


Abstract
The Brazilian Amazon coast is characterized by pronounced seasonal hydroclimatic variability and may also reflect remote Pacific and Atlantic climate signals. This study investigated associations between large-scale climate variability and atmospheric and oceanographic conditions using monthly data from 1995 to 2024. Pacific variability was classified as El Niño, La Niña, or neutral, whereas Atlantic variability was evaluated using drought-related and neutral conditions. Climatic associations were assessed using seasonally adjusted multivariate and univariate analyses, restricted-permutation tests, Spearman correlations, lagged correlations, and multiple regression. El Niño–Southern Oscillation (ENSO) phase showed a significant but modest multivariate association with environmental conditions, supported by restricted-permutation analysis (R2 = 0.036, p = 0.0015). Wind speed and mean wave period showed the clearest ENSO-related differences, with higher winds and shorter wave periods during El Niño. Atlantic drought-related conditions showed an event-consistent increase in salinity, whereas the monthly wind-speed difference was more event-dependent. FDR-adjusted Spearman correlations revealed persistent wind–wave covariation, particularly during the dry season. ONI–SST correlations showed a broad positive pattern at lags of 4–9 months, with the largest observed coefficient at lag 6 (r = 0.348, nominal p = 0.012); however, no individual lag remained significant after false-discovery-rate correction (lag 6: q = 0.066), and the lagged pattern was therefore interpreted as exploratory. Overall, regional seasonality predominated, with climate signals acting as secondary, variable-specific modulators.
1. Introduction
Tropical climate variability is largely governed by coupled ocean–atmosphere interactions, through which sea surface temperature (SST) anomalies influence atmospheric pressure gradients, wind stress, convection, rainfall, and upper-ocean circulation [1,2]. These interactions are particularly notable in the tropics, where relatively small SST variations can reorganize large-scale atmospheric circulation and generate climate anomalies far beyond their region of origin [3]. Among the major manifestations of ocean–atmosphere coupling, the El Niño–Southern Oscillation (ENSO) stands out as the dominant mode of interannual climate variability, involving complex feedbacks among SST, trade winds, thermocline depth, atmospheric convection, and tropical circulation [3,4,5]. Because ENSO links oceanic and atmospheric processes across a wide range of spatial scales, it exerts a profound influence on global climate variability and associated environmental impacts [6,7,8,9].
Originating in the tropical Pacific Ocean, ENSO affects climate conditions worldwide through atmospheric teleconnections [10,11,12]. During El Niño events, anomalous warming in the central and eastern equatorial Pacific modifies tropical convection, weakens the Walker circulation, and alters regional and global wind and pressure fields [11]. Conversely, La Niña events are characterized by cooler SST anomalies and generally stronger tropical circulation patterns, leading to opposite atmospheric responses [10]. These large-scale atmospheric perturbations are transmitted to remote ocean basins through mechanisms such as the atmospheric bridge, affecting surface heat fluxes, wind regimes, upper-ocean thermal structure, and mixed-layer depth [13]. Consequently, ENSO influences not only rainfall and air temperature but also a broad range of oceanographic processes, including circulation patterns, salinity distribution, and wind-driven wave climate [14].
Although ENSO originates in the Pacific Ocean, its influence over tropical South America is strongly modulated by variability in the Tropical Atlantic. SST gradients across the Tropical Atlantic strongly influence atmospheric circulation, wind stress, and rainfall patterns throughout northern South America [15,16]. A key component of this regional climate system is the Intertropical Convergence Zone (ITCZ), whose seasonal meridional migration regulates much of the rainfall variability along the equatorial Atlantic and northern Brazil [17]. Variations in Tropical Atlantic SST can shift the position of the ITCZ and modify moisture convergence, thereby influencing the timing, duration, and intensity of the rainy season [18]. Consequently, Amazonian rainfall variability results from the combined influence of Pacific and Atlantic climate forcing rather than from ENSO alone [18,19,20].
The Amazon basin is particularly sensitive to these large-scale ocean–atmosphere interactions. The Amazonian hydroclimate responds to SST anomalies in both the equatorial Pacific and Tropical Atlantic, highlighting the importance of inter-basin interactions in shaping regional rainfall variability [19]. Across Amazonia, El Niño events are frequently associated with rainfall deficits, elevated temperatures, and drought conditions, whereas La Niña events often promote enhanced rainfall and increased river discharge, although these responses vary according to season and geographic location [21,22,23,24]. Such hydroclimatic fluctuations can trigger severe hydrological extremes, including droughts or floods, affecting freshwater availability, ecosystem functioning, biogeochemical processes, and human populations throughout the region [21,25,26].
Along the Brazilian Amazon coast, these large-scale climatic influences interact with a highly dynamic coastal environment. In this region, rainfall, river discharge, wind forcing, ocean currents, significant wave height, temperature, and salinity interact continuously across multiple temporal and spatial scales [25]. The Amazon and Pará rivers deliver one of the largest freshwater inputs to the Tropical Atlantic Ocean, exerting a strong influence on coastal salinity, stratification, circulation, thermal structure, turbidity, and plume dynamics [27]. Variations in rainfall and river discharge can alter the extent and intensity of the freshwater plume, while wind-driven circulation and regional current systems redistribute low-salinity waters both alongshore and offshore [27,28]. Consequently, climate anomalies associated with both the equatorial Pacific and the Tropical Atlantic may influence both atmospheric conditions and the physical oceanographic structure of the Amazon coastal environment.
Atmospheric forcing also plays a central role in regulating wave climate and surface circulation through changes in wind intensity, direction, and air–sea momentum exchange. Variability in wind fields can modify significant wave height, wave period, wave direction, surface stress, and nearshore circulation patterns. These processes are particularly relevant along the Amazon coast, which is characterized by extensive macrotidal estuaries, mangrove ecosystems, tidal flats, muddy deposits, sandy beaches, and intense sediment transport [29,30,31].
Despite substantial advances in understanding the effects of climatic anomalies on rainfall and hydrology in Amazonia, the response of the Amazon coastal system remains comparatively understudied. Previous studies have generally examined atmospheric, hydrological, oceanographic, or geomorphological processes independently [19,21,25,27,28], despite the inherently multidimensional nature of the coastal environment, which involves the coupled behavior of rainfall, winds, ocean currents, significant wave height, salinity, and sea surface temperature (SST). Although large-scale climate variability is known to influence Amazonian hydroclimatic conditions through changes in precipitation, river discharge, atmospheric circulation, and ocean–atmosphere interactions [25], the extent to which Pacific ENSO variability and Atlantic drought-related conditions are reflected across these interacting atmospheric and oceanographic components of the Brazilian Amazon coast remains insufficiently resolved.
In particular, there is limited evidence integrating rainfall, wind forcing, currents, wave characteristics, salinity, and SST within a common long-term framework while explicitly considering different temporal responses to climatic forcing. This represents an important knowledge gap because environmental variables may respond at different temporal scales and with different magnitudes, meaning that relationships identified from annual averages or isolated variables may not adequately represent the complexity of the coastal response. A framework that combines contemporaneous, multivariate, and lagged analyses is therefore necessary to distinguish immediate environmental associations from delayed responses and to evaluate whether climatic signals are expressed consistently across variables.
Based on previous evidence of Pacific and Atlantic influences on the Amazonian hydroclimate, we hypothesized that Pacific ENSO phases and Atlantic drought-related conditions would be associated with distinct environmental patterns along the Brazilian Amazon coast. Specifically, we expected El Niño conditions to be associated with reduced rainfall and stronger winds relative to La Niña conditions, while Atlantic drought-related conditions were expected to be associated particularly with reduced freshwater influence and higher coastal salinity. We further hypothesized that climatic associations would vary among environmental variables, with atmospheric variables potentially showing more immediate relationships and SST potentially exhibiting delayed associations with ENSO. These hypotheses were evaluated using multivariate and univariate comparisons, Spearman rank correlations, lagged cross-correlation analyses, and multiple regression. By integrating rainfall, winds, currents, waves, salinity, and SST within a long-term monthly framework, this study aimed to characterize variable-specific climatic associations and determine whether relationships between ONI and selected oceanographic variables occur contemporaneously or at positive temporal lags. This integrated framework provides a comprehensive assessment of large-scale climatic variability as a secondary, variable-specific modulator of the Brazilian Amazon coastal environment.
2. Study Area
The study area is located along the Brazilian Amazon coast in northern Brazil, between 2.05° N and 2.32° S and between 50.27° W and 44.10° W (Figure 1). This sector is part of the western Tropical Atlantic and represents a highly dynamic tropical coastal environment [29,30,32]. The region is strongly influenced by the Amazon River, which accounts for approximately 20% of global river discharge, with an average flow close to 200,000 m3 s−1 and an annual suspended sediment load estimated at 754 × 106 tons [33,34]. Near the Amazon River mouth, the continental shelf reaches approximately 330 km in width, within a setting characterized by strong interactions among atmospheric circulation, seasonal rainfall, river discharge, tides, winds, waves, ocean currents, salinity, and sea surface temperature across multiple spatial and temporal scales [27,35].
Figure 1.
Location of the study area on the Brazilian Amazon coast, northern Brazil, highlighting the states of Amapá, Pará, Maranhão, Piauí, and Ceará The orange rectangle (2.05° N to 2.32° S and 50.27° W to 44.10° W) indicates the coastal sector analyzed in this study, extending across the Amazon-influenced region between the states of Amapá, Pará, and Maranhão, with the inset map showing its location in South America.
The regional climate is humid and tropical and is characterized by a marked seasonal rainfall regime, with annual rainfall exceeding 2000 mm along the Atlantic coastal sector [19,36]. Higher rainfall generally occurs during the first half of the year and is mainly associated with the seasonal southward displacement of the ITCZ over northern Brazil, whereas lower rainfall is typically observed during the second half of the year [18,19]. This seasonal variability strongly influences river discharge, freshwater input, salinity distribution, and coastal hydrodynamic conditions.
In addition to its marked seasonal rainfall regime, the Amazon coastal zone is exposed to interannual climate variability associated with both the equatorial Pacific and the Tropical Atlantic. During the study period, major El Niño events occurred in 1997–1998, 2009–2010, 2015–2016, and 2023–2024, while La Niña episodes were recorded in 1999–2000, 2007–2008, and 2010–2011 [37]. These large-scale climatic events are important features of the regional climate context, as they can influence rainfall distribution, river discharge, and coastal oceanographic conditions. The Amazon region has also been affected by severe droughts, particularly in 2005 and 2010, which have been associated with sea surface temperature anomalies in the Tropical Atlantic and broader climate variability [21,38,39]. In the Amazon coastal zone, regional dry conditions were also reported during 2011–2013, when reduced rainfall was associated with increased salinity and changes in hydrological conditions [25].
3. Methodology
3.1. Data Sources
This study analyzed monthly climatic and oceanographic data from 1995 to 2024 to evaluate associations between large-scale climatic variability and environmental conditions along the Brazilian Amazon coast. Two independent climatic classification frameworks were used. Pacific variability was represented by ENSO phase, with monthly observations classified as El Niño, La Niña, or neutral according to the Oceanic Niño Index (ONI). Atlantic variability was evaluated independently by comparing documented drought-related and neutral conditions. Because these classifications represent distinct climatic processes, they were analyzed separately, and a given month could simultaneously belong to a Pacific ENSO category and an Atlantic drought-related category. The environmental dataset included rainfall, wind speed, wind direction, surface current speed, significant wave height, mean wave period, mean wave direction, sea surface temperature, and salinity.
ENSO (El Niño–Southern Oscillation) conditions were classified using the Oceanic Niño Index (ONI), provided by the NOAA Climate Prediction Center [37,40]. The ONI is defined as the three-month running mean of sea surface temperature (SST) anomalies in the Niño 3.4 region (5° N–5° S, 120–170° W) calculated using centered 30-year climatological base periods that are updated every five years [40]. In this study, El Niño conditions were defined as ONI ≥ +0.5 °C, La Niña conditions as ONI ≤ −0.5 °C, and neutral conditions as −0.5 °C < ONI < +0.5 °C [37]. This classification was applied to characterize monthly environmental conditions and should not be interpreted as defining a complete El Niño or La Niña episode, which traditionally requires the threshold to be met for at least five consecutive overlapping three-month seasons [40]. Regional Atlantic drought conditions, including documented events in 2005, 2010, and 2011–2013, were identified separately based on published evidence of drought occurrence and associated Tropical Atlantic SST anomalies [20,25,38].
Monthly rainfall records representative of the study area were obtained from the Tracuateua meteorological station of the Brazilian National Institute of Meteorology (INMET), located at 01°03′49″ S and 46°51′55″ W. The station is situated within the same regional coastal climatic domain as the study area and was selected because of its geographic proximity and the availability of a long-term observational rainfall record.
For wind speed, surface current speed, significant wave height, mean wave period, sea surface temperature, and salinity, all ocean grid cells within the study domain were extracted from the respective gridded reanalysis products and aggregated into monthly values. Unless otherwise stated, the environmental time series used in the analyses represent averages across the study domain rather than measurements at a single point. Land grid cells were excluded from the spatial averaging. This procedure was applied to obtain regional-scale monthly series representative of the Amazon-influenced coastal sector. For the wave variables, the extracted grid cells correspond to the available ocean wave reanalysis nodes within the domain and should therefore be interpreted as regional offshore-to-shelf wave conditions rather than direct nearshore measurements.
Wind speed and wind direction for the complete 1995–2024 study period were obtained from the ERA5 reanalysis produced by the European Centre for Medium-Range Weather Forecasts and distributed through the Copernicus Climate Change Service [41,42]. ERA5 wave variables were not used in the environmental wave time series analyzed in this study.
Wave parameters for the complete 1995–2024 period were obtained from the Copernicus Marine Service Global Ocean Waves Reanalysis product (GLOBAL_MULTIYEAR_WAV_001_032) [43]. The wave dataset comprised significant wave height, mean wave period, and mean wave direction. All available ocean grid cells within the study domain were spatially averaged and subsequently aggregated to monthly values. Thus, the wave time series analyzed throughout the study were derived from a single reanalysis product rather than constructed by merging Copernicus Marine and ERA5 wave data. Consequently, no cross-product adjustment or consistency calibration between ERA5 and Copernicus Marine wave variables was required.
Surface current velocity, salinity, and sea surface temperature were obtained from Copernicus Marine Service Ocean Physics reanalysis products, particularly GLOBAL_MULTIYEAR_PHY_001_030 [44,45].
3.2. Data Processing and Temporal Aggregation
Environmental variability was evaluated at monthly, seasonal, and annual scales. At the monthly scale, environmental variability was evaluated separately under the Pacific and Atlantic classifications. At the seasonal scale, data were grouped according to the regional rainfall regime, with the rainy season defined as January–June and the dry season as July–December. Seasonal rainfall was calculated as accumulated rainfall, whereas wind speed, current speed, wave parameters, salinity, and sea surface temperature were represented by seasonal averages. At the annual scale, rainfall was calculated as annual accumulated rainfall, while all remaining non-directional variables were expressed as annual means.
Extreme conditions were identified from the minimum and maximum monthly values observed throughout the study period. For each extreme event, the corresponding month, season, year, and climatic-event class were recorded. This procedure allowed anomalous rainfall, wind, current, wave, salinity, and temperature conditions to be associated with large-scale climatic variability.
Directional variables require specific statistical approaches, such as circular statistics or transformation into vector components. Therefore, wind direction and mean wave direction were not included in the statistical analyses, as the study focused on variability in the magnitude of atmospheric and oceanographic conditions. The statistical analyses were restricted to scalar variables: rainfall, wind speed, surface current speed, significant wave height, mean wave period, sea surface temperature, and salinity.
3.3. Statistical Analyses
3.3.1. Time-Series Preprocessing and Seasonal Adjustment
The monthly time series for 1995–2024 were seasonally adjusted in IBM SPSS Statistics 24 using the Census I ratio-to-moving-average procedure with a multiplicative decomposition and a 12-month periodicity. Under the multiplicative formulation, the seasonally adjusted value is obtained relative to the estimated seasonal factor, allowing seasonal amplitude to vary proportionally with the level of the series. This formulation was selected because the environmental series, particularly rainfall, exhibited a pronounced annual cycle whose magnitude varied substantially across the year.
Zero rainfall observations were retained as valid observations and were neither replaced nor transformed prior to seasonal adjustment. The rainfall series contained 19 zero-rainfall months. In the saved SPSS decomposition output, all corresponding seasonally adjusted rainfall values also remained equal to zero, and no observations were lost because of these zero values. The estimated multiplicative seasonal factors were positive throughout the series, so zero rainfall observations did not generate undefined adjusted values. Seasonal adjustment was subsequently applied to the scalar environmental series used in Spearman correlation analysis, MANOVA, univariate group comparisons, lagged cross-correlation, and regression analyses in order to reduce the dominant annual seasonal component before evaluating climatic associations.
3.3.2. Spearman Correlation Analysis
Spearman’s rank correlation analysis was used to evaluate pairwise associations among the seven scalar environmental variables: rainfall, wind speed, surface current speed, sea surface temperature, salinity, mean wave period, and significant wave height. Pacific ENSO and Atlantic drought-related conditions were treated as independent climatic classification frameworks. For the Pacific classification, monthly observations were grouped into El Niño, La Niña, and neutral conditions according to the ONI-based classification described above. For the Atlantic classification, months classified as drought-related were analyzed separately from Atlantic neutral conditions. Because the two climatic frameworks were independent, drought-related months were not treated as a fourth ENSO category and could temporally overlap with any Pacific ENSO phase.
Spearman correlations were calculated at two temporal levels. First, pairwise correlations among the seven environmental variables were calculated using the complete monthly series within each climatic condition. Second, to evaluate seasonal differences in the correlation structure, observations within each climatic condition were subdivided according to the regional rainfall regime into the rainy season (January–June) and dry season (July–December), and separate Spearman correlation matrices were calculated for each condition and season. Thus, the correlation analyses were based on the seasonally adjusted monthly scalar series within each climatic and climate × season subset, rather than on seasonal means.
The non-parametric Spearman procedure was selected because the environmental variables did not necessarily satisfy normality assumptions and because rank-based correlations are appropriate for detecting monotonic associations and are less sensitive to extreme values than Pearson correlations.
Correlations were calculated using pairwise complete observations and two-sided nominal p values were initially obtained for each coefficient. Because multiple correlations were evaluated across variable pairs, climatic categories, and seasonal strata, all unique Spearman correlation tests were treated as a single multiple-testing family. In total, 315 tests were evaluated, corresponding to 21 unique variable pairs across five climatic-condition groups and three temporal strata (all months, rainy season, and dry season). The resulting p values were adjusted using the Benjamini–Hochberg false discovery rate (FDR) procedure, and statistical significance was defined as FDR-adjusted q < 0.05. Nominal p values were retained for descriptive reporting, whereas inferential interpretation was based on the FDR-adjusted results. Correlation coefficients were interpreted as measures of association rather than evidence of causal relationships. Complete coefficients, nominal p values, and FDR-adjusted q values are provided in Supplementary Material.
3.3.3. Multivariate and Univariate Analyses
Two independent multivariate analyses of variance (MANOVAs) were performed to evaluate whether large-scale climatic classifications were associated with simultaneous changes in the environmental response vector. MANOVA was selected because the environmental variables were intercorrelated and because evaluating them jointly provides an overall test of differences among climatic groups before examining individual responses separately. The multivariate null hypothesis was that the vector of environmental means was equal among the levels of the climatic factor.
For the Pacific analysis, ENSO phase was included as a categorical explanatory variable with three predefined levels: El Niño, La Niña, and neutral. For the Atlantic analysis, Atlantic condition was included as a categorical explanatory variable with two predefined levels: drought-related and neutral. The MANOVAs tested whether the multivariate environmental response differed among the levels of each climatic classification. The scalar environmental variables defined in Section 3.2 were entered jointly as the multivariate response.
Because the Atlantic drought-related classification comprised a limited number of temporally clustered drought episodes, an additional event-aware sensitivity analysis was conducted for the two variables showing the clearest monthly-level Atlantic differences, salinity and wind speed. Contiguous drought-related months were treated as three distinct episodes: April–September 2005, June–October 2010, and December 2011–December 2013. For each episode, an event-level mean anomaly was calculated relative to Atlantic-neutral observations from the corresponding calendar months. Because only three independent drought episodes were available, these event-level anomalies were evaluated descriptively rather than subjected to formal event-level significance testing. In addition, a leave-one-event-out sensitivity analysis was performed by repeating the drought-related versus neutral Welch comparison after sequentially excluding each drought episode. This analysis was used to assess whether the monthly-level Atlantic results were disproportionately influenced by a single drought event.
Pillai’s trace was used as the primary parametric multivariate test statistic. Wilks’ Lambda (Λ) was additionally reported for comparability. Wilks’ Lambda represents the proportion of generalized multivariate variation remaining within groups relative to the combined within- and between-group variation. Values approaching 1 indicate greater multivariate overlap among groups, whereas smaller values indicate greater separation among group mean vectors. Wilks’ Lambda was not interpreted as a direct percentage of variance explained. Pillai’s trace was emphasized because diagnostic analyses indicated departures from multivariate normality and covariance homogeneity, for which Pillai’s statistic is comparatively more robust.
Assumptions underlying the multivariate analyses were explicitly evaluated. Multivariate normality of model residuals was assessed using Mardia’s multivariate skewness and kurtosis tests. Homogeneity of covariance matrices among groups was evaluated using Box’s M test, whereas homogeneity of error variances for individual dependent variables was assessed using Levene’s test. Mardia’s tests indicated significant departures from multivariate normality, and Box’s M tests indicated that covariance homogeneity was not satisfied in the evaluated models. Consequently, Pillai’s trace was emphasized as the primary parametric MANOVA statistic because of its comparatively greater robustness to violations of multivariate assumptions, while Wilks’ Lambda was retained as a complementary statistic. Where univariate variance homogeneity was violated, Welch’s heteroscedastic ANOVA and Games–Howell pairwise comparisons were used.
PERMANOVA was used exclusively as a sensitivity analysis of the multivariate comparisons among predefined climatic categories and was not used to infer temporal propagation or lagged climate–environment responses. Before analysis, the seven scalar environmental response variables were standardized, and Euclidean distances were calculated from the resulting multivariate response matrix. Statistical significance of the pseudo-F statistic was evaluated using 9999 restricted permutations.
Because the observations consisted of monthly time series, individual months were not freely permuted. For the one-factor Pacific and Atlantic analyses, each calendar year was treated as a 12-month permutation block. The complete multivariate response block for a given year was permuted as a unit relative to the climatic-classification sequence, while the January-to-December ordering of the 12 observations within each block was kept unchanged. Thus, the permutation procedure altered the correspondence between environmental observations and climatic classifications without randomly rearranging months within years.
For the climate × season sensitivity analyses, the original monthly environmental series were subjected to cyclic shifts within each calendar year. For each permutation, the 12-month multivariate sequence was rotated by a common offset while retaining the original ordering of the observations within the sequence. The climate and season factor structure remained fixed, so that the cyclic shift changed the alignment between the environmental series and the explanatory factors without freely shuffling individual monthly observations. This procedure was intended to preserve short-term within-year temporal organization more appropriately than unrestricted permutation. PERMDISP was used separately to evaluate whether multivariate dispersion differed among climatic groups or climate × season combinations.
In addition to statistical significance, effect magnitude was explicitly considered when interpreting the results. Partial η2 was reported for parametric MANOVA and univariate GLM effects, R2 or adjusted R2 was used to describe multivariate permutation and regression model fit where appropriate, and absolute differences between climatic groups were reported in the original measurement units. Statistical significance was therefore not interpreted as evidence of a strong environmental effect in the absence of a corresponding effect magnitude.
3.3.4. Lagged Cross-Correlation Analysis
Lagged correlations were calculated between the Oceanic Niño Index (ONI) and the seasonally adjusted sea surface temperature and salinity series over lags from 0 to 12 months. Positive lag k was defined as the correlation between ONI at time t and the environmental response at time t + k; therefore, positive lags indicate that ONI precedes the response.
Because monthly climatic and oceanographic series exhibit temporal autocorrelation, significance was not evaluated using the nominal number of monthly observations. Instead, an autocorrelation-adjusted effective sample size was estimated for each pair using a modified Bartlett-type correction based on the autocorrelation functions of the two series over the first 12 lags. The effective sample size was then used to calculate the t statistic, two-sided p value, and 95% critical correlation threshold for each lag. This procedure reduces the inflation of statistical significance that may arise when serially correlated observations are treated as independent. Because 13 lags (0–12 months) were evaluated for each environmental response, the autocorrelation-adjusted p-values were additionally corrected for multiple lag testing using the Benjamini–Hochberg false discovery rate (FDR) procedure. The correction was applied separately to the 13 ONI–SST tests and the 13 ONI–salinity tests, with FDR-adjusted q < 0.05 used as the criterion for statistical significance. Nominal p-values are reported to describe the shape of the lagged association, but inferential conclusions were based on the FDR-adjusted results.
Lagged correlations were interpreted as temporal associations and not as direct evidence of causal propagation or fixed physical response times. Because the lag corresponding to the maximum ONI–SST coefficient was identified from the same 0–12-month lag scan, the location of this maximum was treated as exploratory rather than as a confirmatory estimate of a specific response lag.
3.3.5. Multiple Regression Analysis of Sea Surface Temperature Variability
Multiple linear regression was used as an exploratory explanatory analysis to evaluate the joint association of lagged ENSO variability and regional atmospheric conditions with seasonally adjusted sea surface temperature. Candidate predictors included ONI at lag 6, seasonally adjusted wind speed, and seasonally adjusted rainfall. The six-month ONI lag was included because it corresponded to the largest observed ONI–SST correlation in the 0–12-month lag scan. Because this lag was selected from the same dataset rather than specified independently a priori, the regression involving ONI lag 6 was interpreted as exploratory and was not considered an independent confirmatory test of a six-month response time.
The final model retained ONI at lag 6 and seasonally adjusted wind speed. Ordinary least-squares estimates were used to describe the regression coefficients and model fit, including R2 and adjusted R2. Because the data consisted of monthly observations and the regression residuals could exhibit serial correlation and non-constant variance, statistical inference for the coefficients was based on heteroskedasticity- and autocorrelation-consistent (HAC) Newey–West standard errors, using a maximum lag of 12 months. This correction does not alter the OLS coefficient estimates but provides standard errors, t statistics, and p values that are more robust to residual autocorrelation and heteroskedasticity. The HAC-adjusted statistics were therefore used for the final assessment of predictor significance.
The regression was therefore treated as an exploratory associative model rather than as an independent confirmatory or validated forecasting model.
4. Results
To provide a clear chronological overview of the climatic events considered in the analysis, the main Pacific ENSO events and Atlantic drought-related periods are summarized in Table 1. ENSO conditions were classified on a monthly basis using the ONI thresholds described above, whereas the major El Niño and La Niña periods are presented in the table for chronological reference. Atlantic drought-related events were treated separately because their classification was based on documented regional drought occurrence and associated Tropical North Atlantic SST anomalies rather than on ONI thresholds. This distinction ensures that Pacific ENSO phases and Atlantic drought-related conditions are not treated as equivalent climatic classifications.
Table 1.
Summary of major climatic events and their classification during 1995–2024.
4.1. Climatic Events and General Environmental Response
Environmental variability along the Amazon coast was evaluated across monthly, seasonal, and annual temporal scales. Monthly analyses used the complete dataset from 1995 to 2024 (n = 360). Seasonal variability was assessed by grouping observations into the rainy season (January–June) and dry season (July–December), resulting in 60 seasonal observations, whereas annual variability was evaluated using 30 annual observations.
Figure 2 illustrates the long-term relationship between the Oceanic Niño Index (ONI) and rainfall during the study period and allows the temporal correspondence between ENSO phases and rainfall variability to be visualized. A tendency toward higher rainfall during La Niña and lower rainfall during El Niño was evident in the descriptive data. However, after accounting for heterogeneity of variances, the ENSO-related difference in seasonally adjusted rainfall was only marginal in the Welch test (F(2, 193.96) = 3.012, p = 0.051) and was therefore not interpreted as a robust ENSO response. In contrast, wind speed and mean wave period showed clearer differences among ENSO phases.
Figure 2.
(A) Three-month Oceanic Niño Index (ONI), highlighting the El Niño and La Niña thresholds (source: NOAA), and (B) annual rainfall variability (source: INMET). The red dashed line represents the mean annual rainfall for the study period.
Very strong El Niño events occurred in 1997–1998, 2015–2016, and 2023–2024, while a strong El Niño event occurred during 2009–2010. Strong La Niña events were recorded in 1999–2000, 2007–2008, and 2010–2011. Drought-related conditions were also identified in 2005, 2010, and 2011–2013 (Figure 2). Overall, the climatic-event comparisons indicated that the clearest ENSO-related differences occurred in wind speed and mean wave period, whereas rainfall and significant wave height showed weaker and method-sensitive responses. Atlantic drought-related conditions were characterized primarily by higher salinity and wind speed than neutral conditions.
Diagnostic analyses indicated departures from the ideal assumptions of conventional MANOVA. Mardia’s tests rejected multivariate normality of the residuals for the Pacific and Atlantic one-factor models and for both climate × season models (all skewness and kurtosis tests, p < 0.001). Box’s M tests also indicated heterogeneity of covariance matrices for the Pacific one-factor (M = 201.860, p < 0.001), Atlantic one-factor (M = 50.207, p = 0.015), Pacific × season (M = 937.154, p < 0.001), and Atlantic × season models (M = 891.596, p < 0.001). Accordingly, Pillai’s trace was treated as the primary parametric multivariate statistic, and heteroscedasticity-robust and permutation-based sensitivity analyses were used to evaluate the robustness of the principal findings.
The revised one-factor MANOVA for Pacific ENSO phases indicated a significant multivariate difference in the combined set of seven seasonally adjusted, non-directional environmental variables (Pillai’s trace = 0.249, F(14, 704) = 7.139, p < 0.001, partial η2 = 0.124; Wilks’ Λ = 0.754, F(14, 702) = 7.585, p < 0.001). Because Box’s M test indicated heterogeneity among covariance matrices (M = 201.860, p < 0.001), Pillai’s trace was considered the primary parametric statistic. The corresponding restricted-permutation sensitivity analysis yielded consistent evidence of multivariate differentiation among ENSO categories (PERMANOVA: pseudo-F = 6.705, R2 = 0.036, p = 0.0015), while PERMDISP showed no significant difference in multivariate dispersion among ENSO groups (p = 0.158). These results indicate a statistically detectable but modest multivariate association between ENSO phase and environmental conditions.
Robust univariate follow-up analyses showed that wind speed and mean wave period were the clearest individual responses to ENSO classification. Wind speed differed significantly among ENSO phases (Welch F(2, 229.86) = 34.059, p < 0.001), with the highest seasonally adjusted mean during El Niño (4.86 m s−1), followed by neutral conditions (4.65 m s−1) and La Niña (4.44 m s−1). Mean wave period also differed significantly among ENSO phases (Welch F(2, 230.55) = 10.955, p < 0.001), with shorter values during El Niño (6.27 s) than during La Niña (6.42 s) and neutral conditions (6.35 s).
For the Atlantic classification, the parametric MANOVA indicated a weaker multivariate difference between drought-related and neutral conditions (Pillai’s trace = 0.061, F(7, 352) = 3.292, p = 0.002, partial η2 = 0.061; Wilks’ Λ = 0.939). Box’s M test indicated some heterogeneity of covariance matrices (M = 50.207, p = 0.015). In contrast, the restricted-permutation sensitivity analysis did not support the overall Atlantic multivariate difference detected by the parametric MANOVA (PERMANOVA: pseudo-F = 4.713, R2 = 0.013, p = 0.186), while PERMDISP indicated no significant difference in multivariate dispersion (p = 0.578). Therefore, Atlantic drought-related conditions were not interpreted as producing a robust system-wide multivariate shift. At the individual-variable level, the clearest Atlantic differences were observed for salinity and wind speed. Mean seasonally adjusted salinity was higher during drought-related conditions (30.34) than during neutral conditions (29.24; Welch F(1, 44.82) = 21.106, p < 0.001), and wind speed was also higher during drought-related conditions (4.83 m s−1) than during neutral conditions (4.62 m s−1; Welch F(1, 44.46) = 8.937, p = 0.005).
The event-aware sensitivity analysis revealed different levels of consistency for these two variables. Mean salinity anomalies relative to Atlantic-neutral conditions were positive in all three drought episodes (+1.82 in 2005, +0.15 in 2010, and +1.10 in 2011–2013), indicating a directionally consistent event-level salinity signal. Leave-one-event-out analyses likewise showed that the monthly drought-related salinity difference remained significant regardless of which individual event was excluded (all Welch p ≤ 0.031). In contrast, event-level wind-speed anomalies were positive in 2005 (+0.20 m s−1) and 2011–2013 (+0.32 m s−1) but negative in 2010 (−0.33 m s−1). Moreover, the monthly drought-related wind-speed difference was no longer significant when the 2011–2013 episode was excluded (Welch p = 0.790). Thus, the higher salinity observed under Atlantic drought-related conditions was more consistent across individual events, whereas the wind-speed difference was event-sensitive and should be interpreted more cautiously.
To formally assess whether climatic associations varied between the rainy and dry seasons, climate x season interactions were tested using the original monthly environmental variables. In the Pacific model, the conventional MANOVA indicated a significant ENSO phase x season interaction (Pillai’s trace = 0.120, F(14, 698) = 3.188, p < 0.001, partial η2 = 0.060). However, this interaction was not supported by the restricted-permutation sensitivity analysis (PERMANOVA: pseudo-F = 1.975, R2 = 0.0069, p = 0.664), and multivariate dispersion differed significantly among ENSO x season cells (PERMDISP, p < 0.001). Therefore, the data did not provide robust evidence for a generalized seasonal modulation of the multivariate ENSO response. Among the individual variables, only sea surface temperature showed a significant parametric ENSO phase x season interaction (F(2, 354) = 5.910, p = 0.003, partial η2 = 0.032), indicating a variable-specific seasonal pattern rather than a system-wide interaction.
For the Atlantic classification, no significant multivariate Atlantic condition x season interaction was detected in the parametric model (Pillai’s trace = 0.036, F(7, 350) = 1.872, p = 0.073, partial η2 = 0.036), and the restricted-permutation PERMANOVA sensitivity analysis likewise provided no evidence of an interaction (pseudo-F = 2.314, R2 = 0.0042, p = 0.431). Multivariate dispersion differed significantly among Atlantic condition x season cells (PERMDISP, p < 0.001). Rainfall showed a significant interaction in the univariate parametric analysis (F(1, 356) = 10.997, p = 0.001, partial η2 = 0.030), but this variable-specific result was interpreted cautiously given the absence of a significant overall multivariate interaction.
4.2. Hydroclimatic Gradient: Rainfall and Salinity
In this study, rainfall was used as an indirect proxy for regional freshwater input, although it does not represent a direct measurement of river discharge. Therefore, the rainfall–salinity relationship should be interpreted as indicating broad hydroclimatic covariation rather than a direct point-to-point forcing mechanism. This interpretation is particularly relevant because rainfall was derived from a single meteorological station, whereas salinity was obtained from gridded ocean reanalysis data over the study domain. Rainfall showed the greatest intra-annual variability, with the highest monthly values concentrated during the rainy season. The main monthly rainfall peaks were recorded in May 2009 (849.7 mm), March 2019 (765.2 mm), March 2024 (764.4 mm), and March 2004 (750.3 mm). In contrast, several months showed zero rainfall, mainly during the dry season, including October 1995, November 1996, October 1997, and November 2000.
At the seasonal scale, accumulated rainfall ranged from 75.0 mm during the dry season of 2024 to 3306.2 mm during the rainy season of 2019 (Figure 3). At the annual scale, total rainfall reached 3735.0 mm in 2019 (Figure 2). Salinity showed the opposite seasonal behavior, with monthly maxima during the dry season, especially in November 2016 (34.19), November 2004 (33.95), October 2016 (33.85), and November 2011 (33.82). The lowest salinity values occurred during the rainy season, particularly in April 2019 (16.42), March 2020 (17.74), March 2019 (18.55), and April 2023 (19.41). Seasonally, mean salinity ranged from 23.17 in the rainy season of 2019 to 33.00 in the dry season of 2016, while annual mean salinity ranged from 27.54 in 2019 to 30.76 in 2012 (Figure 3 and Figure 4).
Figure 3.
Seasonal variability of rainfall (A,B), wind speed (C,D), current speed (E,F), significant wave height (G,H), wave period (I,J), sea surface temperature (K,L), and salinity (M,N) in the study area from 1995 to 2024, highlighting major El Niño, drought, and La Niña events during the rainy and dry seasons. The light blue rectangle represents the La Niña period, the dark pink rectangle represents the drought period, and the light pink rectangle represents the El Niño period.
Figure 4.
Annual variability of wind speed (A), current speed (B), significant wave height (C), mean wave period (D), sea surface temperature (E), and salinity (F) along the Brazilian Amazon coast from 1995 to 2024. The red dashed line represents the mean value for the study period.
Although the conventional ANOVA indicated an ENSO-related rainfall difference, this effect was not robust to the heteroscedastic Welch test (F(2, 193.96) = 3.012, p = 0.051). Rainfall was therefore interpreted as showing a weak or borderline ENSO-related pattern rather than a statistically robust phase difference. In contrast, Atlantic drought-related conditions showed a clearer association with salinity, which remained significant under the robust analysis (Welch F(1, 44.82) = 21.106, p < 0.001, partial η2 = 0.049).
After Benjamini–Hochberg correction for multiple testing, the inverse rainfall–salinity relationship remained significant across the Pacific climatic categories. Using the complete monthly series, rainfall and salinity remained negatively associated during El Niño (ρ = −0.412, q < 0.001), La Niña (ρ = −0.368, q < 0.001), and neutral conditions (ρ = −0.273, q = 0.003). The relationship was stronger during the rainy season, reaching ρ = −0.722 during El Niño, ρ = −0.506 during La Niña, and ρ = −0.482 under neutral conditions (all q < 0.001).
Current speed and salinity also showed a recurrent positive association that remained significant after FDR correction. In the complete monthly series, current speed was positively correlated with salinity during El Niño (ρ = 0.558), La Niña (ρ = 0.514), neutral Pacific conditions (ρ = 0.608), and Atlantic drought-related conditions (ρ = 0.639; all q < 0.001). The strongest current–salinity associations occurred during the rainy season, reaching ρ = 0.762 during El Niño, ρ = 0.655 during La Niña, ρ = 0.745 under neutral Pacific conditions, and ρ = 0.818 during drought-related conditions (all q < 0.001). These results indicate that the principal hydroclimatic covariance patterns were robust to false-discovery-rate correction.
4.3. Wind–Current Variability and Climatic Associations
Monthly wind maxima occurred mainly during the dry and transition periods, especially in September 2024 (5.94 m s−1), November 2009 (5.90 m s−1), September 2017 (5.88 m s−1), and December 2015 (5.88 m s−1). The lowest wind speeds occurred mainly during the rainy season, particularly in April 2020 (2.82 m s−1), May 1995 (2.92 m s−1), May 2008 (2.94 m s−1), and April 2006 (2.95 m s−1). Seasonally, mean wind speed ranged from 3.56 m s−1 in the rainy season of 1996 to 5.55 m s−1 in the dry season of 2015 (Figure 3). Annually, mean wind speed varied from 4.27 m s−1 in 2008 to 5.13 m s−1 in 2015 (Figure 4).
Among the seasonally adjusted environmental variables, wind speed showed the clearest ENSO-related differentiation. Wind speed differed significantly among ENSO phases under the heteroscedasticity-robust analysis (Welch F(2, 229.86) = 34.059, p < 0.001, partial η2 = 0.148). El Niño conditions showed the highest mean wind speed (4.864 m s−1), significantly exceeding both neutral conditions (4.655 m s−1; mean difference = 0.210 m s−1, p < 0.001) and La Niña conditions (4.438 m s−1; mean difference = 0.426 m s−1, p < 0.001). Wind speed also differed between neutral and La Niña conditions (mean difference = 0.217 m s−1, p < 0.001). Atlantic drought-related conditions were likewise associated with higher wind speed than neutral Atlantic conditions, although the magnitude of this difference was considerably smaller (4.826 vs. 4.616 m s−1; Welch F(1, 44.46) = 8.937, p = 0.005, partial η2 = 0.022).
Current speed followed a similar seasonal pattern to wind speed. Monthly maxima were recorded in July 2015 (0.63 m s−1), August 2012 (0.63 m s−1), August 2013 (0.62 m s−1), and August 2009 (0.61 m s−1). The lowest values occurred during the rainy season, especially in March 2019 (0.13 m s−1), March 2020 (0.14 m s−1), March 2024 (0.16 m s−1), and February 2018 (0.18 m s−1). Seasonally, mean current speed ranged from 0.30 m s−1 in the rainy season of 2019 to 0.56 m s−1 in the dry season of 1996. Annually, mean current speed ranged from 0.40 m s−1 in 2019 to 0.50 m s−1 in 1997.
Surface current speed exhibited a seasonal pattern broadly similar to that of wind speed, but it did not show a statistically significant direct association with either climatic classification after seasonal adjustment. Current speed did not differ significantly among ENSO phases (Welch p = 0.540) and likewise showed no statistically significant difference between Atlantic drought-related and neutral conditions (Welch p = 0.072).
After FDR correction, wind–current covariation remained significant in several, but not all, climatic and seasonal subsets. In the complete monthly series, wind speed and current speed remained positively correlated during La Niña (ρ = 0.259, q = 0.011), neutral Pacific conditions (ρ = 0.447, q < 0.001), and Atlantic drought-related conditions (ρ = 0.536, q = 0.003). During the rainy season, the association remained significant during La Niña (ρ = 0.339, q = 0.029) and neutral conditions (ρ = 0.531, q < 0.001), whereas the nominal associations observed during El Niño (ρ = 0.293, nominal p = 0.048, q = 0.097) and drought-related conditions (ρ = 0.550, nominal p = 0.027, q = 0.058) did not remain significant after correction. During the dry season, the La Niña association remained significant at the FDR threshold (ρ = 0.276, q = 0.04997). These results indicate that wind–current covariance was context dependent and less consistently supported than the principal hydroclimatic and wind–wave relationships.
4.4. Wave Variability and Climatic Associations
Wave conditions showed pronounced seasonal variability, while associations with climatic classifications differed among individual wave parameters. Significant wave height reached its highest monthly values mainly during the rainy season, with peaks in February 2003 (1.57 m), March 2018 (1.55 m), February 2016 (1.53 m), and February 2017 (1.52 m). Minimum values were recorded in July 2000 (0.90 m), June 2021 (0.91 m), June 2023 (0.91 m), and June 2001 (0.95 m). Mean wave period ranged from a minimum monthly value of approximately 5.23 s in June 2023 to a maximum of 7.70 s in January 1996.
At the seasonal scale, significant wave height ranged from 1.09 m in the dry season of 2021 to 1.34 m in the rainy season of 2018, while mean wave period ranged from 5.81 s in the dry season of 2024 to 7.03 s in the rainy season of 1996 (Figure 3). Annually, significant wave height ranged from 1.15 m in 2021 to 1.28 m in 2015, while mean wave period ranged from 5.98 s in 2024 to 6.63 s in 1996 (Figure 4).
Significant wave height showed only a weak ENSO-related difference. Although the conventional ANOVA indicated a small nominal effect, this difference was not statistically robust under the heteroscedastic Welch test (Welch F(2, 214.43) = 2.942, p = 0.055, partial η2 = 0.018). The El Niño–La Niña difference was also not significant under the Games–Howell procedure (mean difference = 0.023 m, p = 0.055). Significant wave height was therefore interpreted as showing a weak or borderline ENSO-related pattern rather than a robust climatic response.
Mean wave period showed a clearer association with ENSO phase (Welch F(2, 230.55) = 10.955, p < 0.001, partial η2 = 0.053). El Niño conditions were characterized by shorter mean wave periods (6.274 s) than La Niña conditions (6.417 s; mean difference = −0.143 s, p < 0.001) and neutral conditions (6.350 s; mean difference = −0.076 s, p = 0.023). The difference between La Niña and neutral conditions was not statistically significant (mean difference = 0.067 s, p = 0.070). These results indicate that mean wave period, rather than significant wave height, represented the clearest wave-related association with ENSO classification.
Wind speed and significant wave height showed a robust positive association after FDR correction, particularly during the dry season. In the complete monthly series, the association remained significant during El Niño (ρ = 0.699, q < 0.001), La Niña (ρ = 0.608, q < 0.001), and neutral Pacific conditions (ρ = 0.672, q < 0.001). The nominal association under Atlantic drought-related conditions (ρ = 0.362, p = 0.030) did not remain significant after FDR correction (q = 0.063). In contrast, during the dry season, wind speed and significant wave height remained strongly and positively associated during El Niño (ρ = 0.767), La Niña (ρ = 0.748), neutral Pacific conditions (ρ = 0.729), and Atlantic drought-related conditions (ρ = 0.716; all q < 0.002). This indicates that dry-season wind–wave covariation was one of the most robust correlation patterns identified in the dataset.
Mean wave period and significant wave height also remained positively associated across several climatic and seasonal subsets after FDR correction. In the complete monthly series, the relationship remained significant during El Niño (ρ = 0.399, q < 0.001), La Niña (ρ = 0.343, q < 0.001), neutral Pacific conditions (ρ = 0.319, q < 0.001), and Atlantic drought-related conditions (ρ = 0.483, q = 0.009). The association remained significant during both rainy and dry El Niño conditions, during the La Niña dry season, during the neutral dry season, and during drought-related rainy conditions. The previously nominally significant relationship under neutral rainy-season conditions (ρ = 0.233, p = 0.038) did not remain significant after FDR correction (q = 0.077). Overall, the mean-wave-period–significant-wave-height relationship was robust in several subsets but less consistently expressed than the dry-season wind–wave association.
4.5. Sea Surface Temperature and Salinity Variability
Sea surface temperature exhibited substantial temporal variability across the study period, whereas the temporal variability of salinity is described in Section 4.2. At the monthly scale, the highest temperatures occurred mainly during recent El Niño and/or drought-related periods, particularly in May 2024 (29.52 °C), May 2010 (29.40 °C), April 2010 (29.19 °C), and April 2024 (29.15 °C). The lowest temperatures were concentrated in 1997, especially in August (26.93 °C), July (27.06 °C), September (27.09 °C), and October (27.19 °C). Seasonally, mean temperature ranged from 27.30 °C in the dry season of 1997 to 29.07 °C in the rainy season of 2024 (Figure 3). Annually, mean temperature varied between 27.52 °C in 1997 and 28.67 °C in 2024 (Figure 4).
Despite this variability, seasonally adjusted temperature did not differ significantly among ENSO phases or between Atlantic drought-related and neutral conditions. Salinity likewise showed no significant ENSO-phase difference, although higher salinity was observed under Atlantic drought-related conditions.
After FDR correction, several temperature-related associations remained significant. In the complete monthly series, SST remained negatively associated with significant wave height during El Niño (ρ = −0.379, q < 0.001), La Niña (ρ = −0.256, q = 0.012), and neutral Pacific conditions (ρ = −0.245, q = 0.010). During Atlantic drought-related conditions, SST remained strongly and negatively associated with wind speed (ρ = −0.607, q < 0.001).
Seasonal stratification showed that negative SST–salinity associations during the dry season remained significant under El Niño (ρ = −0.471, q = 0.002), La Niña (ρ = −0.498, q < 0.001), and neutral Pacific conditions (ρ = −0.338, q = 0.018). During drought-related dry-season conditions, the strong negative wind–SST association also remained significant (ρ = −0.726, q = 0.001). During the rainy season, SST remained negatively associated with significant wave height under El Niño (ρ = −0.642, q < 0.001), and the positive SST–mean-wave-period association under drought-related conditions remained significant (ρ = 0.574, q = 0.045). In contrast, the rainy-season drought-related wind–SST association was only nominally significant (ρ = −0.524, p = 0.037) and did not remain significant after FDR correction (q = 0.077).
4.6. Lagged Associations Between ONI and Oceanographic Variables
After accounting for temporal autocorrelation, the association between ONI and seasonally adjusted sea surface temperature was weak at lag 0 (r = 0.009, p = 0.947) but increased progressively at positive lags. Nominal p-values were below 0.05 from lags 4 to 9 months, peaking at lag 6 (r = 0.348, effective n = 50.8, nominal p = 0.012). However, after Benjamini–Hochberg correction across the 13 tested lags, none of the ONI–SST correlations remained significant at FDR q < 0.05 (the lag-6 association yielded q = 0.066). The 4- to 9-month pattern indicates a broad cluster of positive lagged associations, but the exact location and statistical significance of the maximum at six months should be treated as exploratory.
In contrast, no statistically significant lagged association was detected between ONI and seasonally adjusted salinity. The largest coefficient occurred at lag 7 (r = 0.125), but this was not nominally significant (effective n = 106.9, p = 0.199). Consequently, the revised results do not support a detectable delayed salinity association with ONI over the 0- to 12-month lag interval.
4.7. Regression Analysis of Sea Surface Temperature Variability
The final multiple regression model included ONI lagged by six months and contemporaneous seasonally adjusted wind speed as predictors of seasonally adjusted sea surface temperature. The model had R = 0.493, R2 = 0.243, and adjusted R2 = 0.239, indicating that the two predictors jointly accounted for approximately 24.3% of the variance in the dependent variable.
Because the monthly residuals were temporally structured, statistical inference for the regression coefficients was based on heteroskedasticity- and autocorrelation-consistent (HAC) Newey–West standard errors. ONI at lag 6 remained positively associated with SST (B = 0.173, HAC SE = 0.039, t = 4.451, p < 0.001), whereas wind speed remained negatively associated with SST (B = −0.279, HAC SE = 0.049, t = −5.745, p < 0.001). Thus, a one-unit increase in ONI six months earlier was associated with an estimated 0.173 °C higher seasonally adjusted SST, holding wind speed constant, whereas a 1 m s−1 increase in wind speed was associated with an estimated 0.279 °C lower seasonally adjusted SST, holding lagged ONI constant.
These coefficients indicate statistically significant temporal associations after correction for serial dependence, but the model was not evaluated as an out-of-sample forecasting model and should not be interpreted as establishing a deterministic six-month prediction horizon.
5. Discussion
The revised analyses indicate that environmental variability along the Brazilian Amazon coast is dominated by a strong regional seasonal structure, upon which substantially smaller and variable-specific associations with large-scale Pacific and Atlantic climate variability are superimposed. ENSO produced a statistically detectable but modest multivariate signal, expressed most consistently through wind speed and mean wave period, whereas Atlantic drought-related conditions showed more restricted associations, with salinity exhibiting the clearest and most event-consistent difference, whereas the wind-speed association was more sensitive to the particular drought episode considered.
Importantly, the event-aware sensitivity analysis showed that higher salinity was observed across all three drought episodes, whereas the wind-speed pattern was not directionally consistent among events and became non-significant when the 2011–2013 episode was excluded. The Atlantic wind speed result should therefore be regarded as event-sensitive rather than as a general response to drought-related conditions.
The following discussion therefore focuses on the physical context of these variable-specific relationships rather than interpreting the climatic classifications as uniform or dominant controls of the coastal system.
The influence of Pacific ENSO variability on the Amazon coast should be understood as a sequence of linked atmospheric and regional oceanographic responses rather than as a direct oceanic teleconnection. ENSO-related changes in large-scale atmospheric circulation can modify precipitation over Amazonia, which in turn affects freshwater discharge and the spatial distribution of the Amazon River plume. Changes in freshwater input may influence coastal salinity patterns, although the present study does not directly resolve river discharge, plume structure, stratification, or water-mass dynamics. The statistical relationships identified in the present study are consistent with this multi-step pathway, but they do not demonstrate a direct causal chain. Therefore, these mechanisms are considered plausible interpretations based on the observed statistical associations and established regional processes, rather than mechanisms directly demonstrated by the present analyses.
The main incremental contribution of this study is the integration of these processes within a single long-term framework. Rather than evaluating ENSO effects on an isolated environmental variable, we jointly examined rainfall, wind, currents, waves, salinity, and sea surface temperature using monthly, seasonal, multivariate, and lagged analyses. This approach revealed that the climatic signal was variable-specific and temporally heterogeneous: wind and wave variables showed contemporaneous associations with climatic conditions, whereas sea surface temperature showed an exploratory positive lagged pattern, with the largest observed coefficient at approximately six months. The results therefore complement previous regional studies by demonstrating that the expression of large-scale climate variability along the Amazon coast depends strongly on the environmental variable and temporal scale considered.
Although El Niño and La Niña originate in the equatorial Pacific, their effects reach the Amazon region through atmospheric teleconnections that modify tropical circulation, convection, moisture transport, wind regimes, rainfall distribution, and air–sea exchanges [3,13]. This explains why the climatic-event signal was not equally expressed across all variables. Wind speed showed the clearest immediate ENSO-related differentiation, while mean wave period also differed among ENSO phases. In contrast, significant wave height showed only a weak and method-sensitive association, and sea surface temperature exhibited its clearest ENSO relationship at positive temporal lags. Salinity and surface currents reflected more complex relationships involving freshwater input, plume dynamics, regional circulation, and seasonal variability [27,28].
The Atlantic-driven drought periods identified in this study (2005, 2010, and 2011–2013) correspond to well-documented regional extreme events associated with anomalously warm Sea Surface Temperatures (SST) in the Tropical North Atlantic (TNA) [20,25,38]. In the coastal region of Pará (eastern Amazonia), TNA warming has been associated with a northward displacement of the Intertropical Convergence Zone (ITCZ), which can reduce regional precipitation and prolong dry conditions [38]. The resulting reduction in freshwater input, together with decreased river discharge from major Amazonian tributaries, may alter the hydrological and oceanographic conditions of the coastal zone. This climatic pathway differs from the Pacific ENSO forcing and provides a regional mechanism through which Atlantic variability can contribute to drought conditions along the Amazon coast [25].
The magnitude of the observed climatic associations is as important as their statistical significance. ENSO-related differences were most evident for wind speed, but even the significant Pacific multivariate signal accounted for only a limited fraction of the total multivariate variation in the permutation analysis. Mean wave period showed a smaller ENSO-related effect, whereas rainfall and significant wave height exhibited weak and method-sensitive differences. Atlantic associations were weaker still and were concentrated mainly in salinity and wind speed. These results reinforce the interpretation of large-scale climate variability as a secondary modulator of the coastal environment rather than its dominant source of variability.
In this context, the distinct patterns observed during Atlantic drought-related conditions, particularly the higher salinity and wind speed found in the univariate analyses, are consistent with the possibility that Atlantic climate variability contributes to specific regional environmental differences. However, the overall Atlantic multivariate effect was not retained in the restricted-permutation sensitivity analysis, and these associations should therefore not be generalized as a system-wide Atlantic response.
5.1. Hydroclimatic Control of Rainfall and Salinity
Rainfall and salinity represented the clearest expression of the seasonal hydrological gradient. The strong negative relationship between rainfall and salinity is consistent with rainy months being associated with lower salinity and with the strong influence of freshwater input on the coastal ocean. This pattern is physically consistent with the Amazon and Pará river systems, which strongly influence salinity gradients, plume dynamics, stratification, turbidity, and coastal circulation along the western Tropical Atlantic [27,28].
The rainfall–salinity relationship observed here is consistent with a broad hydroclimatic control on coastal salinity. However, because river discharge, plume extent, stratification, and marine intrusion were not directly measured, these processes should be considered plausible explanatory mechanisms rather than directly demonstrated drivers [35,46].
The seasonal dependence observed in this study is consistent with the role of the Intertropical Convergence Zone (ITCZ) in controlling rainfall over northern Brazil. The seasonal displacement of the ITCZ regulates moisture convergence and rainfall intensity along the equatorial Atlantic and Amazon coastal region, while interannual rainfall variability is also influenced by sea surface temperature anomalies in both the equatorial Pacific and the Tropical Atlantic [18,19]. In this context, the effects of climatic events may be amplified, weakened, or masked depending on the seasonal position of the ITCZ and the concurrent state of the Tropical Atlantic.
Although rainfall tended to be higher during La Niña than during El Niño and neutral conditions, the ENSO-related difference did not reach the conventional 0.05 significance threshold under the heteroscedastic Welch test (p = 0.051). Rainfall should therefore be interpreted as showing a weak or borderline ENSO-related pattern rather than a robust phase response. This result is consistent with the relatively small effect magnitude and reinforces the importance of regional seasonality, the ITCZ, Tropical Atlantic variability, river-basin processes, and other atmospheric controls in determining rainfall variability along the Amazon coast. Previous studies likewise show that Amazonian rainfall, droughts, and floods reflect interacting Pacific and Atlantic influences rather than the action of a single climate mode [11,21,24].
5.2. Wind and Current Fluctuations and Climatic Associations
Wind speed showed the clearest statistical association with ENSO phase among the seasonally adjusted environmental variables [47]. El Niño conditions were associated with higher mean wind speeds than neutral and La Niña conditions, with the ENSO classification accounting for a moderate proportion of wind-speed variability relative to the other individual climatic effects. At the monthly level, Atlantic drought-related conditions were also associated with higher wind speed than neutral conditions. However, this association was not consistent across individual drought episodes and disappeared when the long 2011–2013 event was excluded in the leave-one-event-out sensitivity analysis. The Atlantic wind-speed result should therefore be interpreted cautiously and should not be generalized as an event-independent drought response.
These results suggest that large-scale climatic variability may modulate the regional wind regime, but the observed differences should not be interpreted as evidence that ENSO or Atlantic drought conditions directly control coastal winds. Regional atmospheric circulation, seasonal migration of the ITCZ, pressure gradients, and other local and basin-scale processes may contribute simultaneously to the observed wind variability [27].
Surface current speed did not show a significant direct association with either Pacific ENSO phase or Atlantic drought classification after seasonal adjustment. Its relationships with other environmental variables therefore indicate covariance within the coastal system rather than demonstrating a climate-driven current response. This distinction is particularly relevant in the Amazon coastal zone, where currents are influenced simultaneously by tides, freshwater discharge, shelf circulation, winds, and plume dynamics [30,46].
The relative magnitudes of the observed climatic effects indicate that large-scale climatic variability should be interpreted as a secondary modulator of the Amazon coastal environment, superimposed on pronounced regional seasonal variability. ENSO accounted for a comparatively small but statistically detectable fraction of multivariate variation, whereas the Atlantic classification showed even weaker evidence.
5.3. Wave Variability and Climatic Associations Wave Fluctuations and Climatic Associations
Mean wave period showed the clearest wave-related association with ENSO phase. El Niño conditions were associated with slightly shorter mean wave periods than La Niña and neutral conditions, whereas the La Niña–neutral difference was not statistically significant. This pattern is compatible with a greater relative contribution of locally generated wind waves during periods of stronger regional winds, but the present analyses do not directly distinguish locally generated waves from remotely generated swell.
Significant wave height showed only a small and method-sensitive ENSO-related difference. Although the conventional ANOVA yielded a nominally significant result, the heteroscedastic Welch test did not reach the adopted significance threshold. Consequently, significant wave height is no longer interpreted as a robust response to ENSO phase.
More generally, the wave results indicate that climatic associations are selective rather than representative of a uniform modification of the regional wave climate. The physical implications for coastal dynamics should therefore be interpreted in the context of the dominant local and seasonal controls on wave conditions [48].
5.4. Delayed ENSO and Regional Wind Associations with Sea Surface Temperature
Sea surface temperature differed from the more immediate wind response because the ONI–SST correlation increased at positive temporal lags and showed a broad maximum between approximately four and nine months. The largest observed coefficient occurred at lag 6. However, although nominal p-values were below 0.05 across part of this interval, none of the individual lagged correlations remained significant after FDR correction for the 13 tested lags. The lagged pattern should therefore be regarded as exploratory evidence of delayed temporal covariance rather than as confirmation of a specific six-month response time.
The present analysis identifies temporal covariance but does not isolate the physical pathway responsible for it. ENSO teleconnections can influence remote tropical ocean regions through changes in atmospheric circulation, wind stress, surface heat fluxes, convection, and upper-ocean mixing, while the resulting regional SST signal may also depend on the evolving state of the Tropical Atlantic [13,28]. These processes provide physically plausible context for a delayed SST association, but their individual contributions were not quantified here.
The exploratory regression analysis provides complementary descriptive evidence that the SST signal is associated with both large-scale and regional atmospheric variability. Because ONI lag 6 was selected from the same lag scan, the regression does not constitute an independent confirmation of that particular lag. However, lagged ONI remained positively associated with seasonally adjusted SST, whereas contemporaneous wind speed showed a negative association. These relationships remained statistically significant when inference was corrected for residual autocorrelation using HAC/Newey–West standard errors. Nevertheless, the observational model should be interpreted as an associative rather than causal model; it does not demonstrate direct heat transfer from the Pacific or establish a deterministic six-month prediction horizon.
No corresponding significant delayed association was detected for salinity after temporal autocorrelation was considered. This suggests that salinity variability in the study area may be more strongly influenced by regional freshwater input, river discharge, plume dynamics, marine intrusion, and shelf circulation than by a simple lagged relationship with ONI.
5.5. Environmental and Coastal Implications
The environmental patterns identified in this study may have implications for coastal dynamics and ecosystem functioning, although these consequences were not directly evaluated. Variations in rainfall and freshwater input can alter salinity gradients, plume extent, estuarine stratification, and water-mass structure, while changes in regional wind conditions can influence surface stress, mixing, navigation conditions, and locally generated waves. Because the ENSO-related rainfall and significant-wave-height differences were weak and method-sensitive, these variables should not be interpreted as demonstrating direct climatic impacts on coastal hazards.
The clearer ENSO-related differences in wind speed and mean wave period indicate that large-scale climate variability may contribute to changes in regional atmospheric and wave conditions, but these signals remain superimposed on strong seasonal and local hydrodynamic controls. Similarly, the higher salinity observed during Atlantic drought-related conditions may be environmentally relevant in estuarine and coastal sectors, although the overall Atlantic multivariate effect was not robust under temporally restricted permutation testing.
These environmental changes may also affect traditional coastal communities, fisheries, mangrove habitats, and estuarine productivity [49,50,51,52]. Variations in rainfall and salinity can influence fish distribution, nursery habitats, water quality, and biological productivity, while stronger winds and waves may reduce navigation safety and limit fishing activity [53,54]. Mangroves are particularly important in this context because they contribute to coastal protection and flood-risk reduction, reinforcing their role in adaptation strategies for coastal regions [55,56].
Although the observed variability in rainfall, salinity, wind speed, and wave parameters may be relevant for coastal and estuarine dynamics, the present study did not directly evaluate shoreline change, sediment transport, ecosystem responses, fisheries, navigation safety, or socioeconomic vulnerability. Therefore, these aspects should be interpreted only as potential implications of the observed environmental variability and not as demonstrated impacts.
5.6. Limitations and Future Research
Some limitations should be considered when interpreting these results. First, the use of monthly data may smooth short-duration extreme events, such as intense rainfall episodes, storm surges, wind bursts, and short-lived wave anomalies. Second, reanalysis products may not fully capture nearshore, estuarine, tidal, and small-scale plume processes that are highly relevant along the Amazon coast. Third, shoreline change, fisheries response, ecosystem impacts, and socioeconomic vulnerability were not directly measured. Therefore, implications for erosion, fisheries, navigation, and community vulnerability should be interpreted as potential consequences of the observed climatic and oceanographic patterns.
Further research combining climatic and oceanographic observations with ecological, biological, geomorphological, and socioeconomic data would be necessary to determine whether the environmental variability identified here translates into measurable impacts on coastal ecosystems, fisheries, navigation, shoreline dynamics, or community vulnerability.
Additional statistical and sampling limitations should also be considered. The Atlantic drought classification was strongly unbalanced, comprising 36 drought-related and 324 neutral monthly observations, with the drought-related months concentrated within only three temporally clustered episodes. Monthly observations within the same drought episode cannot be regarded as equivalent to independent climatic events. An event-aware sensitivity analysis was therefore used to examine the consistency of the main Atlantic findings. Salinity anomalies were positive across all three drought episodes and the monthly salinity difference remained significant in leave-one-event-out analyses. In contrast, the wind-speed anomaly was not directionally consistent among events, and the monthly wind-speed difference disappeared when the 2011–2013 drought episode was excluded. Consequently, the Atlantic salinity finding appears more consistent across the available events, whereas the Atlantic wind-speed association remains event-sensitive. Nevertheless, the small number of independent drought episodes precludes strong event-level generalization and remains an important limitation of the study.
Consequently, the effective amount of independent information available for Atlantic comparisons is substantially smaller than the nominal monthly sample size. Rainfall was represented by a single long-term meteorological station, whereas most oceanographic and atmospheric variables represented a broader coastal sector derived from reanalysis products, introducing a spatial-scale mismatch among data sources. In addition, PERMDISP indicated significant differences in multivariate dispersion between rainy and dry seasons and among the climate × season cells. Thus, part of the strong seasonal multivariate differentiation reflects differences in within-group variability as well as differences in multivariate location. These features warrant caution when translating statistical group differences into generalized environmental responses.
The seasonal-adjustment procedure also represents a methodological choice. Although the multiplicative formulation was selected to represent seasonal variation proportional to the level of the environmental series and preserved zero rainfall observations without data loss, sensitivity to alternative seasonal-adjustment schemes, such as additive decomposition, was not evaluated. Future analyses could explicitly compare alternative decomposition approaches to assess the stability of the seasonally adjusted climatic associations.
Future studies should integrate higher-frequency observations, local tide-gauge and wave measurements, river discharge data, satellite-derived plume indicators, and coastal morphodynamic monitoring. This would allow a more detailed assessment of how climatic anomalies propagate from large-scale atmospheric forcing to local coastal impacts.
6. Conclusions
Environmental variability along the Brazilian Amazon coast was dominated by a pronounced regional seasonal structure, upon which smaller and variable-specific associations with large-scale Pacific and Atlantic climate variability were superimposed. Pacific ENSO phase was associated with a statistically detectable but modest multivariate environmental difference that remained significant under temporally restricted permutation testing. Wind speed showed the clearest ENSO-related differentiation, with higher values during El Niño than during neutral and La Niña conditions, while mean wave period was shorter during El Niño than during La Niña and neutral conditions. Rainfall and significant wave height showed comparatively weak and method-sensitive ENSO-related differences and were therefore not interpreted as robust responses.
Atlantic drought-related conditions showed more restricted associations. Although the parametric MANOVA detected an overall Atlantic difference, this result was not confirmed by the restricted-permutation PERMANOVA sensitivity analysis. At the individual-variable level, higher salinity represented the clearest and most event-consistent Atlantic drought-related difference. A monthly wind-speed difference was also detected, but event-aware sensitivity analysis showed that this association was not consistent across the three individual drought episodes and was strongly influenced by the 2011–2013 event. These findings indicate that Atlantic variability may contribute to specific environmental differences without producing a robust system-wide multivariate shift.
Formal climate × season analyses did not provide robust permutation-based evidence for generalized seasonal modulation of either the Pacific or Atlantic climatic associations. Instead, the results showed pronounced regional seasonal differentiation, although rainy and dry conditions also differed significantly in multivariate dispersion. The results therefore support a conceptual framework in which regional seasonality represents the dominant environmental structure and large-scale climate variability acts as a secondary and variable-specific modulator.
ONI and seasonally adjusted sea surface temperature showed a broad positive lagged association, with the largest observed coefficient at six months. Although nominal significance was observed across lags 4–9 months after accounting for temporal autocorrelation, no individual lag remained significant after FDR correction for multiple lag testing. The six-month maximum and the regression model incorporating ONI lag 6 should therefore be interpreted as exploratory rather than as confirmation of a specific physical response lag. No statistically significant delayed ONI–salinity association was detected. The exploratory SST regression accounted for 24.3% of seasonally adjusted SST variance (R2 = 0.243; adjusted R2 = 0.239), with lagged ONI and contemporaneous wind speed remaining associated with SST under HAC/Newey–West inference; however, these coefficients should not be interpreted as independent validation of a six-month response time.
Overall, the findings show that associations between large-scale climate variability and environmental conditions along the Brazilian Amazon coast are modest relative to the broader environmental variability and depend strongly on the environmental variable and temporal scale considered. Integrating seasonal, multivariate, robust statistical, and lagged approaches provides a more realistic characterization of these relationships than relying solely on statistical significance, annual averages, or isolated environmental variables. The results provide a basis for future process-oriented and monitoring studies, but further validation using independent observations and higher-frequency measurements is required before the identified statistical relationships can be translated into predictive or operational coastal applications.
Supplementary Materials
The following supporting information can be downloaded at: https://www.mdpi.com/article/10.3390/coasts6030040/s1. The supporting information includes the processed monthly environmental dataset used in the statistical analyses (Supplementary_Data_S1_Processed_Monthly_Data), the SPSS syntax for the parametric multivariate and univariate analyses (SUPPLEMENTARY CODE—SPSS), the R code for the complementary robustness, multiple-testing, time-series, event-aware, and regression analyses (SUPPLEMENTARY CODE—R), the complete lagged-correlation results with nominal and FDR-adjusted probabilities (Supplementary_Table_S1_Lagged_Correlations_FDR), the complete Spearman correlation results with nominal and FDR-adjusted probabilities (Supplementary_Table_S2_Spearman_FDR), and the Atlantic event-aware sensitivity analysis (Supplementary_Table_S3_Atlantic_Event_Sensitivity).
Author Contributions
Conceptualization, R.L.M.d.C.P. and L.C.C.P.; methodology, R.L.M.d.C.P., L.C.C.P. and B.R.P.d.S.; validation, R.L.M.d.C.P. and L.C.C.P.; formal analysis, R.L.M.d.C.P., L.C.C.P. and B.R.P.d.S.; investigation, R.L.M.d.C.P., B.R.P.d.S., R.M.d.C. and C.M.; resources, R.L.M.d.C.P.; data curation, R.L.M.d.C.P., L.C.C.P. and B.R.P.d.S.; writing—original draft preparation, R.L.M.d.C.P., B.R.P.d.S., R.M.d.C. and C.M.; supervision, L.C.C.P., R.M.d.C. and C.M.; project administration, L.C.C.P.; funding acquisition, L.C.C.P. All authors have read and agreed to the published version of the manuscript.
Funding
This research was funded by the Brazilian National Council for Scientific and Technological Development (CNPq) under grants 408518/2025-1, 307535/2025-8, and 395966/2025-1.
Data Availability Statement
The processed monthly dataset underlying the statistical analyses is provided with this article as Supplementary Data S1. The dataset includes the monthly climatic classifications, environmental variables, and seasonally adjusted scalar series used in the analyses for 1995–2024. The statistical syntax and scripts required to reproduce the reported analyses are provided as Supplementary Codes S1 and S2. The original environmental and climatic products were obtained from the publicly available data sources identified in Section 3.1, including NOAA, INMET, ERA5/Copernicus Climate Change Service, and the Copernicus Marine Service.
Conflicts of Interest
The authors declare no conflicts of interest.
References
- Wang, C. Three-ocean interactions and climate variability: A review and perspective. Clim. Dyn. 2019, 53, 5119–5136. [Google Scholar] [CrossRef] [Scilit]
- Li, G.; Yu, Z.; Li, Y.; Yang, C.; Gu, H.; Zhang, J.; Huang, Y. Interaction mechanism of global multiple ocean–atmosphere coupled modes and their impacts on South and East Asian Monsoon: A review. Glob. Planet. Change 2024, 237, 104438. [Google Scholar] [CrossRef] [Scilit]
- Timmermann, A.; An, S.-I.; Kug, J.-S.; Jin, F.-F.; Cai, W.; Capotondi, A.; Cobb, K.M.; Lengaigne, M.; McPhaden, M.J.; Stuecker, M.F.; et al. El Niño–Southern Oscillation complexity. Nature 2018, 559, 535–545. [Google Scholar] [CrossRef] [Scilit] [PubMed]
- Wang, C.; Picaut, J. Understanding ENSO physics—A review. In Earth’s Climate: The Ocean–Atmosphere Interaction; Wang, C., Xie, S.-P., Carton, J.A., Eds.; American Geophysical Union: Washington, DC, USA, 2004; Volume 147, pp. 21–48. [Google Scholar] [CrossRef] [Scilit]
- Cai, W.; Santoso, A.; Collins, M.; Dewitte, B.; Karamperidou, C.; Kug, J.-S.; Lengaigne, M.; McPhaden, M.J.; Stuecker, M.F.; Taschetto, A.S.; et al. Changing El Niño–Southern Oscillation in a warming climate. Nat. Rev. Earth Environ. 2021, 2, 628–644. [Google Scholar] [CrossRef] [Scilit]
- McPhaden, M.J.; Zebiak, S.E.; Glantz, M.H. ENSO as an integrating concept in Earth science. Science 2006, 314, 1740–1745. [Google Scholar] [CrossRef] [Scilit] [PubMed]
- Zaroug, M.A.H.; Eltahir, E.A.B.; Giorgi, F. Droughts and floods over the upper catchment of the Blue Nile and their connections to the timing of El Niño and La Niña events. Hydrol. Earth Syst. Sci. 2014, 18, 1239–1249. [Google Scholar] [CrossRef] [Scilit]
- Palutikof, J.P.; Boulter, S.L.; Barnett, J.; Rissik, D. (Eds.) Applied Studies in Climate Adaptation; Wiley Blackwell: Hoboken, NJ, USA, 2015. [Google Scholar] [CrossRef] [Scilit]
- Guo, Y.; Hu, A.; Meehl, G.A.; Molina, M.J.; Li, H.; Bellomo, K.; Rosenbloom, N. Migration of the intertropical convergence zone driven by ocean circulation changes. Nat. Commun. 2026, 17, 6501. [Google Scholar] [CrossRef] [Scilit] [PubMed]
- Fasullo, J.T.; Otto-Bliesner, B.L.; Stevenson, S. ENSO’s changing influence on temperature, precipitation, and wildfire in a warming climate. Geophys. Res. Lett. 2018, 45, 9216–9225. [Google Scholar] [CrossRef] [Scilit]
- Cai, W.; McPhaden, M.J.; Grimm, A.M.; Rodrigues, R.R.; Taschetto, A.S.; Garreaud, R.D.; Dewitte, B.; Poveda, G.; Ham, Y.-G.; Santoso, A.; et al. Climate impacts of the El Niño–Southern Oscillation on South America. Nat. Rev. Earth Environ. 2020, 1, 215–231. [Google Scholar] [CrossRef] [Scilit]
- Sun, J.; Guo, D.; Sanikommu, S.; Krokos, G.; Zhan, P.; Hoteit, I. El Niño–Southern Oscillation drives interannual extremes of surface salinity in the Red Sea. J. Geophys. Res. Oceans 2026, 131, e2025JC023637. [Google Scholar] [CrossRef] [Scilit]
- Alexander, M.A.; Bladé, I.; Newman, M.; Lanzante, J.R.; Lau, N.-C.; Scott, J.D. The atmospheric bridge: The influence of ENSO teleconnections on air–sea interaction over the global oceans. J. Clim. 2002, 15, 2205–2231. [Google Scholar] [CrossRef] [Scilit]
- Odériz, I.; Silva, R.; Mortlock, T.R.; Mori, N. El Niño–Southern Oscillation impacts on global wave climate and potential coastal hazards. J. Geophys. Res. Oceans 2020, 125, e2020JC016464. [Google Scholar] [CrossRef] [Scilit]
- Rodrigues, R.R.; Taschetto, A.S.; Sen Gupta, A.; Foltz, G.R. Common cause for severe droughts in South America and marine heatwaves in the South Atlantic. Nat. Geosci. 2019, 12, 620–626. [Google Scholar] [CrossRef] [Scilit]
- McGregor, S.; Timmermann, A.; Stuecker, M.F.; England, M.H.; Merrifield, M.; Jin, F.-F.; Chikamoto, Y. Recent Walker circulation strengthening and Pacific cooling amplified by Atlantic warming. Nat. Clim. Change 2014, 4, 888–892. [Google Scholar] [CrossRef] [Scilit]
- Rodrigues, R.R.; Haarsma, R.J.; Campos, E.J.D.; Ambrizzi, T. The impacts of inter-El Niño variability on the Tropical Atlantic and Northeast Brazil climate. J. Clim. 2011, 24, 3402–3422. [Google Scholar] [CrossRef] [Scilit]
- Yoon, J.-H.; Zeng, N. An Atlantic influence on Amazon rainfall. Clim. Dyn. 2010, 34, 249–264. [Google Scholar] [CrossRef] [Scilit]
- Ronchail, J.; Cochonneau, G.; Molinier, M.; Guyot, J.-L.; Chaves, A.G.M.; Guimarães, V.; de Oliveira, E. Interannual rainfall variability in the Amazon basin and sea-surface temperatures in the equatorial Pacific and tropical Atlantic Oceans. Int. J. Climatol. 2002, 22, 1663–1686. [Google Scholar] [CrossRef] [Scilit]
- Cunha, A.P.M.A.; Zeri, M.; Deusdará Leal, K.; Costa, L.; Cuartas, L.A.; Marengo, J.A.; Tomasella, J.; Vieira, R.M.; Barbosa, A.A.; Cunningham, C.; et al. Extreme drought events over Brazil from 2011 to 2019. Atmosphere 2019, 10, 642. [Google Scholar] [CrossRef] [Scilit]
- Marengo, J.A.; Espinoza, J.C. Extreme seasonal droughts and floods in Amazonia: Causes, trends and impacts. Int. J. Climatol. 2016, 36, 1033–1050. [Google Scholar] [CrossRef] [Scilit]
- Jiménez-Muñoz, J.C.; Mattar, C.; Barichivich, J.; Santamaría-Artigas, A.; Takahashi, K.; Malhi, Y.; Sobrino, J.A.; van der Schrier, G. Record-breaking warming and extreme drought in the Amazon rainforest during the course of El Niño 2015–2016. Sci. Rep. 2016, 6, 33130. [Google Scholar] [CrossRef] [Scilit] [PubMed]
- Marengo, J.A.; Souza, C.M.; Thonicke, K.; Burton, C.; Halladay, K.; Betts, R.A.; Alves, L.M.; Soares, W.R. Changes in climate and land use over the Amazon region: Current and future variability and trends. Front. Earth Sci. 2018, 6, 228. [Google Scholar] [CrossRef] [Scilit]
- Moura, M.M.; dos Santos, A.R.; Pezzopane, J.E.M.; Alexandre, R.S.; da Silva, S.F.; Pimentel, S.M.; Andrade, M.S.S.; Silva, F.G.R.; Branco, E.R.F.; Moreira, T.R.; et al. Relation of El Niño and La Niña phenomena to precipitation, evapotranspiration and temperature in the Amazon basin. Sci. Total Environ. 2019, 651, 1639–1651. [Google Scholar] [CrossRef] [Scilit] [PubMed]
- Costa, A.K.R.; Pereira, L.C.C.; Jimenez, J.A.; Oliveira, A.R.G.; Montes, M.J.F.; Costa, R.M. Effects of extreme climatic events on the hydrological parameters of the estuarine waters of the Amazon coast. Estuaries Coasts 2022, 45, 1517–1533. [Google Scholar] [CrossRef] [Scilit]
- Espinoza, J.C.; Jimenez, J.C.; Marengo, J.A.; Schongart, J.; Ronchail, J.; Lavado-Casimiro, W.; Ribeiro, J.V.M. The new record of drought and warmth in the Amazon in 2023 related to regional and global climatic features. Sci. Rep. 2024, 14, 8107. [Google Scholar] [CrossRef] [Scilit] [PubMed]
- Varona, H.L.; Veleda, D.; Silva, M.; Cintra, M.; Araujo, M. Amazon River plume influence on Western Tropical Atlantic dynamic variability. Dyn. Atmos. Oceans 2019, 85, 1–15. [Google Scholar] [CrossRef] [Scilit]
- Tyaquiçã, P.; Veleda, D.; Lefèvre, N.; Araujo, M.; Noriega, C.; Caniaux, G.; Servain, J.; Silva, T. Amazon plume salinity response to ocean teleconnections. Front. Mar. Sci. 2017, 4, 250. [Google Scholar] [CrossRef] [Scilit]
- Anthony, E.J.; Gardel, A.; Proisy, C.; Fromard, F.; Gensac, E.; Peron, C.; Walcker, R.; Lesourd, S. The role of fluvial sediment supply and river-mouth hydrology in the dynamics of the muddy, Amazon-dominated Amapá–Guianas coast, South America: A three-point research agenda. J. S. Am. Earth Sci. 2013, 44, 18–24. [Google Scholar] [CrossRef] [Scilit]
- Pereira, L.C.C.; Vila-Concejo, A.; Costa, R.M.; Short, A.D. Managing physical and anthropogenic hazards on macrotidal Amazon beaches. Ocean Coast. Manag. 2014, 96, 149–162. [Google Scholar] [CrossRef] [Scilit]
- Pereira, L.C.C.; Vila-Concejo, A.; Short, A.D. Coastal morphodynamic processes on the macro-tidal beaches of Pará State under tidally modulated wave conditions. In Brazilian Beach Systems; Short, A.D., Klein, A.H.F., Eds.; Springer: Cham, Switzerland, 2016; pp. 95–124. [Google Scholar] [CrossRef] [Scilit]
- Anthony, E.J.; Gardel, A.; Gratiot, N.; Proisy, C.; Allison, M.A.; Dolique, F.; Fromard, F. The Amazon-influenced muddy coast of South America: A review of mud-bank–shoreline interactions. Earth-Sci. Rev. 2010, 103, 99–121. [Google Scholar] [CrossRef] [Scilit]
- Callède, J.; Guyot, J.L.; Ronchail, J.; L’Hôte, Y.; Niel, H.; de Oliveira, E. Evolution du débit de l’Amazone à Óbidos de 1903 à 1999/Evolution of the River Amazon’s discharge at Óbidos from 1903 to 1999. Hydrol. Sci. J. 2004, 49, 85–97. [Google Scholar] [CrossRef] [Scilit]
- Martinez, J.-M.; Guyot, J.-L.; Filizola, N.; Sondag, F. Increase in suspended sediment discharge of the Amazon River assessed by monitoring network and satellite data. Catena 2009, 79, 257–264. [Google Scholar] [CrossRef] [Scilit]
- de Freitas, P.P.; Cirano, M.; Teixeira, C.E.P.; Marta-Almeida, M.; de Brito Borges, F.F.; Guerrero-Martin, C.A.; Costa Gomes, V.J. Pathways of surface oceanic water intrusion into the Amazon Continental Shelf. Ocean Dyn. 2024, 74, 321–334. [Google Scholar] [CrossRef] [Scilit]
- Luiz-Silva, W.; Oscar-Júnior, A.C.; Cavalcanti, I.F.A.; Treistman, F. An overview of precipitation climatology in Brazil: Space-time variability of frequency and intensity associated with atmospheric systems. Hydrol. Sci. J. 2021, 66, 289–308. [Google Scholar] [CrossRef] [Scilit]
- NOAA Climate Prediction Center. Oceanic Niño Index (ONI): Historical El Niño/La Niña Episodes (1950–Present); National Weather Service, National Centers for Environmental Prediction, National Oceanic and Atmospheric Administration: Silver Spring, MD, USA, 2026. [Google Scholar]
- Marengo, J.A.; Alves, L.M.; Soares, W.R.; Rodriguez, D.A.; Camargo, H.; Riveros, M.P.; Pabló, A.D. Two contrasting severe seasonal extremes in tropical South America in 2012: Flood in Amazonia and drought in Northeast Brazil. J. Clim. 2013, 26, 9137–9154. [Google Scholar] [CrossRef] [Scilit]
- Marengo, J.A.; Borma, L.S.; Rodriguez, D.A.; Pinho, P.; Soares, W.R.; Alves, L.M. Recent extremes of drought and flooding in Amazonia: Vulnerabilities and human adaptation. Am. J. Clim. Change 2013, 2, 87–96. [Google Scholar] [CrossRef]
- Trenberth, K.E. The definition of El Niño. Bull. Am. Meteorol. Soc. 1997, 78, 2771–2777. [Google Scholar] [CrossRef] [Scilit]
- Hersbach, H.; Bell, B.; Berrisford, P.; Hirahara, S.; Horányi, A.; Muñoz-Sabater, J.; Nicolas, J.; Peubey, C.; Radu, R.; Schepers, D.; et al. The ERA5 global reanalysis. Q. J. R. Meteorol. Soc. 2020, 146, 1999–2049. [Google Scholar] [CrossRef] [Scilit]
- Copernicus Climate Change Service (C3S). ERA5 Hourly Data on Single Levels from 1940 to Present; Copernicus Climate Change Service Climate Data Store: Reading, UK, 2023. [Google Scholar] [CrossRef]
- Copernicus Marine Service. Global Ocean Waves Reanalysis, GLOBAL_MULTIYEAR_WAV_001_032; E.U. Copernicus Marine Service Information, Marine Data Store: Toulouse, France, 2026. [Google Scholar] [CrossRef]
- Copernicus Marine Service. Global Ocean Physics Reanalysis, GLOBAL_MULTIYEAR_PHY_001_030; E.U. Copernicus Marine Service Information, Marine Data Store: Toulouse, France, 2026. [Google Scholar] [CrossRef]
- Lellouche, J.-M.; Greiner, E.; Bourdallé-Badie, R.; Garric, G.; Melet, A.; Drévillon, M.; Bricaud, C.; Hamon, M.; Le Galloudec, O.; Regnier, C.; et al. The Copernicus Global 1/12° Oceanic and Sea Ice GLORYS12 Reanalysis. Front. Earth Sci. 2021, 9, 698876. [Google Scholar] [CrossRef] [Scilit]
- Coles, V.J.; Brooks, M.T.; Hopkins, J.; Stukel, M.R.; Yager, P.L.; Hood, R.R. The pathways and properties of the Amazon River plume in the tropical North Atlantic Ocean. J. Geophys. Res. Oceans 2013, 118, 6894–6913. [Google Scholar] [CrossRef] [Scilit]
- Chelton, D.B.; Xie, S.-P. Coupled ocean–atmosphere interaction at oceanic mesoscales. Oceanography 2010, 23, 52–69. [Google Scholar] [CrossRef] [Scilit]
- Anthony, E.J.; Gardel, A.; Gratiot, N. Fluvial sediment supply, mud banks, cheniers and the morphodynamics of the coast of South America between the Amazon and Orinoco river mouths. Geol. Soc. Lond. Spec. Publ. 2014, 388, 533–560. [Google Scholar] [CrossRef] [Scilit]
- Barbier, E.B.; Hacker, S.D.; Kennedy, C.; Koch, E.W.; Stier, A.C.; Silliman, B.R. The value of estuarine and coastal ecosystem services. Ecol. Monogr. 2011, 81, 169–193. [Google Scholar] [CrossRef] [Scilit]
- Arkema, K.K.; Guannel, G.; Verutes, G.; Wood, S.A.; Guerry, A.; Ruckelshaus, M.; Kareiva, P.; Lacayo, M.; Silver, J.M. Coastal habitats shield people and property from sea-level rise and storms. Nat. Clim. Change 2013, 3, 913–918. [Google Scholar] [CrossRef] [Scilit]
- Lee, S.Y.; Primavera, J.H.; Dahdouh-Guebas, F.; McKee, K.; Bosire, J.O.; Cannicci, S.; Diele, K.; Fromard, F.; Koedam, N.; Marchand, C.; et al. Ecological role and services of tropical mangrove ecosystems: A reassessment. Glob. Ecol. Biogeogr. 2014, 23, 726–743. [Google Scholar] [CrossRef] [Scilit]
- Mentaschi, L.; Vousdoukas, M.I.; Pekel, J.-F.; Voukouvalas, E.; Feyen, L. Global long-term observations of coastal erosion and accretion. Sci. Rep. 2018, 8, 12876. [Google Scholar] [CrossRef] [Scilit] [PubMed]
- Gillson, J. Freshwater flow and fisheries production in estuarine and coastal systems: Where a drop of rain is not lost. Rev. Fish. Sci. 2011, 19, 168–186. [Google Scholar] [CrossRef] [Scilit]
- Farquhar, S.; Nirindrainy, A.F.; Heck, N.; Gomez Saldarriaga, M.; Xu, Y. The impacts of long-term changes in weather on small-scale fishers’ available fishing hours in Nosy Barren, Madagascar. Front. Mar. Sci. 2022, 9, 841048. [Google Scholar] [CrossRef] [Scilit]
- Temmerman, S.; Meire, P.; Bouma, T.J.; Herman, P.M.J.; Ysebaert, T.; De Vriend, H.J. Ecosystem-based coastal defence in the face of global change. Nature 2013, 504, 79–83. [Google Scholar] [CrossRef] [Scilit] [PubMed]
- Menéndez, P.; Losada, I.J.; Torres-Ortega, S.; Narayan, S.; Beck, M.W. The global flood protection benefits of mangroves. Sci. Rep. 2020, 10, 4404. [Google Scholar] [CrossRef] [Scilit] [PubMed]
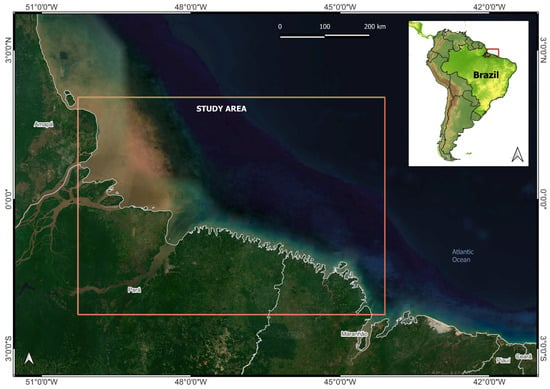
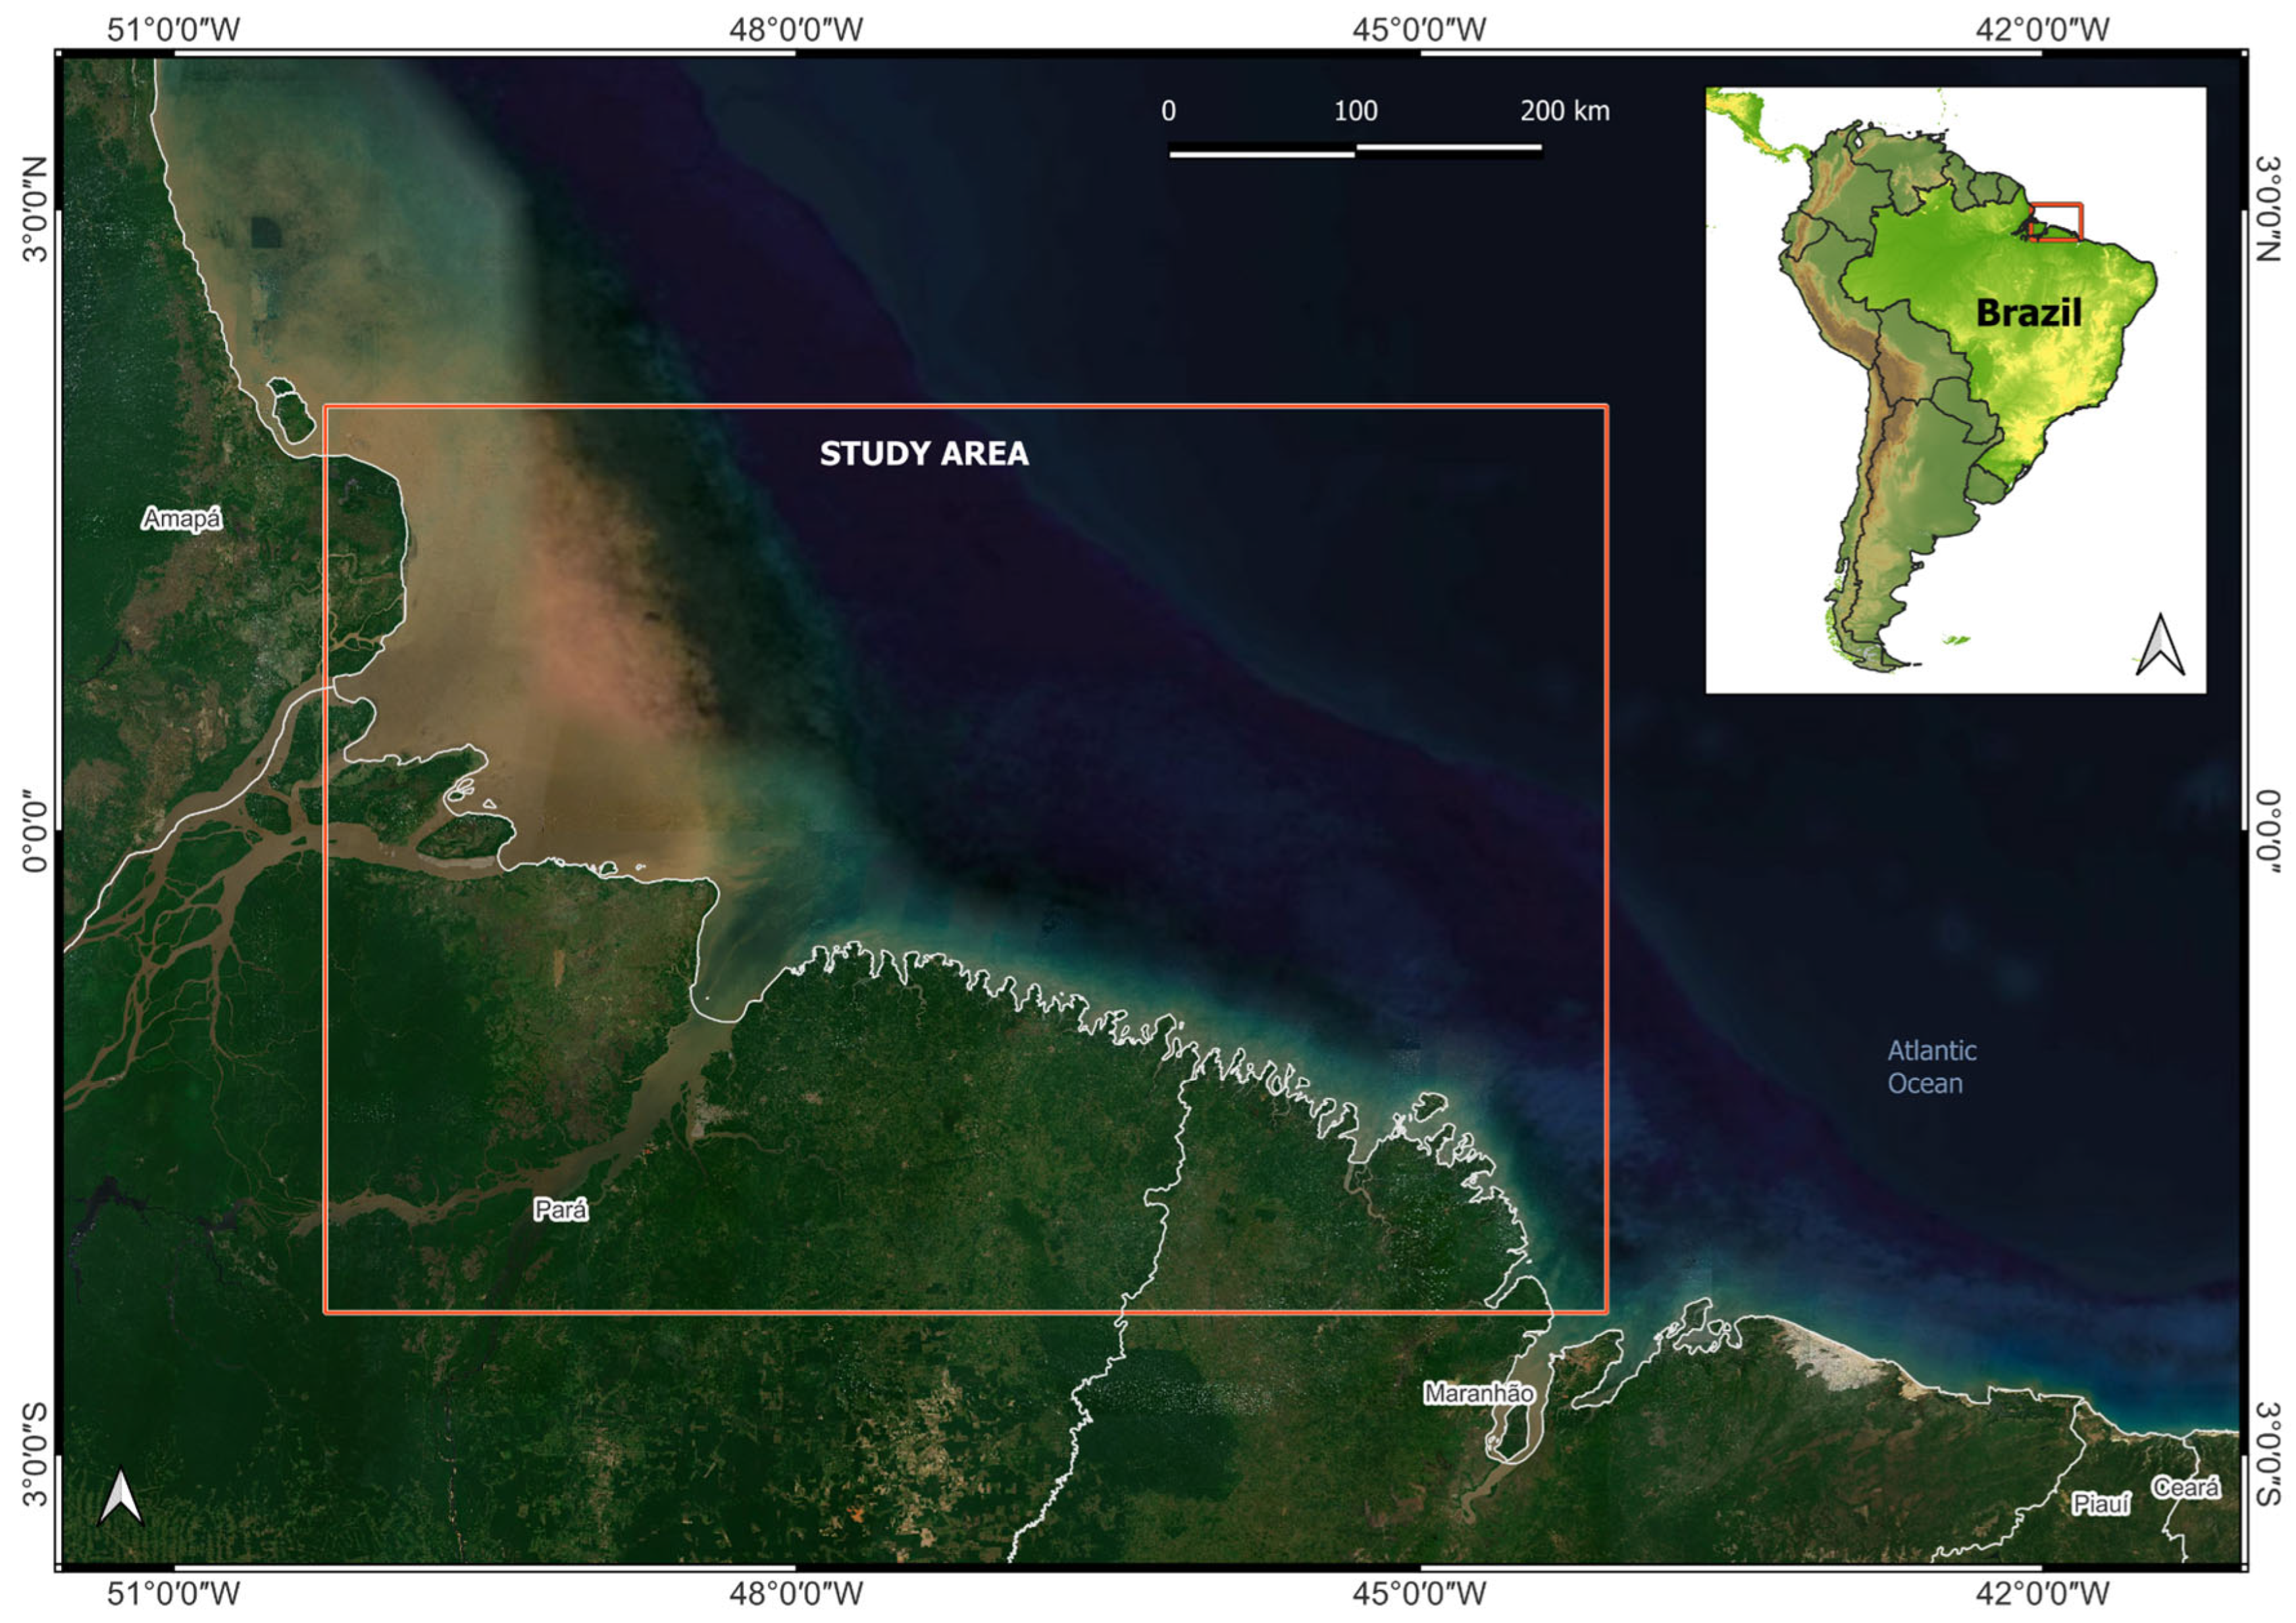
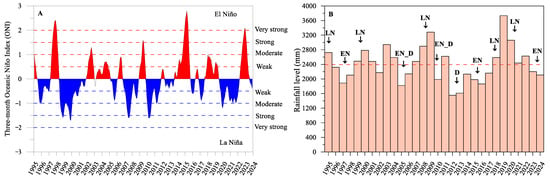
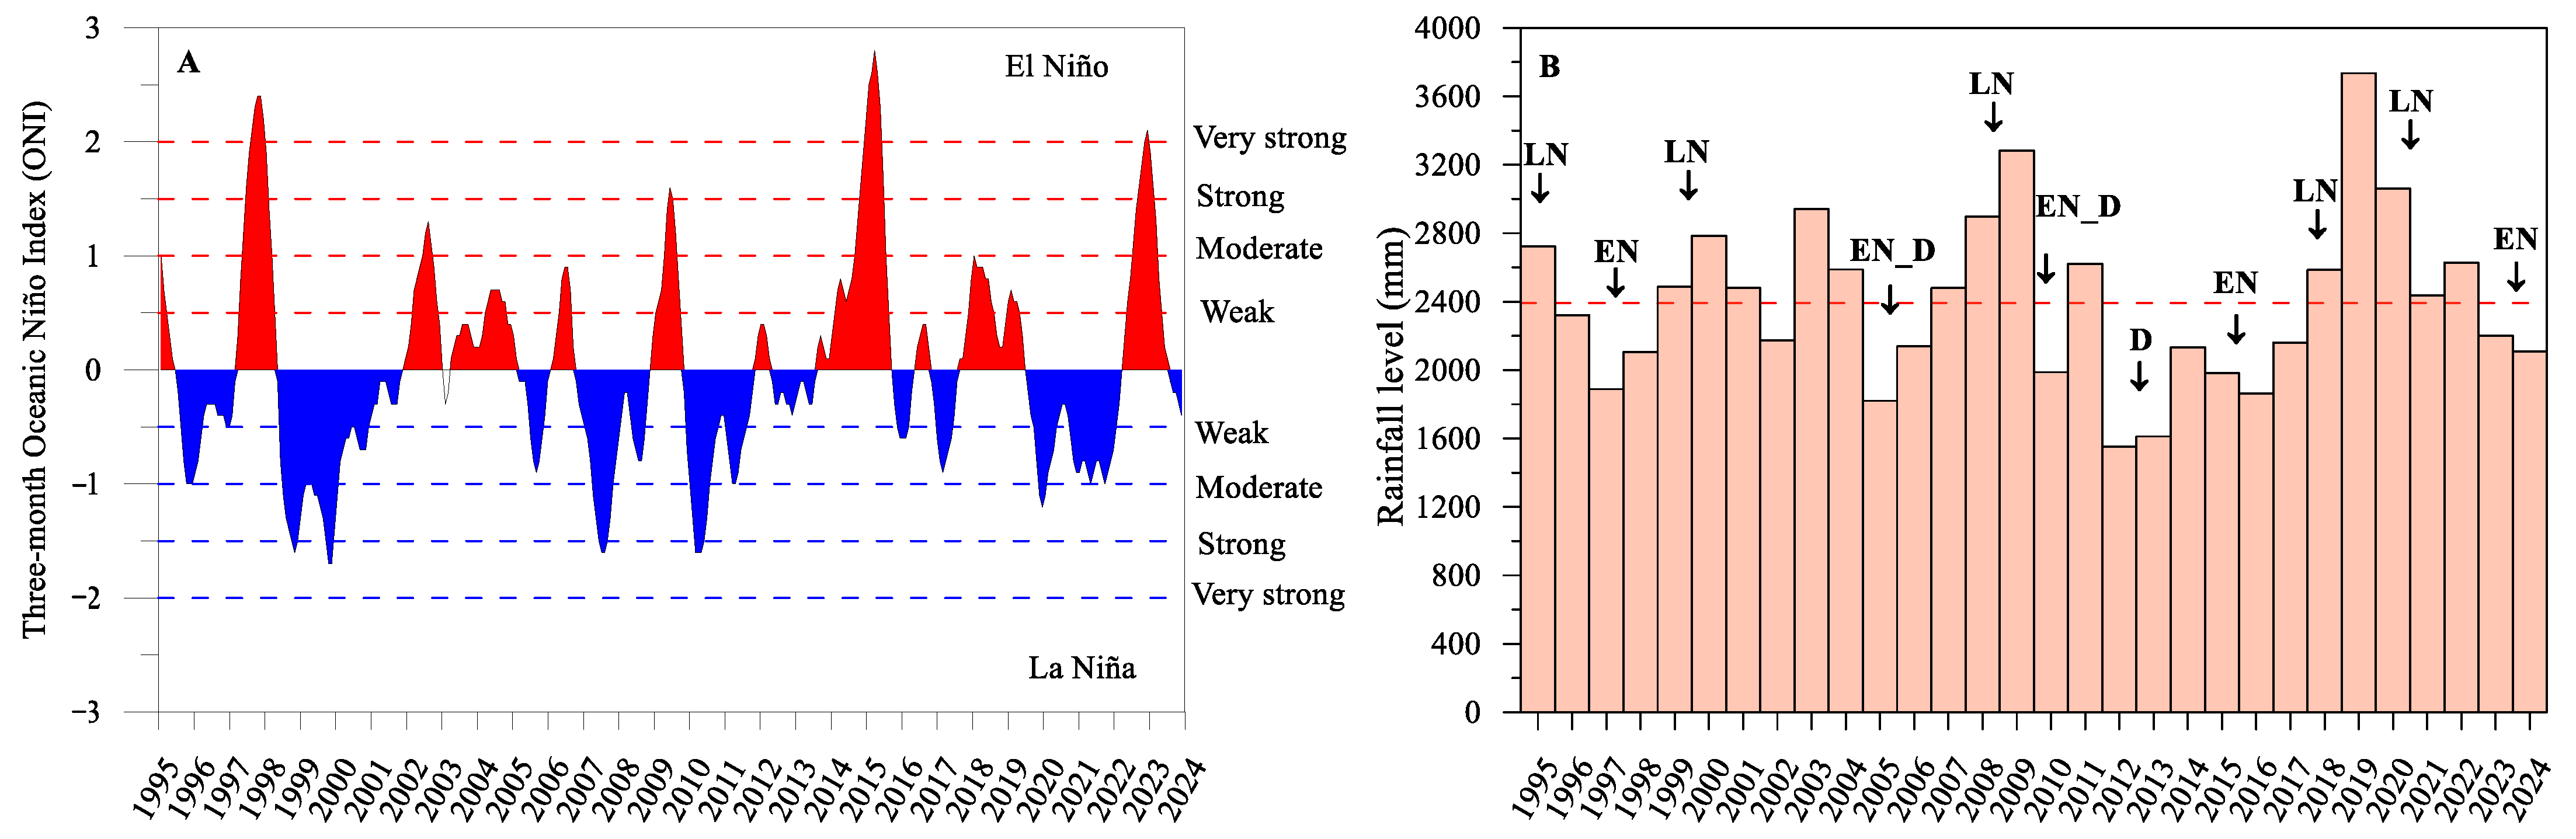
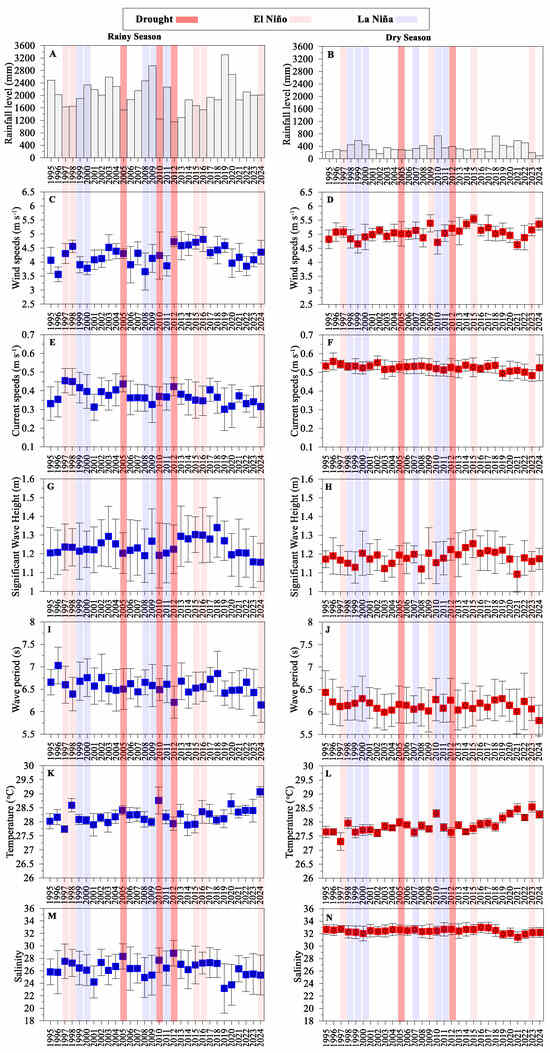
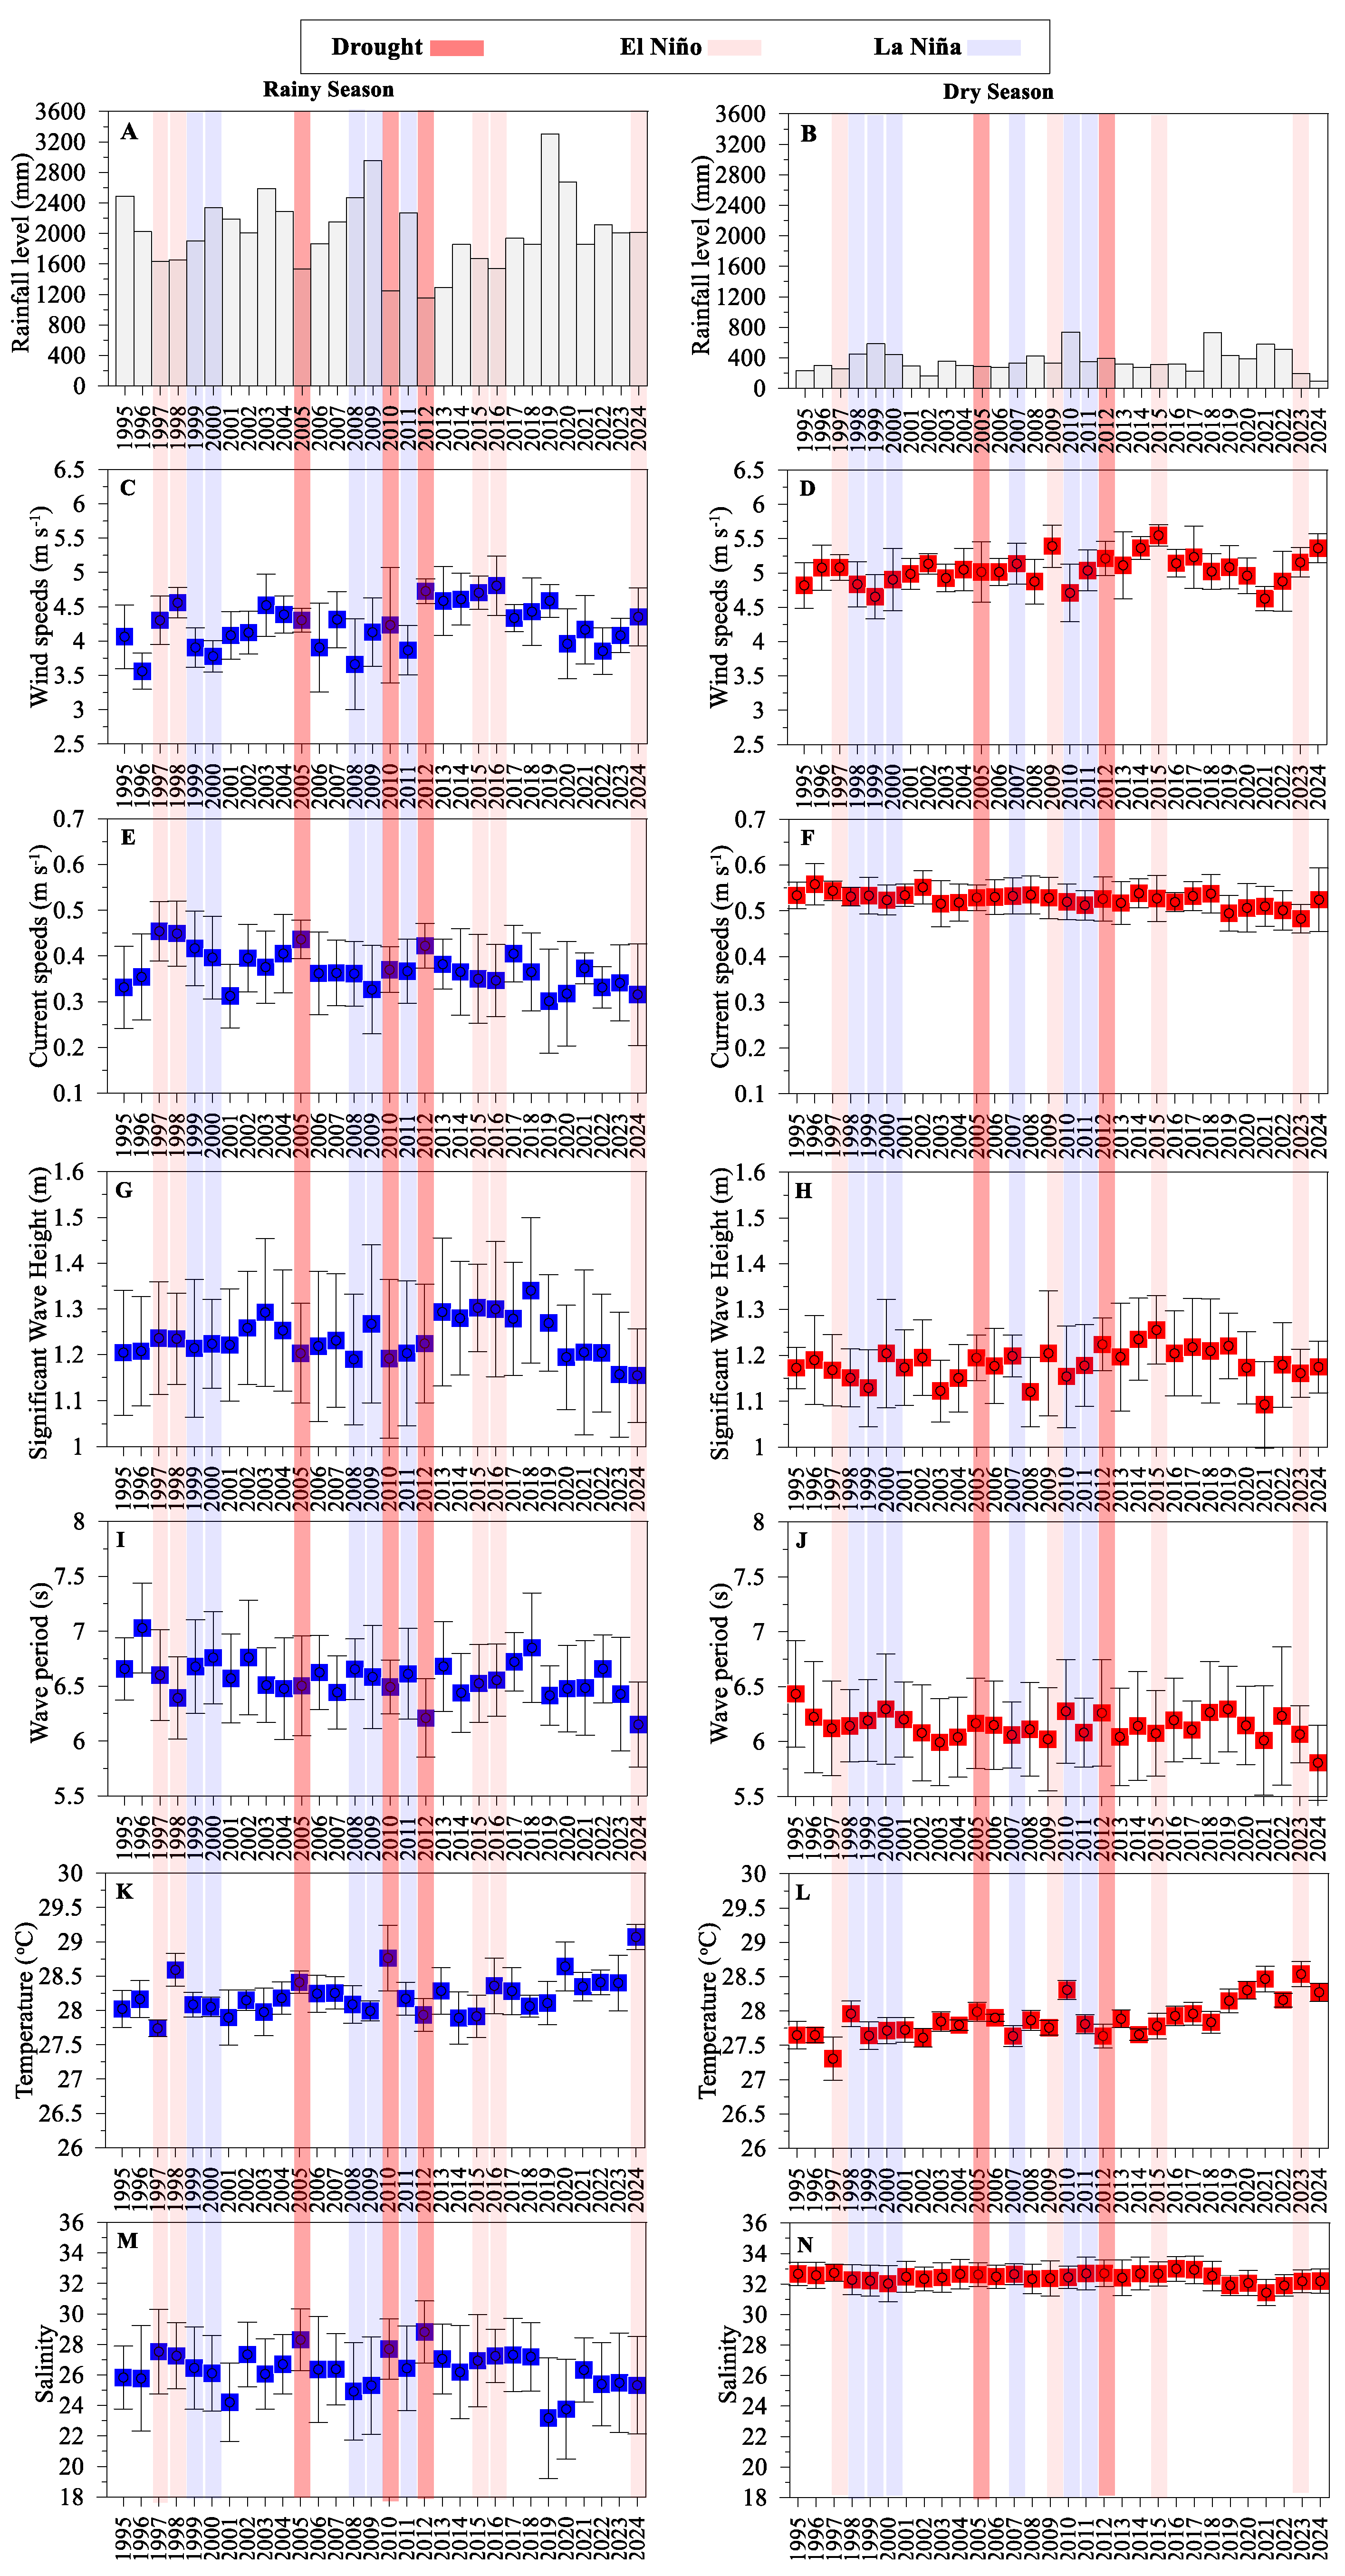
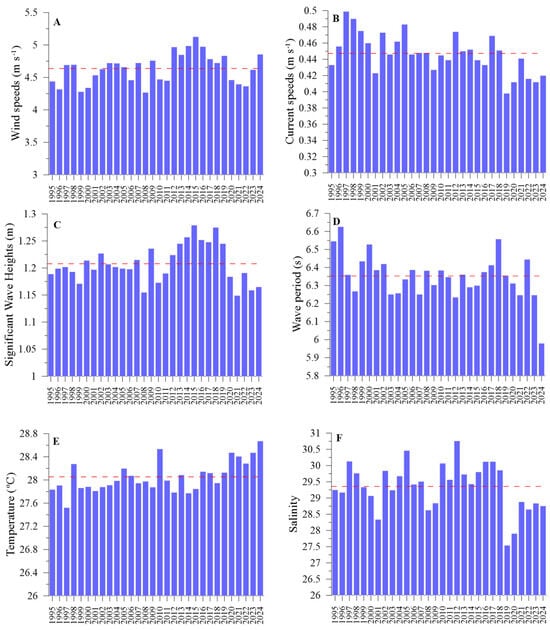
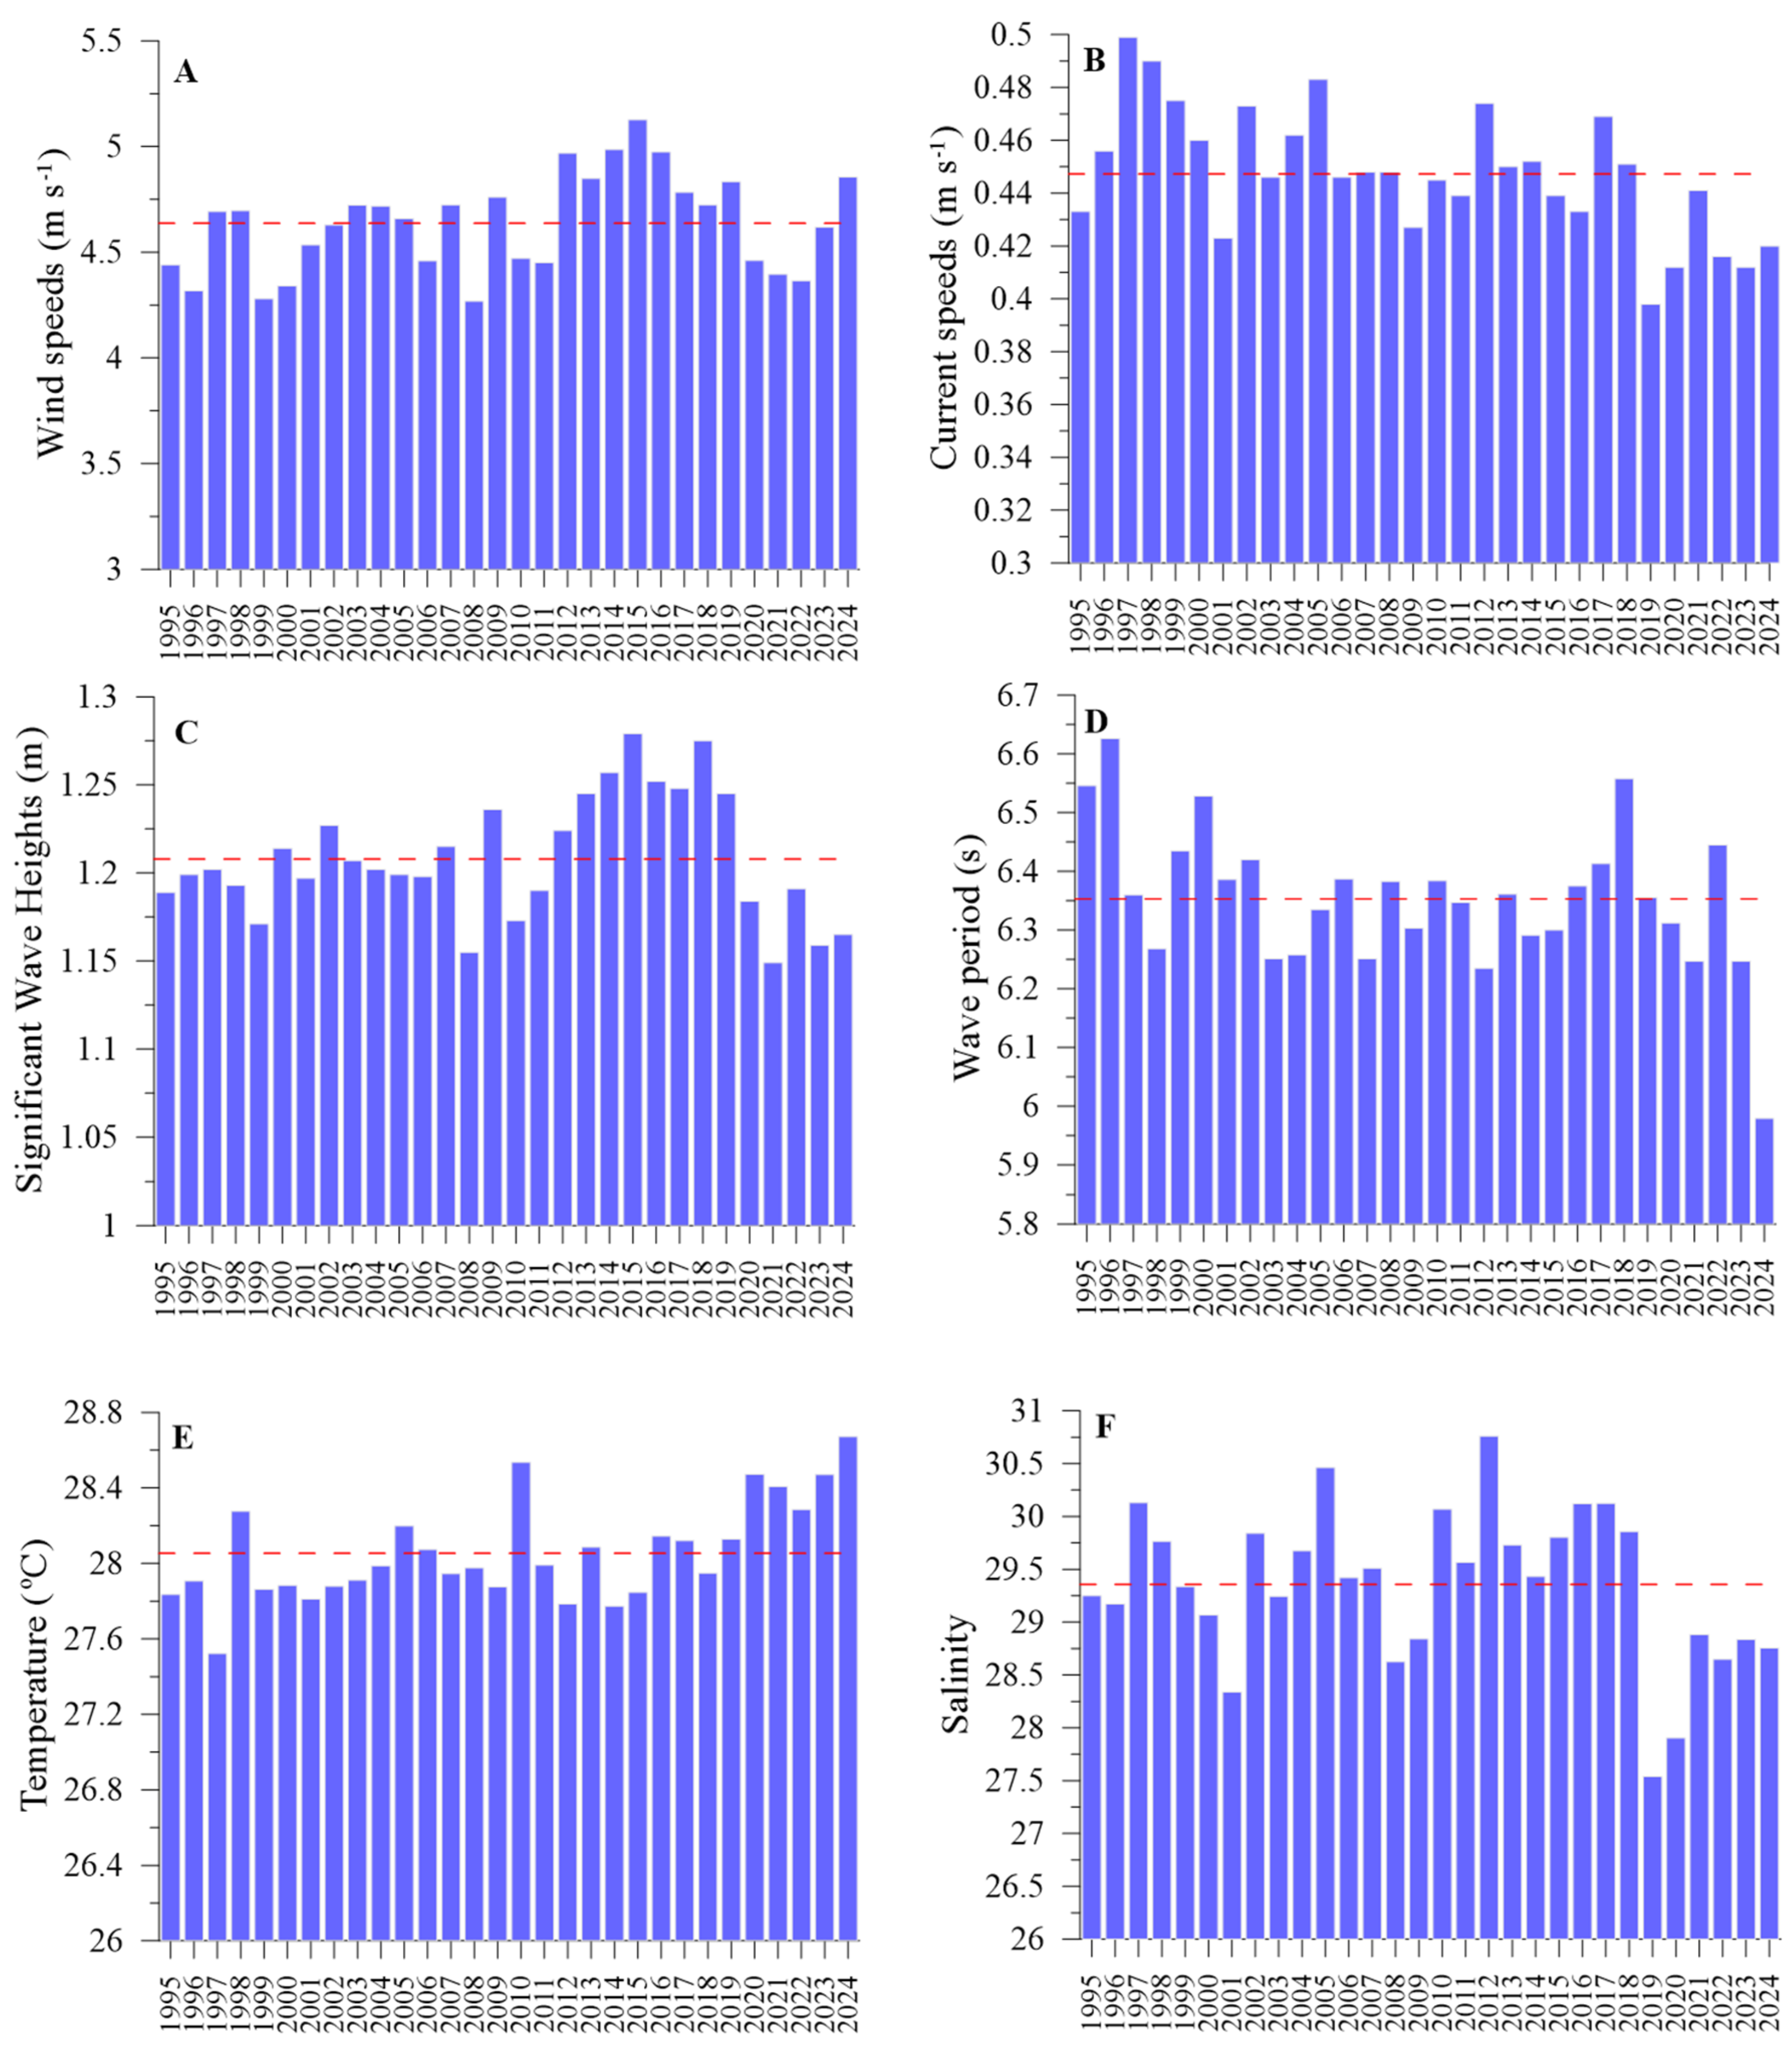

Disclaimer/Publisher’s Note: The statements, opinions and data contained in all publications are solely those of the individual author(s) and contributor(s) and not of MDPI and/or the editor(s). MDPI and/or the editor(s) disclaim responsibility for any injury to people or property resulting from any ideas, methods, instructions or products referred to in the content. |
© 2026 by the authors. Licensee MDPI, Basel, Switzerland. This article is an open access article distributed under the terms and conditions of the Creative Commons Attribution (CC BY) license.