


Highlights
What are the main findings?
- Developed an Integrated Coastal Vulnerability Index (ICVI) to assess coastal hazard vulnerability along the east coast of the UAE.
- Mapped coral reefs, seagrass, and macro-algae and evaluated their proximity with offshore submarine canyon-like features.
- Proposed a GIS-based methodology to identify coastal areas, land use, and infrastructure vulnerable to a 3 m tsunami/storm surge scenario.
What is the implication of the main finding?
- The ICVI identified 26.4% of the coastline as highly vulnerable, providing a valuable tool for coastal planning and climate adaptation.
- The study highlights the critical role of nearshore bathymetry, particularly submarine canyons, in amplifying coastal hazards and influencing benthic ecosystem vulnerability.
- A 3 m inundation could affect 56.76 km² of coastal land, expose nearly 40,000 people, and impact key infrastructure, emphasizing the need for resilient coastal management and disaster preparedness.
Abstract
As they are home to numerous significant ecosystems, natural resources, and a growing population, coastal regions are among the most vital locations on Earth. This study, pertaining to the east coast of the UAE, integrates nine distinct characteristics to provide a thorough methodology for assessing integrated coastal vulnerability. Land use and land cover (LULC), nearshore bathymetry, coastal geomorphology, coastal slope, shoreline erosion and deposition, population density, wave and tide, and nearshore benthic features are important parameters that are examined. For the first time, coastal benthic features are included to assess coastal vulnerability in this region. By combining the variably weighted rank values of the nine variables, an Integrated Coastal Vulnerability Index was created, which divides the coastline into low-, moderate-, and high-risk categories. The methodology improves the precision of regional risk assessments by combining these factors with data from real-time coastal surveillance. Approximately 26.4% of the UAE’s 178 km east coast (or 47.1 km) is at high risk, followed by 17.3% (or 30.9 km) at moderate risk and 56.3% (or 100.2 km) at low risk. The offshore areas of the east coast of the UAE are prone to shoaling and tunneling effects from incoming high waves at certain areas due to the concave-shaped bathymetry and medium-range canyons present, which exacerbate storm surges or tsunamis due to the shoaling effect. For a 3 m rise in sea level, most significantly, 5.58 km2 of plantation and 14.39 km2 of residential areas will be damaged in the Kalba and Fujairah regions. Additional commercial spaces totaling 1.07 km2 will also have an impact, adding to the existing 2.59 km2 of oil bunkers in Fujairah. More than 40,000 people who live within 3.0 m of the UAE’s east coast in six separate districts—Kalba, Fujairah City, Mirbah and Qidfa, Khorfakkan, Dadna and Bidya, and Dibba—will be impacted if a tsunami wave or storm surge of three meters strikes the east coast. Our results are intended to assist government agencies, coastal planners, and policymakers in the Northeast Emirates (Fujairah and Sharjah) in creating sustainable and successful adaptation and mitigation plans for areas most vulnerable to coastal hazards. In addition to enhancing scientific knowledge of coastal vulnerabilities, this integrative method is a useful tool for making well-informed decisions in the face of shifting socio-economic and climatic situations.
1. Introduction
The evaluation of shoreline resilience to sea-level change is a key idea in the study of coastal hazards. The change in sea level in relation to the shoreline can be explained in two dimensions of time. The first is the long-term, gradual shift brought on by the coastline’s adaptation to tectonic movement or sedimentary settlement over time [1]. The other movement is the abrupt increase in sea level brought on by storm waves from cyclones and tsunamis. The melting of ice in the world’s main glaciers and the thermal expansion of water due to global warming are considered slow drivers of sea-level rise in the recent past [2,3,4]. By the end of this century, the global sea level is predicted to increase by over 70 cm if the current rate of ice melt continues [4,5]. An alternative scenario, however, was projected by the authors of [6,7], according to which the sea level would rise by about 200 cm by 2100 as a result of ice melting and the thermal expansion of water. Unlike the regional effects of tsunamis or tectonically induced sea-level rise, this eustatic sea-level rise is significant on a global scale, despite its relative slowness. In any event, the degree of sea-level flooding depends on the nature and features of the coastal zone [8,9,10,11]. Oceanographic processes and nearshore bathymetry also affect the inundation patterns [1,12,13,14,15]. The abrupt increase in sea level is undoubtedly the most damaging [16,17,18].
Over the past century, more people have chosen coastal regions as ideal locations for establishing businesses and homes [19]. The substantial human presence in coastal regions is highlighted by the fact that 45–60% of the world’s population is estimated to reside there [2,3]. This is because a variety of socio-economic activities take place at or close to coasts, including trade, energy production, urbanization, tourism, recreation, and industrial operations [20]. As a result, infrastructure and people are now more susceptible to coastal risks, including coastal erosion [1,19], which raises the price of preventative measures. Therefore, a crucial component of long-term risk reduction management along coastal regions is the risk assessment of natural hazards. There is no evidence of the gradual rise in sea level along the east coast of the UAE; nevertheless, global projections suggest that this trend is occurring. Flooding in coastal lowlands below the 2 m level may result from this gradual alteration [21,22]. For instance, the authors of [23] stated that a 1 m rise in sea level may overrun an area of 6165 km2 along the Egyptian Nile Delta coast, which is below the 1 m level. The authors of [20] also discovered that an area of 980 km2 is below the 1 m level along the Saudi Arabian Red Sea coast. Therefore, the most important factors influencing vulnerability to sea-level rise are elevation, bathymetry, and coastal slope.
Tropical cyclones are common in the Gulf of Oman, the Arabian Sea, and the Indian Ocean. Any cyclone that makes landfall in northern Oman, particularly in the direction of Sohar and Muscat, will have an effect on the UAE’s east coast by causing storm surges that harm the country’s coastal infrastructure [24,25]. The strongest cyclone in the Arabian Sea, Gonu, struck Muscat and the eastern coast of Oman in June 2007 and damaged coastal areas of Fujairah, as well as claiming four lives. Cyclone Gonu killed 49 people and caused USD 4 billion in damages in Oman [26]. In June 2010, Phet—the second-largest tropical cyclone to strike the coast of Oman—made landfall, resulting in 40 deaths and approximately USD 1 billion in damages [27]. Even though the infrastructure was damaged by the May 2018 hurricane Mekunu, there were not many fatalities. On 3 October 2021, another cyclone, named Shaheen, made landfall in Oman, which is close to Muscat. With gusts of up to 70 miles per hour, it was classified as a severe cyclonic storm. This cyclone caused significant flooding and heavy rainfall in Oman’s and Fujairah’s valleys, and its strong winds caused enormous storm surges along the coast of Fujairah, which substantially damaged homes and coastal infrastructure, injured and killed people, and ultimately forced many to relocate.
On the other side of the Indian Ocean, maritime earthquakes are the primary cause of tsunamis. One of the most catastrophic events in history occurred in December 2004 when an Mw 9.1 maritime earthquake in Indonesia caused massive waves, killing over 250,000 people in a matter of hours [16]. The Indonesian tsunami waves traveled thousands of kilometers across the Indian Ocean before reaching the eastern coast of Africa, where they killed numerous people in Somalia (279), Tanzania (13), and Kenya (1) [28]. One of the hotspots in the Indian Ocean that is vulnerable to marine earthquakes is the Makran Subduction Zone (MSZ) in the Gulf of Oman [29]. Initiated by a thrust fault along the MSZ in the Gulf of Oman, a devastating tsunami struck the Omani beaches in 1945, killing over 4000 people in the area [30]. At present, the majority of tsunami wave predictions are based on speculative assumptions about varying earthquake magnitudes along the MSZ [31,32]. Other tsunamis that struck the Omani coast in 1885 and 2013 had a major effect on the coastal infrastructure.
The characteristics of the coastline and its nearshore area dictate the degree of flooding caused by any increase in sea level. Typically, steep, rocky, and cliff-like shorelines exhibit greater resilience than flat, sandy beaches [8]. Gornitz (1990) [33] introduced the physical vulnerability of coasts to sea-level rise to emphasize the susceptibility of the shoreline, categorizing vulnerability into five levels: very low, low, moderate, high, and very high. This indicator is clear and indicates the susceptibility of coasts based on the inherent characteristics of the nearshore and backshore areas of a coastal zone. The United States Geological Survey (USGS) implemented the Coastal Vulnerability Index (CVI) methodology along several U.S. coastlines [34,35,36]. Numerous research studies have embraced the CVI globally, considering the relative characteristics of each location [37,38,39]. Others incorporated biotic and socio-economic variables into their CVI estimations [38,40]. Hoque et al. (2019), Ponmozhi et al. (2025), [41,42], and Hereher (2020) [1] utilized bathymetry as a variable to assess coastal risk along the eastern coasts of Bangladesh, India, and Oman. The coastal vulnerability assessment is essential for optimizing coastal resource utilization, planning future development projects, and facilitating decision-making for integrated and sustainable coastal zone management [43].
The 178 km east coast of the UAE (combined with all coastal structures and artificial reclaimed lands) includes the Emirate of Fujairah and portions of the Emirate of Sharjah, comprising Kalba and Khorfakkan. Historical instances of coastal exposure to storm surges and cyclone waves demonstrate that these coastlines exhibit greater vulnerability compared to those in the Arabian Gulf. According to coastal vulnerability research [1], the adjacent coast of Fujairah (i.e., Oman) is classified as having very high vulnerability due to coastal hazards. Furthermore, over 77% of the population (exceeding 150,000) resides in the Fujairah City area [44]. Moreover, several development projects and infrastructures are being executed along the coasts of Fujairah, Khorfakkan, Dibba, and Kalba. This study integrates coastal benthic features (corals, seagrass, and microalgae), bathymetry, and population data for the first time to assess the vulnerability of the coast to hazards, primarily storm surges and tsunamis, by examining the hydro-physical and socio-economic characteristics of the coast and its nearshore zone. Consequently, the primary aims of this study are as follows:
- We aim to create a comprehensive Integrated Coastal Vulnerability Index (ICVI) for the coastal zone of the east coast of the UAE and assess the level of vulnerability by integrating nine parameters and utilizing geospatial techniques: geomorphology, slope, shoreline change, nearshore bathymetry, benthic features, land use and land cover (LULC), population, tide, and wave.
- This study delineates the benthic characteristics and ascertains their proximity to offshore canyons or concave/convex bays, enabling the stabilization and protection of these areas using artificial reefs and thus safeguarding the coastline from significant storm surges and tsunamis.
- GIS techniques are employed for extracting the coastal zone contours of the eastern coast of the UAE, ranging from 1 to 5 m above sea level from the SRTM DEM, and spatial analyses are conducted to identify the kind and quantity of each infrastructure feature that will be affected by coastal hazards. The heights of tropical cyclone waves fluctuate in location and time due to the meteorological characteristics of the cyclone, making it challenging to forecast wave heights for future cyclones. Nevertheless, the sources of tsunamis in the Gulf of Oman have been examined through various scenarios based on historical and probabilistic evaluations from prior studies [17,18,29,45,46]. Subsequently, we adopt a 3 m tsunami scenario to identify and comprehend the types of land use and infrastructure that would be affected by this event.
2. Study Area
The study area encompasses the 178 km stretch of the east coast of the United Arab Emirates (UAE) (including coastal structures and artificial reclaimed lands), bordering the Gulf of Oman. It comprises the 128 km long Emirate of Fujairah’s coastal districts namely Fujairah City, Mirbah & Qidfa, Dadna & Bidya, and Dibba Al Fujairah and the eastern coastal exclaves of the Emirate of Sharjah, specifically Khorfakkan (26 km) and Kalba (24 km) (Figure 1). The current study area is situated between latitudes 25° 37′ N and 24° 58′ N and longitudes 56° 15′ E and 56° 22′ E. This coastline constitutes the sole direct UAE access to the Indian Ocean basin and is environmentally and oceanographically unique compared to the rest of the Arabian Gulf coast. The eastern coastline features a narrow coastal plain, bordered inland by the Hajar mountain range, which ascends sharply in certain areas to altitudes beyond 1000 m above the mean sea level. The geomorphology comprises rocky headlands, sea stacks, sandy beaches, gravel plains, coastal plains, and intermittent wadi systems that discharge from the mountains to the coast, affecting nearshore sedimentation and water quality, especially after episodic rainfall events. The entirety of the UAE’s eastern coastline is situated near a seismically active collision zone known as the Makran Subduction Zone (MSZ), which is a significant source of earthquakes in this area [47,48] (Figure 1).
Figure 1.
Location map of the study area.
This region is densely populated, with about half a million residents (Fujairah Statistics Center), primarily along the coast at elevations of up to 50 m above sea level, including the port cities of Fujairah and Khorfakkan. Approximately 77% of the population resides in Fujairah City [44]. As previously mentioned, any tropical cyclones making landfall in the northeastern region of Oman, particularly near Shinas, Sohar, and Muscat, will invariably affect the eastern coast of the UAE via storm surges that damage coastal infrastructure [24]. Future sea-level rise is expected to exacerbate storm surges, accelerate coastline erosion, and contribute to issues such as seawater infiltration and damage to coastal infrastructure, consequently increasing the vulnerability of the UAE’s east coast in the future. The eastern coast of the UAE is susceptible to tsunamis, and the MSZ in the Gulf of Oman is a prominent area prone to marine earthquakes in the Indian Ocean. In 1945, a catastrophic tsunami struck the shores of Oman, triggered by a thrust fault along the MSZ in the Gulf of Oman, resulting in around 4000 fatalities in the region; it also affected the east coast of the UAE.
The marine and coastal environments in the research area comprise coral reef patches, rocky reefs, seagrass beds, and sandy subtidal habitats. These ecosystems sustain comparatively high biodiversity and exhibit less thermal extremity than the western UAE waters of the Arabian Gulf. The coastline is increasingly affected by anthropogenic forces, including coastal urbanization, port development activities (notably at Khorfakkan Port and Fujairah Port), tourism development, and related infrastructure. The intricate geomorphology, oceanic linkages to the Indian Ocean, and swift coastal development render the eastern UAE coast a critical area for environmental monitoring and scientific research. This study conducts an integrated coastal vulnerability assessment to determine the vulnerability levels of several segments along the east coast of the UAE.
Theoretical Background
In the early 1980s, Fujairah, Kalba, and Khorfakkan had an insignificant demographic, with populations of 32,189, 4533, and 15,330, respectively. Since the current economic oil boom began 45 years ago, the population of the east coast of the UAE has increased (Figure 2). These numbers increased to 318,325 for Fujairah, 51,000 for Kalba, and 53,000 for Khorfakkan in 2025. Now, nearly half a million people reside a few kilometers away from the coast. Simultaneously, built-up areas also increased over the last 20 years [24].
Figure 2.
Population of the study area.
The physical location of the UAE’s east coast, which includes Fujairah and portions of Sharjah—specifically the Kalba and Khorfakkan districts—adjoins the Makran Subduction Zone (MSZ) in the Gulf of Oman. Over the past decade, tectonic activity in this region has significantly intensified (Figure 3). Additionally, due to the increase in the frequency of tropical cyclones in Oman, which typically impact the Fujairah coast, our hypothesis is that the response to any coastal segment for the sudden sea level rise caused by tsunami or cyclonic storm surges depends on the intrinsic physical characteristics of the coast in terms of its material (coastal geomorphology), slope, bathymetry, temporal shoreline alterations, land use/land cover, population density, and tidal and wave ranges. The Oman coast—near the east coast of the UAE, including Shinas, Sohar, and Muscat—is classified as highly vulnerable according to the authors of [1]. Research has indicated that shorelines comprising consolidated rocks have significantly greater resistance to wave action compared to those formed by friable and unconsolidated sediments, such as those found along sandy beaches [21]. Cliffed shorelines are less susceptible to inundation by sea waves compared to flat and gently sloping coasts, which possess extensive backshores. We posit that shallow coastal regions are likely to undergo relatively significant inundation compared to shorelines adjacent to deep continental shelves. Tsunami waves increase in height as coastal regions grow shallower or in the presence of nearshore canyons, where the shoaling or tunneling effect intensifies [13,49,50]. We further suggest that coastal regions with moderate-to-high tidal ranges are more susceptible to sea-level rise than those with low tidal ranges. This coincides with Gornitz (1990) [33], because high tides are usually linked to more inundation and erosion hazards, and if tsunami or storm waves arrive at the coast during high tides, the impact will be more severe.
Figure 3.
Distribution of earthquakes along the boundaries of Iranian and Arabian microplates along with Paleo-Tsunamigenic earthquakes.
3. Materials and Methods
The main aim of this methodology is to establish an objective approach for identifying areas along the UAE East Coast that are vulnerable to coastal hazards, including sea-level rise, storm surges, and tsunamis. Future coastal hazards are expected to intensify, resulting in accelerated shoreline erosion and damage to coastal infrastructure, consequently rendering the east coast of the UAE increasingly susceptible. The primary rationale for forecasting future coastal alterations with a degree of inevitability is its utility in coastal management and development. This study conducts an integrated coastal vulnerability assessment to determine the vulnerability levels of several coastline segments. Nine variables are used to assess the coastal vulnerability of the UAE’s east coast, as detailed in Table 1. The geological parameters include (1) coastal geomorphology, (2) coastal slope, (3) shoreline changes, (4) bathymetry, and (5) coastal benthic characteristics. The socio-economic characteristics are land use/land cover and population. The hydro-physical parameters are significant wave height and spring tide range. The entire east coast of the UAE is categorized and assigned vulnerability ranks from 1 to 3, with rank 1 indicating low susceptibility and rank 3 indicating high vulnerability, as elaborated in the following subsections.
Table 1.
List of hydro-physical and socio-economic parameters used in developing the integrated coastal vulnerability assessment.
3.1. Hydro-Physical Parameters
Geological elements are crucial in assessing the intrinsic vulnerability of a shoreline. They encompass criteria that delineate the physical attributes and stability of the coastal zone, which affect its response to natural forces, such as erosion, flooding, sea-level rise (SLR), storm surge, and tsunamis [51,52]. The geomorphology, slope, and shoreline alterations of the coastline are essential in determining resistance to physical processes, whereas the erosion rate measures dynamic variations, emphasizing areas of considerable susceptibility [53]. Hydro-physical characteristics denote the interaction between sea forces and the coastline. These characteristics are important when studying the dynamic mechanisms that govern erosion, longshore sediment transport, and inundation [54]. The susceptibility of each parameter was evaluated using the Integrated Coastal Vulnerability Index (ICVI), with scores ranging from low (1) to high (3) (Table 2).
Table 2.
Classification of integrated coastal vulnerability parameters into three categories and associated risk levels.
Coastal Geomorphology: This study defines coastal geomorphology as the beach and its adjacent landforms, such as cliffs, dunes, mudflats, and rocky formations, which affect shoreline stability and susceptibility. This group does not encompass inland areas beyond the active coastal zone. These characteristics are essential in assessing a coastline’s susceptibility to natural phenomena, such as wave action, storm surges, rising sea levels, and tsunamis [55,56]. The rocky cliffs and wave-cut benches provide substantial resistance and are thus minimally vulnerable, but the soft sandy beaches, mudflats, low dunes, sabkhas, and sparse mangroves exhibit less resistance, rendering them very susceptible to coastal hazards [57].
A complete map of the coastal geomorphology of the eastern UAE coast has been developed based on the analysis of satellite images (Sentinel 2, January 2025) and substantiated by meticulous field observations to illustrate the geomorphic features situated below the 10 m contour. The eastern coast of the UAE is characterized by landforms such as beaches, dunes, sabkhas, mudflats, barriers, tidal inlets, mangrove swamps, several rocky headlands bordered by cliffs, wave-cut benches, and sea stacks that were taken as a reference from [58,59]. The Fujairah coast is categorized into three vulnerability groups based on the qualitative assessment of landforms, as outlined in Table 2. A vulnerability rank number is allocated to each coastal section—indicating the vulnerability level based on the geomorphology of the coast—for further analysis in a geographic information system (GIS).
Coastal Slope: The coastal slope, defined by the steepness or flatness of the coastal region, is a critical element in coastal vulnerability assessments, as it influences the coastline’s susceptibility to flooding and erosion. A gentler slope dissipates wave energy more gradually, resulting in waves breaking further offshore. This procedure diminishes wave energy affecting the beach but may result in silt accumulation and heightened inundation risk due to extended ocean exposure [21]. Conversely, steeper slopes enable waves to conserve more energy as they approach the shore, resulting in increased erosive forces along the coastline [57]. In light of these dynamics, softer slopes were deemed more susceptible, whereas steeper slopes were categorized as less vulnerable [21,60,61,62,63]. This study generated the coastal slope using a digital elevation model (SRTM-DEM, 30 m resolution) for the whole eastern coastline of the UAE. The slopes were computed as percentages using the 3D Analyst tool in ArcGIS 10.4, assessing the rate of elevation change at each location within the study area. The slope ranges from greater than 10 to less than 5 (Table 2). The complete spectrum of slope is classified into three rank categories from 1 to 3, considering that a higher slope value corresponds to a reduced vulnerability of the coast. This method guarantees precise spatial slope estimations, offering significant insights into the susceptibility of various coastal segments. Consequently, vulnerability rankings are allocated to all coastal segments for subsequent GIS research.
Shoreline Erosion Rate: The shoreline change rate quantifies the dynamic alterations of coastlines resulting from natural forces and anthropogenic actions over time. It measures the erosion or accretion of the shoreline over time while also offering insights into coastal stability [64]. The breaking of waves and near-shore currents primarily facilitates the transport of coastal sediments, resulting in alterations in the shoreline. This scenario is an aspect of littoral transport, which transfers the eroded material in the coastal zone through waves and currents. Given coastal vulnerability, coasts undergoing accretion will be regarded as less susceptible areas as the shoreline advances towards the ocean, leading to an increase in land area. Conversely, coasts undergoing erosion are deemed vulnerable due to the consequent loss of private or public property and, more critically, natural habitats such as beaches, dunes, and marshes.
The comprehensive trends in shoreline dynamics observed recently are beneficial to some degree in comprehending the coastal reaction to impending sea-level rise. The shorelines were digitized utilizing the Landsat ETM from the year 2000, projected to the Universal Transverse Mercator (UTM) system (zone 40, WGS 1984 datum). This was compared with the current shoreline from Sentinel 2 satellite images (2025), also projected to the UTM system (zone 40, WGS 1984 datum). The near-infrared band and the cubic convolution resampling method are optimal for delineating the land–water boundary and have been employed to extract the shoreline. The overlay approach in GIS (ArcGIS 10.4) software is employed to extract the coastline changes throughout the 25-year period from 2000 to 2025. The vector format of digitized shorelines for 2000 and 2025 served as the input for calculating the shoreline change rate utilizing the Digital Shoreline Analysis System (DSAS 6) [65]. Based on the varying rates of change along the coast, vulnerability scores are assigned to distinct coastal segments according to the ranges specified in Table 2. Employing this classification, all coastal sectors of the UAE’s east coast are scored from one to three for subsequent GIS studies.
Coastal Bathymetry: Bathymetry pertains to the techniques and categorization employed to ascertain the depth of aquatic entities. It signifies the distance from the shoreline to the open ocean and can thus be utilized to ascertain the near-shore gradient. The primary features of bathymetry substantially affect sediment transport, wave refraction, and tidal current dynamics. The coastal bathymetric measurements utilized in this study were sourced from the most reliable General Bathymetric Chart of the Oceans (GEBCO), which has been validated by prior research [66] and corroborated by Navionics Marine charts, for the purpose of classifying the vulnerability of the east coast of the UAE. Bathymetry of around 2 m or less, typically characterized by a concave/U-shaped bathymetry, is deemed very susceptible to sea-level rise, storm surges, and tsunamis, and thus classified as places of high vulnerability. This study categorized the CVI ranking based on bathymetric measurements into three classifications: high (<10 m), characterized by concave or U-shaped bathymetry, which enhances wave breaking and significantly increases wave height due to the shoaling effect; moderate (10–15 m), defined by convex-shaped bathymetry; and low (>15 m), represented by a straight coastline.
Bathymetry is an essential physical element in CVI analysis, as it governs the interaction of wave energy, storm surges, sea-level rise, and tsunamis with the shoreline. Bathymetry denotes the depth and configuration of the seabed outside a coastal area; it affects nearshore hydrodynamics, wave transformation, and the rates of coastal erosion or accretion [1,47]. In CVI frameworks, shallow offshore bathymetry and moderate slopes enhance vulnerability by permitting waves to break farther offshore, thereby dissipating more energy near the coast, which may result in increased shoreline erosion and flooding during catastrophic events. In contrast, abrupt offshore bathymetry can amplify wave energy while potentially diminishing the horizontal reach of storm surges, thus influencing the modeling and prioritization of flooding patterns in risk assessments. CVI approaches specifically rank bathymetric depth classes, assigning higher vulnerability scores to shallow coastal depths due to their capacity to magnify incoming waves.
The reclassification of values was conducted with the understanding that vulnerability is elevated in shallow depths characterized by concave or U-shaped bathymetry, as the impact of breaking waves is more pronounced, resulting in an increased wave height due to the shoaling effect [1,13,14,15,67].
Coastal Benthic Features: Benthic characteristics, including coral reefs, seagrass beds, and benthic microalgae, are essential, as they indicate the ecological integrity, habitat complexity, and resilience of coastal ecosystems to physical and environmental disturbances. Benthic habitats provide shoreline protection, facilitate nutrient cycling, enhance coastal production, and regulate the impact of physical processes, such as wave energy and sediment dynamics, on ecological vulnerability.
The combined benthic factors, including corals, seagrasses, and benthic microalgae, offer a physical and biological dimension to the CVI analysis that enhances the physical and geomorphological variables. Their distribution, health, and community structure dictate the response of coastal ecosystems to threats such as storm surges, sea-level rise, tsunamis, and anthropogenic stresses, hence affecting the evaluation of ecological vulnerability and the resilience of coastal systems to change.
The marine benthic features located on the east coast of the UAE include corals, hard-bottom substrates with corals and microalgae, hard-bottom substrates with microalgae, and seagrass with microalgae. The benthic features are delineated to a depth contour of 30 m, utilizing a comprehensive methodology that integrates remote sensing, field surveys, ground truthing, expert advice, and GIS analysis. Multispectral satellite imagery from Sentinel-2 is utilized to identify shallow water benthic habitats following the application of atmospheric adjustments. Supervised classification was performed utilizing ground-truth data to create training signatures derived from the spectral properties of benthic ecosystems. The choice of a suitable classification technique is crucial, as classification accuracy is heavily influenced by the quality of training data, image attributes, and environmental intricacy. Despite substantial advancements in multispectral image classification, achieving precise thematic mapping continues to be problematic due to complexities in bathymetry, water turbidity, sensor constraints, sample design, and classification methodologies [68]. This study assessed three supervised classification techniques—Minimum Distance (MD), Random Forest (RF), and Classification and Regression Tree (CART)—utilizing Depth-Invariant Index (DII) bands, with CART deemed the most effective method based on overall performance.
CART is a decision-tree-based machine learning algorithm that iteratively divides the training dataset utilizing appropriate predictor variables and threshold values to generate homogeneous class groups [69]. The method successively divides the data until terminal nodes are attained or specified halting requirements are fulfilled, yielding a categorized raster. Subsequent to classification, post-processing was implemented to mitigate the “salt-and-pepper” phenomenon frequently encountered in pixel-based classifications. This encompassed majority filtering, reclassification of detected mistakes, and manual quality assurance utilizing ArcGIS software. Minimum mapping units were utilized to maintain uniformity within habitat classes, whereas habitat categories lacking adequate ground-truthing data were manually scanned and incorporated into the final map.
To enhance classification reliability, modifications based on field knowledge were used, especially in regions with poor image quality or insufficient field data. Habitats with spectral similarities, including hard-bottom substrates exhibiting diverse coral and macroalgal coverage, were meticulously analyzed and enhanced utilizing professional ecological insight and high-resolution images. Accuracy assessment was performed utilizing independent validation data, with 70% of ground-truth points allocated for training and 30% allocated for validation. Four benthic habitat classifications were incorporated within this study due to the adequate sample sizes. The resultant map attained an overall accuracy of 0.66 and a Cohen’s kappa coefficient of 0.51, signifying moderate agreement, with notably robust performance noted for the hard-bottom class mixed with coral and macroalgae.
Field surveys, encompassing transects and underwater photography, yield ground-truth data for the training and validation of image classifications [70]. The resultant benthic habitat layers are analyzed within a GIS context to produce spatial distribution maps, which are then categorized into three distinct vulnerability classes for incorporation into the Coastal Vulnerability Index framework. The CVI ranking based on benthic parameters was categorized into three classifications: areas with a hard bottom and unconsolidated bottom are considered low vulnerability; hard bottom with microalgae is classified as moderate vulnerability; hard bottom combined with corals, microalgae, and seagrass is categorized as high vulnerability, as these benthic characteristics assist in mitigating the impact of incoming high waves. Consequently, these features need to be safeguarded by artificial reefs that will initially absorb the effects of storm surges and tsunami waves.
Spring Tidal Range: Tides refer to the oscillation of sea levels caused by the gravitational influences of the moon and the sun, impacting sediment transport and shoreline stability and significantly contributing to the formation of coastal dynamics and features such as beaches and estuaries. The tidal range is the vertical disparity between high tide and low tide. Permanent and intermittent inundation threats are associated with the tidal range. Gornitz (1991) [71] proposed that the spring tidal range, when accompanied by greater tidal currents, has the ability to induce significant erosion and facilitate sediment transfer. A specific portion of the coastline is deemed highly vulnerable if it has a high tidal range, while coastlines with modest tidal ranges are classified as low vulnerability.
The tidal ranges depicted in hydrographic maps from the United Kingdom Hydrographic Office indicate that the UAE coast experiences microtidal conditions (<2 m) within the Arabian Gulf, and it experiences mesotidal conditions (2–4 m) at the eastern coast (Fujairah) adjacent to the Gulf of Oman. Spring tides are assessed at three stations along the eastern coast of the UAE (Table 2). The spring tide range at Dibba Al Fujairah is 2.74 m; in the center region of Khorfakkan, it is 2.66 m; immediately south in Fujairah, it is 2.67 m. Due to the minimal variation in spring tide levels throughout the shore, the whole east coast is assigned a uniform classification of high.
Significant Wave Height (SWH): Significant wave height (SWH) is a crucial physical parameter for evaluating the susceptibility of coastlines. It denotes the mean height of the highest one-third of waves for a certain duration and serves as a crucial metric for wave energy impacting the coastline and for assessing shoreline vulnerability. An elevation in wave height generated a surge in wave energy, leading to heightened erosion and flooding along the coastline. Intense wave energy can expedite erosion and alter coastal formations, especially in regions with minimal natural defenses, such as low-lying areas or mild inclines [72]. This may result in the degradation of agricultural lands and coastal ecosystems. Coastlines characterized by elevated wave heights are more susceptible than those subjected to diminished wave heights.
In situ datasets of direct wave measurements are the most dependable sources of information. This information is scarce on the eastern coast of the UAE. The Copernicus Marine Service (CMS) is utilized to obtain wave height data for the period from 2000 to 2025 [73]. This data has been juxtaposed with the wave simulation data generated by the SWAN model, and its reliability has been validated [11].
3.2. Socio-Economic Parameters (SVI)
Socio-economic factors are essential for assessing the CVI, as they capture the human dimension of coastal risk, especially in areas heavily reliant on tourism, such as Fujairah, Kalba, and Khorfakkan.
Land Use/Land Cover: Land cover is a socio-economic metric that indicates the degree of urbanization, vegetation, and various land uses along the shoreline. Urbanized regions, such as developed areas, are generally more susceptible due to their diminished ability to offer protection from natural disasters, including storm surges, sea-level rise, tsunamis, and coastal flooding. Conversely, vegetated regions offer vital ecosystem services, such as sediment stability and wave energy dissipation, thereby mitigating susceptibility [74]. Land use and land cover data are generated through image interpretation and on-screen digitization of diverse features using Sentinel-2 imagery with a resolution of 20 m in ArcGIS 10.4. Land use and land cover mapping, along with the analysis of changes, are considered the most significant human-induced environmental disruptions in recent decades. Land use and land cover change, along with soil pollution, are influenced by a common set of physio-chemical and implicit factors crucial to ecological change and management, affecting biodiversity; the carbon cycle; solar radiation; relative humidity budgets; greenhouse gas emissions; productivity; survivability; and various social, economic, and ecological processes [75,76,77]. The land use and land cover of the eastern coast of the UAE were delineated using Sentinel-2 imagery with a spatial resolution of 20 m, which offers detailed insights into human-scale land cover categories, including residential zones, plantations, development sites, recreational areas, oil storage facilities, and barren lands. This study employed three classes to determine the coastal vulnerability indices based on land use and land cover (LULC): low (barren lands and underdeveloped areas), moderate (plantations, recreation, and industrial), and high (residential areas and beaches).
Population Density: Population density directly affects the level of risk exposure and the potential consequences of natural and coastal disasters. Densely populated regions exhibit heightened susceptibility to coastal hazards, including flooding, erosion, storm surges, sea-level rise, and tsunamis, owing to the concentration of population and infrastructure. Consequently, these areas may require greater resources for disaster response and recovery, amplifying their socio-economic vulnerability [78]. In this study area, where tourism propels the economy, including Fujairah, Kalba, and Khorfakkan, population density experiences seasonal peaks due to the influx of tourists. This intensifies the pressure on coastal ecosystems and infrastructure, worsening susceptibility [79]. Elevated population densities in coastal areas frequently correspond with heightened land use alterations, overdevelopment, and habitat degradation, all of which diminish natural resistance to coastal disasters [80]. Population density data were obtained from the Fujairah Statistics Center and represented as a GIS layer in ArcGIS 10.4.
3.3. Integrated Coastal Vulnerability Index
All nine maps showing the entire coastline segmented according to their vulnerability ranks are then combined in GIS to derive a Coastal Vulnerability Index (CVI) for various segments of the entire east coast of the UAE. Previously, the CVI was calculated by Diez et al. (2007) [80], Doukakis (2005) [81], Gornitz (1991) [64,71], Nigam et al. (2024) [82] and Hereher (2020) [1] as the square root of the product of the ranking factors (1 to 5 for each parameter) divided by the number of parameters considered. Gorntiz (1991) [83] opined that, although the CVI can be computed as either the sum or product of the parameters, the latter has the advantage of expanding the range of values.
This study aims to assess coastal vulnerability by integrating hydro-physical and socio-economic factors, utilizing progressively developed models of the Coastal Vulnerability Index (CVI). Nigam et al. [82] incorporated 21 physical and socio-economic characteristics into a modified coastal risk index, conducting a comprehensive analysis of coastal risk at the village level in Goa, India. Their research underscored the necessity for a focused and detailed examination to understand spatial variations in vulnerability and to formulate suitable coastal management strategies. The present model, Integrated Coastal Vulnerability Index (ICVI), combines two primary components—hydro-physical, including bathymetry and benthic features—as a new addition of parameters and socio-economic factors, providing a more thorough evaluation of coastal risk. Scholars since 1991, including Gornitz et al. [83], Thieler and Hammer-Klose (1999) [35], Hereher (2020) [1], Nigam et al. (2024) [82], and [84], have utilized this method, but without bathymetry (with enhanced criteria) and the benthic features used in our study. Therefore, our strategy improves regional specificity by concentrating on the primary drivers and vulnerabilities along the east coast of the UAE, hence providing high flexibility for local management. This method enhances the utilization of high-fidelity data, yielding a comprehensive and pragmatic evaluation of coastal vulnerability pertinent to regional planning and adaptation efforts.
3.3.1. Hydro-Physical Vulnerability Index (HPVI)
The geological and hydrophysical vulnerability index evaluates factors such as geomorphology, slope, shoreline change (m/year), bathymetry, coastal benthic features, significant wave height (m), and spring tide range (m):
Here, (g) represents coastal geomorphology, shoreline stability, and erosion; (s) indicates slope; (c) denotes shoreline change; (b) denotes nearshore bathymetry; (be) denotes coastal benthic features; (w) denotes significant wave height; (t) denotes the spring tide range. By combining the seven elements, the HPVI provides a thorough evaluation of coastal vulnerability.
3.3.2. Socio-Economic Vulnerability Index (SVI)
The Socio-economic Vulnerability Index (SVI) incorporates population density and land use patterns:
Here, (d) represents population density (individual/km2), and (l) indicates the land use/land cover categorization. Densely populated coastal zones are more prone to storm surges, tsunamis, and floods; population density is a crucial predictor of socio-economic vulnerability. In the same manner, the LULC classification assesses land use in terms of vegetation cover, plantation, residential, commercial, barren lands, and underdevelopment areas. By removing natural buffers, such as mangroves, mudflats, and wetlands, which guard against surges and tsunamis, unregulated land use and urban sprawl may increase coastal vulnerability. The SVI provides a thorough understanding of human-driven coastal risks by taking into account these two important socio-economic factors. Finally, both the indices are combined using Equation (3) to obtain the integrated Coastal Vulnerability Index.
ICVI = HPVI + SVI/2
In this study, all nine variables were assigned a weight between 1 and 3 based on their vulnerability classification, as outlined in Table 2. These variables represent hydro-physical and socio-economic factors contributing to coastal vulnerability. The scoring system ranges from “Low” to “High”, with higher values indicating greater vulnerability. A standard formula with equal weights was used for all variables, ensuring an unbiased and consistent approach. In this study, we have taken the entire coastline as a line feature class in GIS; therefore, every point along the coast is considered for the analysis. Firstly, the nine shapefiles are fused together using the “Spatial Join” option in the “Overlay” module in the “ArcTools” menu. The final output layer contains the attributes of all nine variables with their respective ranks for each coastal strip. Thus, the final map generated, combining all the variables, showed 62 segments of the coast with a unique number in their respective attribute table. Another column in the attribute table was added for entering the above-stated (Equation (1)) formula in order to calculate hydro-physical vulnerability using the seven variables. The “calculate geometry” tool in ArcMap was used to perform the above equation. Again, we added one more column in the attribute table for entering the second formula (Equation (2)) in order to calculate socio-economic vulnerability. Finally, another column was added to the same attribute table for the final ICVI using (Equation (3)). Therefore, the system generated ICVI values for all 62 coastal sections of the east coast of the UAE, and final integrated vulnerability ranks are assigned to various segments of the coast. The final cumulative scores were then classified into three categories—low, moderate, and high—reflecting varying levels of coastal vulnerability. This classification helps to identify the regions that are most at risk from coastal hazards, such as storm surges, tsunamis, and sea-level rise.
In order to prevent any one parameter from overshadowing the others, this formula was chosen to guarantee that each parameter contributes proportionately to the overall index. Although there are other formulas in the literature, this methodology offers a fair evaluation of coastal vulnerability and is the most appropriate for the unique features of the UAE’s east coast.
Nine parameters were chosen based on their applicability to assessments of coastal vulnerability in the study area, and each paragraph provides justification. These parameters, which provide a thorough and regionally specific approach to the ICVI, are widely acknowledged based on the scientific literature. Each parameter captures important environmental or anthropogenic factors impacting the east coast of the United Arab Emirates.
The CVI score rankings for each parameter in Table 2 were carefully selected based on research and expert opinion. These criteria take into account local elements, including bathymetry, macrotidal ranges typical of the UAE’s east coast, and benthic features such as corals and seagrass. They also mirror globally recognized values. The chosen ranges offer a fair and contextually suitable assessment for this study region, guaranteeing that the ICVI accurately captures the vulnerability dynamics of the study area, even though changing grading standards may potentially change the results. In order to analyze coastline changes, land use, geomorphology, benthic features, and local data related to population dynamics, remote sensing techniques such as satellite imaging and bathymetric data were essential. These techniques made it possible to gather data effectively and accurately throughout the research area, supplying current data that improved the ICVI assessment.
3.4. Creation of Surface Contours and Quantification of LULC Features and Assets Under 3 m Contour
This study attempts to create contours up to 5 m elevation at 1 m intervals using SRTM 30 m data, as there is currently no map with fine-resolution contour data. SRTM data was used to create these contours, which were then interpolated using the ArcGIS software’s 3-D Analyst module. Despite the fact that the contours created for this analysis are only approximate, they have been significantly corrected based on topographic maps, spot heights, and benchmarks found in the field. (Figure 4a) shows the raw contours extracted from SRTM DEM. Please note that 2 m contour is along the 1 m benchmark and 3 m contour is far away from the 3 m benchmark. Therefore, these contours are meticulously corrected and verified based on the benchmarks present there and also from the Tessa DEM. Through onscreen digitization, every land use and land cover feature within the research area’s 5 m elevation was traced. In order to achieve this, land use classes up to Level III of the popular National Remote Sensing Center (NRSC) categorization are derived from Sentinel data with a spatial resolution of 20 m, supported by numerous field observations. Additionally, Arc (Google Maps 2.0) and municipal data are used to gather information about local assets, such as schools, hospitals, supermarkets, cafeterias, and gas stations. The data on different land use features and assets were then extracted by superimposing the contour data on the land use and land cover maps for further analysis.
Figure 4.
(a) Showing the raw contours extracted from SRTM DEM and (b) contours corrected using benchmarks and topographic maps.
4. Results
Various parameters of the East Coast of the UAE.
The eastern coast of the UAE is influenced by various factors, including hydro-physical and socio-economic elements. These parameters interact to ascertain the region’s susceptibility to coastal risks. Understanding these diverse factors is crucial for effective planning, sustainable development, and climate adaptation strategies to safeguard both natural ecosystems and coastal communities along the eastern coast of the UAE.
4.1. Physical Vulnerability Parameters of the Study Area
4.1.1. Coastal Geomorphology
Coastal morphology is shaped by tectonic and structural features, the composition of coastal rock, and both depositional and erosive processes. It significantly contributes to alleviating the shore’s reaction to coastal hazards by influencing relative erodibility and the degree of coastal resilience to alterations in landform characteristics [56]. Geomorphology investigations offer useful information regarding features that are especially susceptible to current environmental threats and are increasingly sensitive to prospective climate vulnerabilities. Coastal geomorphology results from the primary geomorphic processes that have shaped the current morphology. The comprehensive geomorphological map of the UAE’s east coast (Figure 5), created from a Sentinel-2 image, identifies the primary landforms of the area as beaches, mudflats, mangroves, creeks, alluvial plains, mountains, and coastal plains. The geomorphology is delineated to the 10 m contour on the terrain for the current investigation. The geomorphology of the research region extends approximately 178 km along the east coast and encompasses an area of 180 km2.
Figure 5.
Geomorphology of the east coast of the UAE up to approx. 10 m elevation. Inset (a): field photo, showing the alluvial plains taken from the field, Inset (b): satellite image showing the alluvial plains and coastal plains. The thick colored line along the coast indicates the vulnerability ranking of various segments of the coast.
The southern section of the research area is characterized by diverse low-lying coastal deposits, including a 1.35 km2 expanse of creek and mangrove swamps, 4.2 km2 of mudflats, and beaches that extend 25 km from the Kalba coast to the center region of the study area. The coastal plains (54 km2) diminish in width as one moves northward within the research region, where the Hajar Mountains (rocky headlands) at Khorfakkan, Dadna, and Dibba adjoin the coastline. Alluvial plains are located in Fujairah, Dadna, and Dibba, encompassing an area of 96.26 km2.
Figure 5 provides a graphical representation of the vulnerability rankings derived from the coastal geomorphology of the UAE’s eastern coastline. The findings indicate that sandy beaches, mudflats, barrier islands, creeks, and mangroves are classified as highly vulnerable areas, encompassing 46.6 km. In contrast, rocky headlands are categorized as low-vulnerability areas, spanning 44.34 km. Lastly, embayed and indented coasts, low foredune coasts, and lagoons are deemed moderately vulnerable, covering 87.3 km from a geomorphological perspective.
4.1.2. Coastal Slope
The analysis of the coastal slope indicated that 45.11 km (25.3%) of the coastline is classified as highly fragile, 92.4 km (51.8%) is classified as moderately vulnerable, and 40.7 km (22.8%) is classified as having low susceptibility (Figure 6). The most susceptible areas are in the southern portion (Kalba) and the central region (Khorfakkan and Qidfa) of the research area. Certain areas of the northern half feature cliffs along the shoreline, rendering them less vulnerable.
Figure 6.
Map showing the vulnerability ranking of coastal slopes along the east coast of the UAE.
4.1.3. Shoreline Change
The results indicate that 91.5% (163.3 km) of the coastline is classified as low vulnerability, as the majority of the shoreline has exhibited progradation towards the sea, evidenced by the expansion of Fujairah and Khorfakkan port facilities; coastal structures such as breakwaters, jetties, and container berths; and the development of residences and hotels on artificially reclaimed areas near Al Bidya and Qidfa in Fujairah. The survey identified 13.8 km (7.73%) as highly vulnerable, with significant erosion noted in the Dadna and Bidya regions of Fujairah (Figure 7), as well as in certain sections of Khorfakkan and Kalba. Specifically, Dadna exhibited erosion rates of −2.64 m/year, with the gap between the former shoreline and the current shoreline measuring 66 m. Conversely, the most significant accretion rates are noted at Fujairah city, where the Fujairah Port has been considerably expanded into the sea by 600 m, comprising berths and container terminals.
Figure 7.
Map showing the vulnerability ranking of shoreline change along the east coast of the UAE.
4.1.4. Bathymetry
Figure 8 illustrates the vulnerability index of the coastal bathymetry for the east coast of the UAE. The analysis indicated that 56.5 km (31.6%) is highly vulnerable, particularly due to the presence of concave and U-shaped bays in Kalba, Fujairah City, Khorfakkan, Dadna, Bidya, and Dibba Al Fujairah. Approximately 33.6 km (18.84%) is classified as moderate vulnerability, while the remainder (88.1 km; 49.41%) is categorized as low vulnerability. The regions adjacent to Fujairah Port feature berths extending to a water depth of 20 m, signifying less susceptibility to incoming waves. Incorporating comprehensive bathymetric data into this CVI study for the eastern coast of the UAE enhances the spatial resolution of coastal hazard evaluations, refines flood extent estimates, and facilitates more informed coastal planning and management decisions for the entire eastern coastline of the UAE.
Figure 8.
Map showing the vulnerability ranking of bathymetry along the east coast of the UAE.
4.1.5. Coastal Benthic Features
Figure 9 illustrates the vulnerability ranking of benthic ecosystems along the eastern coast of the UAE. Upon analysis and classification of the coastline, 145 km (81.32%) is categorized as having low vulnerability, primarily in the southern region of Kalba extending to Fujairah Port, characterized by hard and unconsolidated substrates. Of the total, 6.2 km (3.47%) is classified as moderately vulnerable, primarily in the Dadna and Bidya regions. Ultimately, 27 km (15.14%) of the research area is classified as highly susceptible, primarily in the northern region, encompassing significant portions of Dadna, Bidya, and Dibba al Fujairah.
Figure 9.
Vulnerability ranking map of coastal benthic features along the east coast of the UAE.
4.1.6. Land Use/Land Cover
Consequently, the land use and land cover of this region (within a 10 m contour) reveal a combination of residential, plantation, undeveloped, recreational, industrial, and port areas (Figure 10). Land usage in Kalba primarily comprises residential areas covering 18.4 km2 and plantation zones spanning 17.9 km2, in addition to scenic beaches, desolate regions, and mangroves totaling 1.418 km2. Fujairah primarily encompasses Fujairah Port, covering 11.2 km2, with residential and plantation areas totaling 58.6 km2 and business zones spanning 1.8 km2, in addition to recreational spaces. Khorfakkan encompasses 7.3 km2 of the residential zones adjacent to the coast, in addition to Khorfakkan Port, which spans 0.85 km2, and there are 0.4 km2 of regions under development, along with cliffs bordering the sea.
Figure 10.
Vulnerability ranking map of coastal LULC features of the east coast of the UAE.
4.1.7. Population
As per [85], the population of Fujairah is 326,283, with Kalba at 51,000 and Khorfakkan at 53,000. Approximately half a million individuals reside along the eastern coast of the UAE. Approximately 40,000 people are projected to reside within the 3 m contour in the research area. A substantial influx of tourists to the east coast of the UAE is attributed to its exquisite hotels and nearby coral-rich areas that offer opportunities for snorkeling and deep-sea diving. Socio-economic factors greatly influence the vulnerability of the UAE’s east coast. Elevated population density, urban development, tourism, and industrial operations intensify the strain on coastal resources [86]. Fujairah City possesses the highest population density on the entire east coast of the UAE at 2769 individuals per square kilometer, corroborating the statement from [49] that 77% of Fujairah’s population resides in the city. This district experiences significant environmental strain resulting from extensive human activity. Another significant location is Khorfakkan, which has a population density of 1985 individuals per square kilometer. Dibba Al Fujairah has a population density of 1003 individuals per square kilometer and is located at the northernmost point of the UAE’s east coast. The regions with lower population densities are Mirbah and Qidfa at 105.1 persons/km2 and Dadna and Bidya at 155.9 persons/km2. In this study, 89.4 km (or 50.14%) of the shoreline is classified as highly vulnerable in relation to population exposure, 22.35 km (or 12.53%) is categorized as moderately vulnerable, and 66.5 km (or 37.29%) is considered low vulnerability (Figure 11).
Figure 11.
Vulnerability ranking map of coastal districts’ populations along the east coast of the UAE.
4.1.8. Significant Wave Height
Significant wave height (SWH) is a crucial physical parameter for evaluating coastline vulnerability. The mean of the upper one-third (33%) of waves occurring within a specified timeframe is referred to as significant wave height [82]. Generally, SWH serves as an alternative to wave energy and is regarded as a crucial instrument for analyzing coastal risk. A significant increase in wave height results in heightened wave energy, resulting in enhanced erosion and flooding along the coastline. Such events may result in the destruction of infrastructure and coastal ecosystems. Coastlines with elevated wave heights are more susceptible than those with low wave heights.
The wave height classification in this study varied from 0.3 to 1.2 m, categorizing the entire coastline as having moderate to low sensitivity. Significant wave height measurements in the southern region of the study area near Kalba exceed those in the northern region at Dibba al Fujairah (Figure 12).
Figure 12.
Vulnerability ranking map showing significant wave heights along the east coast of the UAE.
4.1.9. Spring Tide Range
The coasts in the world are categorized into three classes based on tidal range: microtidal (<2 m), mesotidal (2–4 m), and macrotidal (>4 m). The eastern coast of the UAE is predominantly classified as mesotidal, with tidal ranges of 2 to 4 m. The low tidal range occurs at Khorfakkan (2.66 m), while the maximum is observed at Dibba al Fujairah (2.74 m). According to the vulnerability assessment, the average tidal range for the entire coastline, which varied between 2.74 and 2.66 m, is less than 1 m; hence, the entire investigated coastline is categorized as highly vulnerable (Figure 13).
Figure 13.
Vulnerability ranking map of spring tides along the east coast of the UAE.
4.2. Evaluation of Integrated Coastal Vulnerability Index
This study employed two approaches to calculate and evaluate coastal vulnerability along the eastern coast of the UAE. These methods offer a more precise evaluation of coastal vulnerability, as they consider both physical and socio-economic characteristics comprehensively. The physical and hydrological factors are the causal variables that dictate the severity and extent of coastal extreme events, while the socio-economic elements delineate the related environmental consequences. According to the ICVI methodology employed, the computed ICVI for the eastern coast of the UAE, utilizing physical and socio-economic characteristics, indicated that the final vulnerabilities varied from 38 to 94. Consequently, in this study, we partitioned the whole ICVI values into three equal segments, each representing a unique vulnerability of the entire east coast to coastal disasters. The coastal vulnerability map for the study area is created by classifying 62 geographical segments into three vulnerability levels, where the lower range of the ICVI values signifies low risk, the intermediate range denotes moderate risk, and the upper range indicates high-risk coastal vulnerability. The graphical depiction of the calculated vulnerability levels and the ICVI rankings is illustrated in Figure 14. This score indicates that 26.4% of the coastline is classified as highly vulnerable, 17.3% is classified as moderately vulnerable, and 56.19% is classified as low vulnerability. According to the classifications, an aggregate of 43.74% of the 178 km eastern coastline of the UAE—extending from the southern region and encompassing the entire Kalba coast, a segment of the Fujairah City coast, Khorfakkan Bay coast, Dadna and Bidya coast, and concluding with Dibba coast—is classified as having moderate to high risk. Conversely, Fujairah Port, Mirbah and Qidfa, Khorfakkan port, and the southern and central regions of Dadna and Bidya exhibit low vulnerability, accounting for 56.19% (or 100.2 km). A substantial portion of this mesotidal coastal region features gently sloping lowlands, sandy shores, mangrove swamps, creeks, mudflats, coastal plains, and narrower sandy beaches.
Figure 14.
Map showing the Coastal Vulnerability Index; the thick line indicates risk levels along the east coast of the UAE, categorized based on the categorization of CVI values into 3 risk classes, as per the classification scheme. The inset pictures (a,b) indicate conspicuous erosion along the coast, and (c) shows the impact of a storm surge in the recent cyclone of 2022-July, justifying the final CVI model.
The coastline of the northern and central parts of Dadna and Bidya is currently undergoing significant erosion, which is in agreement with our final ICVI model (Figure 14). This erosion is intensified by human-induced stressors, including industry, urbanization, land reclamation, harbor expansion, and the construction of coastal breakwaters. Moreover, these coastal segments are characterized by high-energy dynamics, concave bathymetry, and medium-range canyons, as well as active benthic structures distributed in the nearshore zone. Considering that certain coastal segments, particularly Kalba and Dibba, possess nearshore canyons and gentle slopes, which render them highly susceptible, there is a significant likelihood that intensified severe storms and tsunamis will affect broader regions inland from the coastline than presently observed due to the anticipated drastic increase in sea level.
5. Discussion
5.1. Discussion of Parameters Responsible for Creating ICVI on the East Coast of the UAE
The eastern coast of the UAE is a dynamic coastal system influenced by both natural and anthropogenic activities. Assessing its susceptibility is essential for sustainable coastal management, especially given the escalating impacts of climate change, anthropogenic stresses, and the rising frequency of moderate to high earthquakes in the MSZ, along the Zendan fault, Murray Ridge, and Owen fracture zone (Figure 3). Numerous studies have evaluated risk variables along coastlines globally, employing methodologies such as the Coastal Vulnerability Index (CVI) [1,83,84]. The Coastal Vulnerability Index (CVI) is among the most prevalent methodologies for evaluating coastal susceptibility. Numerous Coastal Vulnerability Indices have been established over recent decades, including the seminal research by Gornitz (1991) [83], which concentrated on physical factors such as sea-level rise and shoreline changes, as well as the widely utilized CVI by the authors of [55,87], which integrated six physical variables for extensive evaluations. Recent frameworks [83,87] incorporated socio-economic and flood exposure factors, broadening the focus beyond physical criteria. This study’s ICVI uniquely integrates benthic characteristics with hydro-physical and socio-economic components through an overlay technique in a GIS context.
This index with equal weighting is tailored for the specific regional context, utilizing high-resolution geographic data, analyzing oceanographic datasets, and incorporating adaptive capacity indicators, thereby providing a comprehensive and locally pertinent evaluation. By integrating these dimensions, our ICVI enhances previous models by facilitating precise vulnerability mapping and aiding localized coastal management decisions.
We have justified the equal weighting by assigning weightages to the parameters (4g × 3s × 1c × 2b × 2be × 1w × 1t/7 & 3d × 2l/2) utilized for analysis (Figure 15). After the weightages are assigned and process is completed, Figure 15 (right (B) inset (a)) indicates that rocky terrain falls under moderate vulnerability zone, which is incorrect; moreover, little towards the north, actual erosion areas are showing moderate vulnerability, which is also incorrect. However, in non-weightage ICVI, Figure 15 (left (A)) indicates the rocky terrain is under low vulnerability, and erosion areas showing high vulnerability.
Figure 15.
Comparing the non-weighted version of ICVI on the left (A) and weighted version of ICVI on the right (B), inset a: rocky terrain in moderate vulnerability zone, which is incorrect, inset b: showing rocky terrain in moderate vulnerability zone, which is incorrect, inset c: showing rocky terrain near khorfakkan in moderate vulnerability, which is incorrect.
Now coming to Figure 15 (right (B) inset (b)) in the weighted ICVI, the entire rocky terrain section is showing the moderate vulnerability, which is incorrect. In the non-weightage ICVI, same area is showing low vulnerability.
Finally, Figure 15 (right (B) inset (c)), in the weighted ICVI, elucidates that the rocky terrain which is adjacent to Khorfakkan port is showing moderate vulnerability which is incorrect. In the non-weighted ICVI, same area is under low vulnerability, which is acceptable.
This study analyzes vulnerability throughout the eastern coast of the UAE, specifically focusing on the variability in susceptibility along the shoreline. The region has diverse geomorphic characteristics, including sandy beaches, creeks, mangroves, mudflats, coastal plains, and cliffs, each responding distinctly to accretion and erosion. Low-lying landforms, such as mudflats, tidal flats, creeks, and beaches, with elevations below two meters, are particularly vulnerable to inundation and hence require prioritized attention. Upon analyzing the bathymetric data through the creation of surface profiles, it was determined that Kalba, the northern section of Qidfa, Khorfakkan, the central area of Dadna, and the northern extremity of Dibba al Fujairah are vulnerable to shoaling and tunneling effects from incoming high waves. This susceptibility is attributed to the concave bathymetry and medium-range canyons located in the offshore regions, which are expected to exacerbate the impact of storm surges or tsunamis approaching the eastern coast of the UAE (Figure 16). The concentration of coastal benthic features along the Dibba Al Fujairah and Dadna and Bidya coasts is crucial, as these areas are undergoing significant erosion. Consequently, it is imperative to install additional artificial reefs offshore to mitigate the impact of high-intensity waves, thereby diminishing erosion. The results underscore the significance of adaptive coastal management measures that account for the dynamic nature of coastal systems. Nature-based techniques, including mangrove restoration, dune stabilization, and artificial reefs, can offer enduring resistance against storm surges, tsunamis, and erosion [88,89].
Figure 16.
Isobaths (shown as thin lines). C1–C2, C3–C4, and C5–C6 are longitudinal profiles along canyons, while R1–R2, R3–R4, and R5–R6 are the profiles along the ridge. (a) Kalba Offshore; (b) Dadna Offshore; (c) Dibba Offshore.
Benthic features along the east coast of the UAE up to the 30 m contour have been mapped and categorized into five distinct zones. The initial zone (a) encompasses Dibba Al Fujairah, characterized by a concentration of features such as hard corals (Pocillopora damicornis and Favidae) at depths ranging from 2 m to 5.4 m with a combined area of 3.332 km2 (hard bottom + coral and hardbottom + coral + macroalgae), as well as seagrass + macroalgae (Halophila ovalis) covering an area of 0.016 km2 at a depth of 1 m, as illustrated in Figure 17. In summary, zone (a) exhibited the highest diversity of marine ecosystems and the greatest extent of live hard coral cover. The coral communities seen in this area offer a diversified and complex three-dimensional habitat for various marine creatures. These habitats also function as appealing sites for scuba divers and other marine water enthusiasts, enhancing the nation’s tourism industry and strengthening its economy.
Figure 17.
Different benthic habitats along the east coast of the UAE. Zone (a): Dibba Al Fujairah; zone (b): Dadna and Bidya; zone (c): Khorfakkan; zone (d): Mirbah and Qidafa and Fujairah Port; zone (e): Fujairah City and Kalba.
In zone (b), the region transitioning from Dadna to Bidya in the south comprises predominantly unconsolidated substrates of fine sand and silt. Hard bottom habitats are adorned with macroalgae, and they exhibit varying proportions of macroalgae and corals. Faviids, Stylophora, and Platygyra corals are observed at depths between 4 m and 8 m.
In zone (c), located in the Khorfakkan area, the majority of the region consists of unconsolidated substrates. To the south of Khorfakkan port, different habitats are observed, characterized by macroalgae and hard corals, as illustrated in the inset (C) of Figure 17.
Zone (d), encompassing Mirbah and Qidfa, as well as the Fujairah Port region, mostly has an unconsolidated bottom of fine sand and silt, succeeded by hard-bottom habitats adorned with macroalgae and corals.
Zone (e) encompasses a portion of Fujairah City and the entirety of the Kalba area, characterized by an unconsolidated substrate composed of fine sand and silt. The details of the entire east coast habitat are provided in Table 3.
Table 3.
Summary of area sizes represented in the habitat map for the entire east coast of the UAE.
Previous research [90,91] has indicated that the coral community structures in the Gulf of Oman, particularly along the east coast of the UAE, were adversely affected by Cyclone Gonu and harmful algal blooms (HAB) in 2007 and 2008. The impact of severe storm surges on corals resulted in over 50% loss of live branching and tabular coral cover due to fragmentation and dislodgement of pocilloporid and acroporid colonies. Consequently, storm surges and tsunamis will undoubtedly affect the benthic habitats [91]. It is essential to protect these habitats from impending high waves, such as storm surges and tsunamis. In this context, artificial reefs will be beneficial and should be established in certain places to protect them, as they are valuable natural resources essential for the region’s biodiversity and economy (e.g., local fisheries, recreational activities). Furthermore, these corals are situated in the medium-range offshore canyons close to Dibba (Figure 16), hence increasing their vulnerability. These corals are also susceptible to several anthropogenic stresses (e.g., coastal development, effluent from desalination facilities, proximity to significant shipping routes, oil spills, and introduction of foreign species).
Socio-economic factors exacerbate coastal vulnerability, as rising urbanization, industrialization, and tourism impose escalating pressures on coastal ecosystems [92]. Highly populated metropolitan areas interfere with natural sediment transport mechanisms [93,94]. Seasonal fluctuations, notably shamal-driven winds, alter erosion patterns, underscoring the dynamic nature of coastal systems. Sea-level rise caused by global warming increases flood threats, requiring robust coastal defense measures. Enhancing early warning systems, such as the installation of seabed bottom pressure recorders to detect earthquake-induced tsunamis, promoting sustainable land use, and constructing resilient infrastructure can significantly improve coastal resilience [95].
Vulnerability research has indicated significant disparities in the east coast of the UAE’s susceptibility to coastal disasters. The identification of 26.4% (or 47.03 km) of the coastline as highly vulnerable and 17.3% (or 30.9 km) as moderately vulnerable in this study underscores the urgent necessity for sustainable coastal management. Furthermore, district-specific risk-level data classify Kalba (23.7 km) and Fujairah City (10.12 km) as highly vulnerable. Conversely, Mirbah and Qidfa, with a distance of 20.58 km, exhibit low vulnerability. Dadna and Bidya exhibit high vulnerability at 6.31 km, whereas Dibba exhibits high vulnerability at 5.39 km and low vulnerability at 32.62 km (Table 4). This study emphasizes that artificial structures such as ports, jetties, and groynes can exacerbate erosion by impeding sediment transport and that bathymetry affects coastal erosion [96]. This study reveals that erosion occurred directly opposite areas characterized by concave formations and medium-range canyons in the nearshore bathymetry of the east coast of the UAE. Global case studies indicate that low-lying, heavily inhabited regions with substantial economic activity are more susceptible, and the eastern coast of the UAE demonstrates similar patterns [97,98]. Meticulously designed constructions on artificial reclaimed islands and sustainable tourist regulations must harmonize economic development with the preservation of natural coastlines to avert inadvertent detrimental effects on coastal stability [86,99]. To attain sustainable coastal development, policy frameworks must adopt an integrated strategy that amalgamates scientific research, stakeholder participation, and proactive management [100]. Community-driven adaptation projects and coastal monitoring programs can enhance resilience against tsunamis and climate-induced hazards [101]. The long-term sustainability of the UAE’s east coast relies on a balanced strategy that integrates development with conservation, thereby assuring resilience to future climatic and anthropogenic challenges.
Table 4.
Data on the risk level of the coast in different districts of the east coast of the UAE.
5.2. Assessment of Different Land Use/Land Cover Features and Infrastructure Vulnerability Due to Coastal Hazards (Tsunamis and Storm Surges) on the East Coast of the UAE
Tsunamis and low-pressure systems, such as cyclones, are recognized as catastrophic natural hazards, and their potential impact on various land use and land cover features, populations, structures, and infrastructure along the east coast of the UAE cannot be ignored. Tsunami waves are one of the most violent natural hazards, responsible for a substantial loss of life and the massive destruction of property throughout history [102]. A catastrophic instance of such calamities is the Sumatra tsunami in December 2004, which resulted in over 200,000 casualties across 14 nations in the Indian Ocean within a few hours [103]. Conversely, the 2011 tsunami in Japan caused over 15,000 fatalities and inflicted damage on buildings, dams, nuclear power plants, and several other facilities. The World Bank estimates the economic impact of the 2011 tsunami in Japan at USD 235 billion, rendering it the most expensive natural disaster in history [104].
Subduction zones are sites of significant and catastrophic geohazards, such as earthquakes and landslides, resulting from one tectonic plate descending beneath another [105]. The severity of these hazards is often assessed by the energy released in brief intervals, which is contingent upon the quantity of stored energy accessible for the geological processes that instigate these disasters [106]. Historically, the northern shores of Oman and the eastern coast of the UAE have been regularly impacted by tsunamis. The Makran Subduction Zone (MSZ) in the Gulf of Oman and the Sumatra Subduction Zone are prominent sites prone to marine earthquakes in the Indian Ocean [18,107]. The most significant tsunami documented in the Gulf of Oman transpired following a substantial earthquake (Mw 8.1) near the MSZ on 27 November 1945 [107] (Figure 3). The tsunami’s death toll neared 4000, with wave heights reaching 5 to 12 m along the nations bordering the Gulf of Oman, especially in Pakistan. The majority of tsunami hazard assessments globally rely on historical tsunami records, referred to as direct statistical tsunami hazard assessment (DSTHA) [108]. Three tsunami episodes have been documented in the MSZ in the past (Figure 3). Consequently, maritime earthquakes occurring in the MSZ predict the imminent arrival of significant tsunami waves to the coastal regions of Oman and the eastern coast of the UAE shortly after the earthquake’s initiation [32,45,105]. Two critical factors must be considered when discussing tsunami hazards: tsunami wave height and tsunami run-up height. The first pertains to the wave’s absolute elevation over sea level in the ocean, while the run-up height indicates the tsunami’s vertical elevation above sea level at its furthest inland point.
In the research conducted by Hamidatou et al. (2024) [45], a probabilistic evaluation of a 9.2 Mw earthquake along the entire MSZ predicted tsunami waves reaching the eastern coast of the UAE in an average of 37 min, with a maximum run-up height of 2.55 m, a maximum flow depth of 2.2 m, and a maximum inundation distance of 253 m on the eastern coast of the UAE. The authors of [109] researched a probabilistic assessment of an 8.8 Mw earthquake along the eastern side of the MSZ, forecasting tsunami waves reaching around 2 m in height on the northeast coast of Oman. According to another study [110], utilizing numerical modeling and simulation of the 1945 tsunami, it was proposed that an analogous earthquake (Mw = 8.1) along the MSZ would generate tsunami waves reaching heights of 5 m along the shores of Oman and the eastern coast of the UAE. Browning & Thomas (2016) [32] posited that an earthquake with a magnitude greater than 8 in the Gulf of Oman, near the southwest coast of Pakistan, might generate tsunami waves at the northern coast of Oman, resulting in a run-up height of 7.8 m. The worst-case scenario proposed by the authors of [105] indicates that Mw > 9 earthquakes in the MSZ—resulting from a complete rupture of the plate boundary—might lead to run-up heights of up to 10 m in the coastal regions of the Gulf of Oman. In all prior instances, it is evident that significant earthquakes transpire in the MSZ and will be accompanied by tsunami waves that will affect the eastern coast of the UAE and the northeastern coast of Oman. Furthermore, these studies indicate that the coasts of the Gulf of Oman are vulnerable to tsunamis.
Coastal elevation is typically derived from digital elevation models (DEMs). High-resolution DEMs can be generated for localized areas using airborne light detection and ranging (LiDAR) systems. However, these DEMs are costly to produce and, thus, are not readily accessible at regional and global levels [111,112,113]. Therefore, the Shuttle Radar Topography Mission (SRTM) at 30 m resolution is utilized to derive the contours of the UAE’s east coast—spanning from 1 to 5 m above sea level—and to conduct spatial analysis to categorize the kind and quantity of infrastructure at each elevation level. The contours were adjusted in accordance with the landform, the benchmarks, and the spot heights that were identified and validated during field inspections.
The coastal zone in the eastern UAE, adjacent to the Gulf of Oman, is characterized by its narrow coastal zone. Table 5 delineates the region corresponding to each elevation level from 1 to 5 m above the mean sea level. Each level specifies the inundation zone that will be submerged if the sea waves surpass that threshold. It is noted that all low-lying areas are solely situated around the shore, with no interior lowlands present. The extent of the coastal zone at 1 m above sea level along the entire east coast is 34.76 km2. This indicates that a 1 m rise in sea level would inundate an area of 34.67 km2. Fujairah covers 15.27 km2, Kalba encompasses 18.5 km2, and Khorfakkan occupies 0.9 km2 within the total area of 34.67 km2. In this context, the majority of the Kalba region is predominantly flat, characterized by a high density of residential structures, while the low-lying terrain extends along the entire eastern coastline; the mountains commence approximately 4.5 km from the shoreline.
Table 5.
Total area in km2 between 1 and 5 m contours along the east coast of the UAE.
In the same manner, the total area that will be affected by a 3 m tsunami, which will flood 56.76 km2 of the coastal area on the east coast of the UAE, equaling 3% of the total area of Fujairah and Sharjah combined (Figure 16). As shown in Table 5, the rise in sea level by 1 m will have an impact on different land use and land cover features and will affect infrastructure features along the coast. Built-up areas that could be inundated will be mostly the residential and plantation areas in Kalba, Fujairah City, Dibba, and Khorfakkan.
Table 6 illustrates that, as per reference [45], a probabilistic study of a tsunamigenic earthquake along the MSZ could result in tsunami waves impacting the east coast of the UAE. The anticipated maximum wave height is approximately 2.5 to 3.0 m. Consequently, all infrastructural features situated at or below 3 m above sea level are directly affected. The DEM indicates that the inundated region at 3 m of elevation encompasses 56.76 km2. Table 6 illustrates that the projected sea-level rise in this scenario is expected to have an effect on infrastructure, significantly impacting local cafeterias, baqalas, government offices, and mosques, particularly in the Kalba and Fujairah City regions. A GIS study indicates that 14.39 km2 of residential zones and 5.58 km2 of plantation lands, predominantly situated along the Kalba and Fujairah regions, are at risk (Figure 18). The three districts most susceptible to this type of catastrophe are Kalba, Fujairah City, and Dibba. Currently, around 16 schools, 7 hospitals, 2 clinics, 90 small cafeterias, 2 malls and, notably, 25 mosques would be affected. While numerous other economic factors were excluded from this analysis, it is evident that all coastal infrastructures, including oil refineries, desalination plants, harbors, and ports, are significantly susceptible to this 3 m wave scenario.
Table 6.
Infrastructures below the 3 m contour present on the entire east coast of the UAE.
Figure 18.
Surface contours overlaid on the different LULC features along the east coast of the UAE.
This study focuses on vulnerability to coastal disasters, primarily storm surges and tsunamis. Additional effects of sea-level rise pertinent to the eastern coast of the UAE include industrial and sewage pollution, hazardous algal blooms, and oil spills, particularly in proximity to the ports. Oil slicks can readily reach the shore during high waves or spring tides, resulting in harm to marine environments and impacting coastal populations. Such dangers are not addressed in the current study; however, they undoubtedly possess the potential to elevate the probability of hazardous incidents related to oil spills.
6. Conclusions
This study presents an Integrated Coastal Vulnerability Index (ICVI) that takes into account both hydro-physical and socio-economic factors. Moreover, it provides a thorough evaluation of coastal risk along the UAE’s east coast. A comprehensive assessment of coastal risk in an area increasingly exposed to geophysical and climate-induced hazards is outlined by combining nine important variables: geomorphology, coastal slope, shoreline change, bathymetry, benthic features, land use/land cover, population density, wave height, and tidal range.
According to the findings, roughly 26.4% (47.1 km) of the coastline is at high risk, 17.3% (30.9 km) is at moderate risk, and 56.3% (100.2 km) is at low risk. Due to a combination of low-lying topography, concave bathymetry, benthic parameter concentration, active erosion, and high population density, the most vulnerable areas are mostly found in Kalba, portions of Fujairah City, Khorfakkan, Dadna and Bidya, and Dibba. On the other hand, due to good geomorphological and bathymetric conditions, reasonably stable sections such as Fujairah Port and several rocky headland regions show less susceptibility.
This study’s inclusion of coastal benthic features (corals, seagrass, and microalgae) in the vulnerability framework—a factor not previously included in regional assessments—is a significant contribution. These habitats are essential for improving coastal resilience and reducing wave energy [114]. Their geographic proximity to extremely fragile areas, however, highlights the critical need for conservation and restoration efforts, including the possible application of artificial reefs. The overall east coast area impacted by a 3 m tsunami is 56.76 km2, while 27.47 km2 is located in Kalba, 26.94 km2 in Fujairah, and 2.26 km2 in Khorfakkan. In such an event, 16 schools, 7 hospitals, 2 clinics, 90 small cafeterias, 2 malls and, notably, 25 mosques would be affected.
The analysis also emphasizes how important nearshore bathymetry is, especially concave and canyon-like features that increase wave energy through tunneling and shoaling. Particularly in the context of anticipated sea-level rise scenarios, these circumstances may intensify the effects of storm surges and tsunamis. Over 40,000 people are at risk in low-lying coastal areas, and the 3 m inundation scenario shows significant potential damage to infrastructure, including residential, commercial, and industrial zones.
The ICVI framework created in this study offers coastal planners and policymakers a strong decision-support tool from a management standpoint. It facilitates the identification of intervention priority zones and aids in the development of focused adaptation techniques such as the following:
- Urban growth regulation and coastal zoning;
- Preservation and rehabilitation of natural buffers, such as coral reefs and mangroves;
- Strategic placement of coastal defenses and artificial reefs;
- Disaster preparedness and risk-informed infrastructure planning.
In conclusion, both natural processes and human forces contribute to the east coast of the United Arab Emirates’ notable but spatially varying vulnerability. Integrated, data-driven strategies such as the ICVI are crucial for boosting resilience and guaranteeing sustainable coastal development as climate change continues to increase coastal hazards. In order to strengthen prediction skills and further refine vulnerability assessments, future research should concentrate on integrating dynamic climatic projections, high-resolution elevation data, and real-time monitoring systems.
Using maps and satellite images procured at distinct points in time and at different scales can lead to attribute and positional mistakes, resulting in technical limits in any GIS-related procedures. As a result of generalization, there can be probable inaccuracies in the classification of land uses. For instance, even though they are categorized as built-up residential areas under the law of the majority, built-up regions also include many green spaces. The Shuttle Radar Topography Mission (SRTM) is the foundation for the elevation data, with a one-arc-second (30 m) resolution for source data cells. Since no other topographical data were available, SRTM data—which are typically not appropriate for flood modeling—were used in this study.
This study does not explicitly consider oil spills or future climate scenarios, including projected sea-level rise and changes in cyclone intensity. Incorporating such data and projections would improve the predictive capability of the vulnerability assessment.
The socio-economic analysis is limited to population density and LULC, without incorporating other critical indicators such as economic valuation, infrastructure resilience, evacuation capacity, or adaptive preparedness. These factors could significantly refine the understanding of human vulnerability.
Despite these limitations, this study provides a robust baseline framework for coastal vulnerability assessment in the UAE. Future work should focus on higher-resolution datasets, dynamic modeling approaches, advanced weighting techniques, and integration of climate projections to enhance the accuracy and applicability of the ICVI.
Author Contributions
Conceptualization, P.S.; methodology, P.S.; software, P.S.; validation, P.S., F.M.T. and M.A.; formal analysis, P.S. and M.A.; investigation, P.S., F.L.R. and M.A.; resources, P.S., F.M.T. and M.A.; data curation, P.S. and M.A.; writing—original draft preparation, P.S.; writing—review and editing, P.S. and F.M.T.; visualization, P.S.; supervision, P.S., F.L.R. and M.A.; project administration, P.S., F.L.R., F.M.T. and M.A. All authors have read and agreed to the published version of the manuscript.
Funding
This research received no external funding.
Data Availability Statement
The original contributions presented in this study are included in the article. Further inquiries can be directed to the corresponding author.
Conflicts of Interest
The authors declare that there are no conflicts of interest.
References
- Hereher, M.; Al-Awadhi, T.; Al-Hatrushi, S.; Charabi, Y.; Mansour, S.; Al-Nasiri, N.; Sherief, Y.; El-Kenawy, A. Assessment of the coastal vulnerability to sea level rise: Sultanate of Oman. Environ. Earth Sci. 2020, 79, 369. [Google Scholar] [CrossRef] [Scilit]
- IPCC. Climate Change 2021: The Physical Science Basis. Contribution of Working Group I to the Sixth Assessment Report of the Intergovernmental Panel on Climate Change; Cambridge University Press: Cambridge, UK, 2021. [Google Scholar]
- Hamlington, B.D.; Bellas-Manley, A.; Willis, J.K.; Fournier, S.; Vinogradova, N.; Nerem, R.S.; Piecuch, C.G.; Thompson, P.R.; Kopp, R. The rate of global sea level rise doubled during the past three decades. Commun. Earth Environ. 2024, 5, 601. [Google Scholar] [CrossRef] [Scilit]
- Dussaillant, I.; Hugonnet, R.; Huss, M.; Berthier, E.; Bannwart, J.; Paul, F.; Zemp, M. Annual mass change of the world’s glaciers from 1976 to 2024 by temporal downscaling of satellite data with in situ observations. Earth Syst. Sci. Data 2025, 17, 1977–2004. [Google Scholar] [CrossRef] [Scilit]
- IPCC. Summary for Policy Makers. Climate Change 2013: The Physical Science Basis. Contribution of Working Group i to the Fifth Assessment Report of the Intergovernmental Panel on Climate Change; Stocker, T.F., Qin, D., Plattner, G.-K., Tignor, M., Allen, S.K., Boschung, J., Nauels, A., Xia, Y., Bex, V., Midgley, P.M., Eds.; Cambridge University Press: Cambridge, UK, 2013. [Google Scholar]
- Vermeer, M.; Rahmstorf, S. Global sea level linked to global temperature. Proc. Natl. Acad. Sci. USA 2009, 106, 21527–21532. [Google Scholar] [CrossRef] [Scilit]
- Pfeer, W.T.; Harper, J.T.; O’Neel, S.J.S. Kinematic constraints on glacier contributions to 21st-century sea-level rise. Science 2008, 321, 1340–1343. [Google Scholar] [CrossRef] [Scilit]
- Kumar, T.; Mahendra, R.S.; Nayak, S.; Radhakrishnan, K.; Sahu, V.K. Coastal vulnerability assessment for Orissa State, East coast of India. J. Coast. Res. 2010, 26, 523–534. [Google Scholar] [CrossRef] [Scilit]
- Hereher, M. Vulnerability assessment of the Saudi Arabian Red Sea coast to climate change. Environ. Earth Sci. 2016, 75, 30. [Google Scholar] [CrossRef] [Scilit]
- Ghoussein, Y.; Mhawej, M.; Jaffalb, A.; Fadel, A.; El Hourany, R.; Faour, G. Vulnerability assessment of the South-Lebanese coast: A GIS-based approach. Ocean Coast Manag. 2018, 158, 56–63. [Google Scholar] [CrossRef] [Scilit]
- Subraelu, P.; Yagoub, M.M.; Sefelnasr, A.; Nageswara Rao, K.; Allamsatti, R.S.; Sherif, M. Sea-level Rise and Coastal Vulnerability: A Preliminary Assessment of UAE Coast through Remote Sensing and GIS. J. Coast Zone Manag. 2021, 24, 477. [Google Scholar]
- Williams, S.J. Sea-level rise implications for coastal regions. J. Coast Res. 2013, 63, 184–196. [Google Scholar] [CrossRef] [Scilit]
- Rao, K.N.; Subraelu, P. Role of bathymetry in tsunami amplification—Evidences from Andhra Pradesh coast. Curr. Sci. 2012, 103, 25. [Google Scholar]
- Aranguiz, R. Effect of Submarine Canyons On Tsunami Propagation: A case study of the Biobio canyon, Chile. Coast. Eng. J. 2013, 55, 1350016. [Google Scholar] [CrossRef] [Scilit]
- Jayakumar, S.; ManiMurali, R.; Baldock, T.E. Effect of Submarine canyons on tsunami heights, currents and run-up off the southeast coast of India. Curr. Sci. 2016, 111, 1990–2004. [Google Scholar] [CrossRef] [Scilit]
- Park, J.; Anderson, K.; Aster, R.; Butler, R.; Lay, T.; Simpson, D. Global seismographic network records the great Sumatra-Andaman earthquake. Eos Trans. Am. Geophys Union 2005, 86, 57–64. [Google Scholar] [CrossRef] [Scilit]
- Nandasena, N.A.K.; Hefny, A.; Chen, C.; Alshehhi, M.; Alahbabi, N.; Alketbi, F.; Ali, M.; Alblooshi, N. Tsunami Flow Characteristics on the East Coast of the UAE by One-Dimensional Numerical Analysis and Artificial Neural Networking. Sustainability 2025, 17, 7036. [Google Scholar] [CrossRef] [Scilit]
- Hoffman, G. Large Holocene tsunamis in the northern Arabian Sea. Mar. Geol. 2019, 419, 106068. [Google Scholar] [CrossRef] [Scilit]
- Le Cozannet, G.; Garcin, M.; Bulteau, T.; Mirgon, C.; Yates, M.L.; Méndez, M.; Baills, A.; Idier, D.; Oliveros, C. An AHP-Derived Method for Mapping the Physical Vulnerability of Coastal Areas at Regional Scales. Nat. Hazards Earth Syst. Sci. 2013, 13, 1209–1227. [Google Scholar] [CrossRef] [Scilit]
- Hereher, M. Assessment of South Sinai Coastal Vulnerability to Climate Change. J. Coast. Res. 2015, 31, 1469–1477. [Google Scholar] [CrossRef] [Scilit]
- Rao, K.N.; Subraelu, P.; Rao, T.V.; Malini, B.H.; Ratheesh, R.; Bhattacharya, S.; Rajawat, A.S. Sea level rise and coastal vulnerability: An assessment of Andhra Pradesh coast, India through remote sensing and GIS. J. Coast Conserv. 2008, 12, 195–207. [Google Scholar]
- Subraelu, P.; Sefelnasr, A.; Yagoub, M.M.; Sherif, M.; Ebraheem, A.A.; Raj Sekhar, A.; Nageswara Rao, K. Global Warming Climate Change and Sea Level Rise: Impact on LandUse Land Cover Features along UAE coast through Remote Sensing and GIS. J. Ecosys. Ecograph. 2022, 12, 329. [Google Scholar]
- Hereher, M. Vulnerability of the Nile Delta to sea level rise: An assessment using remote Sensing. Geomat. Nat. Hazards Risk 2010, 1, 315–321. [Google Scholar] [CrossRef] [Scilit]
- Subraelu, P.; Ahmed, A.; Ebraheem, A.A.; Sherif, M.; Mirza, S.B.; Ridouane, F.L.; Sefelnasr, A. Risk Assessment and Mapping of Flash Flood Vulnerable Zones in Arid Region, Fujairah City, UAE-Using Remote Sensing and GIS-Based Analysis. Water 2023, 15, 2802. [Google Scholar] [CrossRef] [Scilit]
- Available online: https://thenationalnews.com/news/uae/2024/04/25/uae-and-oman-flooding-up-to-40-more-intense-due-to-climate-change/?utm_source=chatgpt.com (accessed on 27 November 2025).
- Panahi, F.; Asadollahi, R.; Asadollahi, M. Bafarani A Experience of cyclone Gonu in the Islamic Republic of Iran: Lessons learned. East. Mediterr. Health J. 2010, 16, 1290–1294. [Google Scholar] [CrossRef] [Scilit]
- Haggag, M.; Badry, H. Hydrometeorological Modeling Study of Tropical Cyclone Phet in the Arabian Sea in 2010. Atmos. Clim. Sci. 2012, 2, 174–190. [Google Scholar] [CrossRef]
- Keller, E. Introduction to Environmental Geology, 5th ed.; Pearson Prentice Hall: New Jersey, NJ, USA, 2012. [Google Scholar]
- Heidarzadeh, M.; Pirooz, M.; Zaker, N.; Yalciner, A. Preliminary estimation of the tsunami hazards associated with the Makran subduction zone at the northwestern Indian Ocean. Nat. Hazards 2009, 48, 229–243. [Google Scholar] [CrossRef] [Scilit]
- Carayannis, G.P. The potential of Tsunami generation along the Makran Subduction Zone in Northern Arabian Sea. Case study: The earthquake and tsunami of November 28, 1945. Sci. Tsunami Hazards 2006, 24, 358–384. [Google Scholar]
- Geist, E.; Parsons, T. Probabilistic analysis of tsunami hazards. Nat. Hazards 2006, 37, 277–314. [Google Scholar] [CrossRef] [Scilit]
- Browning, J.; Thomas, N. An assessment of the tsunami risk in Muscat and Salalah, Oman, based on estimations of probable maximum loss. Int. J. Disaster Risk Reduct. 2016, 16, 75–87. [Google Scholar] [CrossRef] [Scilit]
- Gornitz, V. Vulnerability of the East Coast, USA to future sea level rise. J. Coast. Res. 1990, 9, 201–237. [Google Scholar]
- Thieler, E.R.; Hammar-Klose, E.S. National Assessment of Coastal Vulnerability to Sea-Level Rise, US Atlantic Coast; Open-File Report no. 99593, 1 sheet; United States Geological Survey: Woods Hole, MA, USA, 1999.
- Thieler, E.R.; Hammar-Klose, E.S. National Assessment of Coastal Vulnerability to Sea-Level Rise: Preliminary Results for the US. Pacific Coast; Open-File Report 00-178, 1 sheet; US Geological Survey: Woods Hole, MA, USA, 2000.
- Pendleton, E.A.; Thieler, E.R.; Jeffress, S.W. Coastal Vulnerability Assessment of Golden Gate National Recreation Area to Sea-Level Rise; Open-File Report no. 2005–1058; United States Geological Survey: Reston, VA, USA, 2005.
- Dwarakish, G.S.; Vinay, S.A.; Natesan, U.; Asano, T.; Kakinuma, T.; Venkataramana, K.; Babita, M.K. Coastal vulnerability assessment of the 628 future sea level rise in Udupi coastal zone of Karnataka state, west coast of India. Ocean Coast. Manag. 2009, 52, 467–478. [Google Scholar] [CrossRef] [Scilit]
- Hereher, M. Coastal vulnerability assessment for Egypt’s Mediterranean coast. Geom. Nat. Hazards Risk 2015, 6, 342–355. [Google Scholar] [CrossRef] [Scilit]
- Djouder, F.; Boutiba, M. Vulnerability assessment of coastal areas to sea level rise from the physical and socioeconomic parameters: Case of the Gulf Coast of Bejaia, Algeria. Arab J. Geosci. 2017, 10, 299. [Google Scholar] [CrossRef] [Scilit]
- Duriyapong, F.; Nakhapakorn, K. Coastal vulnerability assessment: A case study of Samut Sakhon coastal zone. Songklanakarin J. Sci. Technol. 2011, 33, 469–476. [Google Scholar]
- Hoque, M.; Ahmed, N.; Pradhan, B.; Royd, S. Assessment of coastal vulnerability to multi-hazardous events using geospatial techniques along the eastern coast of Bangladesh. Ocean Coast. Manag. 2019, 181, 104898. [Google Scholar] [CrossRef] [Scilit]
- Arokiyadoss, P.; Narasimhan Chandrasekaran, L.; Andimuthu, R.; Syed Noor, A.I. Assessment of Integrated Coastal Vulnerability Index in the Coromandel Coast of Tamil Nadu, India Using. Multi-Criteria Spatial Analysis Approaches. Sustainability 2025, 17, 6286. [Google Scholar] [CrossRef] [Scilit]
- Maanan, M.; Maanan, M.; Rueff, H.; Adouk, N.; Zourarah, B.; Rhinane, H. Assess the human and environmental vulnerability for coastal hazard by using a multi-criteria decision analysis. Hum. Ecol. Risk Assess. 2018, 24, 1642–1658. [Google Scholar] [CrossRef] [Scilit]
- Yagoub, M.M.; Alsereidi, A.A.; Mohamed, E.A.; Periyasamy, P.; Alameri, R.; Aldarmaki, S.; Alhashmi, Y. Newspapers as a validation proxy for GIS modeling in Fujairah, United Arab Emirates: Identifying flood prone areas. Nat. Hazards 2020, 104, 111–141. [Google Scholar] [CrossRef] [Scilit]
- Hamidatou, M.; Almandous, A.; Alebri, K.; Alameri, B.; Megahed, A. Dterministic Tsunami Hazard Assessment for the Eastern Coast of the United Arab Emirates: Insights from the Makran Subduction Zone. Sustainability 2024, 16, 10665. [Google Scholar] [CrossRef] [Scilit]
- Al-Habsi, Z.; Hereher, M.; El-Hussain, I.; Omira, R.; Baptista, M.A.; Deif, A.; Al-Awadhi, T.; Al-Nasiri, N. Tsunami hazard and risk zoning for qurayyat in northeast Oman Coast: Worst-case credible scenarios along the Makran Subduction Zone, Western Asia. J. Asian Earth Sci. 2022, 8, 100103. [Google Scholar] [CrossRef] [Scilit]
- Aguirre-Ayerbe, I.; Martínez Sánchez, J.; Aniel-Quiroga, Í.; González-Riancho, P.; Merino, M.; Al-Yahyai, S.; González, M.; Medina, R. From Tsunami Risk Assessment to Disaster Risk Reduction—The Case of Oman. Nat. Hazards Earth Syst. Sci. 2018, 18, 2241–2260. [Google Scholar] [CrossRef] [Scilit]
- Dhanhani, H.A.G. Evaluation of the Response Capability of the United Arab Emirates (UAE) to the Impact of Natural Hazards. Ph.D. Thesis, University of Bedfordshire, Luton, UK, 2010. Available online: https://thenationalnews.com/uae/science/2022/06/06/gulf-will-face-more-tropical-cyclones-due-to-climate-change/?utm_source=chatgpt.com (accessed on 18 November 2025).
- Didenkulova, I.; Pelinovsky, R. Run-ups of tsunami waves in U shapes bays. Pure Appl. Geophys. 2011, 168, 1239–1249. [Google Scholar] [CrossRef] [Scilit]
- Anfuso, G.; Postacchini, M.; Di Luccio, D.; Benassai, G. Coastal Sensitivity/Vulnerability Characterization and Adaptation Strategies: A Review. J. Mar. Sci. Eng. 2021, 9, 72. [Google Scholar] [CrossRef] [Scilit]
- Pendleton, E.A.; Thieler, E.R.; Williams, S.J. Importance of Coastal Change Variables in Determining Vulnerability to Sea- and Lake-Level Change. J. Coast. Res. 2010, 261, 176–183. [Google Scholar] [CrossRef] [Scilit]
- Saengsupavanich, C. Flaws in Coastal Erosion Vulnerability Assessment: Physical and Geomorphological Parameters. Arab. J. Geosci. 2022, 15, 57. [Google Scholar] [CrossRef] [Scilit]
- Dronkers, J. Dynamics of Coastal Systems; World Scientific: Singapore, 2005; Volume 25. [Google Scholar]
- Davis, R.A., Jr.; FitzGerald, D.M. Beaches and Coasts; John Wiley & Sons: Hoboken, NJ, USA, 2009. [Google Scholar]
- Thieler, E.R.; Hammer-Klose, E.S. National assessment of coastal vulnerability to sea level rise: Preliminary results for the US atlanta coast. USGS Open File Rep. 1999, 99, 593. [Google Scholar]
- Pranzini, E.; Williams, A.T. Coastal Erosion and Protection in Europe; Routledge: London, UK, 2013. [Google Scholar]
- Webb, P. Introduction to Oceanography; Roger Williams University: Bristol, UK, 2021. [Google Scholar]
- Pain, C.F.; Abdelfattah, M.A. Landform evolution in the arid northern United Arab Emirates: Impacts of tectonics, sea levelchanges and climate. Catena 2015, 134, 14–29. [Google Scholar] [CrossRef] [Scilit]
- Sherif, M.; Sefelnasr, A.; Ebraheem, A.A.; Mulla, M.A.; Alzaabi, M.; Alghafli, K. Spatial and Temporal Changes of GroundwaterStorage in the Quaternary Aquifer, UAE. Water 2021, 13, 864. [Google Scholar] [CrossRef] [Scilit]
- Gaki-Papanastassiou, K.; Karymbalis, E.; Poulos, S.; Seni, A.; Zouva, C. Coastal Vulnerability Assessment to Sea-Level Rise Bαsed on Geomorphological and Oceanographical Parameters: The Case of Argolikos Gulf, Peloponnese, Greece. J. Geosci. 2010, 45, 109–122. [Google Scholar]
- Karymbalis, E.; Chalkias, C.; Chalkias, G.; Grigoropoulou, E.; Manthos, G.; Ferentinou, M. Assessment of the Sensitivity of the Southern Coast of the Gulf of Corinth (Peloponnese, Greece) to Sea-Level Rise. Open Geosci. 2012, 4, 561–577. [Google Scholar] [CrossRef] [Scilit]
- Manno, G.; Azzara, G.; Lo Re, C.; Martinello, C.; Basile, M.; Rotigliano, E.; Ciraolo, G. An Approach for the Validation of a Coastal Erosion Vulnerability Index: An Application in Sicily. J. Mar. Sci. Eng. 2022, 11, 23. [Google Scholar] [CrossRef] [Scilit]
- Weitzner, H. Coastal Processes and Causes of Shoreline Erosion and Accretion; New York Sea Grant: New York, NY, USA, 2015. [Google Scholar]
- Williams, M.O.; Ode, A.B.; Benson, G.O. Coastal Vulnerability Assessment: A Case Study of the Nigerian Coastline. Sustainability 2022, 14, 2097. [Google Scholar] [CrossRef] [Scilit]
- Nieto, C.E.; Martínez-Graña, A.M.; Encinas, B. Analysis of the Risk of Coastal Flooding Due to Rising Sea Levels in Ría of Arosa (Pontevedra, Spain). Appl. Sci. 2023, 13, 12099. [Google Scholar] [CrossRef] [Scilit]
- Giribabu, D.; Hari, R.; Sharma, J.; Ghosh, K.; Padiyar, N.; Sharma, A.; Bera, A.K.; Srivastav, S.K. Performance assessment of GEBCO_2023 gridded bathymetric data in selected shallow waters of Indian ocean using the seafloor from ICESat-2 photons. Mar. Geophys. Res. 2023, 45, 1. [Google Scholar] [CrossRef] [Scilit]
- Iglesias, O.; Lastras, G.; Souto, C.; Costa, S.; Canals, M. Effects of coastal submarine canyons on tsunami propagation and impact. Mar. Geol. 2014, 350, 39–51. [Google Scholar] [CrossRef] [Scilit]
- Kulkarni, A.D.; Lowe, B. Random Forest Algorithm for Land Cover Classification. Int. J. Recent Innov. Trends Comput. Commun. 2016, 4, 58–63. [Google Scholar]
- Lewis, R.J.; Street, W.C. An Introduction to Classification and Regression Tree (CART) Analysis. In Proceedings of the 2000 Society for Academic Emergency Medicine (SAEM) Annual Meeting, San Francisco, CA, USA, 22–25 May 2000; Volume 14, p. 106. [Google Scholar]
- Lyzenga, D.R. Passive remote sensing techniques for mapping water depth and bottom features. Appl. Opt. 1978, 17, 379–383. [Google Scholar] [CrossRef] [Scilit]
- Gornitz, V. Global coastal hazards from future sea level rise. Palaeogeogr. Palaeoclimatol. Palaeoecol. 1991, 89, 379–398. [Google Scholar] [CrossRef] [Scilit]
- Korres, G.; Ravdas, M.; Zacharioudaki, A.; Denaxa, D.; Sotiropoulou, M. Mediterranean SeaWaves Reanalysis (CMEMS Med-Waves, MedWAM3 System) (Version 1). 2021. Available online: https://www.cmcc.it/doi/mediterranean-sea-waves-analysis-and-forecast-cmems-med-waves-medwam3-system (accessed on 27 October 2025).
- Nourdi, N.F.; Raphael, O.; Achab, M.; Loudi, Y.; Rudant, J.-P.; Minette, T.E.; Kambia, P.; Claude, N.J.; Romaric, N. Integrated Assessment of Coastal Vulnerability in the Bonny Bay: A Combination of Traditional Methods (Simple and AHP) and Machine Learning Approach. Estuaries Coasts 2024, 47, 2670–2695. [Google Scholar] [CrossRef] [Scilit]
- MacManus, K.; Balk, D.; Engin, H.; McGranahan, G.; Inman, R. Estimating Population and Urban Areas at Risk of Coastal Hazards, 1990–2015: How Data Choices Matter. Earth Syst. Sci. Data 2021, 13, 5747–5801. [Google Scholar] [CrossRef] [Scilit]
- Ademiluyi, I.A.; Okude, A.S.; Akanni, C.O. An appraisal of land use and landcover mapping in Nigeria. Afr. J. Agric. Res. 2008, 3, 581–586. [Google Scholar]
- Molina, D.M.; Antonopoulow, M.; Baldwin, R.; Bejarano, I.; Burt, J.A.; Garcia, J.A.; Ghais Saif, M.; Walgamage, J.; Taylor, O.J. Applying an integrated approach to coastal marine habitat mapping in the north-western United Arab Emirates. Mar. Environ. Res. 2020, 161, 105095. [Google Scholar] [CrossRef] [Scilit]
- Fasona, M.J.; Omojola, A.S. Climate Change, Human Security and Communal Clashes in Nigeria. In Proceedings of the International Workshop on Human Security and Climate Change, Asker, Norway, 21–23 June 2007. [Google Scholar]
- Yahia Meddah, R.; Ghodbani, T.; Senouci, R.; Rabehi, W.; Duarte, L.; Teodoro, A.C. Estimation of the Coastal Vulnerability Index Using Multi-Criteria Decision Making: The Coastal Social–Ecological System of Rachgoun, Western Algeria. Sustainability 2023, 15, 12838. [Google Scholar] [CrossRef] [Scilit]
- Tragaki, A.; Gallousi, C.; Karymbalis, E. Coastal Hazard Vulnerability Assessment Based on Geomorphic, Oceanographic and Demographic Parameters: The Case of the Peloponnese (Southern Greece). Land 2018, 7, 56. [Google Scholar] [CrossRef] [Scilit]
- Diez, P.G.; Perillo, G.M.E.; Piccolo, M.C. Vulnerability to sea-level rise on the coast of buenos aires province. J. Coast. Res. 2007, 23, 119–126. [Google Scholar] [CrossRef] [Scilit]
- Doukakis, E. Coastal vulnerability and risk parameters. Eur. Water 2005, 11, 3–7. [Google Scholar]
- Nigam, R.; Luis, A.J.; Gagnon, A.S.; Vaz, E.; Damasio, B.; Kotha, M. Assessing coastal vulnerability at the village level using a robust framework, the example of Canacona in South Goa, India. iScience 2024, 27, 109129. [Google Scholar] [CrossRef] [Scilit] [PubMed]
- Gornitz, V.; White, T.W.; Cushman, R.M. Vulnerability of the US to Future Sea Level Rise; Report No.: CONF-910780-1; Oak Ridge National Lab: Oak Ridge, TN, USA, 1991.
- Theocharidis, C.; Doukanari, M.; Kalogirou, E.; Christofi, D.; Mettas, C.; Kontoes, C.; Hadjimitsis, D.; Argyriou, A.V.; Eliades, M. Coastal Vulnerability Index (CVI) Assessment. Evaluating Risks Associated with Human-Made Activities along the Limassol Coastline, Cyprus. Remote Sens. 2024, 16, 3688. [Google Scholar] [CrossRef] [Scilit]
- Subraelu, P.; Ebraheem, A.A.; Sherif, M.; Sefelnasr, A.; Yagoub, M.M.; Rao, K.N. Land in Water: The Study of Land Reclamation and Artificial Islands Formation in the UAE Coastal Zone: A Remote Sensing and GIS Perspective. Land 2022, 11, 2024. [Google Scholar] [CrossRef] [Scilit]
- Dibba, B.; Yaffa, S.; Sawaneh, M.; Adzawla, W. Land Cover Transformation and Population Growth: Impacts on Coastal Environment of The Gambia (1990–2020). Sustainability 2025, 17, 1853. [Google Scholar] [CrossRef] [Scilit]
- Pendleton, E.A.; Thieler, E.R.; Williams, S.J.; Beavers, R.L. Coastal Vulnerability Assessment of Padre Island National Seashore (PAIS) to Sea-Level Rise; U.S. Geological Survey: Reston, VA, USA, 2004. Available online: https://pubs.usgs.gov/of/2004/1090 (accessed on 25 November 2025).
- Bagdanavičiūtė, I.; Kelpšaitė, L.; Soomer, T. Multi-criteria evaluation approach to coastal vulnerability index development in micro-tidal low-lying areas. Ocean Coast. Manag. 2015, 104, 122–136. [Google Scholar] [CrossRef] [Scilit]
- Arun Kumar, A.; Kunte, P.D. Coastal Vulnerability Assessment for Chennai, East Coast of India Using Geospatial Techniques. Nat. Hazards 2012, 64, 853–872. [Google Scholar] [CrossRef] [Scilit]
- Foster, K.A.; Foster, G.; Tourenq, C.; Shuriqi, M.K. Shifts in coral community structures following cyclone and red tide disturbances within the Gulf of Oman (United Arab Emirates) 2010. Mar. Biol. 2010, 158, 955–968. [Google Scholar] [CrossRef] [Scilit]
- Lincoln, S.; Buckley, P.; Howes, E.L.; Maltby, K.M.; Pinnegar, J.K.; Ali, T.S.; Alosairi, Y.; Al-Ragum, A.; Baglee, A.; Balmes, C.O.; et al. A Regional Review of Marine and Coastal Impacts of Climate Change on the ROPME Sea Area. Sustainability 2021, 13, 13810. [Google Scholar] [CrossRef] [Scilit]
- Chavanich, S.; Siripong, A.; Sojisuporn, P.; Menasveta, P. Impact of Tsunami on the seafloor and corals in Thailand. Coral Reefs 2005, 24, 535. [Google Scholar] [CrossRef] [Scilit]
- Tchindjang, M.; Mbevo, F.P.; Kamgho, C. Coastal Hazard and Vulnerability Assessment in Cameroon. Int. J. Clim. Chang. Strateg. Manag. 2025, 13, 65. Available online: https://www.proquest.com/docview/3159530022?fromopenview=true&pqorigsite=gscholar (accessed on 9 December 2025).
- Ali, E.M.; Zanaty, N.; Khairy, N.; El-Magd, I.A. Assessment of Climate Change Implications on Coastal and Marine Ecosystems Using Satellite Data. In Modelling and Advanced Earth Observation Technologies for Coastal Zone Management; Ali, E.M., El-Magd, I.A., Eds.; Springer Nature Switzerland: Cham, Switzerland, 2025; pp. 85–115. [Google Scholar]
- Ford-Learner, M.A.; Addison, J.; Cumming, G.S. A Review of Ecosystem Service Supply in Tropical Marine Ecosystems and Its Relationship to Habitats in the Great Barrier Reef. Ecosyst. People 2025, 21, 2425816. [Google Scholar]
- Turriza Canul, R.A.; Fernandez-Diaz, V.Z.; Rojas Cardenas, D.M.; Tzuc, Ó.M. Coastal vulnerability assessment with a hierarchical coastal segments approach. Ocean Coast. Manag. 2024, 249, 106989. [Google Scholar] [CrossRef] [Scilit]
- Scala, P.; Manno, G.; Cozar, L.C.; Ciraolo, G. COAST-PROSIM: A Model for Predicting Shoreline Evolution and Assessing the Impacts of Coastal Defence Structures. Water 2023, 17, 269. [Google Scholar] [CrossRef] [Scilit]
- Boumpoulis, V.; Depountis, N.; Dimas, A.; Papatheodorou, G. Presentation and analysis of the Geotechnical Coastal Vulnerability Index and validation of its application to coastal erosion problems. Sci. Rep. 2025, 15, 85594. [Google Scholar] [CrossRef] [Scilit] [PubMed]
- Marzouk, M.; Azab, S. Modeling climate change adaptation for sustainable coastal zones using GIS and AHP. Environ. Monit. Assess. 2024, 196, 12287. [Google Scholar] [CrossRef] [Scilit] [PubMed]
- McLaughlin, S.; Cooper, J.A.G. A Multi-Scale Coastal Vulnerability Index: A Tool for Coastal Managers. Environ. Hazards 2010, 9, 233–248. [Google Scholar] [CrossRef] [Scilit]
- Hamid, N.; Yoganandham, S.T. An Introduction to Marine Ecosystem: Environmental and Economic Impacts. In Advances in Marine Ecosystem Research; Springer: Cham, Switzerland, 2025; pp. 1–20. [Google Scholar]
- Monioudi, I.; Chatzistratis, D.; Chalazas, T.; Chatzipavlis, A.; Velegrakis, A.; Andreadis, O.; Monioudis, E.; Nikolaou, A.; Hasiotis, T. A Prioritization Framework for Adaptation Responses for Climate Change-Induced Erosion in Island Beaches—Cases from the Aegean Islands, Greece. J. Mar. Sci. Eng. 2025, 13, 491. [Google Scholar] [CrossRef] [Scilit]
- Geist, E.; Titov, V.; Synolakis, C. Tsunami: Wave of change. Sci. Am. 2006, 294, 56–63. [Google Scholar] [CrossRef] [Scilit] [PubMed]
- National Geophysical Data Center (NGDC/WDS). Global Historical Tsunami Database; National Geophysical Data Center: Boulder, CO, USA, 2013. Available online: http://www.ngdc.noaa.gov/hazard/tsu_db.shtml (accessed on 27 October 2025).
- Sarker, M.A. A Review of numerical modelling of cyclones and tsunamis in the Arabian Sea by Royal HaskoningDHV. Inter. J. Hydrol. 2017, 1, 00014. [Google Scholar]
- Cooke, M.L.; Crider, J.G.; Morell, K.D.; Karlstrom, L.; Yanites, B.J. What is the energy budget of subduction zone hazards? Rev. Geophys. 2025, 63, e2024RG000848. [Google Scholar] [CrossRef] [Scilit]
- Sultanpour, M. A study on the probability of tsunami attacks in the Persian Gulf and Gulf of Oman. In Handbook of Coastal Disaster Mitigation for Engineers and Planners; Elsevier: Amsterdam, The Netherlands, 2015. [Google Scholar]
- Byrine, D.E.; Sykes, L.R.; Davis, D.M. Great thrust earthquakes and aseismic slip along the plate boundary of the Makran Subduction Zone. J. Geophys. Res. 1992, 97, 449–478. [Google Scholar] [CrossRef] [Scilit]
- Schneider, B.; Hoffmann, G.; Reicherter, K. Scenario-based tsunami risk assessment using a static flooding approach and high-resolution digital elevation data: An example from Muscat in Oman. Glob. Planet. Chan. 2016, 139, 183–194. [Google Scholar] [CrossRef] [Scilit]
- El-Hussain, I.; Omira, R.; Al-Habsi, Z.; Baptista, M.A.; Deif, A.; Mohamed, A.M. Probabilistic and deterministic estimates of near-field tsunami hazards in northeast Oman. Geosci. Lett. 2018, 5, 30. [Google Scholar] [CrossRef] [Scilit]
- Heidarzadeh, M.; Pirooz, M.; Zaker, N. Modeling the near-field effects of the worstcase tsunami in the Makran subduction zone. Ocean Eng. 2009, 36, 368–376. [Google Scholar] [CrossRef] [Scilit]
- Yan, K.; Di Baldassarre, G.; Solomatine, D.P.; Schumann, G.J.P. A review of lowcost space-borne data for flood modelling: Topography, flood extent and water level. Hydrol. Proc. 2015, 29, 3368–3387. [Google Scholar] [CrossRef] [Scilit]
- Pham, H.; Marshalla, L.; Johnsona, F.; Sharma, A.A. method for combining SRTMDEM and ASTER GDEM2 to improve topography estimation in regions without reference data. Remote Sens. Environ. 2018, 210, 229–241. [Google Scholar] [CrossRef] [Scilit]
- Olwig, M.F.; Sørensen, M.K.; Rasmussen, M.S.; Danielsen, F.; Selvam, V.; Hansen, L.B.; Nyborg, L.; Vestergaard, K.B.; Parish, F.; Karunagaran, V.M. Using remote sensing to assess the protective role of coastal woody vegetation against tsunami waves. Int. J. Remote Sens. 2007, 28, 3153–3169. [Google Scholar] [CrossRef] [Scilit]
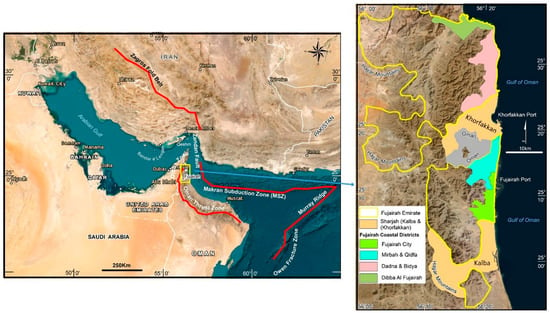
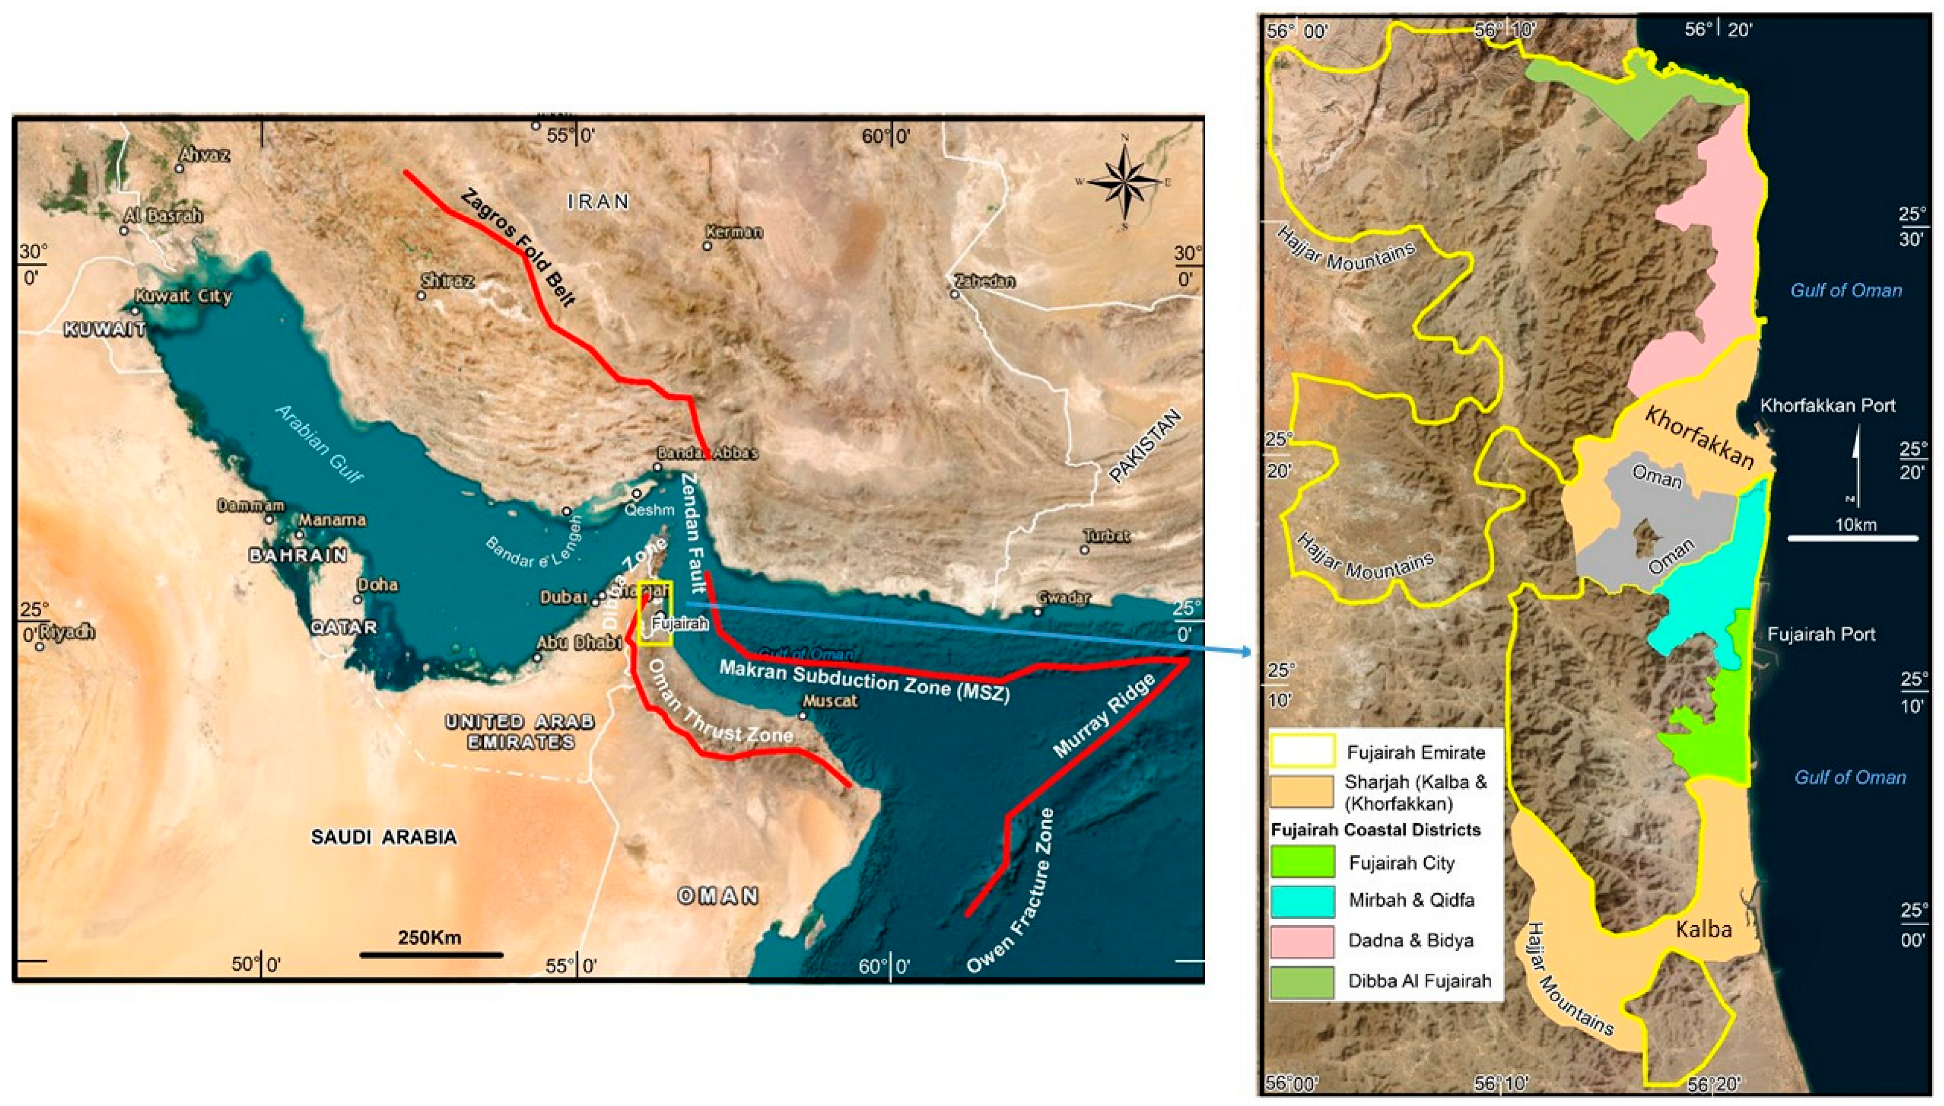


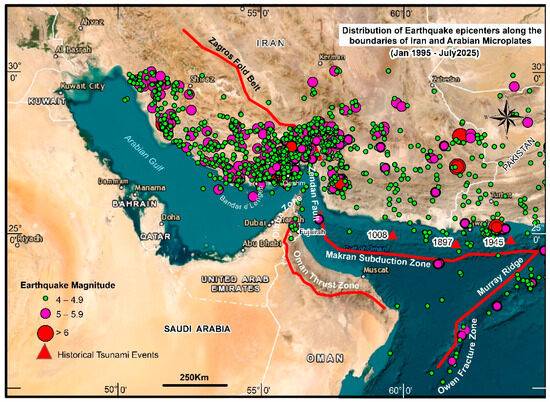
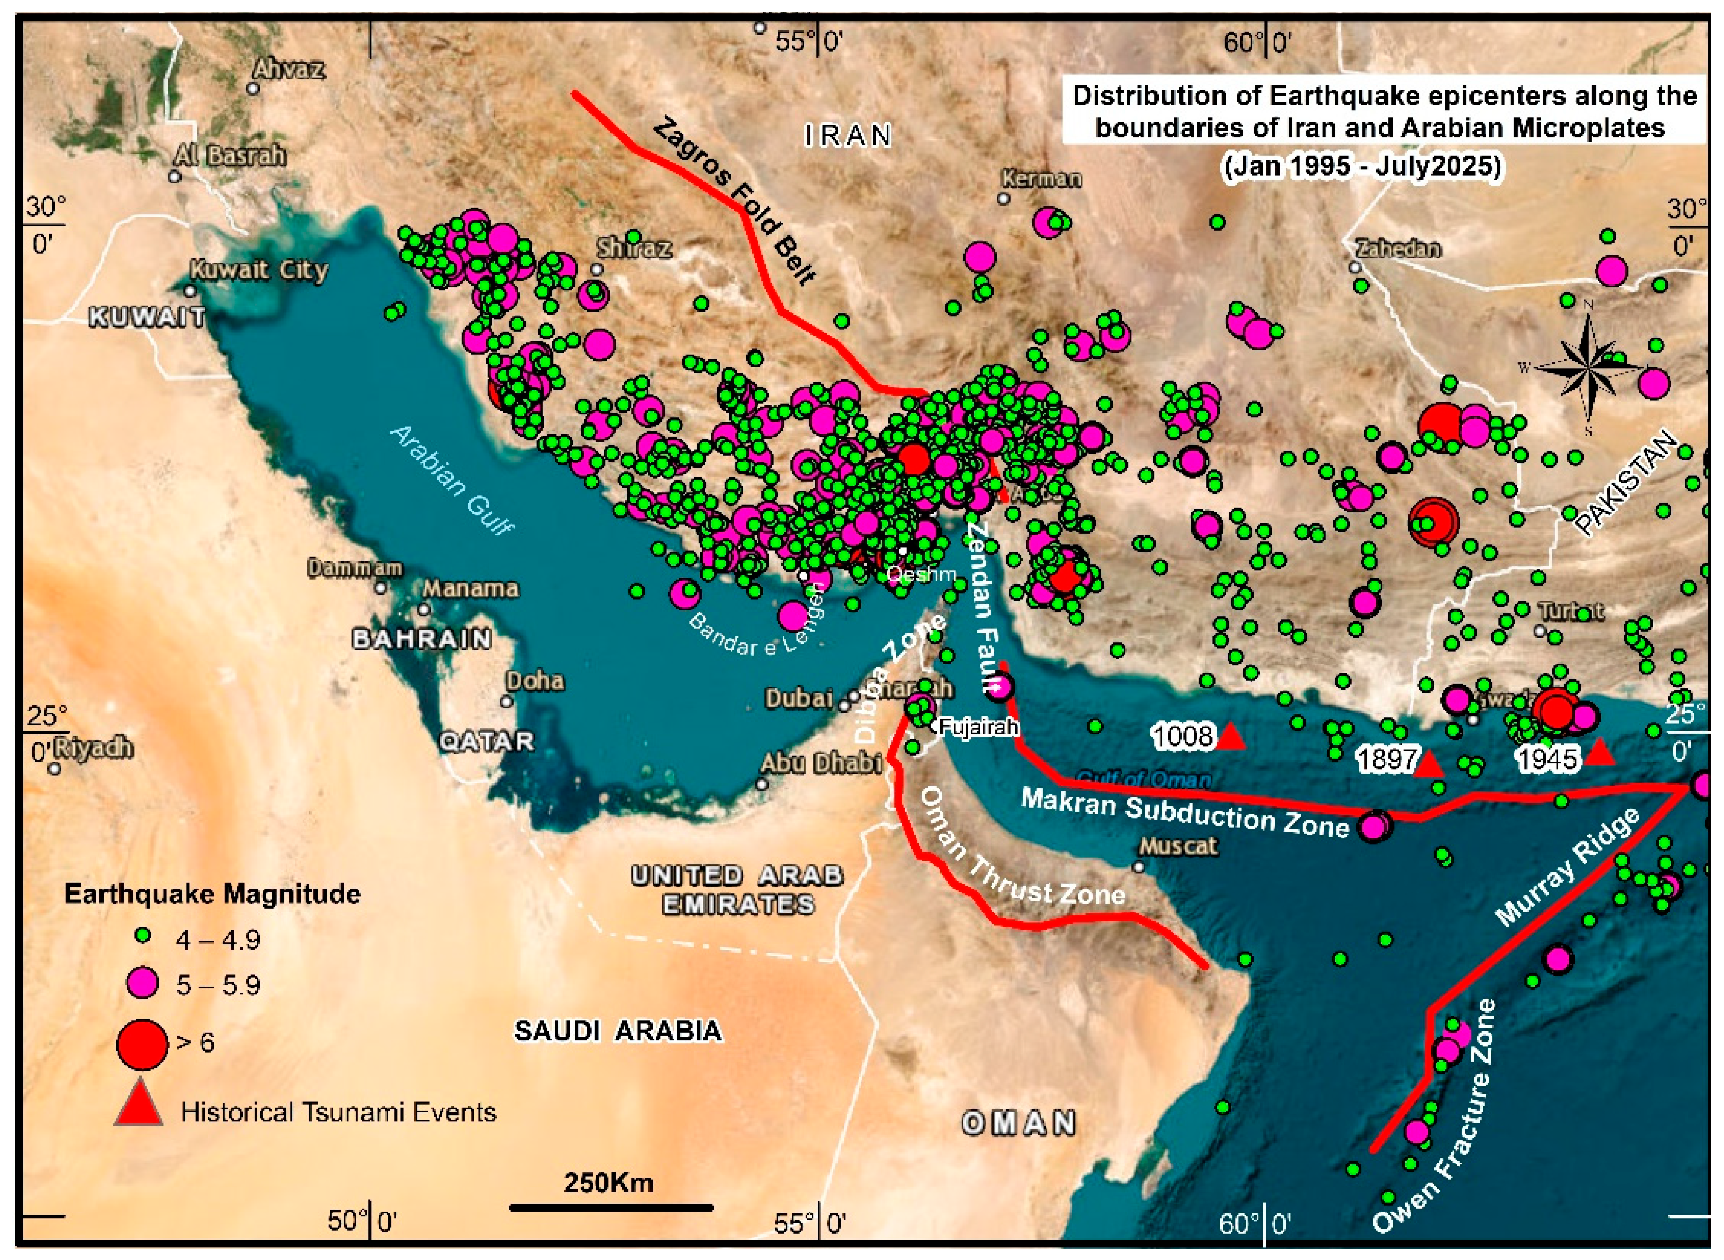
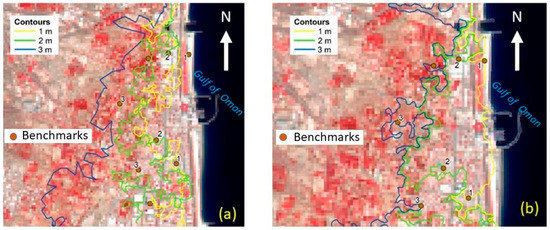
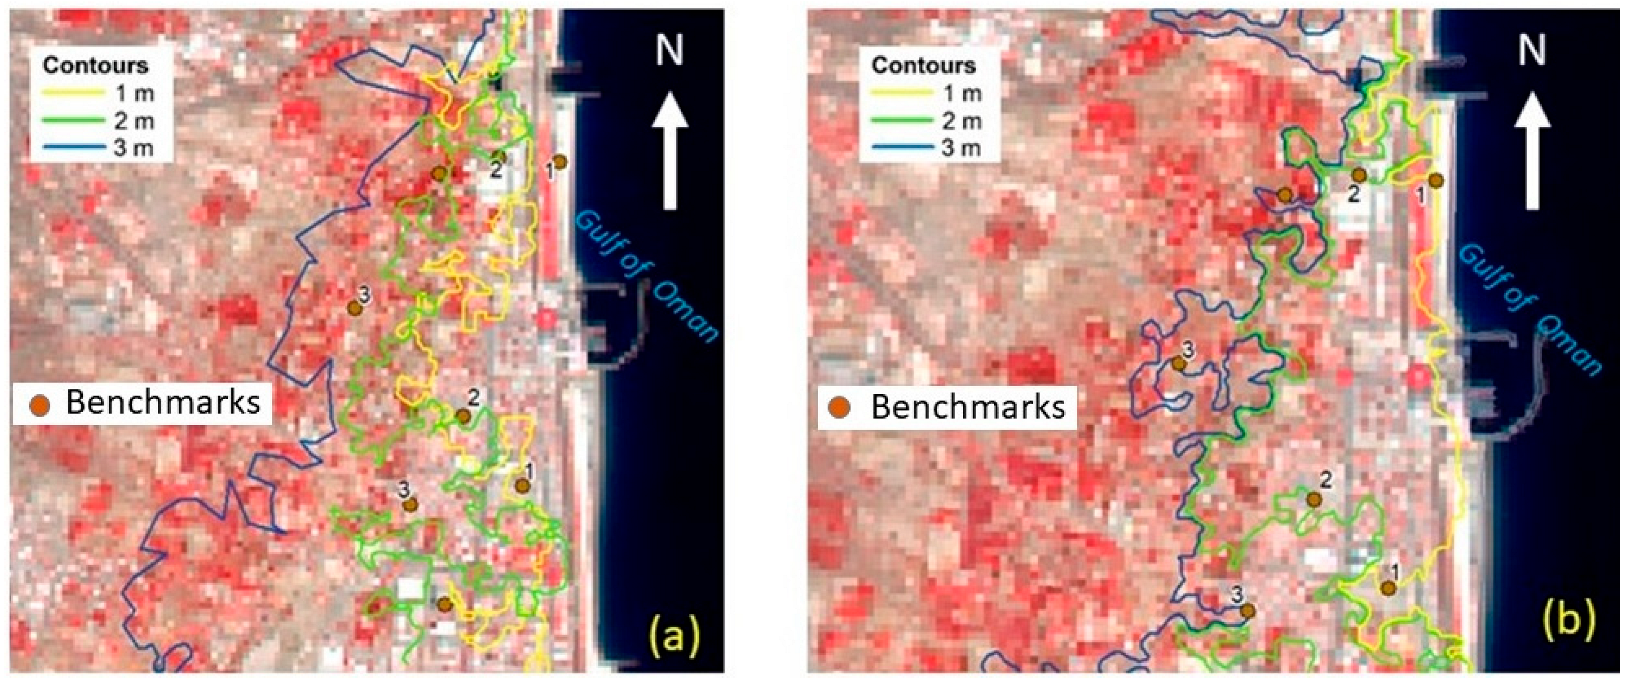
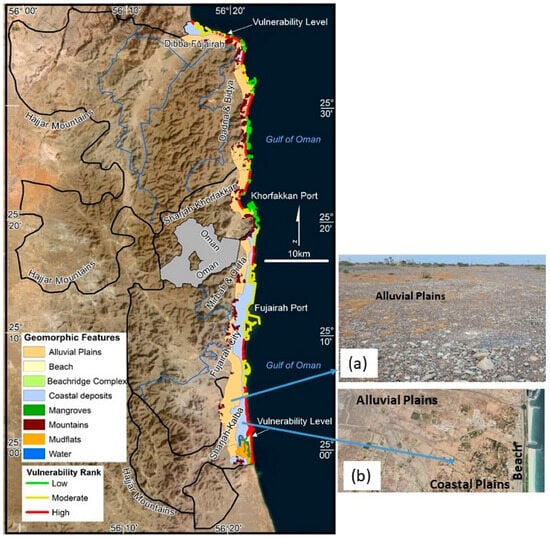
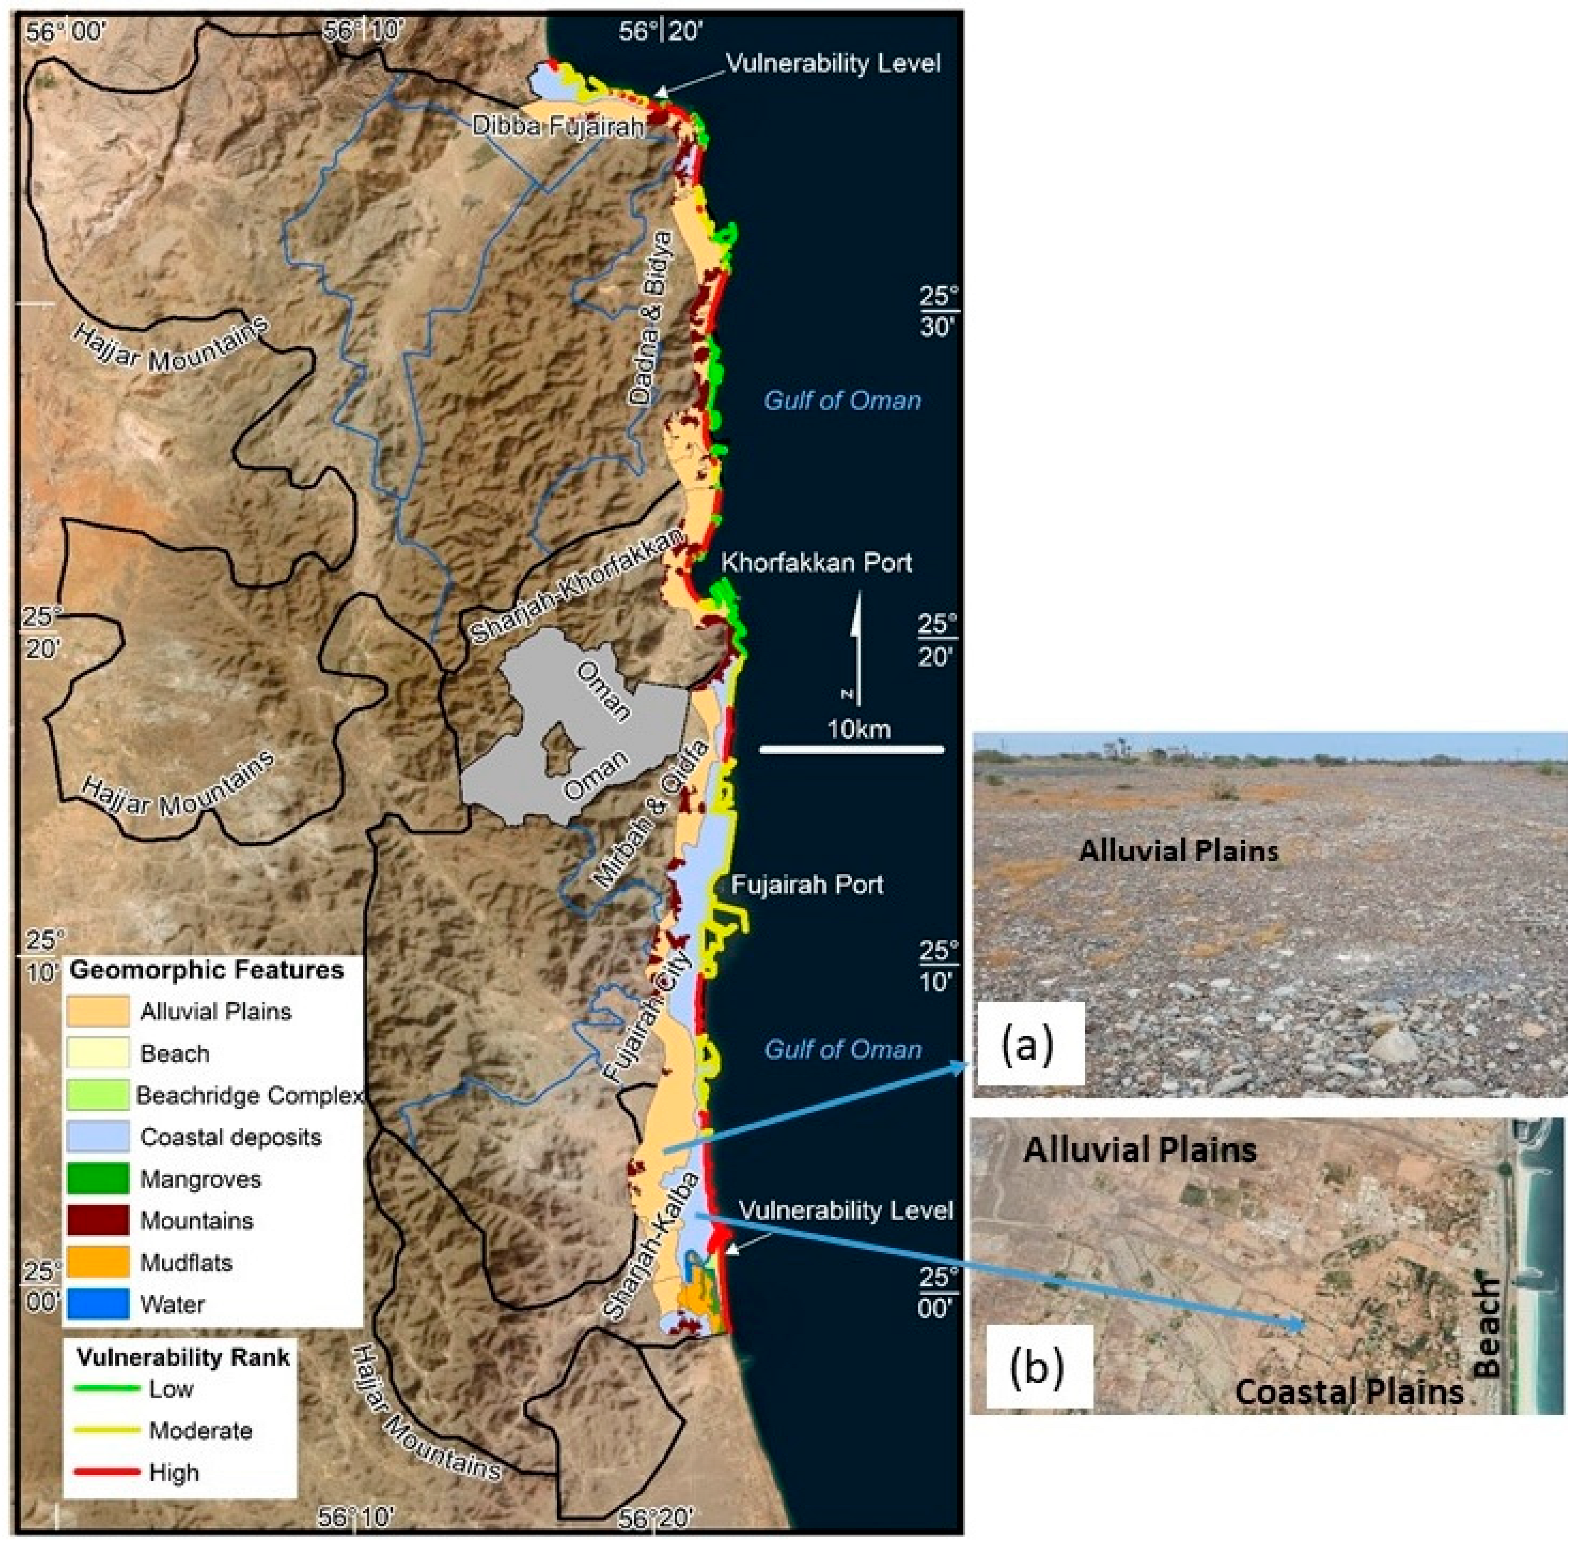
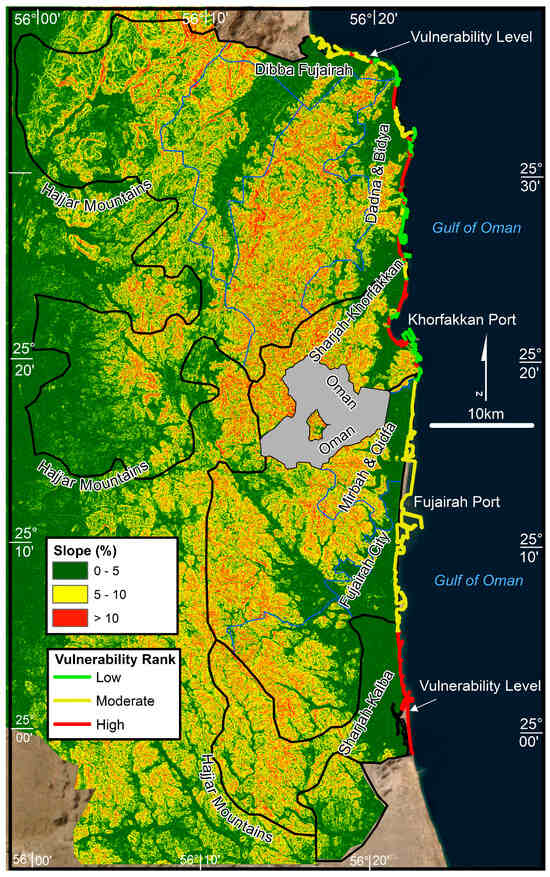
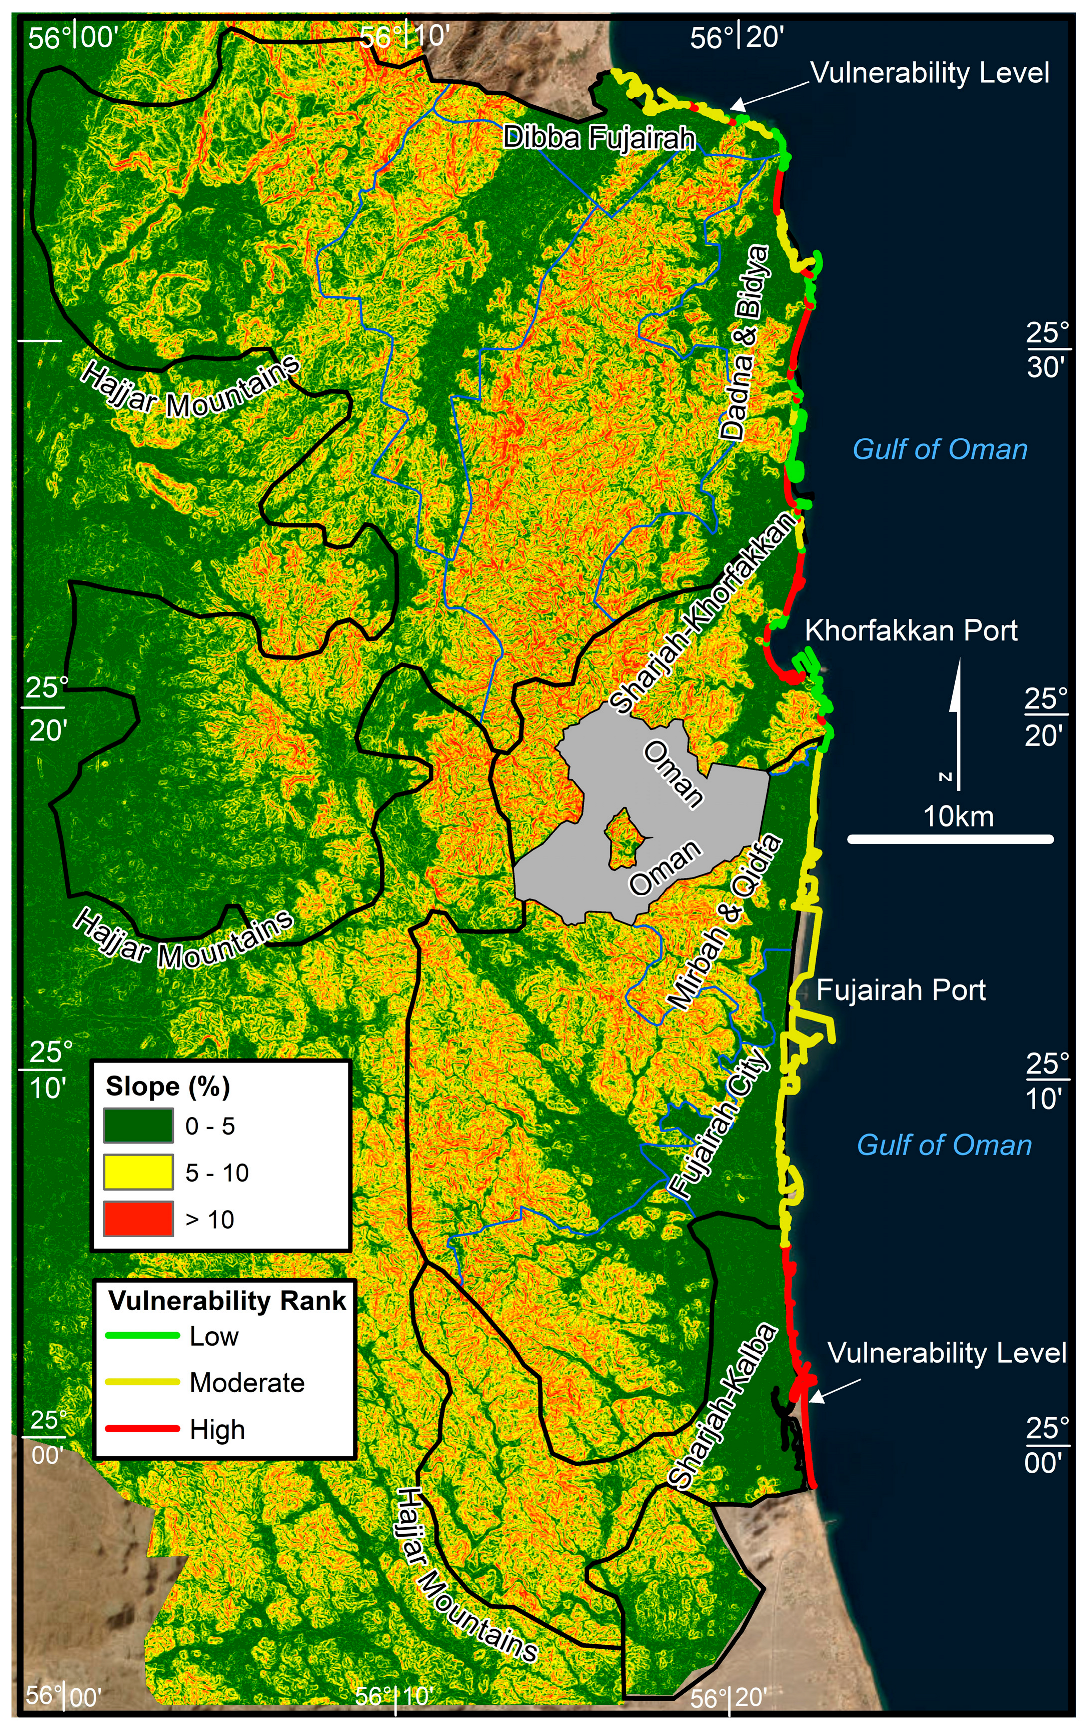
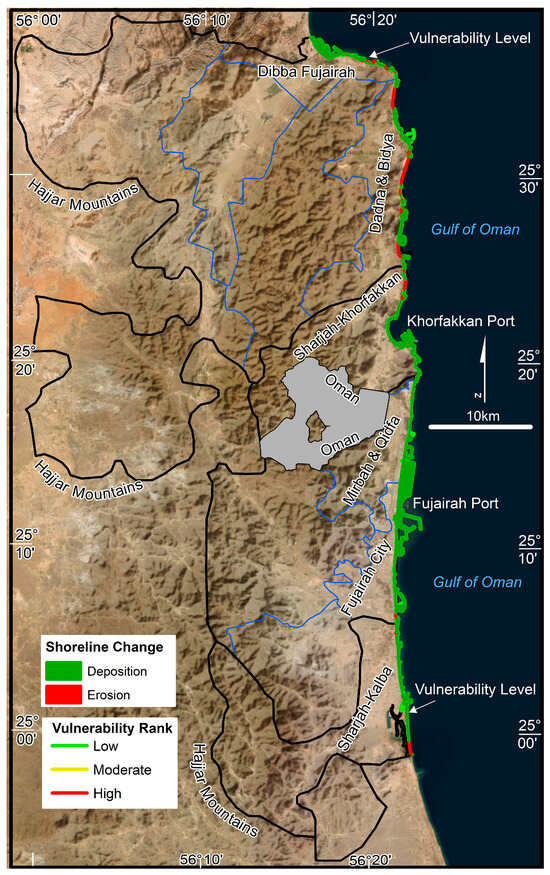
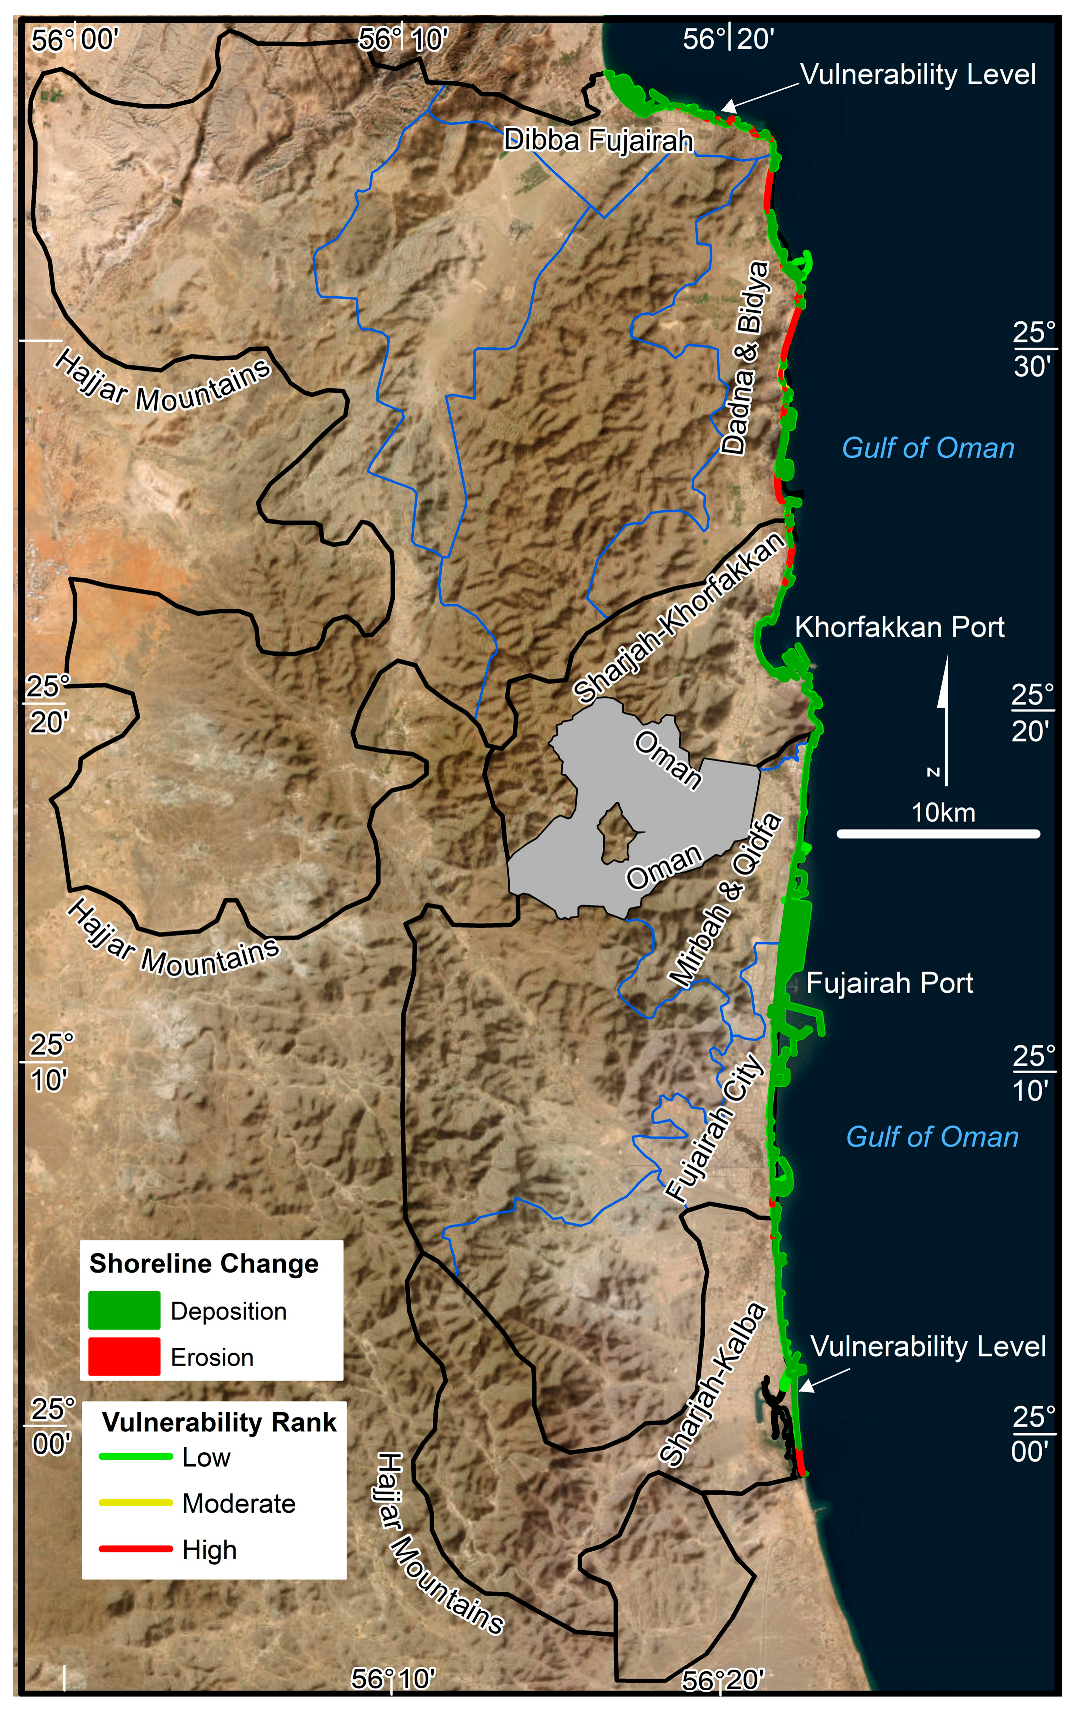
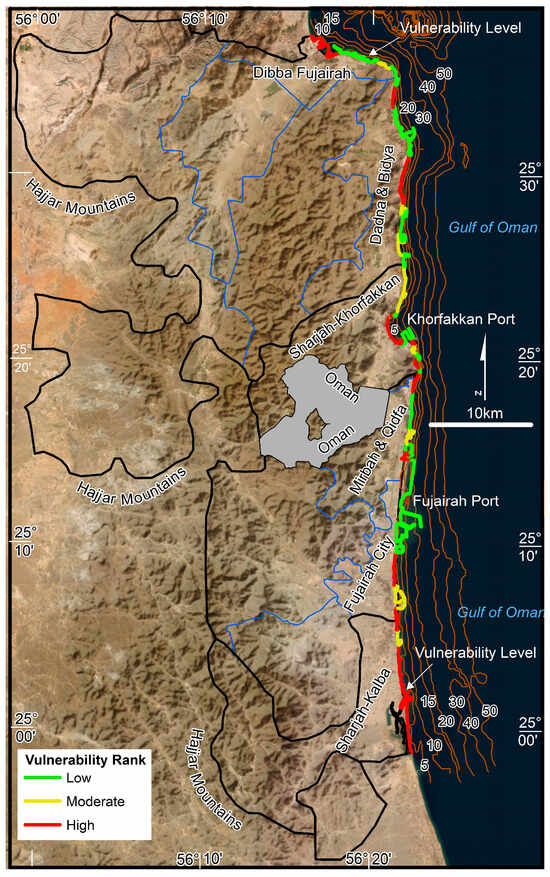
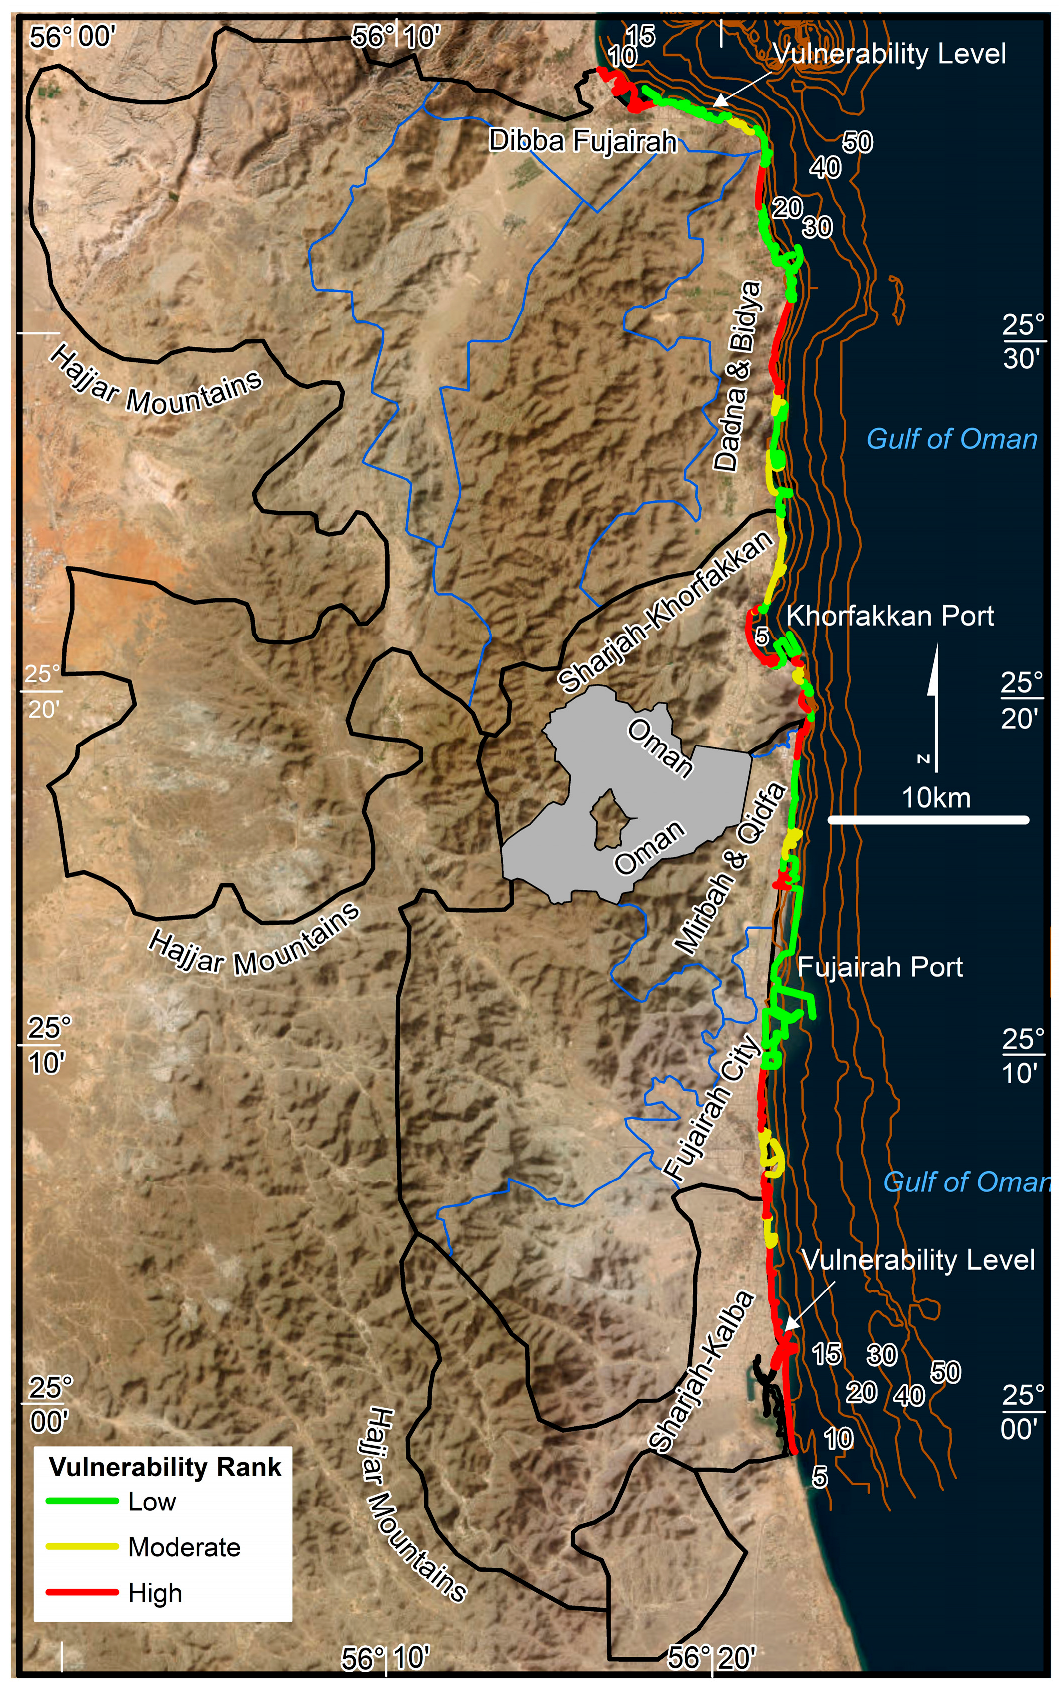
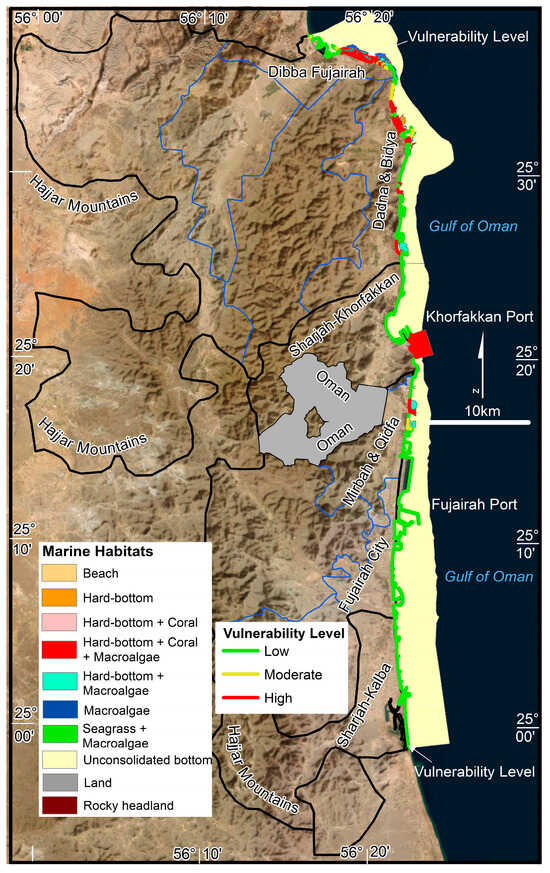
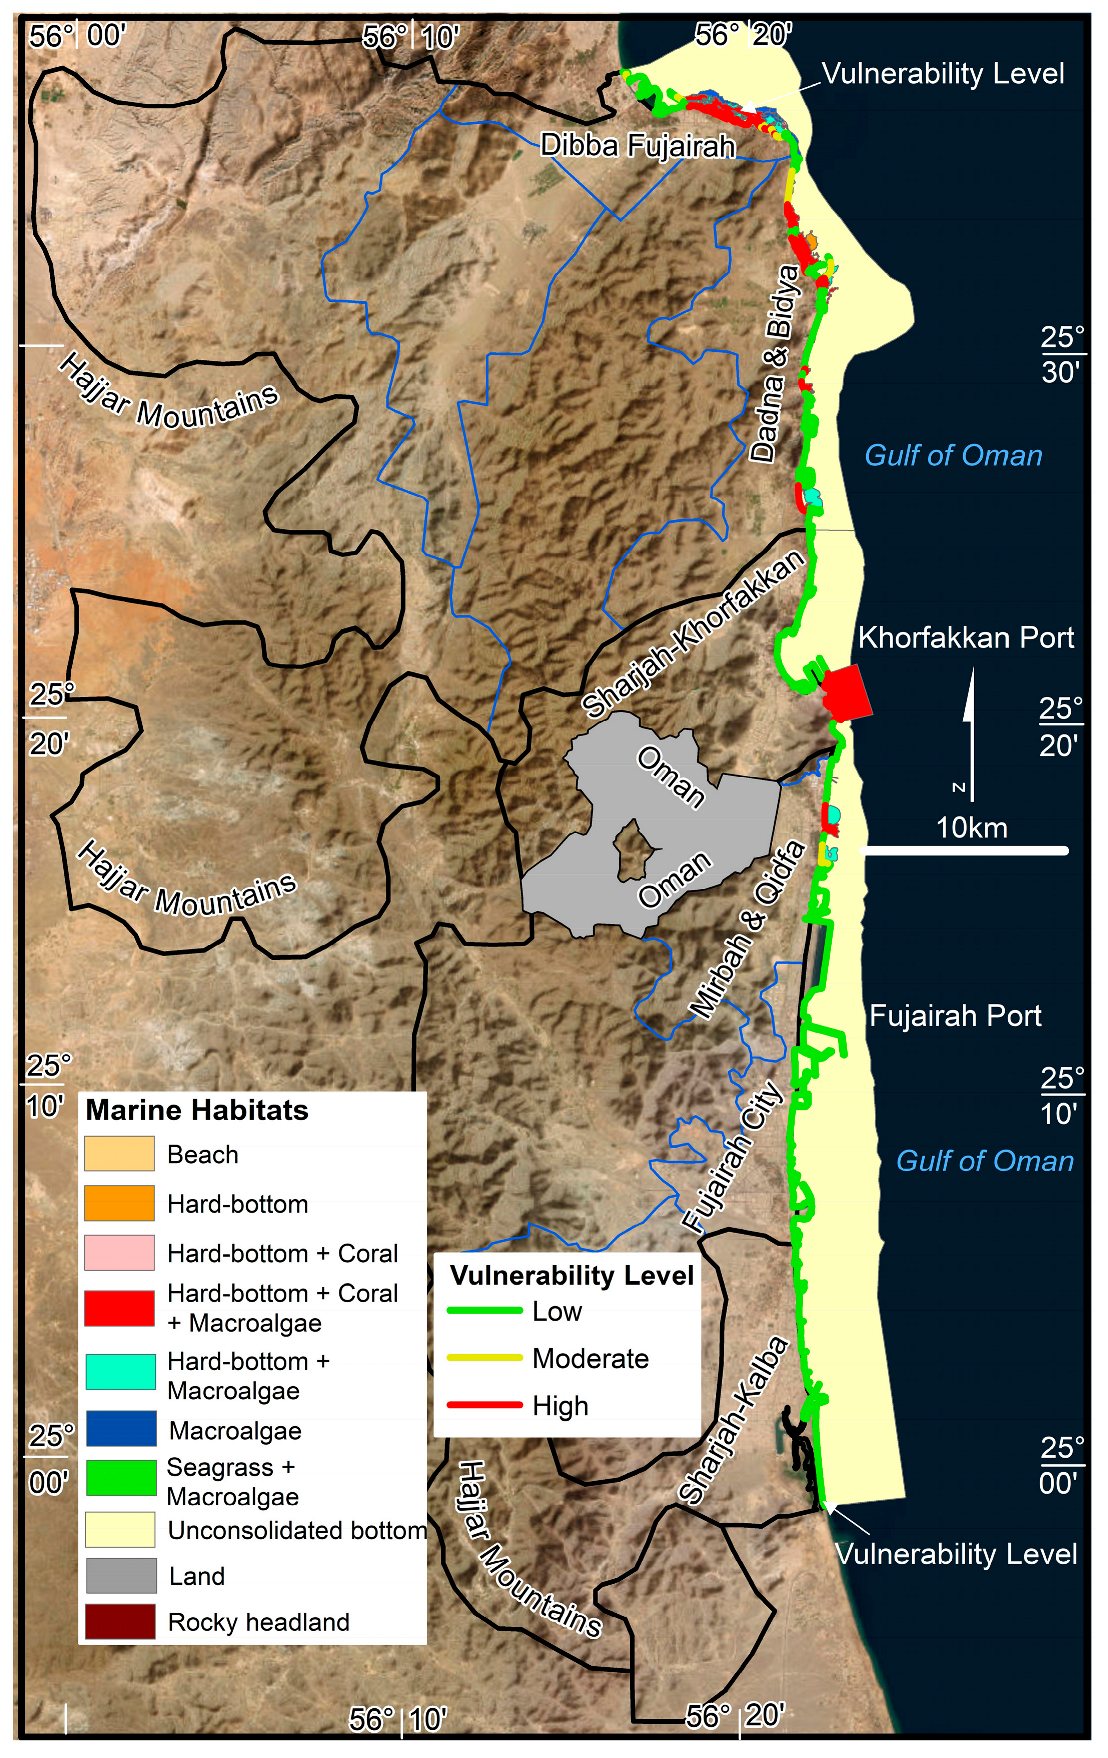
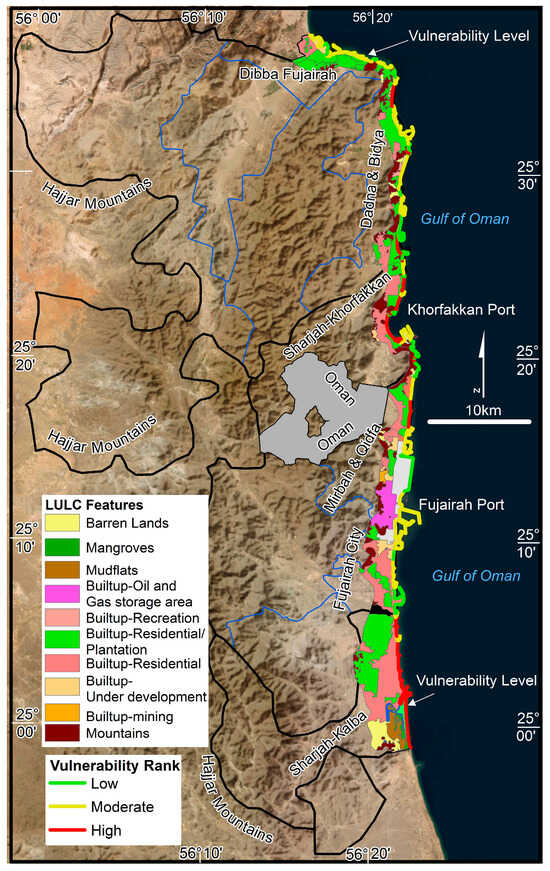
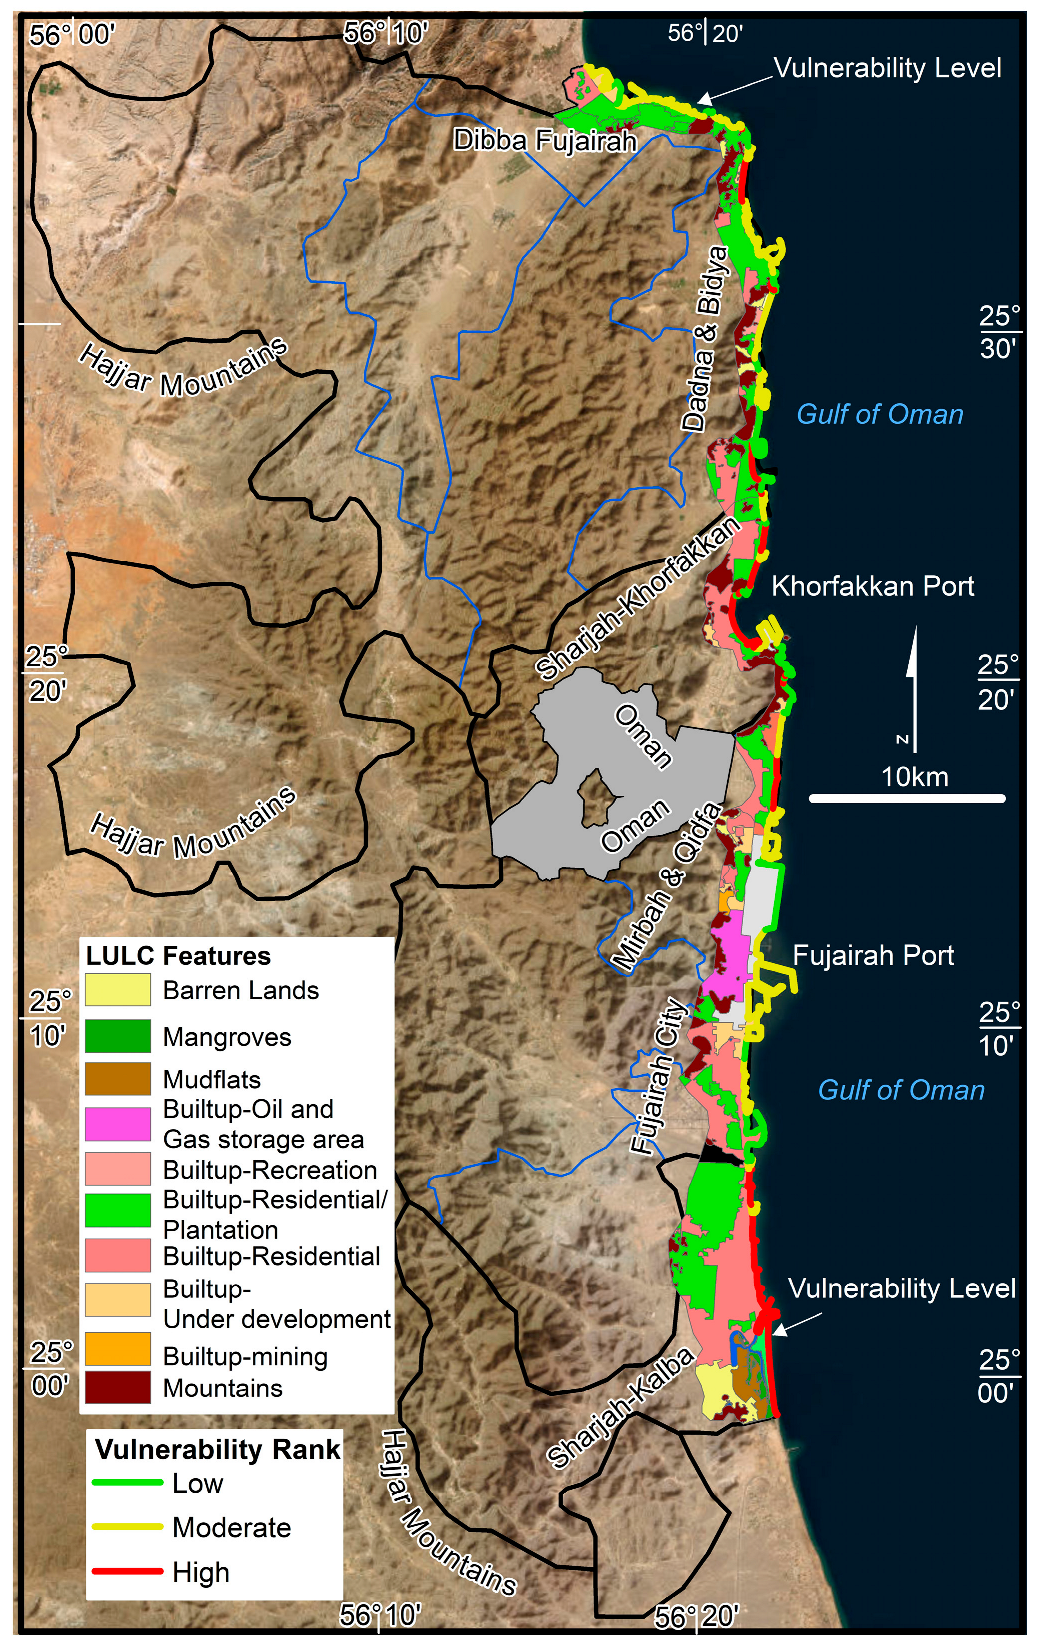
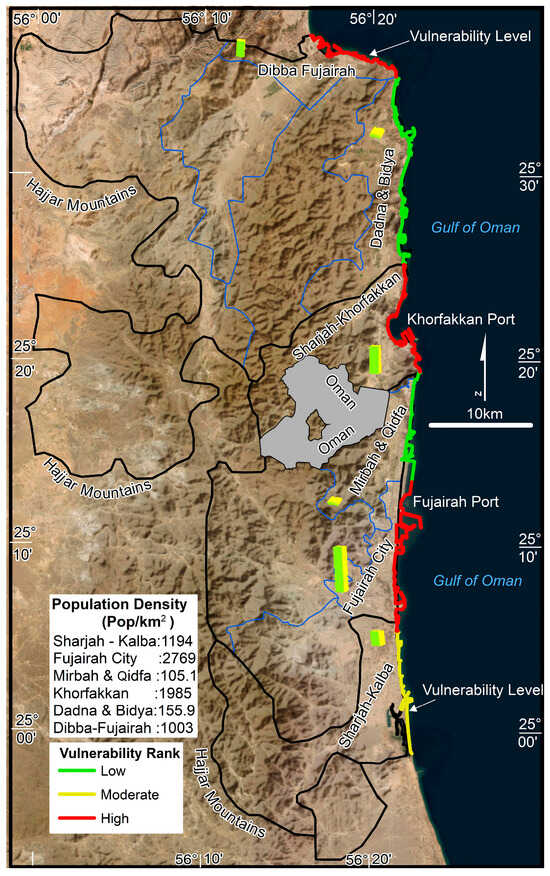
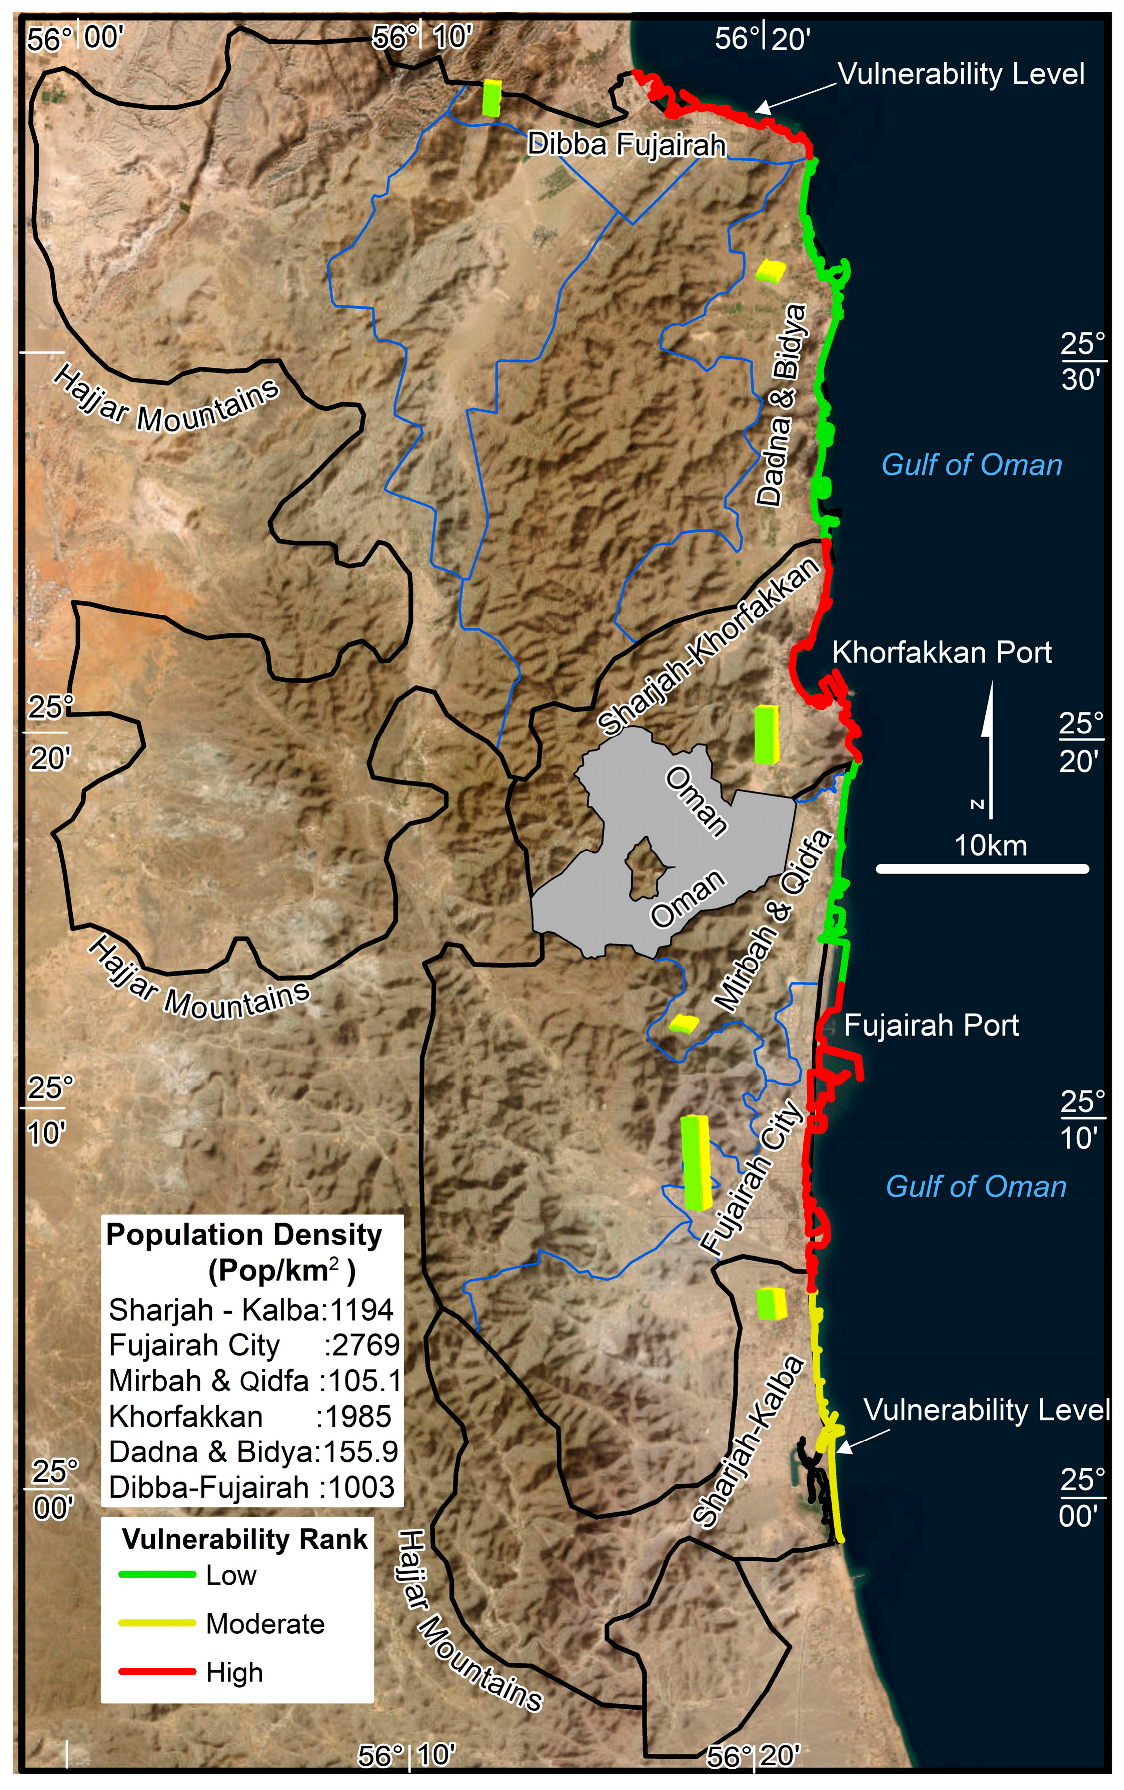
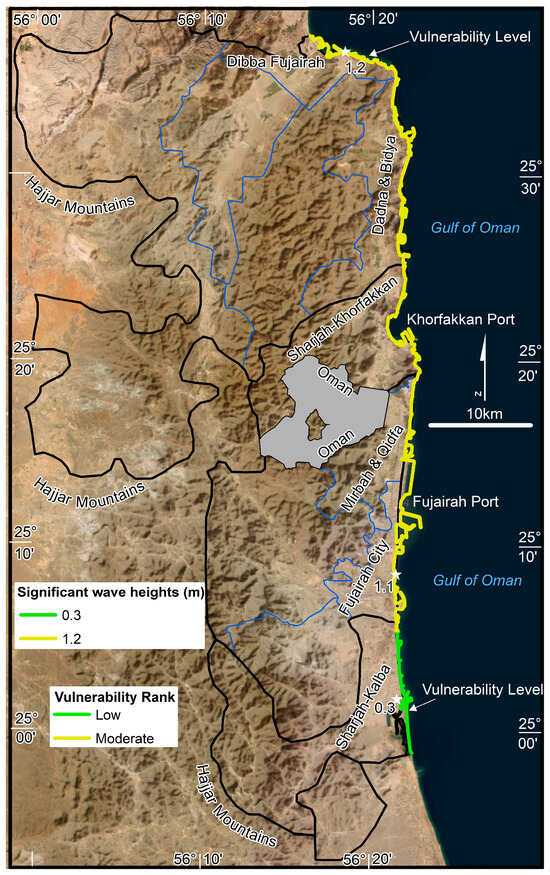
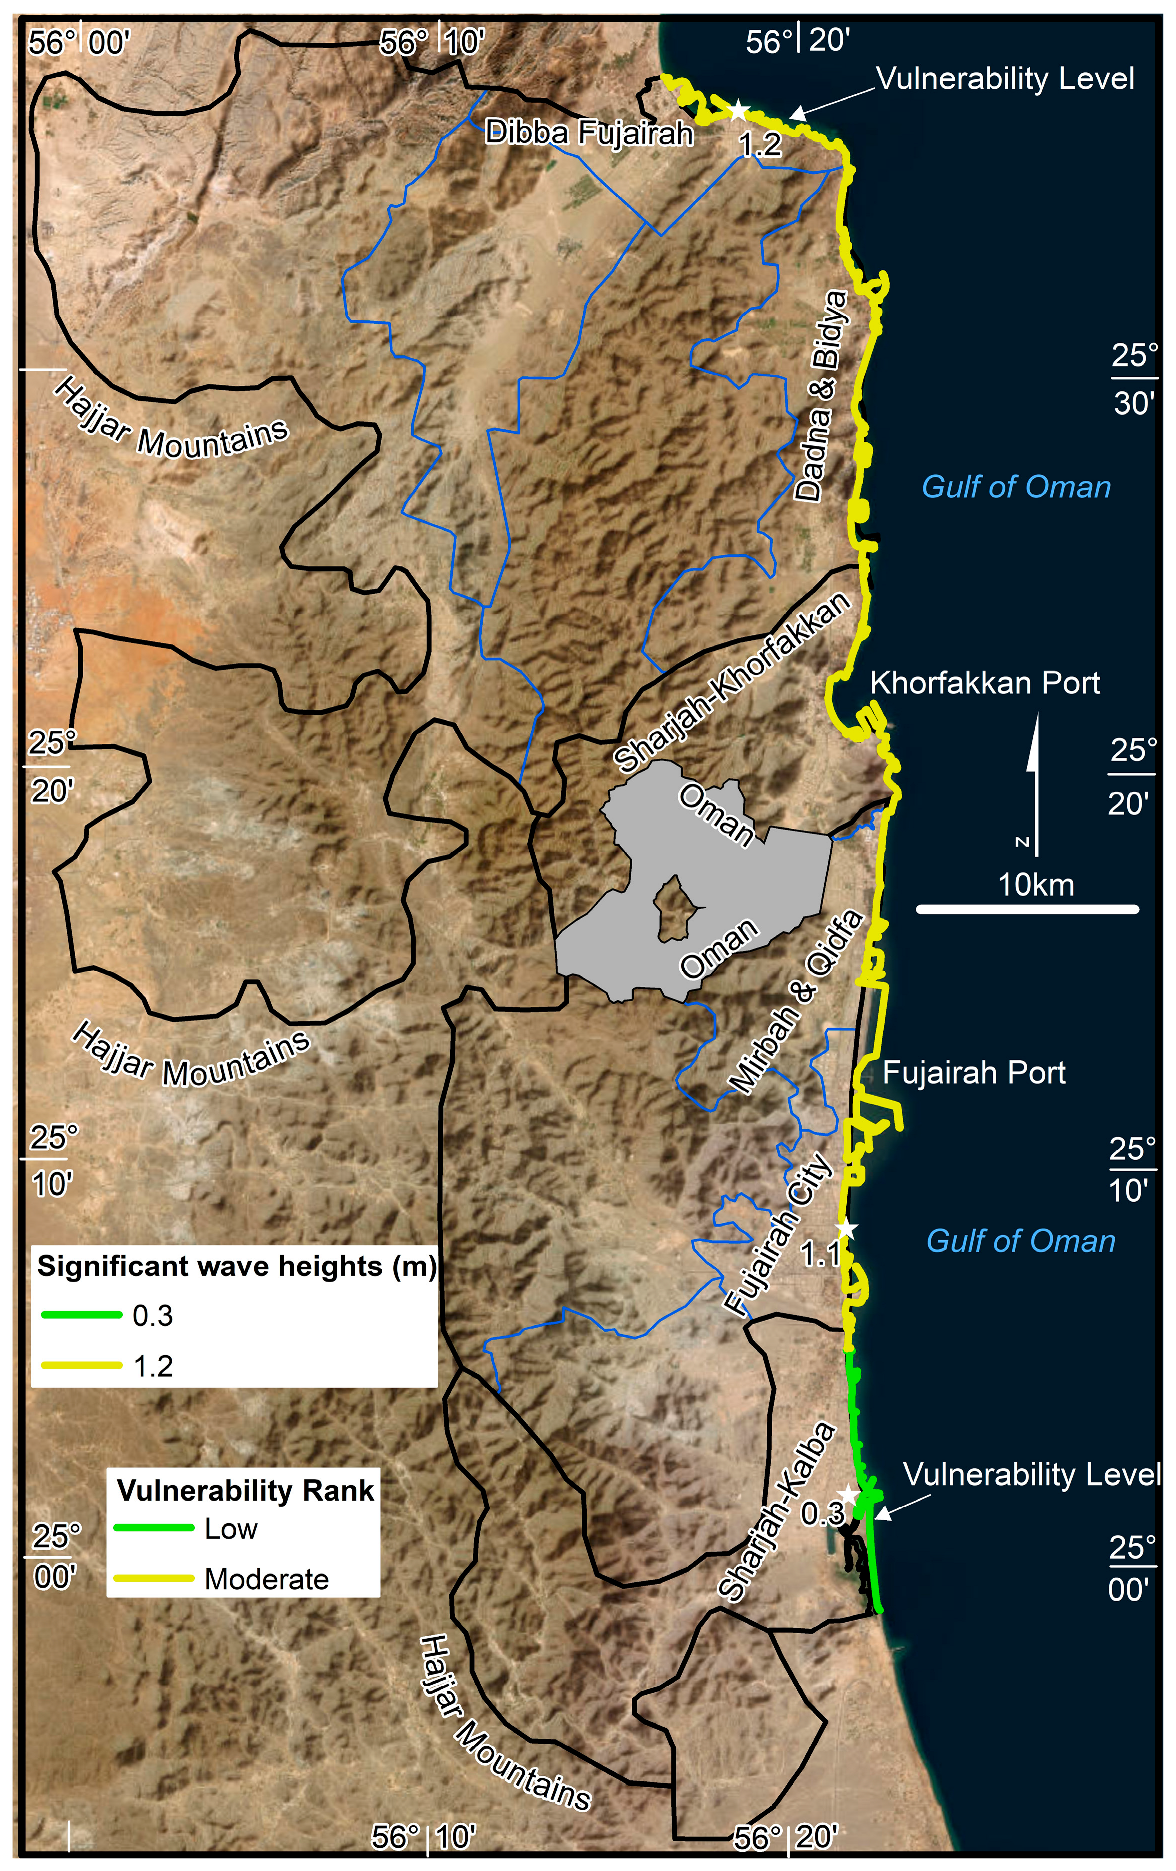
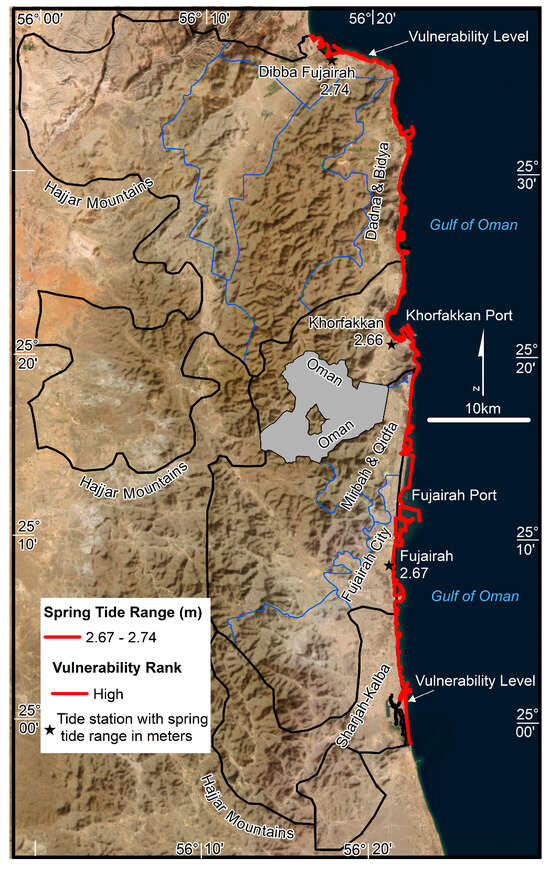
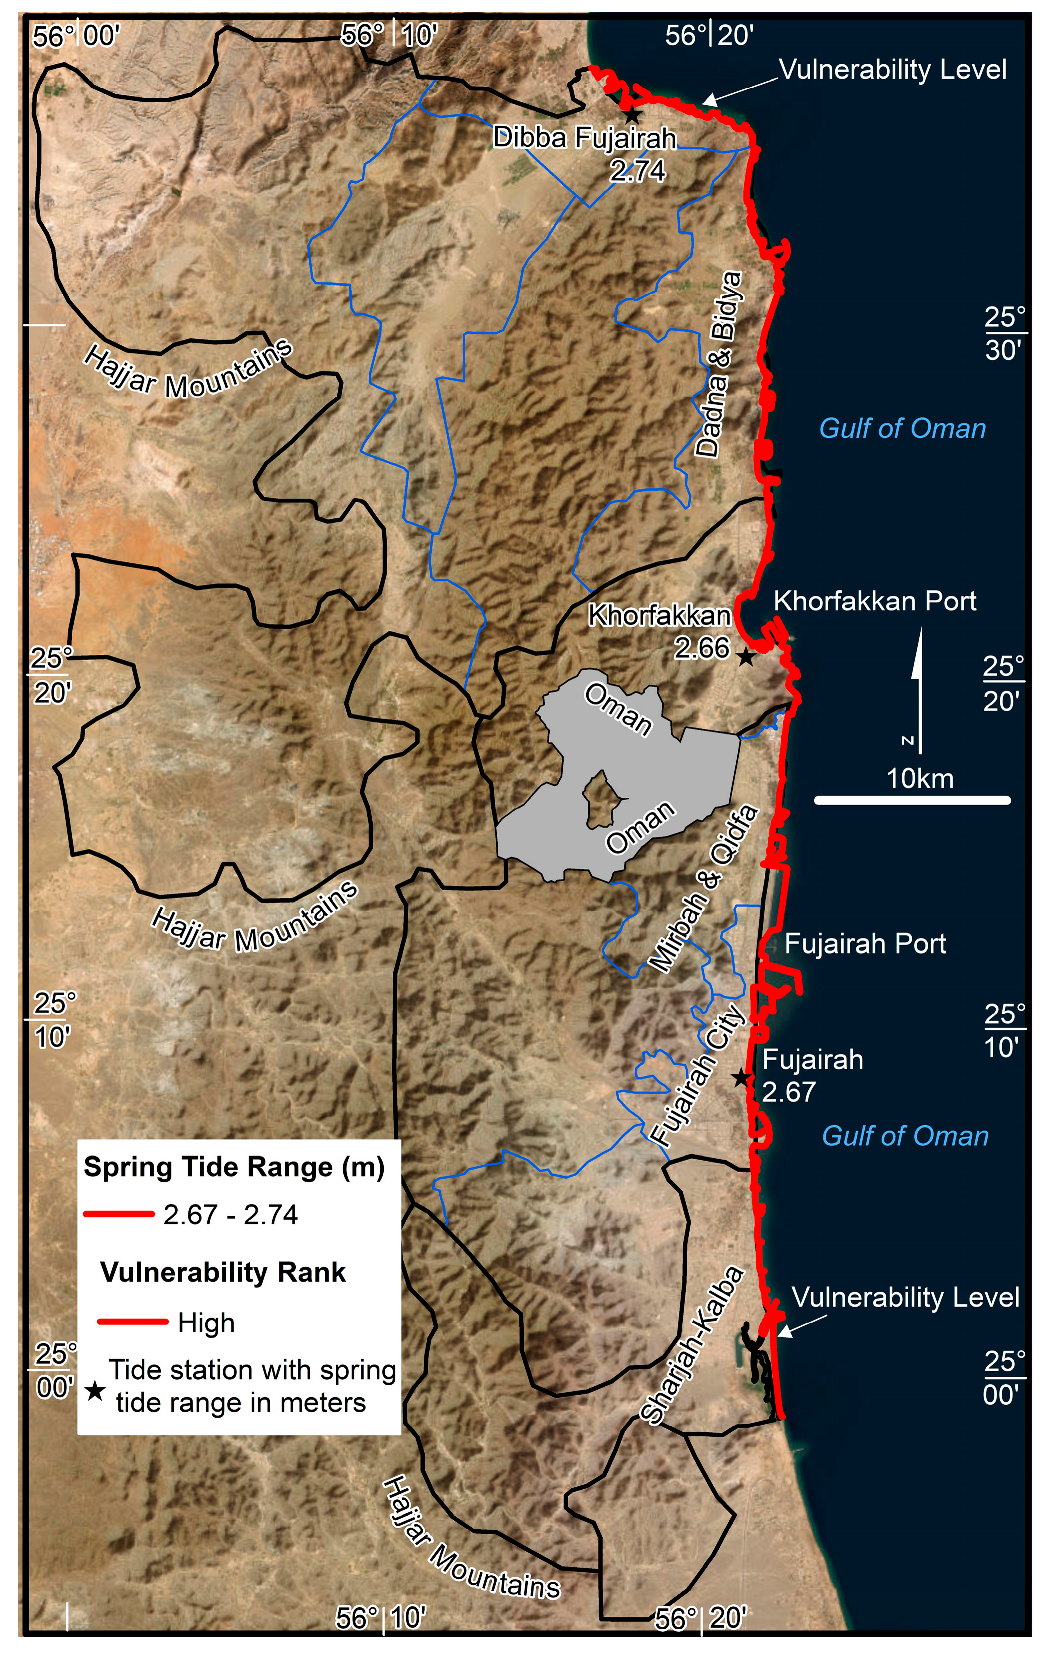
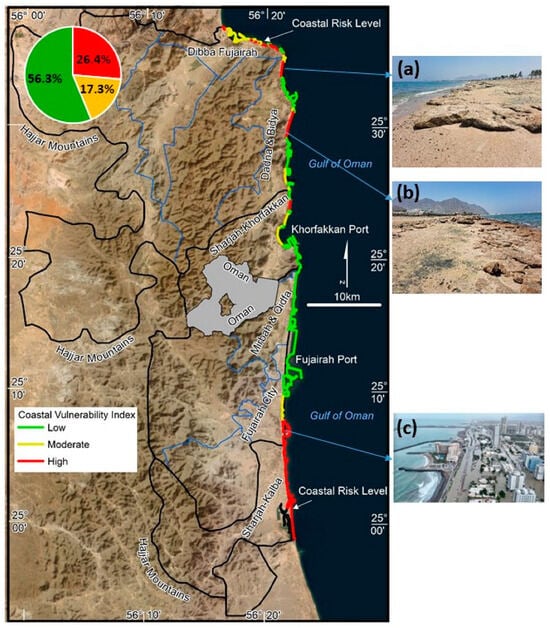
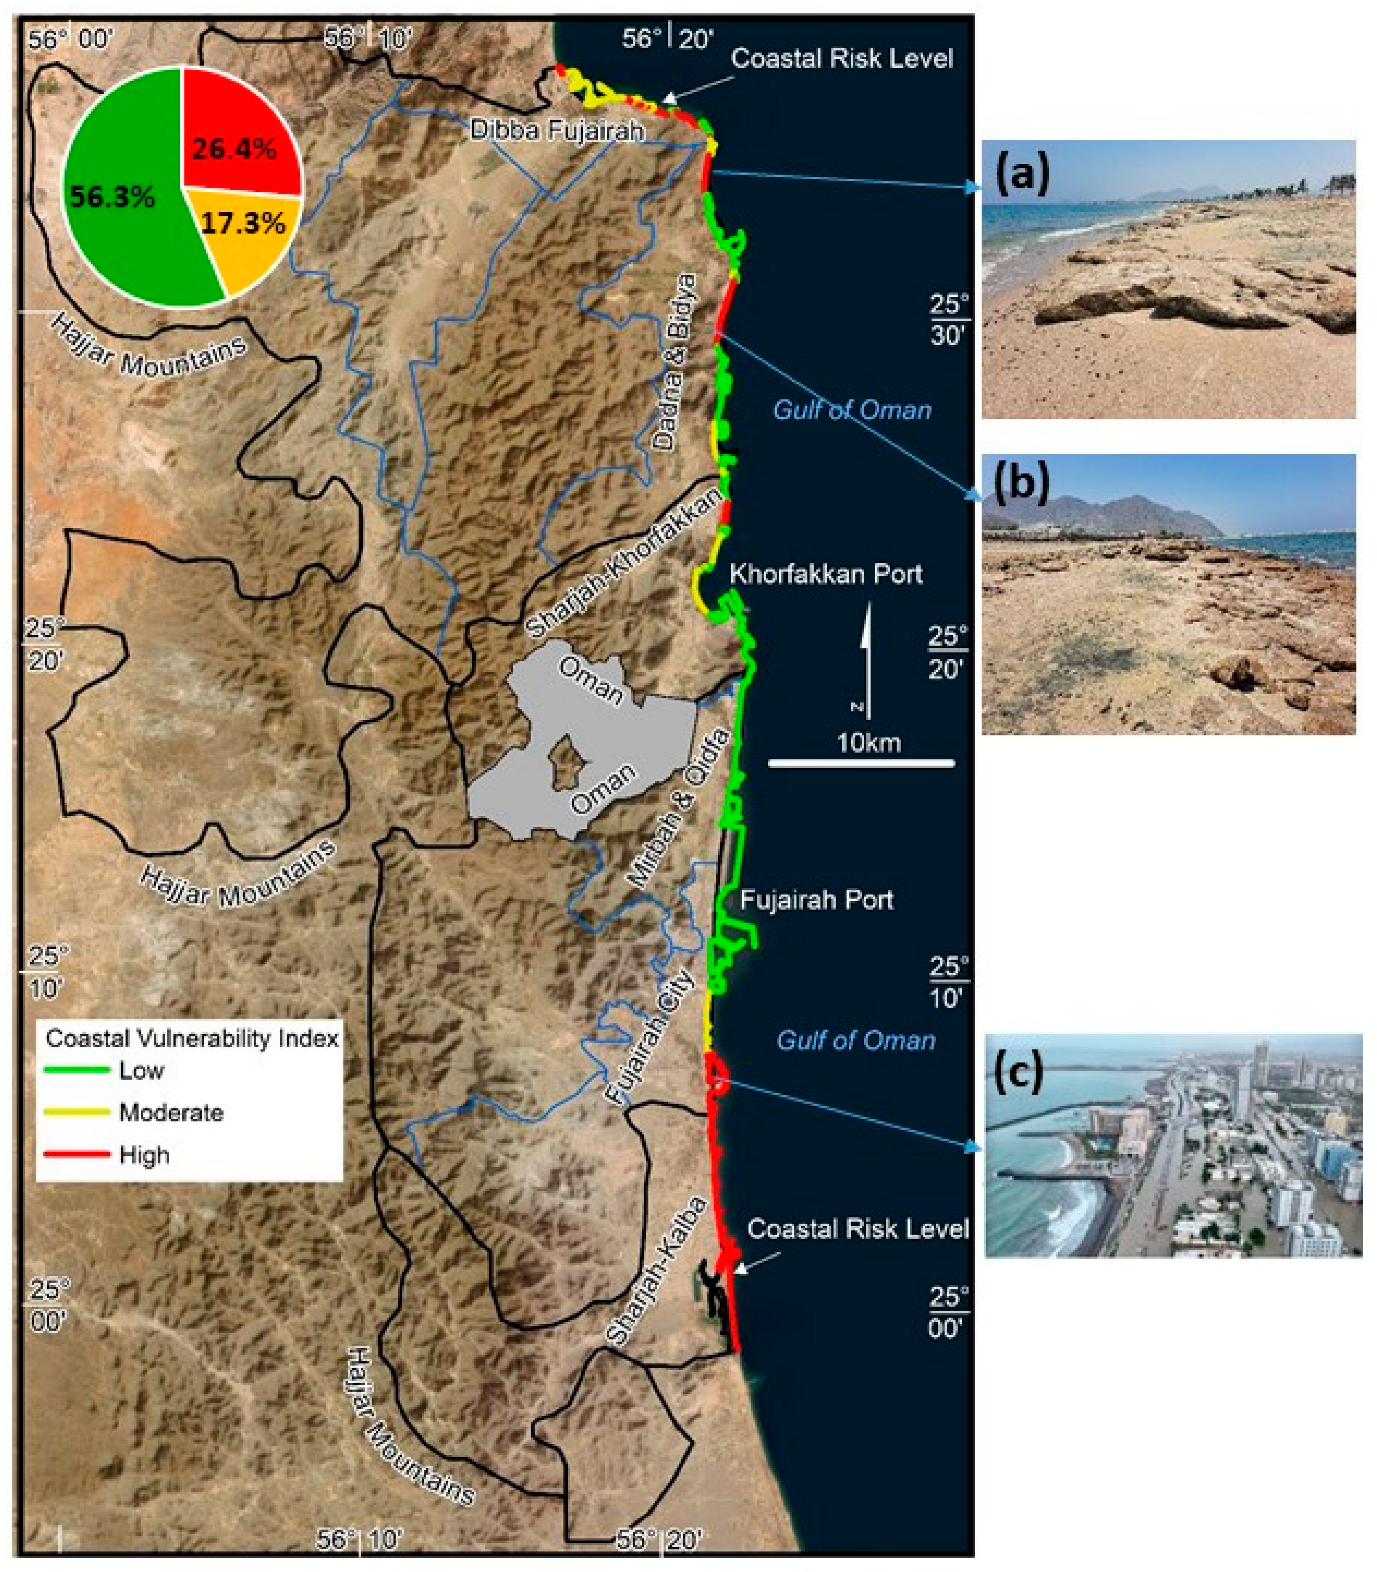
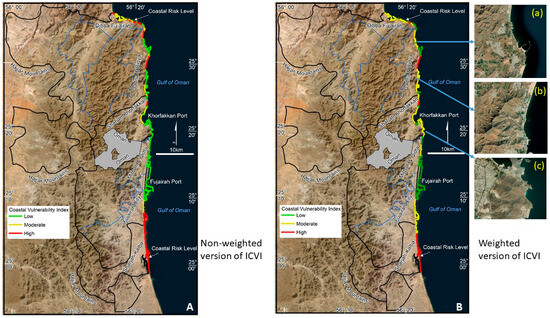
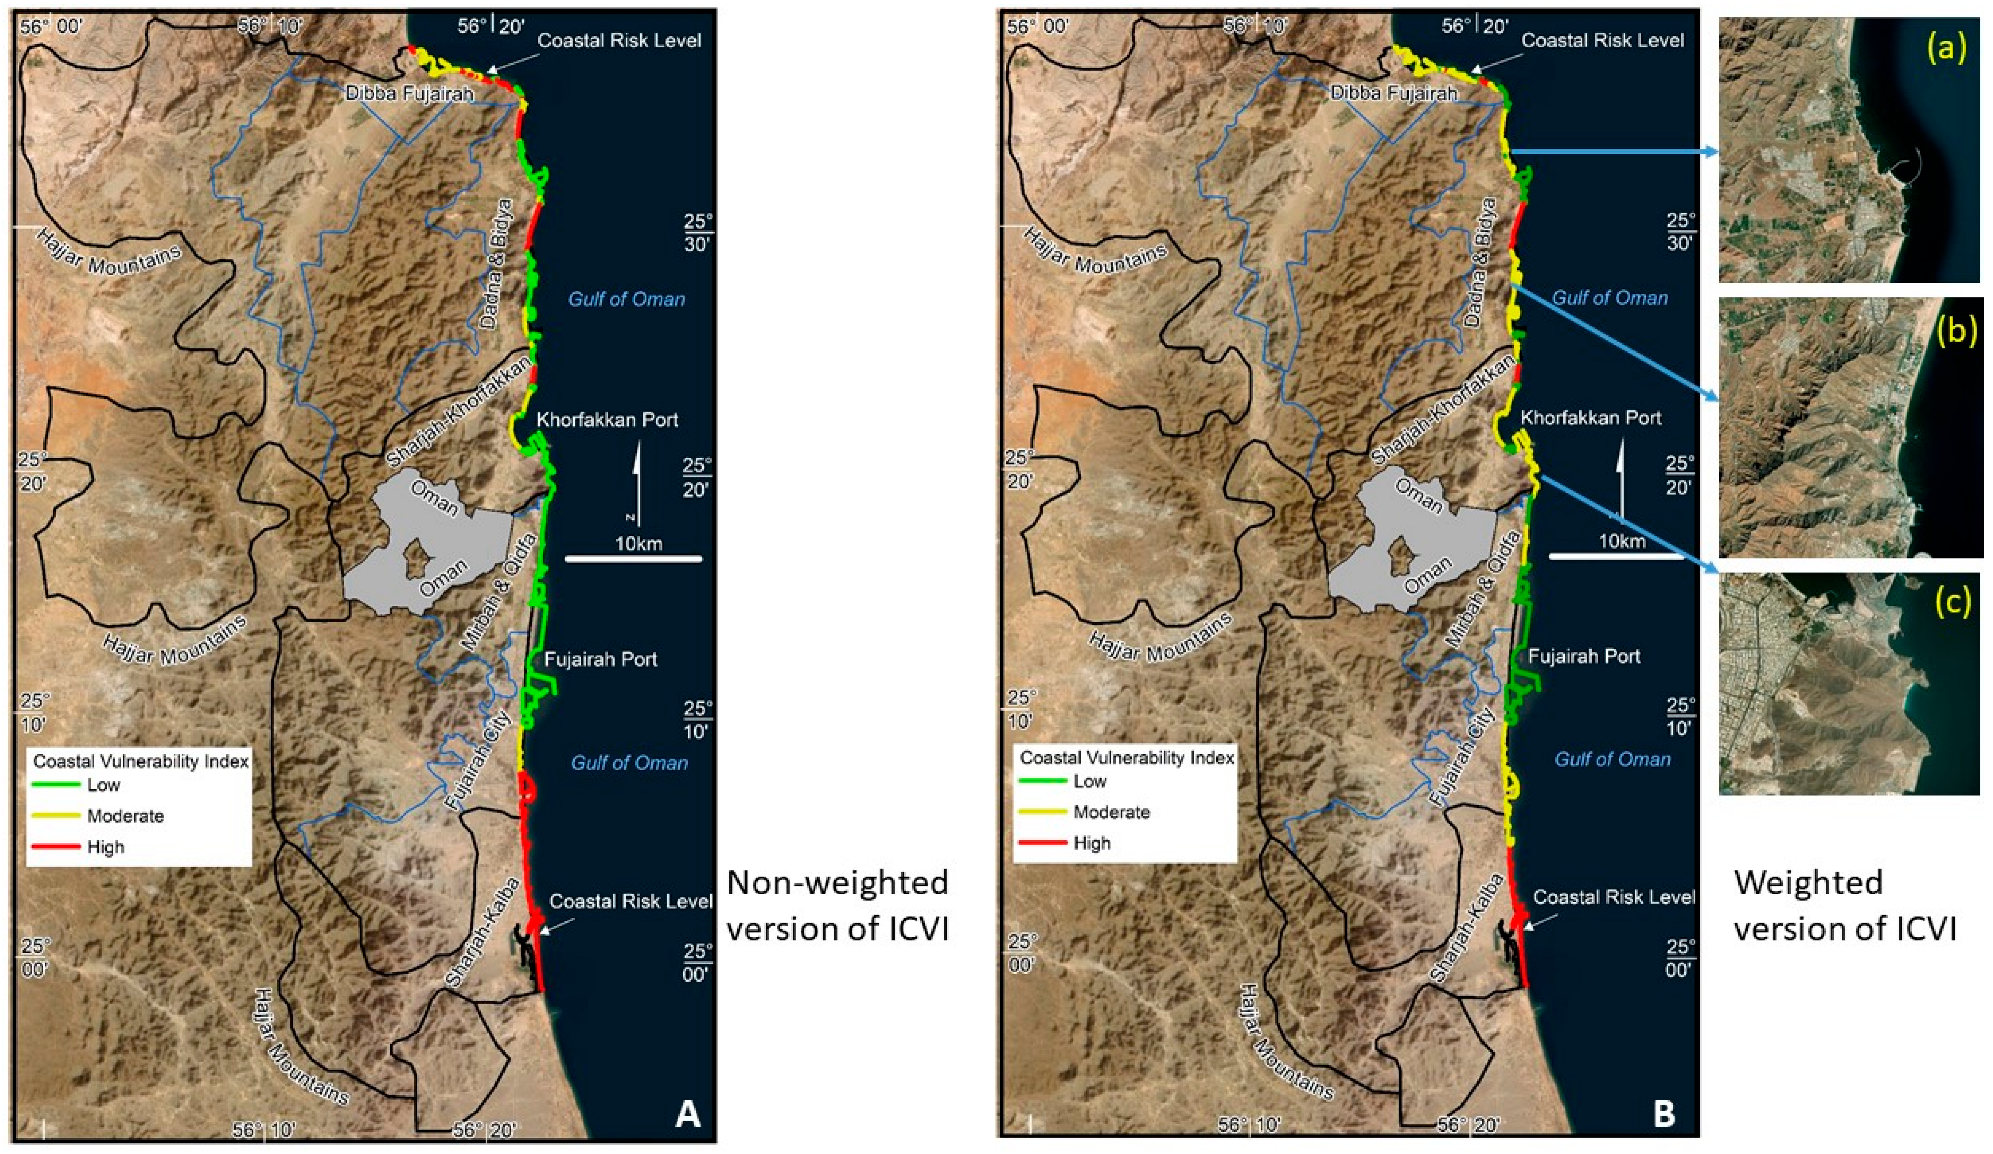
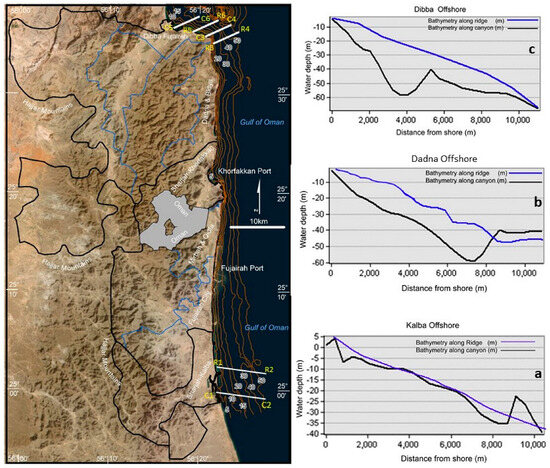
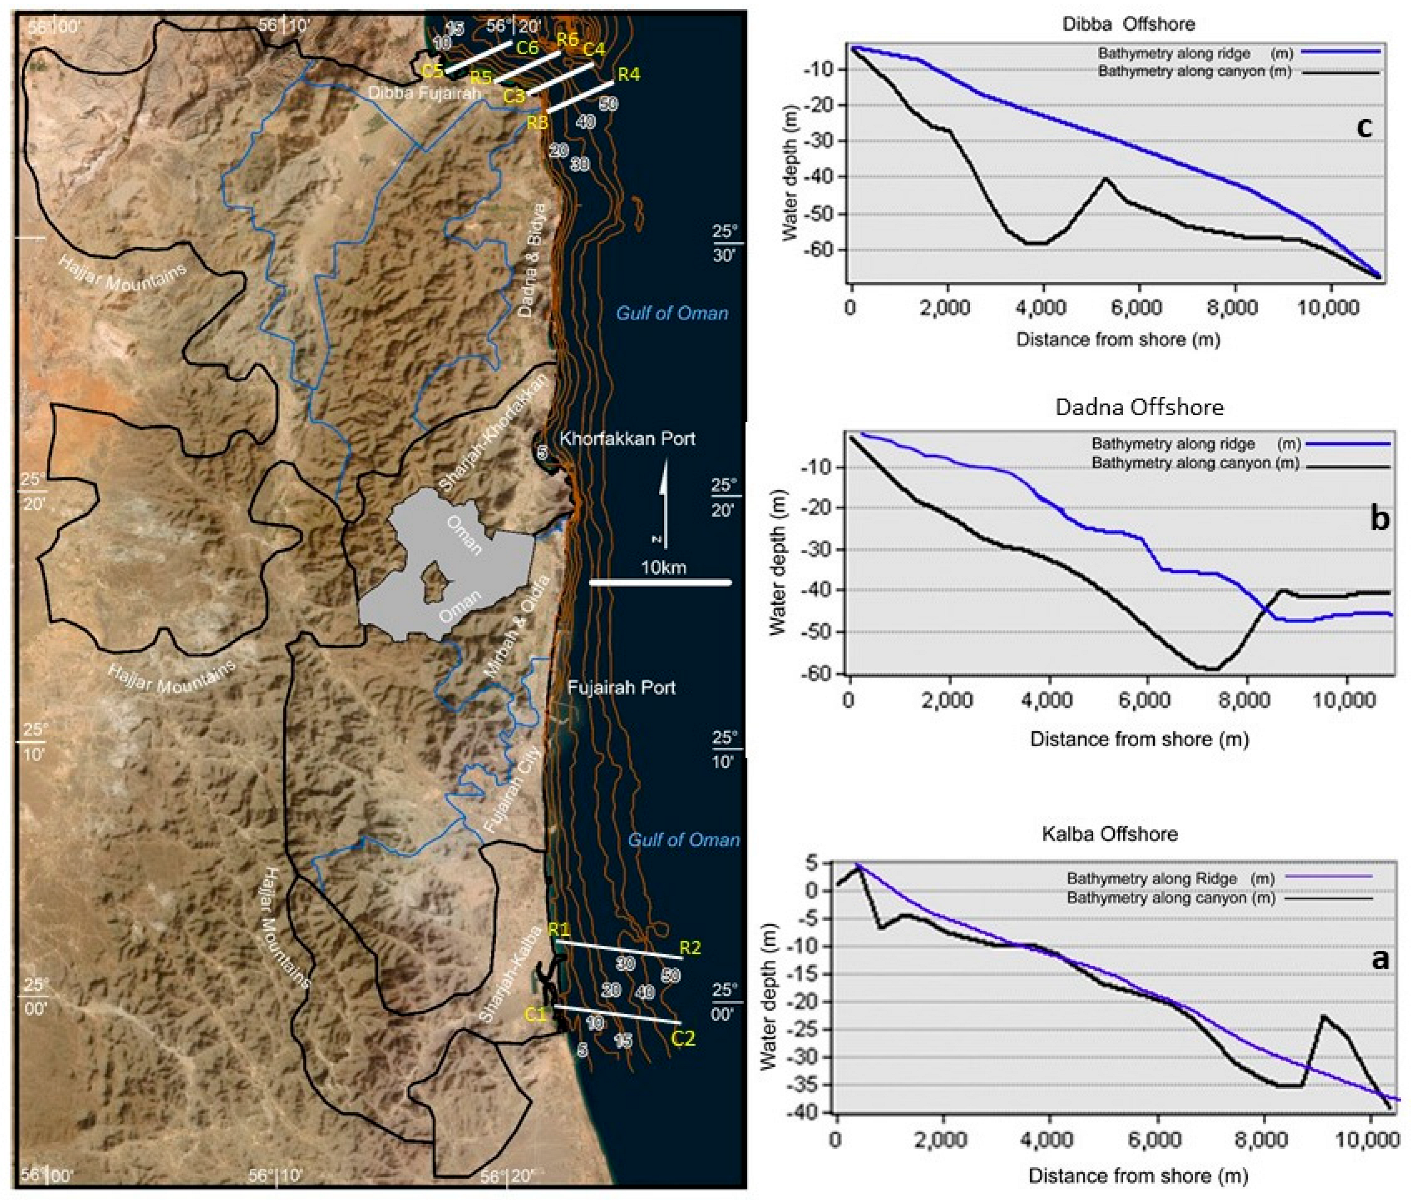
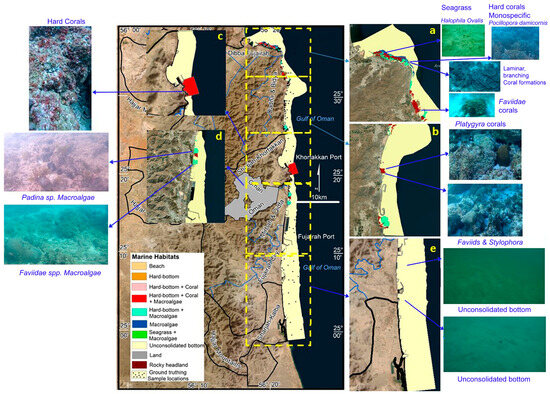
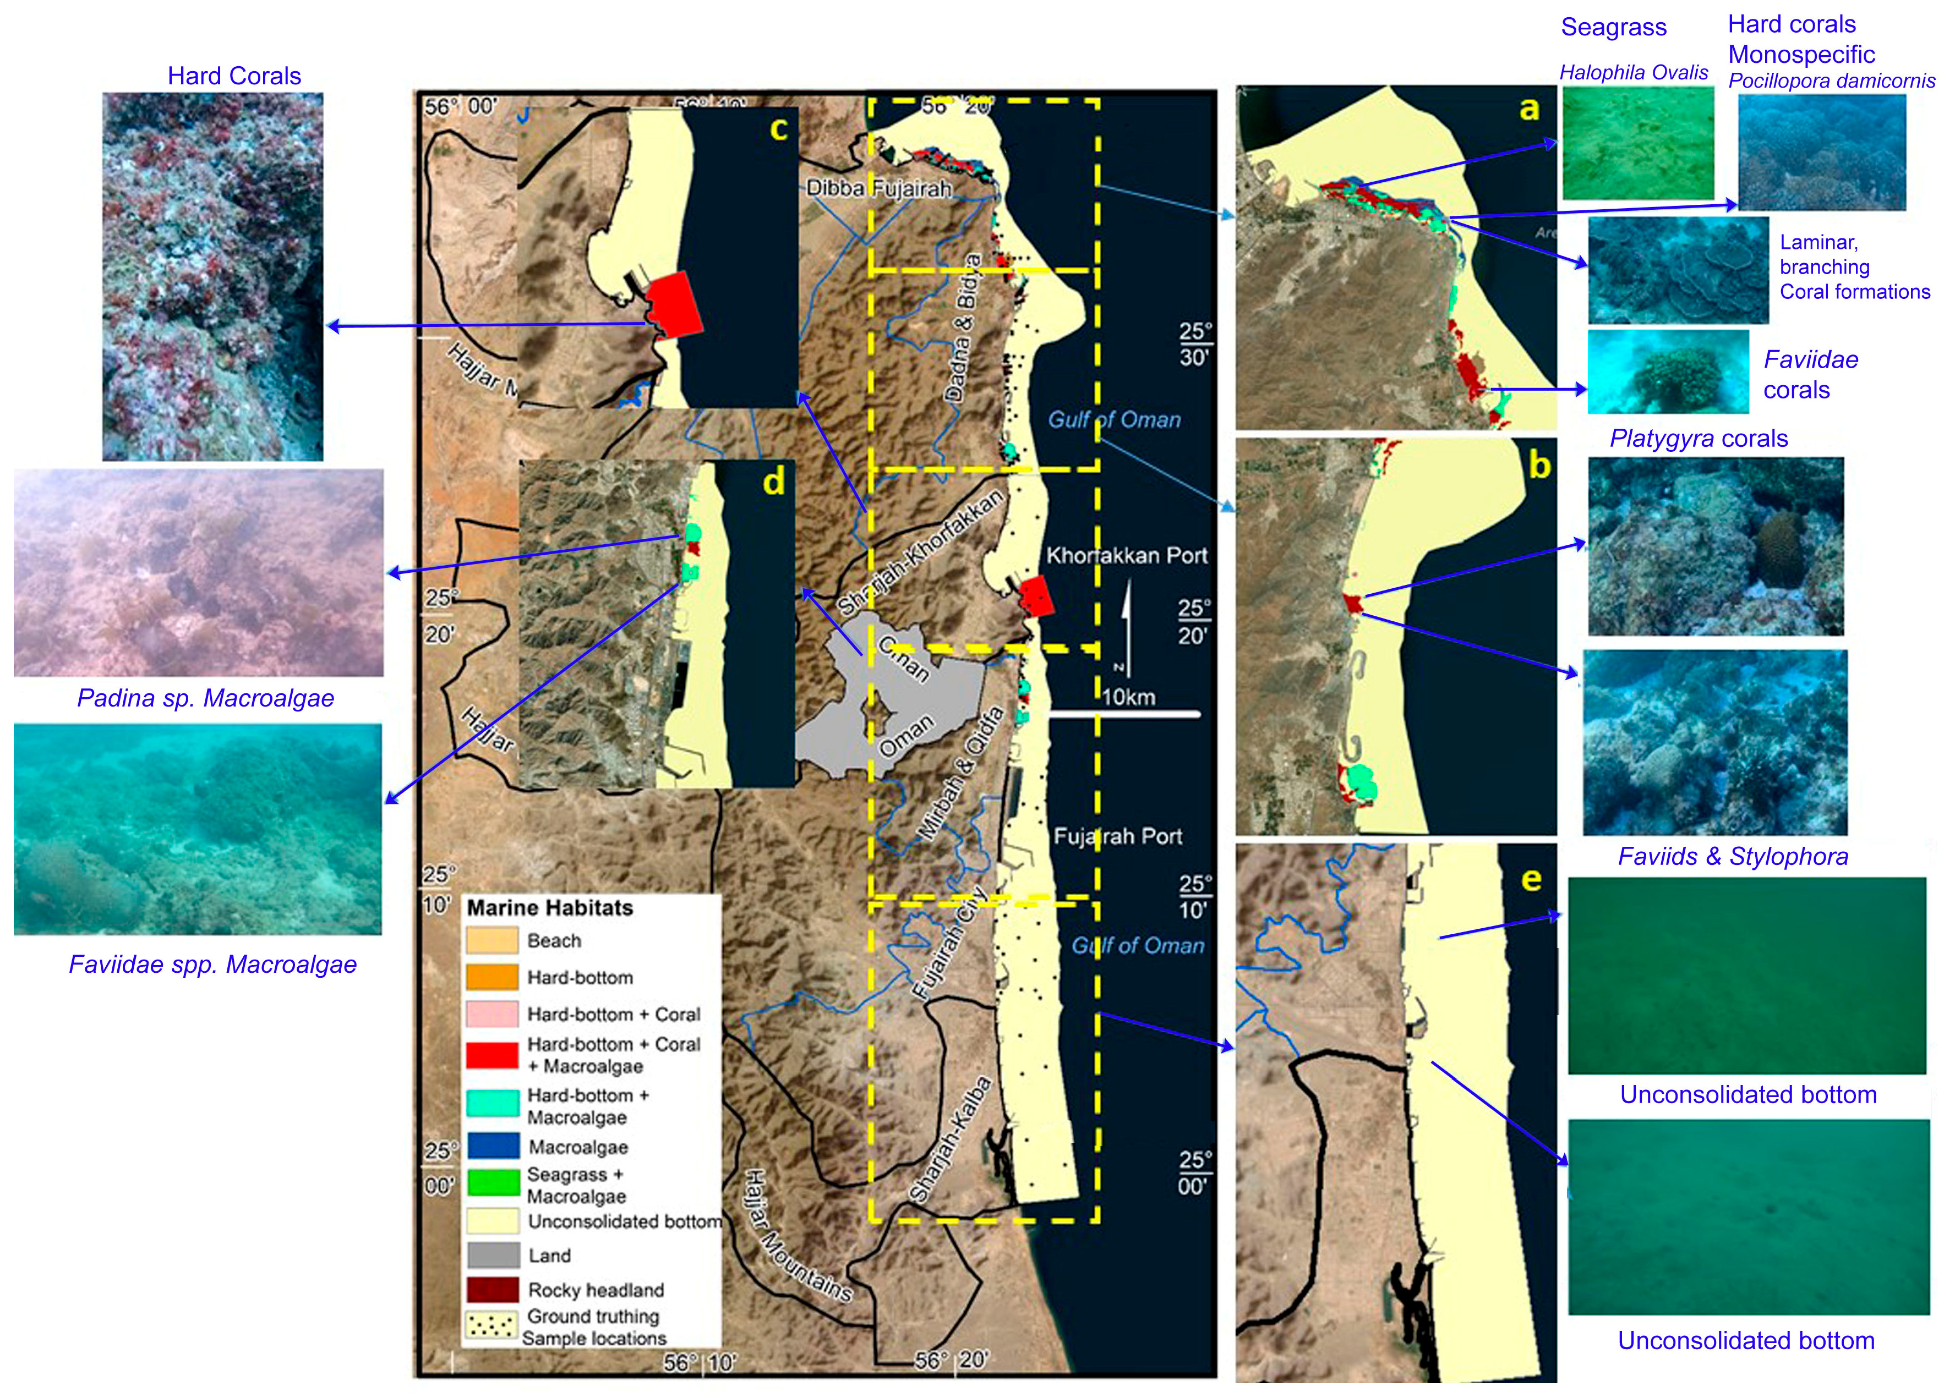
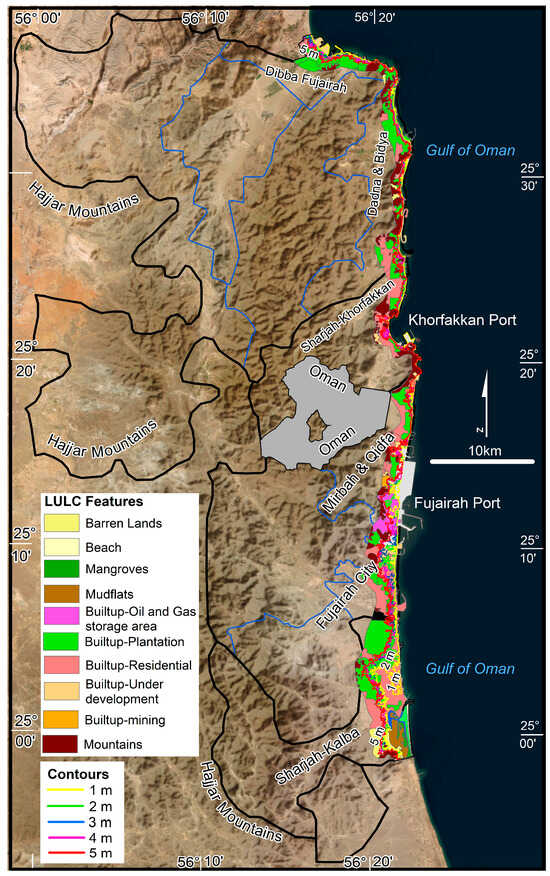
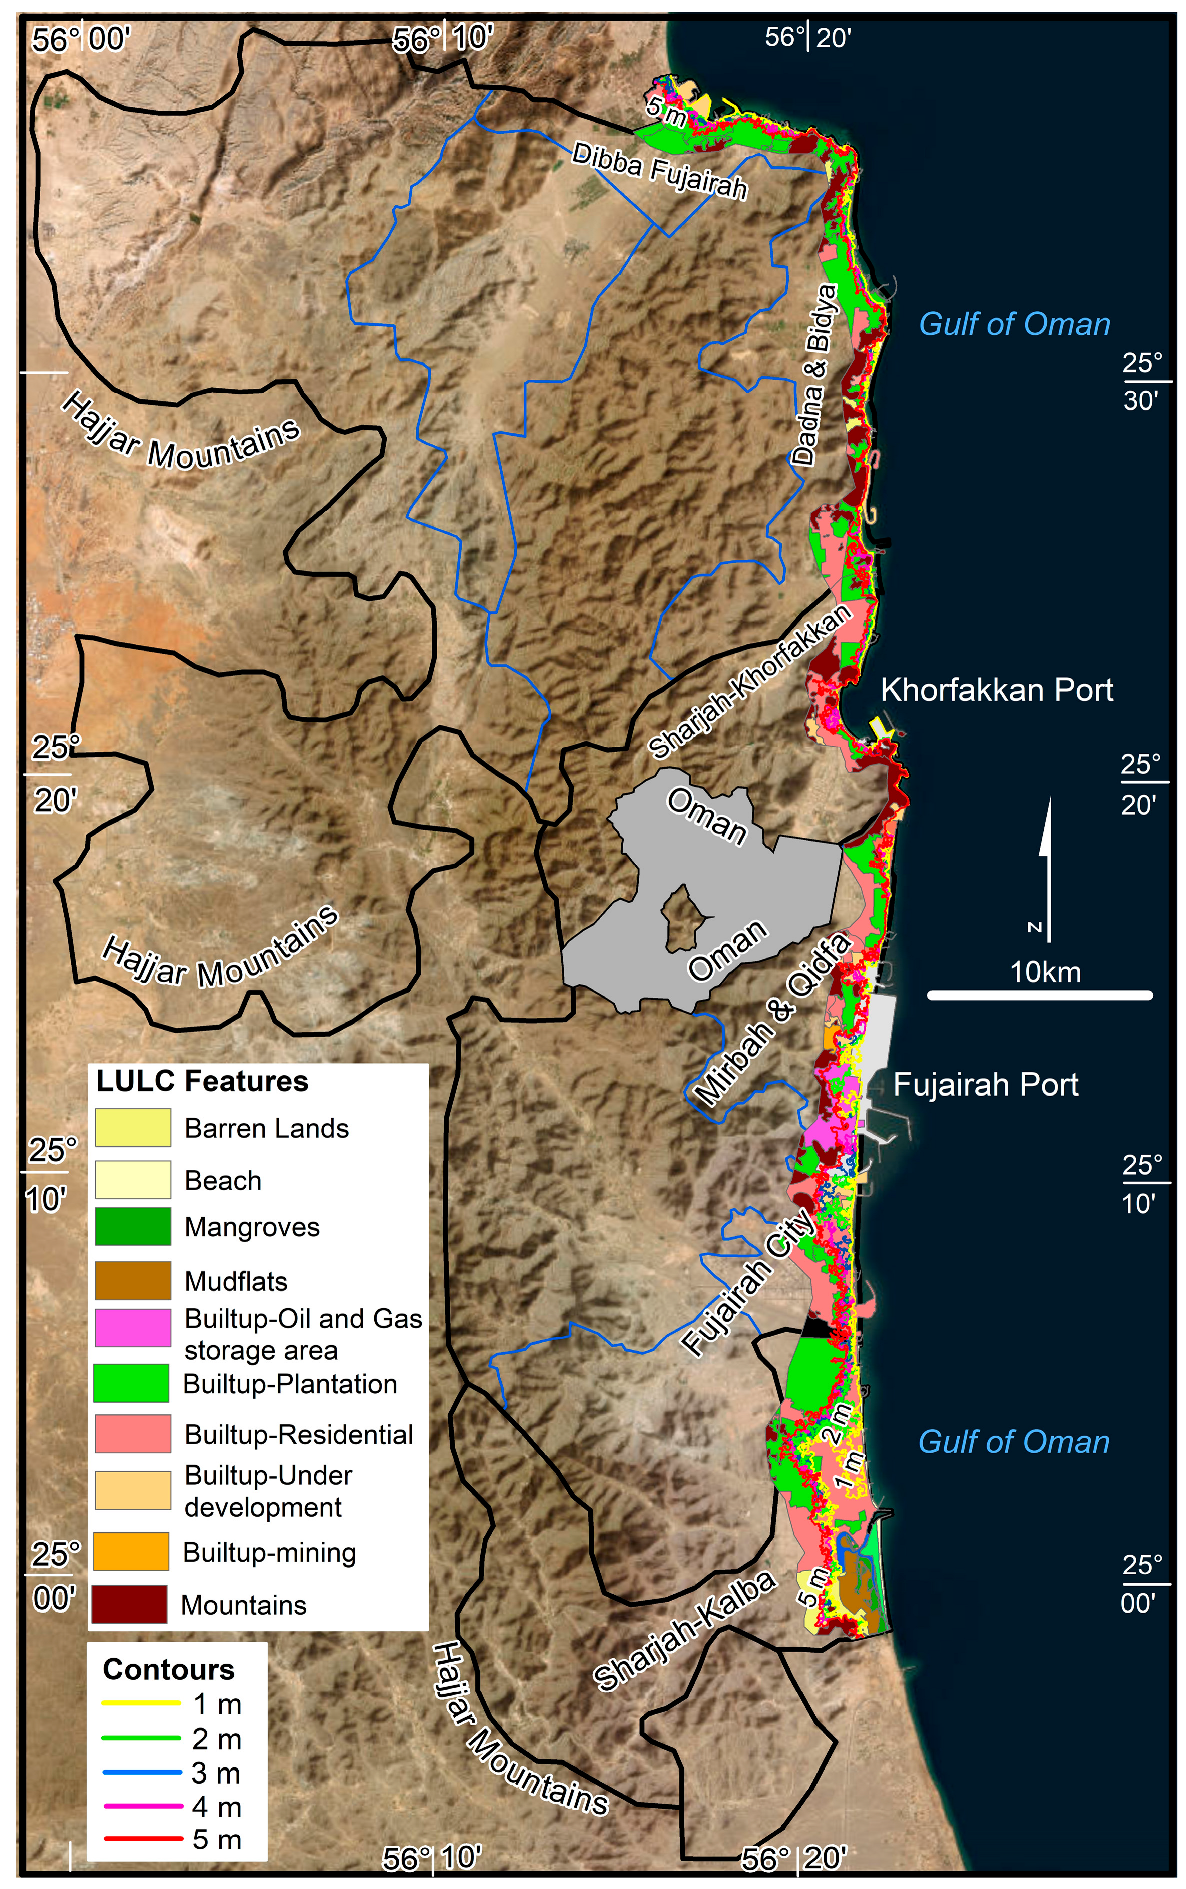

Disclaimer/Publisher’s Note: The statements, opinions and data contained in all publications are solely those of the individual author(s) and contributor(s) and not of MDPI and/or the editor(s). MDPI and/or the editor(s) disclaim responsibility for any injury to people or property resulting from any ideas, methods, instructions or products referred to in the content. |
© 2026 by the authors. Licensee MDPI, Basel, Switzerland. This article is an open access article distributed under the terms and conditions of the Creative Commons Attribution (CC BY) license.