Abstract
Microbial communities play a crucial role in coastal ecosystem function, yet their seasonal and spatial dynamics in response to environmental change remain underexplored in tropical and subtropical regions. This yearlong study investigated microbial composition in water, sinking particles, and sediments along an inshore–offshore gradient influenced by the Caloosahatchee River Estuary in southwest Florida. The region has been altered by rapid coastal development and was struck by Hurricane Ian in September 2022. Environmental parameters exhibited significant spatiotemporal variation, shaping microbial beta diversity in all habitats. Sediment communities showed the greatest hurricane-induced disruption but returned to pre-disturbance conditions within six months. Dominant microbial classes included Alphaproteobacteria, Bacteroidia, and Gammaproteobacteria. Biogeochemical cycling taxa displayed strong habitat specificity, such as Desulfobulbia which dominated sinking particles, Desulfobacteria which was abundant in sediments, and Nitrosomonadaceae and Nitrosopumilaceae which were key nitrifiers in water and sediments, respectively. Particle–sediment taxonomic overlap suggests resuspension processes. Several inshore microbial indicators were consistently present across microbial habitats, especially at estuarine sites, suggesting the estuary as a microbial diversity reservoir for the coastal zone. These results highlight the value of long-term microbial monitoring to understand ecosystem change and resilience in dynamic coastal environments.
1. Introduction
Anthropogenic activity and coastal development significantly impact the environment by increasing nutrient, organic matter, and pollutant loads to the coastal zone, leading to habitat degradation that threatens ecologically and economically important fisheries [1] and vital ecosystem services [2]. The southwest Florida (SWFL) coast experiences altered hydrology due to channelization, dredging, and dam structures connecting the Caloosahatchee River (CR) to Lake Okeechobee, and accommodating a rapidly growing population [3,4].
SWFL population growth is expecting to continue, which will lead to increases in wastewater contamination via septic tanks and overloaded sewer systems [5]. Expected population increases are expected to lead to more fertilizer usage in the area, especially in the region’s numerous golf course communities, which require significant nutrient inputs to maintain [6]. In addition, agriculture accounts for 44% of land use on the CR watershed, and agricultural run-off contributes substantial nutrient and organic matter to the coastal region [7,8]. The SWFL continental shelf region’s circulation is protected from the major Gulf currents by the Cross-Shelf Transport Barrier (CSTB), which leads to increased residence times in the coastal waters, intensifying the impacts of the nutrient-rich terrestrial run-off [9,10].
Runoff inputs enhance primary and secondary production [11], but also drive eutrophication and declines in water quality [12]. Excess nutrients, freshwater, and the chromophoric dissolved organic matter (CDOM) have contributed to a reduction in seagrass and oyster bed habitats [13,14,15] and may exacerbate harmful Karenia brevis blooms, which induce hypoxia across the eastern Gulf of Mexico (also recognized as Gulf of America) [16,17,18].
Microbial communities play a crucial role in environmental systems, driving elemental cycling essential for life [19]. These processes play a major role in nutrient cycling in a region that is routinely impacted by biological and chemical interactions, such as the induction, persistence, and termination of harmful algal blooms (i.e., K. brevis) [20,21]. Understanding which microbial communities are present in the coastal zone under certain water management conditions and land usage overtime can assist in reducing the negative ecological and economic impacts of these blooms in SWFL. Microbial organisms respond to environmental changes (e.g., temperature, oxygen, salinity, turbidity, organic matter, and nutrient concentrations) [22,23,24] and serve as indicators of ecosystem shifts [25,26,27]. Given their spatially dependent dispersal [28], microbial community changes can reveal the extent of freshwater influence on coastal systems when analyzed across a spatial gradient.
Freshwater input varies seasonally in SWFL, with increased riverine discharge during the wet season (May–October) shaping microbial communities [29,30]. Runoff excess nutrients fuel algal blooms, creating a host-specific microbiome [21,31] which has been shown to influence sediment microbial composition by increasing Bacteroidetes and Proteobacteria [32]. Sinking algal particles and sediments have been identified to transport microbes to the seafloor [33,34,35], but the resuspension of sediments could introduce microbes to the water column. However, this warrants further investigation as this may impact ecosystem services and function along a highly dynamic SWFL coast.
This study establishes a microbial baseline for the SWFL coastal system using 16S rRNA gene amplicon sequencing of microbial community compositions across three distinct microbial habitats: water, sinking particles, and seafloor sediments along inshore–offshore transects, in a shallow continental shelf, influenced by the Caloosahatchee River Estuary (CRE). In establishing this microbial community composition, we provide a baseline which can be monitored to track how communities change with greater freshwater influence due to coastal management and development. We hypothesize greater river-associated taxa nearshore and in the wet season, with declining microbial similarity between surface sediments, sinking particles, and the water column offshore. This study aims to (i) characterize microbial communities, (ii) compare seasonal variations, (iii) assess the shared taxa between microbial habitats and identify microbial indicators of riverine influence within these communities to be tracked in multiple microbial habitats.
2. Materials and Methods
2.1. Sample Collection
Water (surface and bottom water) and sediment samples were collected once every two months from August 2022 to August 2023 from eight sites on the SWFL continental shelf (Figure 1). The sites were arranged along two parallel, inshore–offshore transects. The north transect, originating from the mouth of the CRE, contained sites N5 (water depth, 5 m), N10 (10 m), N15 (15 m), N20 (20 m). The south transect, which begins near Doctors Pass, 30 km south of the northern transect, contains sites S5 (5 m), S10 (10 m), S15 (15 m), and S20 (20 m).
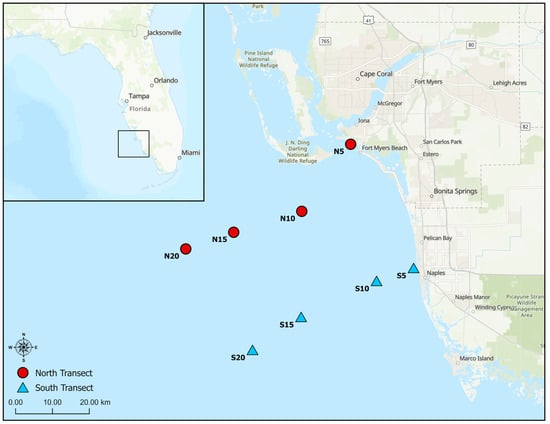
Figure 1.
Map of the sampling sites. Red circles are the north transect sites, and blue triangles are the south transect sites. Sites are labeled with site names which correspond to the water depth at that position.
On 28 September 2022, Hurricane Ian made a landfall, one month prior to the second round of sampling in October and made the Florida Gulf Coast University’s (FGCU) Vester Field Station inoperable. As a result, samples collected in October 2022 and January 2023 were collected aboard the Research Vessel (R/V) Hogarth (FIO, Florida Institute of Oceanography). March 2023 samples were collected on board the R/V Weatherbird II (FIO). All other samples were collected using smaller vessel operations (center-console vessels) deployed from the FGCU’s Vester Field Station.
Discrete water samples, representing the microbial habitat water, were collected in acid-washed high-density polyethylene bottles, with a van Dorn horizontal water sampler (Forestry Suppliers, Jackson, MS, USA) on the small vessels. Niskin bottles were used while onboard research vessel operations (R/V Hogarth and R/V Weatherbird II). Surface water was collected at 0.5 m and bottom water was sampled 1 m above the sea floor. For water microbial community analysis, 200 mL of water was filtered through cellulose nitrate filters (0.22 µm) to collect microbial cells, and filters were frozen at −80 °C until amplicon sequencing. In addition, 10 mL of water was fixed with glutaraldehyde (1% final concentration) for total cell counting. When conditions allowed, surface sediment was collected by divers in sterile 50 mL centrifuge tubes, otherwise it was collected by sub-sampling from sediment collected by a WildCo® Shipek Grab (ScienceFirst®, Yulee, FL, USA). The sediment samples were representative of the surface’s sediment microbial habitat. If samples were collected on small vessels, they were stored on ice until frozen in the lab at −20 °C. If collected on research vessels, samples were immediately frozen at −20 °C. Sub-samples were collected and frozen at −80 °C for microbial community analysis.
In addition, sinking particles were collected with custom-designed sediment traps made from PVC piping with a diameter of 7.62 cm and a height of 50.8 cm. Baffles were also placed on the top of each trap to avoid motile species and to prevent the consumption of trapped materials by larger organisms. Two trap designs were employed based on water depth: sites N5 and S5 used design B, and all other sites used design A (Figure S1) to adjust for variation in water depths; however, the aspect ratio (H/D) was always kept constant. Traps were deployed in triplicate at each sampling site. Traps were deployed two times per season (wet season: July 2023 and August 2023; dry season: February 2023 and March 2023), and deployment periods ranged from 21 to 37 days. The material collected in the traps were designated as the microbial habitat of sinking particles (particle associated). Sediment traps were retrieved by scuba divers who capped the sediment traps to minimize sediment loss and were transported to the laboratory for further processing. Sediment trap samples were gently mixed to homogenize the sample, and a subsample (10–30 mL) of sinking particles was collected for total suspended solid analysis used for sediment flux calculations. The remaining sediment trap materials were allowed to settle, and the overlying water was siphoned off, leaving a sediment slurry. From this slurry, a subsample was collected for microbial analysis, which was further decanted to remove as much water as possible and then frozen at −80 °C through amplicon sequencing. The slurry was then transferred to a 50 mL centrifuge tube and frozen at −20 °C until further analysis. The sediment slurry was then transferred onto pre-combusted (500 °C for 5 h), pre-weighed GF/F filters (Whatman 0.7 µm pore size, 47 mm diameter, Marlborough, MA, USA) for vacuum filtration. Wet filters were then dried (60 °C) to consistency and then weighed to obtain the mass of the suspend solids. Sediment fluxes were calculated from the amount of dried mass collected divided by the number of days deployed multiplied by the area of the sediment trap opening.
2.2. Water Quality
At each site, a vertical water column profile for temperature, salinity, and dissolved oxygen (DO) was measured with an EXO II multiparameter water quality sonde (YSI, Yellow Springs, OH, USA). A single value for each collection depth was determined by averaging stable continuous mode profiling data at the corresponding depth range. A portion of water samples collected for the nutrients were immediately filtered through a 0.45 µm nylon syringe filter for dissolved nutrients (nitrate, nitrite, ammonia, and ortho-phosphate) and frozen at −20 °C until analysis using a SEAL AA500 continuous flow autoanalyzer (A-005-19) following the manufacturers/EPA methods and calibrations. The EPA method/SEAL calibration codes are as follows: 353.2/A-044-19 (nitrate–nitrite), 350.1/A-043-19 (ammonia), and 365.1/A-005-19 (phosphorus). The remaining sample was left unfiltered for analysis of total nitrogen (TN) and total phosphorous (TP). TN analysis was conducted using a Shimadzu total organic carbon (TOC) analyzer with the total nitrogen measuring unit accessory (EPA 7E/APHA 4500-N E). TP was first digested and then run on the autoanalyzer using ortho-phosphate calibrations (365.1/A-005-19). For chlorophyll a (Chl-a) measurement, 100 mL of water was filtered through a GF/F filter (0.7 µm pore size, 25 mm diameter, Whatman, Marlborough, MA, USA) and then filters were frozen at −20 °C before extraction. As solvent, 90% acetone was used to extract Chl-a, soaking for 16–24 h at 4 °C (EPA method 445.0). Chl-a was then quantified using a Trilogy Laboratory Fluorometer (Turner Designs, San Jose, CA, USA) with chlorophyll acid module (model 7200–040-W). Chromophoric dissolved organic matter (CDOM) was measured from filtered (0.45 µm nylon) water with the Trilogy Laboratory Fluorometer module (model 7200-069-W). Total cell counts were measured using a BD Accuri C6 flow cytometer (BD Biosciences, Franklin Lakes, NJ, USA). Bacteria counts were measured by staining with SYBR Green I and picocyanobacteria counts were measured through autofluorescence using cell size constraints to target prokaryotes.
2.3. Elemental and Stable Isotope Measurements
Elemental analysis [total carbon, total inorganic carbon, TN, stable carbon (δ13C), and organic nitrogen isotope (δ15N)] measurements were conducted on sediment traps samples (sinking particles) and surface sediments. From the water column, stable total isotopes were analyzed for suspended particulate organic matter (SPOM), rather than stable isotopes. All other elemental analysis of SPOM was the same as the sediment trap and surface sediment material. For the analysis of SPOM from the water column, water samples were collected from each depth in acid-washed 1 L high-density polyethylene Nalgene bottles and filtered through pre-weighed and combusted (500 °C for 5 h) GF/F filters (Whatman 0.7 µm pore size, 47 mm diameter, Marlborough, MA, USA). Filtration volumes varied from 900 mL to 3 L depending on the total load of suspended sediments, with more volume filtered in the offshore sites to ensure that enough suspended particles were present for the analysis of stable isotopes. The filters were weighed after drying in an oven for at least 24 h at 60 °C, and then a 28 mm hole punch of the filter was taken, carefully folded, and wrapped entirely in tin capsules which were stored until analysis.
Surface sediment and sediment traps samples were dried to consistency (60 °C) and sieved through a mesh filter with a size of 4 mm to remove large particles prior to elemental and stable isotope analysis. For stable isotope analysis, carbonate was removed through acidification with 1N hydrochloric acid. Acid was added until no reaction was observed. The acid and sample mixture were transferred to 50 mL centrifuge tubes, centrifuged, and the acid was decanted. This process was repeated until no reaction was observed and all carbonates had dissolved. Once the reaction ceased, samples were centrifuged again, and deionized water was added for rinsing. The sample was mixed, centrifuged to remove the water, and rinsed twice more using the same process. Afterward, the samples were freeze-dried before analysis.
Analysis was performed using a Thermo Electron DeltaV Advantage isotope ratio mass spectrometer, connected via a ConFlo II interface to a Carlo Erba NA 1500 CNHS Elemental Analyzer at the University of Florida’s Department of Geological Sciences Stable Isotope Mass Spectrometry Laboratory. Samples were prepared in tin capsules and loaded into a 50-position automated Zero Blank sample carousel on the Carlo Erba NA 1500 CNS Elemental Analyzer for processing. Combustion took place in a quartz column at 1000 °C in an oxygen-rich environment, with the resulting sample gas carried by a He stream. The gas then passed through a reduction column at 650 °C, containing elemental copper, to remove O2. Next, the effluent stream was directed through a magnesium perchlorate trap to eliminate water, followed by the separation of N2 and CO2 using a 0.7 m GC column at 125 °C. The purified sample gas then entered a ConFlo II interface, which fed it into the Thermo Electron DeltaV Advantage isotope ratio mass spectrometer operating in continuous flow mode. There, the sample gas was analyzed relative to laboratory reference N2 and CO2 gases. All carbon isotopic results are reported in standard delta (δ) notation relative to Vienna Pee Dee Belemnite, while nitrogen isotopic results are expressed relative to air.
2.4. 16S rRNA Amplicon Sequencing and Data Processing
DNA of the water column was extracted from the biomass collected on the cellulose nitrate filters (0.22 µm) using the DNeasy PowerSoil Pro Kit (Qiagen, Germantown, MD, USA) using manufacturer’s instructions. DNA from the frozen sub samples of surface sediment and sediment trap material was extracted in the same manner. High-throughput amplicon sequencing was conducted using primer pair 515 yF and 926 pfR [36] targeting the V4-V5 region of the 16S rRNA gene using the Illumina MiSeq system (MR DNA, Shallowater, TX, USA). A 30-cycle PCR using the HotStarTaq Plus Master Mix Kit (Qiagen, Germantown, MD, USA) was performed (95 °C for 5 min, followed by 30 cycles of 95 °C for 30 s, 53 °C for 40 s, and 72 °C for 1 min, and a final elongation step at 72 °C for 10 min was performed). Following amplification, PCR products were checked in 2% agarose gel. Samples were multiplexed using unique dual indices and pooled together in equal proportions based on their molecular weight and DNA concentrations. Pooled samples were then purified with calibrated AMPure XP beads (Beckman Coulter Life Sciences, Brea, CA, USA). An Illumina DNA library was then prepared from the pooled and purified PCR product. Demultiplexed FASTQ files were imported to Qiime2 v2023.05 [37] and primer sequences were removed with q2-cutadapt. Quality control and denoising was performed with Dada2 [38] to generate the amplicon sequencing variants (ASVs) that represent distinct organisms. Briefly, forward and reverse reads were trimmed so that the median Phred quality score (Q) was >25 while still having sufficient overlap in the forward and reverse reads when merging. Chimeric sequences were also removed from the data set. Naïve Bayes classification was performed with the q2-feature-classifier plugin using the Silva database (v138.1) for reference [39]. Reference Sequence Annotation and Curation Pipeline (RESCRIPt) was used to optimize classification to the 515 yF/926 pfR primer set [40]. After classification, sequences were further filtered to remove sequences related to eukaryotes, mitochondria, and chloroplasts. ASV tables and taxonomy tables were exported and later used for statistical analysis in R (version 4.4.1). The resulting ASV table was further filtered to exclude ASVs that appeared less than ten times across all samples. The amplicon sequence datasets were deposited in GenBank under BioProject number PRJNA1043673.
2.5. Statistical Analysis
All statistical analysis was performed in R (version 4.4.1) and ggplot2 [41] was used for visualization. Two-way ANOVAs were conducted on all environmental parameters investigating the influence of season (wet and dry) and water depth (5 m, 10 m, 15 m, 20 m). To evaluate the effect of season on spatial factors, water depth was replaced with collection depth (surface and bottom) and transect location (north and south). When the data did not meet the assumptions of parametric statistics, non-parametric permutational alternatives were used using LmPerm (version 2.1.4) [42]. Multivariate analysis comparisons between surface sediments and the material captured in sediment traps were derived from the Euclidean distance with a permutational multivariate analysis of variance (PERMANOVA) within the vegan package using ‘adonis2’. To compare the microbial community compositions of season and water depths, non-metric multidimensional scaling (NMDS) ordination was generated with the vegan package (‘metaMDS’) [43] using a Bray–Curtis dissimilarity calculated from ASV relative abundance. Environmental parameters associated with community change were assessed through distance-based redundancy analysis (db-rda) and significant environmental variables were determined with ‘anova.cca’ (permutation test for constrained ordination). Significant environmental variables were then plotted onto NMDS ordinations with ‘envfit’. Within the vegan package, ‘adonis2’ was used for PERMANOVA (Bray–Curtis dissimilarity) to test whether microbial communities of interest are statistically different from each other. If the samples did not display equal dispersion (assessed with ‘betadisper’, p > 0.05) between groups, PERMANOVA was not conducted. The mgcv package was used to model our environmental data with general additive models (GAMs) to determine the significant interactions of microbial taxa and environmental parameters [44]. p-values reported from the GAM analysis were corrected with the Bonferroni method. A Venn diagram was created using the ggVennDiagram package [45] to illustrate the number of shared and unique ASVs among samples. Percentages represented in the Venn diagrams were calculated from the total number of ASVs present under the condition being examined (e.g., ASV present in the water column, particle-associated, and surface sediment samples during the wet season in the inshore environment). Linear discriminant analysis effect size (LEfSe) [46] was conducted with the package microbiomeMarker [47] to identify the taxa-associated seasons and spatial zones, and this analysis was performed in each microbial habitat separately. Seasonal analysis was conducted on taxa classified to the genus level. Spatial zone indicators, using the groupings of microbial communities found in beta diversity, were conducted only on the ASVs that were found in all three microbial habitats, and were analyzed at the ASV level. LEfSe was conducted with the default conditions with the exception of using the stricter multigroup strategy.
3. Results
3.1. Environmental Parameters
3.1.1. Water Quality and Nutrient Data
Physicochemical data were collected from surface and bottom waters (Figure S2). The surface water was characterized by higher DO during the wet season relative to the bottom. There was a trivial difference in observed cell counts, Chl-a, and CDOM concentrations between the surface and bottom waters (Figure S2). Like the physiochemical data, there was little difference between nutrient concentrations in the surface and bottom waters (Figure S2). These trends were observed at all sites, but some site-specific observations between the surface and bottom waters were made. During July 2023, halocline stratification was observed at N5 as it was the site most influenced by freshwater inputs from the CRE; however, other sampling events did not observe halocline stratification caused by riverine flow. Site N5 was also consistently higher in nutrients and Chl-a concentrations relative to site S5, indicating CRE plume influence (Figure S3a). Except for N5, transects showed little variation in water quality and nutrient concentrations (Figure S3a). As such, the two sites at similar water depths between transects will be combined in further analysis as one quantity.
Physicochemical data were also seasonally examined (i.e., wet and dry seasons) (Figure 2). Except for salinity, all physiochemical parameters were strongly influenced by season. Chl-a was higher in the wet season than in the dry season (two-way permutation ANOVA: df = 1, 80; Iter = 5000; p < 0.001) and displayed an inshore–offshore decline in concentration (2-way permutation ANOVA: df = 3, 80; Iter = 5000; p = 0.0178), which was more pronounced in the dry season (Figure 2). The wet season samples had significantly higher concentrations of CDOM than the dry season (2-way permutation ANOVA: df = 1, 64; Iter = 5000; p < 0.001), which was typically higher in the inshore sites (Figure 2). The great variation was likely due to the impacts of Hurricane Ian, which led to abnormally high wet season values in the offshore sites [48]. DO was also influenced by season, with it being overall lower in the wet season compared to the dry and was lower in the bottom waters of the wet season (two-way permutation ANOVA: df = 1, 82; Iter = 5000; p = 0.0186) (Figure S2). Total bacterial counts were not different seasonally but did show a depth-driven decline in cell counts (two-way permutation ANOVA: df = 3, 64; Iter = 5000; p = 0.0038) (Figure S4a). Total picocyanobacteria counts were also not different seasonally, and lowest counts were seen at the 20 m depths (two-way permutation ANOVA: df = 3, 64; Iter = 5000; p = 0.0146) (Figure S4b).
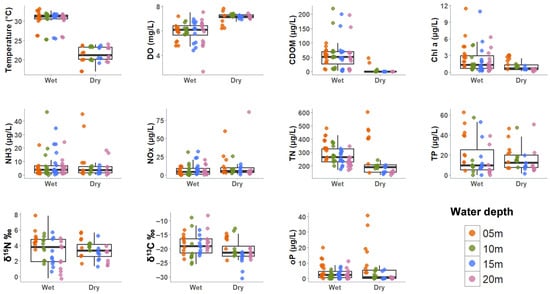
Figure 2.
Spatiotemporal patterns of water column nutrient and physiochemical parameters. Points represent individual measurements collected from the different water depth levels. Boxplots represent the interquartile range with median as the central tendency. Y axis has different intervals. Dissolved oxygen (DO), chromophoric dissolved organic matter (CDOM), Chlorophyll a (Chl-a), stable total nitrogen isotope (δ15N), stable total carbon isotope (δ13C), and orthophosphate (oP).
Nutrient concentrations varied significantly by season and water depth. TN was highest inshore and decreased offshore, with stronger gradients and overall higher concentrations during the wet season compared to the dry season (two-way permutation ANOVA: df = 3, 80; Iter = 5000; p = 0.0052). However, the highest TN concentration observed occurred at inshore sites during the dry season (Figure 2). TP concentrations were similar between the wet and dry seasons but were consistently higher inshore (two-way permutation ANOVA: df = 3, 64; Iter = 5000; p = 0.0424). Orthophosphate was significantly higher in the wet season, with peak concentrations offshore during the summer months. The inshore–offshore gradient was more pronounced in the dry season, where high concentrations at the 5 m depths and declined sharply further offshore (two-way permutation ANOVA: df = 3, 80; Iter = 5000; p < 0.001). Stable total carbon isotopes (δ13C) in SPOM were higher in the wet season than in the dry season, showing little spatial variation except at 5 m depths, where values were generally lower in the dry season (2-way ANOVA: df = 3, 64; F = 4.1; p = 0.01). In contrast, the stable total nitrogen isotope (δ15N) did not differ significantly between wet and dry seasons but was highest at 5 m depths gradually declining offshore (two-way ANOVA: df = 3, 64; F = 8.6; p < 0.001). These results highlight the strong influence of spatial and seasonal factors on nutrient distribution.
3.1.2. Sinking Particles and Surface Sediment
Sinking particles captured in sediment traps displayed both seasonal and spatial patterns (Figure 3). The sediment fluxes were higher during the dry season compared to the wet season (Figure S5; 2-way permutation ANOVA: df = 1, 24; Iter = 2034; p = 0.04). TN and TOC in the sinking particles decreased with distance from the shore (two-way ANOVA: TN: df = 3, 24; F = 6.2; p = 0.002, TOC: df = 3, 24; F = 9.3; p < 0.001). TN and TOC were higher in the wet season (2-way ANOVA: TN: df = 1, 24; F = 8.6; p = 0.007; TOC: df = 1, 24; F = 5.5; p = 0.028); however, inshore sites during the dry season showed similar concentrations to the wet season (Figure 3a). The stable isotopes of organic carbon and nitrogen of the sinking particles were also analyzed. The median (IQR) of δ13C was −20.7‰ (0.48) and δ15N was 3.52‰ (0.54). δ13C did not show strong spatial or temporal patterns, although values were lowest offshore in July 2023, coinciding with higher Chl-a concentrations in offshore waters (Figure 3a). δ15N was higher during the dry season compared to the wet season (two-way permutation ANOVA: df = 1, 24; Iter = 5000; p < 0.001).
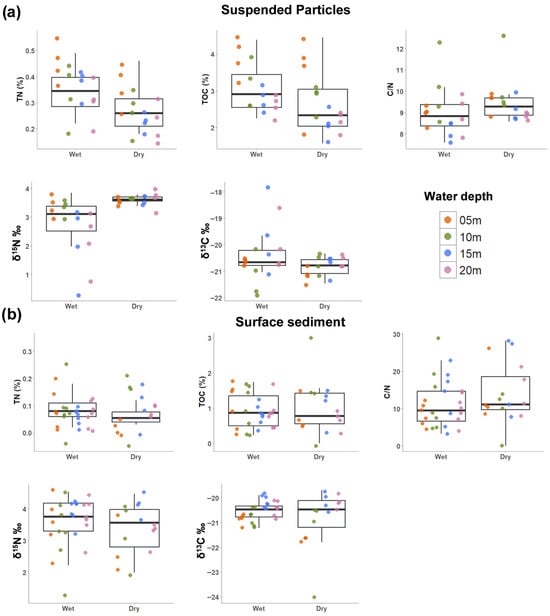
Figure 3.
Spatiotemporal patterns of sinking particles and surface sediment environmental data. (a) Sinking particles. (b) surface sediments. Points represent individual measurements collected from the different water depth levels. Boxplots represent the interquartile range with the center line representing the median value. Y axis has different intervals. Total nitrogen (TN), Total organic carbon (TOC), carbon/nitrogen ratio (C/N), stable nitrogen isotope (δ15N), and stable carbon isotope (δ13C).
In the surface sediments, TN and TOC showed little seasonal difference (Figure 3b). However, the C/N ratio was higher in the dry season than in the wet season (Figure 3b), reflecting more terrestrial input (i.e., Hurricane Ian) and less algal-derived organic matter. δ13C in the surface sediment showed a stronger spatial pattern with 5 m depth samples having the most negative values (two-way ANOVA: df = 3, 29; F = 6.6; p = 0.002), but no strong seasonal patterns were observed (Figure 3b). No significant spatiotemporal patterns were found for δ15N in the surface sediments (Figure 3b). The characteristics of the particles in the sediment traps have similar properties to those of the surface sediment as there were no significant differences in sedimentary properties (TN%, TOC%, CaCO3%, C/N, δ15N, δ13C) between sediment trap and surface sediment samples (PERMANOVA: R2 = 0.012; p = 0.350). This similarity indicates that the sinking particles were compositionally consistent with surface sediments, suggesting a sedimentary origin of the trapped material. There were no significant differences in organic matter and nitrogen content between the north and south transects in both surface sediments and sinking particles (Figure S3).
3.2. Diversity Overview
After the removal of eukaryotic and organelle sequences, 19,585,450 sequences were recovered across 163 samples (water column = 48 surface water and 40 bottom water, particle-associated = 32, and surface sediment = 43) with an average of 120,156 sequence reads per sample, generating 81,949 ASVs. After filtering, 37% of the ASVs were removed to eliminate the background noise as these sequences were low in abundance and insignificant to the overall community trends. As a result, 51,486 ASVs remained across all microbial habitats. There was no significant difference in microbial communities between surface and bottom waters (Figure S6), PERMANOVA R2 = 0.006; p = 0.9), similar to what was observed with water quality. Therefore, the surface and bottom waters were treated as a single group referred to as the water column.
3.2.1. Alpha Diversity
Hill–Shannon diversity differed markedly among habitats, with water column showing lower diversity than particle-associated and surface sediment communities (Figure 4). Diversity in the water column and surface sediments was higher during the wet season, though the latter was not statistically significant (two-way permutation ANOVA: df = 1, 35; Iter = 145; p = 0.414). An inshore–offshore pattern was observed in all habitats but was significant only in the water column, where diversity increased offshore, especially during the wet season (two-way permutation ANOVA: df = 3, 80; Iter = 5000; p = 0.0038). In contrast, the particle-associated community displayed higher diversity at 5 m depths (Figure 4, 2-way permutation ANOVA: df = 3, 24; Iter = 5000; p = 0.013).
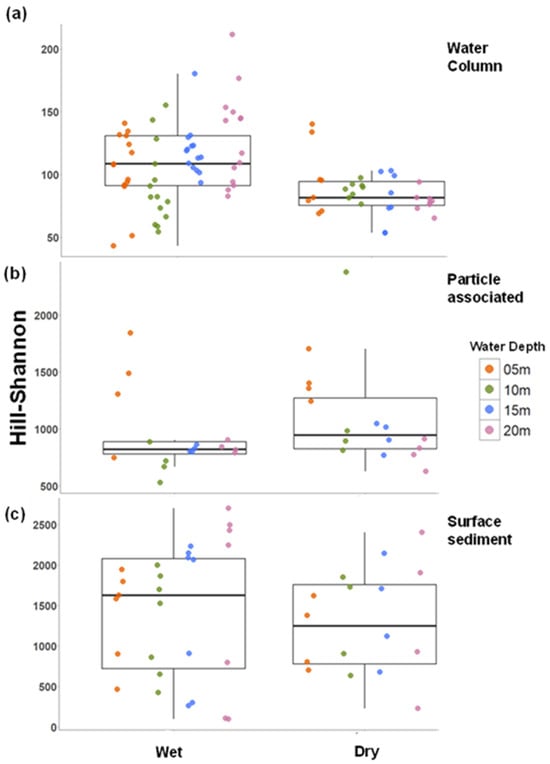
Figure 4.
Spatiotemporal patterns of Hill–Shannon diversity in microbial habitats. (a) Water column communities; (b) particle-associated communities; and (c) surface sediment communities. Points represent individual measurements collected from the different water depth levels. Boxplots represent the interquartile range with median as the central tendency. Y axis has different intervals.
3.2.2. Beta Diversity
Cluster analysis revealed distinct microbial community structures across the three habitats, with particle-associated and surface sediment communities being similar (Figure S7). Water column communities showed seasonal and spatial patterns (Figure 5a). They differed between wet and dry seasons but could not be statistically assessed due to unequal dispersion (betadisp, p = 0.006). Communities grouped into three clusters: inshore (5 m), transition (10 m), and offshore (15 and 20 m) (PERMANOVA: R2 = 0.214, p < 0.001). Water column communities were influenced by factors like distance from shore, temperature, CDOM, Chl-a, TN, orthophosphate, δ13C, δ15N, and DO (Figure 5a, p < 0.05), with the inshore community being most impacted during the wet season. Higher δ15N and the presence of Bacteroidia and Gammaproteobacteria were associated with inshore communities (Figure S8). During the dry season, DO and colder water temperatures influence microbial communities.
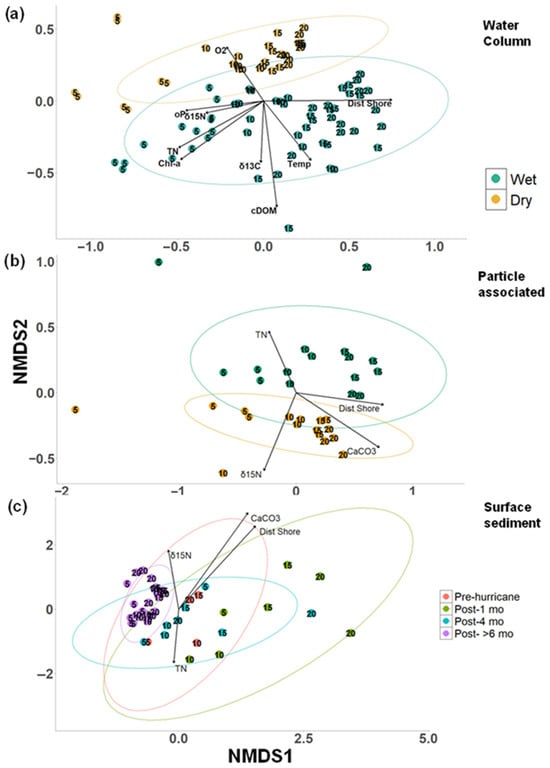
Figure 5.
Beta diversity of microbial habitats. Non-metric multidimensional scaling (NMDS) ordination of prokaryote communities based on Bray–Curtis dissimilarity at the amplicon sequence variant (ASV) level. (a) Water column comparison between wet and dry seasons. (k = 2, stress = 0.1797) (b) Particle-associated comparison between wet and dry seasons (k = 2, stress = 0.0789). (c) Surface sediment community represented as time post-hurricane (k = 2, stress = 0.1324). Each point represents a single sample with colors representing factors of interest. Points are labeled with water depth. Ellipses show the 95% confidence interval for the mean centroid of each time period. Environmental variables significantly associated with community change are represented by vectors with the strength of association represented by the length of the vector (assessed by permutation tests in constrained ordination (p < 0.05, db-rda). Distance from shore (Dist Shore), Total nitrogen (TN), dissolved oxygen (O2), orthophosphate (oP), Chlorophyll a, (Chl-a), Chromophoric dissolved organic matter (CDOM), Temperature (Temp), % calcium carbonate (CaCO3), stable total carbon isotope 13C (δ13C), and stable nitrogen isotope 15N (WC not organic but total) (δ15N).
Particle-associated communities also exhibited seasonal and spatial patterns (Figure 5b). They differed between wet and dry seasons (PERMANOVA: R2 = 0.139, p < 0.001) and were mainly driven by inshore–offshore gradients (PERMANOVA: R2 = 0.269, p < 0.001). Particle-associated communities were influenced by distance from shore, calcium carbonate, δ15N, and TN (Figure 5b, p < 0.05), with TN linked to the inshore community and higher CaCO3 associated with offshore samples in the dry season. Bacteroidia displayed higher relative abundance in the inshore particle-associated communities while Planctomycetes had higher relative abundances in the offshore particles (Figure S9)
Surface sediment communities were heavily impacted by Hurricane Ian. Pre-hurricane sediment samples (north transect) showed drastic changes in just one-month post-hurricane (Figure 5c), and six months later, communities clustered differently (Figure 5c), though statistical testing could not be performed (betadisp, p < 0.001). Post-hurricane samples showed an increased relative abundance of Bacilli, Clostridia, and Actinobacteria, with Dehalococcoidia appearing in the surface sediments (Figures S10 and S11). Despite these changes, surface sediment communities followed the same spatial patterns as water column and particle-associated communities (PERMANOVA: R2 = 0.144, p < 0.001). Spatial factors like distance from shore, CaCO3, TN, and δ15N were more important than temporal changes in influencing sediment microbial communities (Figure 5c, p < 0.05). Higher CaCO3 and δ15N were linked with offshore sites, while TN was associated with inshore sites, especially after the hurricane.
3.3. Seasonal Comparison of Taxonomic Composition Among Microbial Habitats
3.3.1. Major Taxonomic Groups
Alphaproteobacteria, Bacteroidia, and Gammaproteobacteria were the three dominant microbial classes across three tested microbial habitats (Figure 6). In contrast to the three major classes discussed above; strong habitat preference was observed in some classes with seasonal patterns observed. Cyanobacteriia, Thermoplasmata, and Actinobacteria dominated in the water column while Planctomycetes, sulfate-reducing bacteria (SRB) (Desulfobulbia and Desulfobacteria), and ammonia-oxidizing archaea (AOA) Nitrososphaeria dominated in the sediment and particle-associated habitats (Figure 6a).
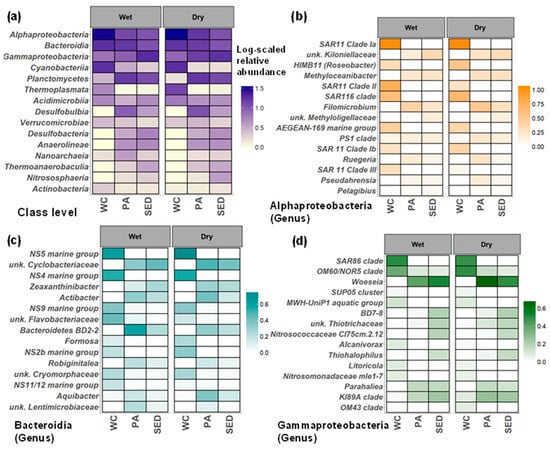
Figure 6.
Seasonal dynamics of microbial communities in microbial habitats. (a) Median log-scaled relative abundance of the top 15 most abundant classes across all microbial habitats during the wet and dry seasons. (b–d) The taxa shown are the top 15 groups classified to the genus level ranked by LDA score from linear discriminant analysis effect size (LefSe) analysis (water column vs. surface sediment) ran separately within the Alphaproteobacteria, Bacteroidia, and Gammaproteobacteria communities. (b) Median log-scaled relative abundance of Alphaproteobacteria taxa. (c) Median log-scaled relative abundance of Bacteroidia taxa. (d) Median log-scaled relative abundance of Gammaproteobacteria taxa. WC = water column, Sed = surface sediment, and PA = particle-associated.
LEfSe analysis was conducted separately on the genus level within the Alphaproteobacteria, Bacteroidia, and Gammaproteobacteria communities using the relative abundance of the whole community to distinguish taxa of the water column and surface sediment within these classes. We found two major trends through seasonal and habitat comparisons. First, at the class level, the major taxonomic groups in all three habitats were similar between the wet and dry seasons, but seasonal differences were observed within more minor taxa. Although, at the genus level within the major taxonomic groups, seasonal differences were observed with habitat specificity (Figure 6 and Figure 7). Second, significant overlap was found between sediment and particle communities while water column communities showed the least overlap with other microbial communities.
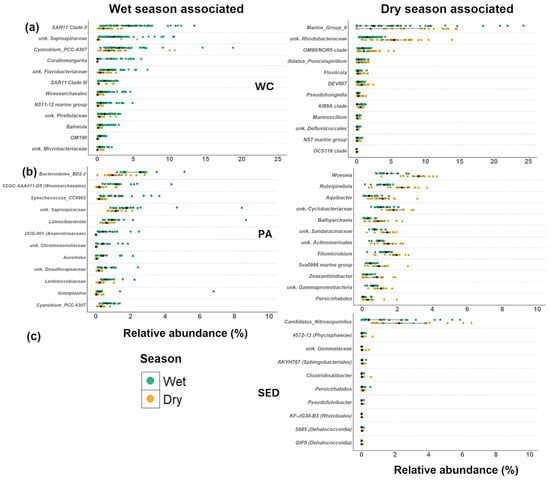
Figure 7.
Wet and dry season-associated taxa in microbial habitats. Relative abundance of ranked (by LDA score, which shows strength of association) taxa identified in LEfSe analysis on the genus level communities in the (a) water column, (b) sinking particles, and (c) surface sediments. The black dot represents the median values, and the lines represent the interquartile range. LEfSe analysis did not find any wet season specific taxa in the surface sediments. WC = water column, Sed = surface sediment, and PA = particle-associated.
Alphaproteobacteria were more prominent in the water column than in surface sediments (Figure 6a). The water column was dominated by SAR11 clades and Roseobacter, and by genera like Methyloceanibacter, Filomicrobium, and Unknown Kiloniellaceae in the surface sediments (Figure 6b). In the water column, SAR11 Clades II and III were much higher in the wet season than in the dry season, with SAR11 clade Ib and HIMB11 (Roseobacter) being higher in the dry season (Figure 6b). Little seasonal variation was observed in the Alphaproteobacteria in the surface sediments, although Pelagibius was over two times higher in the wet season (wet = 0.17, dry = 0.06%) (Figure 6b).
Bacteroidia were more abundant in the water column than in the surface sediments (Figure 6a) and were dominated by Flavobacteriaceae (e.g., NS clades and Formosa) (Figure 6c). Saprospiraceae in the water column were abundant in the wet season (Figure 7; Wet = 2.45 Dry = 0.12%). Saprospiraceae appear to be associated with algal growth driven by estuarine inputs and associated run-off as they appear to be associated with Chl-a concentrations (GAM: R2 = 0.0646, F = 7.013, p = 0.057) and CDOM concentrations (GAM: R2 = 0.258, F = 8.623, p < 0.001). In addition, unknown Flavobacteriaceae and the NS11/12 marine group also increased in relative abundance in the water column during the wet season (Figure 6c). Although dominant throughout the study period, the NS5 marine group increased in relative abundance during the dry season (wet = 3.19, dry = 4.58%) along with Formosa and the NS2b marine group (Figure 6c). The surface sediments showed greater Bacteroidia diversity encompassed by Cyclobacteriaceae and different Flavobacteriaceae (e.g., Actibacter, Zeaxanthinibacter, Robiginitalea, and Aquibacter) than in the water column. Except for Aquibacter, all surface sediment Bacteroidia either showed no difference or an increased in relative abundance during the wet season. All the dominant Bacteroidia in the surface sediments were also found in the particle-associated communities and tended to have higher relative abundances during the dry season (Figure 6c).
Gammaproteobacteria displayed lower relative abundance in the water column than in the surface sediments (Figure 6a) and were dominated by SAR86, Halieaceae (OM60/NOR5), and OM43 clades, with the ammonia-oxidizers Nitrosomonadaceae present. Seasonal patterns were observed in the water column Gammaproteobacteria community. The MWH-UniP1 aquatic group, Alcanivorax, and Litoricola all increased in relative abundance during the wet season, while the OM60/NOR5 clade, Woeseia, KI89A clade, and OM43 clade greatly increased in relative abundance during the dry season (Figure 6d). Sediments contained a more diverse Gammaproteobacteria community, including Woeseia, KI89A clade, ammonia-oxidizers Nitrosococcaceae, and sulfur-oxidizing Thiohalophilus. Within the surface sediment Gammaproteobacteria community, little seasonal variation was found (Figure 6d). All the dominant Gammaproteobacteria in the surface sediment were also found in the particle-associated communities and tended to have higher relative abundances during the dry season (Figure 6d).
Planctomycetes constitutes a major taxonomic group within the surface sediments and particle-associated communities compared to the water column (Figure 6a) and contributed more to the particle-associated communities (wet = 14.5%, dry = 15.2%) compared to the surface sediments (wet = 10.9%, dry = 11.5%). However, the Planctomycetes community of the water column was over three times higher in the wet season compared to the dry season (wet = 1.9%, dry = 0.60%). Pirellulaceae was the most abundant family within Planctomycetes in all habitats and was associated with the wet season in the water column (Figure 7a). In the water column, Pirellulaceae was associated with pheophytin (GAM: R2 = 0.164, F = 4.382, p = 0.016) concentrations, but not Chl-a concentrations (GAM: R2 = 0.031, F = 1.683, p = 1.0), indicating its association with decomposing algal materials in the water column.
Cyanobacteriia were dominant in the water column where they did not show a seasonal difference (Figure 6a, wet = 17.0% dry = 17.5%) and displayed seasonal patterns in the particle-associated and surface sediments. Although, Cyanobium PCC-6307 did increase in relative abundance during the wet season in both the particle-associated community and the water column (Figure 7). In addition, Synechococcus CC9902 increased in relative abundance during the wet season in the particle-associated communities. Overall, Cyanobacteriia was higher in the wet season (Figure 6a, PA = 2.2%, SED = 1.0%) compared to the dry season (PA = 0.65%, SED = 0.60%) in the particle-associated community and the surface sediments.
3.3.2. Functional Taxonomic Groups
The SRB community was predominantly made up of Desulfobulbia and Desulfobacteria (Figure 6a). In the particle-associated community, Desulobulbia was the dominant group (wet = 8.50%, dry = 10.43%) of SRB compared to Desulfobacteria (wet = 2.29, dry = 2.18%). Unknown Desulfocapsaceae was the most abundant group within the Desulfobulbia community and drove the higher relative abundance during the dry season as all other taxa of this class in the particle-associated community had a higher relative abundance during the wet season (Figure 8a). Unknown Desulfocapsaceae (wet = 2.0, dry = 2.5%), along with Sva0081 sediment group (wet = 2.1, dry = 1.9%) of the Desulfobacteria were the dominant SRB in the sediment communities with little seasonal variation (Figure 8a). Contrary to the particle-associated communities, the surface sediments were more dominated by Desulfobacteria (wet = 4.43, dry = 3.61%) comparted to Desulfobulbia (Figure 6a; wet = 2.79, dry = 2.82%).
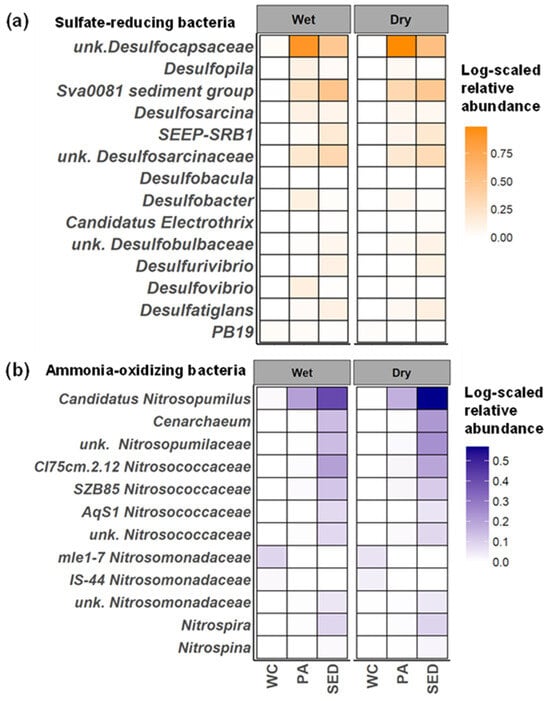
Figure 8.
Seasonal patterns of SRB and nitrifier community in microbial habitats. Log-scaled average relative abundance across all microbial habitats during the wet and dry seasons for (a) SRB and (b) ammonia oxidizing and nitrite oxidizing microorganisms classified to the genus level. Average relative abundances are used to highlight the influence of more rare taxa. WC = water column, Sed = surface sediment, and PA = particle-associated.
Ammonia-oxidizing microorganisms showed great differentiation between the water column and surface sediment communities (Figure 8b). The water column was dominated by ammonia-oxidizing bacteria (AOB), specifically mle1-7 and IS-44 (Nitrosomonadaceae). During the wet seasons, there was an increase in the relative abundance of mle1-7 (wet = 0.23%, dry = 0.15%), while IS-44 exhibited higher abundance in the dry season (wet = 0.04%, dry = 0.08%) (Figure 8b). Nitrosopumilus was the dominant sediment ammonia-oxidizer as well as in the particle-associated communities, but was the least abundant in the water column (Figure 8b). Nitrosopumilus in the surface sediments increased in relative abundance during the dry season (Figure 7c, wet = 1.6, dry = 2.7%). Other AOA included Cenarchaeum and unknown Nitrosopumilaceae were also more abundant in the surface sediments (Figure 8b). Nitrosococcaceae (CI75cm.2.12, SZB85, AqS1) was also present in the surface sediment, but its relative abundance was overall lower compared to Nitrosopumilaceae. Nitrite-oxidizing bacteria found were Nitrospira and Nitrospina with both present in the surface sediment and particle–associate communities with much higher relative abundances in the surface sediments. Nitrospira was more dominant compared to Nitrospina in both habitats and little seasonal variation was observed (Figure 8b).
3.4. Shared ASV Communities
3.4.1. Inshore–Offshore Spatiotemporal Patterns of ASVs Among Three Microbial Habitats
The percentage of shared ASVs among microbial habitats were analyzed from a rarefied data set, on a spatial temporal basis derived from previously found beta diversity trends (Figure 9). Regardless of season or spatial zone, the surface sediments encompassed the greatest percentage of ASVs distinctive to their microbial habitats which the richness was higher during the wet season and increased in diversity along the inshore–offshore gradient. The water column showed the lowest percentage of ASVs distinct to their habitat and was also higher during the wet season. The water column-specific ASVs declined in diversity along the inshore–offshore gradient. Between the water column and the particle-associated community, the inshore waters during the wet season shared 11.6% of ASVs, the highest percentage shared between these two habitats by far. Sinking particles and surface sediments shared the highest percentage of shared ASVs between the microbial habitats and the percentage of shared ASVs declined in the offshore zone. The percentage of shared ASVs found in all three habitats was the highest in the inshore community, and the percentage of shared ASV declined along the inshore–offshore gradient, especially during the dry season, but homogeneity extended to the offshore waters during the wet season. These shared ASVs would be most responsible in connecting the three microbial habitats.
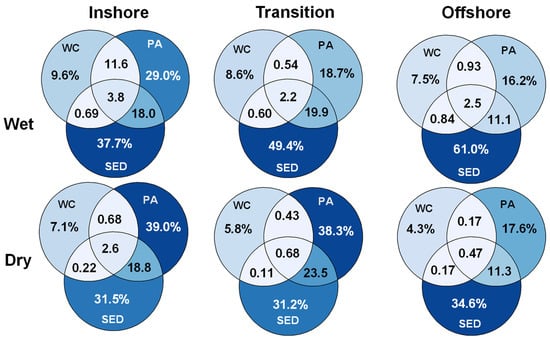
Figure 9.
Spatiotemporal patterns of shared ASVs between microbial habitats. Percentage of ASV present in each combination of microbial habitats during the wet and dry season for each spatial zone identified in beta-diversity analysis. Percentages were calculated from ASVs that were present in each season and spatial zone combination from a data set rarefied to equal sampling depth. Percentage signs were removed from the intersecting circles for legibility. WC = water column, Sed = surface sediment, and PA = particle-associated.
3.4.2. Dominant ASVs Spatiotemporal Comparison of Sediment and Water Column Associated Dominant ASVs Between Three Microbial Habitats
In total, 1552 ASVs were found in all three microbial habitats encompassing 3% of the total community. This community was further filtered to only contain ASVs with a relative abundance above 0.01% in at least 10% of samples from each microbial habitat, resulting in a community henceforth called the dominant shared ASVs (Table S1). To determine whether the particles collected in sediment traps were sourced from the water column (i.e., sinking particles of algal origin) or from the surface sediment (i.e., sediment resuspension), the dominant shared ASVs more prevalent in the water column and the surface sediment habitats were analyzed on a spatiotemporal basis between all three microbial habitats. To achieve this, the top 15 shared dominant ASVs in both the water column and the surface sediment were targeted to highlight changes in relative abundance between season, habitat, and spatial zones (Figure 10).
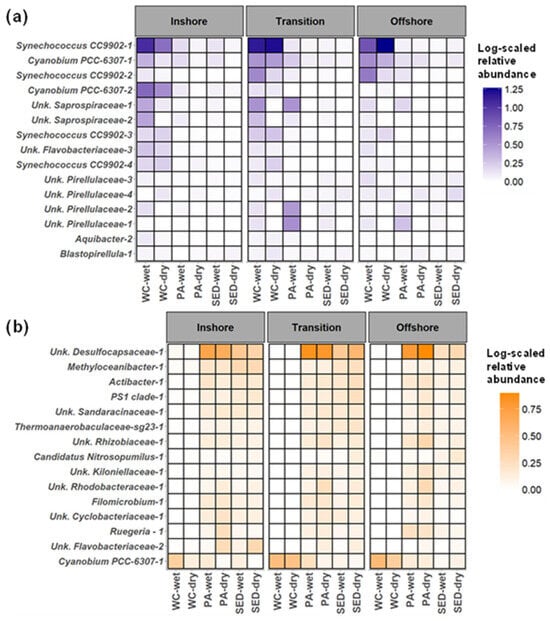
Figure 10.
The spatiotemporal comparison of the surface sediment- and water column-associated shared ASVs between three microbial habitats. (a) The log-scaled average relative abundance of the top 15 water column associated ASVs. The top 15 ASVs were determined by averaging the water column samples of the dominant shared ASV community and taking the 15 ASVs with the largest averaged relative abundance in the water column. (b) The log-scaled average relative abundance of the top 15 surface sediment-associated ASVs. The top 15 ASVs were determined by averaging the surface sediment samples of the dominant shared ASV community and taking the 15 ASVs with the largest average relative abundance in the surface sediments. Averages were used to highlight rare taxa. The spatial zone identified in beta-diversity analysis (inshore = 5 m, transition = 10 m, offshore = 15 and 20 m). WC = water column, Sed = surface sediment, and PA = particle-associated.
The dominant shared ASVs that were more water column-associated were composed of picocyanobacteria, Bacteroidia, and Planctomycetes (Figure 10a). Six of the water columns were dominated by ASVs of Synechococcus CC9902 and Cyanobium PCC-6307. Synechococcus CC9902-1 and Cyanobium PCC-6307-1 had the highest relative abundance and second highest relative abundance of the picocyanobacteria in the water column, respectively (Figure 10a). From the Bacteroidia community, there were two shared ASVs from Saprospiraceae, and one Flavobacteriaceae ASV, which all had higher relative abundance during the wet season. Unknown Saprospiraceae-1 relative abundance was highest in the transition zone in the water column and sinking particles. The Planctomycetes of the dominant shared community of the water column were composed of four unknown Pirellulaceae ASVs and a Blastopirellula ASV. With the exception of unknown Pirellulaceae-4, all other Planctomycetes ASVs were higher in the wet season, regardless of microbial habitat and spatial zone. Furthermore, outside of unknown Pirellulaceae-2, all Planctomycetes ASVs tended to be higher in offshore waters compared to the inshore. A trend that is observed in the particle-associated and surface-sediment community as well. Unknown Pirellulaceae-1 and unknown Pirellulaceae-2 appeared to bloom in the transition zone as reflected by their comparatively higher relative abundance in the water column and the higher relative abundance found in the sinking particles of the transition zone. A similar pattern was observed for unknown Saprospiraceae-1, and this pattern highlights the patchiness of these communities and may indicate their association with algal blooms.
The dominant shared ASVs were more associated with the surface sediments which were more diverse, and comprised Alphaproteobacteria ASVs, Bacteroidia ASVs, and known functional taxa such as Desulfocapsaceae and Nitrosopumilus. The most abundant sediment associated with ASV was the unknown Desulfocapsaceae-1 but had much greater relative abundances in the particle-associated communities. The sediment Alphaproteobacteria ASVs were composed of Methyloceanibacter-1, PS1 clade-1, unknown Rhizobiaceae-1, unknown Kiloniellaceae-1, unknown Rhizobiaceae-1, unknown Rhodobacteraceae-1, Filomicrobium-1, and Ruegeria-1. All of these ASVs were found in similar relative abundances within the particle-associated communities (Figure 10b). The shared dominant Bacteroidia ASVs of the surface sediments were Actibacter-1, unknown Cyclobacteriaceae-1, and unknown Flavobacteriaceae-2, which also had similar relative abundances in the particles associated communities. Interestingly, Cyanobium PCC-6307-1 was the second most abundant ASVs in the water column and was also found to have one of the highest relative abundances in the surface sediments. Cyanobium PCC-6307-1 tended to be higher in relative abundance during the wet season in the particle-associated and surface sediment communities. From this analysis, it is clear that the sediment-associated ASVs were found to be dominant in the particle-associated communities as well.
3.4.3. Indicator Bacteria in Inshore–Offshore Gradient
LEfSe was conducted on the shared ASVs community to identify the indicator ASVs of spatial zone to elucidate ASVs that are responding to riverine and terrestrial influence. The majority of spatial indicators were found through LEfSe analysis within particle-associated communities with 499 ASVs, followed by the sediments with 20 ASVs and the water column analysis identified 13 ASVs. The shared dominant ASVs found in these analyses were highlighted as they are more relevant in assessing the influence of terrestrial and estuarine inputs. (Table S2). Tracking these ASV changes in relative abundance through space and time in three microbial habitats can act as genetic tracers to assess the estuarization of the shelf overtime as human development along the coast continues. The LEfSe indicator ASVs were either more water column-associated or surface sediment associated, and inshore indicators will be focused on these as they are more relevant in highlighting terrestrial and estuarine influence.
From the water column, Cyanobium PCC-6307-2 and Synechococcus CC9902-4 were found to be inshore indicators in both the water column and particle-associated communities (Figure 11). Cyanobium PCC-6307-2 saw a great decline in relative abundance beyond the inshore waters. Within inshore zone, its abundance was twice as high during the wet season compared to the dry season (Figure 11a), primarily driven by higher relative abundance at site N5 compared to S5 (Figure 12a). The spatiotemporal trend of being higher in relative abundance during the wet season within the inshore waters was followed in both the particle-associated and surface sediment communities (Figure 10a and Figure 11a). Synechococcus CC9902-4 appears to be higher during the dry season compared to the wet season in all other microbial habitats and spatial zones (Figure 11b). Unknown Saprospiraceae-2 and unknown Flavobacteriaceae-3 were inshore indicators of the shared water column community (Figure 11). Unknown Saprospiraceae-2 showed a great increase in relative abundance during the wet season in all microbial habitats (Figure 10a and Figure 11c). Unknown Saprospiraceae-2’s relative abundance in the water column gradually declined along the inshore–offshore gradient which followed a similar trend in the surface sediments and particle-associated communities (Figure 11c). Unknown Flavobacteriaceae-3 was higher in relative abundance during the wet season in all microbial habitats with the inshore–offshore decline being most distinct in the dry season (Figure 11d). In addition, unknown Flavobacteriaceae-3, had higher relative abundance at site N5 compared to S5 indicating more estuarine influence (Figure 12b).
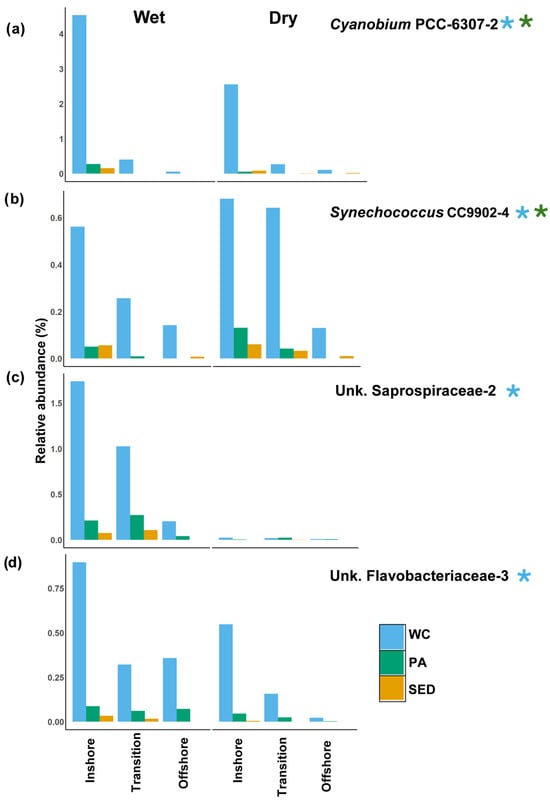
Figure 11.
Water column-associated inshore indicators from dominant shared ASV community. Average relative abundance of selected inshore indicators (LEfSe analysis) for each microbial habitat in spatial zones during the wet and dry seasons. (a) Average relative abundance of Cyanobium PCC-6307-2. (b) Average relative abundance of Synechococcus CC9902-4. (c) Average relative abundance of Unk. Saprospiraceae-2. (d) Average relative abundance of Unk. Flavobacteriaceae-3. Blue (*) indicates that the ASV was identified in the water column LEfSe analysis. Green (*) indicates that the ASV was identified in particle-associated LEfSe analysis. The spatial zone identified in beta-diversity analysis (inshore = 5 m, transition = 10 m, offshore = 15 and 20 m). Notice a difference in y axis values. WC = water column, Sed = surface sediment, and PA = particle-associated.
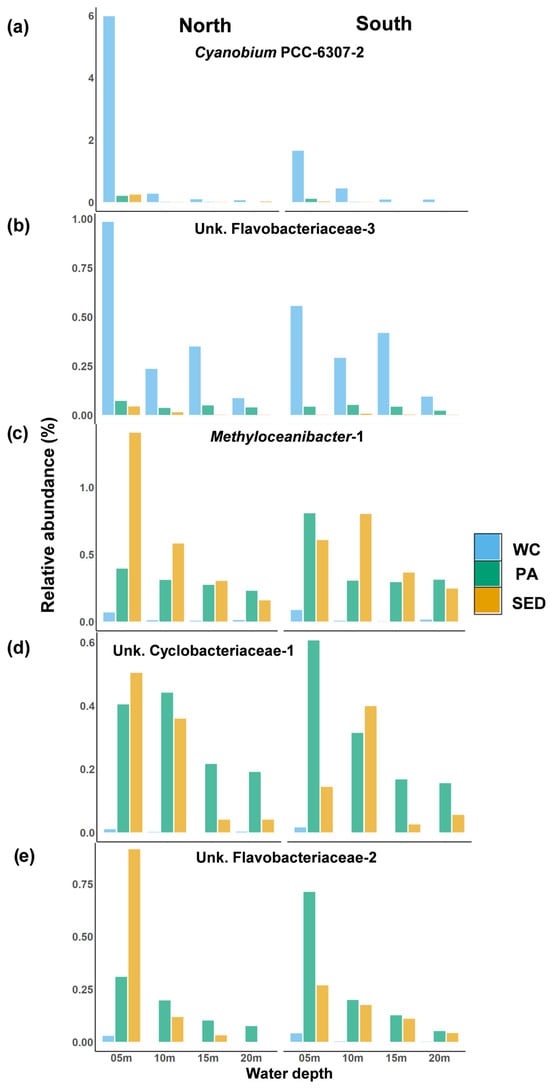
Figure 12.
Estuarine or riverine associated shared dominant ASVs. Average relative abundance of shared dominant ASVs at each sampling site compared between the north and south transects in each microbial habitat. (a,b) Average relative abundance of water column-associated ASVs ((a) Cyanobium PCC-6307-2. (b) Unk. Flavobacteriaceae-3). (c–e) Average relative abundance of surface sediment-associated ASVs ((c) Methyloceanibacter-1. (d) Unk. Cyclobacteriaceae-1. (e) Unk. Flavobacteriaceae-2). WC = water column, Sed = surface sediment, and PA = particle-associated.
The majority of the surface sediment-associated indicator ASVs were identified through analysis in the particle-associated communities (Table S2). Methyloceanibacter-1 was identified as an inshore indicator within the particle-associated communities, and in all three microbial habitats, its relative abundance declined along the inshore–offshore gradient with little seasonal variation (Figure 13a). In the surface sediments, Methyloceanibacter-1 was much higher at the site N5 compared to S5 (Figure 12c). Unknown Cyclobacteriaceae-1 and unknown Flavobacteriaceae-2 were both inshore indicators of the particle-associated communities which, in this environment, their relative abundance declined along the inshore–offshore gradient (Figure 13b,c). These organisms were prominent in the inshore surface sediments with a steep decline in the offshore sediments. Both of these ASVs’ higher inshore relative abundance in the particle-associated community was driven by site S5, but in the surface sediments, their relative abundance was higher at site N5 (Figure 12d,e). In all microbial habitats, unknown Flavobacteriaceae-2 greatly increased in relative abundance in all spatial zones during the dry season and was present in high relative abundances only inshore during the wet season (Figure 13c). Unknown Cyclobacteriaceae-1 shows no seasonal difference within the water column and surface sediments, but in the particle-associated community, it greatly increased in all spatial zones during the dry season (Figure 13b).
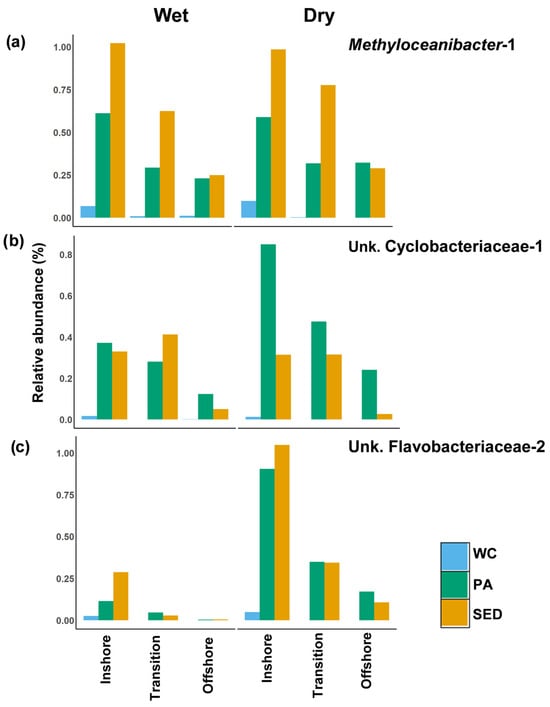
Figure 13.
Surface sediment associated inshore indicators from the dominant shared ASV community. Average relative abundance of selected inshore indicators (LEfSe analysis) for each microbial habitat in spatial zones during the wet and dry seasons. (a) Average relative abundance of Methyloceanibacter-1. (b) Average relative abundance of Unk. Cyclobacteriaceae-1. (c) Average relative abundance of Unk. Flavobacteriaceae-2. All surface sediment-associated inshore indicators were identified through LEfSe analysis within the particle-associated community. Spatial zone identified in beta-diversity analysis (inshore = 5 m, transition = 10 m, offshore = 15 and 20 m). Notice difference in y axis values. WC = water column, Sed = surface sediment, and PA = particle-associated.
4. Discussion
The original purpose of this study was to compare environmental parameters and their impact on the microbial communities between a northern transect positioned near the mouth of the CRE and one southern transect. The north transect was assumed to be more influenced by the CRE inputs. Although, parameters that would be expected to be affected by the CRE in the water column (e.g., salinity, CDOM, TN, and stable isotopes) and in the sediments and sinking particles (e.g., TOC%, TN%, and stable isotopes) were not significantly different between the two transects with the exception of site N5 for water quality parameters. Further, riverine-induced salinity stratification was detected once in July 2023 and did not extend past site N5, with no other occurrence of salinity stratification observed during the study period. The CRE is a smaller river system compared to other studies that saw a clear riverine influence on the coastal waters [49,50,51]. The tidal nature of the CRE, as evidenced by the upper estuary commonly reaching a salinity of 20 psu, in combination with the width of the estuary, lessens the distinct physical evidence of freshwater influence to the coast. As a result, the flood tides push the marine waters into the estuary, increasing the salinity of the freshwater plume [52]. However, even with the low flow and tidal nature of the estuary, the CRE appears to drive primary production in the system. When physical plume evidence was detected in July 2023, the highest Chl-a concentration in the study was measured. This supports the previous finding that the flow rate of the CR correlated with the Chl-a concentration in the coastal waters [8]. In addition, orthophosphate concentrations were high inshore, especially at site N5 (Figure S3), which was likely due to river flow. Based on the transect comparisons of environmental indicators of freshwater influence (e.g., salinity, CDOM, and stable isotopes), no strong patterns of riverine influence were observed past site N5 in this tidally dominant estuary, but freshwater influence appears to drive primary production into the offshore water during the wet season.
Clear inshore–offshore patterns in both environmental parameters and microbial communities were observed in the water column, sinking particles, and surface sediments, as seen in previous coastal studies [26,51,53,54], which is likely in part due to the CRE influence. Although, surface sediments are typically shown to be more driven by permeability and anthropogenic contamination with regard to microbial communities [55,56]. As seen in previous studies, δ13 C in the sediments was lower at the inshore sites, which may reflect more terrigenous organic matter derived from C3 plants within the watershed that were delivered to the coastal sediments through terrestrial run-off [49,57,58,59,60,61]. However, these studies did not investigate microbial communities, so it is unknown whether the prokaryote communities reflected these patterns as seen in this study. The inshore–offshore gradient in sediment microbial communities and sediment δ13 C in SWFL may be due to a resilient CSTB that creates a “forbidden zone” that is isolated from the loop current due to the coastal geometry creating a strong local upwelling, strengthening wind driven circulation [9,10]. This condition allows for particulate matter, nutrients, and other contaminants to build up and accumulate near the coastline rather than being transported offshore by the loop current. As a result, these particulate matters may be trapped inshore and eventually sink to the sea floor, inducing shifts in microbial communities or potentially inoculating the sediments with allochthonous microorganisms as previously hypothesized [33]. The freshwater discharge from the CR in combination with discharge from submarine springs [5] likely drove these spatial patterns in the water column and sinking particles which were magnified by the long residence times induced by the CSTB. However, the offshore sites may not be protected by this “forbidden zone”. During the wet season, the offshore water column and surface sediments displayed higher species diversity which could be explained by the influence of the nutrient-rich loop current which affects the West Florida Shelf in the summer [62]. Riverine and submarine discharge appears to greatly impact the SWFL coast as evidenced by the spatial patterns of environmental conditions and microbial communities in all microbial habitats.
The microbial communities in the water column and sinking particles were both clearly distinct between wet and dry seasons (Figure 5 and Figure 7), reflecting the changes in physiochemical and nutrient parameters. It appears that microbial communities are shaped by the environmental proxies of the inshore–offshore gradient, which seem to be most associated with community change during the wet season when parameters resulting in this gradient (e.g., nutrients, terrestrial influence/organic matter, and primary producer biomass) are at their greatest influence. The higher degree of allochthonous organic matter and nutrient run-off during the wet season sustains much more algal growth, which then in turn influences the prokaryotic community dynamics based on the quality and quantity of dissolved organic matter (DOM) that the algae exudates [63,64,65,66] resulting in the seasonal patterns of microbial communities commonly found in particle-associated and free-living communities [65,67,68]. Unknown Saprospiraceae bloomed during the wet season and is likely associated with algal growth. It was previously seen that Saprospiraceae is associated with the particle fraction (>3 µm) of the water column during spring blooms and is utilizing genes to degrade algal polysaccharides, including alginate [66]. Saprospiraceae appears to increase in the water column during the summer months [66,67]. The dominant Saprospiraceae ASVs of the water column also increased in relative abundance in the sinking particles during the summer. As this family is clearly associated with marine biofilms [66,69,70,71], it is possible that Saprospiraceae were associated with the algal growth of the wet season and were intertwined with marine snow that sank to the seafloor. This is supported by these Saprospiraceae ASVs being found in the surface sediments with a similar inshore–offshore decline during the wet season, but not during the dry season. Whether these Saprospiraceae phylotypes are active is beyond the scope of this study, but Saprospiraceae is commonly found in sediments [55,72]. Planctomycetes are known to employ sulfatases that degrade sulfated polysaccharides of algal origin, and it was shown that Planctomycetes, along with Verrucomicrobiae, were the main degraders of fucoidan during a diatom bloom and are common residents of the biofilms of macroalgae [66,73,74]. In the present study, Pirellulaceae represent the dominant Planctomycetes in all microbial habitats. A representative from this family, Pirellula, was associated with a diatom bloom off the coast of Oregon, USA [75]. The influence of the seasonal run-off on primary production in the region is highlighted by the fact that the relative abundance of Planctomycetes and Saprospiraceae extended further offshore during the wet season, reflecting the greater influence of the inshore–offshore gradient during this period. Furthermore, in July 2023, when riverine driven primary production was observed, Verrucomicrobiae (Puniceicoccaceae) increased in relative abundance in the water column, particularly in the offshore waters.
The particle-associated communities were directly shaped by marine primary production as well, as many associated algal and picocyanobacteria taxa increased in relative abundance during the wet season when chlorophyll concentrations were higher (Figure 7). There was a clear increase in Cyanobacteriia (Synechococcus CC9902 and Cyanobium PCC-6307) during the wet season in the particle-associated community. It has recently been shown that Synechococcus and Cyanobium, the picoplankton most responsible for this increase, can form aggregates with ballast minerals such as calcium carbonate, clay, and other sedimentary minerals. The proportion of the aggregate forming Synechococcus has been shown to be up to 85.4% of the total Synechococcus community [76,77]. This increase in Cyanobacteriia during the wet season in the particle-associated communities is likely due to this aggregating phenomenon as the region’s sediment contain a high amount of calcium carbonate [78]. In addition, there was not a stark seasonal difference between Cyanobacteriia populations in the water column which could explain the difference in the particle-associated communities. Picocyanobacteria being collected in the sediment traps indicate that these organisms play a more important role in particulate organic matter (POM) flux to the seafloor than has been previously indicated in POM flux studies [79]. Their presence in the particle-associated communities was also shown in the open ocean when sediment traps were deployed in the euphotic zone in the Sargasso Sea [80] supporting a significant role of picocyanobacteria in POM flux in the global ocean. Sediment-associated bacteria seem to have more influence on the particle-associated communities during the dry season. This was evident from the relative abundance of sediment-dominant Gammaproteobacteria (e.g., Woeseia, BD7-8, Thiotrichaceae) and Bacteroidia (e.g., Cyclobacteriaceae, Zeaxanthinibacter, Actibacter, Aquibacter) being higher in the particle-associated community during the dry seasons. This was likely due to the higher degree of sediment resuspension found in the region during the dry season [81].
The benthic community changed drastically following the passing of Hurricane Ian; characterized by the large-scale transportation of surface sediments and decreases in the cover of macrobenthic organisms such as seagrass, calcareous green algae, and fleshy macroalgae [48]. Hurricanes have previously been shown to drastically restructure surface sediment microbial communities in the coastal ecosystem [82,83]. Following the passage of Hurricane Ian, the surface sediment communities were drastically different compared to the communities in August 2022, which was particularly noticeable in the offshore sediments. This was likely due to hurricane-induced sediment resuspension, which lifts previously buried sediments into the water column, followed by their transport, sedimentation, and the subsequent restructuring of benthic communities [48,84]. The microbial evidence of this occurrence is that the class Dehalococcoidia has the highest relative abundance found in the study within the surface sediments and water column following the hurricane. Dehalococcoidia is typically found in sediments at depths of 10 cm and below with relative abundances increasing with sediment depth [85]. The presence of Dehalococcoidia in the surface sediments after Hurricane Harvey was also attributed to the transport of sediments [86] through the resuspension of deeper sediments.
Storm events are known to transport large amounts of terrestrial organic matter, such as lignin, to coastal regions [87], which is likely responsible for some of the other shifts in the community structure seen in this study. Taxa from Actinobacteria, Bacilli, and Clostridia are all known to produce genes capable of degrading terrestrial derived organic matter [88,89], all increased in the surface sediments one month after the Hurricane Ian. As follows, Planctomycetes and Bacteroidia, the typical degraders of algal derived organic matter in the sediments [73,90], declined in relative abundance. As seen in previous studies [82], the effects of the hurricane disturbance are short-lived and the community reverted back to near pre-hurricane conditions in March 2023 (post-6 months) with lignin-degrading taxa being almost absent in this sampling round. These hurricane impacts on the surfaces sediments could be potentially masking seasonal pattern of surface sediment microbial communities that have been previously found in coastal ecosystems [91,92].
The microorganisms of the water column and surface sediments display largely different lifestyles and different energy requirements, as reflected by large differences in beta diversity. Water column communities are typically dominated by free-living organisms that degrade smaller labile organic matter using aerobic respiration and microbial photoautotrophs [26,64,68,93,94]. While the surface sediments are composed of a much more diverse community, they are typically found attached to sedimentary materials, which allow better access to breakdown organic matter substrate that reaches the surface sediment, driving remineralization [55,90,93,95]. This is evident by the genus level differentiation of Alphaproteobacteria, Bacteroidia, and Gammaproteobacteria between the water column and the surface sediments which the classes are shown to be dominant in both communities [55,72,93]. Alphaproteobacteria of the water column were SAR11 and HIMB11 (Roseobacter) clades which are small celled organisms with streamlined genomes which require them to form associations with other organisms to provide all the nutrients required for growth [94,96]. SAR11 is found largely in the free-living fraction of the water column and displays more oligotrophic adaptation [65,66,94]. Similarly, Bacteroidia (e.g., NS marine clades, Formosa, and Cryomorphaceae) and Gammaproteobacteria (e.g., SAR86 and Halieaceae (OM60/NOR5)) of the water column degrade algal derived sugars, but are typically more closely associated with the algal bloom as they are found in the particles of the water column [35,63,64,65,97]. Both SAR11 and the Gammaproteobacteria OM43 display C1 (1 Carbon compounds) metabolism, oxidizing methylated compounds such as methanol into carbon dioxide, although SAR11 does not utilize this energy for biomass production, but for maintenance [94,98]. C1 compounds are prevalent throughout the water column, and in the case of OM43, are shown to be associated with algal biomass [64,75]. The surface sediment from Alphaproteobacteria also displays methylotrophic metabolism as Methyloceanibacter and Filomicrobium can oxidize methanol, and some strains of Methyloceanibacter can oxidize methane [99,100,101]. Sediment-associated Bacteroidia (Cyclobacteriaceae, Zeaxanthinibacter, Actibacter, and Robiginitalea) display growth on a wide range of sugars utilizing aerobic respiration [102,103,104,105], suggesting that Bacteroidia are aerobic degraders of smaller sized organic matter within the surface sediments. Sediment-associated Gammaproteobacteria was dominated by the Woesisa which are a diverse group of facultative anaerobes with evidence that supports metabolisms ranging from facultative chemolithoautotrophy to obligate chemoheterotrophic [106,107,108]. Woeseiales has been shown to shift their metabolism from sulfur oxidation to nitrite reduction with decreasing oxygen levels associated with the settling of organic matter on the seafloor [108]. This would increase success in a shallow shelf environment where sediment resuspension is persistent, leading to cycles of burial and resuspension and associated fluctuating oxygen exposure [35,84], explaining its increase during the dry season when wind-driven resuspension is prominent. Pirellulaceae, of the class Planctomycetes, were found to be a major component in the surface sediments communities throughout the study and bloomed in the water column during the wet season. In the coastal North Sea, Planctomycetes were hypothesized to be the main degraders of larger recalcitrant materials settling to the sediments from the water column [54]. They saw no significant phylogenetic differentiation between the Planctomycetes of the sediments and of the water column [55], which was similar to the current study.
The majority of organic matter that reaches the seafloor is mineralized by SRB, which employs dissimilatory sulfate reduction where organic matter is used as one of the electron donors and sulfate as the electron acceptor to generate energy typically under anaerobic conditions [109,110]. This recycling leads to substrate production for other biogeochemical cycling such as the sulfur and nitrogen cycle. As in previous coastal studies [55,90,111], the SRB community was dominated by Desulfosarcinaceae, Desulfocapsaceae, and Desulfobulbaceae. Desulfocapsaceae can be tolerant of oxygen as they contain enzymes involved in aerobic respiration and oxidative stress tolerance [111,112]. Sediment resuspension would increase a benthic microbial community’s exposure to toxic water [84], especially during the dry season, when sediment resuspension is greater. The oxygen tolerance of Desulfocapsaceae could explain why this group can dominate in the particle-associated SRB community. Desulfovibrio and Desulfobacula were recently shown to be the main SRB associated within anoxic and hypoxic bottom waters during a K. brevis bloom [21]. In our study, Desulfovibrio was most abundant in particle-associated SRB communities during the wet season (Figure S12. Desulfobacula, the main SRB of the K. brevis bloom, was only found in the sediment trap samples during the dry season, when sediment resuspension is at its peak (Figure S12). This suggests that Desulfobacula and Desulfovibrio are minor contributors to the surface sediment and on sinking particles that were potentially resuspended, but they dominate in hypoxic bottom waters where they can benefit from the large supply of fresh organic matter during K. brevis blooms. Furthermore, Desulfovibrio is known to have nitrogen-fixing capabilities and in which nitrogen fixing activity is shown to persist through resuspension which could provide nitrogen sources to the water column in a similar manner as Trichodesmium [113]. Nitrogen fixing, by Trichodesmium, is previously implicated in providing dissolved organic nitrogen that fuels Karenina brevis blooms [114], but heterotrophic non-cyanobacterial diazotrophs of the benthos such as SRB [113,115] could play a more significant role in a shallow shelf environment where resuspension is prominent.
As seen previously [116], the ammonia-oxidizing microorganisms of the surface sediments were dominated by AOA Nitrosopumilaceae. Nitrosococcaceae was also co-present in the same sediment samples, but in lower relative abundances. This observation differed from the ammonia-oxidizing community in the Yangtze River estuary which was more AOB dominant [117]. Nitrosopumilaceae increased in relative abundance in the surface sediments during the colder dry season, with no changes in Nitrosococcaceae relative abundance. It is well established that AOA are more adapted to lower ammonia concentrations relative to AOB [118,119] which explains its higher prevalence during the dry season when less organic matter is settling to the seafloor and less ammonia is produced. Nitrosomonadaceae was more dominant in the water column than Nitrosopumilaceae and was higher in relative abundance during the wet season when more nutrients and organic matter were introduced to the system. The seasonal patterns of AOA and AOB have been examined in Hood Canal and Puget Sound using molecular and activity-based methods [21]. Findings suggest that AOA dominates nitrification under low-ammonia conditions, while AOB increases with higher ammonia concentrations, supporting niche separation based on ammonia availability in estuarine ecosystems. AOA prefers lower concentrations of ammonia supplied at slow constant rates, such as through ammonia production through remineralization. AOB prefers higher concentrations supplied at a higher rate, as seen through inorganic and urea fertilizer usage in soil environments [120]. It was recently seen that the widespread usage of urea-based fertilizer in SWFL resulted in a pulse of higher urea concentrations following precipitation events resulting in increased algal growth [121]. This pulse of nitrogen runoff, in combination with the increased residence time of the region, which allows concentrations to accumulate, could lead to higher concentrations of ammonia, which select Nitrosomonadaceae rather than Nitrosopumilaceae. The subsequent step of nitrification after ammonia oxidation is nitrite oxidization, which was carried out by Nitrospira and Nitrospina within the surface sediments. These genera were the primary nitrite oxidizers of the surface sediment communities in coastal ecosystems [116].
The microbial habitat comparison of ASVs showed that the surface sediment and particle-associated communities had the highest percentage of shared microorganisms. As wind-driven sediment resuspension is prominent in shallow shelf environments [35,81], it is likely that many of these microbes were resuspended from the surface sediment and collected by the sediment traps. Sediment resuspension is correlated with bottom shear stress which is higher in shallower waters [35,122] which may be why the percentage of shared ASVs between the surface sediment and sinking particles declined towards the offshore waters. This is supported by the similarity of sediment characteristics between the sinking particles and surface sediments and of the higher-level taxonomic similarity between the surface sediments and particle-associated communities. Alternatively, the shared ASVs may contain prokaryotes that colonized on the particles within the water column and then sank to the sea floor, as previously hypothesized by [32], leading to their contribution in all microbial habitat communities.
Water column-associated shared ASVs appear to be associated with primary production, either being phototrophs such as picocyanobacteria (Synechococcus CC9902 and Cyanobium PCC-6307), or algal matter-associated taxa such as Pirellulaceae and Saprospiraceae, which bloomed during the wet season. Several of these ASVs were more associated with inshore communities driven by terrestrial inputs; with some indicator ASVs being more likely derived directly from the CR inputs, as assessed by proximity to site N5. As the influence of environmental factors and dispersal limitations on microbial diversity are dependent on a spatial scale [28], these taxa can be assumed to be shaped by the influence of the inshore–offshore gradient driven by estuarine run-off. What is unclear is whether these organisms were introduced into the coastal system from terrestrial and estuarine habitats, or whether these organisms were already present in the coastal habitat and selected by the seasonal changes impacting the inshore communities. Cyanobium PCC-6307-2 and unknown Flavobacteriaceae-3 were more prevalent at site N5, the site closest to the river mouth, relative to site S5 (Figure 1). There is evidence of riverine systems delivering microorganisms to the coastal waters [53,76] and the great increase in shared ASVs between the water column and particle-associated communities during the wet season in the inshore environment supports this idea as microorganisms associated with particles delivered to the coastal water by riverine input would be shared between these two microbial habitats. Cyanobium was found in higher relative abundances closer to the shore. Some Cyanobium strains were recently shown to form aggregates in coordination with estuarine-derived ballast material such as clay and calcium carbonate [77]. If Cyanobium PCC-6307-2 is one of these aggregate-forming phylotypes, then it could be potentially exported from the CRE and then settle to the coastal sea floor, but more studies are required to determine the degree of activity when reaching the sediments. Although not identified as a spatial indicator, Cyanobium PCC-6307-1 was likely one of these aggregate-forming phylotypes as it was found to be in high relative abundance in the particle-associated and surface sediment communities, which could highlight this organism’s impact on picocyanobacterial POC flux to the seafloor that was previously seen in the deep sea environments [122]. Within the water column, unknown Pirellulaceae-3 was a shared ASV associated with the offshore environment. These organisms are likely associated with decaying algal material [73,75], which explains the higher relative abundance in the water column during the wet season. Unknown Pirellulaceae-3 could then sink to the bottom, inoculating the surface sediment and causing the proliferation of this organism in the offshore surface sediments during the dry season.
The dominant shared ASVs in the sediment were more phylogenetically diverse but were primarily composed of aerobic bacteria involved in organic matter degradation, such as Methyloceanibacter and representatives from the class Bacteroidia. The most abundant shared ASV in the surface sediments was an oxygen-tolerant SRB (unknown Desulfocapsaceae-1), which may survive resuspension and thus show higher relative abundances in particle-associated communities [111,113]. Unknown Cyclobacteriaceae-1 and unknown Flavobacteriaceae-2 of Bacteroidia were residents of the surface sediment and representatives of these families are involved in the degradation of sugars in a wide range of habitats [55,103]. Their relative abundance in particle-associated communities increased significantly during the dry season, when wind-driven sediment resuspension is at its peak in the region [81]. These ASVs were found in higher relative abundance in the surface sediment at site N5 compared to S5, indicating that the ASVs, or the organic matter they are degrading is more of estuarine origin. Furthermore, their relative abundance in the particle-associated community was highest at site S5, which could be explained by the sediments at site N5 acting as a seed bank for dispersal through sediment resuspension, leading to microbial community reassembly down the coastline [123].
The dominant shared ASVs in the surface sediments were involved in biogeochemical cycling. Sediment resuspension has been shown to influence their metabolism [113]. The methylotroph, Methyloceanibacter-1, was associated with the inshore communities responding to organic matter inputs either derived from estuarine sources or from settling algal derived organic matter where methylotrophs are known to be associated [101,124]. Methyloceanibacter-1 has a higher relative abundance at N5 compared to S5, so its growth may be derived from organic matter of estuarine origin, or algal growth more associated with nutrient rich estuarine waters. Some strains of Methyloceanibacter show nitrous oxide production when grown with nitrate under-oxygen depleted environments [101]. Increased sediment resuspension exposes benthic microbial communities to more oxygen, which can reduce nitrous oxide production by Methyloceanibacter. This shift in biogeochemical cycling dynamics may, in turn, influence greenhouse gas emissions. It was previously observed [123] that Nitrosopumilus-1 also showed signs of its involvement in sediment resuspension. Nitrosopumilus-1 was found more dominant in the surface sediments but was found in the offshore waters following Hurricane Ian when sediment resuspension would be at its highest. Following the hurricane in the dry season, this ASV was found more frequently in the particle-associated community, again showing how sediment resuspension could potentially have impacts on nutrient cycling dynamics. With regard to the inshore indicator ASV of the shared community, it is not clear whether these microorganisms are active, and in turn, the degree of ecological significance. RNA-sequencing and other transcript-based studies would be required to identify the extent of their activity, but the ASVs highlighted in the present study could be used as genetic tracers to track the riverine and terrestrial influence on the coastal zone through multiple microbial habitats.
5. Conclusions
Seasonal inputs play a major role in shaping environmental conditions on the SWFL shelf. Attempts to assess the impact of CRE discharge through transect comparisons did not reveal any significant differences in freshwater-influenced parameters beyond the inshore waters. The tidal nature of the CRE may be masking the traditional signatures of river plumes in this environment, but the CRE inputs supplied higher nutrients at site N5 and sustained higher Chl-a concentrations during the wet season when flow would be highest. The inshore–offshore patterns were found regardless of the season, as expected with the higher residence times in the region, and were likely shaped through a combination of CRE outputs, other surface water runoff, and groundwater discharge. Following similar trends as the environmental parameters, the microbial communities were shaped spatiotemporally in all microbial habitats. Surface sediments were greatly impacted by the effects of Hurricane Ian through large-scale sediment resuspension and reverted to near pre-hurricane conditions after six months. Water column- and particle-associated communities were distinctive between the wet and dry seasons, and all microbial habitat communities grouped into inshore, transition, and offshore clusters.
The similarities of the sedimentary characteristics and microbial communities between sinking particles and surface sediments suggest that the majority of material in the sediment traps were derived from resuspended sediment. This should be considered with future studies using sediment traps in shallow shelf environments. Based on microbial evidence, there appears to be a seasonal impact on sinking particles. The particle-associated communities during the dry season were more shaped by sediment-associated taxa when sediment flux was higher. The wet season communities were shaped by the sinking particles of algal derived marine snow origin when Chl-a was higher, indicating that water column particles were collected more often during the wet season. Shared community analysis supported the hypothesis made by [33], but sinking particles inoculating the sediments could originate from sediment resuspension as well as through marine snow deposition. Further studies are required to determine the degree of activity of these microorganisms in the surface sediments
Several inshore indicator ASVs were found that were dominant in all microbial habitats and are likely introduced or selected due to material flux from terrestrial environments conveyed via river flow. Based on its spatial patterns, Cyanobium PCC-6307-2, potentially a more freshwater phylotype, was physically exported to the coastal waters. The spatial patterns of surface sediment inshore indicators (i.e., Methyloceanibacter-1, Unknown Cyclobacteriaceae-1, and unknown Flavobacteriaceae-2) having the highest relative abundances at N5 and S5 in the surface sediment and sinking particles, respectively, indicates that N5 sediments may act as a seed bank for dispersal to the offshore environments. As the more traditional evidence of riverine influence was not captured in this tidally dominant estuary, the microbial indicator ASVs identified in this study could be used as a genetic tracer to track the degree of freshwater influence over time as the human population and associated pollution increases.
Supplementary Materials
The following supporting information can be downloaded at https://www.mdpi.com/article/10.3390/coasts5040047/s1, Table S1. Dominant shared ASV community. Average relative abundance (%) and standard deviation of ASVs in each microbial habitat that were found in at least 10% of samples for each microbial habitat with an average relative abundance of >0.01%. Table S2. Zone indicators from the dominant shared community. Average relative abundance (%) and standard deviation of indicator ASVs in each spatial zone for each microbial habitat. The community identified indicates the community in which LEfSe analysis identified the ASV as an indicator. The indicator zone is the spatial zone that the ASV is most associated in. Spatial zone identified in beta-diversity analysis (Inshore = 5 m, Transition = 10 m, offshore = 15 and 20 m). Figure S1. Design of custom-made sediment traps. (a) Design of sediment traps collecting particles at sites at a water depth of 10 m, 15 m, and 20 m. (b) The design for sites with a water depth of 5 m. Figure S2. Surface and bottom water comparisons of physiochemical and nutrient parameters. Points represent individual measurements collected from the wet and dry seasons. Boxplots represent the interquartile range with the median as the central tendency. Y axis has different intervals. Dissolved oxygen (DO), chromophoric dissolved organic matter (CDOM), chlorophyll a (Chl-a), ortho-phosphate (oP), picocyanobacterial total cell counts (Pico), and total cell counts (TCCs). Note that only surface water was taken in October 2022, which explains differing wet season temperatures and cDOM. Figure S3. Transect comparison of the environmental data. (a) Water column (b) sinking particles and (c) surface sediments. Points represent individual measurements collected from the different water depth levels. Boxplots represent the interquartile range with the median as the central tendency. Y axis has different intervals. Dissolved oxygen (DO), chromophoric dissolved organic matter (CDOM), Chlorophyll a (Chl-a), stable nitrogen isotope (δ15N), stable carbon isotope (δ13C), orthophosphate (oP), total nitrogen (TN), and total organic carbon (TOC). Figure S4. Spatiotemporal patterns of (a) total cell counts (TCCs) and (b) picocyanobacteria abundances. Points represent individual measurements collected from the wet and dry seasons. Boxplots represent the interquartile range with the median as the central tendency. Y axis has different intervals. X axis is the water depth collected from. Figure S5. Seasonal difference in sediment fluxes. Sedimentation flux is calculated from mass collected in sediment traps for each site during the wet and dry seasons. Figure S6. Surface and bottom comparison of water column microbial community structure and diversity. (a) Non-metric multidimensional scaling (NMDS) ordination (k = 2, stress = 0.1797) of prokaryote communities based on Bray–Curtis dissimilarity between collection depth. Ellipses show the 95% confidence interval for the mean centroid of each collection depth. (b) Hill–Shannon diversity between the surface and bottom waters. Boxplots represent the interquartile range with median as the central tendency. Figure S7. Microbial community beta diversity between microbial habitats. Cluster analysis derived from Bray–Curtis dissimilarities from all sample habitats. R2 = August 2022, R3 = October 2022, R4 = January 2023, R5 = March 2023, R6 = July 2023, and R7 = August 2023. W1= July 2023, W2 = August 2023, D1 = February 2023, D2 = March 2023. WC = water column, Sed = surface sediment, and PA = particle-associated. Figure S8. Relative abundance of taxa in water column microbial communities at each sampling site between sampling rounds. Surface and bottom water relative abundances were averaged. (a) Class level community (b) Family level community. Other represents the taxa less than 1% relative abundance. Figure S9. Relative abundance of particle-associated communities at each sampling site between sampling rounds. (a) Class level community (b) Family level community. Other represents the taxa less than 1% relative abundance. Figure S10. Relative abundance of the surface sediment communities at each sampling site between sampling rounds. (a) Class-level community; (b) Family-level community. Other represents the taxa less than 1% relative abundance. Figure S11. Relative abundance of the class Dehalococcoidia. (a) Relative abundance of Dehalococcoidia in the water column during each sampling round within spatial zones. (b) Relative abundance of Dehalococcoidia in the surface sediments during each sampling round within spatial zones. Y axis has different values. Figure S12. Karenia brevis-associated sulfate reducing bacteria. Average relative abundance of Desulfobacula and Desulfovibrio in spatial zones during each sampling round within the (a) sinking particles and (b) surface sediments communities.
Author Contributions
Conceptualization, H.U. and J.G.D.; methodology, T.R.T. and H.U.; software, T.R.T.; validation, H.U.; formal analysis, T.R.T.; investigation, T.R.T. and R.M.S.; resources, H.U.; data curation, T.R.T. and R.M.S.; writing—original draft preparation, T.R.T.; writing—review and editing, H.U., J.G.D., P.L.A. and A.B.C.; visualization, T.R.T. and R.M.S.; supervision, H.U.; project administration, J.G.D., H.U. and P.L.A.; funding acquisition, J.G.D., H.U. and P.L.A. All authors have read and agreed to the published version of the manuscript.
Funding
This work was supported by the U.S. Environmental Protection Agency grant number SF-02D20922 to J.G.D., and US National Science Foundation Award OCE-2309659 to P.L.A. and partial ship time to the investigators was awarded by the Florida Institute of Oceanography.
Data Availability Statement
The raw data supporting the conclusions of this article will be made available by the authors on request.
Acknowledgments
We would like to acknowledge the captain and crew of R/V Hogarth and R/V Weatherbird II for their help with sampling efforts. In addition, we thank all the undergraduate students and divers who assisted with fieldwork. We are grateful to Richard Bartleson at Sanibel-Captiva Conservation Foundation for his critical reading of the manuscript. We also thank Haruka Urakawa at FGCU for her support and help with preparation throughout this study.
Conflicts of Interest
The authors declare no conflicts of interest.
Abbreviations
The following abbreviations are used in this manuscript:
| AOA | Ammonia-Oxidizing Archaea |
| AOB | Ammonia-Oxidizing Bacteria |
| ASV | Amplicon Sequence Variant |
| CDOM | Chromophoric Dissolved Organic Matter |
| Chl-a | Chlorophyll-a |
| CR | Caloosahatchee River |
| CRE | Caloosahatchee River Estuary |
| CSTB | Cross-Shelf Transport Barrier |
| DO | Dissolved Oxygen |
| DOM | Dissolved Organic Matter |
| FGCU | Florida Gulf Coast University |
| FIO | Florida Institute of Oceanography |
| LEfSe | Linear Discriminant Analysis Effect Size |
| PA | Particle-Associated |
| SED | Surface Sediment |
| SPOM | Suspended Particulate Organic Matter |
| SRB | Sulfate-Reducing Bacteria |
| SWFL | Southwest Florida |
| TN | Total Nitrogen |
| TOC | Total Organic Carbon |
| TP | Total Phosphorous |
| WC | Water Column |
References
- Häder, D.-P.; Banaszak, A.T.; Villafañe, V.E.; Narvarte, M.A.; González, R.A.; Helbling, E.W. Anthropogenic pollution of aquatic ecosystems: Emerging problems with global implications. Sci. Total Environ. 2020, 713, 136586. [Google Scholar] [CrossRef]
- Malone, T.C.; Newton, A. The globalization of cultural eutrophication in the coastal ocean: Causes and consequences. Front. Mar. Sci. 2020, 7, 670. [Google Scholar] [CrossRef]
- Doering, P.H.; Chamberlain, R.H. Water quality and source of freshwater discharge to the Caloosahatchee estuary, Florida. J. Am. Water Resour. Assoc. 1999, 35, 793–806. [Google Scholar] [CrossRef]
- Barnes, T. Caloosahatchee estuary conceptual ecological model. Wetlands 2005, 25, 884–897. [Google Scholar] [CrossRef]
- Brewton, R.A.; Kreiger, L.B.; Tyre, K.N.; Baladi, D.; Wilking, L.E.; Herren, L.W.; Lapointe, B.E. Septic system–groundwater–surface water couplings in waterfront communities contribute to harmful algal blooms in southwest Florida. Sci. Total Environ. 2022, 837, 155319. [Google Scholar] [CrossRef]
- Shaddox, T.W.; Unruh, J.B.; Johnson, M.E.; Brown, C.D.; Stacey, G. Nutrient use and management practices on United States golf courses. Horttechnology 2023, 33, 79–97. [Google Scholar] [CrossRef]
- Buzzelli, C.; Wachnicka, A.; Zheng, F.; Chen, Z.; Baldwin, L.; Kahn-Dickens, A. Chapter 8C: St. Lucie and Caloosahatchee River watershed research and water quality monitoring results and activities. In South Florida Environmental Report; South Florida Water Management District (SFWMD): West Palm Beach, FL, USA, 2018; Volume 1, pp. 1–48. [Google Scholar]
- Rumbold, D.G.; Doering, P.H. Water quality and source of freshwater discharge to the Caloosahatchee estuary, Florida: 2009–2018. Fla. Sci. 2020, 83, 1–20. [Google Scholar]
- Olascoaga, M.J.; Rypina, I.I.; Brown, M.G.; Beron-Vera, F.J.; Koçak, H.; Brand, L.E.; Halliwell, G.R.; Shay, L.K. Persistent transport barrier on the West Florida Shelf. Geophys. Res. Lett. 2006, 33, 2006GL027800. [Google Scholar] [CrossRef]
- Yang, H.; Weisberg, R.H.; Niiler, P.P.; Sturges, W.; Johnson, W. Lagrangian circulation and forbidden zone on the West Florida Shelf. Cont. Shelf Res. 1999, 19, 1221–1245. [Google Scholar] [CrossRef]
- Satinsky, B.M.; Smith, C.B.; Sharma, S.; Landa, M.; Medeiros, P.M.; Coles, V.J.; Yager, P.L.; Crump, B.C.; Moran, M.A. Expression patterns of elemental cycling genes in the Amazon River plume. ISME J. 2017, 11, 1852–1864. [Google Scholar] [CrossRef]
- Romero, E.; Garnier, J.; Lassaletta, L.; Billen, G.; Le Gendre, R.; Riou, P.; Cugier, P. Large-scale patterns of river inputs in southwestern Europe: Seasonal and interannual variations and potential eutrophication effects at the coastal zone. Biogeochemistry 2013, 113, 481–505. [Google Scholar] [CrossRef]
- Buzzelli, C.; Doering, P.; Wan, Y.; Sun, D. Modeling ecosystem processes with variable freshwater inflow to the Caloosahatchee River Estuary, southwest Florida. II. Nutrient loading, submarine light, and seagrasses. Estuar. Coast. Shelf Sci. 2014, 151, 272–284. [Google Scholar] [CrossRef]
- Douglass, J.G.; Chamberlain, R.H.; Wan, Y.; Doering, P.H. Submerged vegetation responses to climate variation and altered hydrology in a subtropical estuary: Interpreting 33 years of change. Estuaries Coast 2020, 43, 1406–1424. [Google Scholar] [CrossRef] [PubMed]
- Julian II, P.; Thompson, M. Dark waters: Evaluating seagrass community response to optical water quality and freshwater discharges in a highly managed subtropical estuary. Reg. Stud. Mar. Sci. 2024, 69, 103302. [Google Scholar] [CrossRef]
- Brand, L.E.; Compton, A. Long-term increase in Karenia brevis abundance along the southwest Florida coast. Harmful Algae 2007, 6, 232–252. [Google Scholar] [CrossRef] [PubMed]
- Yentsch, C.S.; Lapointe, B.E.; Poulton, N.; Phinney, D.A. Anatomy of a red tide bloom off the southwest coast of Florida. Harmful Algae 2008, 7, 817–826. [Google Scholar] [CrossRef]
- Milbrandt, E.C.; Martignette, A.J.; Thompson, M.A.; Bartleson, R.D.; Phlips, E.J.; Badylak, S.; Nelson, N.G. Geospatial distribution of hypoxia associated with a Karenia brevis bloom. Estuar. Coast Shelf Sci. 2021, 259, 107446. [Google Scholar] [CrossRef]
- Falkowski, P.G.; Fenchel, T.; DeLong, E.F. The microbial engines that drive Earth’s biogeochemical cycles. Science 2008, 320, 1034–1039. [Google Scholar] [CrossRef]
- Fei, C.; Booker, A.; Klass, S.; Vidyarathna, N.K.; Ahn, S.H.; Mohamed, A.R.; Arshad, M.; Glibert, P.M.; Heil, C.A.; Martínez Martínez, J.; et al. Friends and foes: Symbiotic and algicidal bacterial influence on Karenia brevis blooms. ISME Commun. 2025, 5, ycae164. [Google Scholar] [CrossRef]
- Urakawa, H.; Adhikari, P.L.; Urakawa, H.E.; Bartleson, R.D.; Rumbold, D.G. Microbial assessment of the ecological linkage between a red tide of Karenia brevis and bottom water anoxia off the coast of Fort Myers and Sanibel Island, Florida. Reg. Stud. Mar. Sci. 2024, 78, 103765. [Google Scholar] [CrossRef]
- King, G.M.; Smith, C.; Tolar, B.; Hollibaugh, J.T. Analysis of composition and structure of coastal to mesopelagic bacterioplankton communities in the Northern Gulf of Mexico. Front. Microbiol. 2013, 3, 438. [Google Scholar] [CrossRef] [PubMed]
- Urakawa, H.; Martens-Habbena, W.; Huguet, C.; de la Torre, J.R.; Ingalls, A.E.; Devol, A.H.; Stahl, D.A. Ammonia availability shapes the seasonal distribution and activity of archaeal and bacterial ammonia oxidizers in the Puget Sound estuary. Limnol. Oceanogr. 2014, 59, 1321–1335. [Google Scholar] [CrossRef]
- Sunagawa, S.; Coelho, L.P.; Chaffron, S.; Kultima, J.R.; Labadie, K.; Salazar, G.; Djahanschiri, B.; Zeller, G.; Mende, D.R.; Alberti, A.; et al. Structure and function of the global ocean microbiome. Science 2015, 348, 1261359. [Google Scholar] [CrossRef] [PubMed]
- Urakawa, H.; Bernhard, A.E. Wetland management using microbial indicators. Ecol. Eng. 2017, 108, 456–476. [Google Scholar] [CrossRef]
- Wang, Z.; Juarez, D.L.; Pan, J.; Blinebry, S.K.; Gronniger, J.; Clark, J.S.; Johnson, Z.I.; Hunt, D.E. Microbial communities across nearshore to offshore coastal transects are primarily shaped by distance and temperature. Environ. Microbiol. 2019, 21, 3862–3872. [Google Scholar] [CrossRef]
- Basili, M.; Campanelli, A.; Frapiccini, E.; Luna, G.M.; Quero, G.M. Occurrence and distribution of microbial pollutants in coastal areas of the adriatic sea influenced by river discharge. Environ. Pollut. 2021, 285, 117672. [Google Scholar] [CrossRef]
- Martiny, J.B.H.; Eisen, J.A.; Penn, K.; Allison, S.D.; Horner-Devine, M.C. Drivers of bacterial β-diversity depend on spatial scale. Proc. Natl. Acad. Sci. USA 2011, 108, 7850–7854. [Google Scholar] [CrossRef]
- Mönnich, J.; Tebben, J.; Bergemann, J.; Case, R.; Wohlrab, S.; Harder, T. Niche-based assembly of bacterial consortia on the diatom thalassiosira rotula is stable and reproducible. ISME J. 2020, 14, 1614–1625. [Google Scholar] [CrossRef]
- Jackrel, S.L.; Yang, J.W.; Schmidt, K.C.; Denef, V.J. Host specificity of microbiome assembly and its fitness effects in phytoplankton. ISME J. 2021, 15, 774–788. [Google Scholar] [CrossRef]
- Baker, D.; Lauer, J.; Ortega, A.; Jackrel, S.L.; Denef, V.J. Effects of phycosphere bacteria on their algal host are host species-specific and not phylogenetically conserved. Microorganisms 2022, 11, 62. [Google Scholar] [CrossRef]
- Xiao, X.; Pei, M.; Liu, X.; Zhao, Y.; Liang, Y. Planktonic algal bloom significantly alters sediment bacterial community structure. J. Soils Sediments 2017, 17, 2547–2556. [Google Scholar] [CrossRef]
- Novitsky, J. Evidence for sedimenting particles as the origin of the microbial community in a coastal marine sediment. Mar. Ecol. Prog. Ser. 1990, 60, 161–167. [Google Scholar] [CrossRef]
- Urakawa, H.; Yoshida, T.; Nishimura, M.; Ohwada, K. Characterization of depth-related population variation in microbial communities of a coastal marine sediment using 16s rdna-based approaches and quinone profiling. Environ. Microbiol. 2000, 2, 542–554. [Google Scholar] [CrossRef] [PubMed]
- Yang, Y.; Wang, Y.P.; Gao, S.; Wang, X.H.; Shi, B.W.; Zhou, L.; Wang, D.D.; Dai, C.; Li, G.C. Sediment resuspension in tidally dominated coastal environments: New insights into the threshold for initial movement. Ocean Dyn. 2016, 66, 401–417. [Google Scholar] [CrossRef]
- Parada, A.E.; Needham, D.M.; Fuhrman, J.A. Every base matters: Assessing small subunit rrna primers for marine microbiomes with mock communities, time series and global field samples. Environ. Microbiol. 2016, 18, 1403–1414. [Google Scholar] [CrossRef] [PubMed]
- Bolyen, E.; Rideout, J.R.; Dillon, M.R.; Bokulich, N.A.; Abnet, C.C.; Al-Ghalith, G.A.; Alexander, H.; Alm, E.J.; Arumugam, M.; Asnicar, F.; et al. Reproducible, interactive, scalable and extensible microbiome data science using qiime 2. Nat. Biotechnol. 2019, 37, 852–857. [Google Scholar] [CrossRef]
- Callahan, B.J.; McMurdie, P.J.; Rosen, M.J.; Han, A.W.; Johnson, A.J.A.; Holmes, S.P. DADA2: High-resolution sample inference from illumina amplicon data. Nat. Methods. 2016, 13, 581–583. [Google Scholar] [CrossRef]
- Quast, C.; Pruesse, E.; Yilmaz, P.; Gerken, J.; Schweer, T.; Yarza, P.; Peplies, J.; Glöckner, F.O. The silva ribosomal RNA gene database project: Improved data processing and web-based tools. Nucleic Acids Res. 2013, 41, D590–D596. [Google Scholar] [CrossRef]
- Robeson, M.S.; O’Rourke, D.R.; Kaehler, B.D.; Ziemski, M.; Dillon, M.R.; Foster, J.T.; Bokulich, N.A. RESCRIPt: Reproducible sequence taxonomy reference database management. PLoS Comput. Biol. 2021, 17, e1009581. [Google Scholar] [CrossRef]
- Wickham, H. Ggplot2. Wiley Interdiscip. Rev. Comput. Stat. 2011, 3, 180–185. [Google Scholar] [CrossRef]
- Wheeler, B.; Torchiano, M.; Torchiano, M.M. Package ‘lmPerm’; Version 2.1.0; R Foundation for Statistical Computing: Vienna, Austria, 2016. [Google Scholar]
- Oksanen, J.; Simpson, G.L.; Blanchet, F.G.; Kindt, R.; Legendre, P.; Minchin, P.R.; O’Hara, R.B.; Solymos, P.; Stevens, M.H.H.; Szoecs, E.; et al. Vegan: Community Ecology Package 2025. Available online: https://cran.r-project.org/web/packages/vegan/index.html (accessed on 24 March 2025).
- Wood, S.N.; Pya, N.; Säfken, B. Smoothing parameter and model selection for general smooth models. J. Am. Stat. Assoc. 2016, 111, 1548–1563. [Google Scholar] [CrossRef]
- Gao, C.-H.; Chen, C.; Dusa, A.; Yu, G.; Cao, B.; Cai, P. ggVennDiagram: Intuitive Venn Diagram Software Extended—Gao—2024—iMeta—Wiley Online Library. Available online: https://onlinelibrary.wiley.com/doi/10.1002/imt2.177 (accessed on 2 March 2025).
- Segata, N.; Izard, J.; Waldron, L.; Gevers, D.; Miropolsky, L.; Garrett, W.S.; Huttenhower, C. Metagenomic biomarker discovery and explanation. Genome Biol. 2011, 12, R60. [Google Scholar] [CrossRef] [PubMed]
- Cao, Y.; Dong, Q.; Wang, D.; Zhang, P.; Liu, Y.; Niu, C. microbiomeMarker: An R/bioconductor package for microbiome marker identification and visualization. Bioinformatics 2022, 38, 4027–4029. [Google Scholar] [CrossRef] [PubMed]
- Tillman, M.C.; Smith, R.M.; Tubbs, T.R.; Catasus, A.B.; Urakawa, H.; Adhikari, P.L.; Douglass, J.G. Acute impacts of hurricane ian on benthic habitats, water quality, and microbial community composition on the southwest Florida shelf. Coasts 2025, 5, 16. [Google Scholar] [CrossRef]
- Waterson, E.J.; Canuel, E.A. Sources of sedimentary organic matter in the Mississippi River and adjacent Gulf of Mexico as revealed by lipid biomarker and δ13CTOC analyses. Org. Geochem. 2008, 39, 422–439. [Google Scholar] [CrossRef]
- Ye, F.; Guo, W.; Shi, Z.; Jia, G.; Wei, G. Seasonal dynamics of particulate organic matter and its response to flooding in the Pearl River Estuary, China, revealed by stable isotope (δ13 C and δ15 N) analyses. J. Geophys. Res. Oceans 2017, 122, 6835–6856. [Google Scholar] [CrossRef]
- Kieft, B.; Crump, B.; White, A.; Goñi, M.; Mueller, R. Winter river plumes shape community composition and activity of heterotrophic microorganisms on the Oregon coast. Aquat. Microb. Ecol. 2020, 84, 15–29. [Google Scholar] [CrossRef]
- Qiu, C.; Wan, Y. Time series modeling and prediction of salinity in the Caloosahatchee River Estuary: Time series modeling of estuarine salinity. Water Resour. Res. 2013, 49, 5804–5816. [Google Scholar] [CrossRef]
- Fortunato, C.S.; Eiler, A.; Herfort, L.; Needoba, J.A.; Peterson, T.D.; Crump, B.C. Determining indicator taxa across spatial and seasonal gradients in the Columbia River coastal margin. ISME J. 2013, 7, 1899–1911. [Google Scholar] [CrossRef]
- Mason, O.U.; Canter, E.J.; Gillies, L.E.; Paisie, T.K.; Roberts, B.J. Mississippi River plume enriches microbial diversity in the northern Gulf of Mexico. Front. Microbiol. 2016, 7, 01048. [Google Scholar] [CrossRef]
- Probandt, D.; Knittel, K.; Tegetmeyer, H.E.; Ahmerkamp, S.; Holtappels, M.; Amann, R. Permeability shapes bacterial communities in sublittoral surface sediments. Environ. Microbiol. 2017, 19, 1584–1599. [Google Scholar] [CrossRef]
- Guo, X.; Yang, Y.; Niu, Z.; Lu, D.-P.; Zhu, C.; Feng, J.; Wu, J.; Chen, Y.; Tou, F.; Liu, M.; et al. characteristics of microbial community indicate anthropogenic impact on the sediments along the Yangtze Estuary and its coastal area, China. Sci. Total Environ. 2019, 648, 306–314. [Google Scholar] [CrossRef] [PubMed]
- Yu, F.; Zong, Y.; Lloyd, J.M.; Huang, G.; Leng, M.J.; Kendrick, C.; Lamb, A.L.; Yim, W.W.-S. Bulk organic δ13C and C/N as indicators for sediment sources in the Pearl River Delta and Estuary, Southern China. Estuar. Coast Shelf Sci. 2010, 87, 618–630. [Google Scholar] [CrossRef]
- Sampaio, L.; Freitas, R.; Máguas, C.; Rodrigues, A.; Quintino, V. Coastal sediments under the influence of multiple organic enrichment sources: An evaluation using carbon and nitrogen stable isotopes. Mar. Pollut. Bull. 2010, 60, 272–282. [Google Scholar] [CrossRef] [PubMed]
- Li, Y.; Zhang, H.; Tu, C.; Fu, C.; Xue, Y.; Luo, Y. Sources and fate of organic carbon and nitrogen from land to ocean: Identified by coupling stable isotopes with c/n ratio. Estuar. Coast Shelf Sci. 2016, 181, 114–122. [Google Scholar] [CrossRef]
- Liu, X.; Tang, D.; Ge, C. Distribution and sources of organic carbon, nitrogen and their isotopic composition in surface sediments from the southern Yellow Sea, China. Mar. Pollut. Bull. 2020, 150, 110716. [Google Scholar] [CrossRef]
- Marshall, D.A.; La Peyre, M.K.; Palmer, T.A.; Guillou, G.; Sterba-Boatwright, B.D.; Beseres Pollack, J.; Lebreton, B. Freshwater inflow and responses from estuaries across a climatic gradient: An assessment of northwestern Gulf of Mexico estuaries based on stable isotopes. Limnol. Oceanogr. 2021, 66, 3568–3581. [Google Scholar] [CrossRef]
- He, R.; Weisberg, R.H. A loop current intrusion case study on the west Florida shelf. J. Phys. Oceanogr. 2003, 33, 465–477. [Google Scholar] [CrossRef]
- Teeling, H.; Fuchs, B.M.; Becher, D.; Klockow, C.; Gardebrecht, A.; Bennke, C.M.; Kassabgy, M.; Huang, S.; Mann, A.J.; Waldmann, J.; et al. Substrate-controlled succession of marine bacterioplankton populations induced by a phytoplankton bloom. Science 2012, 336, 608–611. [Google Scholar] [CrossRef]
- Teeling, H.; Fuchs, B.M.; Bennke, C.M.; Krüger, K.; Chafee, M.; Kappelmann, L.; Reintjes, G.; Waldmann, J.; Quast, C.; Glöckner, F.O.; et al. Recurring patterns in bacterioplankton dynamics during coastal spring algae blooms. eLife 2016, 5, e11888. [Google Scholar] [CrossRef]
- Mestre, M.; Höfer, J.; Sala, M.M.; Gasol, J.M. Seasonal variation of bacterial diversity along the marine particulate matter continuum. Front. Microbiol. 2020, 11, 1590. [Google Scholar] [CrossRef]
- Wang, F.-Q.; Bartosik, D.; Sidhu, C.; Siebers, R.; Lu, D.-C.; Trautwein-Schult, A.; Becher, D.; Huettel, B.; Rick, J.; Kirstein, I.V.; et al. Particle-attached bacteria act as gatekeepers in the decomposition of complex phytoplankton polysaccharides. Microbiome 2024, 12, 32. [Google Scholar] [CrossRef]
- Korlević, M.; Markovski, M.; Herndl, G.J.; Najdek, M. Temporal variation in the prokaryotic community of a nearshore marine environment. Sci. Rep. 2022, 12, 16859. [Google Scholar] [CrossRef]
- Marín-Vindas, C.; Sebastián, M.; Ruiz-González, C.; Balagué, V.; Vega-Corrales, L.; Gasol, J.M. Shifts in bacterioplankton community structure between dry and wet seasons in a tropical estuary strongly affected by riverine discharge. Sci. Total Environ. 2023, 903, 166104. [Google Scholar] [CrossRef] [PubMed]
- Pollet, T.; Berdjeb, L.; Garnier, C.; Durrieu, G.; Poupon, C.L.; Misson, B.; Briand, J.-F. Prokaryotic community successions and interactions in marine biofilms: The key role of Flavobacteriia. FEMS Microbiol. Ecol. 2018, 94, fiy083. [Google Scholar] [CrossRef] [PubMed]
- Ogawa, A.; Tanaka, R.; Hirai, N.; Ochiai, T.; Ohashi, R.; Fujimoto, K.; Akatsuka, Y.; Suzuki, M. investigation of biofilms formed on steelmaking slags in marine environments for water depuration. Int. J. Mol. Sci. 2020, 21, 6945. [Google Scholar] [CrossRef] [PubMed]
- Briand, J.-F.; Pollet, T.; Misson, B.; Garnier, C.; Lejars, M.; Maintenay, M.; Barry-Martinet, R.; Portas, A.; Ghiglione, J.-F.; Bressy, C. Surface characteristics together with environmental conditions shape marine biofilm dynamics in coastal nw mediterranean locations. Front. Mar. Sci. 2022, 8, 746383. [Google Scholar] [CrossRef]
- Ul-Hasan, S.; Bowers, R.M.; Figueroa-Montiel, A.; Licea-Navarro, A.F.; Beman, J.M.; Woyke, T.; Nobile, C.J. Community ecology across bacteria, archaea and microbial eukaryotes in the sediment and seawater of coastal Puerto Nuevo, Baja California. PLoS ONE 2019, 14, e0212355. [Google Scholar] [CrossRef]
- Lage, O.M.; Bondoso, J. Planctomycetes and macroalgae, a striking association. Front. Microbiol. 2014, 5, 267. [Google Scholar] [CrossRef]
- Orellana, L.H.; Francis, T.B.; Ferraro, M.; Hehemann, J.-H.; Fuchs, B.M.; Amann, R.I. Verrucomicrobiota are specialist consumers of sulfated methyl pentoses during diatom blooms. ISME J. 2022, 16, 630–641. [Google Scholar] [CrossRef]
- Morris, R.M.; Longnecker, K.; Giovannoni, S.J. Pirellula and OM43 are among the dominant lineages identified in an oregon coast diatom bloom. Environ. Microbiol. 2006, 8, 1361–1370. [Google Scholar] [CrossRef] [PubMed]
- Cruz, B.N.; Neuer, S. Heterotrophic bacteria enhance the aggregation of the marine picocyanobacteria Prochlorococcus and Synechococcus. Front. Microbiol. 2019, 10, 1864. [Google Scholar] [CrossRef]
- Wang, T.; Li, J.; Xu, Y.; Zou, T.; Qin, S. Aggregating Synechococcus contributes to particle organic carbon export in coastal estuarine waters: Its lineage features and assembly processes. Sci. Total Environ. 2024, 917, 170368. [Google Scholar] [CrossRef] [PubMed]
- Brooks, G.R.; Doyle, L.J.; Davis, R.A.; DeWitt, N.T.; Suthard, B.C. Patterns and controls of surface sediment distribution: West-central Florida inner shelf. Mar. Geol. 2003, 200, 307–324. [Google Scholar] [CrossRef]
- Tréguer, P.; Bowler, C.; Moriceau, B.; Dutkiewicz, S.; Gehlen, M.; Aumont, O.; Bittner, L.; Dugdale, R.; Finkel, Z.; Iudicone, D.; et al. Influence of diatom diversity on the ocean biological carbon pump. Nature Geosci. 2018, 11, 27–37. [Google Scholar] [CrossRef]
- De Martini, F.; Neuer, S.; Hamill, D.; Robidart, J.; Lomas, M.W. Clade and strain specific contributions of Synechococcus and Prochlorococcus to carbon export in the Sargasso Sea. Limnol. Oceanogr. 2018, 63, S448–S457. [Google Scholar] [CrossRef]
- Schoellhamer, D.H. Sediment resuspension mechanisms in Old Tampa Bay, Florida. Estuar. Coast Shelf Sci. 1995, 40, 603–620. [Google Scholar] [CrossRef]
- Huang, S.; Sherman, A.; Chen, C.; Jaffé, P.R. Tropical cyclone effects on water and sediment chemistry and the microbial community in estuarine ecosystems. Environ. Pollut. 2021, 286, 117228. [Google Scholar] [CrossRef]
- Wang, F.-Y.; Liu, M.-Y. Microbial community diversity of coral reef sediments on Liuqiu Island, southwestern Taiwan. J. Mar. Sci. Eng. 2023, 11, 85. [Google Scholar] [CrossRef]
- Bianucci, L.; Balaguru, K.; Smith, R.W.; Leung, L.R.; Moriarty, J.M. Contribution of hurricane-induced sediment resuspension to coastal oxygen dynamics. Sci. Rep. 2018, 8, 15740. [Google Scholar] [CrossRef]
- Petro, C.; Starnawski, P.; Schramm, A.; Kjeldsen, K. Microbial community assembly in marine sediments. Aquat. Microb. Ecol. 2017, 79, 177–195. [Google Scholar] [CrossRef]
- Govindarajan, A.; Crum, M.; Adolacion, J.; Kiaghadi, A.; Acuña-Gonzalez, E.; Rifai, H.S.; Willson, R.C. Sediment and their bacterial communities in an industrialized estuary after Hurricane Harvey. Mar. Pollut. Bull. 2022, 175, 113359. [Google Scholar] [CrossRef] [PubMed]
- Garrison, C.E.; Roozbehi, S.; Mitra, S.; Corbett, D.R.; Field, E.K. Coastal microbial communities disrupted during the 2018 hurricane season in Outer Banks, North Carolina. Front. Microbiol. 2022, 13, 816573. [Google Scholar] [CrossRef] [PubMed]
- Bianchi, T.S. The role of terrestrially derived organic carbon in the coastal ocean: A changing paradigm and the priming effect. Proc. Natl. Acad. Sci. USA 2011, 108, 19473–19481. [Google Scholar] [CrossRef] [PubMed]
- Fernandes, T.A.R.; Silveira, W.B.D.; Passos, F.M.L.; Zucchi, T.D. Laccases from Actinobacteria—what we have and what to expect. Adv. Microbiol. 2014, 04, 285–296. [Google Scholar] [CrossRef]
- McKew, B.A.; Dumbrell, A.J.; Taylor, J.D.; McGenity, T.J.; Underwood, G.J.C. Differences between aerobic and anaerobic degradation of microphytobenthic biofilm-derived organic matter within intertidal sediments. FEMS Microbiol. Ecol. 2013, 84, 495–509. [Google Scholar] [CrossRef]
- Feng, B.-W.; Li, X.-R.; Wang, J.-H.; Hu, Z.-Y.; Meng, H.; Xiang, L.-Y.; Quan, Z.-X. Bacterial diversity of water and sediment in the Changjiang Estuary and coastal area of the East China Sea. FEMS. Microbiol. Ecol. 2009, 70, 236–248. [Google Scholar] [CrossRef]
- Li, Y.; Huang, D.; Sun, W.; Sun, X.; Yan, G.; Gao, W.; Lin, H. Characterizing sediment bacterial community and identifying the biological indicators in a seawater-freshwater transition zone during the wet and dry seasons. Environ. Sci. Pollut. Res. 2022, 29, 41219–41230. [Google Scholar] [CrossRef]
- Zinger, L.; Amaral-Zettler, L.A.; Fuhrman, J.A.; Horner-Devine, M.C.; Huse, S.M.; Welch, D.B.M.; Martiny, J.B.H.; Sogin, M.; Boetius, A.; Ramette, A. Global patterns of bacterial beta-diversity in seafloor and seawater ecosystems. PLoS ONE 2011, 6, e24570. [Google Scholar] [CrossRef]
- Giovannoni, S.J. SAR11 bacteria: The most abundant plankton in the oceans. Annu. Rev. Mar. Sci. 2017, 9, 231–255. [Google Scholar] [CrossRef]
- O’Reilly, S.S.; Pentlavalli, P.; Flanagan, P.V.; Allen, C.C.R.; Monteys, X.; Szpak, M.T.; Murphy, B.T.; Jordan, S.F.; Kelleher, B.P. Abundance and diversity of sedimentary bacterial communities in a coastal productive setting in the western Irish Sea. Cont. Shelf Res. 2016, 113, 1–9. [Google Scholar] [CrossRef]
- Durham, B.P.; Grote, J.; Whittaker, K.A.; Bender, S.J.; Luo, H.; Grim, S.L.; Brown, J.M.; Casey, J.R.; Dron, A.; Florez-Leiva, L.; et al. Draft genome sequence of marine Alphaproteobacterial strain HIMB11, the first cultivated representative of a unique lineage within the Roseobacter clade possessing an unusually small genome. Stand. Genomic Sci. 2014, 9, 632–645. [Google Scholar] [CrossRef]
- Hoarfrost, A.; Nayfach, S.; Ladau, J.; Yooseph, S.; Arnosti, C.; Dupont, C.L.; Pollard, K.S. Global ecotypes in the ubiquitous marine clade SAR86. ISME J. 2020, 14, 178–188. [Google Scholar] [CrossRef]
- Halsey, K.H.; Carter, A.E.; Giovannoni, S.J. Synergistic metabolism of a broad range of C1 compounds in the marine methylotrophic bacterium HTCC2181. Environ. Microbiol. 2012, 14, 630–640. [Google Scholar] [CrossRef]
- Takeuchi, M.; Katayama, T.; Yamagishi, T.; Hanada, S.; Tamaki, H.; Kamagata, Y.; Oshima, K.; Hattori, M.; Marumo, K.; Nedachi, M.; et al. Methyloceanibacter caenitepidi Gen. Nov., Sp. Nov., a facultatively methylotrophic bacterium isolated from marine sediments near a hydrothermal vent. Int. J. Syst. Evol. Microbiol. 2014, 64, 462–468. [Google Scholar] [CrossRef]
- Henriques, A.C.; De Marco, P. Complete genome sequences of two strains of “Candidatus Filomicrobium marinum,” a methanesulfonate-degrading species. Genome Announc. 2015, 3, e00160-15. [Google Scholar] [CrossRef] [PubMed]
- Vekeman, B.; Kerckhof, F.; Cremers, G.; De Vos, P.; Vandamme, P.; Boon, N.; Op Den Camp, H.J.M.; Heylen, K. New Methyloceanibacter diversity from North Sea sediments includes methanotroph containing solely the soluble methane monooxygenase. Environ. Microbiol. 2016, 18, 4523–4536. [Google Scholar] [CrossRef] [PubMed]
- Kim, J.-H.; Kim, K.-Y.; Hahm, Y.-T.; Kim, B.-S.; Chun, J.; Cha, C.-J. Actibacter sediminis Gen. Nov., Sp. Nov., a marine bacterium of the family Flavobacteriaceae isolated from tidal flat sediment. Int. J. Syst. Evol. Microbiol. 2008, 58, 139–143. [Google Scholar] [CrossRef] [PubMed]
- Pinnaka, A.K.; Tanuku, N.R.S. The family Cyclobacteriaceae. In The Prokaryotes; Rosenberg, E., DeLong, E.F., Lory, S., Stackebrandt, E., Thompson, F., Eds.; Springer: Berlin/Heidelberg, Germany, 2014; pp. 551–575. ISBN 978-3-642-38953-5. [Google Scholar]
- Lee, Y.; Jeong, H.I.; Jeong, S.E.; Jeon, C.O. Zeaxanthinibacter aestuarii Sp. Nov., isolated from estuary sediment and emended description of the genus Zeaxanthinibacter Asker et al. 2007. Int. J. Syst. Evol. Microbiol. 2016, 66, 3264–3269. [Google Scholar] [CrossRef]
- Xuan, X.-Q.; Mao, R.-Y.; Yu, W.-X.; An, J.; Du, Z.-J.; Mu, D.-S. Robiginitalea marina Sp. Nov., isolated from coastal sediment. Arch. Microbiol. 2022, 204, 644. [Google Scholar] [CrossRef]
- Du, Z.-J.; Wang, Z.-J.; Zhao, J.-X.; Chen, G.-J. Woeseia oceani Gen. Nov., Sp. Nov., a chemoheterotrophic member of the order Chromatiales, and proposal of Woeseiaceae Fam. Nov. Int. J. Syst. Evol. Microbiol. 2016, 66, 107–112. [Google Scholar] [CrossRef]
- Mußmann, M.; Pjevac, P.; Krüger, K.; Dyksma, S. Genomic repertoire of the Woeseiaceae /JTB255, cosmopolitan and abundant core members of microbial communities in marine sediments. ISME J. 2017, 11, 1276–1281. [Google Scholar] [CrossRef] [PubMed]
- Buongiorno, J.; Sipes, K.; Wasmund, K.; Loy, A.; Lloyd, K.G. Woeseiales transcriptional response to shallow burial in arctic fjord surface sediment. PLoS ONE 2020, 15, e0234839. [Google Scholar] [CrossRef]
- Jørgensen, B.B. Mineralization of organic matter in the sea bed—the role of sulphate reduction. Nature 1982, 296, 643–645. [Google Scholar] [CrossRef]
- Plugge, C.M.; Zhang, W.; Scholten, J.C.M.; Stams, A.J.M. Metabolic flexibility of sulfate-reducing bacteria. Front. Microbiol. 2011, 2, 81. [Google Scholar] [CrossRef]
- Chen, Y.-J.; Leung, P.M.; Cook, P.L.M.; Wong, W.W.; Hutchinson, T.; Eate, V.; Kessler, A.J.; Greening, C. Hydrodynamic disturbance controls microbial community assembly and biogeochemical processes in coastal sediments. ISME J. 2022, 16, 750–763. [Google Scholar] [CrossRef]
- Ward, L.M.; Bertran, E.; Johnston, D.T. Expanded genomic sampling refines current understanding of the distribution and evolution of sulfur metabolisms in the Desulfobulbales. Front. Microbiol. 2021, 12, 666052. [Google Scholar] [CrossRef]
- Liesirova, T.; Aarenstrup-Launbjerg, T.; Hallstrøm, S.; Bittner, M.J.; Riemann, L.; Voss, M. Nitrogen-fixing sulfate reducing bacteria in shallow coastal sediments under simulated resuspension. Estuar. Coast Shelf Sci. 2023, 280, 108165. [Google Scholar] [CrossRef]
- Sipler, R.; Bronk, D.; Seitzinger, S.; Lauck, R.; McGuinness, L.; Kirkpatrick, G.; Heil, C.; Kerkhof, L.; Schofield, O. Trichodesmium-derived dissolved organic matter is a source of nitrogen capable of supporting the growth of toxic red tide Karenia brevis. Mar. Ecol. Prog. Ser. 2013, 483, 31–45. [Google Scholar] [CrossRef]
- Jabir, T.; Vipindas, P.V.; Jesmi, Y.; Divya, P.S.; Adarsh, B.M.; Nafeesathul Miziriya, H.S.; Mohamed Hatha, A.A. Influence of environmental factors on benthic nitrogen fixation and role of sulfur reducing diazotrophs in a eutrophic tropical estuary. Mar. Pollut. Bull. 2021, 165, 112126. [Google Scholar] [CrossRef]
- Begmatov, S.; Savvichev, A.S.; Kadnikov, V.V.; Beletsky, A.V.; Rusanov, I.I.; Klyuvitkin, A.A.; Novichkova, E.A.; Mardanov, A.V.; Pimenov, N.V.; Ravin, N.V. Microbial Communities involved in methane, sulfur, and nitrogen cycling in the sediments of the barents sea. Microorganisms 2021, 9, 2362. [Google Scholar] [CrossRef]
- Wei, H.; Lin, X. Shifts in the relative abundance and potential rates of sediment ammonia-oxidizing archaea and bacteria along environmental gradients of an urban river–estuary–adjacent sea continuum. Sci. Total Environ. 2021, 771, 144824. [Google Scholar] [CrossRef] [PubMed]
- Martens-Habbena, W.; Berube, P.M.; Urakawa, H.; De La Torre, J.R.; Stahl, D.A. Ammonia oxidation kinetics determine niche separation of nitrifying archaea and bacteria. Nature 2009, 461, 976–979. [Google Scholar] [CrossRef] [PubMed]
- Prosser, J.I.; Hink, L.; Gubry-Rangin, C.; Nicol, G.W. Nitrous oxide production by ammonia oxidizers: Physiological diversity, niche differentiation and potential mitigation strategies. Glob. Change Biol. 2020, 26, 103–118. [Google Scholar] [CrossRef] [PubMed]
- Hink, L.; Gubry-Rangin, C.; Nicol, G.W.; Prosser, J.I. The consequences of niche and physiological differentiation of archaeal and bacterial ammonia oxidisers for nitrous oxide emissions. ISME J. 2018, 12, 1084–1093. [Google Scholar] [CrossRef]
- Ivey, J.E.; Wolny, J.L.; Heil, C.A.; Murasko, S.M.; Brame, J.A.; Parks, A.A. Urea inputs drive picoplankton blooms in Sarasota Bay, Florida, U.S.A. Water 2020, 12, 2755. [Google Scholar] [CrossRef]
- Li, F.; Burger, A.; Eppley, J.M.; Poff, K.E.; Karl, D.M.; DeLong, E.F. Planktonic microbial signatures of sinking particle export in the open ocean’s interior. Nat. Commun. 2023, 14, 7177. [Google Scholar] [CrossRef]
- Che, Y.; Lin, C.; Li, S.; Liu, J.; Zhu, L.; Yu, S.; Wang, N.; Li, H.; Bao, M.; Zhou, Y.; et al. Influences of hydrodynamics on microbial community assembly and organic carbon composition of resuspended sediments in shallow marginal seas. Water Res. 2024, 248, 120882. [Google Scholar] [CrossRef]
- Chistoserdova, L. Methylotrophs in natural habitats: Current insights through metagenomics. Appl. Microbiol. Biotechnol. 2015, 99, 5763–5779. [Google Scholar] [CrossRef]
Disclaimer/Publisher’s Note: The statements, opinions and data contained in all publications are solely those of the individual author(s) and contributor(s) and not of MDPI and/or the editor(s). MDPI and/or the editor(s) disclaim responsibility for any injury to people or property resulting from any ideas, methods, instructions or products referred to in the content. |
© 2025 by the authors. Licensee MDPI, Basel, Switzerland. This article is an open access article distributed under the terms and conditions of the Creative Commons Attribution (CC BY) license (https://creativecommons.org/licenses/by/4.0/).