


Abstract
Onosma elegantissima is an endemic and understudied plant of the Kozani Regional Unit (Greece), with poorly established traditional use. However, the well-documented pharmacological potential of the genus has prompted further investigation. Furthermore, green solvent-based extraction procedures have gained emerging scientific interest due to their high efficiency/selectivity and environmentally friendly approach. Therefore, our study aimed to establish the optimal extraction protocol to obtain extracts with high therapeutic value using two green solvent-based techniques: hydrothermal and deep eutectic solvent (DES) extraction. Our results demonstrate that hydrothermal extraction for 90 min at 80 °C yielded extracts exhibiting total phenolic content (35.19 mg GAE/g dw), approximately threefold higher compared to DES extracts (10.03 mg GAE/g dw), and significantly higher antioxidant capacity. The flavonoid concentration (8.39 mg RE eq/g) measured was at the same level for both types of extracts (7.34 mg RE eq/g). The DES extract showed slightly higher anti-inflammatory potential, though. Additional assays were performed to evaluate antimicrobial activity and in vitro antidiabetic capacity. The bioactive compounds of optimized extracts were identified by HPLC, revealing that the most dominant compound recovered was chlorogenic acid in the DES extract and neochlorogenic acid in the hydrothermal extract. To complement the phytochemical analysis, molecular docking was used as a reproducible, hypothesis-generating screen to prioritize future enzyme inhibition assays for HPLC-detected phenolic constituents and literature-related comparators; docking was not used as evidence of biological activity. Conclusively, Onosma elegantissima’s first biological study revealed significant antioxidant activity.
1. Introduction
The plant species of the Onosma genus belong to the Boraginaceae family and are characterized by a wide range of morphological characteristics as well as chemical composition among their representatives. The species of this family are widely distributed in many countries and habitats with different climatic conditions, making the classification of Boraginaceae an interesting task for botanists. In addition, the variability in bioactive compounds endows plants in this family with abundant pharmacological and other beneficial properties [1]. Specifically, the genus Onosma is a large genus, a member of the tribe Lithospermae within the family Boraginaceae, comprising more than 230 species worldwide. Onosma species are mainly distributed on three continents (Asia, Europe, Africa), with Turkey having the highest rate of endemism [2,3].
Traditional therapeutic uses of Onosma species have been reported in many Asian countries for centuries. Extracts of the plant exhibited beneficial effects against pain, rheumatism, heart palpitations, asthma, bladder and kidney diseases and many other gynecological, gastric and respiratory disorders, while their ability to heal wounds is also remarkable. The aforementioned properties have also been experimentally demonstrated in many in vitro studies. Extracts from different parts of Onosma plants showed significant antibacterial activity, remarkable antioxidant capacity, anticancer effects against several cell lines and enzyme inhibition potential. The antidiabetic and anti-inflammatory activity of the extracts was also remarkable [3,4,5].
Onosma species are also utilized in food—as some species are edible—and the cosmetics industry. Known by the Hindi name “Ratanjot”, extracts from the dried and ground roots of O. hispidum and O. echioides are used for their vibrant red color as a coloring agent in culinary, cosmetic or even galenical preparations, as they seem to improve skin conditions. Moreover, these extractions are used as a spice adulterant and also as a natural fabric dye [3].
The plethora of bioactive compounds that have been detected in Onosma species contributes to the wide range of their pharmacological properties. Phytochemical analysis of extracts derived from the aerial and root parts of the plants reveals the existence of chemical compounds such as flavonoids and phenolics, naphthaquinone derivatives (mainly shikonin and alkannin), pyrrolizidine alkaloids, as well as fatty acids and hydrocarbons. According to these reports, the most abundant compounds among Onosma species are rosmarinic acid, apigenin and ferrulic acid [1,3].
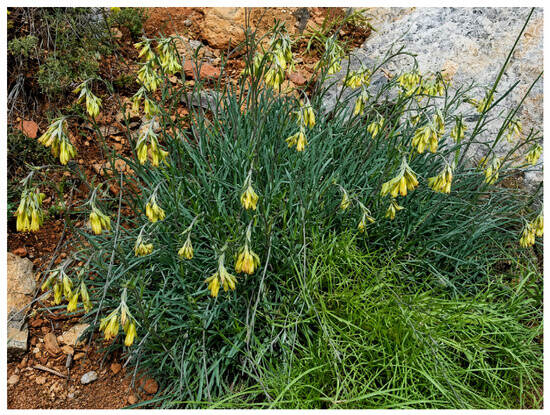
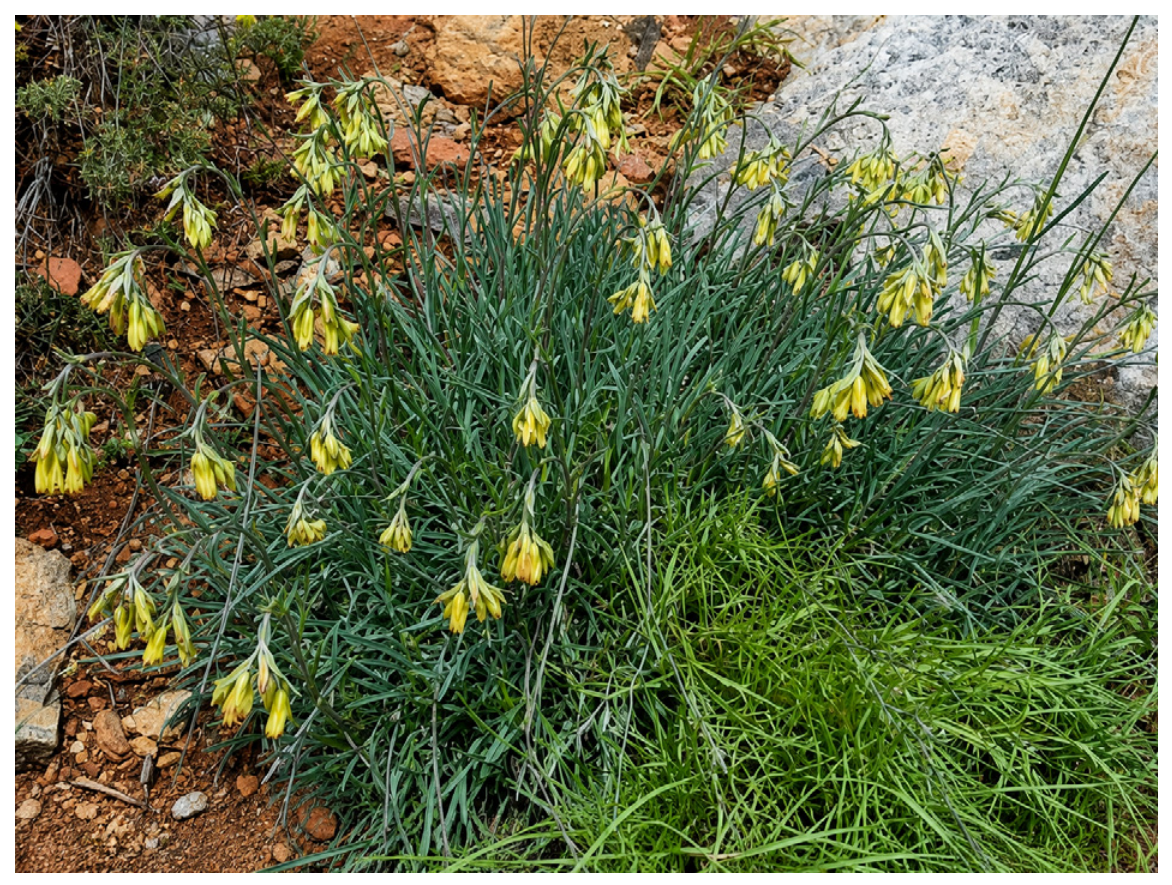
Onosma elegantissima is a rare endemic species of the genus Onosma whose phytochemical content has not been investigated yet. It was discovered by botanists Karl Heinz Rechinger and Konstantinos Goulimy on the mountain Vourinos (West Macedonia, Greece) in 1956. It is a perennial herb with narrow leaves, slightly hairy stems and tubular, yellowish flowers, blooming from May to July at an altitude of 800–1800 m. A typical plant is depicted in Figure 1 in its natural habitat [4].
Figure 1.
A typical Onosma elegantissima plant in its natural habitat.
In studies conducted so far, bioactive substances from Onosma species were recovered by utilizing conventional solvents such as methanol and ethanol due to their efficiency in polyphenol and flavonoid recovery. Among the sustainable alternatives, hydrothermal extraction ameliorates extraction efficacy as it employs water at elevated temperature, improving the solubility of bioactive compounds without utilizing harmful or even hazardous organic solvents. Additionally, DESs are a novel class of solvents composed of a hydrogen bond donor and a hydrogen bond acceptor, allowing mass transfer without excess energy consumption. Moreover, DESs are environmentally friendly, with low volatility and inflammability, and are considered to improve extraction selectivity for polyphenols [5,6,7,8,9,10,11].
As O. elegantissima has never been phytochemically or biologically characterized before, the present study aimed to explore the chemical composition and potential therapeutic actions of the aerial part extracts of this plant by employing environmentally friendly extraction techniques. For this purpose, the extraction conditions were optimized, and two green solvent-based techniques were applied: hydrothermal and deep eutectic solvent (DES) extraction, aiming to detect the most efficient solvent procedure, to evaluate O. elegantissima’s phytochemical profile as well as to identify potent beneficial properties of the extracts. Molecular docking was further employed to investigate potential mechanisms of action, by reducing reagents and energy consumption that may have been required in complementary in vitro assays.
2. Materials and Methods
2.1. Chemicals and Reagents
Standard HPLC compounds such as neochlorogenic acid, protocatechuic acid, chlorogenic acid, p-coumaric acid, kaempferol, α-amylase from Bacillus sp. (assay >30%) and BSA (Bovine Serum Albumin, >98%) were purchased from Sigma-Aldrich (Darmstadt, Germany). Chemlab (Zedelgem, Belgium) was the provider of the Folin–Ciocalteu reagent, FeCl3, CuSO4, ascorbic acid, gallic acid and starch. DPPH and TPTZ were purchased (>98%) from Thermo Scientific (Waltham, MA, USA), while DNSA (>98%), acarbose (>98%), and choline chloride (>98%) were provided by TCI (Zwijndrecht, Belgium). Methanol (>99.8%) was obtained from Honeywell Riedel-de Haën (Seelze, Germany), while Ibuprofen was acquired from a local pharmacy.
2.2. Plant Material
The aerial parts (stems, leaves and flowers) of the plant were carefully collected during its blooming stage in June 2024 from Mount Vourinos (Siatista, Kozani Regional Unit, Greece, 40.198719″ N, 21.660140″ E based on Google Earth version 10.109.81.5) at an altitude of 1400 m. After collection, the plant material was weighed and left for thirty days in a shaded room to dry at room temperature (22–25 °C) without excess humidity. The plant material’s weight stabilization indicated the complete loss of water, and then the dry plant material was ground and subjected to different extraction processes.
2.3. Optimization of Plant Extraction with Response Surface Methodology (RSM)
To optimize the extraction procedure, Response Surface Methodology (RSM) was employed, aiming to maximize the recovery of polyphenols from O. elegantissima. Additionally, the antioxidant and other beneficial pharmacological properties of the resulting extracts were evaluated. Specifically, 0.4 g of accurately weighed dried plant material was used, and the extraction was performed in 20 mL of deionized water under continuous stirring at 500 rpm. The extraction temperature and the time of the process were designed according to a Central Composite Design (CCD), as shown in Table 1.
Table 1.
Experimental factors and coded levels used in the Central Composite Design (CCD) for optimizing the extraction of O. elegantissima.
Upon completion of each extraction run, the samples were centrifuged at 10,000× g for 10 min using a NEYA 16R centrifuge (Remi Elektrotechnik Ltd.,Vasai (East) Palghar, Maharashtra, India). Following centrifugation, the supernatants were aliquoted and stored at −40 °C until analysis. Prior to each assay, the extracts were thawed once, vortexed to ensure homogeneity, and diluted to the appropriate concentration required by each analytical method.
A two-factor, five-level Central Composite Design consisting of 10 experimental runs was used to model the effects of temperature and extraction time on the response variables. The independent variables were coded as −1, 0, and +1 corresponding to 30, 55, and 80 °C for temperature (X1), and 30, 60, and 90 min for extraction time (X2). Analysis of variance (ANOVA) and summary-of-fit statistics were applied to evaluate the overall significance of the fitted model (R2 and p-values) and the significance of individual model coefficients at a 95% confidence level.
2.4. Extraction Using Deep Eutectic Solvent (DES)
A deep eutectic solvent (DES) composed of glycerol and choline chloride in a molar ratio of 2:1 was used as an alternative extraction solvent. In brief, 0.4 g of dried O. elegantissima sample was extracted by continuous stirring at 500 rpm in 20 mL of DES at 80 °C for 90 min. The DES solvent extraction conditions were selected based on the optimal results of hydrothermal extraction. After centrifugation, the DES supernatants were collected, aliquoted, and stored at −40 °C. Before analysis, DES extracts were thawed, vortexed, and diluted with deionized water to ensure compatibility with the colorimetric assays. All extracts were thawed only once and used immediately.
2.5. Polyphenol Determination
2.5.1. Total Polyphenol Content (TPC)
To determine TPC, a previously established technique was applied [12], and prior to analysis, the extracts were diluted 1:5 (v/v) with deionized water to ensure that the absorbance values fell within the linear range of the calibration curve. Briefly, 40 μL of the plant extract—properly diluted—was mixed with 2.4 mL of deionized water and 200 μL of Folin–Ciocalteu reagent. After 3 min, 600 μL of saturated (20%) sodium carbonate reagent was added. The mixture remained in the dark for 2 h, and the absorbance was measured at 725 nm. A standard curve of gallic acid was used to determine the total polyphenol concentration (CTP) (0.1–1 mg/mg). The results are expressed as mg gallic acid equivalents (GAE) per g of dry weight (dw), using the following Equation (1):
where the volume of the extraction medium is indicated with V (expressed in L) and the dry weight of the sample as w (expressed in g).
2.5.2. Total Flavonoid Content
The flavonoid content of the extracts was detected by the AlCl3 assay [13]. Briefly, 0.5 mL of properly diluted extract sample was mixed with 1.5 mL methanol, 2.8 mL of deionized water, 0.1 mL of CH3COOH 1 M and 0.1 mL of 10% AlCl3 solution. After vortexing, the absorbance was measured at 415 nm. Rutin was used as a standard for the calibration curve. Total flavonoids were expressed in mg RE equivalents per g of dry weight (dw), as demonstrated in the following Equation (2):
where V (L) is the volume of the extraction media and w (g)—the dry weight of the plant.
2.5.3. HPLC Detection of Polyphenolic Compounds
The detection and quantification of specific polyphenols in the O. elegantissima extracts was performed by HPLC by employing a Shimadzu CBM-20A liquid chromatograph and a Shimadzu SPD-M20A diode array detector (DAD) (both purchased from Shimadzu Europa GmbH, Duisburg, Germany). The compounds were separated on a Phenomenex Luna C18(2) column from Phenomenex Inc. (Torrance, CA, USA) and maintained at 40 °C (100 Å, 5 μm, 4.6 mm × 250 mm). The mobile phase comprised 0.5% aqueous formic acid (A) and 0.5% formic acid in acetonitrile/water (3:2) (B). The applied gradient program started from 0 to 40% B, rose to 50% B in 10 min, then to 70% B in another 10 min, and was then kept constant for 10 min. The flow rate of the mobile phase was set at 1 mL/min. The compounds were identified at 320 nm by comparing the absorbance spectrum and retention time to those of pure standards and then quantified through calibration curves (0–50 μg/mL). The results were given in mg/g dw.
2.6. Antioxidant Capacity of the Extracts
2.6.1. Ferric-Reducing Antioxidant Power (FRAP) Assay
The FRAP assay was conducted following the protocol of Pulido et al. [14]. Specifically, 100 μL of properly diluted extract was mixed with 2.9 mL “FRAP solution”, which consisted of 10 mL CH3COOH/CH3COONa buffer solution (0.3 M, pH 3.6), 1 mL of FeCl3 solution (0.02 M Fe3+) and 1 mL of TPTZ solution (0.01 M in 0.04 M HCl). The mixture was incubated at 37 °C for 10 min, then cooled down to room temperature, and the absorbance was measured at 593 nm. A Trolox (a water-soluble analog of vitamin E) calibration curve was established for the calculation of ferric-reducing power (PR). The PR was calculated as μmol of Trolox equivalents (TE) per g of dw, using Equation (3):
where V (in L) is the entire volume of the extraction medium and (in g) represents the dried weight of the material.
2.6.2. DPPH• Antiradical Activity Assay
To determine the antiradical activity (AAR) of the extracted samples, the DPPH. method was used [15]. Briefly, 100 μL of Onosma extract—properly diluted—was mixed with 3.9 mL DPPH solution in methanol. The mixture was kept in the dark for 30 min at room temperature, and the absorbance was measured at 517 nm. To estimate the percentage of scavenging, the following Equation (4) was employed:
For the evaluation of the antiradical activity (AAR), a Trolox (water-soluble analog of vitamin E) calibration curve was used, and AAR was expressed as μmol TE per g of dw, as demonstrated in Equation (5):
where V (in L) is the entire volume of the extraction medium and (in g) represents the dried weight of the material.
2.7. In Vitro BSA Denaturation Inhibition
The potential anti-inflammatory capacity of O. elegantissima based on bovine serum albumin (BSA) denaturation was examined [16]. A volume of 400 μL of plant extract was mixed with 600 μL of BSA solution (0.5% in Tris-HCl solution, pH 6.4). The samples were incubated for 20 min at 37 °C, followed by incubation at 70 °C for 15 min. The blank samples used for spectrophotometer calibration contained either water or DES, depending on the measured extract. The absorbance was measured at 660 nm, and the % inhibition of protein denaturation was expressed according to Equation (6). Ibuprofen was used as a positive control solution.
2.8. In Vitro Antidiabetic Activity
The in vitro evaluation of the antidiabetic properties of O. elegantissima was conducted by utilizing the a-amylase inhibition assay with slight modifications [17,18]. In brief, 150 μL of plant extract and 150 μL of a-amylase solution (20 IU/mL in phosphate buffer, pH 6.9) were mixed and incubated for 10 min at 37 °C. After 10 min, 300 μL of starch solution (1% in phosphate buffer, pH 6.9) was added and the mixture was incubated for 20 min at 37 °C. Immediately after, 200 μL of DNSA reagent was added to terminate the chemical reaction and the tubes were placed in a boiling water bath for 5 min. The absorbance was measured at 540 nm when the samples’ temperature reached 25 °C. An acarbose solution was used as a positive control. The antidiabetic potency of O. elegantissima was determined as the % inhibition of a-amylase by the following Equation (7):
2.9. Antibacterial Activity
To investigate any antibacterial impact of the O. elegantissima extract, a micro-broth microdilution (BMD) method was utilized to determine the in vitro Minimum Inhibitory Concentration (MIC), namely the lowest concentration that prevents the visible growth of a microorganism under specified conditions [19] against the following reference bacterial strains: Pseudomonas aeruginosa NCTC 10662, Listeria monocytogenes NCTC 11994, Staphylococcus aureus NCTC 6571, Salmonella ser. Typhimurium NCTC 12023, Escherichia coli NCTC 9001, Enterococcus faecalis NCTC 775, and Campylobacter jejuni ATCC 33560.
All reference bacterial strains were initially resuscitated from frozen stocks by culture on Mueller–Hinton agar (MHA) or Columbia blood agar (CBA) with 5% sheep blood (C. jejuni). After incubation for 24 h under an aerobic or microaerobic (C. jejuni; GENbox microaer sachets and GENbox jar, bioMérieux) atmosphere, one pure colony of each tested strain was again subcultured on the same agar medium for another 24 h, and a pure colony of each tested strain was utilized to prepare an inoculum of 0.5 McFarland turbidity in sterile saline (0.9% NaCl).
The BMD method was performed according to the ISO 20776-1:2019 [20] procedure, with appropriate modifications. Mueller–Hinton Broth (MHB) was added to 96-well microtiter plates (100 μL/well), and an equal volume (100 μL) of the extract was added to the first well of a plate row. After mixing evenly, 100 μL was transferred to the second well and further diluted (2-fold), resulting in a dilution series well with a range of extract concentrations from 10 mg/mL to 0.039 mg/mL. Subsequently, the prepared 0.5 McFarland suspensions of each reference strain were further diluted (1:100) in either MHB or MHF (C. jejuni), and equal volumes (100 μL) of diluted microorganism suspensions were added in each well of the corresponding plate. The plates were incubated under either an aerobic (control) or microaerobic (C. jejuni—inoculated plate) atmosphere at 35.1 °C for 16–20 h. Results were read visually and turbidimetrically.
2.10. Molecular Docking
Molecular docking was performed as an exploratory, hypothesis-generating, structure-based analysis. The aim was to assess whether selected phenolic constituents identified in O. elegantissima extracts, together with closely related literature comparators from the Onosma/polyphenol context, can occupy pharmacologically relevant binding pockets. Docking was not used as stand-alone evidence of biological activity and was not interpreted as an experimental measurement of binding free energy, enzyme inhibition, or potency.
The final reported docking analysis focused on two receptor models for which native ligand redocking provided robust grid calibration: human acetylcholinesterase (AChE; PDB ID 4EY7, donepezil-bound active site gorge) and angiotensin-converting enzyme (ACE; PDB ID 1O86, lisinopril/Zn active site pocket). These targets were used to generate testable biochemical hypotheses for future assays rather than to explain the in vitro antioxidant, BSA denaturation, alpha-amylase, or antimicrobial assays performed in the present work.
Receptor preparation involved removing nonessential crystallographic waters and co-crystallized ligands before docking, adding polar hydrogens, assigning receptor charges, and generating PDBQT receptor files for AutoDock Vina. Catalytically relevant metal ions were retained where required, including Zn701 in ACE. ACE results were interpreted cautiously because the standard AutoDock Vina scoring function is not a dedicated metal coordination model; therefore, ACE poses were described qualitatively as active site pocket or near-Zn pocket poses, not as evidence of direct metal chelation or ACE inhibition.
The ligand library comprised 12 phenolic or flavonoid-related compounds: protocatechuic acid, p-coumaric acid, chlorogenic acid, neochlorogenic acid, ferulic acid, rosmarinic acid, rutin, luteolin-7-glucoside, hyperoside, quercetin-3-glucoside/isoquercitrin, kaempferol-3-glucoside/astragalin, and kaempferol-3-rutinoside/nicotiflorin. The current HPLC-DAD analysis assigned chlorogenic acid, neochlorogenic acid, protocatechuic acid, p-coumaric acid, and an unresolved kaempferol derivative by retention time/UV comparison with available standards. Because DAD data alone do not unambiguously define glycosidic linkage or positional isomerism, kaempferol glycoside docking entries are treated as structurally plausible comparators, not definitive HPLC assignments; LC-MS/MS confirmation would be required for final structural assignment.
Docking boxes were centered on experimentally observed co-crystallized ligands. Thus, the reported docking workflow was site-directed rather than whole-protein blind docking. Grid definitions are provided in Table 2.
Table 2.
Receptor structures and docking grid definitions used for the final reported docking subset.
Docking calculations were performed using AutoDock Vina v1.2.5 [21,22]. The final reported subset comprised 24 receptor–ligand pairs (2 receptor models × 12 ligands). Each pair was evaluated under a strict reproducibility protocol using three independent random seeds (101, 202, and 303), exhaustiveness = 64, num_modes = 20, and energy_range = 5, producing 72 strict Vina calculations. For each receptor–ligand pair, the mean and standard deviation of the best Vina score across the three seeds were calculated. Scores are reported only as rounded prioritization metrics because fine cross-ligand ranking is not chemically meaningful in a Vina-based screening workflow, particularly when ligands differ substantially in size and flexibility.
Pose plausibility was assessed using reproducible, distance-based contact analysis against pre-specified active site residues. A residue was counted as a coarse contact when any non-hydrogen atom of the ligand in MODEL 1 of the Vina output pose was within 6.0 A of any non-hydrogen atom of that residue. A stricter 4.5 A consensus contact set was also generated for selected candidates to reduce overinterpretation of broad contact shells. Detected status, ligand size, ligand-efficiency estimates, contact reproducibility, and assay relevance were evaluated together. Native ligand redocking was performed for both receptor structures to assess whether the selected grids reproduced reference ligand placement (Table 3).
Table 3.
Native ligand redocking calibration for the retained receptor models.
2.11. Statistical Analysis
A Central Composite Design (CCD) with two factors (temperature, X1; time, X2) was used to model the responses (TPC, TFC, FRAP, DPPH) using quadratic Response Surface Methodology (RSM). Model significance was assessed by ANOVA, and terms with p < 0.05 were considered significant. Residual diagnostics were examined to confirm model adequacy.
Standardized Pareto charts were used to visualize the magnitude and direction of significant effects. Response surface and contour plots illustrated the combined influence of X1 and X2. Multi-response optimization was performed using the desirability function, and the prediction profiler was used to inspect optimal factor settings.
Partial Least Squares (PLS) regression was additionally applied to evaluate multivariate relationships among predictors and responses. Variable Importance in Projection (VIP) scores identified the most influential factors, supporting the RSM findings. All analyses were conducted in JMP Pro 16 (SAS Institute Inc., Cary, NC, USA). This statistical workflow follows standard RSM/CCD methodology as implemented in JMP Pro 16.
3. Results
3.1. Optimization of Extraction Conditions
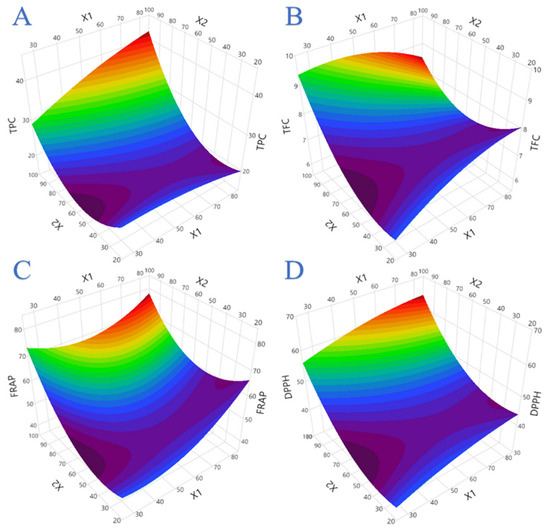
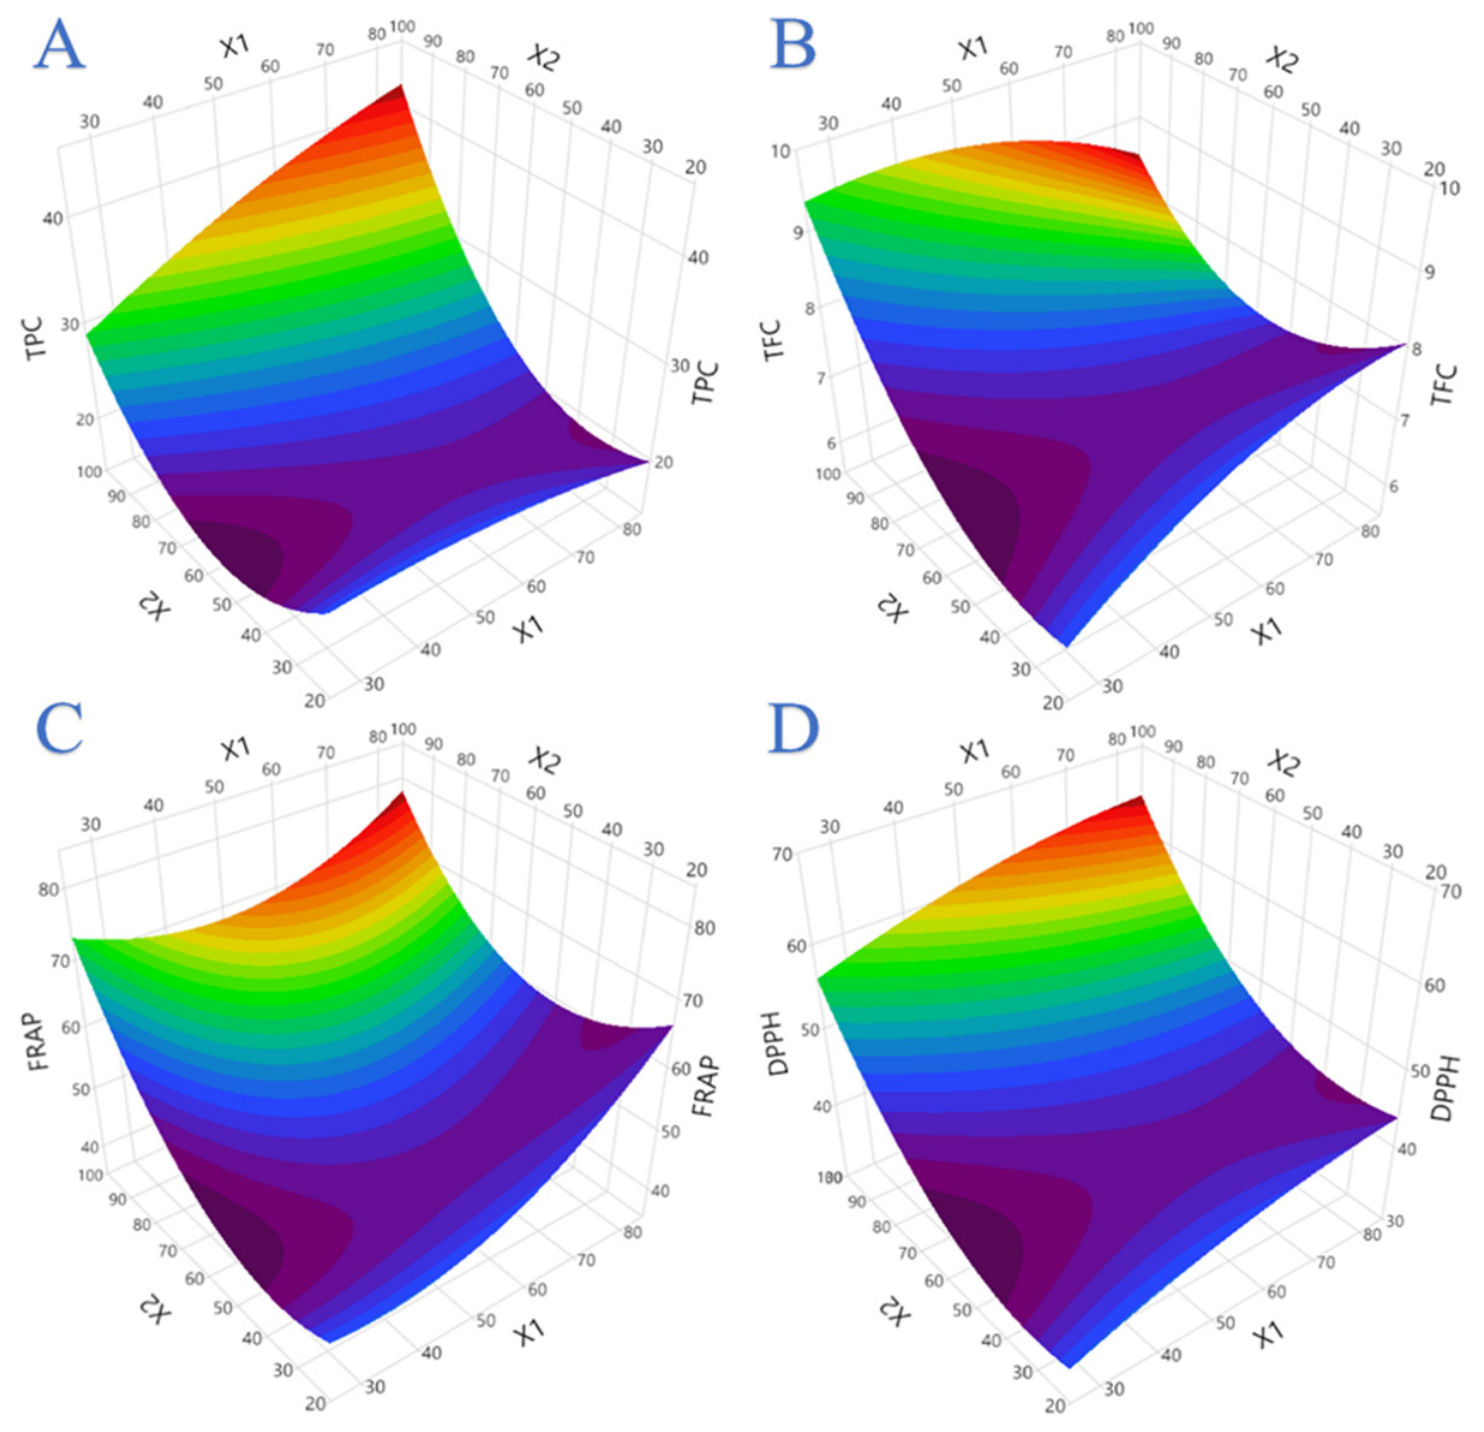
Conventional extraction techniques for bioactive compounds from plant material often lead to a high environmental footprint due to elevated energy consumption and the necessity for multiple solvents to recover diverse bioactive compounds [23,24]. To establish green extraction processes, deionized water and DESs serve as alternative solvent choices due to their low toxicity, cost-effectiveness and high solubilization efficiency against a wide range of compounds [10,23,24]. In our study, Response Surface Methodology (RSM) was applied to optimize the extraction conditions of Onosma elegantissima, correlating process parameters with the extract’s antioxidant activity, Total Phenolic Content (TPC), and Total Flavonoid Content (TFC). As demonstrated in Table 4 and Table 5 and the 3D plots (Figure 2), the best conditions within the tested range were determined to be 80 °C for 90 min, yielding a polyphenol-enriched extract with significant antioxidant potency. This temperature alignment is consistent with the literature, documenting that maximum polyphenolic recovery typically occurs within the 50–80 °C range [10].
Table 4.
Experimental design matrix of the Central Composite Design (CCD) and actual responses for the extraction of Onosma elegantissima.
Table 5.
Analysis of variance (ANOVA) for the quadratic response surface models fitted to TPC, TFC, FRAP and DPPH.
Figure 2.
3D response surface plots illustrating the influence of temperature (X1) and extraction time (X2) on (A) TPC, (B) TFC, (C) FRAP, and (D) DPPH responses. The surfaces were generated from the fitted quadratic RSM models, highlighting linear, quadratic and interaction effects of the process variables.
ANOVA analysis (Table 5) indicated that the selected factors significantly influenced the responses (p < 0.05). Moreover, the R2 and Adj-R2 values demonstrated that the model possesses excellent predictive performance, while the RMSE value, combined with the mean, additionally confirms the model’s precision and adequacy.
The lack-of-fit test (Table 6) was conducted to assess whether the experimental observations were adequately represented by the proposed model. As demonstrated in Table 4, for TPC, TFC and FRAP, the lack-of-fit was statistically non-significant (p > 0.05), indicating that the predicted and experimental values comply. Consequently, it is confirmed that the developed models were considered appropriate for the prediction of responses and their optimization. For the DPPH response, the lack-of-fit test could not be evaluated because the pure error term was zero, preventing computation of an F-ratio. Standard transformations (log, square-root, Box–Cox) and higher-order model terms were examined, but none resolved this structural limitation or improved model adequacy. Therefore, the DPPH model was interpreted descriptively and excluded from the desirability-based multi-response optimization.
Table 6.
Lack-of-fit tests for the fitted quadratic models. The lack-of-fit degrees of freedom (DF) were three for all the responses.
Table 7 lists the statistically significant terms (p < 0.05) in each quadratic RSM model. Extraction time (X2) was the dominant factor, significantly affecting all four responses (TPC, TFC, FRAP, DPPH). Temperature (X1) significantly influenced TPC, FRAP, and DPPH, but not TFC. Interactions and quadratic effects were limited, with X1, X2 and X22 being significant only for TPC. Overall, the table highlights that longer extraction time and higher temperatures generally enhanced phenolic content and antioxidant activity.
Table 7.
Significant model terms (p < 0.05) for the fitted quadratic RSM models.
3.2. Model Analysis
The fitted quadratic models describing the effect of temperature (X1) and extraction time (X2) on TPC, TFC, FRAP and DPPH are presented below. All models included linear, quadratic and interaction terms, and were expressed in uncoded units (°C and min).
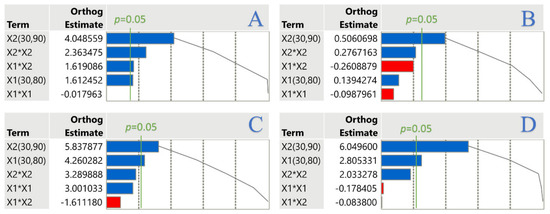
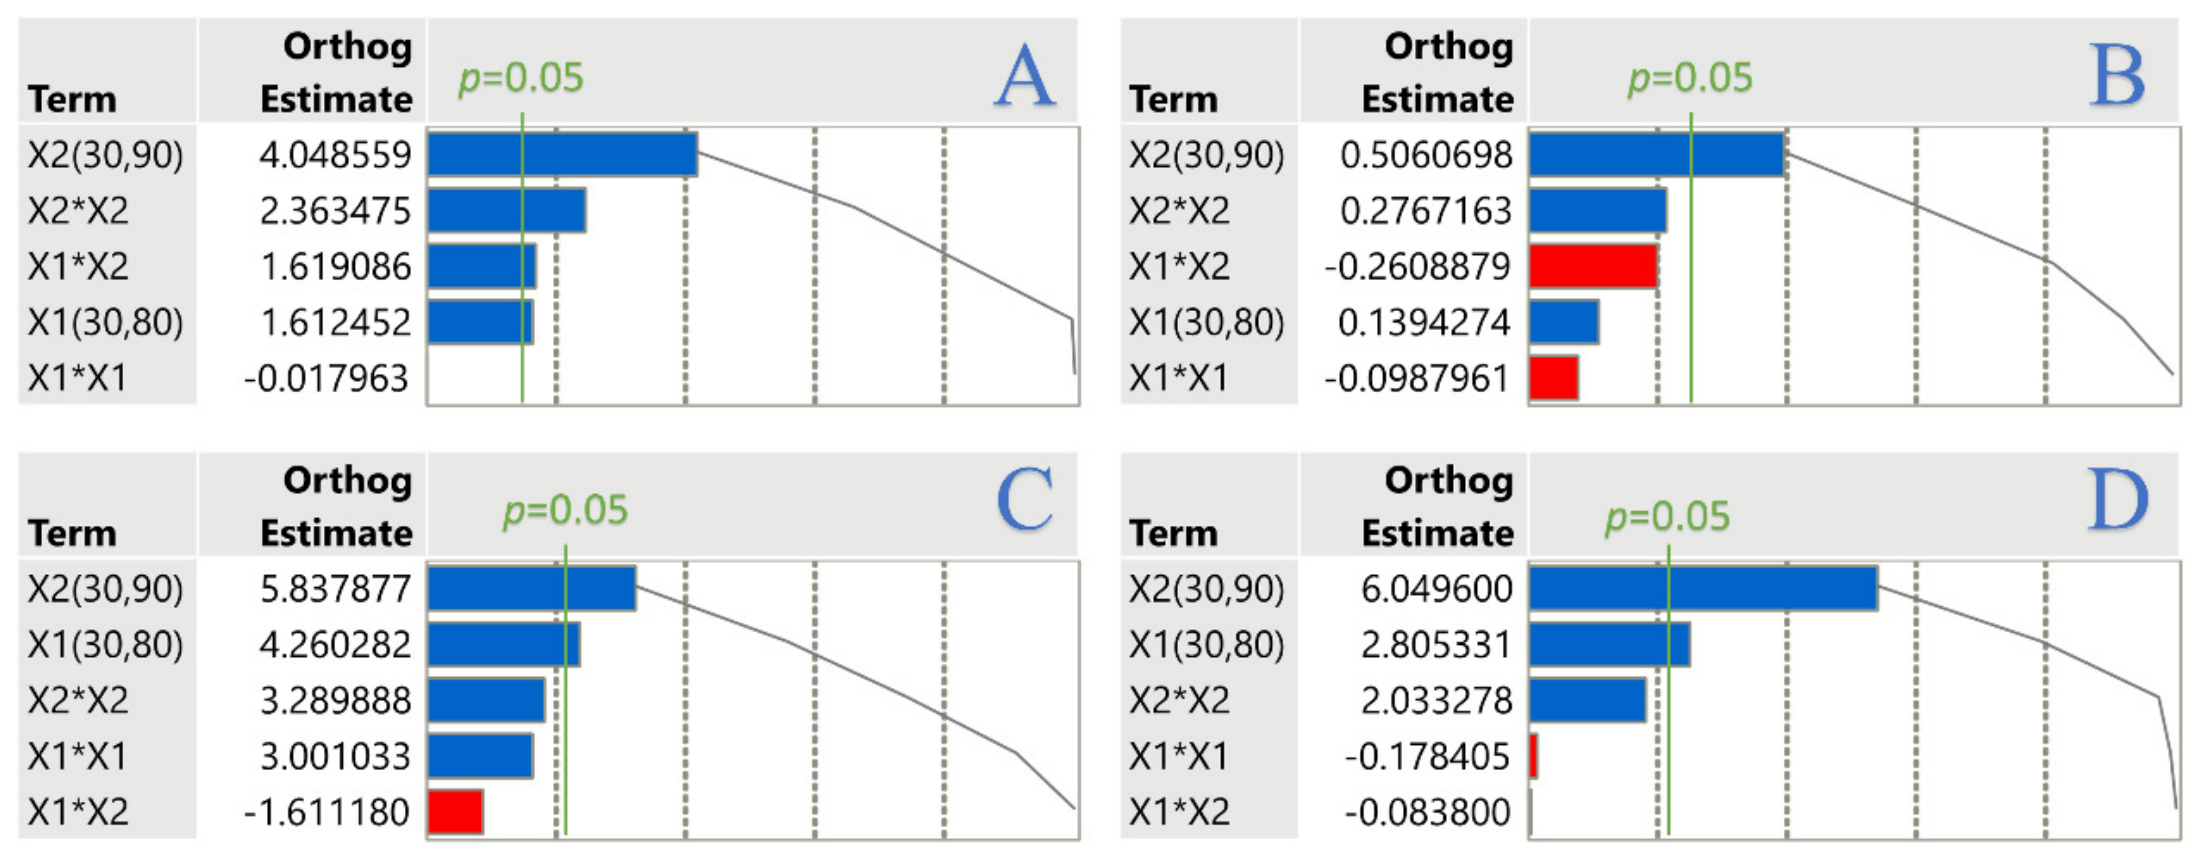
The Pareto charts in Figure 3 highlight the relative importance of the model terms for each response. For TPC, extraction time (X2) was the dominant positive factor, followed by the quadratic term X22 and the interaction X1 × X2, indicating both curvature and synergistic effects between temperature and time. In contrast, TFC was influenced almost exclusively by extraction time, with all other terms remaining below the significance threshold. For FRAP, both temperature (X1) and time (X2) exerted strong positive effects, confirming that higher extraction severity enhances reducing power. Similarly, DPPH was mainly driven by X2 and secondarily by X1, while interaction and quadratic terms were negligible. Overall, the Pareto charts confirm that extraction time is the most influential factor across all responses, whereas temperature contributes significantly to antioxidant-related responses but less to flavonoid extraction.
Figure 3.
Pareto charts of standardized effects for the fitted quadratic RSM models for (A) TPC, (B) TFC, (C) FRAP and (D) DPPH. Blue bars represent positive effects, whereas red bars represent negative effects on the response. Bars exceeding the significance threshold (p = 0.05) indicate statistically significant model terms.
3.3. Partial Least Squares (PLS) Analysis
A PLS regression model was developed to simultaneously evaluate the influence of temperature (X1) and extraction time (X2) on the four responses (TPC, TFC, FRAP, DPPH). The NIPALS algorithm with five latent factors was selected, as this configuration minimized the root mean PRESS (1.3 × 10⁻¹⁵) and was statistically supported by the van der Voet test (p = 1.000). The final model explained 100% of the variation in both the X and Y matrices, indicating an excellent overall fit.
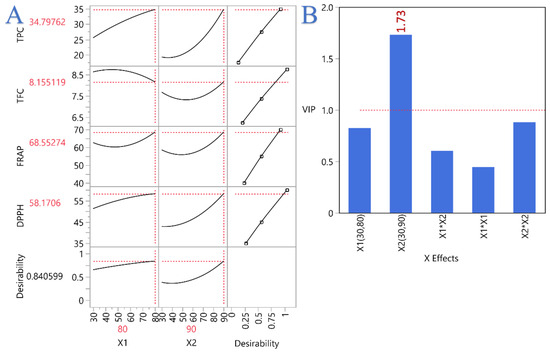
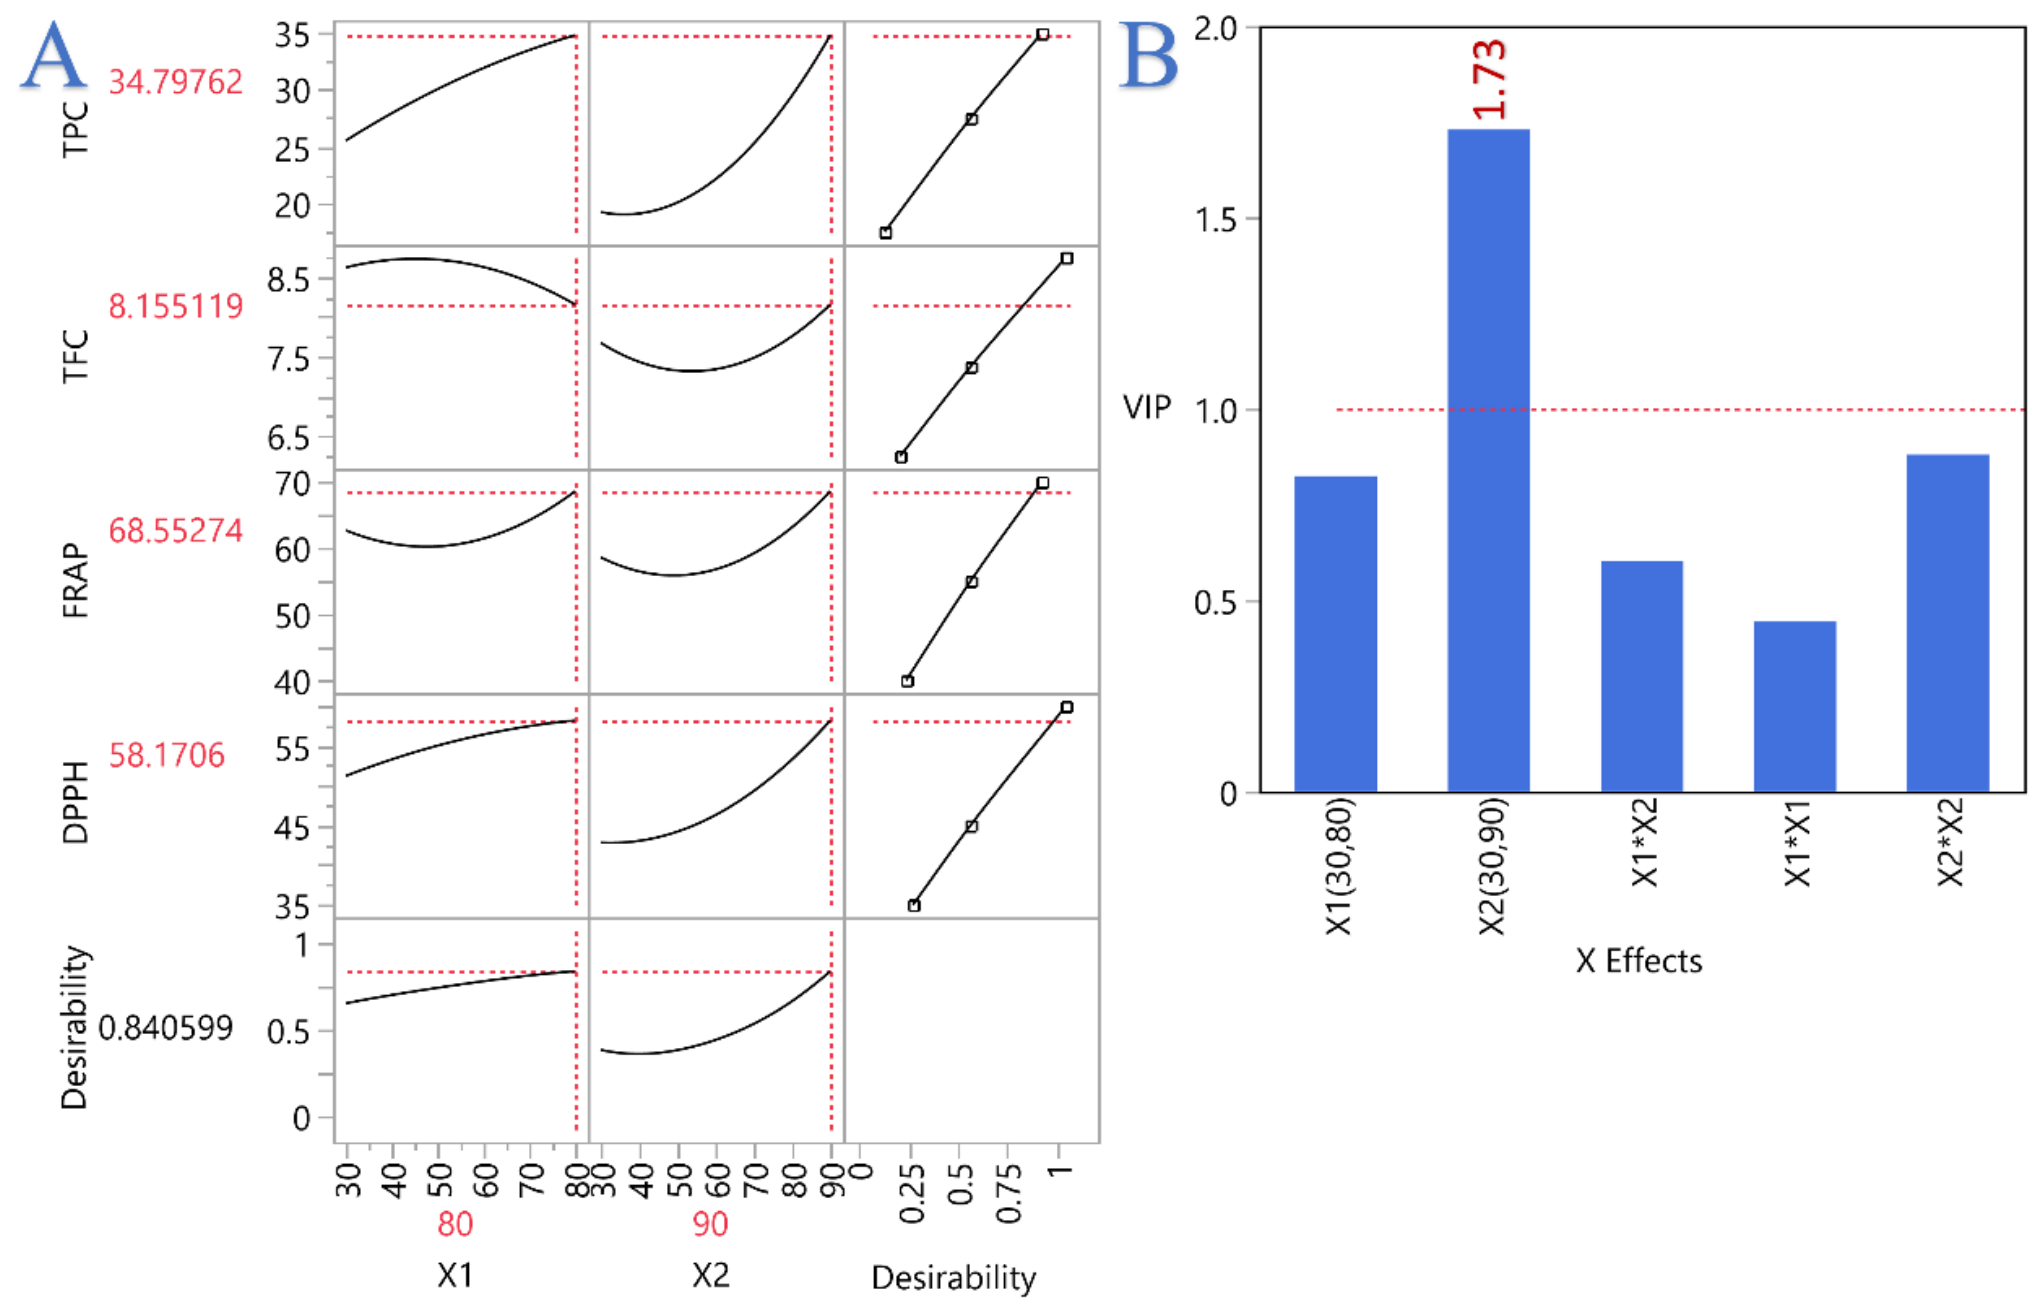
The Variable Importance in Projection (VIP) scores revealed that extraction time (X2) was the dominant predictor (VIP = 1.73), followed by moderate contributions from the quadratic term X22 (VIP = 0.88) and temperature (X1) (VIP = 0.82). Interaction and quadratic temperature effects (X1 × X2 and X12) had less influence (VIP < 0.60). These findings confirm that extraction time is the primary driver of phenolic recovery and antioxidant activity.
The X–Y score plots demonstrated (Figure 4) strong positive correlations among all responses, while the prediction profiler indicated that increasing X2 consistently enhanced TPC, TFC, FRAP, and DPPH. Temperature (X1) also contributed positively, particularly to FRAP and DPPH. Overall, the PLS analysis corroborates the RSM results, highlighting X2 as the most influential factor and supporting the presence of curvature effects in the extraction system.
Figure 4.
(A) Prediction profiler and multi-response desirability plot illustrating the effect of extraction temperature (X1) and extraction time (X2) on the four responses (TPC, TFC, FRAP, DPPH). The black curves represent the fitted quadratic RSM models, while the red dashed lines indicate the optimal settings that maximize the overall desirability. (B) Variable Importance in Projection (VIP) plot from the PLS model. Blue bars denote the relative contribution of each predictor, and the red dashed line marks the VIP = 1 threshold, above which variables are considered highly influential.
3.4. Optimal Extraction—Comparing Hydrothermal and DES Extraction
To examine the efficiency of the DES solvent at the optimal hydrothermal extraction conditions, O. elegantissima underwent a DES extraction process by applying optimal time and temperature hydrothermal conditions (90 min at 80 °C). Comparative results are shown in Table 8.
Table 8.
Maximum predicted responses, optimal aqueous extract under optimal extraction conditions, and comparison with DES extraction.
There is good agreement between the predicted and the experimental values, indicating high predictive adequacy of the selected model, confirming the results demonstrated by the tests performed. The hydrothermally yielded extract seems to possess higher antioxidant capacity and phenolic content, while the DES extract revealed enhanced anti-denaturation activity. However, it should be considered that glycerin has been reported to exert a protein-stabilizing effect and may influence the outcome of BSA denaturation [11]. In order to minimize the possible error due to glycerin’s aforementioned property, a blank sample containing DES was used for the spectrophotometer before measuring the test samples, which contained DES extracts.
3.5. HPLC Analysis of the Optimal Extract
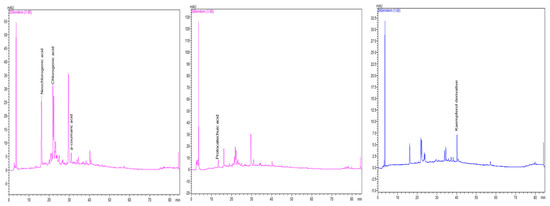
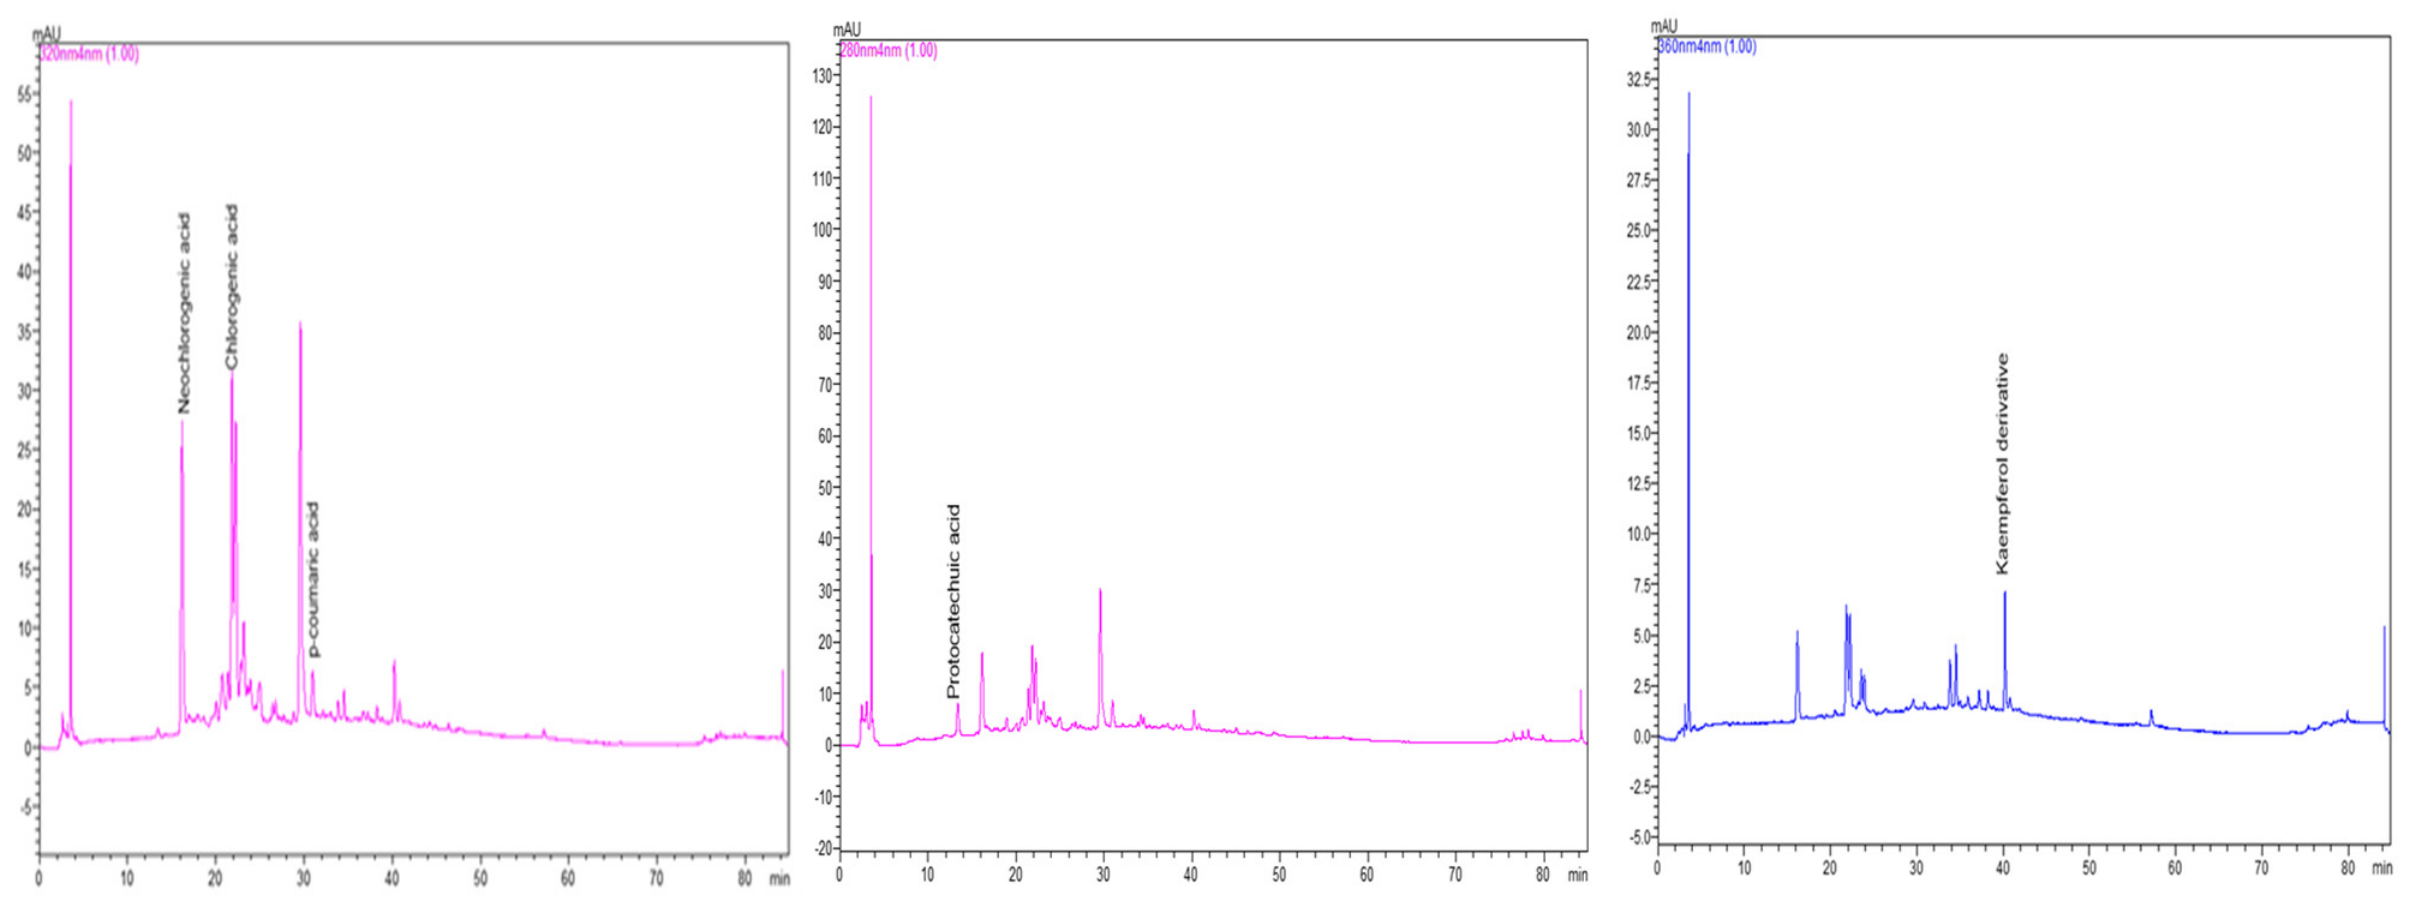
The dominant polyphenolic compounds of both extract types were identified and quantified by HPLC-DAD (Table 9). Neochlorogenic acid, protocatechuic acid, chlorogenic acid, p-coumaric acid and a kaempferol derivative were present, as shown in Figure 5. As shown in Table 9, under the tested conditions, hydrothermal extraction yielded higher total phenolic content, whereas the glycerol/choline chloride DES showed selective recovery of chlorogenic acid.
Table 9.
Polyphenolic compounds analysis of optimal extract under optimal extraction conditions.
Figure 5.
HPLC chromatograms at 320 nm of optimal hydrothermal extract, demonstrating polyphenolic compounds (neochlorogenic acid, chlorogenic acid, p-coumaric acid, protocatechuic acid, kaempferol derivative).
Phytochemical analysis of various Onosma species has demonstrated abundance of polyphenolic constituents, as their TPC ranges from approximately 10 to 70 mg GAE/g, while TFC content is reported up to 45 mg RE/g. However, there is a wide range of TPC content depending on the solvent used as well, as methanolic extracts tend to recover more polyphenols than aqueous extracts. This remarkable polyphenol concentration is thought to contribute to Onosma extracts’ beneficial properties. There is a pattern of dominant phenolic compounds detected among the Onosma genus, including rosmarinic acid, chlorogenic and caffeic acid, while apigenin, rutin, luteolin and their glucosides are the major flavonoid compounds [2,17,18,19].
Comparing the phenolic acids isolated from Onosma species, rosmarinic acid was the most dominant (e.g., O. oreodoxa 87.5 mg/g, O. lycaeonica 65 mg/g, O. ambigens 37.67 mg/g, O. gracilis 21.82 mg/g, O. trapezuntea 9.09 mg/g, O. papillosa 6.31 mg/g, O. rigidum 3.75 mg/g, O. pulchra 2.52 mg/g), despite the fact that it was not detected in our extracts [2,18,19,20,21].
Neochlorogenic acid (NCGA) was present in the highest concentration among O. elegantissima polyphenols (0.76 mg/g); however, there are no references documenting NCGA’s presence in other Onosma species. Yet, protocatechuic acid (PCA) (0.72 mg/g) seems to be quite abundant among Onosma representatives of different concentrations (e.g., O. oreodoxa and O. ambigens 0.99 mg/g, O. gracilis, O. trapezuntea and O. papilosa 0.25 mg/g, O. lycaeonica 0.16 mg/g, O. pulchra 0.14 mg/g, O. rigidum 0.12 mg/g) [2,18,19,20,21].
Chlorogenic acid (CGA) content follows a similar pattern, e.g., O. oreodoxa 0.27 mg/g and O. ambigens 0.057 mg/g, O. gracilis, 0.10 mg/g, O. trapezuntea 0.53 mg/g, O. papilosa 14 mg/g, O. lycaeonica 0.85 mg/g, O. pulchra 0.79 mg/g, O. rigidum 17 mg/g [2,18,19,20,21]. The recovery seems to be affected the most by the extraction solvent, as its concentration in O. pulchra and O. ambigens methanol extracts is almost quadrupled (2.12 mg/g and 3.76 mg/g, respectively) compared to aqueous extracts. Likewise, only 0.49 mg/g CGA was isolated from O. elegantissima’s aqueous extract, while 2.12 mg/g was detected in the DES extract [2,18,19,20,21].
Even though p-coumaric acid is the least abundant compound in O. elegantissima, its concentration (0.31 mg/g) is much higher than in other Onosma representatives, where it ranges from 0.079 mg/g to 0.35 mg/g [2,18,19,20,21].
3.6. Antidiabetic Effect
No detectable antidiabetic effect of the O. elegantissima optimal conditions extract was determined at the tested concentration in vitro. According to published data, some Onosma species exhibit antidiabetic effects due to the presence of rosmarinic acid, ferulic acid, apigenin and luteolin derivatives [1,2,5,6,7,8,9]. However, none of these compounds were identified in the O. elegantissima aqueous extracts, which supports the lack of antidiabetic activity observed in our samples.
3.7. Antibacterial Activity
O. elegantissima extract did not exhibit any antibacterial effect on the tested bacterial strains, and no MIC was observed at the tested concentrations. Notably, p-coumaric acid, chlorogenic acid and protocatechuic acid demonstrate antimicrobial activity against microorganisms, as mentioned in the literature [25,26,27,28,29,30,31]. Our results could be explained by the concentration of these compounds in the prepared extracts. Consequently, further investigation is required to determine whether more concentrated extracts of O. elegantissima exhibit significant antibacterial activity.
3.8. Molecular Docking
The final reported docking subset was completed for 24 receptor–ligand pairs using three independent seeds per pair. All 72 strict docking calculations were completed successfully. This analysis was designed to test numerical stability and binding-site compatibility, not to convert docking into experimental evidence of enzyme inhibition. The reproducibility package containing materials required to fully reproduce the computational workflow is provided as Supplementary Material (File S1). Across three independent seeds, donepezil redocking in AChE 4EY7 reproduced the crystallographic pose with MODEL 1 RMSD values of 0.38–1.02 Å (mean 0.80 Å), and lisinopril redocking in ACE 1O86 reproduced the native binding mode with RMSD values of 0.92–1.31 Å (mean 1.06 Å). All redocking poses fell below the conventional 2 Å success threshold, although ACE recovery was slightly less tight than AChE. AChE and ACE were therefore retained as the only receptor models used for final interpretive discussion, with ACE interpreted more cautiously.
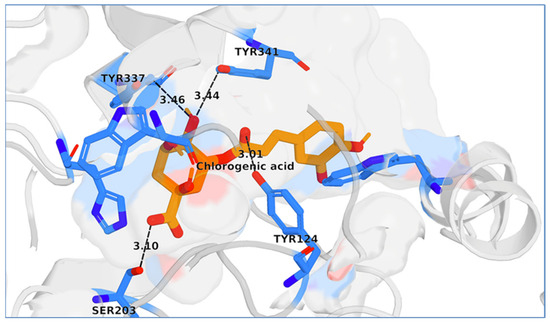
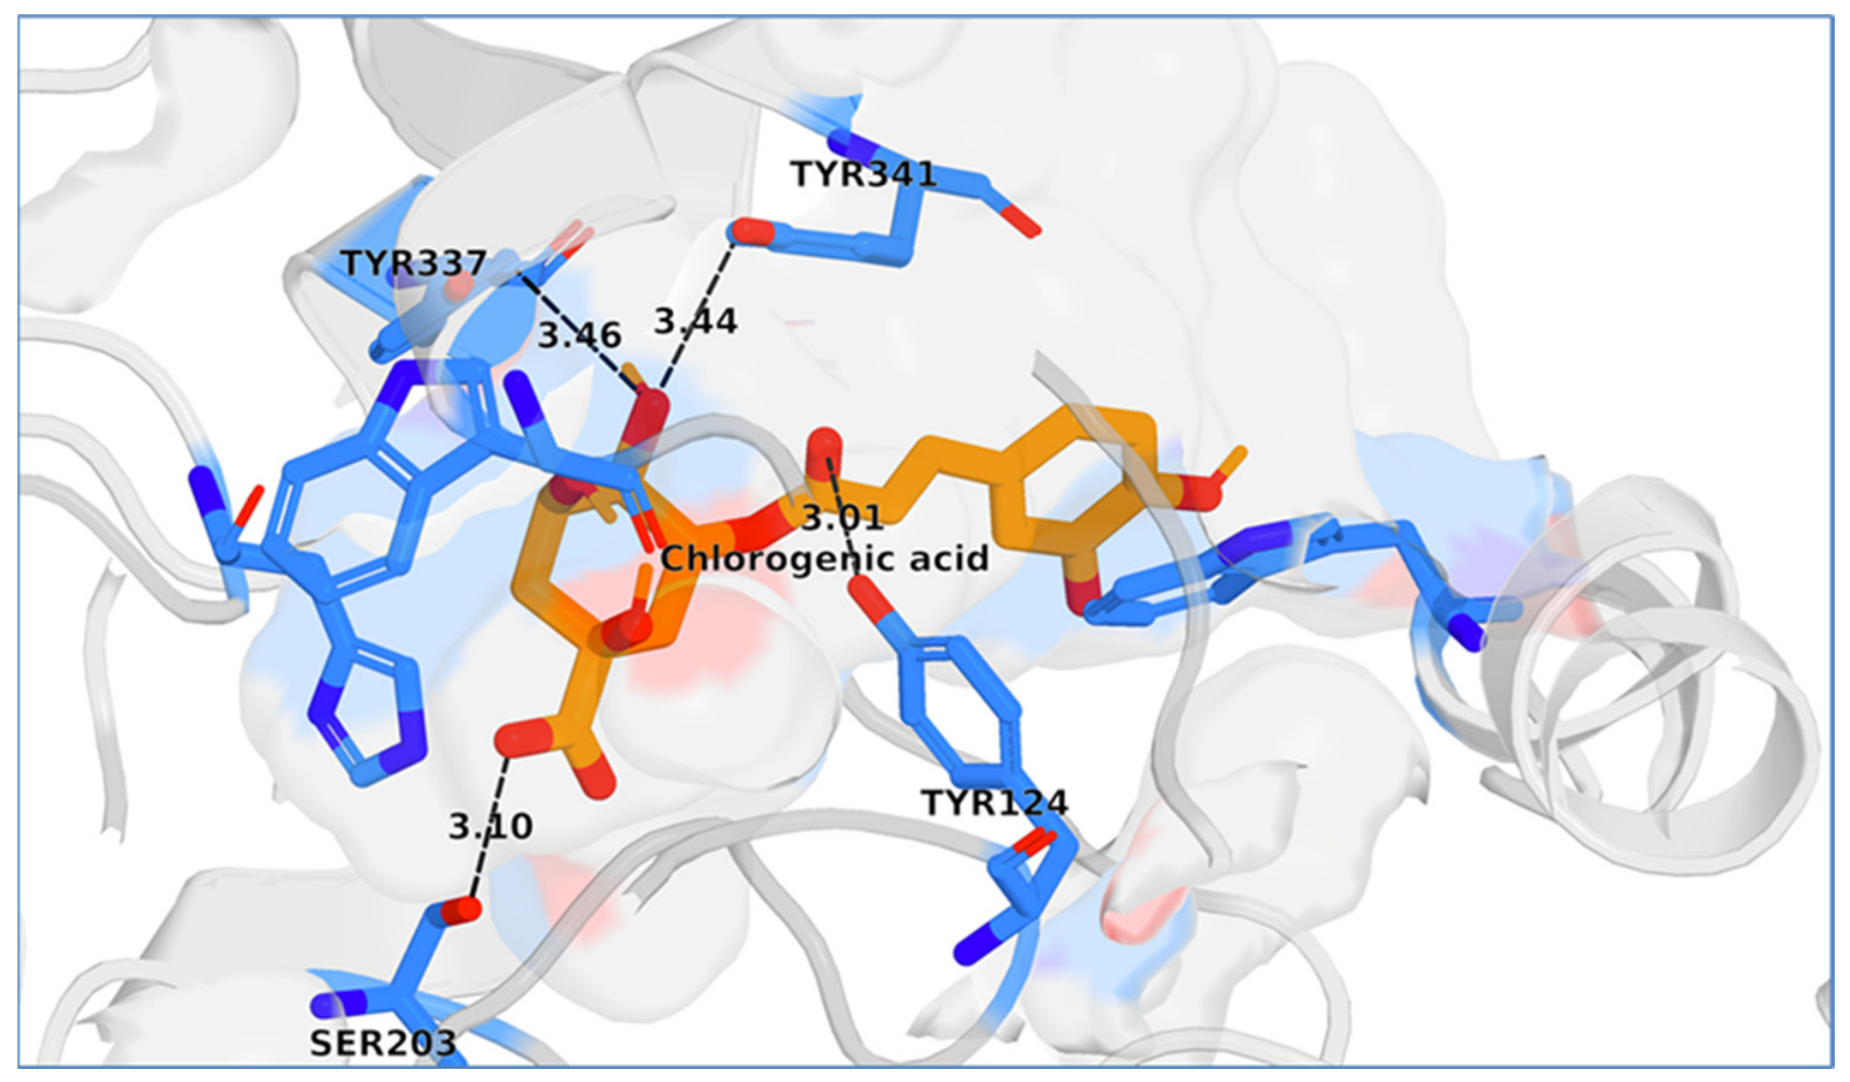
The most extract-aligned docking result was observed for AChE. Chlorogenic acid and neochlorogenic acid, both identified in the HPLC-DAD analysis, consistently occupied the AChE active site gorge across all three seeds. Chlorogenic acid showed a rounded mean Vina score of approximately −10.10 kcal/mol, while neochlorogenic acid showed a rounded mean score of approximately −9.77 kcal/mol. Both compounds shared a conserved contact pattern involving the catalytic anionic/peripheral gorge region, including GLU202, SER203, TRP86, TYR124, TRP286, TYR337, PHE338, TYR341, and HIS447 (Figure 6: a representative pose of chlorogenic acid in which only TYR337, TYR341, TYR124, and SER203 are labeled). The conservative interpretation is that the AChE gorge is accommodated and prioritized for future AChE inhibition testing, not a demonstration of cholinesterase inhibition in the present study.
Figure 6.
Docked chlorogenic acid poses in the AChE gorge. Representative docking pose of chlorogenic acid in the acetylcholinesterase active site gorge (PDB ID: 4EY7). The ligand is shown in orange, selected gorge residues in blue, and the local receptor cavity as a semi-transparent gray surface/cartoon. Dashed lines show selected close contacts between the ligand and nearby residues, with distances given in Angstroms. This visualization highlights the placement of chlorogenic acid within the gorge and its proximity to residues TYR337, TYR341, TYR124, and SER203.
Rosmarinic acid achieved the highest AChE score in the retained docking subset and exhibited the same reproducible gorge-associated contact pattern. However, it was not included in the current HPLC-DAD table and is therefore treated only as a literature-related Onosma comparator. It is not used as evidence of the measured extract’s activity.
ACE docking generated reproducible active site pocket poses for several flavonoid glycoside comparators. However, the most informative ACE ligands in this subset, including rutin, luteolin-7-glucoside, hyperoside, and kaempferol-3-rutinoside/nicotiflorin, were not detected in the current HPLC-DAD profile. ACE observations are therefore interpreted only as hypotheses involving purified compounds or genus comparators. They are not presented as extract-level evidence, and no ACE inhibition is inferred. Because Vina is not a dedicated metal coordination model, ACE/Zn observations are described qualitatively rather than as precise coordination geometries.
Protocatechuic acid and p-coumaric acid were included in the retained docking subset because they were assigned in the HPLC-DAD profile, but they did not enter the high-priority AChE/ACE hypothesis set. These compounds are therefore reported transparently as screened lower-priority docking outcomes. Overall, the docking results support a focused future experimental priority: biochemical AChE testing of chlorogenic and neochlorogenic acids, and, secondarily, purified-compound ACE testing only if the relevant glycosides are confirmed or tested as external standards. Table 10 summarizes the final retained AChE/ACE docking priorities, distinguishing HPLC-detected extract constituents from non-detected comparator compounds and defining the appropriate use of each docking observation for future biochemical testing.
Table 10.
Final docking prioritization for the retained AChE/ACE subset.
4. Discussion
The present study reveals for the first time the phytochemical profile and the antioxidant potential of a rare, highly endemic plant of the Onosma genus of the Boraginaceae family known as O. elegantissima. Different hydrothermal extraction conditions were applied to identify the optimal extraction conditions.
The combined RSM and PLS analyses provided a coherent and robust understanding of how extraction temperature and time influence the recovery of phenolic compounds and antioxidant activity from O. elegantissima. Across all statistical approaches, extraction time (X2) consistently emerged as the dominant factor, significantly enhancing TPC, TFC, FRAP and DPPH values, a trend that aligns with the diffusion-controlled nature of solid–liquid extraction. Temperature (X1) exerted a secondary but meaningful effect, particularly on FRAP and DPPH, reflecting the thermally enhanced release of bound phenolics and the increased reaction kinetics of antioxidant mechanisms. The presence of curvature—mainly through the X22 term—indicates that prolonged extraction improves yields up to a point, beyond which gains diminish, highlighting the importance of identifying an optimal extraction window. The strong agreement between RSM significant patterns, Pareto effects, and PLS VIP scores reinforces the reliability of the findings and confirms that the extraction system is primarily governed by time-dependent mass transfer phenomena. Overall, the statistical evidence demonstrates that maximizing extraction time and applying moderately high temperatures provides the most favorable conditions for achieving high phenolic content and antioxidant capacity, offering a clear and scientifically supported strategy for optimizing the extraction of bioactive compounds from O. elegantissima.
Our study confirmed the model’s predictions and demonstrated that the polyphenolic profile of Onosma elegantissima yielded a TPC of 35.19 mg GAE/g and a TFC of 8.39 mg RE/g. Furthermore, its antioxidant capacity and free radical scavenging potency were determined by FRAP and DPPH assays to be 71.05 μmol TE/g and 59.50 μmol TE/g, respectively. According to previous studies, the total phenolic content of various Onosma species exhibited values ranging from 53.76 mg GAE/g (O. oreodoxa) and 69.03 mg GAE/g (O. leptantha) to lower values (10–34 mg GAE/g) reported for O. papillosa, O. rigidum, and O. trapezuntea. Similarly, reported TFC values ranged from 6 to 46 mg RE or QE/g. Although the majority of these literature results were obtained from methanolic extracts, the polyphenolic profile of O. elegantissima remains well within the range described for other representatives of the genus [2,5,6,7,8,9].
The antioxidant capacity of aqueous extracts, measured by DPPH and FRAP reducing power assays, exhibited values ranging from 279 to 390 μmol TE/g (for O. pulchra and O. ambigens, respectively), while methanolic extracts possessed a stronger antioxidant potency, ranging from 360 to 719 μmol TE/g [2,5,6,7,8,9]. Even though our results on the antioxidant capacity of O. elegantissima extract are lower, these differences may be attributed to variations in species geographical origin, environmental conditions, period of harvesting, chemical profile and extraction procedure.
The efficiency of the deionized water towards DES (glycerol–chloride choline) on the extraction of bioactive compounds from O. elegantissima was studied under the best conditions within the tested range identified at the hydrothermal extraction. DES extraction is an alternative, accessible, and green method, as DESs result in the efficient recovery of active compounds with low energy consumption and avoid the use of organic solvents that are flammable, toxic, and harmful to the environment [23,24,32,33]. Conversely, the most-used hydrothermal extraction exhibits low selectivity, while hot water can degrade sensitive compounds. Furthermore, the solubility of polyphenols in water varies depending on the conditions applied. Although DES exhibits better outputs in selectivity and polyphenol recovery, mass transfer is reduced due to high solvent viscosity, diminishing the yield and the polyphenol concentration in the extract. Our experimental data support once more that under the tested conditions, water extraction remains more efficient, as hydrothermal extraction yielded higher total phenolic content and antioxidant capacity. The lower TPC and TFC observed may be attributed not only to the solvent’s recovery capacity but also to its physical limitations. DES’s high viscosity may limit mass transfer and therefore extraction efficiency by hindering its penetration into the plant tissue, as a result reducing the diffusion of the target compounds. Therefore, DES extraction efficiency could be improved by incorporating moderate water amounts (suggested 10–20% v/v) in order to lower the solvent viscosity and ameliorate extraction efficacy, while preserving the solvent’s other favorable features, assuming that this is a promising strategy for future optimization [34,35,36].
HPLC analysis revealed the presence of neochlorogenic acid, protocatechuic acid, chlorogenic acid and p-coumaric acid, with neochlorogenic acid being the most abundant (0.76 mg/g dw). Further evaluation of the individual compounds detected in O. elegantissima highlights the plant’s therapeutic potential. Neochlorogenic acid (NCGA), the most abundant polyphenol in the extract, belongs to the caffeoylquinic acids. NCGA exerts neuroprotective effects against Alzheimer’s disease by inhibiting reactive oxygen species (ROS) production, thereby preventing oxidative stress and inflammation [17]. Additionally, it regulates lipid metabolism, attenuating lipid accumulation and preventing fatty liver conditions [18]. Protocatechuic acid (PCA) is the second most dominant compound. This phenolic acid enhances endogenous antioxidant mechanisms through free radical scavenging and exhibits strong anti-inflammatory activity by downregulating COX-2, TNF-α, and IL-1β. Furthermore, PCA displays multifaceted anticancer properties by suppressing tumorigenesis, inducing apoptosis, and reducing metastasis [19,20]. It also crosses the blood–brain barrier—providing neuroprotection and improving cognitive impairment [20]—while demonstrating broad-spectrum antimicrobial activity [21]. Another prevalent phenolic acid, p-coumaric acid (p-CouA), combines low toxicity with significant antioxidant, anti-inflammatory, and antiproliferative properties. Studies also confirm its antimicrobial efficacy against various bacterial and fungal strains, alongside its neuroprotective, renal, gastrointestinal, and cardioprotective effects [22,23,24]. Finally, chlorogenic acid (CGA) possesses well-documented biological benefits. Like other compounds, CGA scavenges free radicals and downregulates inflammatory pathways. It protects the liver and kidneys by suppressing pro-inflammatory factors and inducing apoptosis, a mechanism that also drives its antiproliferative actions. Moreover, CGA exhibits antibacterial potency by disrupting bacterial cell membranes and metabolic pathways, while its ability to regulate glucose uptake and lipid metabolism makes it a promising therapeutic agent for metabolic diseases such as diabetes [25,26,27]. Nevertheless, it is highly probable that the high dilution rate of our samples resulted in inadequate antibacterial activity, necessitating further investigation to confirm the antimicrobial activity of O. elegantissima at different concentrations. It is also worth noting that TPC determined by the Folin–Ciocalteu assay was considerably higher than the cumulative concentration of the identified phenolic compounds by HPLC, leading us to conclude that both identified and unidentified compounds contribute to the beneficial properties of the extract. Therefore, further investigation and employment of complementary assays are essential to obtain a more complete characterization of O. elegantissima extract’s phenolic fraction.
According to molecular docking data, the most practical experimental prioritization appears to be the AChE in vitro assay. This is based on the detection status, contact reproducibility, and assay relevance; since neochlorogenic and chlorogenic acids were identified in O. elegantissima by HPLC-DAD and reproducibly positioned within the AChE gorge, they represent the strongest extract-consistent docking follow-up. Data derived from an in vitro analysis conducted on other Onosma representatives suggested that these species contained molecules capable of inhibiting AChE, confirming the molecular docking results. Therefore, we conclude that Onosma extracts may possess a protective role against Alzheimer’s disease, as the inhibition of this enzyme prevents acetylcholine’s breakdown, which is a neurotransmitter promoting brain signaling and memory encoding. Specifically, O. gracilis extracts exhibited the highest AChE inhibitory activity, with a value of 2.57 mg GALAEs/g, followed by O. oreodoxa and O. grecae, with 2.40 mg GALAEs/g and 2.35 mg GALAEs/g, respectively. O. trapezuntea, O. rigidum, O. lycaonica and O. papillosa extracts also exhibited inhibitory activity against this enzyme [2,7,8,9].
5. Conclusions
In conclusion, our study reveals enhanced polyphenol and flavonoid contents as well as antiradical activity of the Onosma elegantissima aqueous extract, suggesting that the plant could serve as a traditional remedy, as the literature has shown for the Onosma genus [1,2,3,7,8]. Further investigation is conducted in order to clarify the antibacterial potency of hydrothermal extracts and their additional pharmacological properties as suggested by molecular docking data.
Supplementary Materials
The following supporting information can be downloaded at: https://www.mdpi.com/article/10.3390/appliedchem6030053/s1, Molecular docking reproducibility package (computational workflow, receptor/ligand files, grid definitions, Vina outputs, redocking calibration, scripts, checksum manifest).
Author Contributions
Conceptualization, A.V. and P.M.; methodology, V.A., S.I.L. and P.M.; investigation, A.V., G.P. and V.A.; validation, A.V., V.A., G.P., S.I.L. and P.M.; formal analysis, A.V., V.A. and G.P.; resources V.A., G.P., S.I.L. and P.M.; data curation, V.A., G.P. and P.M.; writing—original draft preparation, A.V., V.A. and G.P.; writing—review and editing, A.V., V.A., G.P., S.I.L. and P.M.; visualization, A.V. and V.A.; supervision P.M.; project administration, P.M. All authors have read and agreed to the published version of the manuscript.
Funding
This research received no external funding.
Institutional Review Board Statement
Not applicable.
Informed Consent Statement
Not applicable.
Data Availability Statement
The raw data supporting the conclusions of this article will be made available by the authors on request. The molecular docking reproducibility package supporting the findings of this study has been deposited as Supplementary Material. The package includes the final AChE/ACE docking subset, receptor and ligand PDBQT files, grid definitions, strict three-seed AutoDock Vina outputs for 72 calculations, native-ligand redocking calibration files, score summaries, contact-consensus tables, package-relative scripts, and a checksum manifest. All materials required to fully reproduce the computational workflow are available in the uploaded Supplementary Material.
Acknowledgments
The authors would like to thank Athanasios Bourtsos, Lazos Serefas, Dimitrios Tsitsias and Markos Grammenos for their help in locating and collecting O. elegantissima. The authors honor the memory of Michalis Dainavas for his contribution to identifying the plants and providing the authors with valuable information about the traditional uses and the characteristics of herbs from Mount Vourinos. The authors would also like to thank Thomai Lazou and Serafeim Chaintoutis for their valuable contribution to experimental procedures of antibacterial effect, and Martha Maria Mantiniotou for her critical contribution to HPLC analysis of the extracts.
Conflicts of Interest
The authors declare no conflicts of interest.
Abbreviations
The following abbreviations are used in this manuscript:
| DES | Deep Eutectic Solvent(s) |
| GAE | Gallic Acid Equivalents |
| RE | Rutin Equivalents |
| dw | Dry Weight |
| HPLC | High Permformance Liquid Chromatography |
| TPC | Total Phenolic Content |
| TFC | Total Flavonoid Content |
| FRAP | Ferric Reducing Antioxidant Power |
| DPPH | 2,2-diphenyl-1-picrylhydrazyl |
| RSM | Response Surface Methodology |
| ANOVA | Analysis of Variance |
| BSA | Bovine Serum Albumin |
| BMD | Micro-Broth Microdilution |
| MHA | Mueller–Hinton agar |
| MHB | Mueller–Hinton Broth |
| MHF | Mueller–Hinton Fastidious |
| MIC | Minimum Inhibitory Concentration |
| AChE | Acetylcholinesterase |
| ACE | Angiotensin Converting Enzyme |
| CCD | Central Composite Design |
| PLS | Partial Least Squares |
| VIP | Variable Importance in Projection |
| NCGA | Neochlorogenic acid |
| PCA | Protocatechuic acid |
| CGA | Chlorogenic acid |
References
- Jabbar, A.A.; Abdullah, F.O.; Hassan, A.O.; Galali, Y.; Hassan, R.R.; Rashid, E.Q.; Salih, M.I.; Aziz, K.F. Ethnobotanical, Phytochemistry, and Pharmacological Activity of Onosma (Boraginaceae): An Updated Review. Molecules 2022, 27, 8687. [Google Scholar] [CrossRef] [Scilit] [PubMed]
- Kirkan, B.; Sarikurkcu, C.; Zengin, G. Bioactive constituents, antioxidant effects and enzyme inhibitory properties of two Onosma species (Onosma trapezuntea and O. Rigidum). S. Afr. J. Bot. 2022, 145, 142–148. [Google Scholar] [CrossRef] [Scilit]
- Rajapara, A.M.; Shah, M.B. The Genus Onosma L.: A Comprehensive Review. EPRA Int. J. Res. Dev. 2021, 6, 219–227. [Google Scholar] [CrossRef] [Scilit]
- Dainavas, M. The Botanical Heaven of Bourinos, 1st ed.; Region of Western Macedonia: Kozani, Greece, 2025. [Google Scholar]
- Sarikurkcu, C.; Sahinler, S.S.; Ceylan, O.; Tepe, B. Onosma ambigens: Phytochemical composition, antioxidant and enzyme inhibitory activity. Ind. Crops Prod. 2020, 154, 112651. [Google Scholar] [CrossRef] [Scilit]
- Sarikurkcu, C.; Sahinler, S.S.; Ceylan, O.; Tepe, B. Onosma pulchra: Phytochemical composition, antioxidant, skin-whitening and anti-diabetic activity. Ind. Crops Prod. 2020, 154, 112632. [Google Scholar] [CrossRef] [Scilit]
- Baltaci, N.; Aydogdu, N.; Sarikurkcu, C.; Tepe, B. Onosma gracilis (Trautv.) and O. oreodoxa (Boiss. & Heldr.): Phytochemistry, in silico docking, antioxidant and enzyme inhibitory activities. S. Afr. J. Bot. 2021, 143, 410–417. [Google Scholar] [CrossRef] [Scilit]
- Saravanakumar, K.; Sarikurkcu, C.; Sahinler, S.S.; Sarikurkcu, R.B.; Wang, M.-H. Phytochemical Composition, Antioxidant, and Enzyme Inhibition Activities of Methanolic Extracts of Two Endemic Onosma Species. Plants 2021, 10, 1373. [Google Scholar] [CrossRef] [Scilit] [PubMed]
- Panou, E.; Zengin, G.; Milic, N.; Ganos, C.; Graikou, K.; Chinou, I. A Comparative UPLC/HRMS Molecular Networking-Enhanced Study on the Phenolic Profiles and Bioactivities of Three Medicinally Significant Species of Onosma (Boraginaceae). Plants 2024, 13, 3468. [Google Scholar] [CrossRef] [Scilit] [PubMed]
- Osorio-Tobón, J.F. Recent advances and comparisons of conventional and alternative extraction techniques of phenolic compounds. J. Food Sci. Technol. 2020, 57, 4299–4315. [Google Scholar] [CrossRef] [Scilit] [PubMed]
- Jiang, J.; Song, X.; Zhao, L.; Wang, S.; Hou, B.; Li, B.; Dudu, O.E.; Yi, H.; Zhang, L.; Gong, P. Glycerin-Betaine-Based Natural Eutectic Solvent Enhanced the Spray Drying Resistance of Lactobacillus. Food Bioprocess Technol. 2024, 17, 3654–3669. [Google Scholar] [CrossRef] [Scilit]
- Singleton, V.L.; Orthofer, R.; Lamuela-Raventós, R.M. Analysis of total phenols and other oxidation substrates and antioxidants by means of folin-ciocalteu reagent. Methods Enzymol. 1999, 299, 152–178. [Google Scholar] [CrossRef] [Scilit]
- Bhaigyabati, T.; Devi, P.; Bag, G. Total flavonoid content and antioxidant activity of aqueous rhizome extract of three Hedychium species of Manipur valley. Res. J. Pharm. Biol. Chem. Sci. 2014, 5, 970–976. [Google Scholar]
- Pulido, R.; Bravo, L.; Saura-Calixto, F. Antioxidant Activity of Dietary Polyphenols as Determined by a Modified Ferric Reducing/Antioxidant Power Assay. J. Agric. Food Chem. 2000, 48, 3396–3402. [Google Scholar] [CrossRef] [Scilit] [PubMed]
- Sánchez-Moreno, C.; Larrauri, J.; Saura-Calixto, F. A Procedure to Measure the Antiradical Efficiencyof Polyphenols. J. Sci. Food Agric. 1998, 76, 270–276. [Google Scholar] [CrossRef]
- Castañeda-Corral, G.; Cedillo-Cortezano, M.; Petricevich, V.L. Parallel In Vitro and In Silico Studies of the Anti-Inflammatory Activity of Bioactive Compounds Found in Different Ethanolic Extracts of Bracts from B. x buttiana (var. Rose): A Comparative Analysis. Pharmaceuticals 2025, 18, 821. [Google Scholar] [CrossRef] [Scilit] [PubMed]
- Sathya, A.; Siddhuraju, P. Role of phenolics as antioxidants, biomolecule protectors and as anti–diabetic factors—Evaluation on bark and empty pods of Acacia auriculiformis. Asian Pac. J. Trop. Med. 2012, 5, 757–765. [Google Scholar] [CrossRef] [Scilit] [PubMed]
- Vadivel, V.; Biesalski, H.K. Contribution of phenolic compounds to the antioxidant potential and type II diabetes related enzyme inhibition properties of Pongamia pinnata L. Pierre seeds. Process Biochem. 2011, 46, 1973–1980. [Google Scholar] [CrossRef] [Scilit]
- Chen, S.; Li, Z.; Gu, Z.; Ban, X.; Hong, Y.; Cheng, L.; Li, C. A new micro-agar dilution method to determine the minimum inhibitory concentration of essential oils against microorganisms. J. Microbiol. Methods 2023, 211, 106791. [Google Scholar] [CrossRef] [Scilit] [PubMed]
- ISO 20776-1:2019; Susceptibility Testing of Infectious Agents and Evaluation of Performance of Antimicrobial Susceptibility Test Devices. International Organization of Standardization: Geneva, Switzerland, 2019. Available online: https://www.iso.org/standard/70464.html (accessed on 25 May 2026).
- Eberhardt, J.; Santos-Martins, D.; Tillack, A.F.; Forli, S. AutoDock Vina 1.2.0: New Docking Methods, Expanded Force Field, and Python Bindings. J. Chem. Inf. Model. 2021, 61, 3891–3898. [Google Scholar] [CrossRef] [Scilit] [PubMed]
- Trott, O.; Olson, A.J. AutoDock Vina: Improving the speed and accuracy of docking with a new scoring function, efficient optimization, and multithreading. J. Comput. Chem. 2010, 31, 455–461. [Google Scholar] [CrossRef] [Scilit] [PubMed]
- Usman, M.; Nakagawa, M.; Cheng, S. Emerging Trends in Green Extraction Techniques for Bioactive Natural Products. Processes 2023, 11, 3444. [Google Scholar] [CrossRef] [Scilit]
- Osamede Airouyuwa, J.; Mostafa, H.; Riaz, A.; Maqsood, S. Utilization of natural deep eutectic solvents and ultrasound-assisted extraction as green extraction technique for the recovery of bioactive compounds from date palm (Phoenix dactylifera L.) seeds: An investigation into optimization of process parameters. Ultrason. Sonochem. 2022, 91, 106233. [Google Scholar] [CrossRef] [Scilit] [PubMed]
- Mahfuz, S.; Mun, H.-S.; Dilawar, M.A.; Ampode, K.M.B.; Yang, C.-J. Potential Role of Protocatechuic Acid as Natural Feed Additives in Farm Animal Production. Animals 2022, 12, 741. [Google Scholar] [CrossRef] [Scilit] [PubMed]
- Zaman, A.; Hasnat, H.; Noman, Z.A.; Islam, M.M.; Nakib, A.A.; Mukherjee, S.; Saha, K.; Ahmed, N.U.; Ashrafi, S.; Saha, T.; et al. Exploring Pharmacological Potentials of p-Coumaric Acid: A Prospective Phytochemical for Drug Discovery. Bangladesh Pharm. J. 2023, 26, 185–194. [Google Scholar] [CrossRef] [Scilit]
- Tehami, W.; Nani, A.; Khan, N.A.; Hichami, A. New Insights into the Anticancer Effects of p-Coumaric Acid: Focus on Colorectal Cancer. Dose-Response 2023, 21, 15593258221150704. [Google Scholar] [CrossRef] [Scilit] [PubMed]
- Liu, P.; Shen, J.; Cao, J.; Jiang, W. p-Coumaric acid-loaded nanoliposomes: Optimization, characterization, antimicrobial properties and preservation effects on fresh pod pepper fruit. Food Chem. 2024, 435, 137672. [Google Scholar] [CrossRef] [Scilit] [PubMed]
- Wang, L.; Pan, X.; Jiang, L.; Chu, Y.; Gao, S.; Jiang, X.; Zhang, Y.; Chen, Y.; Luo, S.; Peng, C. The Biological Activity Mechanism of Chlorogenic Acid and Its Applications in Food Industry: A Review. Front. Nutr. 2022, 9, 943911. [Google Scholar] [CrossRef] [Scilit] [PubMed]
- He, Y.; Mao, S.; Zhao, Y.; Yang, J. Research Advances in the Synthesis, Metabolism, and Function of Chlorogenic Acid. Foods 2025, 14, 1914. [Google Scholar] [CrossRef] [Scilit] [PubMed]
- Nguyen, V.; Taine, E.G.; Meng, D.; Cui, T.; Tan, W. Chlorogenic Acid: A Systematic Review on the Biological Functions, Mechanistic Actions, and Therapeutic Potentials. Nutrients 2024, 16, 924. [Google Scholar] [CrossRef] [Scilit] [PubMed]
- Makoś-Chełstowska, P.; Słupek, E.; Fourmentin, S.; Gębicki, J. Supramolecular deep eutectic solvents in extraction processes: A review. Environ. Chem. Lett. 2025, 23, 41–65. [Google Scholar] [CrossRef] [Scilit]
- Martins, R.; Barbosa, A.; Advinha, B.; Sales, H.; Pontes, R.; Nunes, J. Green Extraction Techniques of Bioactive Compounds: A State-of-the-Art Review. Processes 2023, 11, 2255. [Google Scholar] [CrossRef] [Scilit]
- Makris, D.P.; Lalas, S. Glycerol and Glycerol-Based Deep Eutectic Mixtures as Emerging Green Solvents for Polyphenol Extraction: The Evidence So Far. Molecules 2020, 25, 5842. [Google Scholar] [CrossRef] [Scilit] [PubMed]
- Munir, R.; Muneer, A.R.; Muneer, A.; Sultana, B. Glyceline (choline chloride-glycerol) (natural) deep eutectic solvents for bioactive compound extraction. Talanta 2026, 306, 129753. [Google Scholar] [CrossRef] [Scilit] [PubMed]
- Jeliński, T.; Przybyłek, M.; Cysewski, P. Natural Deep Eutectic Solvents as Agents for Improving Solubility, Stability and Delivery of Curcumin. Pharm. Res. 2019, 36, 116. [Google Scholar] [CrossRef] [Scilit] [PubMed]

Disclaimer/Publisher’s Note: The statements, opinions and data contained in all publications are solely those of the individual author(s) and contributor(s) and not of MDPI and/or the editor(s). MDPI and/or the editor(s) disclaim responsibility for any injury to people or property resulting from any ideas, methods, instructions or products referred to in the content. |
© 2026 by the authors. Licensee MDPI, Basel, Switzerland. This article is an open access article distributed under the terms and conditions of the Creative Commons Attribution (CC BY) license.