


Abstract
Almond blanched skins (BS) and blanch water (BW) are underutilized agro-industrial by-products, despite their richness in polyphenols and other bioactive compounds. This study investigates the reuse of BW as an extraction solvent to recover polyphenols from BS, avoiding the need for additional water or organic solvents. BW showed a total polyphenol content (TPC) of 475.2 ± 10.7 µg GAE/mL and a Total Antioxidant Capacity (TAC) of 840.4 ± 41.8 µM TE. Thermal extraction at 115 °C and 1.7 atm for 1 h (1:10 BS/BW w/v) produced an enriched blanch water (EBW) with a TPC of 809.2 ± 12.1 µg GAE/mL and a TAC of 2188.8 ± 3.6 µM TE. Subsequent microfiltration and nanofiltration further concentrated the bioactive fraction, with the nanofiltration retentate exhibiting a 2.8-fold increase in TPC and a 2.1-fold increase in TAC compared to the EBW feed. Spray-drying generated a fine, homogeneous, and storage-stable powder without loss of antioxidant capacity. UHPLC-QqTOF-MS/MS analysis identified catechins and their derivatives, procyanidins, and flavanol glycosides as the main polyphenols contributing to the strong antioxidant capacity of the powder. Overall, this workflow provides a scalable and water-saving strategy to convert almond-processing residues into high-value functional ingredients for food, cosmetic, and pharmaceutical applications.
1. Introduction
Almond trees [Prunus dulcis (Mill.) D.A. Webb] are one of the most economically significant nut trees worldwide, valued for their nutritious kernels and extensive applications in the bakery and confectionery industries [1]. Almond seeds possess good nutritional properties such as high protein content, an abundance of unsaturated fatty acids, essential vitamins (notably tocopherols or vitamins E), dietary fiber, phytosterols, amino acids, particularly arginine, and minerals such as potassium and phosphorus [1]. These attributes consolidate the almond’s role as a staple in the food industry and a potent source of bioactive compounds, offering antioxidant, hypoglycemic, antihypertensive, and lipid- and cholesterol-lowering properties [2,3,4].
Almonds grow in Mediterranean climates, characterized by hot, dry summers and mild, wet winters. The United States is the largest producer, accounting for 77% of global almond production, followed by Australia (11%), Europe (9%), and Turkey (2%) [5]. Almond production for 2025/2026 is projected to rise by nearly 10%, reaching 1.8 million metric tons (shelled basis), driven primarily by higher U.S. yields and smaller gains in the European Union and Australia [5]. This escalation poses a critical challenge for waste and by-product management. Industrial almond processing generates a considerable amount of biomass: hulls account for approximately 50% of the fruit’s weight, followed by shells (25%) and skins (4–8%) [6]. Hulls and shells are commonly repurposed for livestock feed, bioenergy, and bio-composite manufacturing [7], while almond skins represent a high-value byproduct due to their extraordinary concentration of bioactive compounds [8,9]. A significant portion of the almond’s phenolic content—from 50% to 75%—is concentrated within its skin, which contains a diverse array of phytochemicals, including lignans, aldehydes, and various classes of flavonoids [10]. Among these, flavanols and flavonol glycosides are the predominant phenolic families, with catechin, epicatechin, and glycosylated derivatives of isorhamnetin, kaempferol, and naringenin being the most representative compounds [11,12].
The blanching process, typically carried out to remove the skin from the kernel, produces a large volume of aqueous solution (i.e., blanch water, BW), estimated at 5–10 m3/day for every 10 tons of almonds [13]. Due to the water solubility of many phenolics, BW is naturally rich in polyphenols, primarily flavonoids and phenolic acids [14], since the blanching conditions—immersion of whole kernel (with skin) in hot water up to 100 °C—are sufficient to extract most of these compounds [10]. Nevertheless, both almond blanched skins (BS) and BW remain largely untapped bioresources [12]. Their disposal contributes to the organic load of industrial wastewater, representing an environmental burden but also a missed opportunity for recovering naturally occurring antioxidants. In this context, the valorization of almond-processing by-products aligns with circular economy principles, transforming what is typically treated as waste into valuable precursors for functional food or nutraceutical applications. This approach contributes to sustainability goals while potentially generating economic value.
The aim of this work is to employ BW as a solvent to extract residual skins generated during processing, with the overarching goal of valorizing both liquid and solid waste streams through the recovery of polyphenol-rich fractions.
In this study, the obtained lab-scale extracts were subjected to downstream processing, including microfiltration, nanofiltration, and spray drying, to generate a stable concentrated bioproduct. UHPLC-QqTOF-MS/MS analysis was then carried out to characterize the recovered biomolecules and to demonstrate the high added value of the final product. This workflow exemplifies how waste streams from industrial processing can be integrated into circular-economy strategies for the recovery of high-value biomolecules.
2. Materials and Methods
2.1. Samples and Chemicals
Two by-products from the peeling process of Californian almonds (Prunus dulcis, L.), namely blanched skin (BS) and blanch water (BW), were provided by an Italian company. The blanching process is performed by immersion of almond seeds in water at 85–95 °C for 3–4 min. Once blanched, the BS reached a moisture content of 66.0% ± 0.3%, based on triplicate oven-drying measurements at 105 °C. The skins were supplied in sealed plastic packaging, while the BW was provided in 5-L containers. Both were stored at +4 °C and sheltered from light until the analysis to avoid metabolite degradation. All chemicals used in this study were purchased from Sigma-Aldrich (Steinheim, Germany) and used without further purification.
2.2. Extraction Procedure
A thermal extraction was performed using BW as extraction medium and BS as solid feedstock. A total volume of 6000 mL of BW was mixed with 600 g of BS, corresponding to a biomass/solvent ratio of 1:10 (w/v). The extraction was carried out at 115 °C under a pressure of 1.7 atm for 1 h. At the end of the extraction, the liquid phase was separated and collected. The obtained extract, hereafter referred to as Enriched Blanch Water (EBW), was subsequently used as feed for the downstream fractionation processes described in Section 2.4 and Section 2.5.
2.3. Total Polyphenol Content and Total Antioxidant Capacity
Total polyphenol content (TPC) was determined using the Folin–Ciocalteu method, as described by Singleton et al. [15] with slight modifications. Briefly, 0.2 mL of each liquid matrix was mixed with 5 mL of 0.2 N Folin–Ciocalteu reagent (Sigma-Aldrich). After a 5-min incubation in the dark, 1.5 mL of a 60 g/L anhydrous sodium carbonate solution was added to provide the alkaline conditions required for the redox reaction. The mixture was then incubated in the dark for 30 min at room temperature. The absorbance was measured at 725 nm using a Lambda 2 spectrophotometer (Perkin Elmer, Norwalk, CT, USA) against a blank prepared with distilled water. TPC was quantified using a gallic acid calibration curve (10–500 μg/mL; R2 > 0.99). Results were expressed as gallic acid equivalents (GAE) per unit of mass or volume, depending on the sample.
The Total Antioxidant Capacity (TAC) of the extract was determined using the DPPH (2,2-diphenyl-1-picrylhydrazyl) radical scavenging assay, as described by Brand-Williams et al. [16]. Briefly, 100 μL of BW or BS extracts were added to 2.9 mL of a freshly prepared 60 μM solution of 2,2-diphenyl-1-picrylhydrazyl (DPPH) in absolute ethanol. The mixture was incubated in the dark at room temperature for 60 min. The absorbance was then measured at 515 nm using a Lambda 2 spectrophotometer (Perkin Elmer). Results were quantified using a Trolox calibration curve (100–1000 μM) and expressed as mmol of Trolox equivalents (TE) per unit of mass or volume, depending on the sample.
2.4. Membrane Filtration
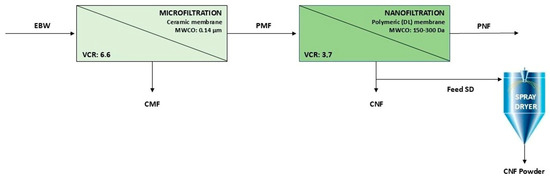
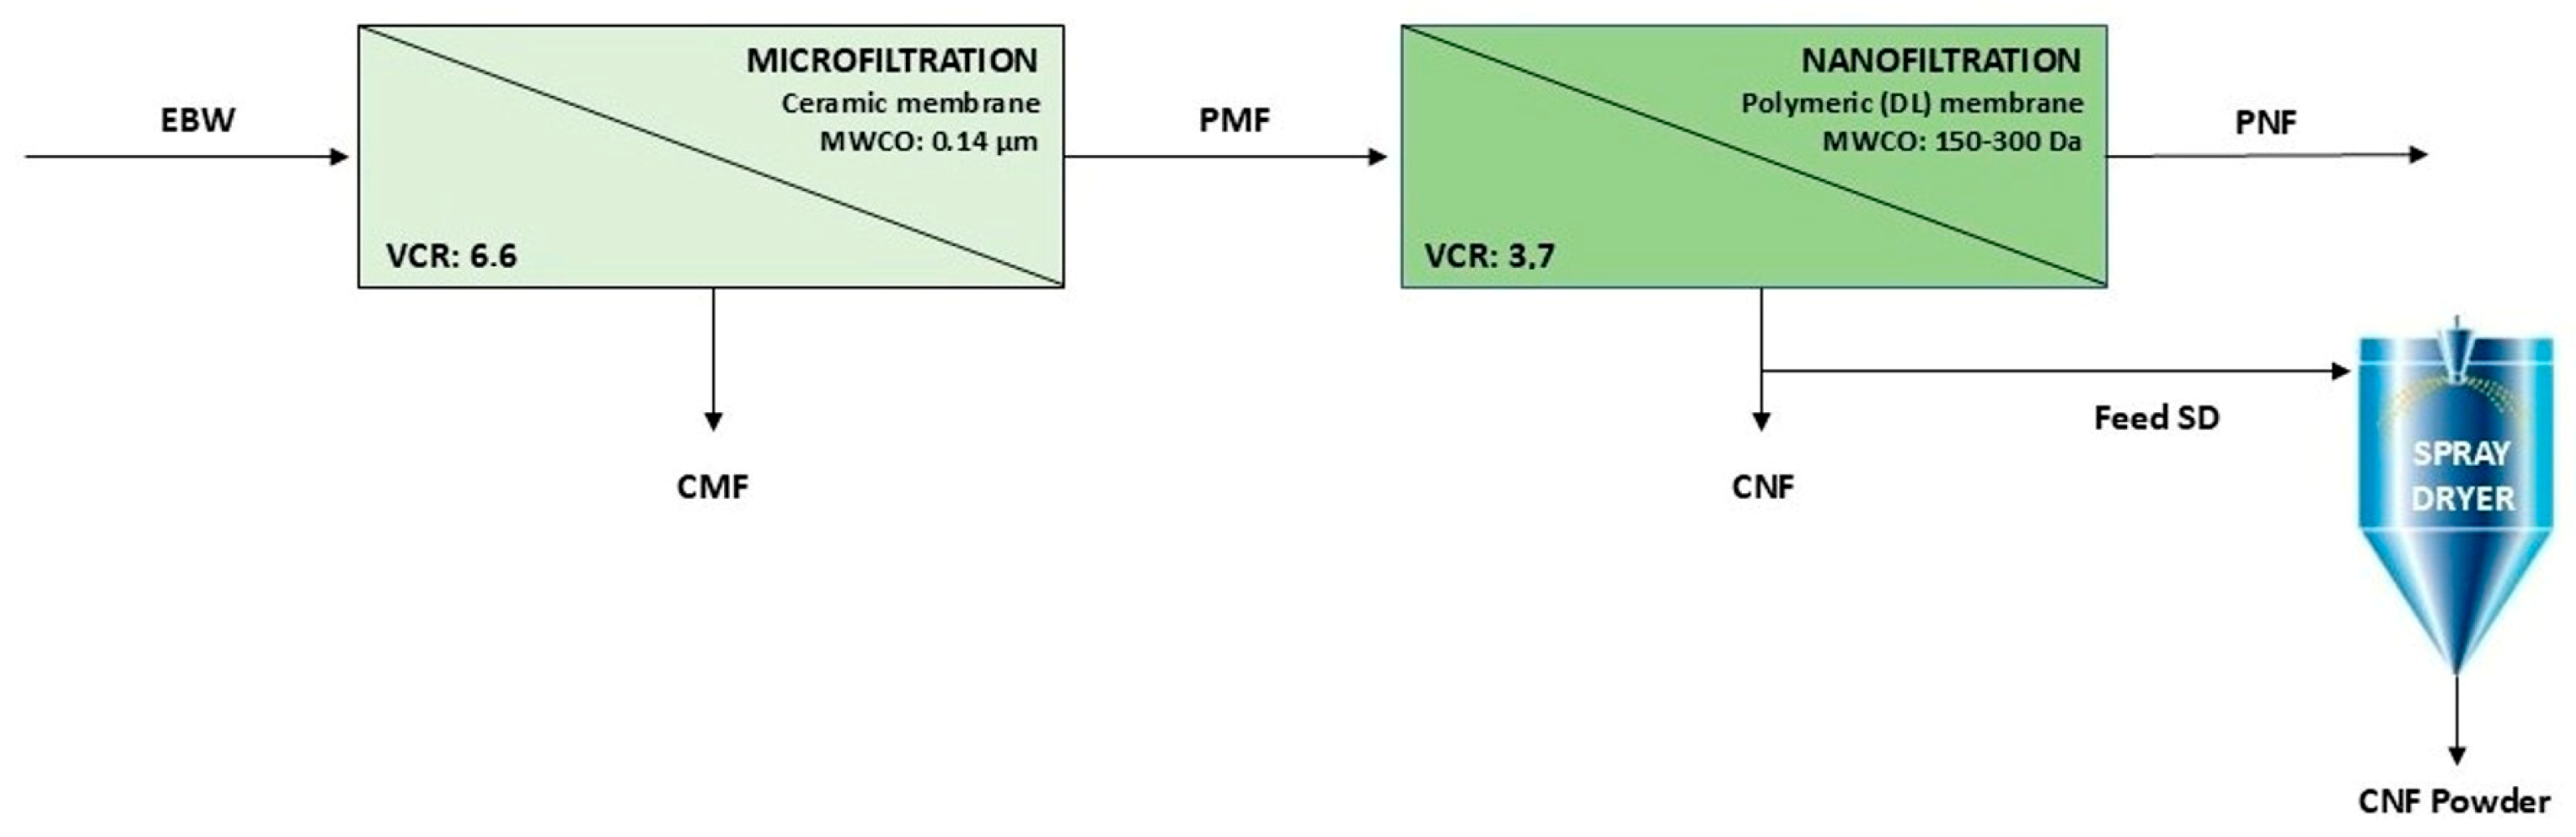
Membrane filtration processes were used to treat EBW in order to extract and concentrate polyphenols. The trial was conducted on a bench-scale tangential flow filtration unit, according to the following layout: a microfiltration (MF) step followed by a nanofiltration (NF) step on the permeate of MF (PMF). The concentrate of NF (CNF) was subsequently sent to a spray dryer to obtain a stabilized solid product (CNF powder) (Figure 1).
Figure 1.
Process layout including two filtration steps (MF, microfiltration and NF, nanofiltration) and a spray-drying stage (EBW, Enriched blanch water; CMF: concentrate of MF; PMF, permeate of MF; CNF: concentrate of NF; PNF, permeate of NF; Feed SD: feed of spray-dryer; MWCO: Molecular Weight Cut-Off; VCR: volume concentration ratio).
MF was performed using an in-house assembled filtration unit equipped with a peristaltic pump (Masterflex XX80EL230, Millipore, Burlington, MA, USA), which fed a ceramic membrane module (alumina–zirconia; “sunflower” configuration) with 23 channels (length: 50 mm), a nominal pore size of 0.14 µm, and an effective surface area of 0.10 m2 (TAMI Industries, Nyons, France). During MF, the feed stream was split into two fractions: the permeate (PMF), which was used as the feed for the subsequent nanofiltration step, and the concentrate (CMF), which was recirculated to the feed tank. The temperature and pH of the CMF were monitored using a portable temperature probe (Hanna, HI93510) and a pH meter (Orion Star A211, Thermo Scientific, Waltham, MA, USA), respectively. Throughout the MF run, the permeate (PMF) was collected progressively and stored at 4 °C to minimize degradation at room temperature.
NF was carried out using a Sepacell separation device. The filtration loop was driven by a volumetric piston pump (Model T3A 100 LA4, Smem, Monza e Brianza, Italy) with a maximum flow rate of 400 L h−1. The separation chamber housed a flat-sheet polyamide membrane with an active surface area of 0.0266 m2 and a molecular weight cut-off (MWCO) of 150–300 Da. A thermostatic bath (Haake G) was used to limit temperature increases during filtration. At the end of the NF process, the nanofiltration concentrate (CNF) and permeate (PNF) were collected. The CNF was stored at 4 °C, and an 800 mL aliquot was subsequently processed by spray-drying. Estimated transmembrane pressure (TMP_est) was calculated from the inlet pressure (P_in) assuming a negligible pressure drop along the module (ΔP ≤ 0.1 bar) and a permeate-side pressure of approximately 0.1 bar, according to: TMP_est ≈ P_in − (ΔP/2) − P_perm.
2.5. Spray Drying
CNF powder was produced by spray-drying using a laboratory-scale unit (Model DF/500/B, I.C.F. Industrie Cibec S.p.A., Maranello, Modena, Italy). The spray dryer had an evaporation capacity of 500 mL h−1 and was equipped with an AISI 304 stainless-steel drying chamber (internal diameter: 180 mm). The apparatus included a digital peristaltic pump to feed the suspension, a two-fluid nozzle (type L = 300 E3P-B2-P11), and an electric air heater (Model 3000 8D1, Leister AG, Kägiswil, Switzerland). The inlet air temperature was set to 120 °C, and the CNF feed flow rate was 3.0 mL min−1. Compressed air pressure for atomization was set to 2 bar. During spray-drying, the CNF suspension was continuously stirred at 300 rpm using a magnetic stirrer to ensure homogeneity of the feed and, consequently, of the resulting powder. At the end of the process, the powder was recovered from the cyclone separator and stored at 4 °C until analysis.
2.6. Total Dissolved Solids, Electrical Conductivity, pH and Total Solid Content
All liquid matrices were characterized by total dissolved solids (TDS), electrical conductivity (EC) and pH. TDS, expressed in ppm, and EC, expressed in µS cm−1, and pH were measured in triplicate using dedicated probes (VINKK, model PH-02) on 50 mL aliquots under continuous magnetic stirring at 500 rpm to ensure homogeneous conditions and stable probe readings.
The total solid content of the CNF matrix was determined using a thermobalance Sartorius MA 160 (Sartorius, Göttingen, Germany). This analysis was performed to quantify the residual solids and to enable accurate reconstruction of the original matrix composition from the spray-dried CNF powder.
2.7. Ultra-High-Performance Liquid Chromatography—Mass Spectrometry
The spray-dried CNF powder was reconstituted with ultrapure water to reproduce the original total solid content of the liquid CNF (2% w/v) by dissolving 1 g of powder in 49 mL of water. The mixture was vortexed and subsequently sonicated using an ultrasonic bath (Branson UltrasonicsTM BransonicTM M3800-E, Danbury, CT, USA) to ensure complete dispersion. The resulting solution was filtered through a 0.22 µm membrane filter to remove particulate matter and obtain a clear extract suitable for chromatographic analysis. The filtrate was then subjected to UHPLC-HRMS/MS analysis for untargeted phytochemical profiling. Analyses were carried out on a UHPLC NEXERA system (Shimadzu, Kyoto, Japan) equipped with a Luna® Omega C18 column (50 × 2.1 mm i.d., 1.6 µm particle size). The mobile phase consisted of water with 0.1% formic acid (solvent A) and acetonitrile with 0.1% formic acid (solvent B), under a linear gradient elution program as follows: 0–1 min, 2% B; 1–2 min, 2–10% B; 2–7 min, 10% B; 7–8 min, 10–15% B; 8–11 min, 15% B; 11–13 min, 15–95% B, followed by 1 min of isocratic elution and re-equilibration to initial conditions until 15 min. The flow rate was set to 0.5 mL/min, and the injection volume was 2 μL.
Mass spectrometric detection was performed using a hybrid quadrupole time-of-flight (TOF) mass spectrometer, operated in both positive and negative electrospray ionization (ESI) modes. TOF-MS data were acquired in full-scan mode over the mass range m/z 150–1200 (250 ms), with data-dependent MS/MS acquisition (IDA) in the range m/z 100–1100 (100 ms), using a collision energy of 40 ± 10 V. ESI source parameters were set as follows: interface heater at 600 °C, curtain gas 35 psi, nebulizer gas (GS1) and auxiliary gas (GS2) at 60 psi, and spray voltage of ±4500/5500 V. Automated mass calibration was applied before each analysis. Quantification was performed using a relative approach, consistent with the untargeted UHPLC-HRMS/MS workflow adopted in this study. Compound abundances were estimated based on peak areas in the total ion chromatogram (TIC). Relative abundances were calculated by normalizing individual peak areas to the total chromatographic area and were used exclusively for comparative profiling of compound classes and structural subclasses within the same sample [17]. Data acquisition and instrument control were performed using Analyst® TF 1.7, while chromatographic and spectral data processing were conducted with PeakView® 2.2.
2.8. Statistical Analyses
All measurements were performed in triplicate across three independent batches. Results are expressed as mean ± standard deviation. Statistical comparisons between TPC and TAC of different experimental groups were assessed using an unpaired Student’s t-test. In particular, comparisons between the nanofiltration concentrate (CNF) and the reconstituted CNF powder, derived from the same batch, were performed using a paired Student’s t-test. Statistical significance was defined as p < 0.05. All analyses were performed using GraphPad Prism version 8 (GraphPad Software, San Diego, CA, USA).
3. Results and Discussion
3.1. Polyphenols and Antioxidant Activities in Blanch Water (BW) and Enriched Blanch Water (EBW)
BW exhibited a substantial load of phenolic compounds, with a TPC of 475.2 ± 10.7 µg GAE/mL and a TAC of 840.4 ± 41.8 µM TE (Table 1), values falling within the broad range previously reported for similar matrices. Milbury et al. [18] described phenolic contents between 50.3 and 153.9 mg GAE per 100 g of fresh almonds, while Mandalari et al. [19] reported approximately 90 mg GAE/g dry extract in BW. Although BW characteristics depend on processing conditions, almond genotype, production year, and environmental and storage factors [20], the high TPC measured here supports the notion that blanching promotes the release of phenolics naturally concentrated in almond skins.
Table 1.
Summary of physicochemical parameters, total polyphenol content (TPC), total antioxidant capacity (TAC) total dissolved solids (TDS), and conductivity for all process fractions: blanch water (BW), enriched blanch water (EBW), microfiltration concentrate (CMF) and permeate (PMF), nanofiltration concentrate (CNF) and permeate (PNF), and reconstituted CNF powder.
Recent UHPLC-MS studies have further clarified the phenolic profile of BW, indicating a predominance of procyanidins, catechin, epicatechin, and isorhamnetin-3-O-rutinoside [21]. These findings are consistent with the known chemical composition of almond skins, which typically retain 50–75% of the total phenolic content of the fruit [12,20]. Given that blanching involves prolonged contact between hot water and intact skins, a significant fraction of these compounds becomes solubilized in BW, accounting for its marked antioxidant activity.
To further enhance the recovery of residual phenolics retained in the skins and improve the valorization of both liquid and solid by-products, BW was used as solvent in a high-temperature, pressurized extraction step. Thermal treatment at 115 °C for 1 h using a BS/BW ratio of 1:10 (w/v) produced an Enriched Blanch Water (EBW), characterized by markedly increased TPC (809.2 ± 12.1 µg GAE/mL) and TAC (1843.3 ± 123.5 µM TE), as shown in Table 1. This corresponds to an enrichment of ~70% in TPC and more than a two-fold increase in TAC compared with untreated BW.
Thermal enhancement of phenolic extraction is well documented in the literature, although optimal conditions are widely recognized to be feedstock-dependent. Antony and Farid [22] demonstrated that phenolic yields generally increase at temperatures above 100 °C under pressurized aqueous conditions, providing a conceptual framework rather than feedstock-specific optimal parameters. Guided by these trends, preliminary extraction trials were conducted on blanched almond skins using BW as extraction medium to investigate the combined effect of temperature and pressure. These preliminary tests enabled the selection of process-relevant conditions that enhance phenolic release while preserving antioxidant activity and operational feasibility. Mechanistically, high-temperature treatments promote the disruption of structural polymers and facilitate the release of phenolic acids, flavonoids, and oligomeric proanthocyanidins otherwise tightly bound within the skin matrix [23]. The results obtained here are consistent with this mechanism, as evidenced by the substantial increase in TPC, TAC, TDS, and EC observed in EBW, indicating the concurrent extraction of phenolic and other water-soluble components.
Overall, the chemical enhancement achieved through thermal extraction confirms that BW can act not only as a waste stream containing solubilized polyphenols, but also as an effective solvent for further recovering phenolic compounds retained in blanched skins. The marked increase in both TPC and TAC underscores the potential of this combined approach for generating enriched antioxidant fractions suitable for subsequent membrane processing and downstream valorization.
3.2. Filtration Trials
MF and NF trials were conducted on EBW total volume to fractionate it and obtain a TPC-enriched fraction. The trends of main process parameters are discussed in the following sections.
3.2.1. Microfiltration (MF)
The microfiltration run lasted a total of 565 min, during which 5000 mL of EBW were processed. At the end of the trial, 4250 mL of PMF and 750 mL of concentrate CMF were obtained, corresponding to a final volume concentration ratio (VCR) of 6.6.
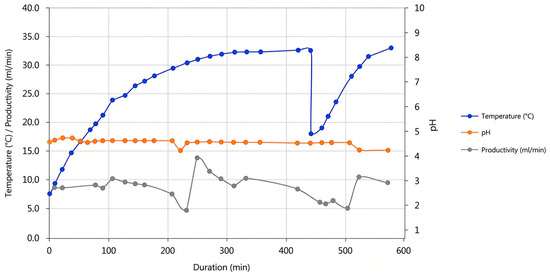
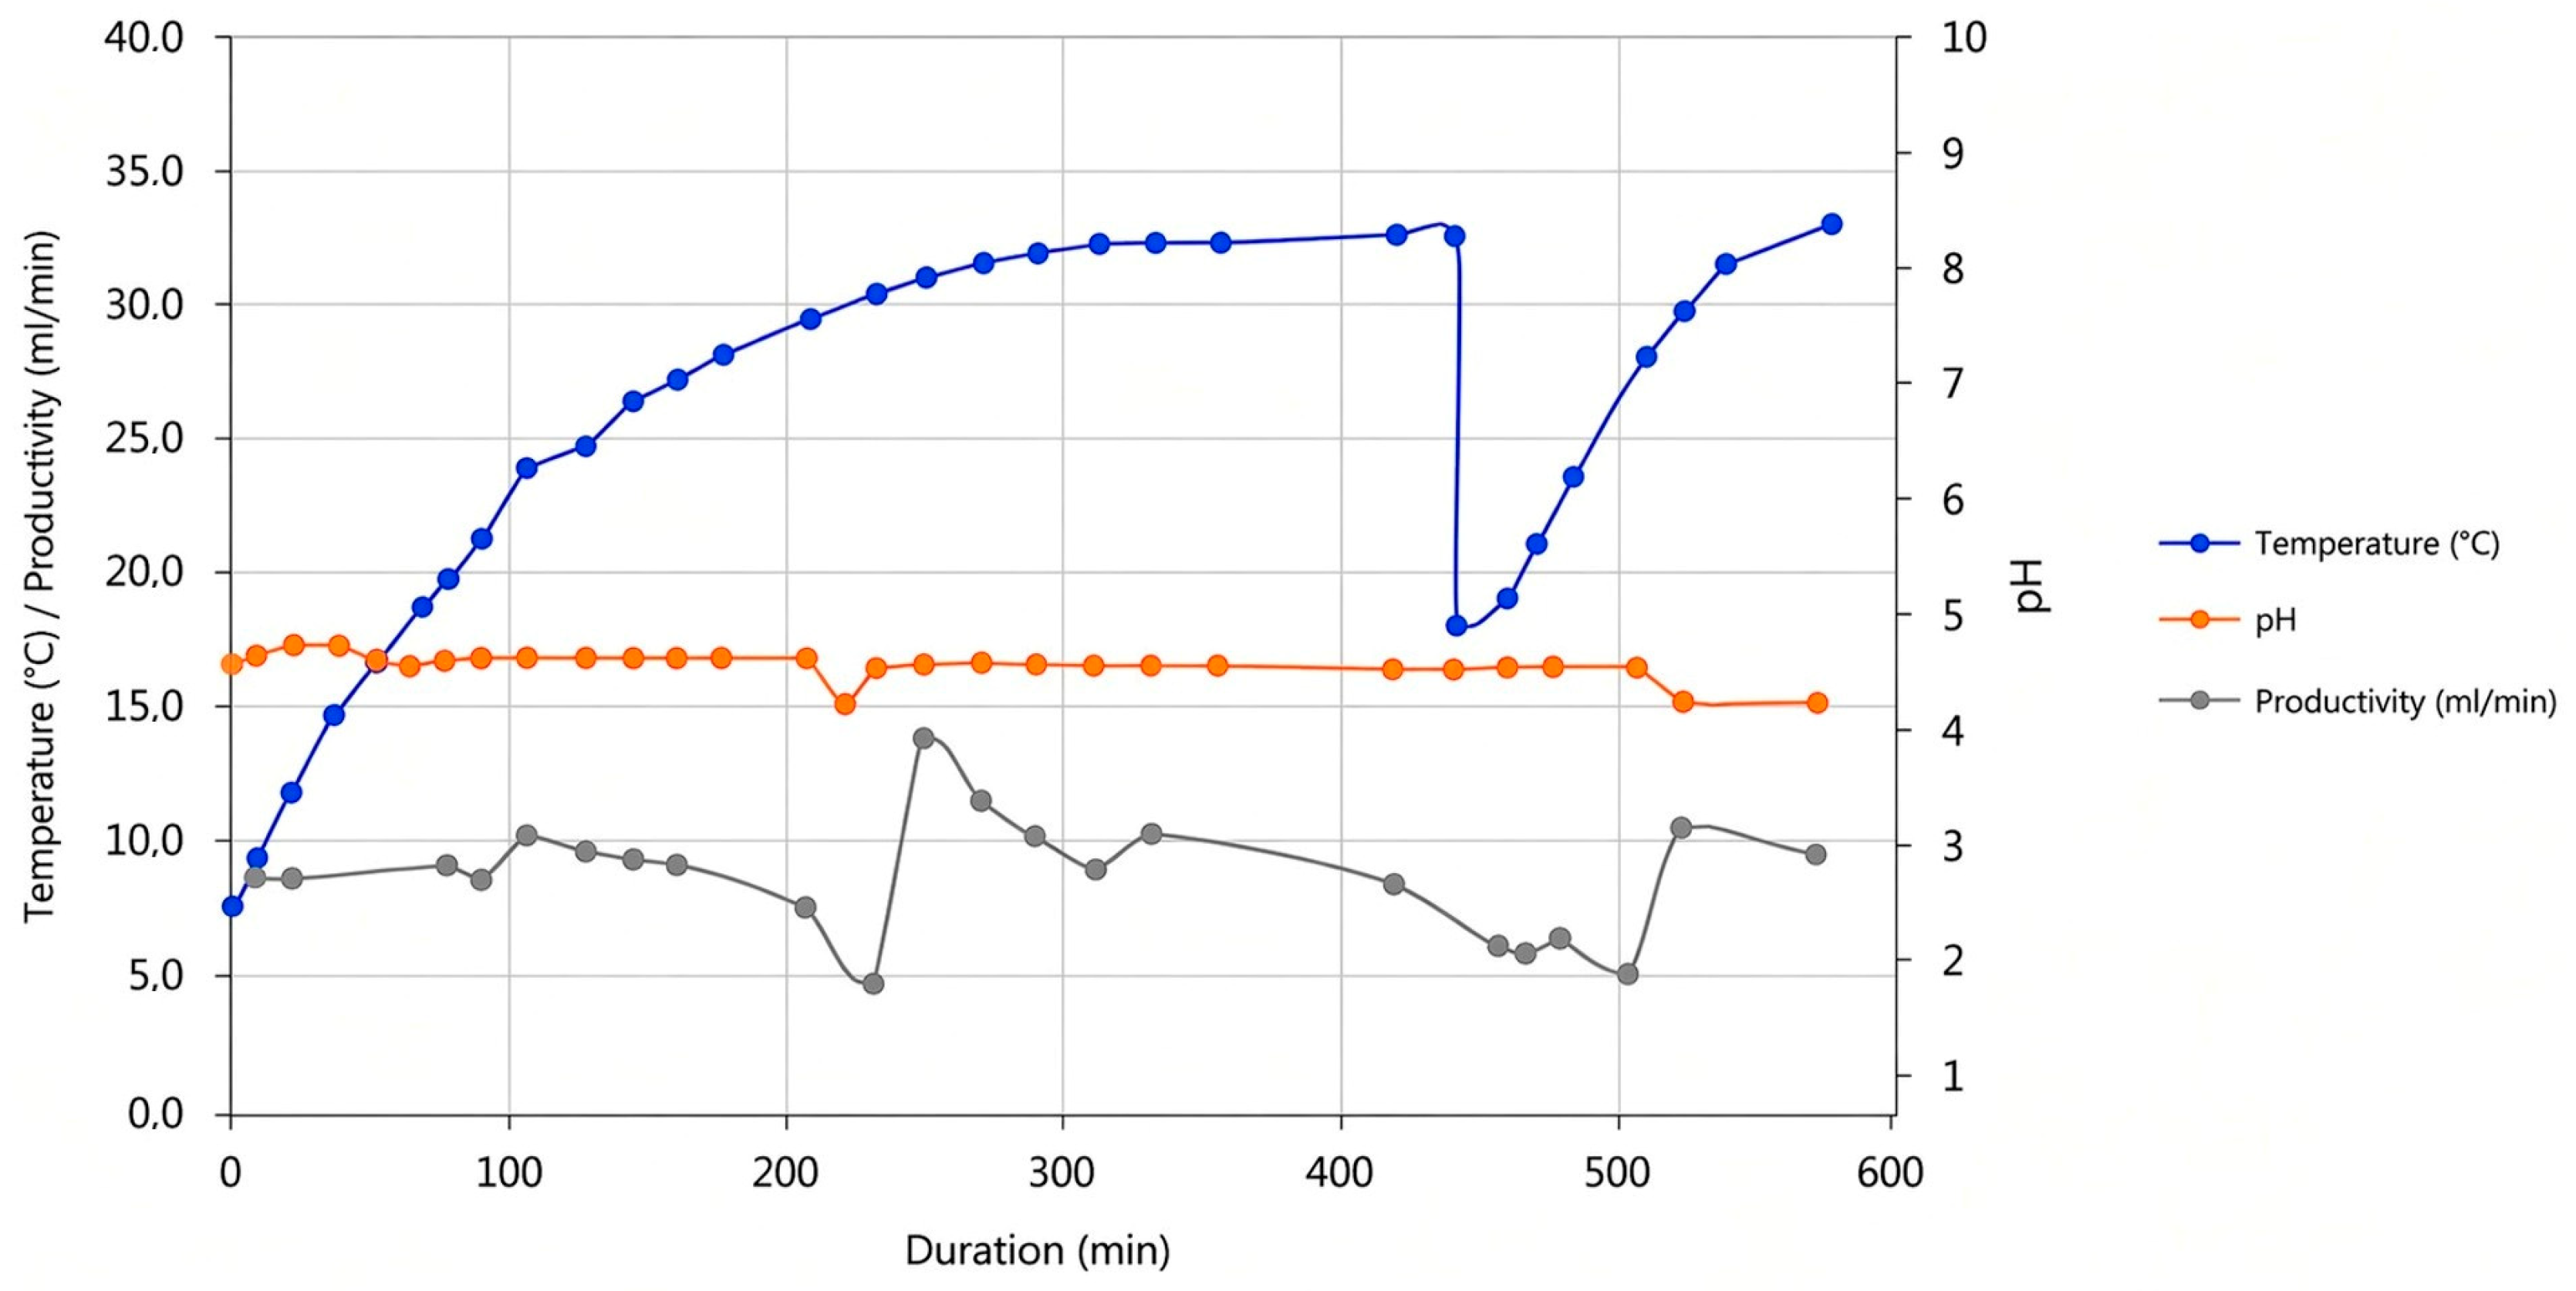
The temporal evolution of CMF temperature and pH is reported in Figure 2, together with the permeate flow rate (mL min−1). Two increases in permeate flow rate were observed at approximately 240 min and 500 min, corresponding to a feed addition and a rise in temperature, respectively. The maximum temperature reached during the run was 34 °C, which did not appear to compromise the molecular integrity of polyphenolic compounds. In this study, MF was primarily intended to remove suspended solids while enhancing the transfer of polyphenols into the permeate; therefore, the moderate temperature increase likely promoted solute transport across the membrane. The pH remained nearly constant throughout the process, indicating that the operating conditions did not induce acidification of the CMF.
Figure 2.
Microfiltration parameters: temperature, pH, and flow rate.
3.2.2. Nanofiltration
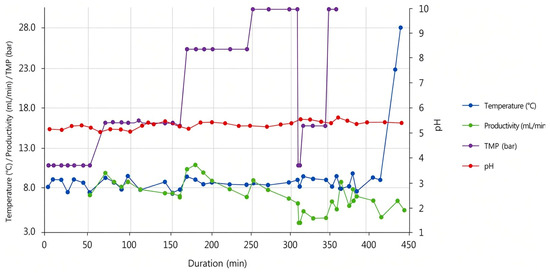
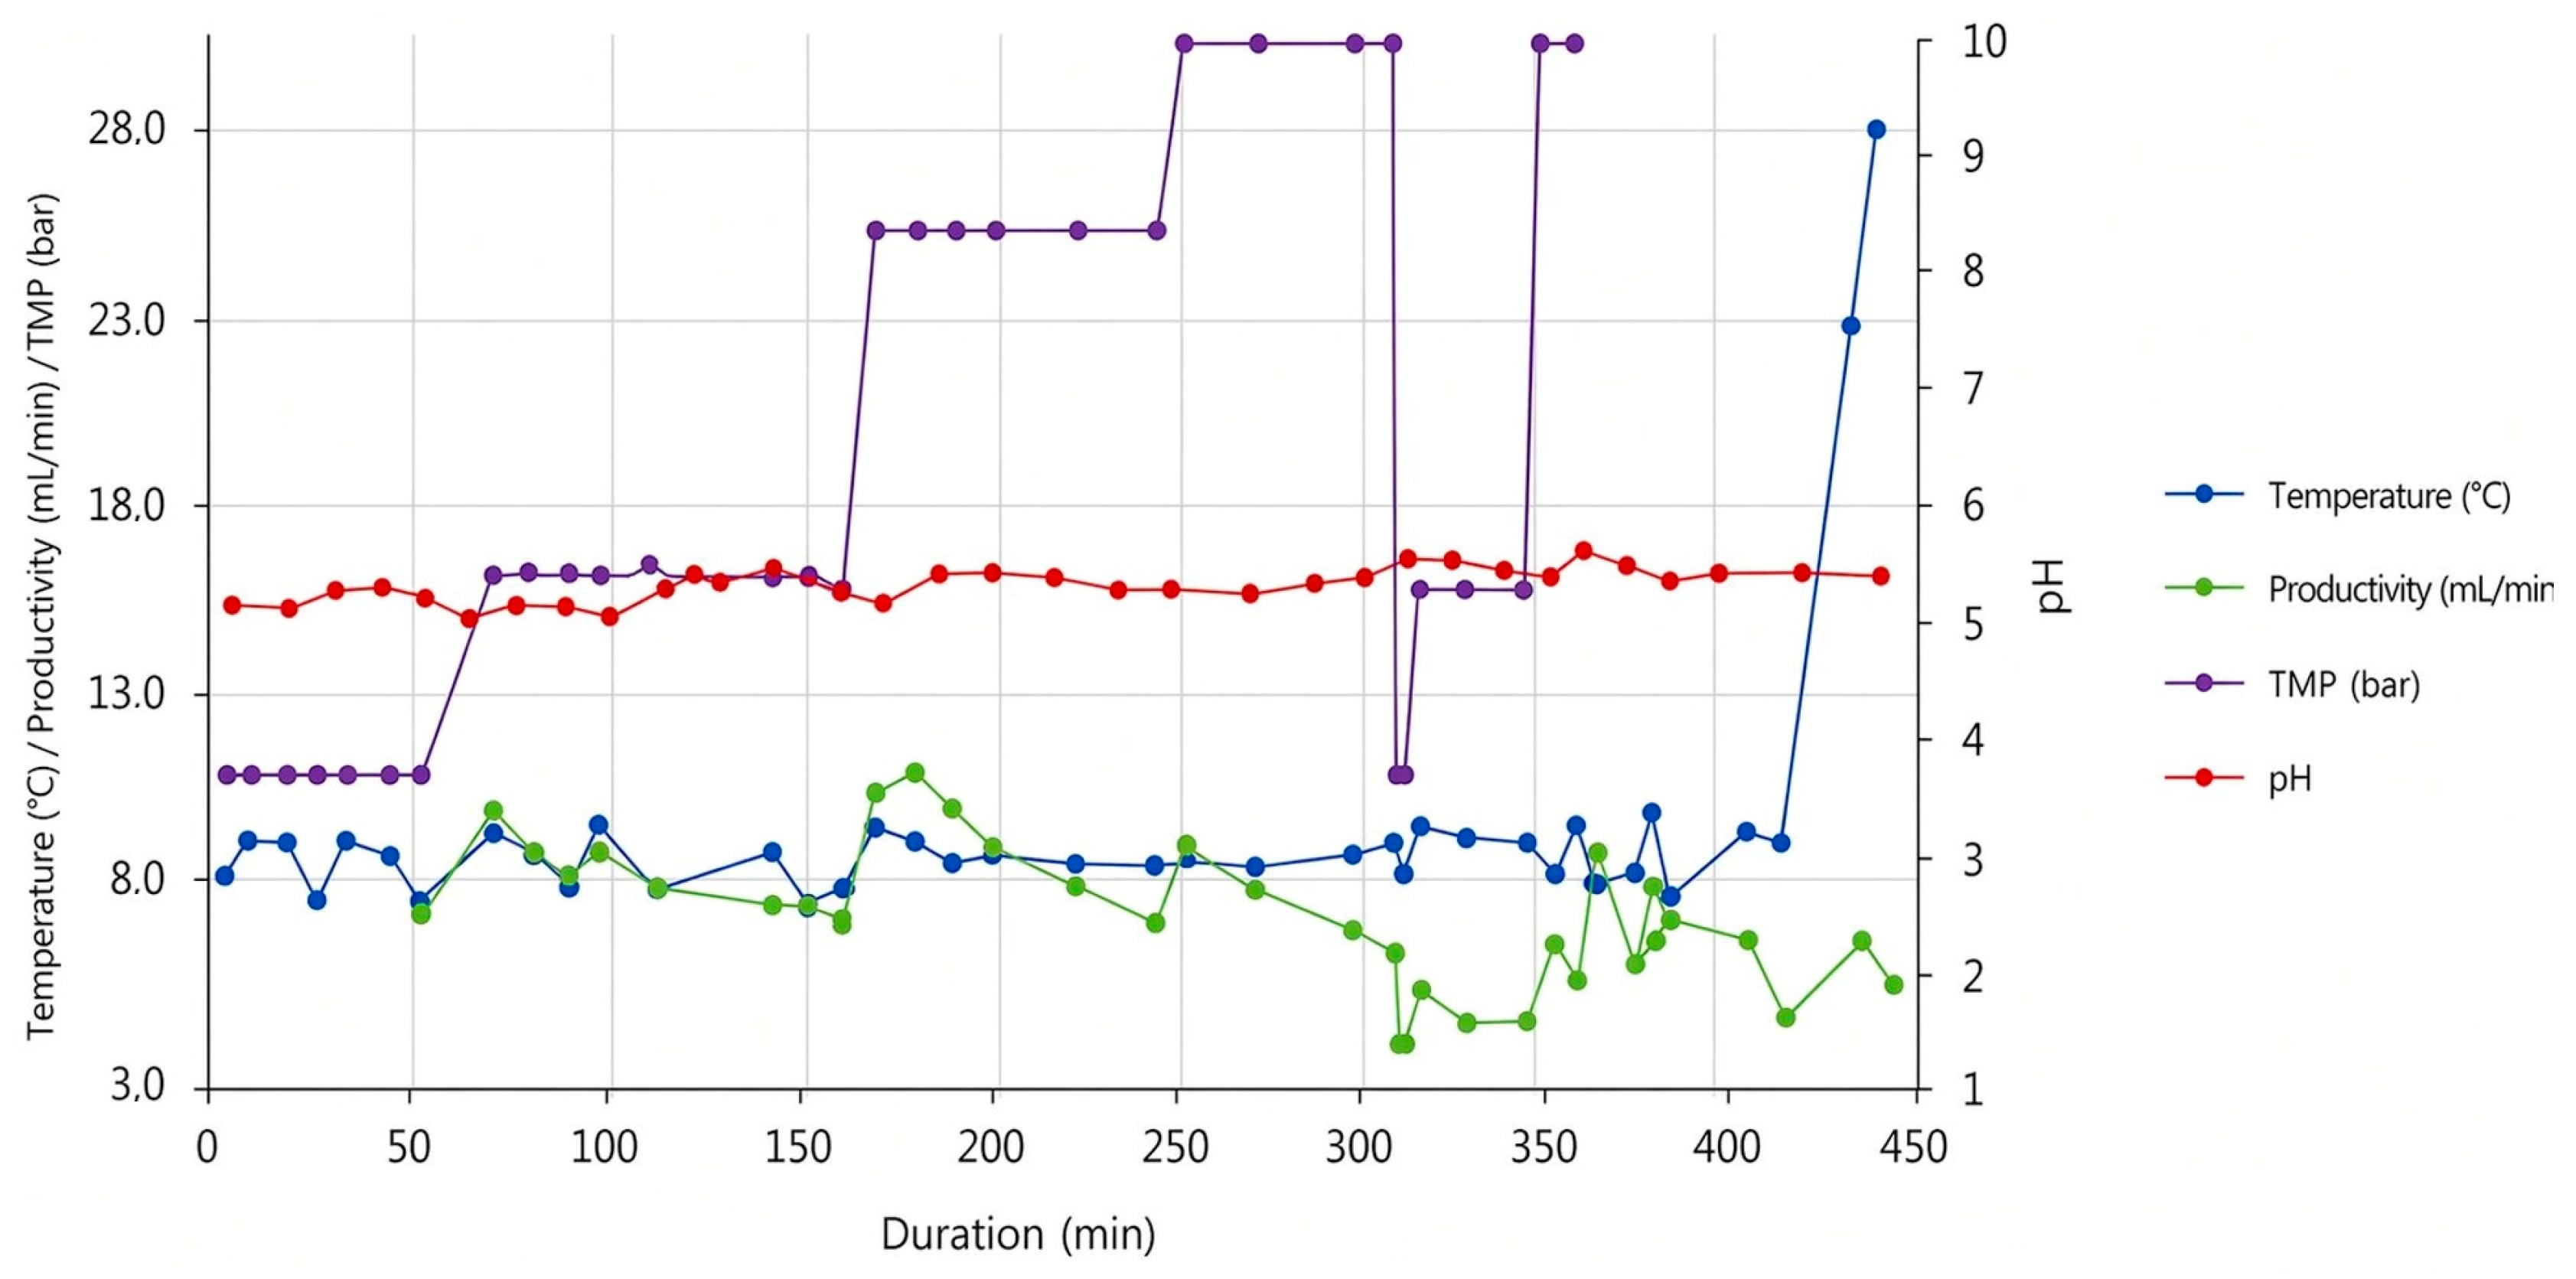
NF process was performed using 4120 mL of PMF and lasted 448 min. At the end of the run, 3050 mL of permeate and 1070 mL of concentrate were recovered, corresponding to a VCR of approximately 3.8. Figure 3 shows the time profiles of permeate flow rate (mL min−1) and key operating parameters, including temperature, estimated TMP_est, and concentrate pH. TMP_est was progressively increased from 10.5 to 28 bar over the course of the filtration, with an average permeate flow rate of approximately 7.5 mL min−1. Temperature was maintained at ~8 °C using a thermostatic bath.
Figure 3.
Nanofiltration parameters trends: temperature, pH, flow rate, and transmembrane pressure (TMP).
At the end of the membrane separation process, 800 mL of CNF was obtained with a total solid content of 2% w/v (16 g total).
3.3. Spray-Drying Process
An 800 mL aliquot of CNF was spray-dried to stabilize the nanofiltration concentrate and to assess the suitability of the drying step in preserving powder quality relative to the starting solution. The overall spray-drying run lasted 250 min. The feed flow rate to the spray dryer was 3.2 mL min−1. The drying-chamber temperature was set to 120 ± 2 °C, while the outlet air temperature—determined by the operating conditions—was 71 ± 3 °C.
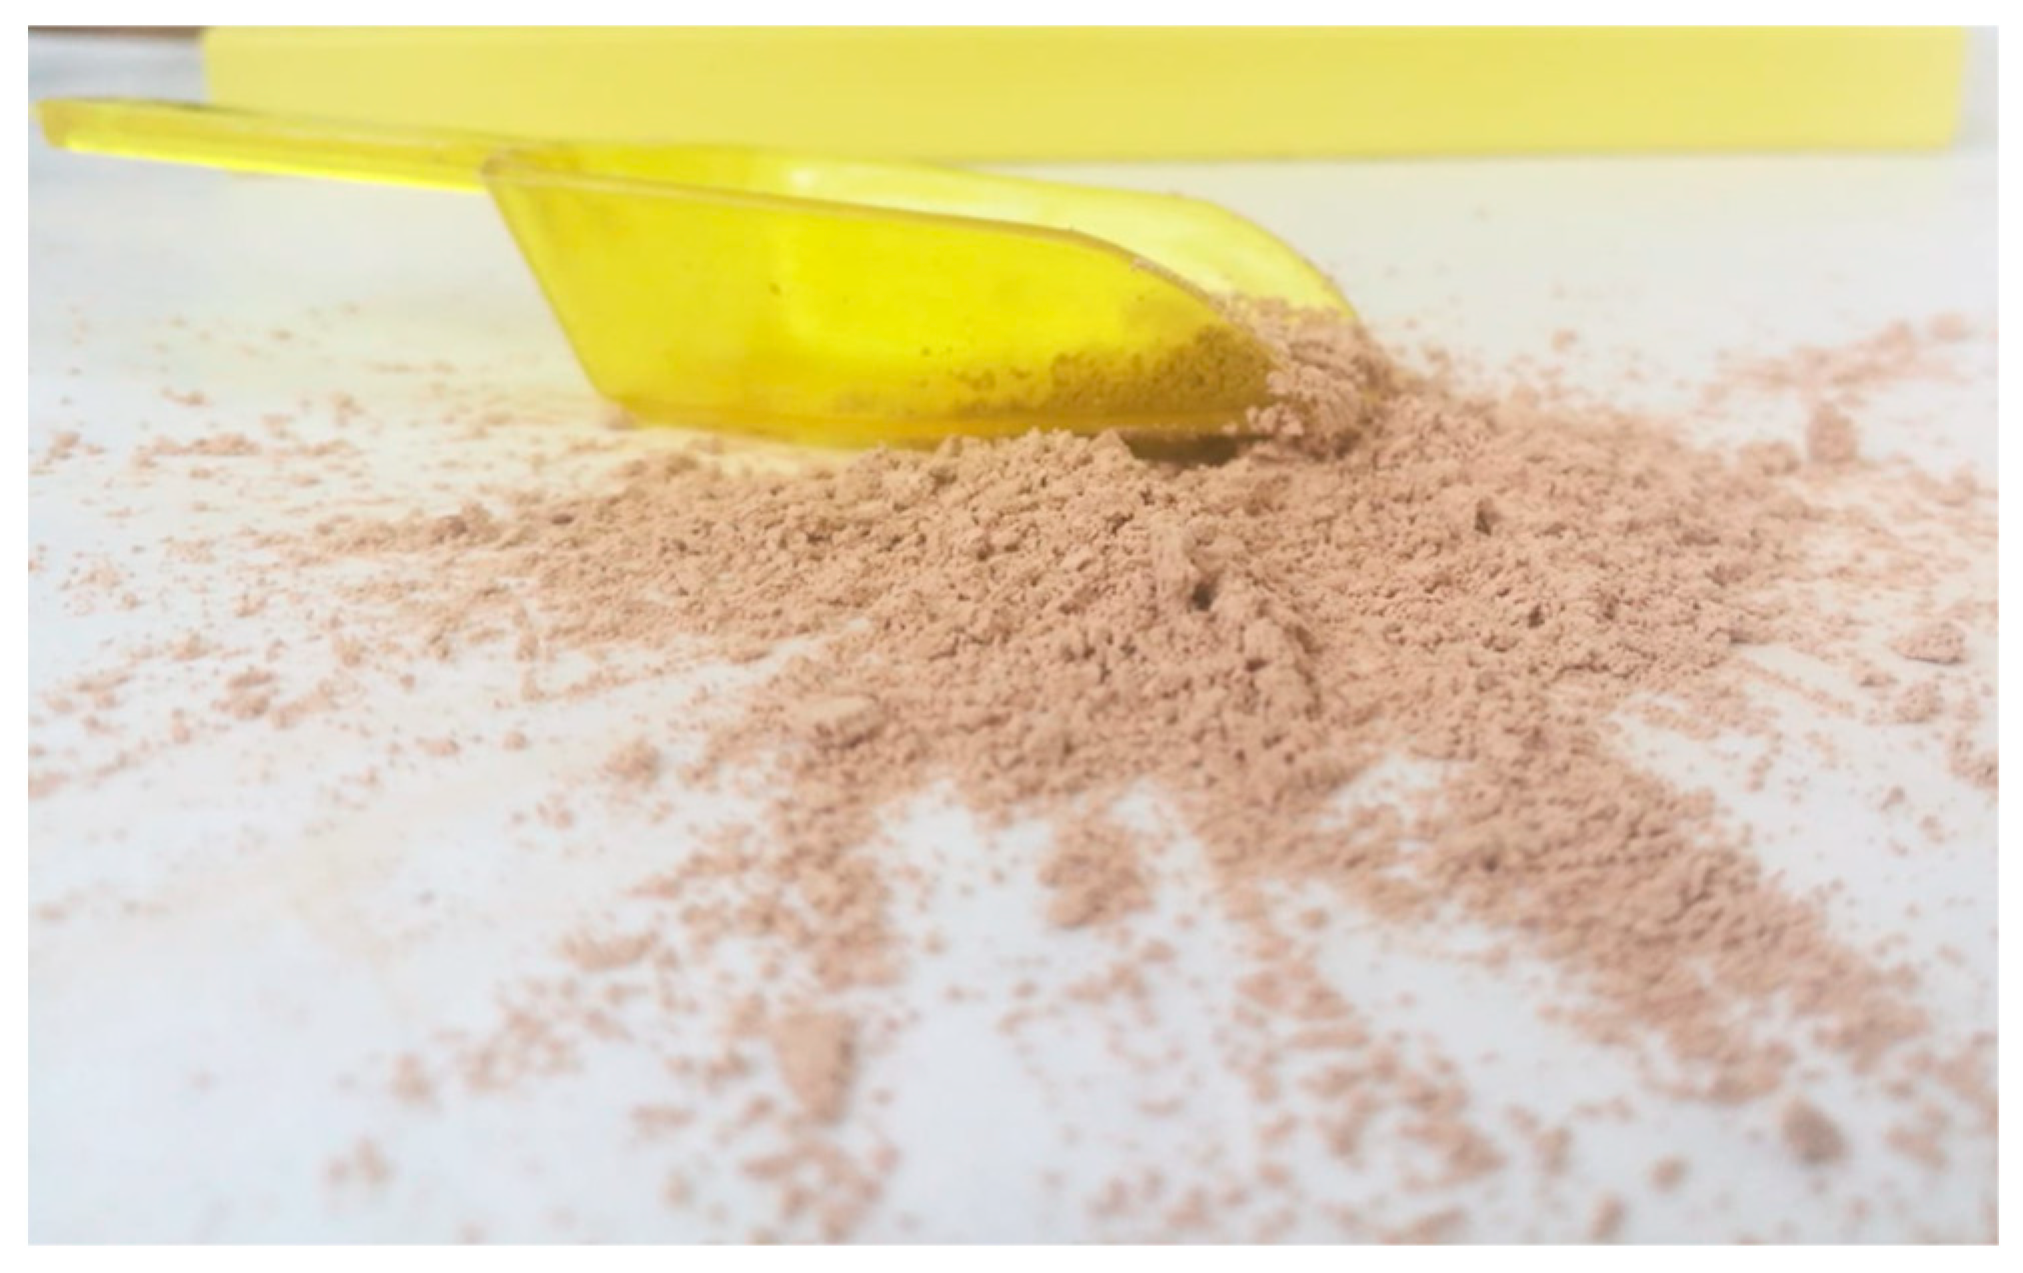
At the end of the process, approximately 8 g of spray-dried powder was collected (Figure 4), compared with the ~16 g theoretically expected based on the processed volume (800 mL) and the total solid content (2%, w/v), corresponding to an overall recovery of about 50%. This value should be considered indicative, as it reflects process recovery rather than product quality; moreover, yield optimization and industrial-scale production estimates are beyond the scope of the present work.
Figure 4.
CNF spray-dried powder.
3.4. Comparative Analysis for Overall Process Performance Assessment
Table 1 provides a consolidated overview of all process fractions generated throughout the extraction, filtration, and drying workflow (BW, EBW, CMF, PMF, PNF, CNF, and CNF powder). The table enables direct comparison of their polyphenolic content, antioxidant capacity, pH, conductivity, and total dissolved solids, offering an integrated perspective on the evolution of chemical and physicochemical features across the entire process. This comprehensive dataset allows evaluation of the efficiency of each operation—thermal extraction, microfiltration, nanofiltration, and spray-drying—and illustrates the progressive enrichment and stabilization of bioactive compounds.
The pH remained relatively stable during the filtration sequence, with values ranging from 4.4 to 4.6 in BW, EBW, CMF, PMF, and PNF. A higher pH value (≈5.4) was already observed at the inlet of the nanofiltration step and was maintained in both the nanofiltration concentrate (CNF) and the reconstituted CNF powder. This variation is therefore attributed to changes occurring during storage of the MF permeate at 4 °C prior to nanofiltration, likely related to physicochemical re-equilibration phenomena (e.g., partial CO2 degassing), rather than to the membrane separation processes themselves.
The MF step was primarily intended to remove suspended solids. The selected membrane pore size (0.14 µm) was expected to allow most dissolved phenolic compounds to pass into the permeate stream, and the analytical data support this interpretation. In PMF, TPC decreased only slightly relative to EBW, from 809.2 to 768.3 µg GAE/mL, while TAC decreased from 1843.3 to 1486.1 µM TE. At the same time, TDS and conductivity increased to 1946.7 ppm and 3866.0 µS/cm, respectively.
In contrast, the MF concentrate (CMF) showed substantially lower TPC and TAC values, namely 496.8 µg GAE/mL and 851.1 µM TE, respectively. However, TDS and conductivity remained high (1924.3 ppm and 3882.0 µS/cm), indicating that the retained fraction was enriched mainly in non-phenolic material and suspended matter. Taken together, the MF results indicate that microfiltration acted mainly as a clarification step, whereas most of the target phenolic compounds remained in the permeate stream.
NF was performed to concentrate phenolic compounds in the retentate. This objective was achieved effectively: in CNF, TPC reached 2269.1 µg GAE/mL and TAC reached 3660.0 µM TE. Relative to EBW, these values correspond to approximately 2.8-fold and 2.0-fold increases, respectively. TDS and conductivity also increased markedly, to 4055.0 ppm and 8410.0 µS/cm, corresponding to approximately 2.6-fold increases relative to EBW. Conversely, PNF showed a strong depletion of all monitored parameters, with TPC, TAC, TDS, and conductivity decreasing to 38.0 µg GAE/mL, 85.0 µM TE, 230.7 ppm, and 461.7 µS/cm, respectively. The calculated NF rejection with respect to TPC was approximately 95%, confirming the high selectivity of this step for phenolic enrichment.
The reconstituted CNF powder showed values very similar to those measured in liquid CNF. In particular, TPC and TAC were 2067.3 µg GAE/mL and 3696.1 µM TE, respectively. These data indicate substantial preservation of antioxidant functionality after spray drying, with TPC retention of about 91% and no appreciable loss in measured TAC. Therefore, under the conditions adopted here, the thermal stress associated with spray drying did not appear to significantly compromise the phenolic fraction concentrated by NF.
The overall process performance can also be described in terms of TPC rejection (RTPC) and volumetric concentration ratio (VCR). RTPC was calculated using the equation
where Cp and Cf are the TPC concentrations in the permeate and in the feed, respectively.
RTPC = 1 − Cp/Cf
MF showed a very low rejection (approximately 5%) confirming that this step did not significantly retain phenolic compounds, whereas NF showed a rejection of about 95%. These values are consistent with those reported for similar systems, where NF membranes exhibit high rejection coefficients for polyphenols due to their molecular weight and polarity. For instance, Sánchez-Arévalo et al. (2023) [24] reported polyphenol retentions of about 85% during NF treatment of olive pomace extracts.
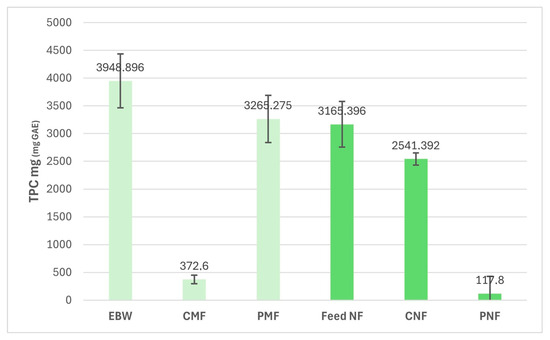
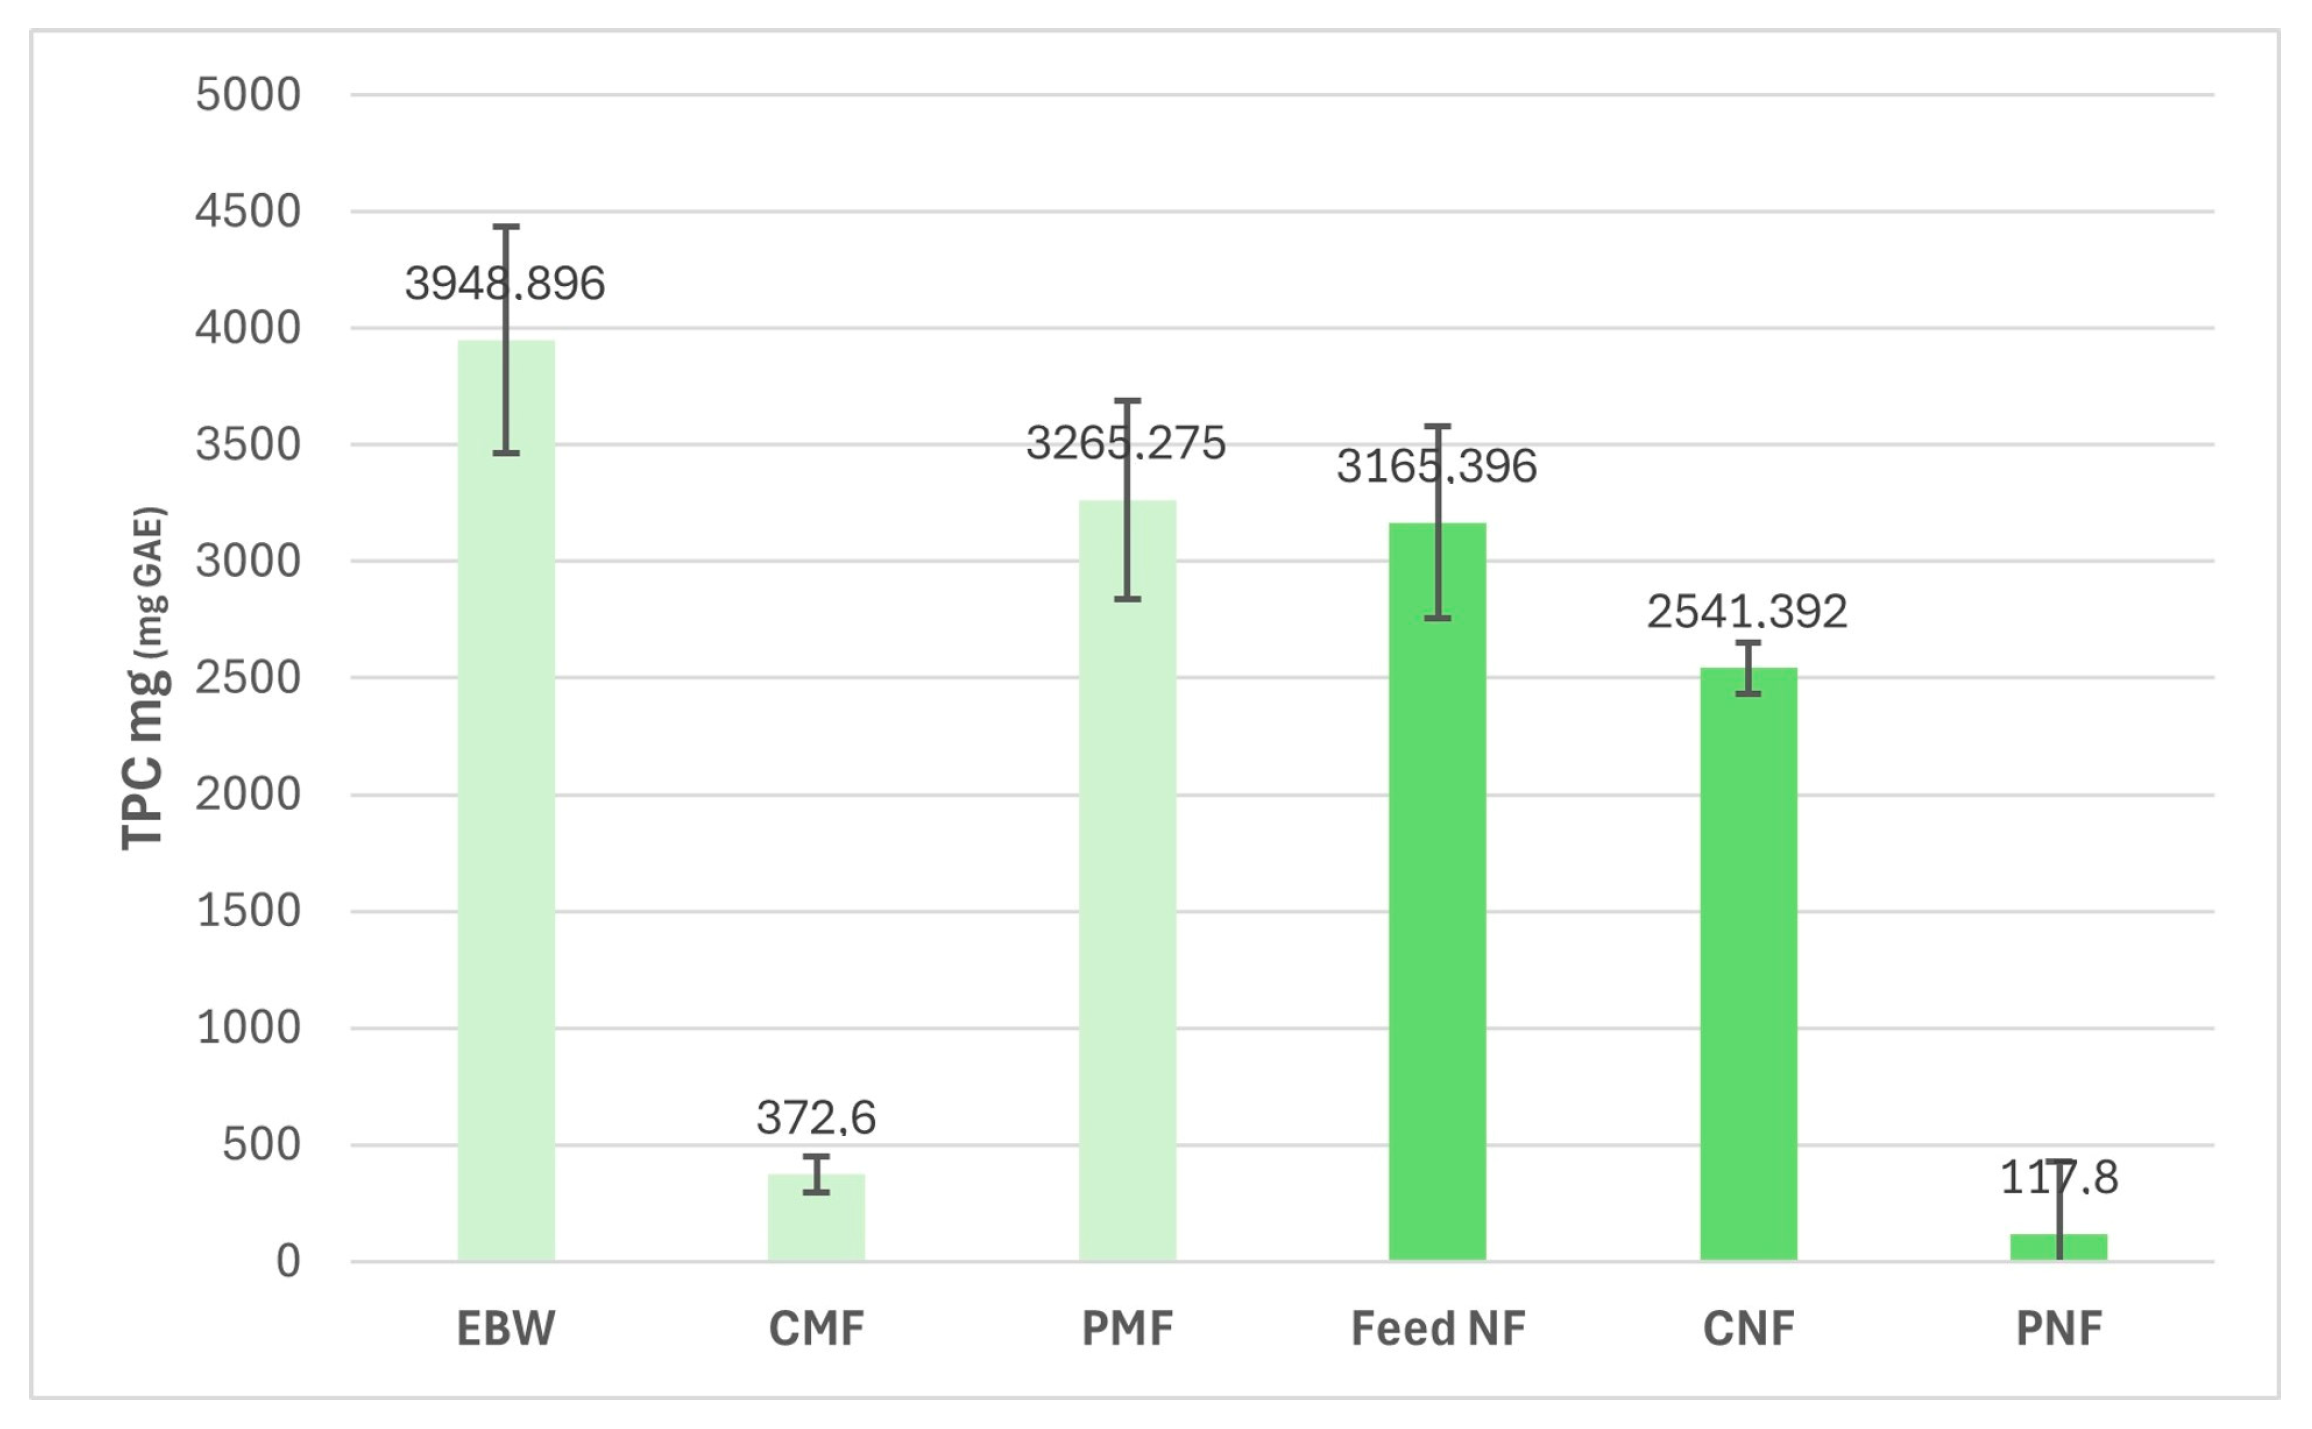
The reported VCR values were 6.6 for MF and 3.8 for NF, which is consistent with the role of MF as a clarification step and NF as the key concentration step for phenolic recovery. The distribution of phenolics across the process streams, as shown in Figure 5, confirms the strong selectivity of the NF membrane. Comparable fractionation patterns have been observed in wine lees and grape pomace processing, where phenolic compounds preferentially accumulate in the retentate fraction [25,26]. This behaviour is typically attributed to size exclusion mechanisms combined with solute–membrane interactions.
Figure 5.
Mass balance of total polyphenolic compounds (TPC), expressed as mg GAE, in the main process fractions. EBW, enriched blanching water; CMF, microfiltration concentrate; PMF, microfiltration permeate; Feed NF (PMF without sampling volume); CNF, nanofiltration concentrate; PNF, nanofiltration permeate.
Figure 5 summarizes the distribution of TPC among the main process fractions. Feed NF identifies the PMF slightly reduced by the removal of volume for sampling. Based on the reported EBW concentration (809.2 µg GAE/mL) and the initial EBW volume (5000 mL), the total TPC in the feed was 4046 mg.
According to the reported mass-balance values, MF transferred 3265.28 mg of TPC to PMF, corresponding to 80.7% of the TPC initially present in EBW. During the subsequent NF step, CNF contained 2427.94 mg of TPC. This value corresponds to 60.0% of the initial TPC in EBW and approximately 76.7% of the TPC entering the NF step. The filtration steps of MF and NF showed variations lower than 20%, 10.1% (408.1 mg) and 19.6% (621.6 mg), respectively, validating data about the efficiency.
The incomplete mass balance observed for TPC after MF and NF can be reasonably explained by a combination of phenomena commonly associated with membrane processing. One contributing factor is the partial adsorption of phenolic compounds onto the membrane surface and, more significantly, into the fouling layer formed during filtration [27]. Due to their aromatic structure and hydroxyl groups, phenolics can interact with both inorganic and polymeric surfaces mainly through hydrogen bonding, as well as hydrophobic interactions, as reported for nanofiltration systems and organic fouling mechanisms [28]. Additionally, hold-up volumes within the filtration system (e.g., membrane module and tubing) may retain part of the processed solution even after final drainage of the filtration systems, contributing to apparent mass losses. Finally, possible oxidation or polymerization reactions of phenolic compounds under aqueous processing conditions may alter their response in the Folin–Ciocalteu assay, resulting in an underestimation of TPC rather than true material loss [15].
The results obtained demonstrate the effectiveness of the integrated MF–NF process for the recovery and concentration of phenolic compounds from EBW, while also highlighting specific features that distinguish this work from existing literature. Cassano et al. [29] demonstrated that low-pressure membrane processes (MF, UF) efficiently remove suspended solids while preserving dissolved phenolics. In a previous study [30], the pre-treatment of olive mill wastewaters through MF membrane, before the NF step, allowed a reduction in total suspended solids (TSS) and total organic carbon (TOC) of 91% and 26%, respectively. In the MF permeate, were recovered 78% of TPC, while rejection of MF membrane with respect to specific polyphenolic compounds remained between 7.2% (protocatechuic acid) and 27.7% (oleuropein). From a process perspective, the results confirm that membrane selectivity is governed by a combination of molecular weight cut-off (MWCO), fouling layer formation, and solute–membrane interactions. As discussed by Alsobh et al. [31] these factors can significantly influence polyphenol rejection and process performance.
To evaluate the impact of the drying process, the spray-dried CNF powder was reconstituted in water to match the original solid content of the CNF matrix. The TPC and TAC values of the reconstituted matrix (2067.3 ± 99.4 µg GAE/mL and 3696.1 ± 176.6 µM TE, respectively) showed no significant deviation from the original sample (unpaired Student’s t-test, p < 0.05). This result is particularly relevant, as literature often focuses on liquid fractions without evaluating the stability of the final product. Pinto et al. [32] reported partial losses of phenolics during processing of eucalyptus extracts, highlighting the importance of process optimization. The preservation of bioactivity after downstream processing seems to indicate that the spray-drying process did not induce any substantial degradation of the key antioxidant compounds.
From a scale-up perspective, the MF–NF–spray-drying sequence adopted in this study relies on unit operations that are already well established at pilot and industrial scales in the food and bioprocessing sectors. Potential challenges associated with membrane processes mainly include fouling phenomena, particularly related to the presence of polyphenols, polysaccharides, and other co-extracted components. However, such effects are commonly addressed at larger scale through appropriate pre-treatment steps, optimization of cross-flow conditions, and established cleaning-in-place strategies.
Energy consumption represents another relevant aspect, especially for the thermal extraction step and for spray-drying, which is inherently more energy-intensive than membrane filtration. For agro-industrial streams comparable to EBW, such as olive mill wastewater and fruit-processing effluents, membrane processes have been widely investigated for the recovery of valuable compounds and water reuse. Although most studies report operating conditions rather than explicit energy consumption values, it is well established that pressure-driven membrane processes exhibit significantly lower energy requirements compared to conventional thermal separation techniques [33]. Spray-drying benefits from economies of scale and from the possibility of heat-recovery integration at pilot and industrial levels. Overall, although further pilot-scale validation is required to fully assess long-term performance and process economics, the use of mature, scalable technologies supports the technical feasibility of transferring the proposed workflow beyond laboratory scale.
3.5. Phytochemical Characterization and MS/MS-Based Identification
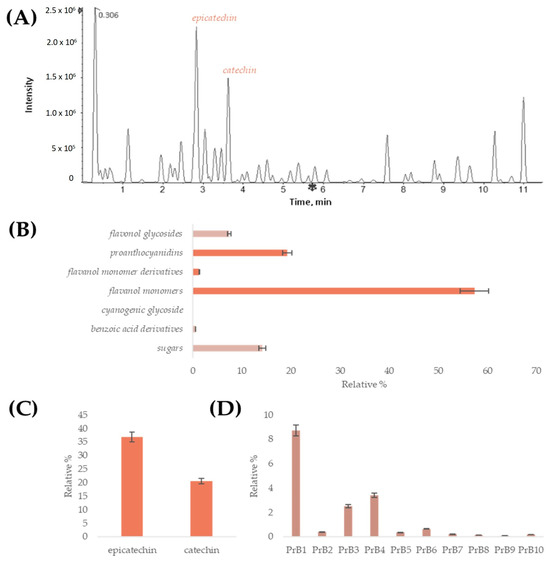
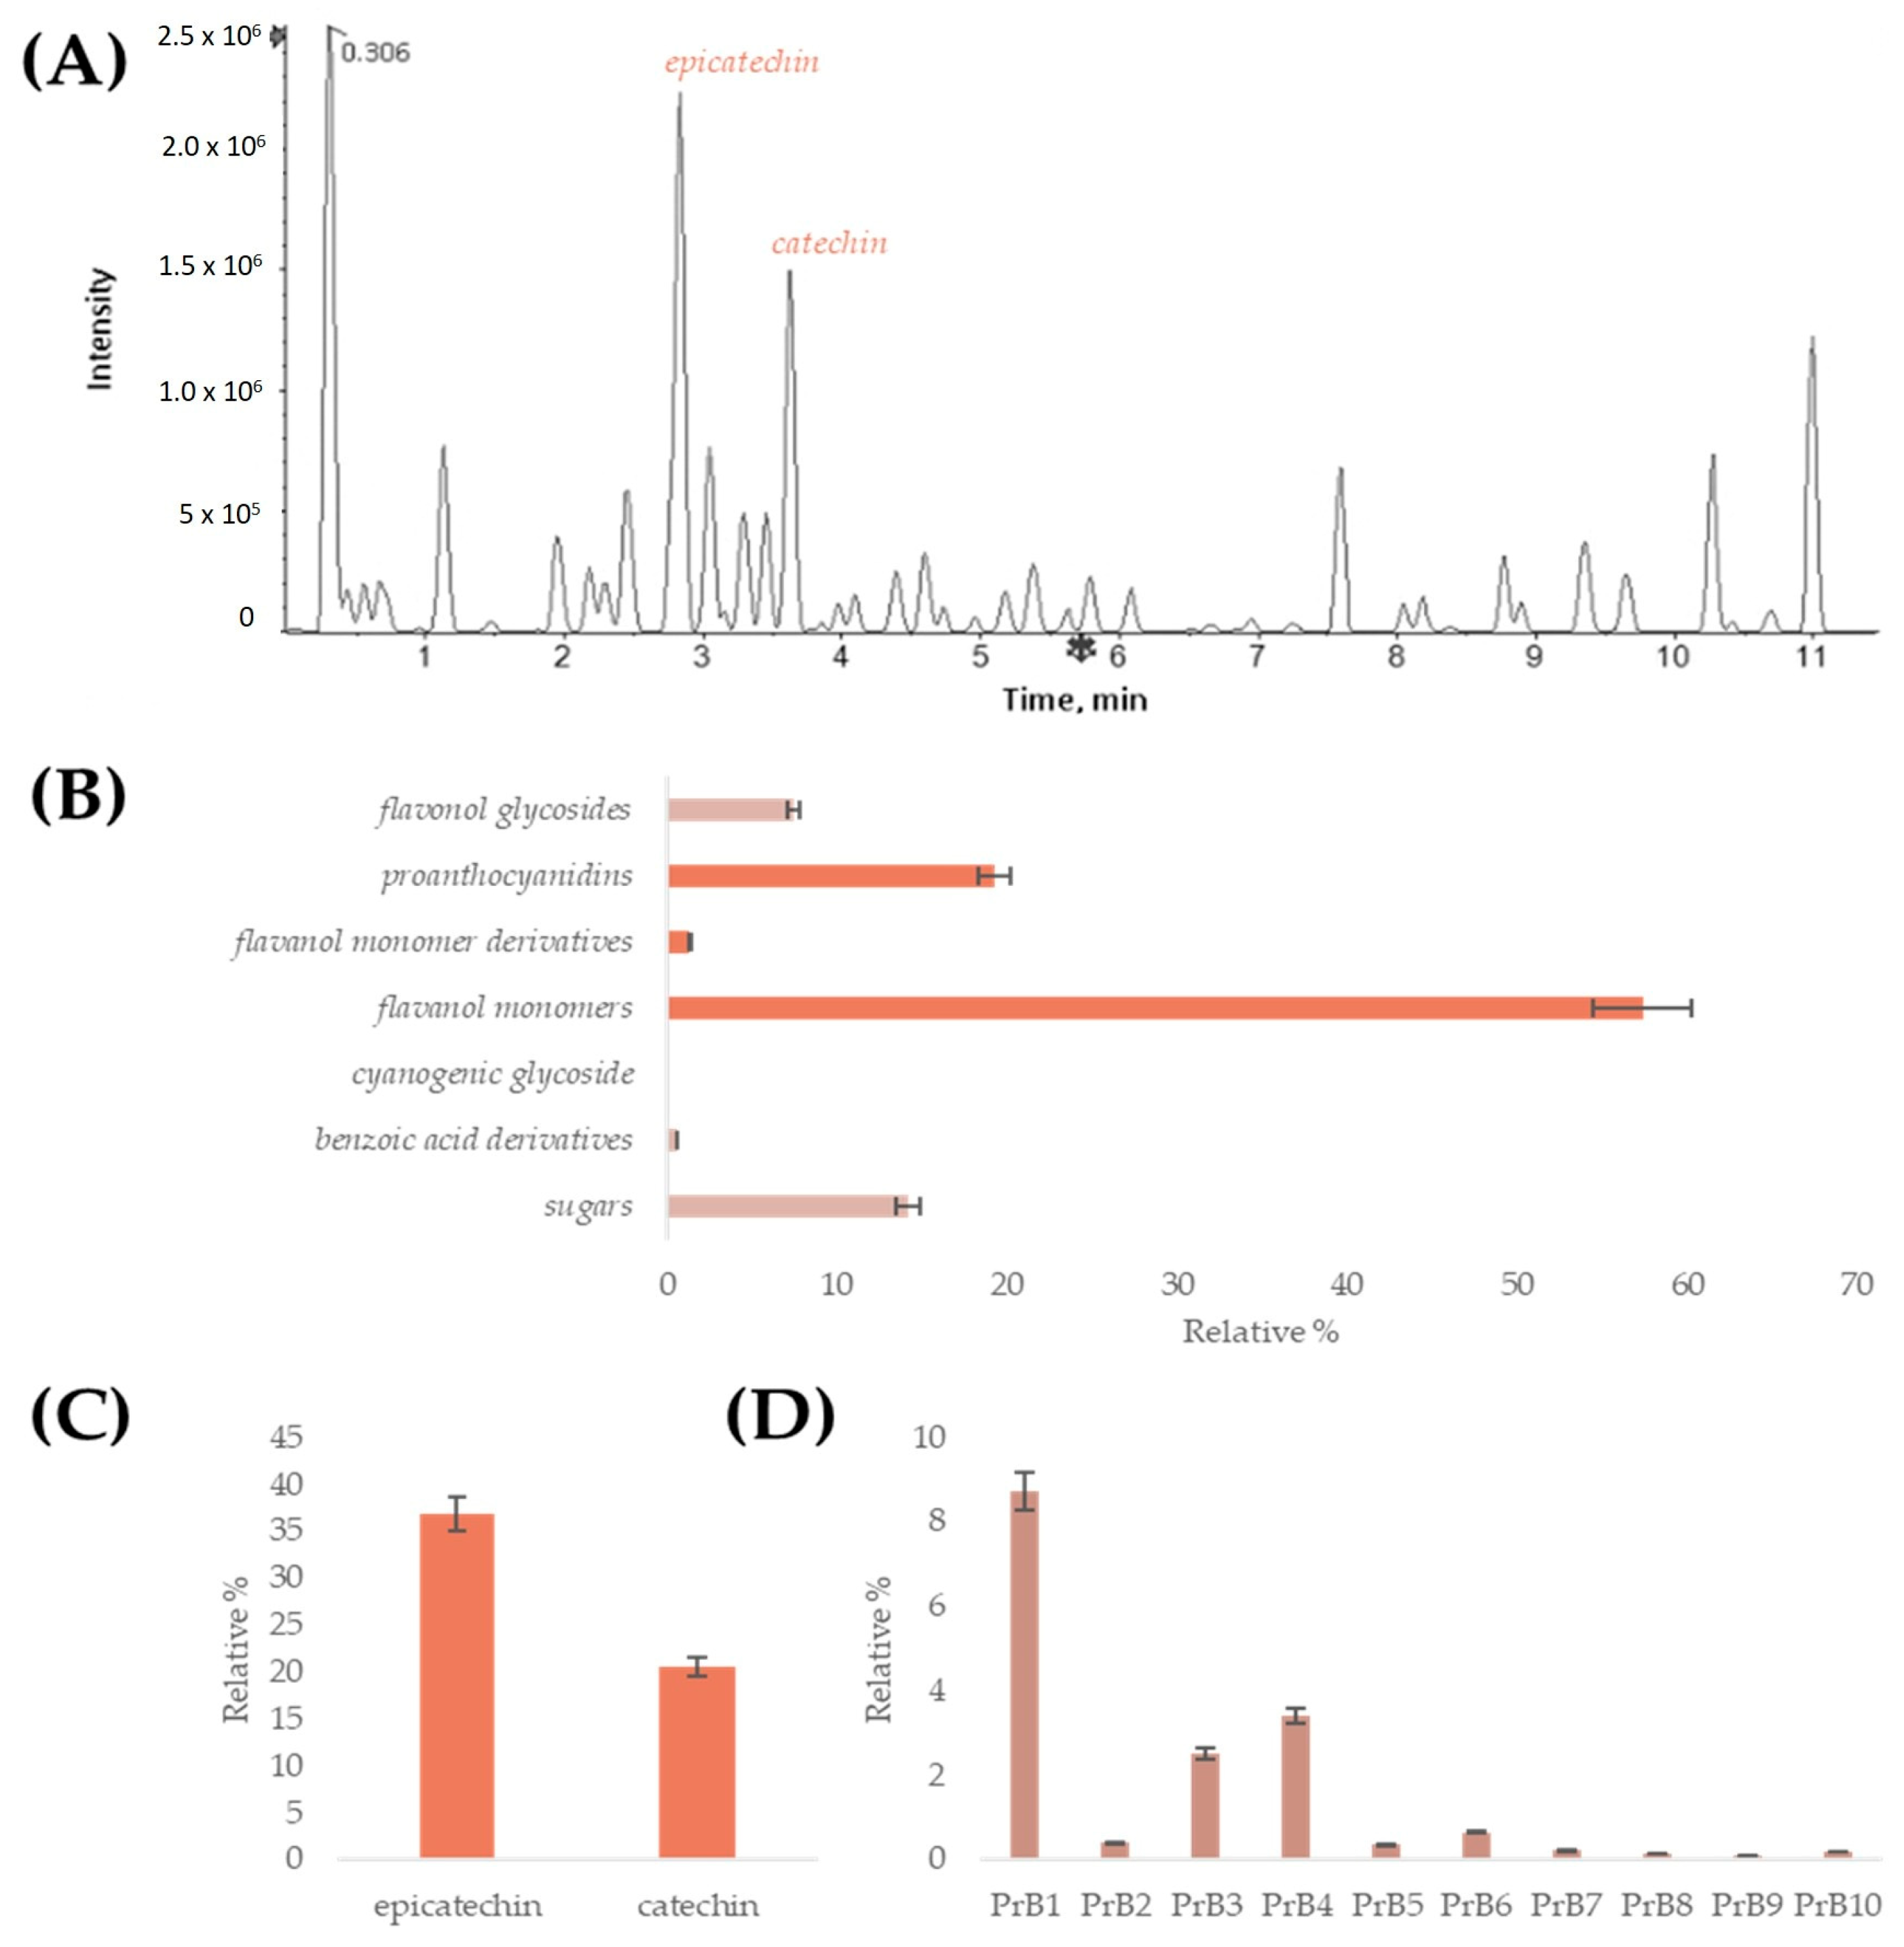
Untargeted UHPLC–HRMS analysis enabled the tentative identification of a wide range of primary and secondary metabolites in the almond extract (Figure 6). These included carbohydrates, phenolic acids and their glycosides, flavan-3-ols, proanthocyanidins, and flavonol glycosides. Compound annotation was based on accurate mass, isotopic pattern, and diagnostic TOF-MS/MS fragmentation. Relevant data (accurate masses, retention times, and MS/MS fragments) are reported in Table 2, Table 3 and Table 4, while detailed structural assignments are discussed in the corresponding subsections. Epicatechin and catechin were the predominant constituents, followed by flavanol derivatives, mainly proanthocyanidins. Dimeric procyanidins were more abundant than propelargonidins, with kaempferol and isorhamnetin derivatives being the most abundant flavonol glycosides, primarily as deoxyhexosylhexosyl conjugates.
Figure 6.
Untargeted UHPLC-HRMS profiling of the almond extract. (A) Representative total ion chromatogram (TIC) highlighting the major flavanol monomers, with epicatechin and catechin as the most intense signals. (B) Relative distribution (%) of the main compound classes estimated from normalized TIC peak areas, showing the predominance of flavanol monomers and proanthocyanidin derivatives. (C) Relative abundance of flavanol monomers, with epicatechin occurring at higher levels than catechin. (D) Relative abundance of dimeric procyanidins (PrB = B-type proanthocyanidins). The numbers following PrB correspond to the 10 different isomers based on retention time, where 1 represents the lowest retention time and 10 the highest. Error bars represent the standard deviation of peak areas obtained from three independent chromatographic runs.
Table 2.
Catechins and related derivatives tentatively identified in almond fraction 2 by TOF-MS and TOF-MS/MS analysis. RDB = ring and double bond equivalents.
Table 3.
Flavonol glycosides tentatively identified in CNF powder by TOF-MS and TOF-MS/MS analysis. RDB = ring and double bond equivalents.
Table 4.
Tentative annotation of non-flavonoid compounds detected in CNF powder by TOF-MS and TOF-MS/MS analysis. RDB denotes ring and double bond equivalents.
Compound annotation was based on accurate mass measurements, isotopic pattern evaluation, and interpretation of diagnostic TOF-MS/MS fragmentation pathways. In the Supplementary Materials, Figures S1–S7 show TOF-MS/MS spectra of tentatively identified compounds.
For clarity, the constituents identified in the CNF powder are presented in the following sections according to three major phenolic groups: flavan-3-ols and proanthocyanidins, flavonol glycosides, and additional minor compounds.
3.5.1. Flavan-3-ols and Proanthocyanidins
Flavan-3-ols and oligomeric proanthocyanidins represented the dominant phenolic class in the CNF powder. The monomeric units (+)-catechin and (−)-epicatechin (m/z 289.07) were identified based on accurate mass and characteristic TOF-MS/MS fragmentation, yielding product ions at m/z 245.08 (CO2 loss with A-ring cleavage) and 203.07 (subsequent ethenone loss), consistent with known pathways [34,35] (Figure S1, panels A and B). A diglucoside derivative of (epi)catechin was tentatively assigned based on the precursor ion at m/z 613.1778 and the fragment at m/z 289.0746, corresponding to the loss of a dihexose moiety (Figure S1, panel C). An additional compound at m/z 427.1039 was tentatively identified as an acylated catechin derivative (Figure S1, panel D). While no direct references exist for this compound in almonds, a similar acylated flavonol has been reported in Salix sieboldiana [36].
A complex profile of B-type proanthocyanidins was observed, including dimers and trimers. Ten ions at m/z 577.13 (PrB1–PrB10) were assigned to B-type procyanidin dimers (Figure S2) [35], characterized by quinone methide (QM) cleavage yielding the diagnostic ion at m/z 289.07, along with fragments from retro-Diels–Alder (RDA) and heterocyclic ring fission (HRF) pathways. Differences in the relative abundance of ions at m/z 289.07, 451.11, 425.09, and 407.08 reflected structural variability among isomers. In addition, three ions at m/z 561.1401 were attributed to B-type propelargonidin dimers (Figure S3).
Trimeric proanthocyanidins were detected at lower abundance, including one propelargonidin trimer (m/z 849.2021) and four procyanidin trimers (m/z 865.19; PrBT). The trimer at m/z 849.2021 was tentatively identified as (epi)afzelechin-(epi)catechin-(epi)catechin B-type (Figure S4, panel A). For the PrBT trimers (Figure S4, panels B–E), TOF-MS/MS spectra of the precursor ion at m/z 865.2 yielded the detectable ion at m/z 695.14 due to RDA cleavage of an (epi)catechin unit (−152 Da) plus loss of a water molecule (−18 Da). The fragment at m/z 739.17 resulted from HRF of the upper (epi)catechin unit (-126 Da), and the ions at m/z 577.14 and 575.12 formed via QM reaction. RDA and HRF reactions of the dimer produced ions at m/z 407.08, while QM cleavage of the dimer yielded the characteristic ions at m/z 289.07 and 287.06 [37]. These compounds have been previously reported in almond blanching water, which, due to its high proanthocyanidin content, represents an interesting bioactive ingredient for functional food applications [38].
3.5.2. Flavonol Glycosides
Several flavonol glycosides were detected and tentatively identified based on accurate mass measurements and characteristic neutral losses observed in TOF-MS/MS experiments (Figure S5). These compounds are already known constituents of almond seed coats [39] and other plant tissues, including leaves [40].
The TOF-MS/MS spectrum of rutin was dominated by the aglycone ion at m/z 301.0361 (quercetin), resulting from the loss of a rutinosyl moiety (−308 Da). Similarly, quercetin hexoside yielded diagnostic ions at m/z 301.0354 (aglycone) and 300.0303 (aglycone radical). The higher abundance of the aglycone radical ion suggests C-3 glycosylation, supporting its tentative assignment as quercetin 3-O-hexoside. In addition, glycosides of kaempferol and isorhamnetin were identified. Kaempferol rutinoside yielded the aglycone ion at m/z 285.0434 as the base peak, while isorhamnetin rutinoside produced the aglycone ion at m/z 315.0534. A higher relative abundance of the [M-H]− ion compared to the [M-H]●− ion was observed for these deoxyhexosyl-hexosyl (rutinosyl) derivatives, which is consistent with glycosylation at the C-7 hydroxyl group of the flavonol backbone, as previously reported for flavonols in MS/MS studies [41]. The corresponding hexosyl derivatives of kaempferol and isorhamnetin, likely differing in the type or linkage of the sugar residue, were also identified.
3.5.3. Other Compounds
In addition to flavan-3-ols and flavonols, several other metabolites were detected and characterized in the CNF powder.
Simple sugars, such as sucrose and trihexose, were observed at early retention times and identified based on their deprotonated ions and common adducts (formate or chloride). A vanilloyl dihexoside was tentatively assigned with a deprotonated molecular ion at m/z 491.1406, producing a TOF-MS/MS fragment ion at m/z 167.0345 (vanillate ion), which underwent methyl radical loss to give the ion at m/z 152.0156. A glycosylated prenylated benzoic acid derivative was detected, with TOF-MS/MS fragmentation yielding a diagnostic ion at m/z 205.0887, corresponding to the aglycone moiety, supporting its tentative identification as 4-hydroxy-3-(3-methylbut-2-en-1-yl)benzoic acid dihexoside (Figure S6). A related compound, 3-prenyl-4-O-β-D-glucopyranosyloxy-4-hydroxybenzoic acid, had been previously isolated from almonds and differs by one fewer hexosyl unit [42].
The cyanogenic glycoside amygdalin, a characteristic almond metabolite, was also identified (Figure S7) [43]. Its deprotonated molecular ion appeared at m/z 456.1506, and TOF-MS/MS fragmentation showed loss of 133.0522 Da, corresponding to the aglycone 2-hydroxy-2-phenylacetonitrile, yielding the ion at m/z 323.0984, due to the dehydrated disaccharide anion.
3.6. Correlation Between Chemical Composition, Phenolic Content, and Antioxidant Capacity
The UHPLC-HRMS/MS profile of the CNF fraction aligns closely with its measured functional properties and provides a comprehensive understanding of its bioactive potential. Unlike traditional colorimetric assays, which provide only total phenolic content (TPC) without resolving individual compounds, UHPLC-HRMS/MS allows for the reliable identification and relative quantification of specific polyphenols, offering critical insights into structure-activity relationships. The enrichment of the CNF extract in flavan-3-ols and oligomeric proanthocyanidins, while providing a clear chemical rationale for the observed antioxidant activity, highlights its potential as a bioactive ingredient for functional foods and nutraceuticals, serving as an antioxidant-rich supplement or natural additive to improve shelf-life and oxidative stability [44]. These compounds display well-established antioxidant, anti-inflammatory, and cardioprotective activities, and their structural diversity, including dimers and trimers, is critical for modulating bioavailability and biological efficacy [45,46]. Notably, analysis of the dimeric proanthocyanidins suggests that the B-ring hydroxyl groups of the upper unit play a key role in determining radical scavenging capacity and overall biological activity [47]. The prevalence of catechin, epicatechin, and especially B-type procyanidin dimers explains the strong radical-scavenging capacity, while glycosylated flavonols, such as rutin, quercetin hexoside, and kaempferol/isorhamnetin derivatives, likely enhance redox-active functionalities. This detailed compositional insight is fully consistent with the high TPC (2269.1 μg GAE/mL) and strong antioxidant activity (3169.9 μM TE) measured for the CNF fraction, providing a direct link between molecular identity and functional outcome. Comparable studies on almond blanching water have reported similar pronounced antioxidant and antiradical activities associated with high proanthocyanidin content and glycosylated flavonoids [19,21,48], reinforcing the idea that almond blanching water is a naturally rich source of flavanol-based antioxidants.
Moreover, the identified flavonol glycosides are well known for their antioxidant, anti-inflammatory, anti-microbial and cardioprotective properties [49]. It has been demonstrated that their biological activity is strongly influenced by the position and type of sugar moieties, which affect solubility, stability, and bioavailability [50]. From an application perspective, these compounds, in particular rutin, have been successfully incorporated as functional ingredients in foods, nutraceuticals, and antioxidant-rich formulations, as well as in nanoencapsulated systems or food-grade biofilms, enhancing their delivery, stability, and biological efficacy [51,52].
Although present in trace amounts, amygdalin was also widely studied for its anticancer, anti-inflammatory, and antioxidant activities, although its clinical use is limited by cyanide release. Indeed, new delivery strategies, including nanoencapsulation, may enhance its bioavailability and safety, supporting potential applications as a bioactive ingredient in functional foods or nutraceuticals.
Furthermore, the co-presence of free sugars, including di- and tri-hexoses, may influence the solubility, stability, and bioaccessibility of polyphenolic compounds by modulating their release from the food matrix and interactions during digestion. In fact, it was shown that interactions between polyphenols and carbohydrates can significantly affect the fraction of phenolics available for absorption, and the overall food matrix, including proteins and lipids, plays a key role in determining polyphenol bioavailability [53,54]. Thus, the combination of quantitative colorimetric assays and detailed UHPLC–HRMS/MS molecular characterization confirms that the CNF fraction is a phenolic-rich, highly antioxidant material. The precise molecular profile explains its elevated bioactivity and highlights almond blanching water extracts as a sustainable source of value-added phytochemicals for food, feed, and cosmetic applications.
4. Conclusions
This study demonstrates the feasibility of valorizing two almond-processing by-products—blanch water and blanched skins—as valuable sources of bioactive polyphenols within a circular-economy framework. The use of BW as extraction medium enabled efficient recovery of phenolic compounds from BS, producing an enriched blanch water (EBW) with markedly increased total polyphenol content and antioxidant capacity.
The downstream membrane-based process proved effective for phenolic concentration. Microfiltration primarily acted as a clarification step, while nanofiltration enabled selective enrichment of the bioactive fraction, yielding a concentrate (CNF) with a 2.8-fold increase in TPC and a 2-fold increase in antioxidant capacity relative to EBW. Mass-balance analysis showed that approximately 76.7% of phenolics entering the NF step were retained, corresponding to 60.0% of the phenolic content of EBW.
Spray-drying effectively stabilized the nanofiltration concentrate, yielding a homogeneous, storage-stable powder whose reconstituted form retained TPC and antioxidant capacity comparable to the liquid CNF.
Untargeted UHPLC–HRMS analysis revealed a profile dominated by flavan-3-ols and oligomeric proanthocyanidins—particularly catechin, epicatechin, and B-type procyanidins—which account for the strong antioxidant capacity measured. Flavonol glycosides (rutin, quercetin, kaempferol, and isorhamnetin derivatives) further contribute to the functional potential of the extract.
Overall, this work provides an environmentally sustainable strategy for converting almond-processing residues into high-value functional ingredients and supports the scalability of the approach and its integration into sustainable biorefinery schemes. The combination of BW-based extraction, membrane concentration, and spray-drying offers a robust and solvent-free process, with promising applications in food, nutraceutical, feed, and cosmetic formulations.
To fully unlock the industrial potential of this workflow, further efforts should focus on validating the process at pilot scale and assessing its technical and economic feasibility under real operating conditions. In parallel, logistical challenges related to the efficient collection, storage, and timely stabilization of blanch water—which is prone to microbial spoilage—should be addressed. Further studies should also evaluate the stability, bioavailability, and functionality of the spray-dried powder in final formulations. In this context, future studies could additionally benefit from the application of quantitative green metrics tools (e.g., Analytical Greenness, AGREE, or Green Analytical Procedure Index, GAPI) to complement the present process-oriented assessment and further quantify the environmental performance of the proposed workflow at higher technological readiness levels.
Supplementary Materials
The following supporting information can be downloaded at: https://www.mdpi.com/article/10.3390/appliedchem6020035/s1, Figure S1. TOF-MS/MS spectra of tentatively identified compounds (A) epicatechin; (B) catechin; (C); and (D) Catechin 3-O-(1-hydroxy-6-oxo-2-cyclohexene-1-carboxylate). Figure S2. TOF-MS/MS spectra of tentatively identified procyanidins B-type (PrB1-PrB10). The extracted ion chromatogram (XIC) of ions with m/z 577.13 is shown in the inset. Figure S3. TOF-MS/MS spectra of tentatively identified B-type propelargonidin dimers (ProPe1-ProPe3). The extracted ion chromatogram (XIC) of ions with m/z 561.14 is also shown. Figure S4. TOF-MS/MS spectra of tentatively identified (A) B-type propelargonidin trimer; (B–E) B-type procyanidin trimer isomers (PrBT1-PrBT4). Figure S5. TOF-MS/MS spectra of (A) quercetin glycosides; (B) kaempferol glycosides; (C) isorhamnetin glycosides. Figure S6. TOF-MS/MS spectrum of tentatively identified 4-hydroxy-3-(3-methylbut-2-en-1-yl)benzoic acid dihexoside. Figure S7. TOF-MS/MS spectrum of tentatively identified amygdalin.
Author Contributions
Conceptualization: L.B., O.M. and G.P.L.; methodology: P.S.; validation: S.P. (Severina Pacifico), L.B., G.P.L., D.P. and P.S.; investigation: D.P., G.P.L., O.M., S.P. (Silvia Procacci) and S.P. (Severina Pacifico); writing—original draft preparation: all authors; writing—review and editing: G.P.L., D.P., L.B. and P.S.; visualization: all authors. All authors have read and agreed to the published version of the manuscript.
Funding
This research received no external funding.
Institutional Review Board Statement
Not applicable.
Informed Consent Statement
Not applicable.
Data Availability Statement
The raw data supporting the conclusions of this article will be made available by the authors on request.
Conflicts of Interest
The authors declare no conflicts of interest.
Abbreviations
The following abbreviations are used in this manuscript:
| AGREE | Analytical Greenness |
| BW | Blanch Water |
| BS | Blanched Skins |
| CMF | Microfiltration Concentrate |
| CNF | Nanofiltration Concentrate |
| DPPH | 2,2-Diphenyl-1-picrylhydrazyl |
| EBW | Enriched Blanch Water |
| EC | Electrical Conductivity |
| ESI | Electrospray Ionization |
| GAE | Gallic Acid Equivalents |
| GAPI | Green Analytical Procedure Index |
| IDA | Information-Dependent Acquisition |
| MF | Microfiltration |
| MWCO | Molecular Weight Cut-Off |
| NF | Nanofiltration |
| PMF | Microfiltration Permeate |
| PNF | Nanofiltration Permeate |
| TAC | Total Antioxidant Capacity |
| TDS | Total Dissolved Solids |
| TE | Trolox Equivalents |
| TIC | Total Ion Chromatogram |
| TMP | Transmembrane Pressure |
| TPC | Total Polyphenol Content |
| TOF-MS/MS | Time-of-Flight Tandem Mass Spectrometry |
| UHPLC-HRMS | Ultra-High-Performance Liquid Chromatography–High-Resolution Mass Spectrometry |
| VCR | Volume Concentration Ratio |
| XIC | Extracted Ion Chromatogram |
References
- Silva, V.; Oliveira, I.; Pereira, J.A.; Gonçalves, B. Almond By-Products: A Comprehensive Review of Composition, Bioactivities, and Influencing Factors. Foods 2025, 14, 1042. [Google Scholar] [CrossRef] [Scilit] [PubMed]
- Arslan, J.; Najam, Z.; Abdullah, H.; Siddiqi, H.S.; Bano, R.; Gilani, A.-H.; Jamshed, H. Daily Almond Supplementation Improves Blood Pressure and Lipid Profile in Pregnant Women with Hypertension and Dyslipidemia: A Randomized Controlled Trial. J. Nutr. 2026, 156, 101270. [Google Scholar] [CrossRef] [Scilit]
- Dikariyanto, V.; Smith, L.; Francis, L.; Robertson, M.; Kusaslan, E.; O’Callaghan-Latham, M.; Palanche, C.; D’Annibale, M.; Christodoulou, D.; Basty, N.; et al. Snacking on Whole Almonds for 6 Weeks Improves Endothelial Function and Lowers LDL Cholesterol but Does Not Affect Liver Fat and Other Cardiometabolic Risk Factors in Healthy Adults: The ATTIS Study, a Randomized Controlled Trial. Am. J. Clin. Nutr. 2020, 111, 1178–1189. [Google Scholar] [CrossRef] [Scilit]
- Singar, S.; Kadyan, S.; Patoine, C.; Park, G.; Arjmandi, B.; Nagpal, R. The Effects of Almond Consumption on Cardiovascular Health and Gut Microbiome: A Comprehensive Review. Nutrients 2024, 16, 1964. [Google Scholar] [CrossRef] [Scilit]
- International Nut and Dried Fruit Council (INC). Almond Crop Update & Outlook. Available online: https://inc.nutfruit.org/almond-crop-update-outlook/ (accessed on 2 March 2026).
- Prgomet, I.; Gonçalves, B.; Domínguez-Perles, R.; Pascual-Seva, N.; Barros, A.I.R.N.A. A Box-Behnken Design for Optimal Extraction of Phenolics from Almond By-Products. Food Anal. Methods 2019, 12, 2009–2024. [Google Scholar] [CrossRef] [Scilit]
- Boulika, H.; El Hajam, M.; Nabih, M.H.; Kandri, N.I.; Zerouale, A. Physico-Chemical Properties and Valorization Perspectives of Almond Residues (Shells & Hulls) in the Northern Morocco: A Comparative Study. Biomass Conv. Bioref. 2025, 15, 4073–4082. [Google Scholar] [CrossRef] [Scilit]
- Taş, N.G.; Gökmen, V. Phenolic Compounds in Natural and Roasted Nuts and Their Skins: A Brief Review. Curr. Opin. Food Sci. 2017, 14, 103–109. [Google Scholar] [CrossRef] [Scilit]
- Pasqualone, A.; Laddomada, B.; Boukid, F.; Angelis, D.D.; Summo, C. Use of Almond Skins to Improve Nutritional and Functional Properties of Biscuits: An Example of Upcycling. Foods 2020, 9, 1705. [Google Scholar] [CrossRef] [Scilit] [PubMed]
- Hughey, C.A.; Janusziewicz, R.; Minardi, C.S.; Phung, J.; Huffman, B.A.; Reyes, L.; Wilcox, B.E.; Prakash, A. Distribution of Almond Polyphenols in Blanch Water and Skins as a Function of Blanching Time and Temperature. Food Chem. 2012, 131, 1165–1173. [Google Scholar] [CrossRef] [Scilit]
- Valdés, A.; Vidal, L.; Beltrán, A.; Canals, A.; Garrigós, M.C. Microwave-Assisted Extraction of Phenolic Compounds from Almond Skin Byproducts (Prunus amygdalus): A Multivariate Analysis Approach. J. Agric. Food Chem. 2015, 63, 5395–5402. [Google Scholar] [CrossRef] [Scilit]
- Smeriglio, A.; Mandalari, G.; Bisignano, C.; Filocamo, A.; Barreca, D.; Bellocco, E.; Trombetta, D. Polyphenolic Content and Biological Properties of Avola Almond (Prunus dulcis Mill. D.A. Webb) Skin and Its Industrial Byproducts. Ind. Crops Prod. 2016, 83, 283–293. [Google Scholar] [CrossRef] [Scilit]
- Hellwig, V.; Gasser, J. Polyphenols from Waste Streams of Food Industry: Valorisation of Blanch Water from Marzipan Production. Phytochem. Rev. 2020, 19, 1539–1546. [Google Scholar] [CrossRef] [Scilit]
- Ingegneri, M.; Smeriglio, A.; Rando, R.; Gervasi, T.; Tamburello, M.P.; Ginestra, G.; La Camera, E.; Pennisi, R.; Sciortino, M.T.; Mandalari, G.; et al. Composition and Biological Properties of Blanched Skin and Blanch Water Belonging to Three Sicilian Almond Cultivars. Nutrients 2023, 15, 1545. [Google Scholar] [CrossRef] [Scilit]
- Singleton, V.L.; Orthofer, R.; Lamuela-Raventós, R.M. Analysis of Total Phenols and Other Oxidation Substrates and Antioxidants by Means of Folin-Ciocalteu Reagent. In Methods in Enzymology; Elsevier: Amsterdam, The Netherlands, 1999; Volume 299, pp. 152–178. ISBN 978-0-12-182200-2. [Google Scholar]
- Brand-Williams, W.; Cuvelier, M.E.; Berset, C. Use of a Free Radical Method to Evaluate Antioxidant Activity. LWT—Food Sci. Technol. 1995, 28, 25–30. [Google Scholar] [CrossRef] [Scilit]
- Muhammad, N.; Hussain, I.; Fu, X.; Ali, A.; Guo, D.; Noureen, L.; Subhani, Q.; Ahmad, N.; Zhu, Q.; Cui, H.; et al. A Comprehensive Review of Instrumentation and Applications in Post-Column and In-Source Derivatization for LC-MS. Mass Spectrom. Rev. 2025; in press. [CrossRef] [Scilit]
- Milbury, P.E.; Chen, C.-Y.; Dolnikowski, G.G.; Blumberg, J.B. Determination of Flavonoids and Phenolics and Their Distribution in Almonds. J. Agric. Food Chem. 2006, 54, 5027–5033. [Google Scholar] [CrossRef] [Scilit] [PubMed]
- Mandalari, G.; Arcoraci, T.; Martorana, M.; Bisignano, C.; Rizza, L.; Bonina, F.; Trombetta, D.; Tomaino, A. Antioxidant and Photoprotective Effects of Blanch Water, a Byproduct of the Almond Processing Industry. Molecules 2013, 18, 12426–12440. [Google Scholar] [CrossRef] [Scilit]
- Bolling, B.W.; Chen, C.-Y.O.; McKay, D.L.; Blumberg, J.B. Tree Nut Phytochemicals: Composition, Antioxidant Capacity, Bioactivity, Impact Factors. A Systematic Review of Almonds, Brazils, Cashews, Hazelnuts, Macadamias, Pecans, Pine Nuts, Pistachios and Walnuts. Nutr. Res. Rev. 2011, 24, 244–275. [Google Scholar] [CrossRef] [Scilit]
- Tabib, M.; Ginies, C.; Rakotomanomana, N.; Remmal, A. Adsorption of Polyphenols from Almond Blanching Water by Macroporous Resin. Int. J. Food Sci. 2022, 2022, 7847276. [Google Scholar] [CrossRef] [Scilit] [PubMed]
- Antony, A.; Farid, M. Effect of Temperatures on Polyphenols during Extraction. Appl. Sci. 2022, 12, 2107. [Google Scholar] [CrossRef] [Scilit]
- Maillard, M.-N.; Berset, C. Evolution of Antioxidant Activity during Kilning: Role of Insoluble Bound Phenolic Acids of Barley and Malt. J. Agric. Food Chem. 1995, 43, 1789–1793. [Google Scholar] [CrossRef] [Scilit]
- Sánchez-Arévalo, C.M.; Pérez García-Serrano, A.; Vincent-Vela, M.C.; Álvarez-Blanco, S. Combining Ultrafiltration and Nanofiltration to Obtain a Concentrated Extract of Purified Polyphenols from Wet Olive Pomace. Membranes 2023, 13, 119. [Google Scholar] [CrossRef] [Scilit] [PubMed]
- Reig, M.; Vecino, X.; Cortina, J.L. Use of Membrane Technologies in Dairy Industry: An Overview. Foods 2021, 10, 2768. [Google Scholar] [CrossRef] [Scilit]
- Yammine, S.; Rabagliato, R.; Vitrac, X.; Mietton Peuchot, M.; Ghidossi, R. The Use of Nanofiltration Membranes for the Fractionation of Polyphenols from Grape Pomace Extracts. OENO One 2019, 53, 11–26. [Google Scholar] [CrossRef] [Scilit]
- Saf, C.; Villain-Gambier, M.; Belaqziz, M.; Ziegler-Devin, I.; Trebouet, D.; Ouazzani, N. Fouling Control Investigation by pH Optimization during Olive Mill Wastewater Ultrafiltration. Process Saf. Environ. Prot. 2022, 164, 119–128. [Google Scholar] [CrossRef] [Scilit]
- Arsuaga, J.M.; López-Muñoz, M.J.; Sotto, A. Correlation between Retention and Adsorption of Phenolic Compounds in Nanofiltration Membranes. Desalination 2010, 250, 829–832. [Google Scholar] [CrossRef] [Scilit]
- Cassano, A.; Conidi, C.; Ruby-Figueroa, R.; Castro-Muñoz, R. Nanofiltration and Tight Ultrafiltration Membranes for the Recovery of Polyphenols from Agro-Food By-Products. Int. J. Mol. Sci. 2018, 19, 351. [Google Scholar] [CrossRef] [Scilit]
- Garcia-Castello, E.; Cassano, A.; Criscuoli, A.; Conidi, C.; Drioli, E. Recovery and Concentration of Polyphenols from Olive Mill Wastewaters by Integrated Membrane System. Water Res. 2010, 44, 3883–3892. [Google Scholar] [CrossRef] [Scilit]
- Alsobh, A.; Zin, M.M.; Vatai, G.; Bánvölgyi, S. The Application of Membrane Technology in the Concentration and Purification of Plant Extracts: A Review. Period. Polytech. Chem. Eng. 2022, 66, 394–408. [Google Scholar] [CrossRef] [Scilit]
- Pinto, P.C.R.; Mota, I.F.; Loureiro, J.M.; Rodrigues, A.E. Membrane Performance and Application of Ultrafiltration and Nanofiltration to Ethanol/Water Extract of Eucalyptus Bark. Sep. Purif. Technol. 2014, 132, 234–243. [Google Scholar] [CrossRef] [Scilit]
- Drioli, E.; Stankiewicz, A.I.; Macedonio, F. Membrane Engineering in Process Intensification—An Overview. J. Membr. Sci. 2011, 380, 1–8. [Google Scholar] [CrossRef] [Scilit]
- Bottone, A.; Masullo, M.; Montoro, P.; Pizza, C.; Piacente, S. HR-LC-ESI-Orbitrap-MS Based Metabolite Profiling of Prunus dulcis Mill. (Italian Cultivars Toritto and Avola) Husks and Evaluation of Antioxidant Activity. Phytochem. Anal. 2019, 30, 415–423. [Google Scholar] [CrossRef] [Scilit]
- Candela, L.; Formato, M.; Crescente, G.; Piccolella, S.; Pacifico, S. Coumaroyl Flavonol Glycosides and More in Marketed Green Teas: An Intrinsic Value beyond Much-Lauded Catechins. Molecules 2020, 25, 1765. [Google Scholar] [CrossRef] [Scilit]
- Hsu, F.-L.; Nonaka, G.-I.; Nishioka, I. Acylated Flavanols and Procyanidins from Salix sieboldiana. Phytochemistry 1985, 24, 2089–2092. [Google Scholar] [CrossRef] [Scilit]
- Enomoto, H.; Takahashi, S.; Takeda, S.; Hatta, H. Distribution of Flavan-3-Ol Species in Ripe Strawberry Fruit Revealed by Matrix-Assisted Laser Desorption/Ionization-Mass Spectrometry Imaging. Molecules 2019, 25, 103. [Google Scholar] [CrossRef] [Scilit] [PubMed]
- Pérez-Jiménez, J.; Torres, J.L. Analysis of Proanthocyanidins in Almond Blanch Water by HPLC–ESI–QqQ–MS/MS and MALDI–TOF/TOF MS. Food Res. Int. 2012, 49, 798–806. [Google Scholar] [CrossRef] [Scilit]
- Frison-Norrie, S.; Sporns, P. Identification and Quantification of Flavonol Glycosides in Almond Seedcoats Using MALDI-TOF MS. J. Agric. Food Chem. 2002, 50, 2782–2787. [Google Scholar] [CrossRef] [Scilit]
- Bottone, A.; Montoro, P.; Masullo, M.; Pizza, C.; Piacente, S. Metabolomics and Antioxidant Activity of the Leaves of Prunus dulcis Mill. (Italian Cvs. Toritto and Avola). J. Pharm. Biomed. Anal. 2018, 158, 54–65. [Google Scholar] [CrossRef] [Scilit]
- Cuyckens, F.; Claeys, M. Mass Spectrometry in the Structural Analysis of Flavonoids. J. Mass Spectrom. 2004, 39, 461. [Google Scholar] [CrossRef] [Scilit]
- Sang, S.; Lapsley, K.; Rosen, R.T.; Ho, C.-T. New Prenylated Benzoic Acid and Other Constituents from Almond Hulls (Prunus amygdalus Batsch). J. Agric. Food Chem. 2002, 50, 607–609. [Google Scholar] [CrossRef] [Scilit]
- Bottone, A.; Montoro, P.; Masullo, M.; Pizza, C.; Piacente, S. Metabolite Profiling and Antioxidant Activity of the Polar Fraction of Italian Almonds (Toritto and Avola): Analysis of Seeds, Skins, and Blanching Water. J. Pharm. Biomed. Anal. 2020, 190, 113518. [Google Scholar] [CrossRef] [Scilit]
- Verma, P.; Sen, R.; Bamanna, A.; Elhindawy, M.; Nagpal, K.; Krishnan, V. Structural Chemistry to Therapeutic Functionality: A Comprehensive Review on Proanthocyanidins. Biocatal. Agric. Biotechnol. 2024, 55, 102963. [Google Scholar] [CrossRef] [Scilit]
- Smeriglio, A.; Barreca, D.; Bellocco, E.; Trombetta, D. Proanthocyanidins and Hydrolysable Tannins: Occurrence, Dietary Intake and Pharmacological Effects. Br. J. Pharmacol. 2017, 174, 1244–1262. [Google Scholar] [CrossRef] [Scilit]
- Tie, F.; Wang, J.; Liang, Y.; Zhu, S.; Wang, Z.; Li, G.; Wang, H. Proanthocyanidins Ameliorated Deficits of Lipid Metabolism in Type 2 Diabetes Mellitus via Inhibiting Adipogenesis and Improving Mitochondrial Function. Int. J. Mol. Sci. 2020, 21, 2029. [Google Scholar] [CrossRef] [Scilit]
- Hamada, Y.; Takano, S.; Ayano, Y.; Tokunaga, M.; Koashi, T.; Okamoto, S.; Doi, S.; Ishida, M.; Kawasaki, T.; Hamada, M.; et al. Structure–Activity Relationship of Oligomeric Flavan-3-Ols: Importance of the Upper-Unit B-Ring Hydroxyl Groups in the Dimeric Structure for Strong Activities. Molecules 2015, 20, 18870–18885. [Google Scholar] [CrossRef] [Scilit]
- Karamać, M.; Janiak, M.A.; Sulewska, K.; Amarowicz, R. Phenolic Profile and Antioxidant Activity of Fractions of Procyanidin-Rich Hawthorn (Crataegus monogyna Jacq.) Bark Extract Separated by Low-Pressure Liquid Chromatography. Molecules 2025, 30, 4375. [Google Scholar] [CrossRef] [Scilit] [PubMed]
- Barreca, D.; Trombetta, D.; Smeriglio, A.; Mandalari, G.; Romeo, O.; Felice, M.R.; Gattuso, G.; Nabavi, S.M. Food Flavonols: Nutraceuticals with Complex Health Benefits and Functionalities. Trends Food Sci. Technol. 2021, 117, 194–204. [Google Scholar] [CrossRef] [Scilit]
- Lai, X.; Li, X.; Chen, J.; Liu, X.; Pan, P.; Zhou, Y.; Zhao, G. Advances in Flavonoid Glycosylation: Chemical and Biological Basis, Mechanisms, Physicochemical Properties, and Applications in the Food Industry. Trends Food Sci. Technol. 2025, 165, 105296. [Google Scholar] [CrossRef] [Scilit]
- Malekpour, M.; Ebrahiminezhad, A.; Karimi, Z.; Saadi, M.I.; Berenjian, A. Current Strategies for Rutin Nano-Formulation; a Promising Bioactive Compound with Increased Efficacy. Bioprocess Biosyst. Eng. 2025, 48, 877–898. [Google Scholar] [CrossRef] [Scilit]
- Ramezani, H.; Sazegar, H.; Rouhi, L. The Antimicrobial Efficacy of Rutin Encapsulated Chitosan versus Multidrug-Resistant Pseudomonas aeruginosa. Sci. Rep. 2025, 15, 22047. [Google Scholar] [CrossRef] [Scilit]
- Tarko, T.; Duda-Chodak, A. Influence of Food Matrix on the Bioaccessibility of Fruit Polyphenolic Compounds. J. Agric. Food Chem. 2020, 68, 1315–1325. [Google Scholar] [CrossRef] [Scilit]
- Polia, F.; Pastor-Belda, M.; Martínez-Blázquez, A.; Horcajada, M.-N.; Tomás-Barberán, F.A.; García-Villalba, R. Technological and Biotechnological Processes to Enhance the Bioavailability of Dietary (Poly)Phenols in Humans. J. Agric. Food Chem. 2022, 70, 2092–2107. [Google Scholar] [CrossRef] [Scilit]

Disclaimer/Publisher’s Note: The statements, opinions and data contained in all publications are solely those of the individual author(s) and contributor(s) and not of MDPI and/or the editor(s). MDPI and/or the editor(s) disclaim responsibility for any injury to people or property resulting from any ideas, methods, instructions or products referred to in the content. |
© 2026 by the authors. Licensee MDPI, Basel, Switzerland. This article is an open access article distributed under the terms and conditions of the Creative Commons Attribution (CC BY) license.