


Abstract
Background/Objectives: This study examined the effects of an eight-week plyometric training programme on jump biomechanics, field-based jump performance, and repeated-jump endurance in 13–14-year-old volleyball players, and explored training-induced changes. Methods: A pre–post controlled experimental design was used. Thirty male volleyball players aged 13–14 years were assigned to an experimental group (EG, n = 15) or a control group (CG, n = 15). The EG completed a structured plyometric programme three times per week for eight weeks in addition to regular volleyball training, whereas the CG continued usual practice. Biomechanical variables were assessed during the Repeated Countermovement Jump test using the BTS Bioengineering G-Walk inertial measurement system, together with field-based jump and repeated-jump endurance tests. Outcomes were analysed using two-way mixed ANOVA (Group × Time). Δ-based correlations were examined using Pearson and Spearman coefficients with false discovery rate correction. Results: Significant Group × Time interaction effects were found for all analysed RCMJ variables (all p < 0.001). Significant interaction effects were also observed for all field-based jump and repeated-jump endurance outcomes (all p ≤ 0.025). The EG showed greater improvements over time than the CG across the principal biomechanical, practical, and endurance-related indicators. Correlation analysis revealed strong associations among the principal RCMJ variables and selected links with field-based and endurance measures. Conclusions: A structured plyometric programme may improve jump biomechanics, jump performance, and repeated-jump endurance in adolescent volleyball players. These findings should be interpreted cautiously because of baseline differences, the modest sample size, and the IMU-derived nature of force- and power-related estimates.
1. Introduction
Volleyball is characterised as a team sport with a strong focus on speed and power. Players often perform many intense jumps and explosive moves over short periods [1,2]. During games, volleyball athletes perform many complex actions, such as vertical jumps, blocking, spiking, and quick direction changes [3]. Research reports that a professional volleyball player can make 200–400 jumps in a match. Explosive strength, muscle coordination, and movement efficiency are key skills [4,5,6]. As a result, improving jumping is an important part of volleyball.
The main factors that affect jumping ability are the stretchiness of muscles and tendons, the efficiency of the stretch–shortening cycle (SSC), peak power, muscle activation speed, and neuromuscular changes [7,8]. Plyometric training is commonly used in sports to improve these areas. Such exercises use the SSC to store elastic energy in muscles, trigger fast reflexes, and boost contraction speed [9,10]. Athletes can then increase explosive power and jumping ability.
Many recent studies prove plyometric training works, but most focus on adults or well-trained athletes [1,11,12,13]. In younger players aged 13–14, bones, muscles, and nerves are still developing [14]. It is important to study appropriate and safe plyometric programs for this age group.
Many earlier studies only examined how high players can jump [15,16]. But, in volleyball, jump efficiency depends on several factors: explosive force, power during take-off, jumping technique, speed, and endurance [3,17]. Current research stresses the value of full biomechanical testing using sensor technology. For example, the G-Walk device measures jump height, take-off force, concentric power, peak speed, and endurance index, all of which have shown to be reliable in other studies [18,19].
Therefore, studying how plyometric training affects jump biomechanics, explosive force, and endurance in young volleyball players is important for both training and sports science [2,20]. In particular, analysing how training changes these measures helps us understand how jumping works as a whole. Yet, there is not enough experimental research on 13–14-year-old volleyball players that closely examines factors such as take-off force, power, speed, and endurance index using sensors. Also, the links between improvements in explosive strength and jump endurance after training are not fully understood for this age group.
The scientific novelty of the present study lies in the simultaneous assessment of jump biomechanics and jump endurance using the G-Walk inertial measurement system, combined with Δ-correlation analysis to identify integrated neuromuscular adaptations induced by plyometric training in 13–14-year-old volleyball players.
Accordingly, the aim of this study was to determine the effects of an eight-week plyometric training programme on jump biomechanics, explosive muscle power, and jump endurance in 13–14-year-old volleyball players, and to evaluate the Δ-relationships among these parameters.
It was hypothesised that plyometric training would significantly improve jumping performance, explosive strength, and jump endurance in 13–14-year-old volleyball players, and that strong interrelationships would exist among the Δ-changes in these outcomes. To test these hypotheses, the study used a pre–post controlled experimental design to compare the results of the experimental and control groups.
2. Results
The pre- and post-intervention changes in the biomechanical variables obtained from the RCMJ test were analysed in the experimental and control groups. This analysis was aimed at determining the extent to which training influenced jump height, take-off force, concentric power, movement speed, and endurance index. To evaluate time-dependent differences between the groups, a two-way mixed ANOVA was applied.
Table 1 shows that all principal RCMJ biomechanical variables improved from pre-test to post-test in both groups; however, the magnitude of change was consistently greater in the experimental group. The mixed ANOVA revealed statistically significant Group × Time interaction effects for CMJ height (F(1,28) = 145.0, p < 0.001), take-off force (F(1,28) = 175.5, p < 0.001), maximum concentric power (F(1,28) = 114.2, p < 0.001), peak speed (F(1,28) = 269.4, p < 0.001), and Endurance Index (F(1,28) = 250.5, p < 0.001). These findings indicate that the plyometric training programme produced significantly greater positive changes in the experimental group compared with the control group. In particular, the most pronounced between-group differences over time were observed for peak speed and Endurance Index, suggesting marked improvements in force–velocity characteristics and repeated-jump performance stability.
Table 1.
Pre- and post-test G-Walk biomechanical variables in the experimental (EG) and control (CG) groups, with Group × Time interaction effects.
Table 2 presents the pre- and post-test results of the field-based jump performance variables in the experimental and control groups. The analysis revealed significant Group × Time interaction effects for the running two-leg vertical jump test (F(1,28) = 51.07, p < 0.001), pure vertical jump height test (F(1,28) = 22.22, p < 0.001), standing long jump test (F(1,28) = 110.0, p < 0.001), and the Abalakov method (F(1,28) = 48.58, p < 0.001). A smaller but still statistically significant interaction effect was also identified for the relative jump coefficient (Ucchelli test) (F(1,28) = 6.784, p = 0.015). These findings indicate that the magnitude of change over time differed significantly between the groups across all analysed field-based jump tests.
Table 2.
Pre- and post-test field-based jump performance variables in the experimental (EG) and control (CG) groups, with Group × Time interaction effects.
Descriptive results showed that the experimental group demonstrated greater improvements than the control group in all variables. The most pronounced differences were observed in the standing long jump and running two-leg vertical jump tests, indicating a substantial enhancement of explosive lower-limb performance under applied testing conditions. Significant improvements in the pure vertical jump and Abalakov tests also suggest that the training programme positively influenced vertical jump capacity in sport-relevant settings. Overall, the field-based test results support the conclusion that the applied plyometric training programme was effective in improving practical jump performance in 13–14-year-old volleyball players.
Table 3 presents the pre- and post-test results of the repeated-jump endurance variables in the experimental and control groups. The mixed ANOVA showed significant Group × Time interaction effects for all analysed indicators, including repeated two-leg jump performance (F(1,28) = 12.60, p = 0.001), repeated run-up jump performance (F(1,28) = 5.627, p = 0.025), repeated hurdle jump performance (F(1,28) = 237.9, p < 0.001), and spike-jump endurance (F(1,28) = 7.365, p = 0.011). These findings indicate that the magnitude of change over time differed significantly between the groups across all repeated-jump endurance tests.
Table 3.
Pre- and post-test repeated-jump endurance variables in the experimental (EG) and control (CG) groups, with Group × Time interaction effects.
Descriptive results further showed that the experimental group achieved greater improvements than the control group in all variables. The largest interaction effect was observed for the repeated hurdle jump test, suggesting a marked enhancement in the ability to sustain repeated explosive jumping efforts. In the spike-jump endurance test, both groups reduced the number of errors, but the decrease was greater in the experimental group, indicating improved fatigue resistance and greater stability of sport-specific jump execution. Overall, these results demonstrate that the plyometric training programme was effective not only in improving maximal jump-related performance, but also in enhancing repeated-jump endurance in 13–14-year-old volleyball players.
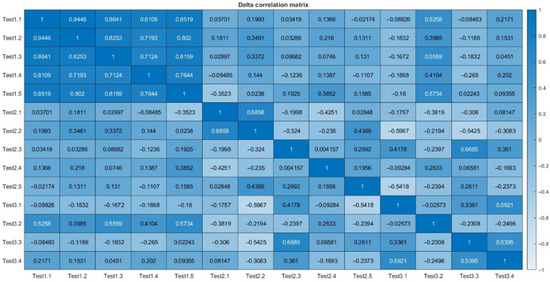
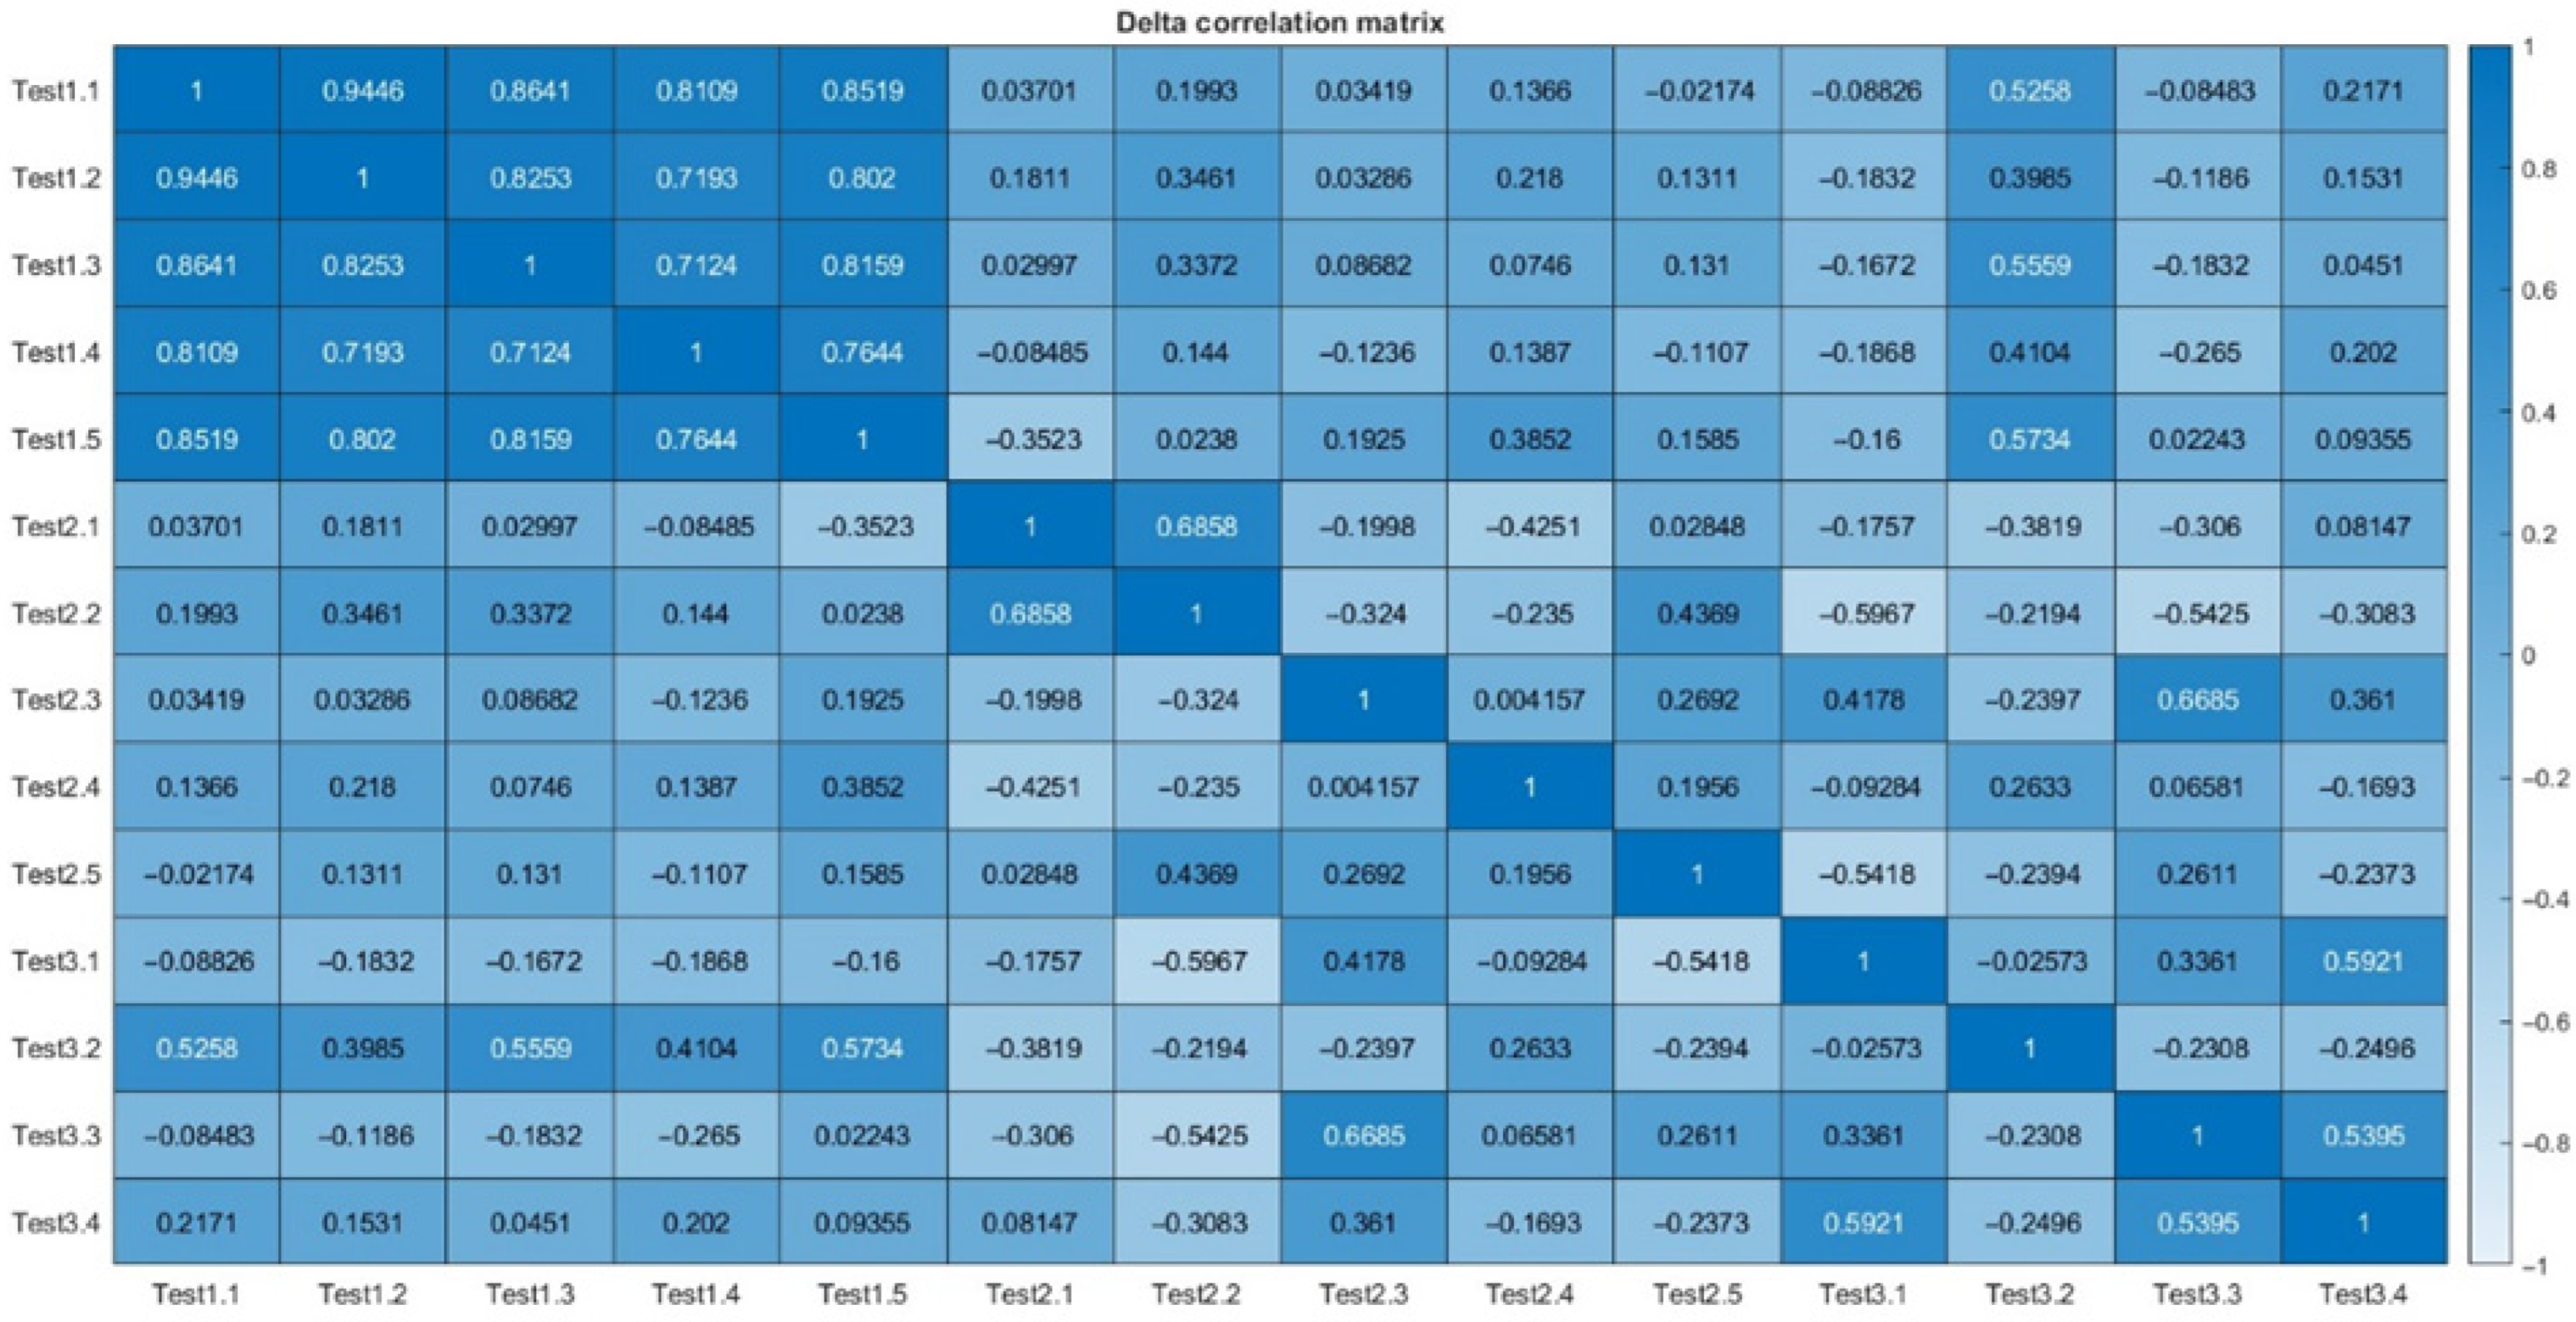
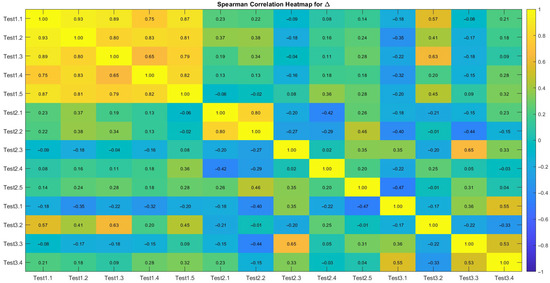
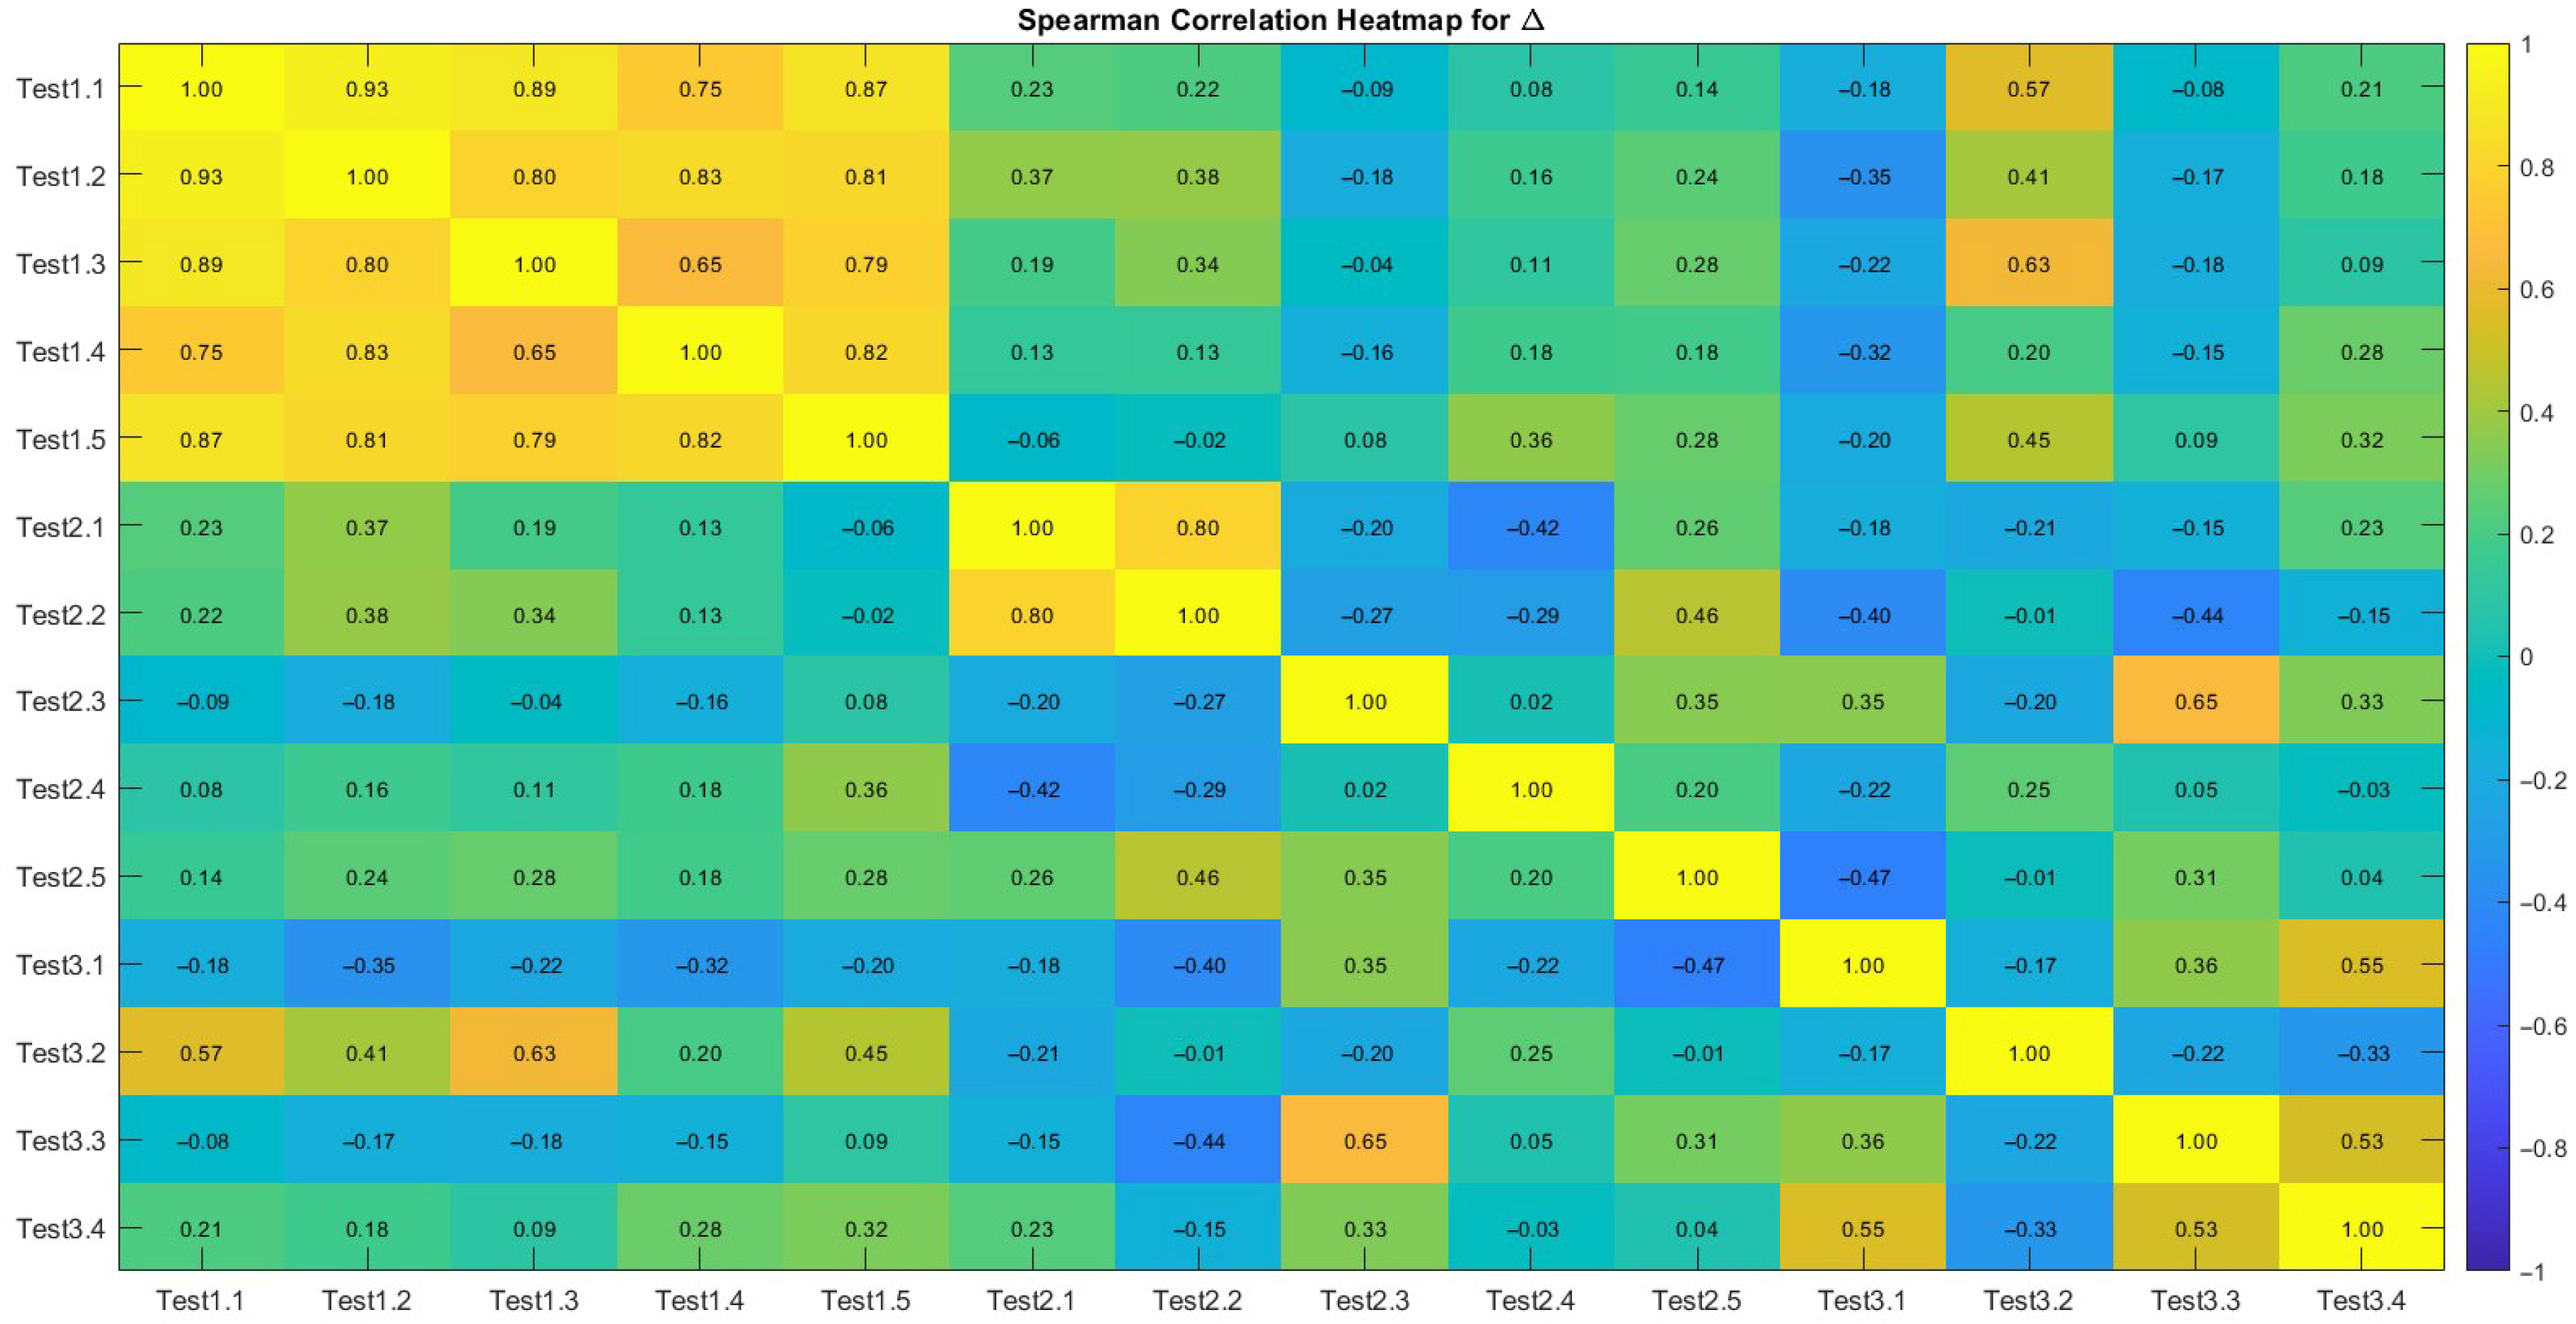
The interrelationships between training-induced changes (Δ) were evaluated using Pearson’s correlation coefficient (r), together with p-values and 95% confidence intervals (CI). These findings are visualised in Figure 1 and Figure 2 as Pearson and Spearman correlation heatmaps, respectively.
Figure 1.
Heatmap of the Pearson correlation matrix illustrating the relationships between Pre–Post Δ-changes across all test variables.
Figure 2.
Spearman correlation relationships between Pre–Post Δ-changes in youth volleyball players.
Within the experimental group, all principal biomechanical, field-based, and repeated-jump variables showed favourable pre–post changes. For the RCMJ biomechanical indicators, CMJ height increased from 32.60 ± 2.66 cm to 36.48 ± 3.07 cm (Δ = 3.88 ± 0.44 cm), take-off force from 1.05 ± 0.07 kN to 1.17 ± 0.08 kN (Δ = 0.12 ± 0.01 kN), maximum concentric power from 44.37 ± 4.05 kW to 50.19 ± 4.51 kW (Δ = 5.82 ± 0.63 kW), peak speed from 2.66 ± 0.15 m·s−1 to 2.95 ± 0.17 m·s−1 (Δ = 0.29 ± 0.03 m·s−1), and the Endurance Index from 1.14 ± 0.06 to 1.30 ± 0.07 (Δ = 0.15 ± 0.02).
Similarly, all field-based jump tests improved after the intervention. Running vertical jump performance increased by 5.73 ± 1.83 cm, pure vertical jump height by 3.87 ± 1.51 cm, the Ucchelli coefficient by 0.06 ± 0.03, standing long jump distance by 30.47 ± 6.07 cm, and Abalakov jump height by 5.47 ± 1.19 cm.
Positive changes were also observed in the repeated-jump endurance tests. Repeated two-leg jump performance increased by 3.73 ± 1.79, repeated run-up jump performance by 3.20 ± 1.86, and repeated hurdle jump performance by 4.93 ± 0.80. In the spike-jump endurance test, the number of errors decreased from 9.87 ± 1.77 to 8.07 ± 1.16 (Δ = −1.80 ± 0.86), indicating improved sport-specific jump endurance. Full descriptive statistics are presented in Table 4.
Table 4.
Descriptive statistics of pre–post outcomes and mean Δ-changes in vertical jump, biomechanical and endurance indicators in the experimental group.
Correlation analysis revealed strong positive associations among the principal biomechanical variables obtained from the RCMJ test. Specifically, CMJ height was significantly correlated with take-off force (r = 0.945), maximum concentric power (r = 0.864), peak speed (r = 0.811), and the Endurance Index (r = 0.852; all p < 0.001). These findings indicate that improvements in jump height were accompanied by parallel improvements in force production, movement velocity, and repeated-jump stability.
Several significant associations were also identified between the field-based and endurance-related tests. Running vertical jump performance was positively associated with pure vertical jump height (r = 0.686, p = 0.0048), whereas pure vertical jump height showed negative correlations with repeated standing jump performance (r = −0.597, p = 0.019) and repeated hurdle jump performance (r = −0.542, p = 0.037). In addition, repeated standing jump performance was positively associated with spike-jump endurance (r = 0.592, p = 0.020). Overall, these results suggest that training-induced biomechanical adaptations were closely linked with selected practical and endurance-related manifestations of jumping performance.
Because multiple pairwise correlations were examined, false discovery rate (FDR) correction according to the Benjamini–Hochberg procedure was applied to the correlation p-values. The main correlation patterns remained statistically significant after correction. Detailed pairwise Δ-correlations, including raw p-values, FDR-adjusted p-values, and 95% confidence intervals, are presented in Table 5.
Table 5.
Correlations between training-induced changes (Δ): Pearson’s correlation coefficients (r), raw p-values, FDR-adjusted p-values, and 95% confidence intervals (CI).
Figure 1 presents a heatmap of the Pearson correlation matrix illustrating the interrelationships between the training-induced changes (Δ). The colour gradient reflects both the strength and direction of the correlations, ranging from −1 to +1. The strongest positive associations were observed between the following variable pairs: Test 1.1–Test 1.2 (r = 0.94), Test 1.1–Test 1.3 (r = 0.86), Test 1.2–Test 1.3 (r = 0.83), and Test 1.1–Test 1.5 (r = 0.85), all of which are represented by darker colour tones on the heatmap. High positive correlations were also recorded for the Test 1.3–Test 1.5 (r = 0.82) and Test 1.4–Test 1.5 (r = 0.76) pairs.
For the field-based tests, positive correlations were observed between Test 2.1 and Test 2.2 (r = 0.69) and between Test 2.3 and Test 3.3 (r = 0.67). In contrast, several negative correlations were identified, particularly between Test 2.2 and Test 3.1 (r = −0.60) and between Test 2.2 and Test 3.3 (r= −0.54). The remaining variable pairs demonstrated weak-to-moderate associations.
Figure 2 presents a colour-coded Spearman correlation heatmap illustrating the monotonic relationships between Δ-values (Post–Pre) in the youth volleyball players. The colour scale ranges from −1 to +1, representing negative and positive monotonic associations, respectively.
The results of the Spearman analysis revealed a structural pattern similar to that observed in the Pearson correlations. In particular, strong positive monotonic associations were clearly evident on the heatmap among Test 1.1, Test 1.2, Test 1.3, Test 1.4 and Test 1.5 (κ = 0.75–0.95). Negative associations were also identified between Test 2.2 and both Test 3.1 and Test 3.3, which were reflected as negative values on the colour scale.
3. Discussion
The present study examined the effects of an eight-week plyometric training programme on jump biomechanics, field-based jump performance, and repeated-jump endurance in 13–14-year-old volleyball players. Overall, the findings showed that the experimental group demonstrated greater improvements over time than the control group across the principal biomechanical, practical, and repeated-jump endurance indicators. The significant Group × Time interaction effects suggest that the applied plyometric programme induced additional adaptations beyond those achieved through regular volleyball training alone. Nevertheless, these findings should be interpreted with appropriate caution because baseline differences were present between the groups and the sample size was relatively small.
The most consistent effects were observed in the RCMJ biomechanical variables recorded with the G-Walk system. Significant interaction effects for CMJ height, take-off force, maximum concentric power, peak speed, and Endurance Index indicate that the intervention improved several components of jump-related performance simultaneously. These changes are compatible with improved stretch–shortening cycle efficiency, more effective neuromuscular activation, and better force–velocity organisation during repeated jumping actions [9,10,14]. The particularly pronounced effects for peak speed and Endurance Index may suggest improvements not only in explosive output, but also in the stability of repeated-jump execution.
The field-based jump tests also demonstrated significant Group × Time interaction effects across all analysed outcomes. This indicates that the performance gains observed under instrument-based conditions were also transferred to more applied sport-related tasks. The largest improvements were observed in the standing long jump and the running two-leg vertical jump, suggesting enhanced lower-limb explosive performance under conditions more closely related to volleyball movement demands. Improvements in the pure vertical jump and Abalakov tests further support the practical relevance of the applied training programme.
Similarly, all repeated-jump endurance indicators showed significant interaction effects. This is an important finding because volleyball performance depends not only on maximal jump height, but also on the ability to reproduce explosive actions repeatedly during training and match play. The largest effect was observed in the repeated hurdle jump test, which may indicate improved tolerance to repeated explosive loading. In addition, the reduction in errors in the spike-jump endurance test in the experimental group suggests improved fatigue resistance and greater stability of sport-specific jump execution.
The correlation analysis was included to explore the internal structure of training-induced adaptations. The strongest positive associations were observed among the principal RCMJ biomechanical variables, which supports the interpretation of vertical jumping as an integrated force–velocity profile rather than as a set of isolated characteristics [15,17]. However, these associations should be interpreted cautiously. Variables such as jump height, force, power, speed, and Endurance Index are mechanically related, and some of the observed correlations may partly reflect mathematical coupling because several of these indices are derived from closely related movement signals. Therefore, these results are better interpreted as evidence of an integrated biomechanical response pattern than as proof of fully independent physiological mechanisms.
A smaller number of significant relationships were also identified between biomechanical, field-based, and repeated-jump endurance measures. These associations suggest that some adaptations detected in the RCMJ test may be functionally linked with practical and endurance-related manifestations of jumping performance. At the same time, these relationships were not universal across all outcomes, which indicates that biomechanical indicators and field-based tests represent related, but not identical, dimensions of adaptation. In this context, the negative correlations identified between pure vertical jump height and some endurance-related variables may reflect differences in the relationship between maximal jump capacity and the ability to sustain repeated efforts, rather than indicating a clear physiological trade-off.
Because multiple pairwise correlations were examined, false discovery rate correction using the Benjamini–Hochberg procedure was applied, and the principal association patterns remained statistically significant after correction. Nevertheless, the Δ-correlation analysis was based only on the experimental group (n = 15), and even relatively high coefficients should be interpreted cautiously. Accordingly, these findings should be viewed as exploratory and hypothesis-generating rather than definitive.
The practical value of the study lies in the combined use of biomechanical, field-based, and repeated-jump endurance assessments in a youth volleyball population. This integrated approach may be useful for coaches because it links laboratory-oriented indicators with applied sport-specific outcomes. In particular, the integration of repeated-jump endurance testing with biomechanical profiling appears to provide a broader picture of jump-related adaptation than either approach alone.
At the same time, the biomechanical findings should be interpreted within the methodological limits of the G-Walk system. Although the device is practical and portable for field-based monitoring, it does not directly measure ground reaction force in the same way as a force platform. Accordingly, take-off force and maximum concentric power should be regarded as algorithm-derived estimates based on IMU-recorded signals rather than as direct kinetic measurements. These variables are therefore more suitable for monitoring relative changes over time than for making absolute kinetic interpretations in explosive vertical tasks.
Several limitations should also be acknowledged. First, the sample size was relatively small, which limited precision and generalisability, even though post hoc power analysis suggested favourable achieved power for representative interaction effects. Second, baseline differences were present between the groups, especially in some biomechanical variables; therefore, the main interpretation of the intervention effect was based on Group × Time interaction effects rather than simple post-test comparisons. Third, all participants belonged to a single age group and one sport discipline, which restricted extrapolation to other populations. In addition, at 13–14 years of age, jumping technique, motor coordination, and neuromuscular control are still developing. Although all participants were familiar with volleyball-specific jumping tasks and were assessed under standardised conditions, age-related variability in technique and coordination could not be fully excluded.
Overall, the present findings suggest that a structured plyometric training programme may improve jump biomechanics, practical jump performance, and repeated-jump endurance in youth volleyball players. However, these conclusions should be interpreted in light of the baseline differences, the modest sample size, and the methodological limitations of IMU-derived force- and power-related variables. Future studies should include larger and more diverse samples and further examine how jump-related adaptations relate to match performance, fatigue, movement quality, and injury-related risk factors.
4. Materials and Methods
4.1. Participants
The study involved 30 male volleyball players aged 13–14 years. All participants were healthy, regularly attended organised volleyball training sessions, and had no injuries or medical contraindications affecting participation in jumping exercises. Before the intervention, all athletes underwent baseline assessment of age, body height, body mass, body mass index, and initial jump-related functional indicators.
The participants were assigned to the experimental group (EG, n = 15) and the control group (CG, n = 15) according to the following criteria: belonging to the same age range (13–14 years), medical fitness for full participation in training, regular involvement in volleyball practice, adequate training attendance, and the ability to complete the full study protocol. In addition, physical development level and baseline jump-performance indicators were considered during group allocation. On this basis, those athletes who were able to safely and fully complete the additional plyometric training programme were included in the experimental group, whereas the control group consisted of players who continued their usual volleyball training routine without the additional plyometric intervention.
At the same time, baseline testing showed that in some variables the experimental group demonstrated higher initial values than the control group. Therefore, the main analytical emphasis of the study was placed not only on final between-group differences, but also on within-group pre–post changes and the Group × Time interaction effect.
4.2. Anthropometric Assessment
Before implementing the training programme, the baseline level of physical development of all participants was assessed, and the comparability of the groups at baseline was verified. Body height (cm), body mass (kg), and body mass index (BMI, kg/m2) were measured for each participant. All anthropometric assessments were performed in accordance with the methodology recommended by the World Health Organisation [WHO, 2024]. The anthropometric characteristics of the participants are presented in Table 6.
Table 6.
Anthropometric characteristics of the participants.
After defining the composition of the participants and the inclusion criteria, the study design and the overall structure of the training programme developed for the experimental group were established. The research design and the content of the training intervention are described in detail below.
4.3. Description of the Research Design and Training Programme
The present study employed a pre–post controlled experimental design. Thirty male volleyball players aged 13–14 years were assigned to either an experimental group or a control group. In addition to their regular volleyball practice, the experimental group completed a structured 8-week jump-oriented plyometric training programme performed three times per week. The quantitative characteristics, progression, and monitoring procedures of this programme are presented in Table 7. The intervention was designed to progressively develop explosive strength, vertical jump ability, and repeated-jump endurance through age-appropriate bilateral, unilateral, reactive, and volleyball-specific jumping exercises. The control group continued its usual volleyball training programme, including technical–tactical drills, general physical preparation, and routine game-based exercises, but did not perform the additional structured plyometric intervention.
Table 7.
Summary of the main parameters of the training programme.
Training sessions were conducted three times per week, with each session lasting 75–85 min and consisting of a 12–15 min preparatory part, a 35–45 min main plyometric part, and a 5–8 min concluding part. The programme was organised according to a 3:1 loading model and was progressively adjusted in accordance with the athletes’ technical preparedness and age. Training load monitoring included the number of ground contacts, exercise type, heart rate (HR), and session rating of perceived exertion (sRPE).
4.4. Warm-Up Protocol
To ensure both measurement accuracy and participant safety, a standardised warm-up protocol was applied prior to all tests. Before each testing session, participants completed a 10-min standard warm-up routine. The warm-up consisted of the following components: 3–4 min of light jogging, 3–4 min of dynamic stretching exercises, and 3–4 min of low-amplitude bilateral jumps and amortisation movements. This warm-up procedure was performed under identical conditions for all tests and was designed to prepare the muscles for activity while enhancing the reliability of performance outcomes. The use of a uniform warm-up protocol helped minimise the influence of external factors and strengthened the comparability of the results.
4.5. Vertical Jump Performance Analysis
After baseline anthropometric characteristics had been recorded, assessment proceeded to the measurement of biomechanical variables related to vertical jumping performance. In both the experimental and control groups, the principal biomechanical parameters of vertical jumping were evaluated using the Repeated Countermovement Jump (RCMJ) test performed with the G-Walk inertial measurement system (BTS Bioengineering, Garbagnate Milanese, Italy). The G-Walk is a compact wearable inertial measurement unit (IMU) that combines a triaxial accelerometer, gyroscope, and magnetometer for the analysis of human movement. The system is designed to capture acceleration, angular velocity, and spatial orientation during dynamic motor tasks, thereby enabling the assessment of kinematic and selected biomechanical parameters in real training and testing environments. Compared with laboratory-based force platforms and optical motion-capture systems, G-Walk provides a portable and practical solution for field-based evaluation of jump performance.
In the present study, the G-Walk system was applied to assess CMJ height, take-off force, maximum concentric power, peak speed, and Endurance Index during the RCMJ test. This approach allowed objective monitoring of movement velocity, jump-related performance, and repeated-jump stability in youth volleyball players. The use of countermovement-type jump testing and inertial-sensor-based assessment is supported by previous studies demonstrating acceptable validity and reliability for the evaluation of jump height and related performance characteristics [15,16,18,19].
It should be noted that the G-Walk system does not directly measure ground reaction force in the same way as a force platform. Therefore, variables such as take-off force and maximum concentric power reported in the present study should be interpreted as algorithm-derived estimates generated by the device software on the basis of inertial-sensor signals recorded during the RCMJ task. In this context, the G-Walk system was used as a practical field-based tool for the comparative assessment of jump-related performance changes over time rather than as a direct laboratory-standard force measurement system. Although previous studies have reported acceptable reliability and practical usefulness of inertial measurement systems for jump assessment, caution is warranted when interpreting force- and power-related values in explosive vertical tasks, as their validity may be lower than that obtained with force platforms.
For the RCMJ assessment, each participant started from an upright standing position with the feet placed shoulder-width apart. The hands were kept in a standardised position according to the device’s testing protocol to minimise inter-trial variation. After a preparatory countermovement, the athlete performed repeated maximal bilateral jumps with the shortest possible ground-contact time. One familiarisation trial was provided before formal testing. The formal test was performed once under standardised conditions, and the variables automatically generated by the G-Walk software (version 3.5.25) were used for statistical analysis.
The recorded parameters included the following:
Test 1.1. CMJ Height (cm)—height of the countermovement jump performed bilaterally;
Test 1.2. Take-off Force (kN)—maximal reactive force produced during the take-off phase;
Test 1.3. Maximum Concentric Power (kW)—explosive muscular power output during the concentric phase;
Test 1.4. Peak Speed (m·s−1)—maximal movement velocity in the propulsion phase;
Test 1.5. Endurance Index—an integrated indicator reflecting the stability of force and velocity across repeated jumps.
These indicators provided an objective field-based evaluation of jump-related performance, take-off mechanics, and performance stability during repeated jumping tasks. However, force- and power-related outputs should be interpreted as estimated indices derived from IMU-based data processing rather than as direct kinetic measurements.
4.6. Jump Performance Tests
To complement the biomechanical data, a series of conventional jump performance tests was also administered. Five different jump tests were used to assess jumping ability and explosive strength in youth volleyball players. All tests were conducted under standardised volleyball-specific indoor conditions. Before data collection, all athletes received a standardised verbal explanation and a practical demonstration of each test. One familiarisation attempt was allowed for each test. Thereafter, each test was performed three times, with 60–90 s of passive rest between attempts, and the best result was included in the final analysis. The selection of these field-based jump tests was based on their broad use in youth and team-sport populations, with previous studies reporting acceptable validity and reliability for the assessment of lower-limb explosive performance [4,15,16,17,21].
- Test 2.1. Running the two-leg vertical jump test:
The participant started from a standing position at a standardised distance from the wall-mounted measuring panel, approached the target with a short run-up of 2–3 steps, performed a two-leg take-off, and touched the panel at the highest possible point. Jump height was recorded in centimetres. Three trials were performed, and the best result was retained for analysis. This test assesses maximal vertical jump height and reflects explosive strength and the efficiency of the locomotor system.
- Test 2.2. Pure vertical jump height test:
The athlete started from an upright standing position facing the measuring surface and first reached upward while standing on the forefeet to establish the initial reference point (Point A). He then performed a maximal vertical jump from a stationary bilateral take-off and touched the highest possible point (Point B). Three trials were completed, and the best result was used for analysis. The net jump height was calculated using the formula: ∆h = B − A.
This test indicates the effectiveness of the stretch-shortening cycle.
- Test 2.3. Relative jump coefficient (Ucchelli test):
This coefficient assesses jump height relative to body height and is calculated as:
The coefficient was calculated from the best vertical jump attempt obtained in Test 2.2. Values between 1.28 and 1.32 were interpreted as good, whereas values > 1.32 were considered excellent.
- Test 2.4. Standing long jump test:
The athlete started from a stationary standing position behind the take-off line, with the feet approximately shoulder-width apart. Using a rapid arm swing and bilateral take-off, he performed a maximal horizontal jump forward. The landing had to be completed on both feet without falling backwards. Three trials were performed, and the longest valid distance, measured from the take-off line to the nearest heel contact, was included in the analysis. This test evaluates horizontal explosive strength and inter-muscular synchronisation.
- Test 2.5. Abalakov method:
This is considered one of the most accurate methods for assessing vertical jump height. The participant first touched the wall in a fully extended position while standing on the forefeet (H_reach), and then performed a maximal vertical jump, and touched the wall again (H_jump). Net jump height was calculated as: ∆h = H_jump − H_reach. The test was performed three times from a stationary standing position with the use of arm swing, and the best result was retained for analysis. Previous research has shown that CMJ- and Abalakov-type jump tests demonstrate good reliability and validity in athletic populations [15,16].
Collectively, these tests provided a comprehensive assessment of athletes’ explosive power, coordination, and the effectiveness of the stretch-shortening mechanism.
4.7. Jump-Endurance Tests
Since jumping ability in volleyball is not limited to achieving maximal height but must also be sustained over time, a set of tests was included to evaluate jump endurance. The following tests were administered: All endurance tests were explained in advance, and one submaximal familiarisation trial was provided when necessary. Each endurance test was performed once because of the fatiguing nature of the protocol, and the recorded performance in that formal trial was used for statistical analysis.
- Test 3.1. Repeated two-leg jump to “optimal” height from a standing position:
The athlete started from an upright standing position under the target marker, with the feet placed shoulder-width apart. He then performed repeated bilateral vertical jumps to reach a target positioned 1 m above his individual standing reach height. The test outcome was the number of correctly completed jumps performed without a substantial decline in technique.
- Test 3.2. Repeated run-up jump test:
The athlete began from a standardised starting mark, performed repeated approach jumps with a short run-up, and attempted to touch a target line positioned 10 cm below his individual maximal jump height. The test continued until volitional exhaustion or until the athlete could no longer reach the required target height. The total number of successful repetitions was recorded.
- Test 3.3. Repeated hurdle jump test:
The athlete started in a standing position next to the hurdle and repeatedly performed lateral bilateral jumps over a hurdle adjusted to 75% of his maximal jump height. The test ended when the rhythm of execution was disrupted or when the athlete failed to clear the hurdle correctly. The number of successful repetitions was recorded.
- Test 3.4. Spike-jump endurance test:
During a 3-min protocol (12 spike actions per minute), the athlete alternately performed spike jumps toward two designated targets under standardised timing conditions. The initial position, movement sequence, and tempo were identical for all participants. Performance was evaluated by counting the number of inaccurate or unsuccessful attempts, with lower values indicating better specific jump endurance.
Collectively, these tests were used to assess the stability of athletes’ jumping and spiking performance under repeated loading. The inclusion of both standardised jump tests and volleyball-specific repeated-jump tasks was intended to improve the ecological validity of the assessment and to reflect both maximal explosive performance and fatigue resistance under sport-relevant conditions [4,17].
4.8. Statistical Analysis
All statistical analyses were performed using JASP, the Numiqo Statistics Calculator platform (available online: https://numiqo.com, accessed on 19 November 2025), and MATLAB R2024b software (MathWorks, Natick, MA, USA). Descriptive statistics were calculated for all variables and are presented as mean ± standard deviation (SD). In addition, ranges and 95% confidence intervals (CI) were computed where appropriate.
To evaluate intervention-related changes over time, the principal outcome variables were analysed using a two-way mixed analysis of variance (ANOVA), with Group (experimental vs. control) as the between-subject factor and Time (Pre-test vs. Post-test) as the within-subject factor. The primary effect of interest was the Group × Time interaction, which was used to determine whether the magnitude of change over time differed significantly between the two groups. This analytical approach was selected because baseline differences were observed in some variables and simple post-test between-group comparisons were therefore considered insufficient for interpreting intervention effects.
To further support interpretation of the achieved sample size, a post hoc power analysis was conducted in G*Power version 0.96.0.0 using the repeated-measures ANOVA within–between interaction model, with α = 0.05, a total sample size of 30, 2 groups, and 2 measurements. For a representative field-based outcome with the smallest interaction effect among these tests, namely the relative jump coefficient (Ucchelli test; f = 0.492), the achieved power was 0.999.
Correlation analysis was performed to explore the relationships among training-induced changes, using Δ values (Post−Pre) calculated within the experimental group. Pearson’s correlation coefficient (r) was used as the primary index to assess linear associations among the variables. Spearman’s rank correlation coefficient was additionally calculated to evaluate the robustness of the observed association patterns under a rank-based, non-parametric approach that is less sensitive to non-normality and potential outliers. For each variable pair, the correlation coefficient, p-value, and 95% confidence interval were calculated.
Because multiple pairwise correlations were examined, false discovery rate (FDR) correction according to the Benjamini–Hochberg procedure was applied to the correlation p-values. Accordingly, both raw and FDR-adjusted p-values were considered when interpreting the correlation results. The magnitude of correlation coefficients was interpreted according to commonly accepted thresholds: r < 0.30, weak; 0.30–0.49, moderate; 0.50–0.69, substantial; and ≥0.70, strong association.
Given the relatively small sample size for the Δ-correlation analysis, these correlation findings were interpreted cautiously and considered exploratory in nature. The level of statistical significance was set at α = 0.05. To facilitate visual interpretation of the association structure, Pearson and Spearman correlation matrices were additionally presented as heatmaps.
5. Conclusions
The present study indicates that an eight-week structured plyometric training programme may improve jump-related biomechanical characteristics, field-based jump performance, and repeated-jump endurance in 13–14-year-old volleyball players. In the present sample, the experimental group showed greater changes over time than the control group across the principal RCMJ, field-based, and repeated-jump endurance outcomes.
These findings support the practical value of combining biomechanical, field-based, and repeated-jump endurance assessments when monitoring jump-related adaptations in youth volleyball players. In particular, the integration of repeated-jump endurance testing with biomechanical profiling appears to provide a broader perspective on performance development than the use of isolated jump measures alone.
However, these conclusions should be interpreted with caution. Baseline differences were present between the groups, the sample size was relatively small, and the force- and power-related variables obtained from the G-Walk system should be regarded as IMU-derived estimates rather than direct force-platform measurements. In addition, the correlation findings should be considered exploratory and supportive rather than definitive.
Overall, the present results suggest that a structured plyometric programme, combined with inertial-sensor-based monitoring and practical field testing, may represent a useful applied approach for tracking relative changes in jump performance and repeated-jump capacity in adolescent volleyball players. Future research should include larger and more diverse samples, stronger control of baseline comparability, and further examination of the relationships among jump performance, movement quality, fatigue, and match-related outcomes.
Author Contributions
Conceptualization, D.M. and N.T.; methodology, D.M.; validation, D.M., N.T. and A.I.; formal analysis, D.M.; investigation, D.M.; resources, N.T. and A.I.; data curation, D.M.; writing—original draft preparation, D.M.; writing—review and editing, D.M., N.T. and A.I.; visualization, D.M.; project administration, D.M.; funding acquisition, N.T. All authors have read and agreed to the published version of the manuscript.
Funding
This research received no external funding.
Institutional Review Board Statement
The study was conducted in accordance with the Declaration of Helsinki, and approved by the Institutional Review Board of Turan International University (protocol code 2/09, 10 September 2024).
Informed Consent Statement
Informed consent was obtained from all subjects involved in the study.
Data Availability Statement
The datasets analyzed in this study are available from the corresponding author upon reasonable request, subject to appropriate ethical approvals and data sharing agreements.
Acknowledgments
The authors would like to express their sincere gratitude to the coaches and administration of Sports School No. 1 and Sports School No. 2 of Yunusabad District, Tashkent City, for their organizational support and cooperation during the implementation of the training and testing procedures. The authors also thank the participating youth volleyball players for their commitment and active involvement in the study. During the preparation of this manuscript, the authors used ChatGPT (GPT-5.2) to assist with language editing and improvement of academic style. The authors reviewed and edited the generated output and take full responsibility for the content of this publication.
Conflicts of Interest
The authors declare no conflicts of interest.
Abbreviations
The following abbreviations are used in this manuscript:
| BMI | Body Mass Index |
| CG | Control Group |
| CI | Confidence Interval |
| CMJ | Countermovement Jump |
| EG | Experimental Group |
| RCMJ | Repeated Countermovement Jump |
| SSC | Stretch–Shortening Cycle |
| WHO | World Health Organisation |
References
- Ramirez-Campillo, R.; Andrade, D.C.; Nikolaidis, P.T.; Moran, J.; Clemente, F.M.; Chaabene, H.; Comfort, P. Effects of plyometric jump training on vertical jump height of volleyball players: A systematic review with meta-analysis of randomized-controlled trials. J. Sports Sci. Med. 2020, 19, 489–499. [Google Scholar] [PubMed]
- Silva, A.F.; Clemente, F.M.; Lima, R.; Nikolaidis, P.T.; Rosemann, T.; Knechtle, B. The effect of plyometric training in volleyball players: A systematic review. Int. J. Environ. Res. Public Health 2019, 16, 2960. [Google Scholar] [CrossRef] [Scilit] [PubMed]
- Pawlik, D.; Mroczek, D. Fatigue and training load factors in volleyball. Int. J. Environ. Res. Public Health 2022, 19, 11149. [Google Scholar] [CrossRef] [Scilit]
- Lima, R.F.; Palao, J.M.; Clemente, F.M. Jump performance during official matches in elite volleyball players: A pilot study. J. Hum. Kinet. 2019, 67, 259–269. [Google Scholar] [CrossRef] [Scilit]
- Mori, Y.; Yamada, Y.; Umezaki, S.; Kida, N.; Nomura, T. A study on the number of jumps and jump height in volleyball: From a mock game of college men players. Adv. Phys. Educ. 2022, 12, 1–10. [Google Scholar] [CrossRef]
- Oliveira, J.P.; Marinho, D.A.; Jacinto, P.; Sampaio, T.; Morais, J.E. Characterization of physical performance and change of direction deficit across age groups in young female volleyball players. BMC Sports Sci. Med. Rehabil. 2025, 17, 209. [Google Scholar] [CrossRef] [Scilit]
- Cherni, Y.; Hammami, M.; Jelid, M.C.; Aloui, G.; Suzuki, K.; Shephard, R.J.; Chelly, M.S. Neuromuscular adaptations and enhancement of physical performance in female basketball players after 8 weeks of plyometric training. Front. Physiol. 2021, 11, 588787. [Google Scholar] [CrossRef] [Scilit]
- Mănescu, D.C. Computational analysis of neuromuscular adaptations to strength and plyometric training: An integrated modeling study. Sports 2025, 13, 298. [Google Scholar] [CrossRef] [Scilit]
- Davies, G.; Riemann, B.L.; Manske, R. Current concepts of plyometric exercise. Int. J. Sports Phys. Ther. 2015, 10, 760–786. [Google Scholar] [PubMed]
- Seiberl, W.; Hahn, D.; Power, G.A.; Fletcher, J.R.; Siebert, T. Editorial: The stretch–shortening cycle of active muscle and muscle–tendon complex: What, why and how it increases muscle performance? Front. Physiol. 2021, 12, 693141. [Google Scholar] [CrossRef] [Scilit]
- Asadi, A.; Arazi, H.; Ramirez-Campillo, R.; Moran, J.; Izquierdo, M. Influence of maturation stage on agility performance gains after plyometric training: A systematic review and meta-analysis. J. Strength Cond. Res. 2017, 31, 2609–2617. [Google Scholar] [CrossRef] [Scilit]
- Faigenbaum, A.D.; McFarland, J.E.; Keiper, F.B.; Tevlin, W.; Ratamess, N.A.; Kang, J.; Hoffman, J.R. Effects of a short-term plyometric and resistance training program on fitness performance in boys aged 12–15 years. J. Sports Sci. Med. 2007, 6, 519. [Google Scholar]
- Drazic-Beni, D.; Lagos-Hernández, R.; Bruneau-Chávez, J. Effects of plyometric training on sports performance in team sports: A literature review. MHSalud 2025, 22, e17522. [Google Scholar] [CrossRef] [Scilit]
- Granacher, U.; Puta, C.; Gabriel, H.H.; Behm, D.G.; Arampatzis, A. Neuromuscular training and adaptations in youth athletes. Front. Physiol. 2018, 9, 1264. [Google Scholar] [CrossRef] [Scilit]
- Kyne, H.; Cronin, J.B. Beyond jump height: A comparison of concentric variables in the squat jump, countermovement jump and drop jump for athletic profiling. Sports 2025, 13, 379. [Google Scholar] [CrossRef] [Scilit]
- Conceição, F.; Lewis, M.; Lopes, H.; Fonseca, E.M.M. An evaluation of the accuracy and precision of jump height measurements using different technologies and analytical methods. Appl. Sci. 2022, 12, 511. [Google Scholar] [CrossRef] [Scilit]
- Ikeda, Y.; Sasaki, Y.; Hamano, R. Factors influencing spike jump height in female college volleyball players. J. Strength Cond. Res. 2018, 32, 267–273. [Google Scholar] [CrossRef] [Scilit] [PubMed]
- Thapa, R.K.; Kumar, G.; Kundu, G.; Yadav, P.; Sortwell, A.; Ramirez-Campillo, R. Intra- and inter-session reliability of countermovement jump and gait analysis in collegiate athletes measured using an inertial measurement unit (BTS G-Walk). Montenegrin J. Sports Sci. Med. 2024, 13, 37–47. [Google Scholar] [CrossRef] [Scilit]
- Donisi, L.; Pagano, G.; Cesarelli, G.; Coccia, A.; Amitrano, F.; D’Addio, G. Benchmarking between two wearable inertial systems for gait analysis based on a different sensor placement using several statistical approaches. Measurement 2021, 173, 108642. [Google Scholar] [CrossRef] [Scilit]
- Medeni, Ö.Ç.; Turgut, E.; Çolakoğlu, F.F.; Baltaci, G. Plyometric training combined with jump rope training in female adolescent volleyball players. Turk. Klin. J. Health Sci. 2019, 4, 261–268. [Google Scholar] [CrossRef] [Scilit]
- Markovic, G.; Dizdar, D.; Jukic, I.; Cardinale, M. Reliability and factorial validity of squat and countermovement jump tests. J. Strength Cond. Res. 2004, 18, 551–555. [Google Scholar] [PubMed]

Disclaimer/Publisher’s Note: The statements, opinions and data contained in all publications are solely those of the individual author(s) and contributor(s) and not of MDPI and/or the editor(s). MDPI and/or the editor(s) disclaim responsibility for any injury to people or property resulting from any ideas, methods, instructions or products referred to in the content. |
© 2026 by the authors. Licensee MDPI, Basel, Switzerland. This article is an open access article distributed under the terms and conditions of the Creative Commons Attribution (CC BY) license.