


Abstract
Documented skeletal collections provide many of the samples necessary for forensic anthropological research, including the creation and validation of skeletal analytical methods. Although modern collections are considered more representative of the current living population, they often differ significantly from each other by geographic location, organization, and procurement strategies. As these factors influence which donors are included in a particular collection, they also create collection-specific sample bias. This research aims to identify how that bias impacts skeletal variation across collections and whether it obscures normal patterns of human skeletal variation. Craniometric and demographic data were collected from a sample of individuals from eight modern United States-based documented skeletal collections (n = 1161). The results indicate that collection-specific sample bias influences average cranial morphology, but to a lesser extent than sex or population. Across analyses, samples consistently and preferentially clustered with individuals from similar population and sex groups rather than with individuals from the same collection of origin. These analyses suggest that normal patterns of human variation are not obscured by collection origin and that documented skeletal collections therefore remain valid and reliable sources of data for understanding population diversity and sex differences, even when some level of collection-specific bias is present.
1. Introduction
Documented skeletal collections are an integral component of research in biological anthropology, providing a testing ground for the creation and validation of methods utilized for skeletal analysis—the very bread and butter of our discipline (Campanacho et al., 2021; de la Cova, 2021; Henderson, 2018). Considering their importance to research and the methods used in casework, we need to understand if these collections are representative of the population or if they are intrinsically biased.
Proper research protocols emphasize the importance of a representative sample to ensure reliability and validity in study results (Sharman & Albanese, 2018; Singh & Masuku, 2014). Ideally, all individuals in a population would be included in a study; however, if this is impractical, probability sampling is recommended to ensure unbiased results and adequate representation (Smith, 2019). In biological anthropology, probability sampling may not be possible since we cannot randomly sample skeletons from a living population. Instead, we must use available sources, including documented skeletal collections, to conduct our research.
Documented skeletal collections are not representative of the living population for two main reasons. First, individuals do not have an equal probability of dying, except in unique cases like massacres or catastrophes (Albanese, 2018). Second, not all decedents have an equal likelihood of being included in a documented skeletal collection. Before the legalization of body donation and the enactment of the Uniform Anatomical Gift Act (UAGA) in 1968, most individuals in documented collections were those unclaimed by family members (de la Cova, 2019; Muller et al., 2017). This resulted in an over-representation of individuals from lower socioeconomic status (SES) groups of predominantly immigrant and minoritized populations (de la Cova, 2021; Sadler et al., 1968). For instance, African Americans make up over half of the entire Robert J. Terry Anatomical Collection yet represented less than 10% of St. Louis’s living population in the 1930s and 40s (de la Cova, 2019). Today, willed body donation is legal and less socially stigmatized; however, there are many individuals, often including those exploited by structural inequalities, who strongly oppose body donation for numerous reasons, including skepticism concerning body disfigurement, religious restrictions, and the historic victimization of donors by researchers (Christensen, 2006; Winburn et al., 2022). The result has been that older European American males represent the highest donation rate, a fact clearly reflected in the demographic compositions of United States-based documented collections (George et al., 2022; Gocha et al., 2022; Komar & Grivas, 2008; Winburn et al., 2022).
Additionally, although the UAGA has ended the reliance on unclaimed decedents as the primary source of skeletal collections, it has not prohibited their presence; several modern collections have historically accepted, or continue to accept, unclaimed decedents (Christensen, 2006). While many forensic anthropologists prefer that collections refrain from accepting unclaimed decedent status (Armelli et al., 2025), the practice remains legal, and these individuals continue to comprise samples used for biological anthropological research. These factors have culminated in biased historic and modern collections, which have demographic compositions that do not reflect either state or national census populations (Albanese, 2018; Winburn et al., 2022).
Even among potential donors, there is an unequal likelihood of donation to any specific collection. Documented skeletal collections are often affiliated with medical schools, medical examiner’s offices, and/or outdoor decomposition facilities whose locations and professional networks impact which individuals are available for donation. Each collection also sets specific criteria for accepting potential donations. Factors like space limitations, resource constraints for processing donations, and restrictions based on donor characteristics (e.g., height, weight, active communicable diseases, unclaimed decedent, estranged next-of-kin) influence a curator’s decisions (Armelli et al., 2025). The individual procurement strategies of curators, such as targeting or avoiding specific demographic variables, can also influence the composition of a collection. A historic example of such targeting is Trotter’s attempt to balance the uneven sex distribution by prioritizing female donors in the Terry Collection (de la Cova, 2021; Sharman & Albanese, 2018). Ultimately, these factors impact which donors are included in a collection, resulting in unique samples—or collection-specific sample bias.
The question is no longer whether collection-specific sample bias exists—we know it does. The real question is whether this bias produces artificial “populations” within collections that mask genuine patterns of human skeletal variation, or patterns attributable to biological differences that reflect evolutionary or environmental processes. For instance, secular change studies have identified significant changes in skeletal proportions between historic and modern collections due to shifting genetic and environmental components over time (L. M. Jantz & Jantz, 2000; R. L. Jantz & Meadows Jantz, 2016; R. L. Jantz et al., 2016; Langley et al., 2016; Moore-Jansen, 1989; Spradley, 2008; Spradley et al., 2016). Many researchers argue these findings prove that historic collections are biased and should not be used for modern research (Sharman & Albanese, 2018). On the other hand, Albanese (2018) argues the impact of sample bias is not limited to historic collections and can also be documented across modern collections. If sample bias can impact our understanding of aggregate skeletal morphology, are documented skeletal collections valid and reliable sources for understanding population diversity, or do observed differences simply reflect collection sample structures?
To assess collection-specific sample bias and how it can impact our understanding of variation in skeletal morphology, documented skeletal collections from similar temporal periods and geographic regions with comparable population histories should be compared. Examining documented collections from similar contexts can reveal how collection-specific sample bias impacts skeletal morphology and whether that bias obscures true patterns of human skeletal variation, such as population differences. This study investigates the presence of collection-specific sample bias and the extent to which that bias may impact, or overwhelm, normal human skeletal variation, using data from eight modern documented skeletal collections from the United States.
2. Materials and Methods
2.1. Samples
Collection-specific sample bias was assessed using craniometric data for 1161 individuals from eight documented skeletal collections located across the United States (Table 1). Craniometric data are valid proxies of genetic markers due to measurable differences in geographic patterning, sexual dimorphism, plasticity, and secular change (L. M. Jantz & Jantz, 2000; Relethford, 2009; Sparks & Jantz, 2002), as well as anthropometric patterns not attributable to general human variation (Gordon & Bradtmiller, 1992; Utermohle & Zegura, 1982; Utermohle et al., 1983). Previous research investigating sample bias in documented skeletal collections also used metric data (Albanese, 2003; Moore-Jansen, 1989). Craniometric data for this study comprise 78 standard landmarks collected using a MicroScribe® G digitizer (Revware, 2023) and the 3Skull software program (Ousley, 2014). All data were collected by the first author (R.R.D.) to control for observer error between collection samples. To contextualize the data, demographic variables were requested from the individual institutions. These variables include age, birthplace, birth year, cause of death, height, location at time of death, occupation, sex, population, SES, type of donation (e.g., self-donation, next-of-kin donation), and year of death.
Table 1.
Skeletal samples used in this study, broken down by collection, population, and sex.
Documented skeletal collections were selected for inclusion based on their use in biological anthropological research, the collection’s standing as a modern skeletal collection (i.e., established after the UAGA and still accepting donations; (Campanacho et al., 2021)), geographic location, and whether access is permitted to visiting researchers (e.g., at the time of data collection, the Hamann–Todd Human Osteological Collection was closed to researchers for museum renovations). Ultimately, eight collections were included. Collection samples include adult crania unaffected by extensive pathology or trauma and having associated demographic information. For larger collections, where data collection for all individuals was not possible, simple random sampling was used to ensure the data represented the collection. Background information about each collection is provided below and presented in the order in which data were collected for this study.
The Maxwell Museum Documented Skeletal Collection (MMDSC)—Located in the Maxwell Museum of Anthropology at the University of New Mexico (UNM) in Albuquerque, New Mexico, the MMDSC was established in 1978. All donors were obtained through self-donation, next-of-kin donation, and/or transfers from the Department of Anatomy at UNM and the Office of the Medical Examiner (Komar & Grivas, 2008). The demographic composition of the MMDSC is primarily male (59%), middle-aged (mean age of 67), and European American (91.9%), followed by Hispanic and African American. For this study, craniometric data were collected from 246 individuals (females = 100; males = 146; see Table 1).
The University of Tennessee, Knoxville, Donated Skeletal Collection (UTK DSC)—Located in the Department of Anthropology at the University of Tennessee (UTK), Knoxville, in Knoxville, Tennessee, the UTK DSC is associated with the Anthropology Research Facility (established in 1981) and contains over 1800 individuals (as of April 2024). The UTK DSC historically accepted donations from medical examiner offices (Bass & Jefferson, 2003; Christensen, 2006), but currently only accepts donations from donors or donor families, free of cost and with transportation provided within 100 miles of UTK (Body Donation, 2024). The demographic composition of the UTK DSC is primarily male (64%), middle-aged (mean age of approximately 63), and European American (93%), followed by African American, Hispanic, Multiple (more than one population group reported), Native American, and Asian American (Winburn et al., 2022). For this study, the curator at the time of data collection, Dr. Dawnie Wolfe Steadman, provided a randomized list of 295 individuals with associated demographic information. Craniometric data were collected from 220 of these individuals (females = 109; males = 111; see Table 1). Of note, this sample only includes individuals donated after 2005 because donation forms were updated to include socioeconomic status information starting in 2006.
The Texas State Donated Skeletal Collection (TXSTDSC)—Located in the Forensic Anthropology Center at Texas State (FACTS) in San Marcos, Texas, the TXSTDSC is associated with the Forensic Anthropology Research Facility (FARF), established in 2008, and contains over 700 individuals (Gocha et al., 2022). All donations are from “living” donors (i.e., individuals who have pre-registered for donation upon their death; Gocha et al., 2022) or next-of-kin donations. FACTS does not accept unclaimed decedents or next-of-kin donations from estranged family members (Gocha et al., 2022). Similar to the UTK DSC, FACTS has a limited pick-up radius and can only provide free transportation up to 100 miles from the FARF (Gocha et al., 2022). The demographic composition of the TXSTDSC is primarily male (58%), middle-aged (mean age of 66), and European American (90%), followed by Hispanic, African American, Multiple, Native American, Asian, and Middle Eastern (Gocha et al., 2022). For this study, the current curator, Dr. Daniel J. Wescott, provided a random sample of 365 individuals. Craniometric data were collected from 250 of these individuals (females = 107; males = 143; see Table 1).
The John A. Williams Documented Human Skeletal Collection (JAWDHSC)—Located in the Department of Anthropology and Sociology at Western Carolina University in Cullowhee, North Carolina, the JAWDHSC is associated with the Forensic Osteology Research Station established in 2003. Apart from a few early donations, all donors are self-donations or next-of-kin donations (George et al., 2022). The demographic composition of the JAWDHSC includes a relatively balanced sex distribution and predominantly represents European Americans (91% as of May 2024; George et al., 2022). Of note, the JAWDHSC is only a two-hour-and-thirty-minute drive from UTK’s Anthropology Research Facility, which highlights the similar geographic region and research efforts between the two institutions. For this study, craniometric data were collected from a sample of 118 individuals (females = 59; males = 59; see Table 1).
The Western Michigan University Homer Stryker M.D. School of Medicine Skeletal Teaching and Research Series (WMed STARS)—Located at Western Michigan University Homer Stryker M.D. School of Medicine (WMed) in Kalamazoo, Michigan, the WMed STARS was established in 2014. The WMed STARS contains only individuals who have opted for permanent skeletal donation through WMed’s Body Donation Program. The WMed STARS primarily comprises males and European Americans (72% and 66%, respectively, as of May 2024). For this study, craniometric data were collected from a sample of 40 individuals (females = 12; males = 28; see Table 1).
The Michigan State University Forensic Anthropology Laboratory Donated Skeletal Collection (MSUFAL DSC)—Located in the Department of Anthropology at Michigan State University in East Lansing, Michigan, the MSUFAL DSC began accepting donations in 1996. Historically, the MSUFAL DSC accepted donations from local medical examiners but has stopped accepting donations that are not self- or next-of-kin donations; however, many donations are still coordinated through contacts at local medical examiner offices. As of September 2024, the demographic composition of the collection is primarily male (67%) and European American (75%), followed by African American (23%). For this study, craniometric data were collected from a sample of 37 individuals (females = 12; males = 25; see Table 1).
The Mann–Labrash Osteological Collection (MLOC)—Located in the Department of Anatomy, Biochemistry, and Physiology at the John A. Burns School of Medicine in Honolulu, Hawai’i, the MLOC contains over 350 individuals, with the first donation in 1974 (Mann et al., 2020). Approximately 50 complete skeletons are available for teaching and research; the remainder only include select elements, such as the skull (as of September 2024). All individuals housed within the collection are permanent donations through the Willed Body Program, following informed consent obtained from the donor or the donor’s family (Mann et al., 2020). Individuals within MLOC comprise diverse ancestries and ethnicities often not encountered in other United States-based documented skeletal collections, including many individuals of Asian and/or Pacific Island descent (Mann et al., 2020). For this study, craniometric data were collected from a sample of 100 individuals (females = 44; males = 56; see Table 1).
The Southeast Texas Applied Forensic Science Facility Donated Skeletal Collection (STAFS DSC)—Located at the Southeast Texas Applied Forensic Science Facility in Huntsville, Texas, the STAFS DSC was established in 2009 and contains over 450 individuals (STAFS Research, 2024). STAFS only accepts living donors or next-of-kin donations and is primarily male (67%), over 66 years of age (44%), and European American (84%), followed by African American, Hispanic, and Asian (STAFS Research, 2024). Of note, STAFS is approximately a three-hour drive from the TXSTDSC. Due to space constraints at STAFS, the collection is divided between STAFS and collection space on the Sam Houston State University main campus. For this study, craniometric data were collected from a sample of 150 individuals across both locations (females = 54; males = 96; see Table 1).
2.2. Statistical Methods
All statistical analyses were conducted in R version 4.3.2 (R Core Team, 2023), and the open-source code is available from the authors. To identify sources of collection-specific sample bias and to guide the interpretation of any patterns revealed during analysis of craniometric data, a series of chi-squared tests of independence and one-way analyses of variance (ANOVAs) were performed on the demographic variables from each of the eight collections. For significant ANOVA results, pairwise comparisons were assessed using post hoc Tukey HSD tests. Significant chi-squared results were further examined using standardized residuals, with Bonferroni-adjusted p-values. Demographic variables investigated include sex, population, age, height, birth year, year of death, birth state, state at time of death, and SES. These variables were not available for every collection or every individual, so sample sizes reflect these filtered analyses.
Twenty-nine interlandmark distances were selected for craniometric analysis to match the data commonly used in other forensic anthropological studies and to minimize missing values (Table 2). However, some missing data remain. Because complete observations are necessary for multiple analyses, missing values were imputed by variable using the ’mice’ package and the predictive mean matching approach, an appropriate method for imputing continuous craniometric data (Azur et al., 2011; Kamnikar et al., 2021; van Buuren & Groothuis-Oudshoorn, 2011). Five iterations of the ’mice’ algorithm were used, and convergence was assessed by plotting trace lines. Following imputation, box plots, pairwise plots, and Cook’s distance were used to detect potential outliers and to assess the goodness-of-fit of the imputation process. Following imputation, the craniometric data were standardized by scaling and centering each variable (adjusting the mean to 0 and the standard deviation to 1), ensuring comparability and equal contribution of all variables to the model.
Table 2.
Interlandmark distances (and their abbreviations) used throughout the analyses.
Inter- and intraobserver error tests were performed on the craniometric dataset. For interobserver error testing, interlandmark distances from 41 individuals housed in the MMDSC were provided by the Forensic Anthropology Data Bank (R. L. Jantz, 2019). For intraobserver error testing, five individuals were randomly selected and re-digitized by the first author (R.R.D.). Overall error was assessed using intraclass correlation coefficients (ICCs). A two-way random-effects model with absolute agreement was used for interobserver error testing; a two-way random-effects model with consistency was used for intraobserver error testing.
To assess variation in cranial morphology and how it differs by collection, a series of one-way multivariate analyses of variance (MANOVAs), two-way MANOVAs, and two-way multivariate analyses of covariance (MANCOVAs) were conducted. These models quantified the impact of collection and other demographic variables (e.g., sex, population) on cranial morphology. A Pillai trace test statistic was used for each MANOVA and MANCOVA, as it provides more robust results in the case of violations of the homogeneity of variance–covariance assumption (Ateş et al., 2019).
Canonical variate analysis (CVA) was conducted on each MANOVA model to identify linear combinations of variables that best distinguish collections. The resultant canonical variates were used to visualize collection separation. This combined MANOVA and CVA approach was iteratively applied, starting with a single independent variable (collection) and progressively adding sex, population, donor age, birth year, and birth state. This approach clarified which variables contribute most to the separation between collections and assessed whether the effects of collection on cranial morphology remained significant after accounting for variation in cranial morphology attributable to other demographic variables.
Mahalanobis distances () were calculated to assess similarity and dissimilarity between the various collections and to explore potential hierarchical relationships. Mahalanobis distances were calculated for (1) all data by collection; (2) European American data by collection; and (3) all data by population, sex, and collection. Distance matrices were also calculated for the geographic distances between physical collection locations. To facilitate visual comparison between cranial morphology and geographic distances among collections, Mahalanobis distances and geographic distances were transformed using multidimensional scaling to create comparable coordinate spaces. The transformed datasets were then aligned using Procrustes analysis, allowing both sets of data to be plotted together for direct visualization of their spatial relationships.
To quantify the effect of collection-specific sample bias on cranial morphology, two linear discriminant functions were generated: (1) classification by collection and (2) classification into population- and sex-specific groups. These functions assessed whether classification rates were higher based on collection origin or traditional biological parameters (i.e., population and sex). Both models were cross-validated using a leave-one-out cross-validation (LOOCV) procedure.
3. Results
3.1. Initial Data Analysis
Demographic variables varied by collection (e.g., height in inches versus centimeters), so data cleaning was necessary, primarily related to simple formatting changes (e.g., capitalization, spacing, transforming state names to state codes). However, the language used to record population/ancestry information varied considerably by collection—some provided refined, population-level labels (e.g., Irish, Japanese, Mexican, etc.), while others used general terms (e.g., Asian, European, Hispanic). Consequently, the more refined population labels were converted to general terminology to ensure comparability. We understand this limits some of the conclusions drawn from this study, as the use of more general terminology may not adequately reflect the scope of human variation, contributing an additional source of bias. More broadly, the use of general population group labels may have implications for the development of skeletal analytical methods and subsequent identification efforts, but we were ultimately constrained by the information made available.
Sex and population information was available for all individuals across all collections (Table 1 and Table 3). Information on age, height, birth year, year of death, birth state, state at time of death, SES, and donation type varied by collection (see Table 3). STAFS DSC, TXSTDSC, and UTK DSC provided childhood SES, while JAWDHSC, TXSTDSC, and WMed STARS provided adulthood SES. Of the collection samples used in this study, the JAWDHSC, MMDSC, MSUFAL DSC, and UTK DSC include individuals donated by a medical examiner’s office; however, as these collections no longer accept such donations, next-of-kin or self-donation constituted the most common donation type for all collections.
Table 3.
Summary of mean statistics for collections on all demographic factors assessed except for population and sex, which are provided in Table 1.
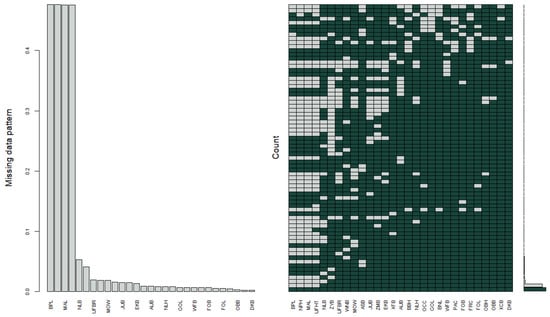
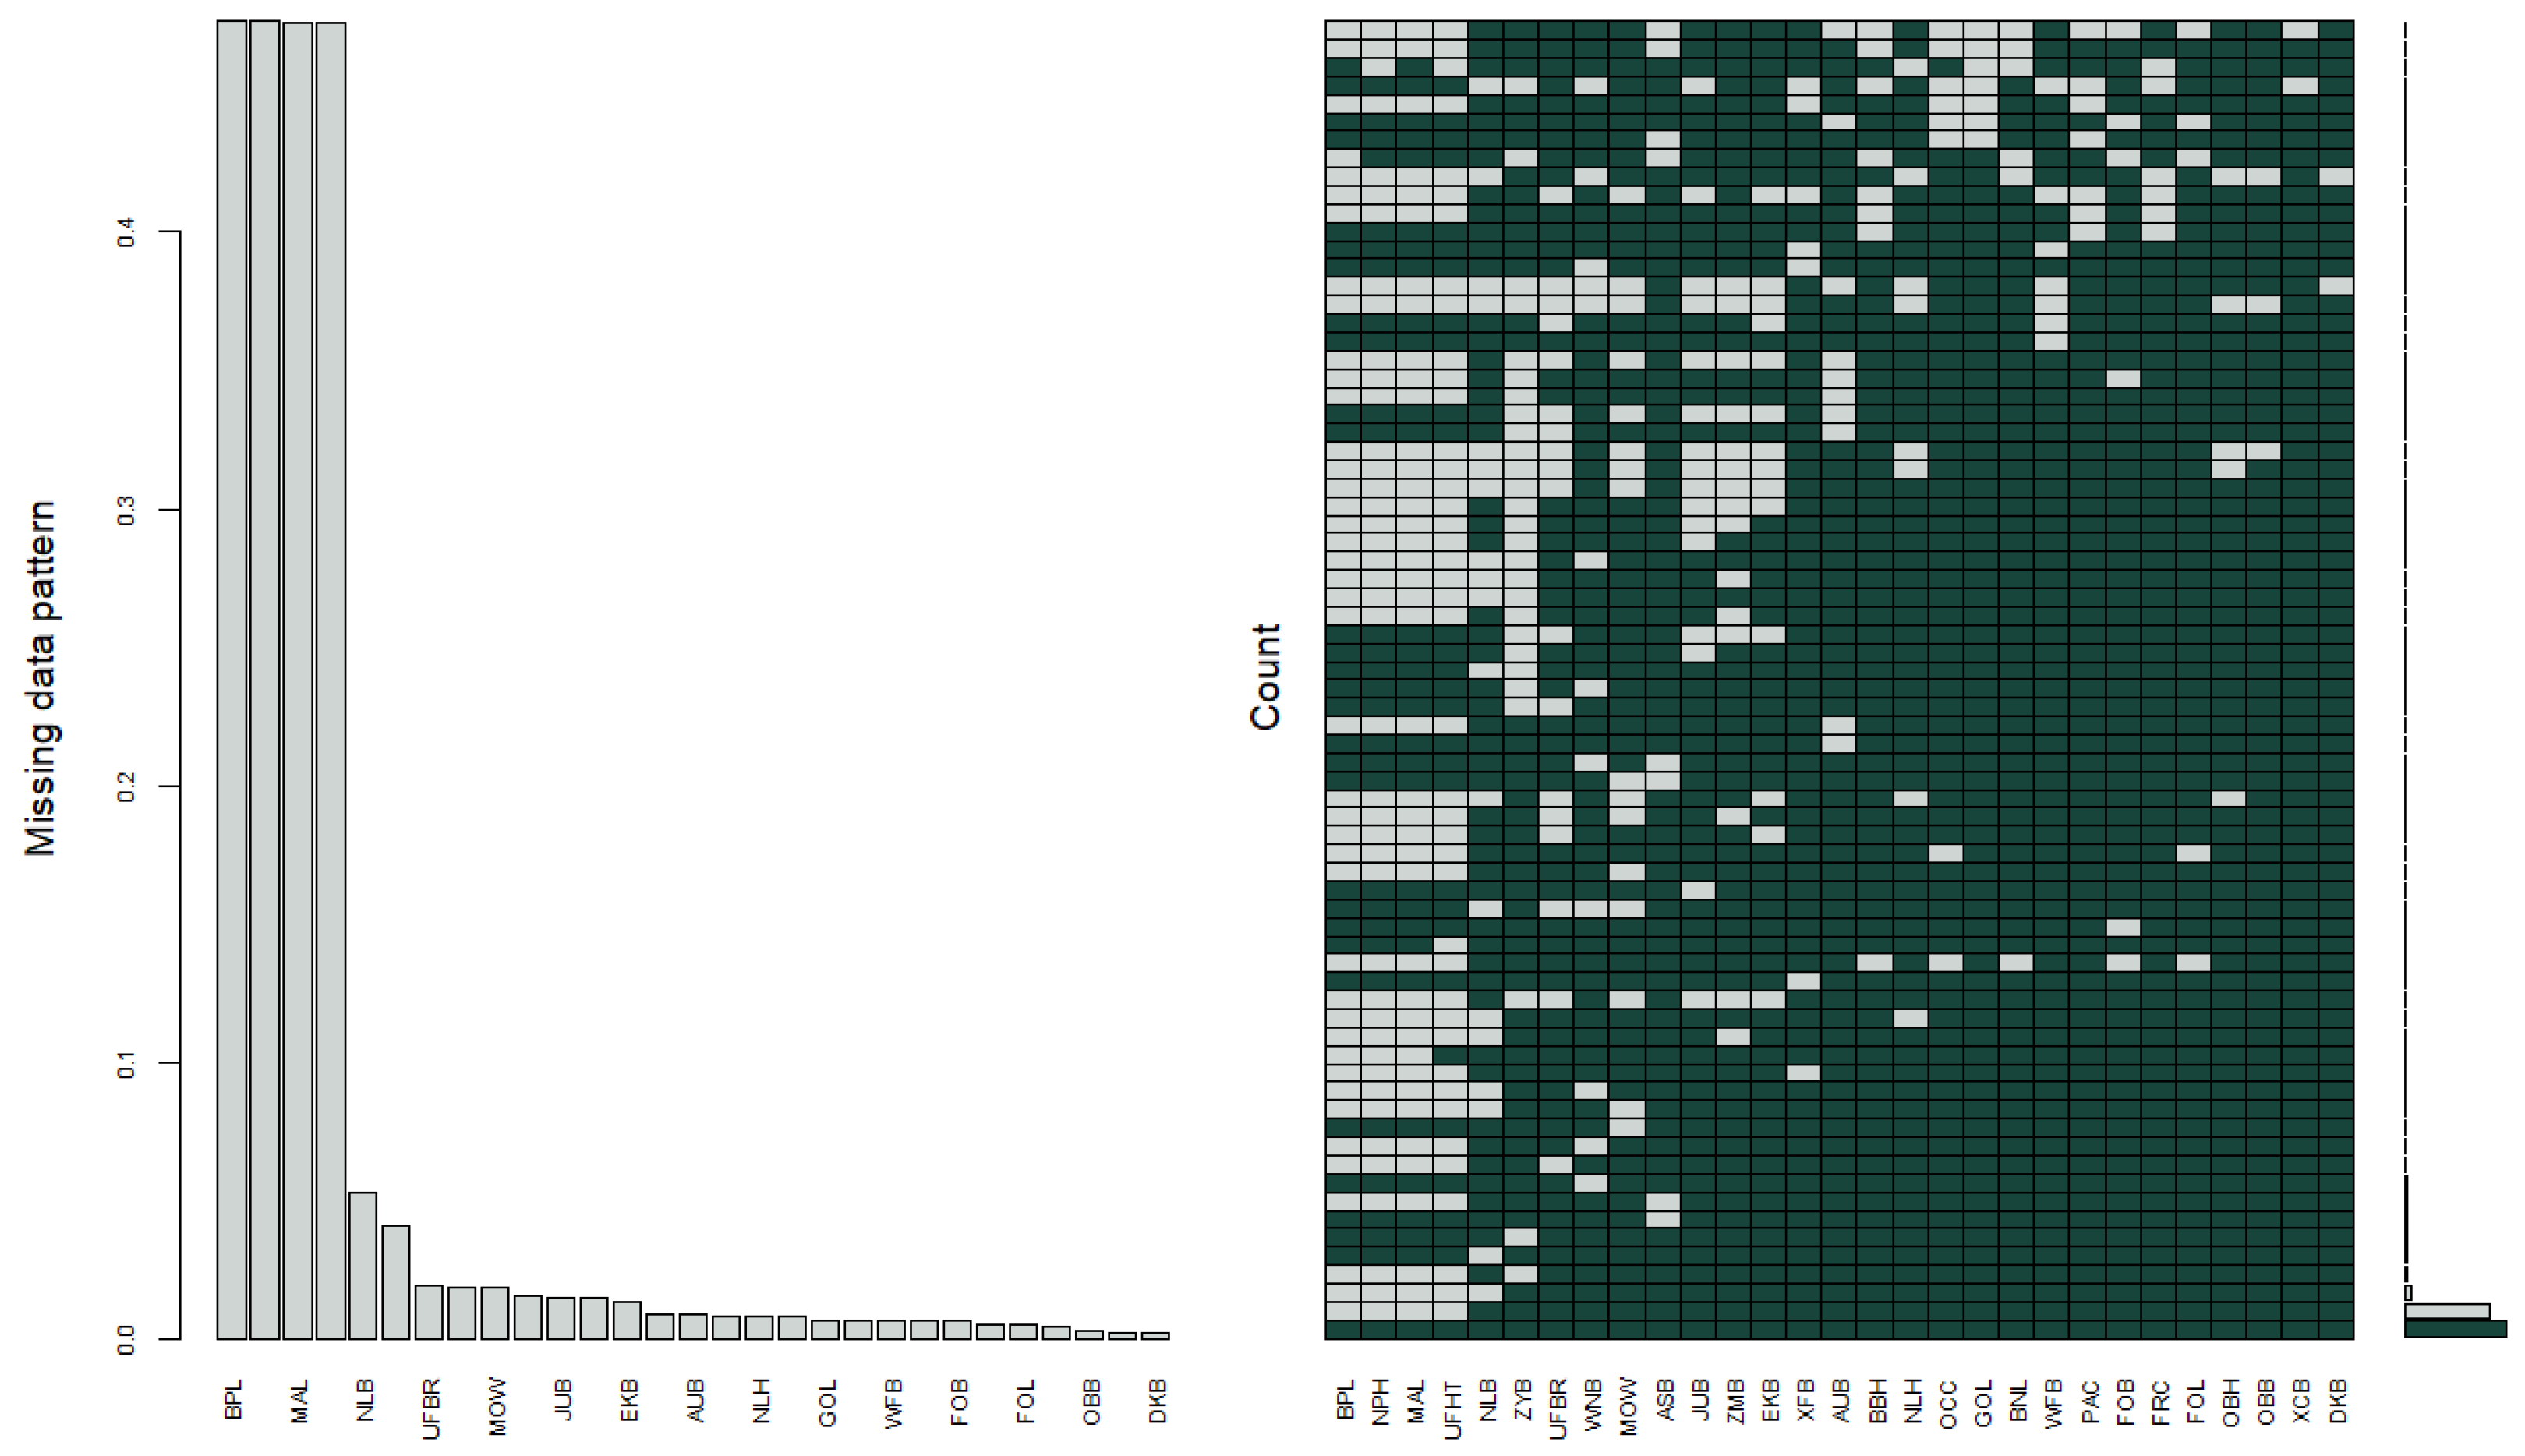
Due to antemortem tooth loss and alveolar resorption, the interlandmark distances with the most missing data were generally associated with measurements that include prosthion, such as BPL, NPH, MAL, and UFHT (Figure 1). Following imputation, variable means were calculated for each collection to assess the overall fit of the imputation process.
Figure 1.
Visualization of missing data patterns among interlandmark distances across all collections. Missing values (grey) and observed values (green) are provided for each variable.
A two-way random-effects model for absolute agreement was used to assess interobserver error. The ICC was 0.999 (95% CI: 0.999 to 0.999), indicating excellent agreement. Using a two-way random-effects model for consistency, the intraobserver error test produced an ICC = 0.999 (CI: 0.999 to 1), indicating excellent consistency.
3.2. Analysis of Demographic Variables
The results of the chi-squared tests and one-way ANOVAs are provided in Table 4. Sex ratios differ across collections (p = 0.04); however, no significant differences were identified in post hoc analyses (adjusted p > 0.05). Although European Americans make up the largest population group in each collection (56–99%), population compositions varied significantly by collection. Post hoc analyses indicate these differences are attributable to an overrepresentation of Asian Americans in the MLOC, African Americans in the MSUFAL DSC, and Native Americans in the WMed STARS (adjusted p < 0.01). Mean adult age differed significantly between collections (see Table 4); post hoc pairwise comparisons revealed these differences are attributable to a higher mean adult age in the MLOC and a lower mean adult age in the MSUFAL DSC (adjusted p < 0.01). Mean height did not differ significantly by collection.
Table 4.
Results of chi-squared tests and one-way ANOVAs on collection samples.
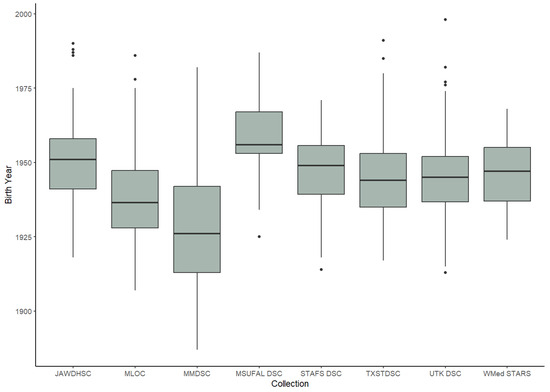
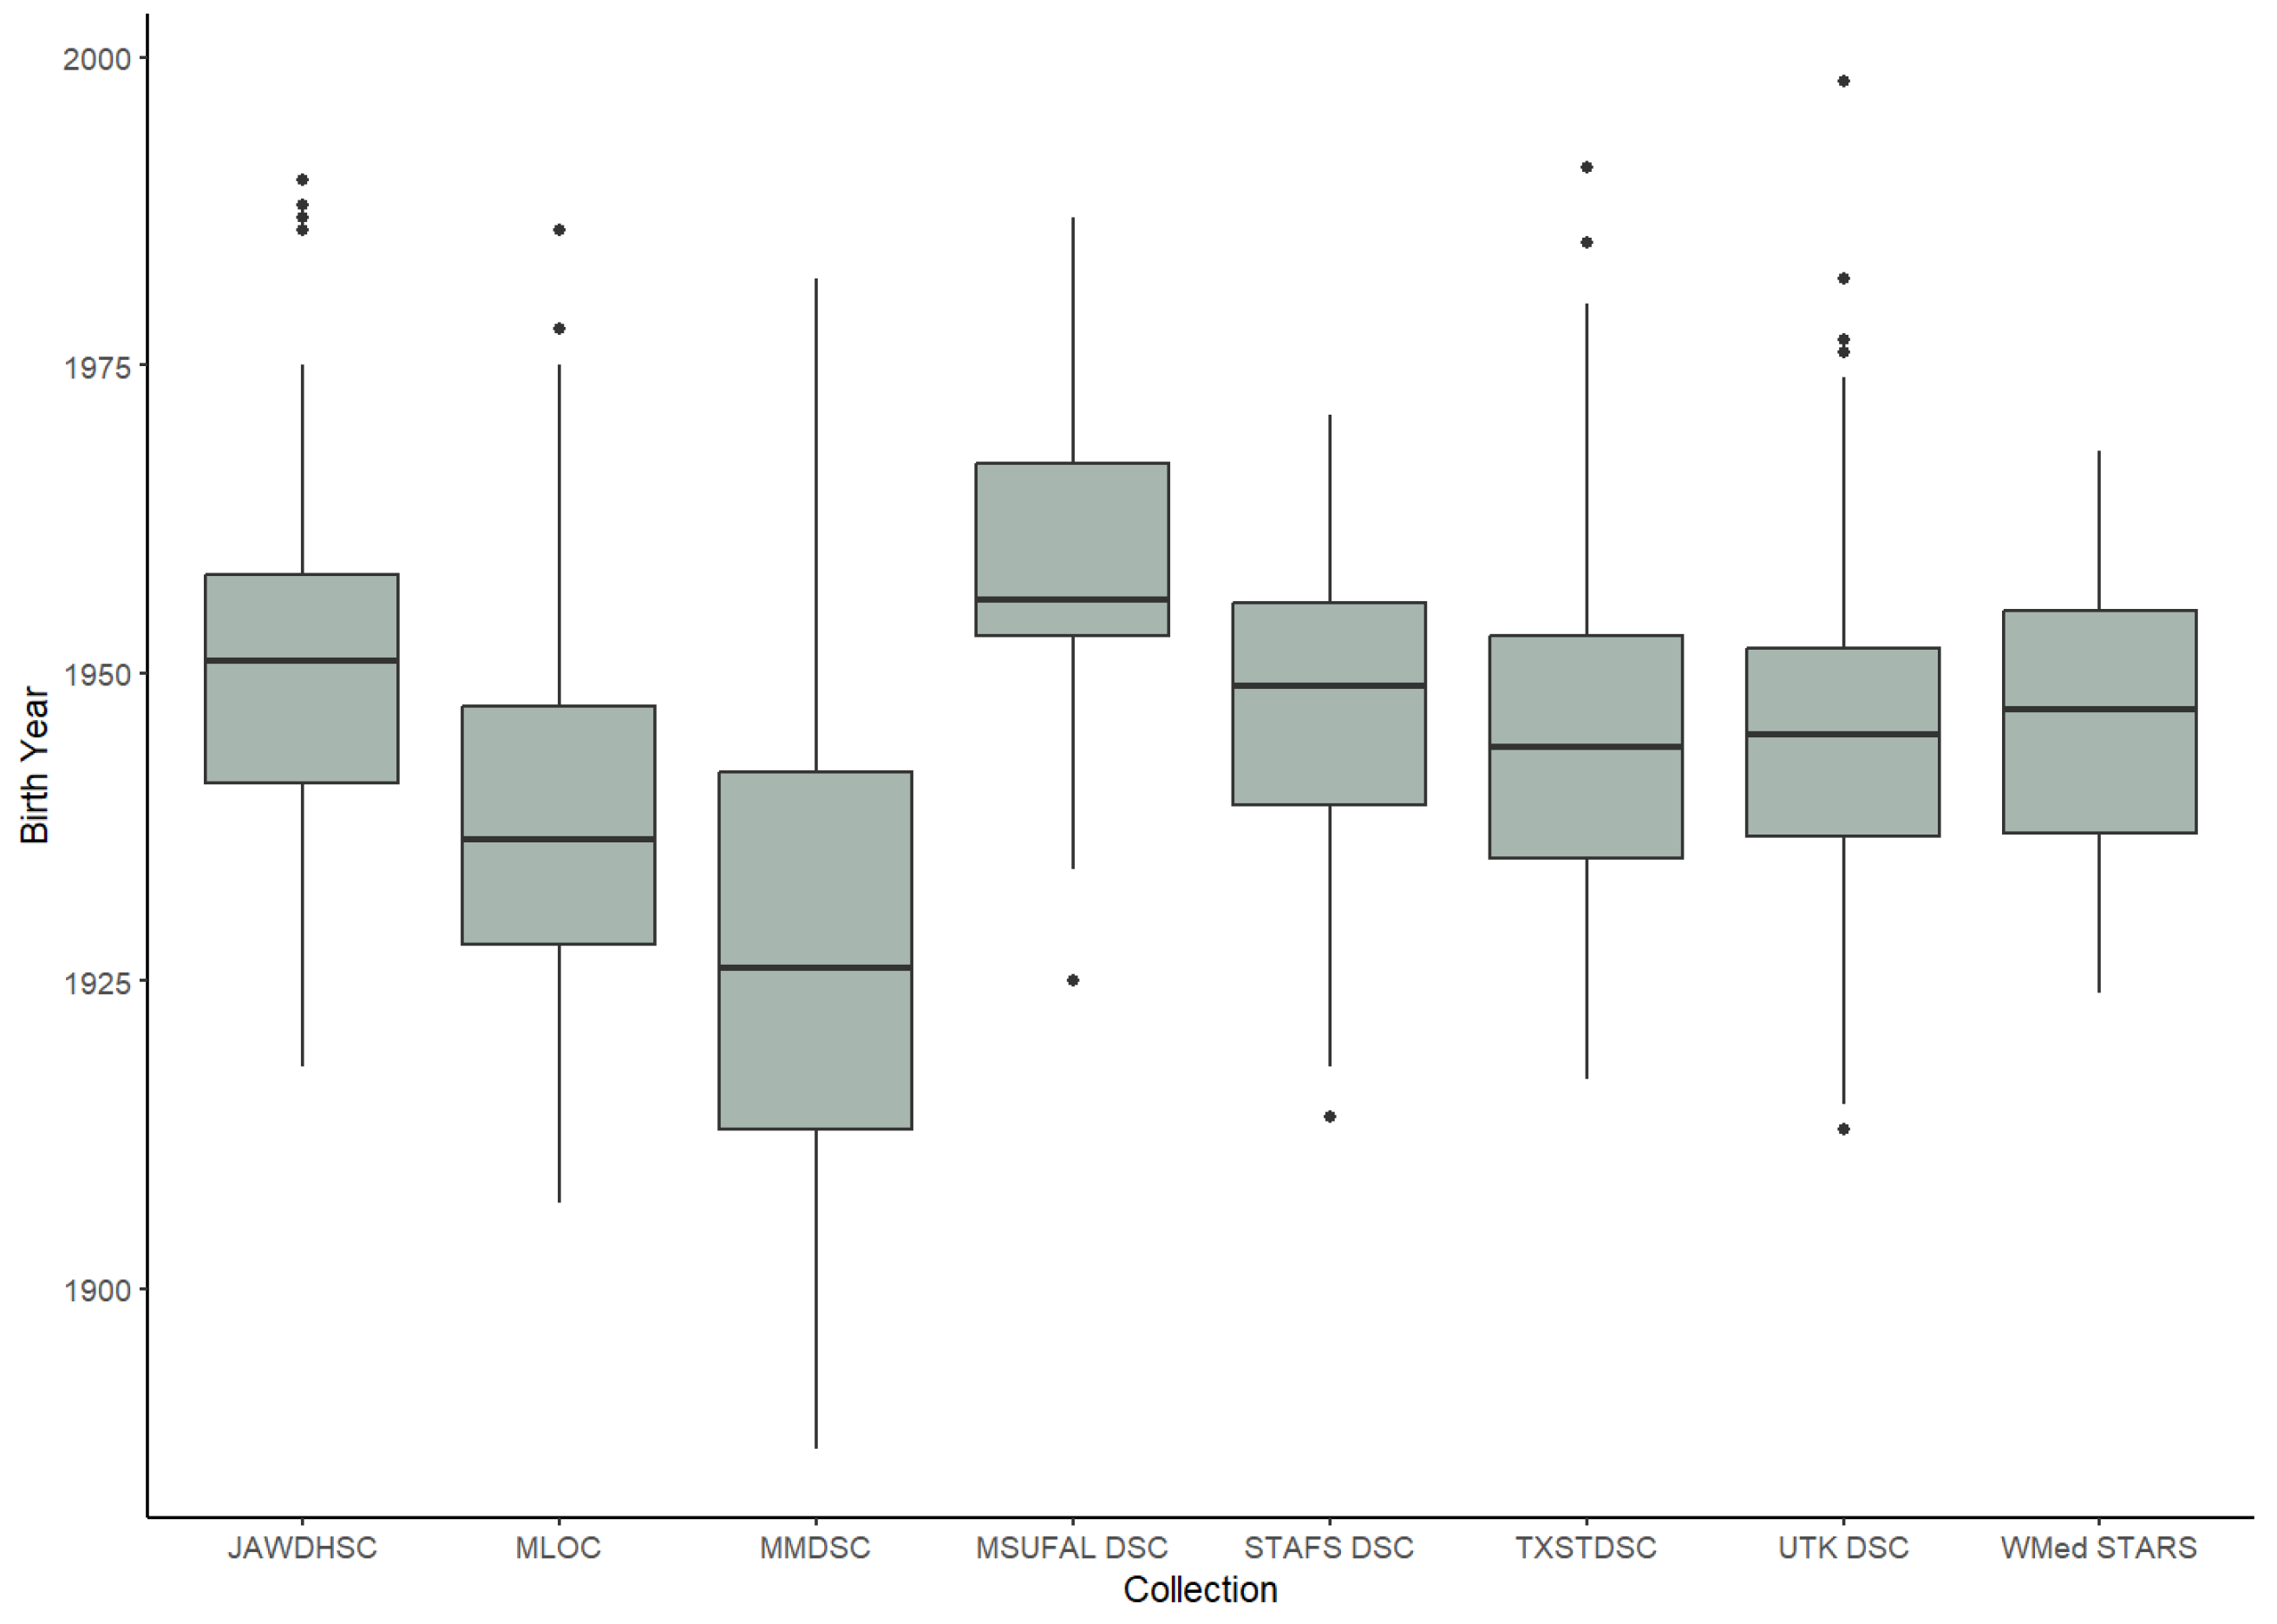
Although all collections are modern, significant differences in mean birth year and year of death were identified (see Table 4). Post hoc pairwise comparisons reveal the MMDSC in New Mexico and the MLOC in Hawai’i have a significantly earlier mean birth year than all other collections (adjusted p < 0.01; Figure 2). Conversely, the MSUFAL DSC has a much later mean birth year than all others except the JAWDHSC (adjusted p < 0.01). The MMDSC had a significantly earlier mean year of death than all other collections (adjusted p < 0.01). The UTK DSC also had a significantly earlier mean year of death than the JAWDHSC, MLOC, STAFS DSC, TXSTDSC, and WMed STARS (adjusted p < 0.01).
Figure 2.
Box plot of birth years by collection. Dots indicate observations beyond 1.5 times the interquartile range.
Significant differences were identified between collections for state of birth and state at time of death (see Table 4). Perhaps unsurprisingly, individuals in a collection are most often from the same state where the collection is located. There was no significant difference in childhood SES between collections (see Table 4). A significant difference in adulthood SES was identified between collections (see Table 4), which post hoc analyses attribute to an overrepresentation of low-SES individuals in the WMed STARS and an underrepresentation of low-SES individuals in the TXSTDSC (adjusted p < 0.01).
3.3. Craniometric Analysis
Cook’s distance identified six potential outliers. After direct observation of these data and associated box plots and pairwise plots, one European American female from the MSUFAL DSC was removed from the dataset. Upon reexamination of the skeletal remains, the outlier status of this individual (i.e., small cranial dimensions) was directly associated with a pathological condition.
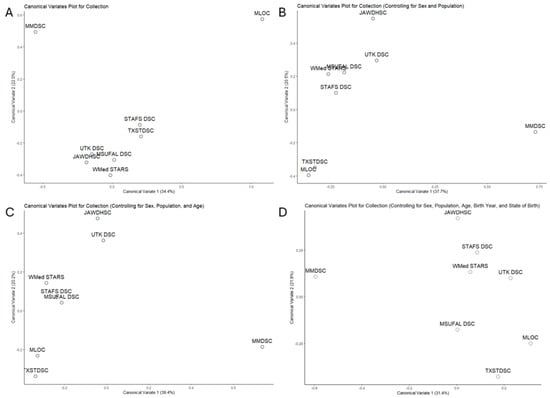
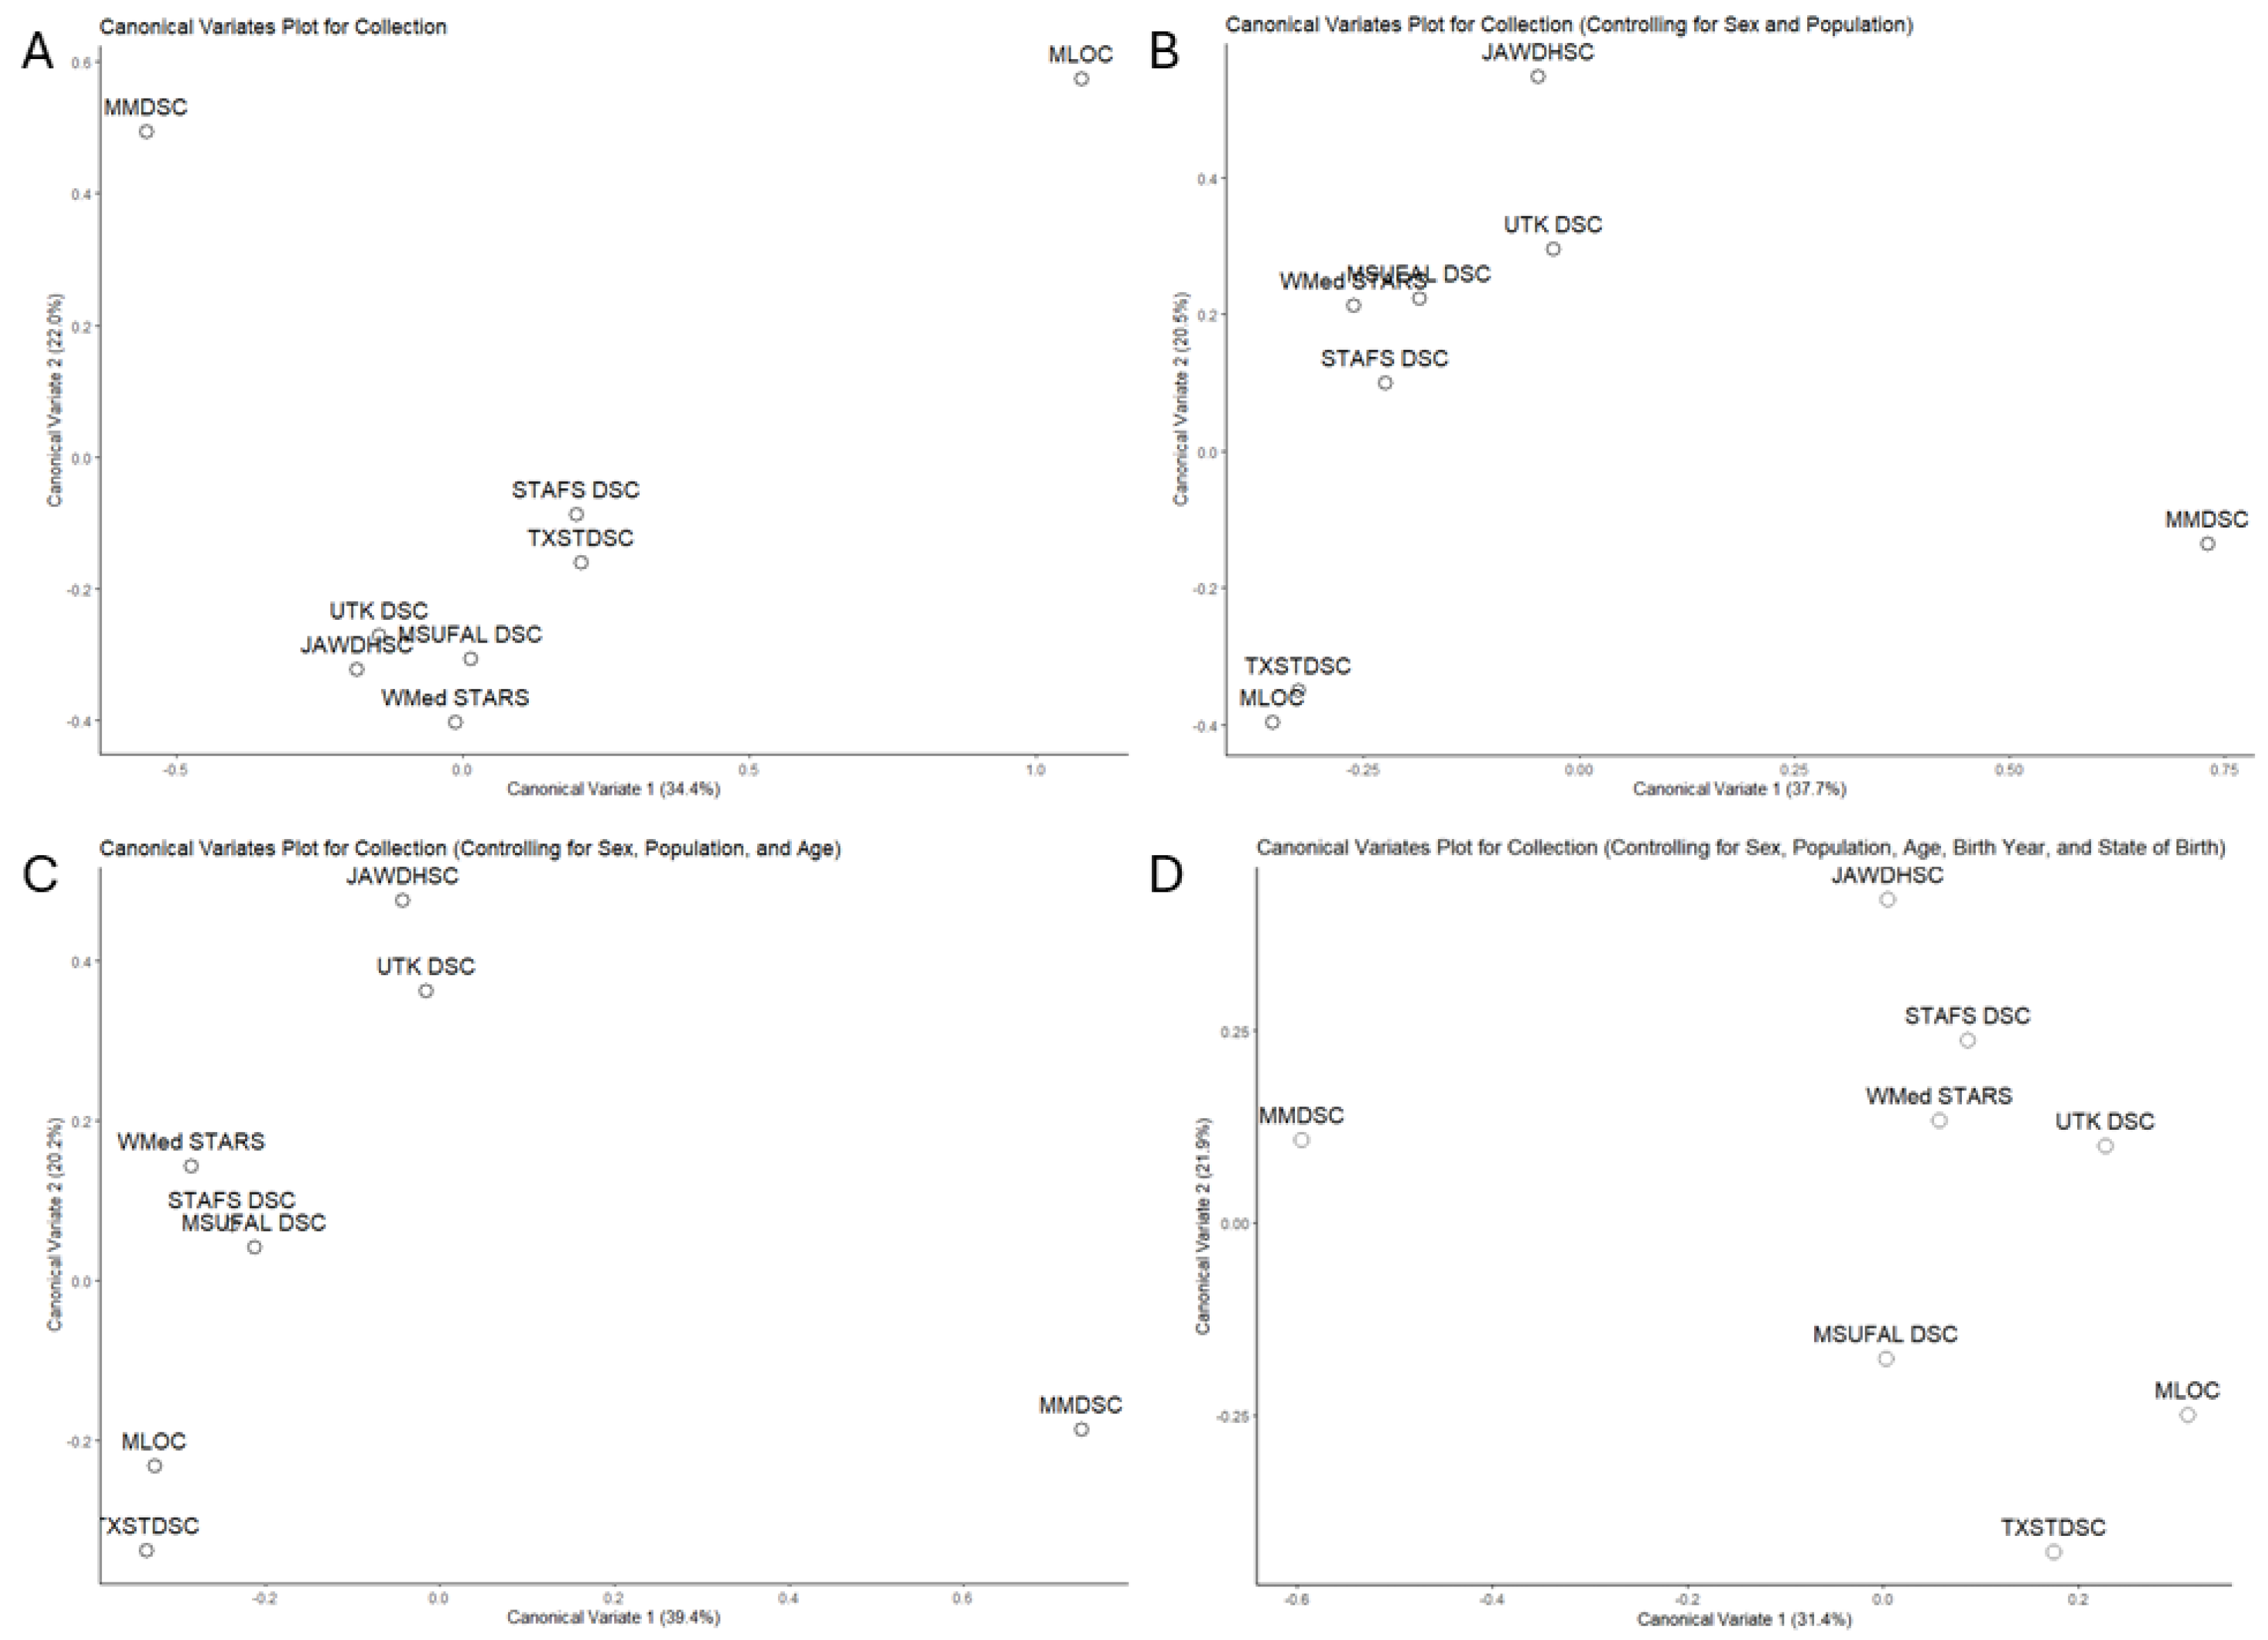
The individual results of the MANOVA and MANCOVA analyses are provided in Table 5. Collection origin consistently had a significant effect on cranial morphology, even after accounting for variation in cranial morphology caused by other demographic variables (see Table 5). CVA and canonical variate visualizations demonstrate how collection separation varies based on the demographic variables included (Figure 3). With collection as the sole independent factor in the MANOVA and CVA, the second canonical variate separates the MMDSC and MLOC from the other six collections (Figure 3A). The separation between MLOC and the other collections decreases after sex and population are added to the model (Figure 3B). However, across all models that incorporate collection and additional demographic variables, the first canonical variate separates the MMDSC from all other collections (Figure 3B–D).
Table 5.
MANOVA and MANCOVA summaries.
Figure 3.
Canonical variate plots of interlandmark distances by (A) collection; (B) collection, accounting for variation caused by sex and population; (C) collection, accounting for variation caused by sex, population, and age; and (D) collection, accounting for variation caused by sex, population, age, birth year, and state of birth. All plots display separation of collections using the first two canonical variates (Can1 and Can2), which accounted for 53.3–59.6% of the variance, depending on the model used.
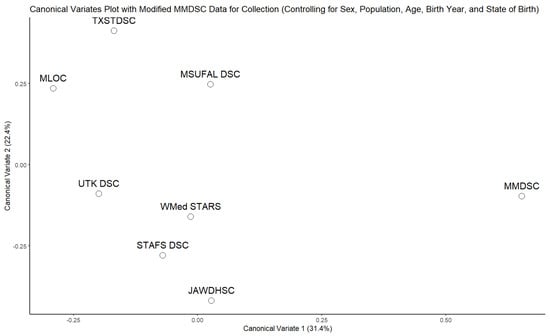
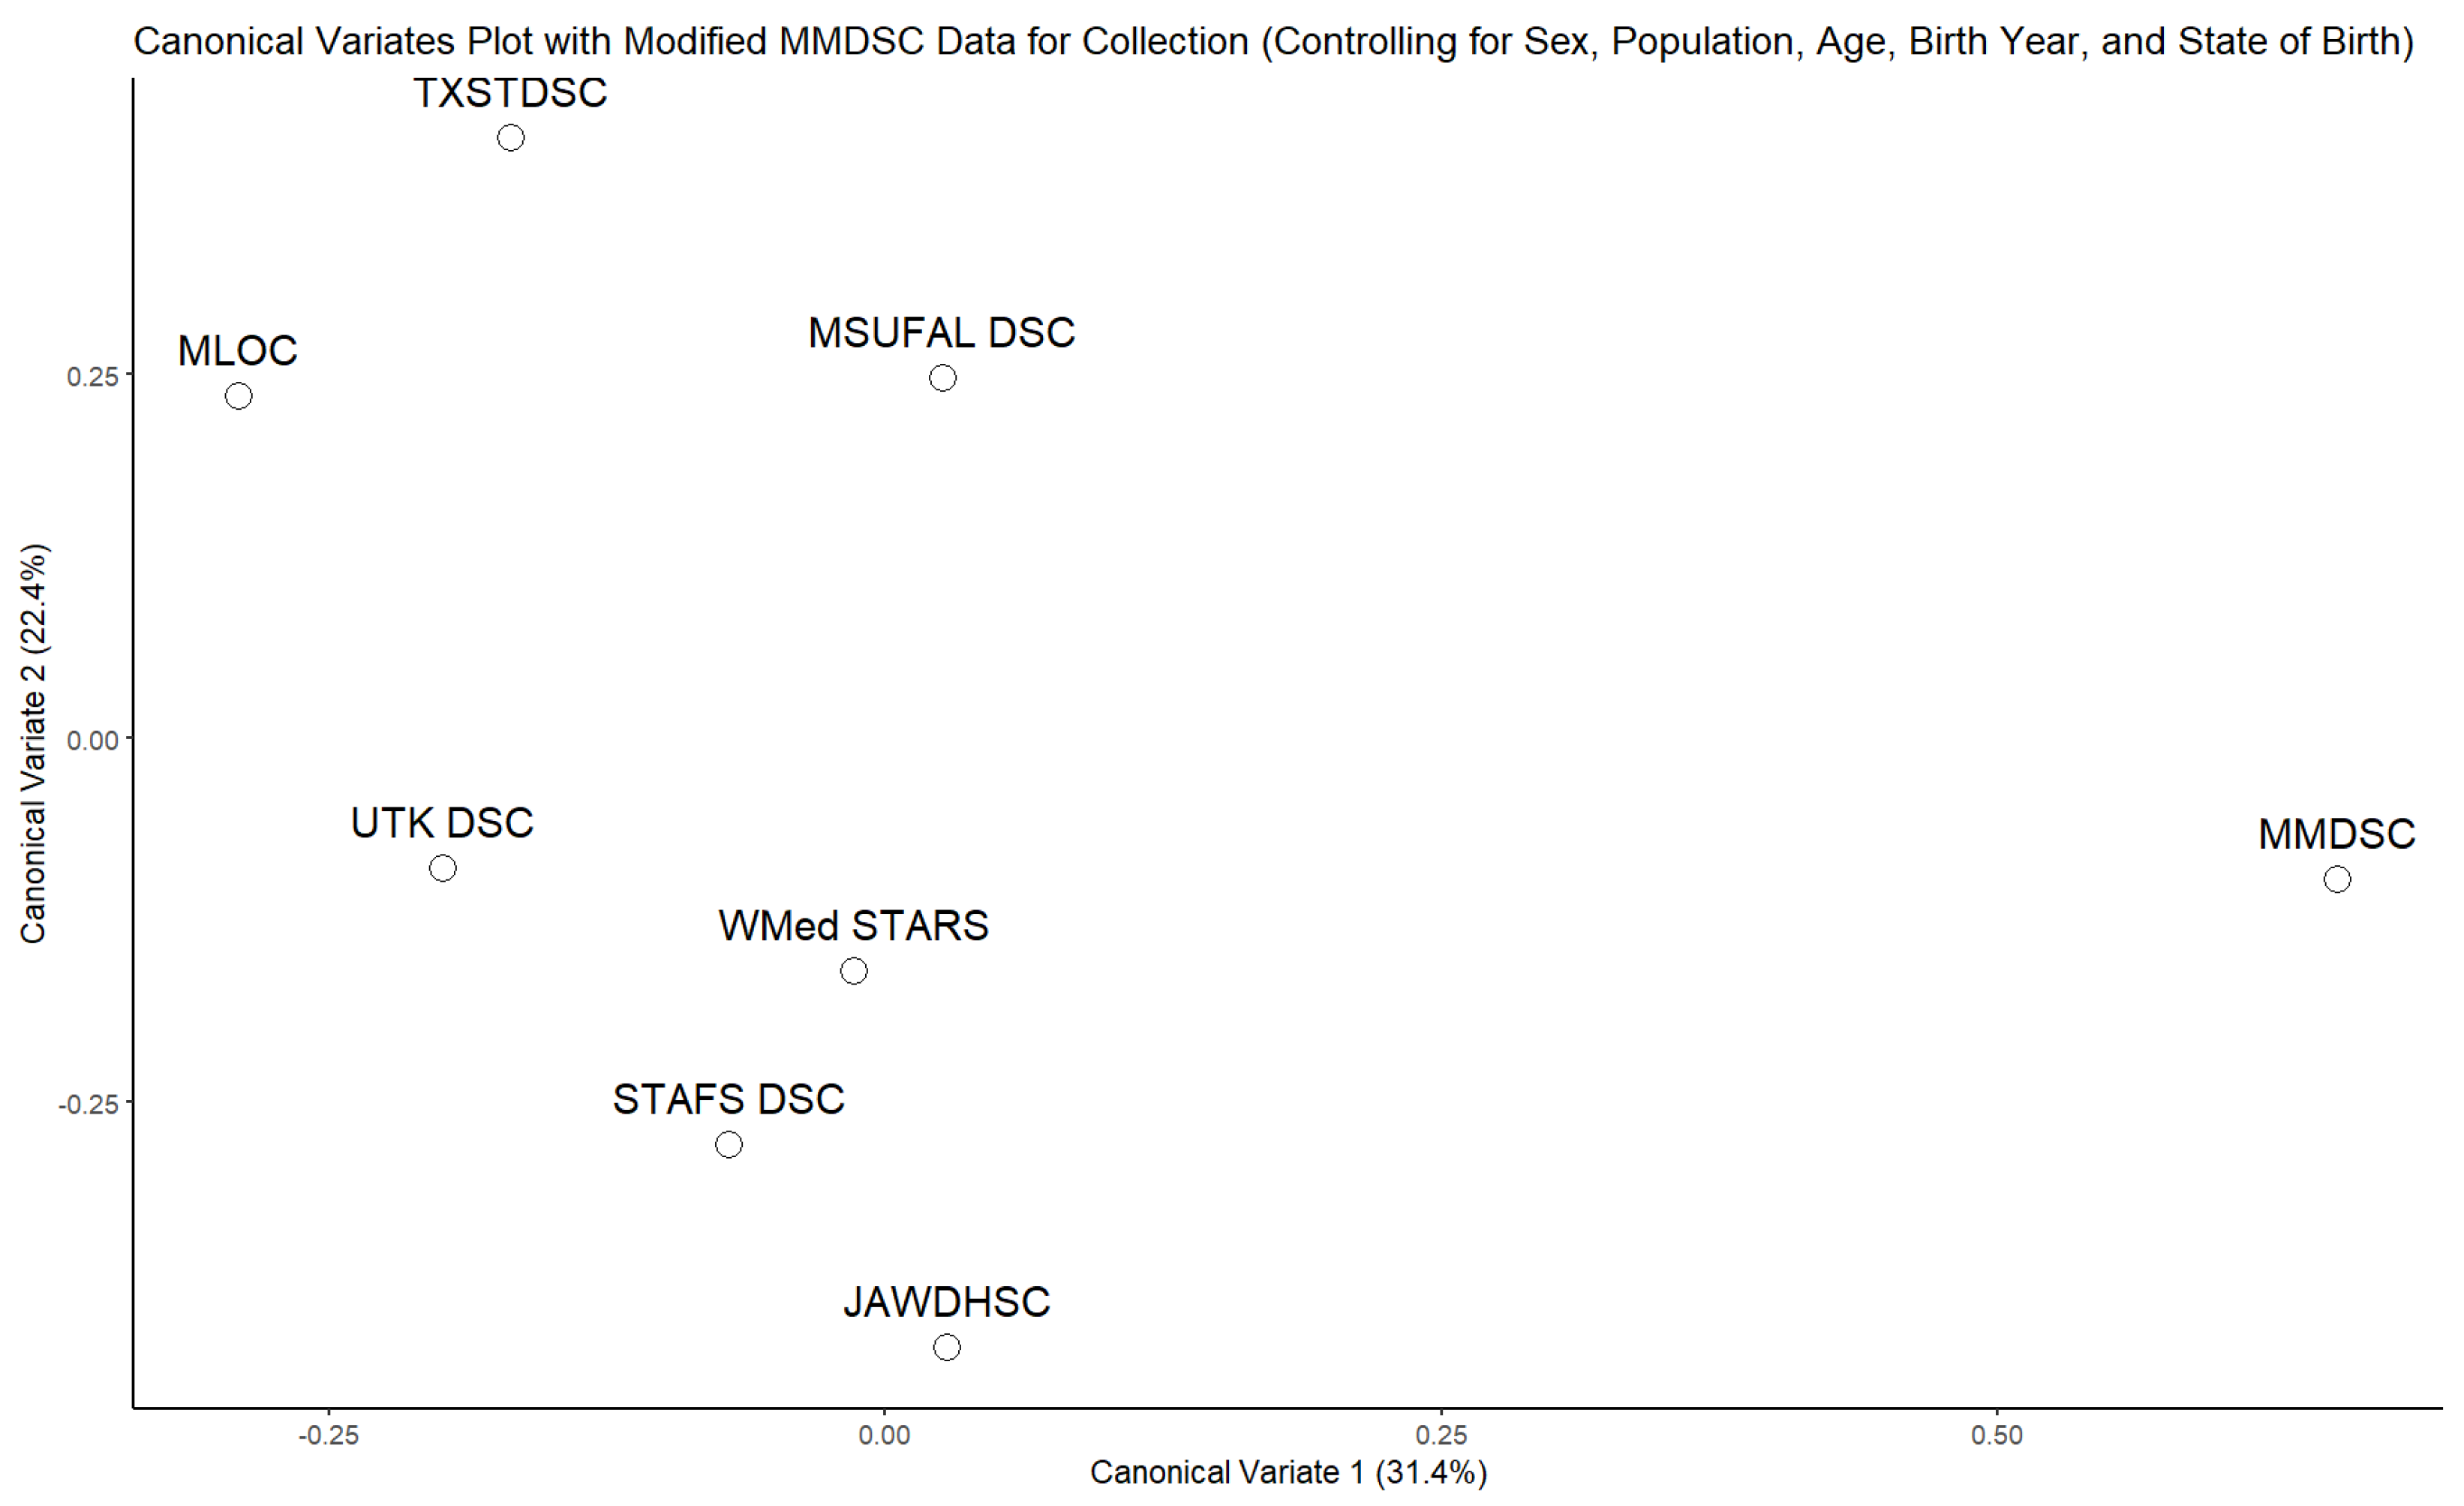
The questionable identification status of the individuals from the MMDSC (Komar & Grivas, 2008) required a MANCOVA with a reduced MMDSC dataset to determine if these individuals were driving the separation of the MMDSC from the other seven collections (see Table 5). All of the individuals designated as “transfers” from the Department of Anatomy or the Office of the Medical Examiner and those without associated donation documentation were removed from the analysis (Table 6). The CVA and visualization of collection separation using canonical variates 1 and 2 (Figure 4) further separate the MMDSC from the other seven collections, suggesting that identification status was not contributing to this separation. Across all MANCOVAs, including analyses with both MMDSC datasets, the most influential factor on cranial variation is sex, followed by population, collection, state of birth, age, and birth year.
Table 6.
Breakdown of reduced MMDSC sample by population and sex.
Figure 4.
Canonical variate plot of interlandmark distances in the reduced MMDSC dataset by collection, accounting for variation associated with sex, population, age, birth year, and state of birth. The plot displays the first two canonical variates (Can1 and Can2), which account for 31.4% and 22.4% of the variance, respectively. MMDSC shows the greatest divergence along Can1.
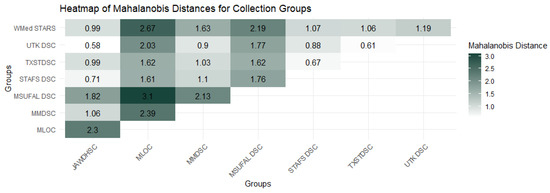
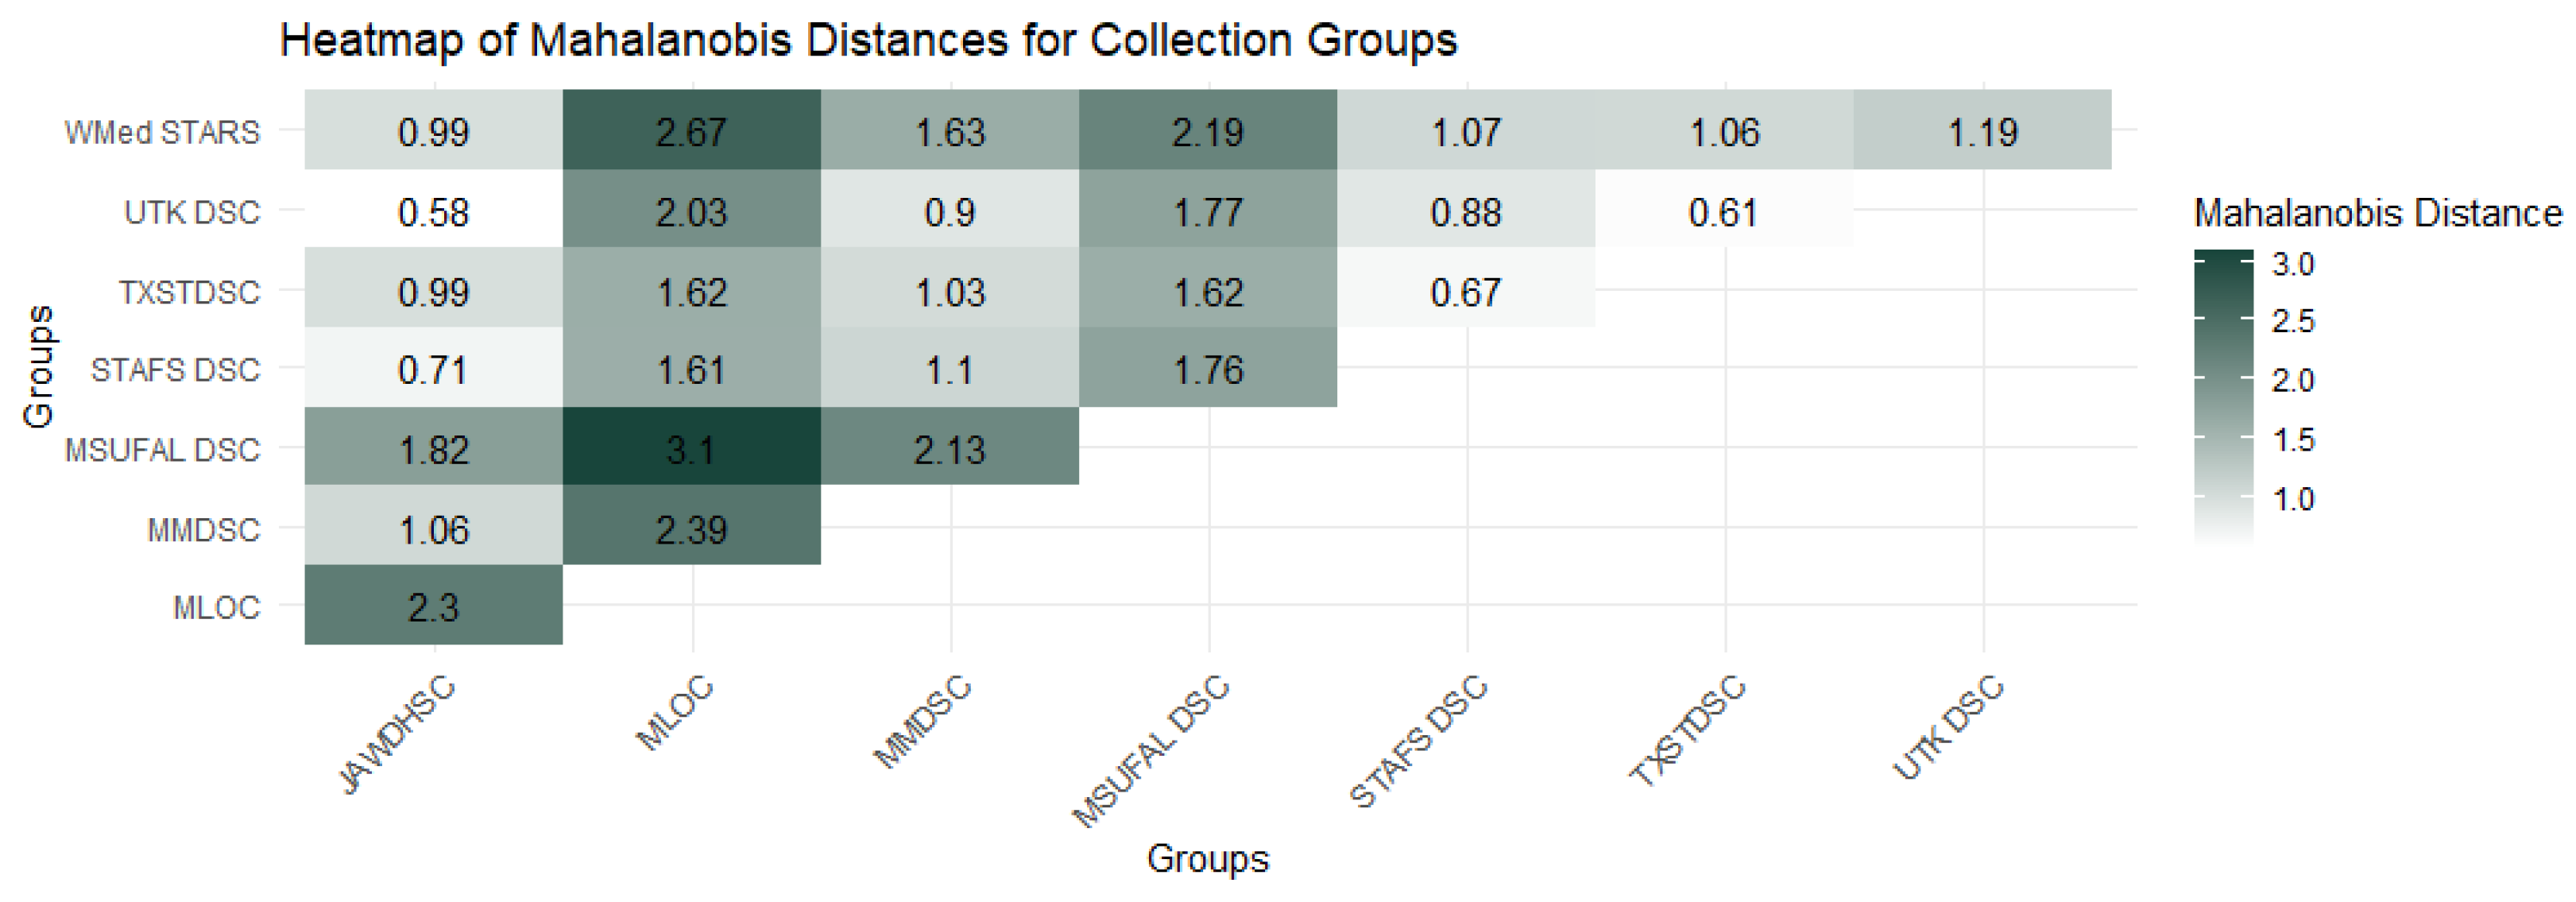
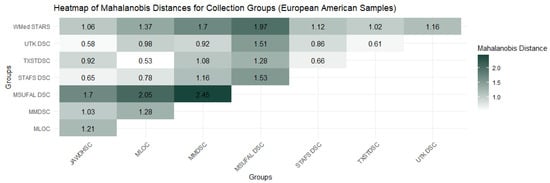
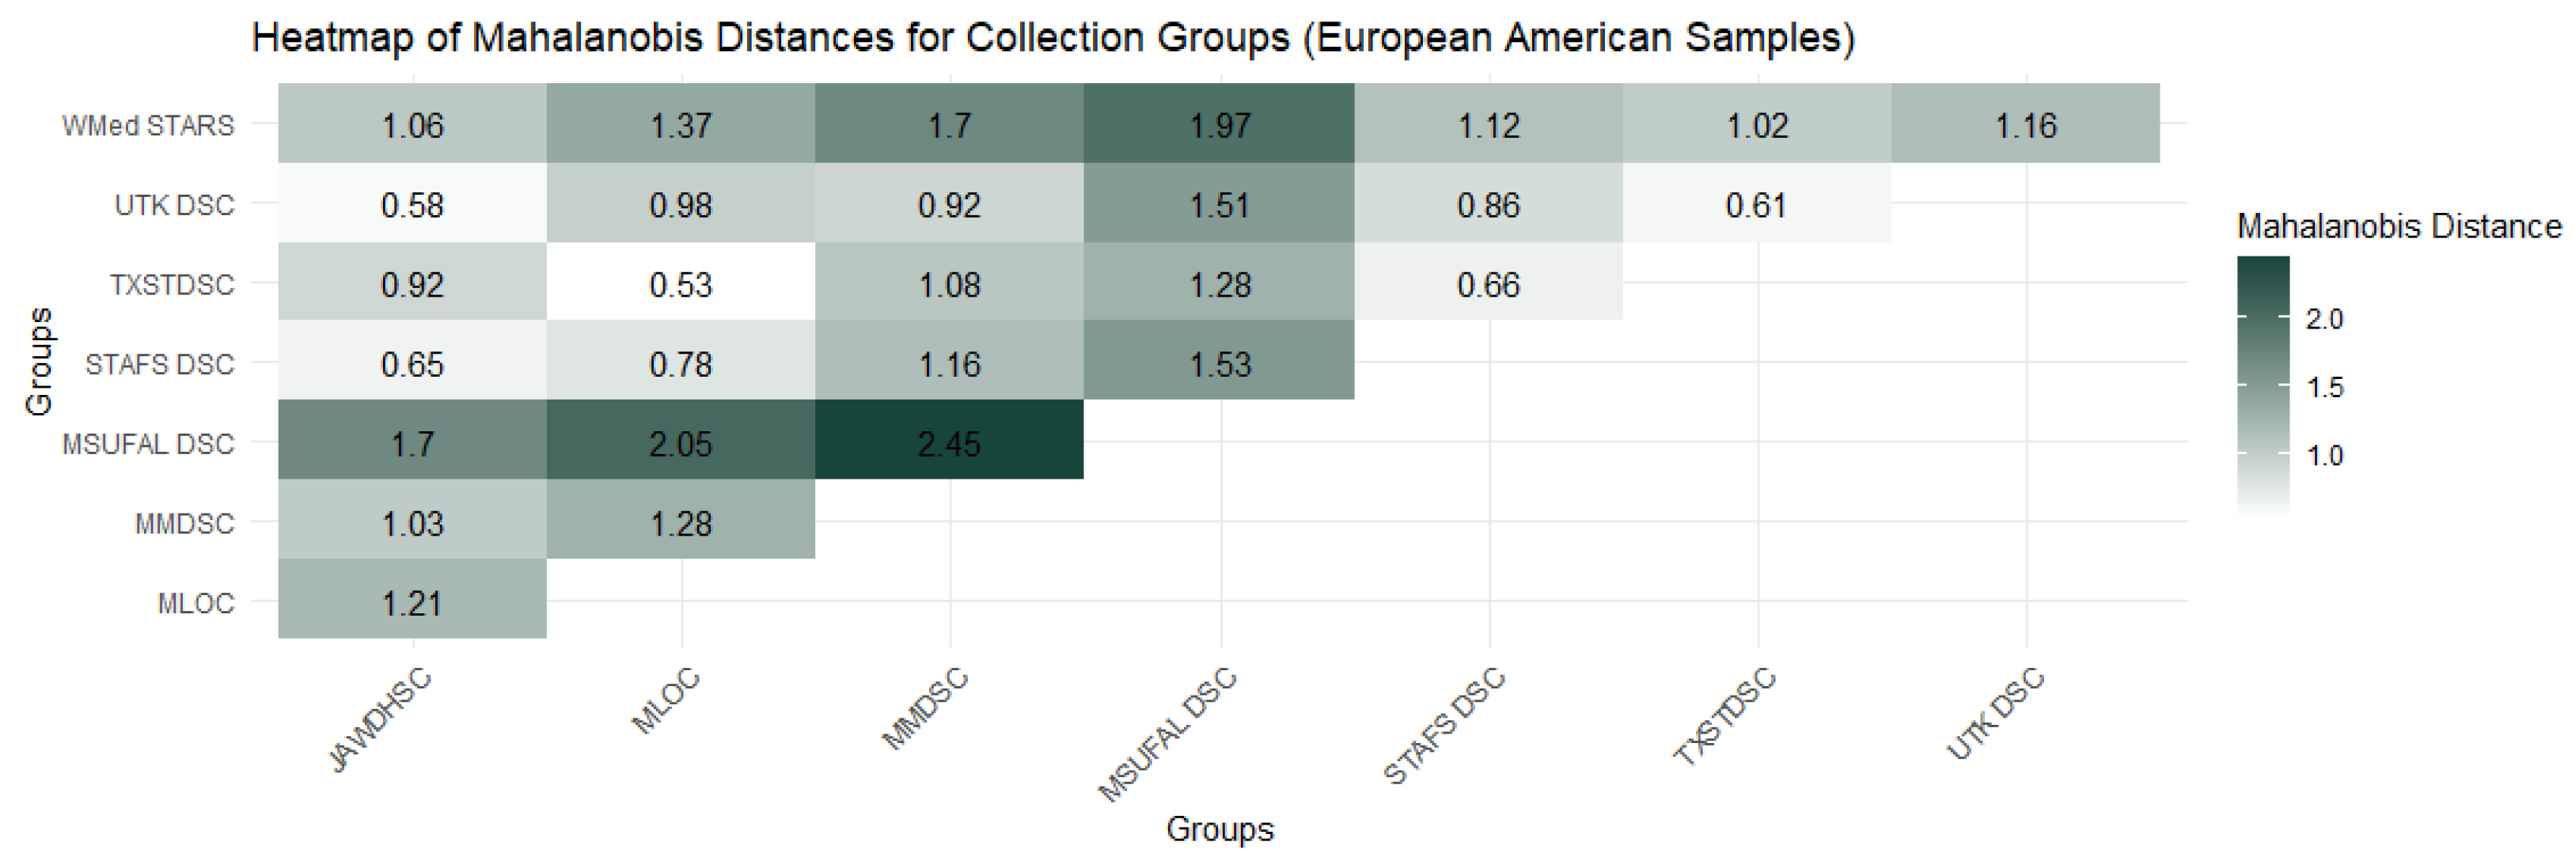
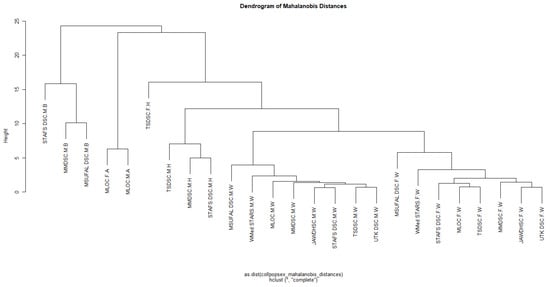
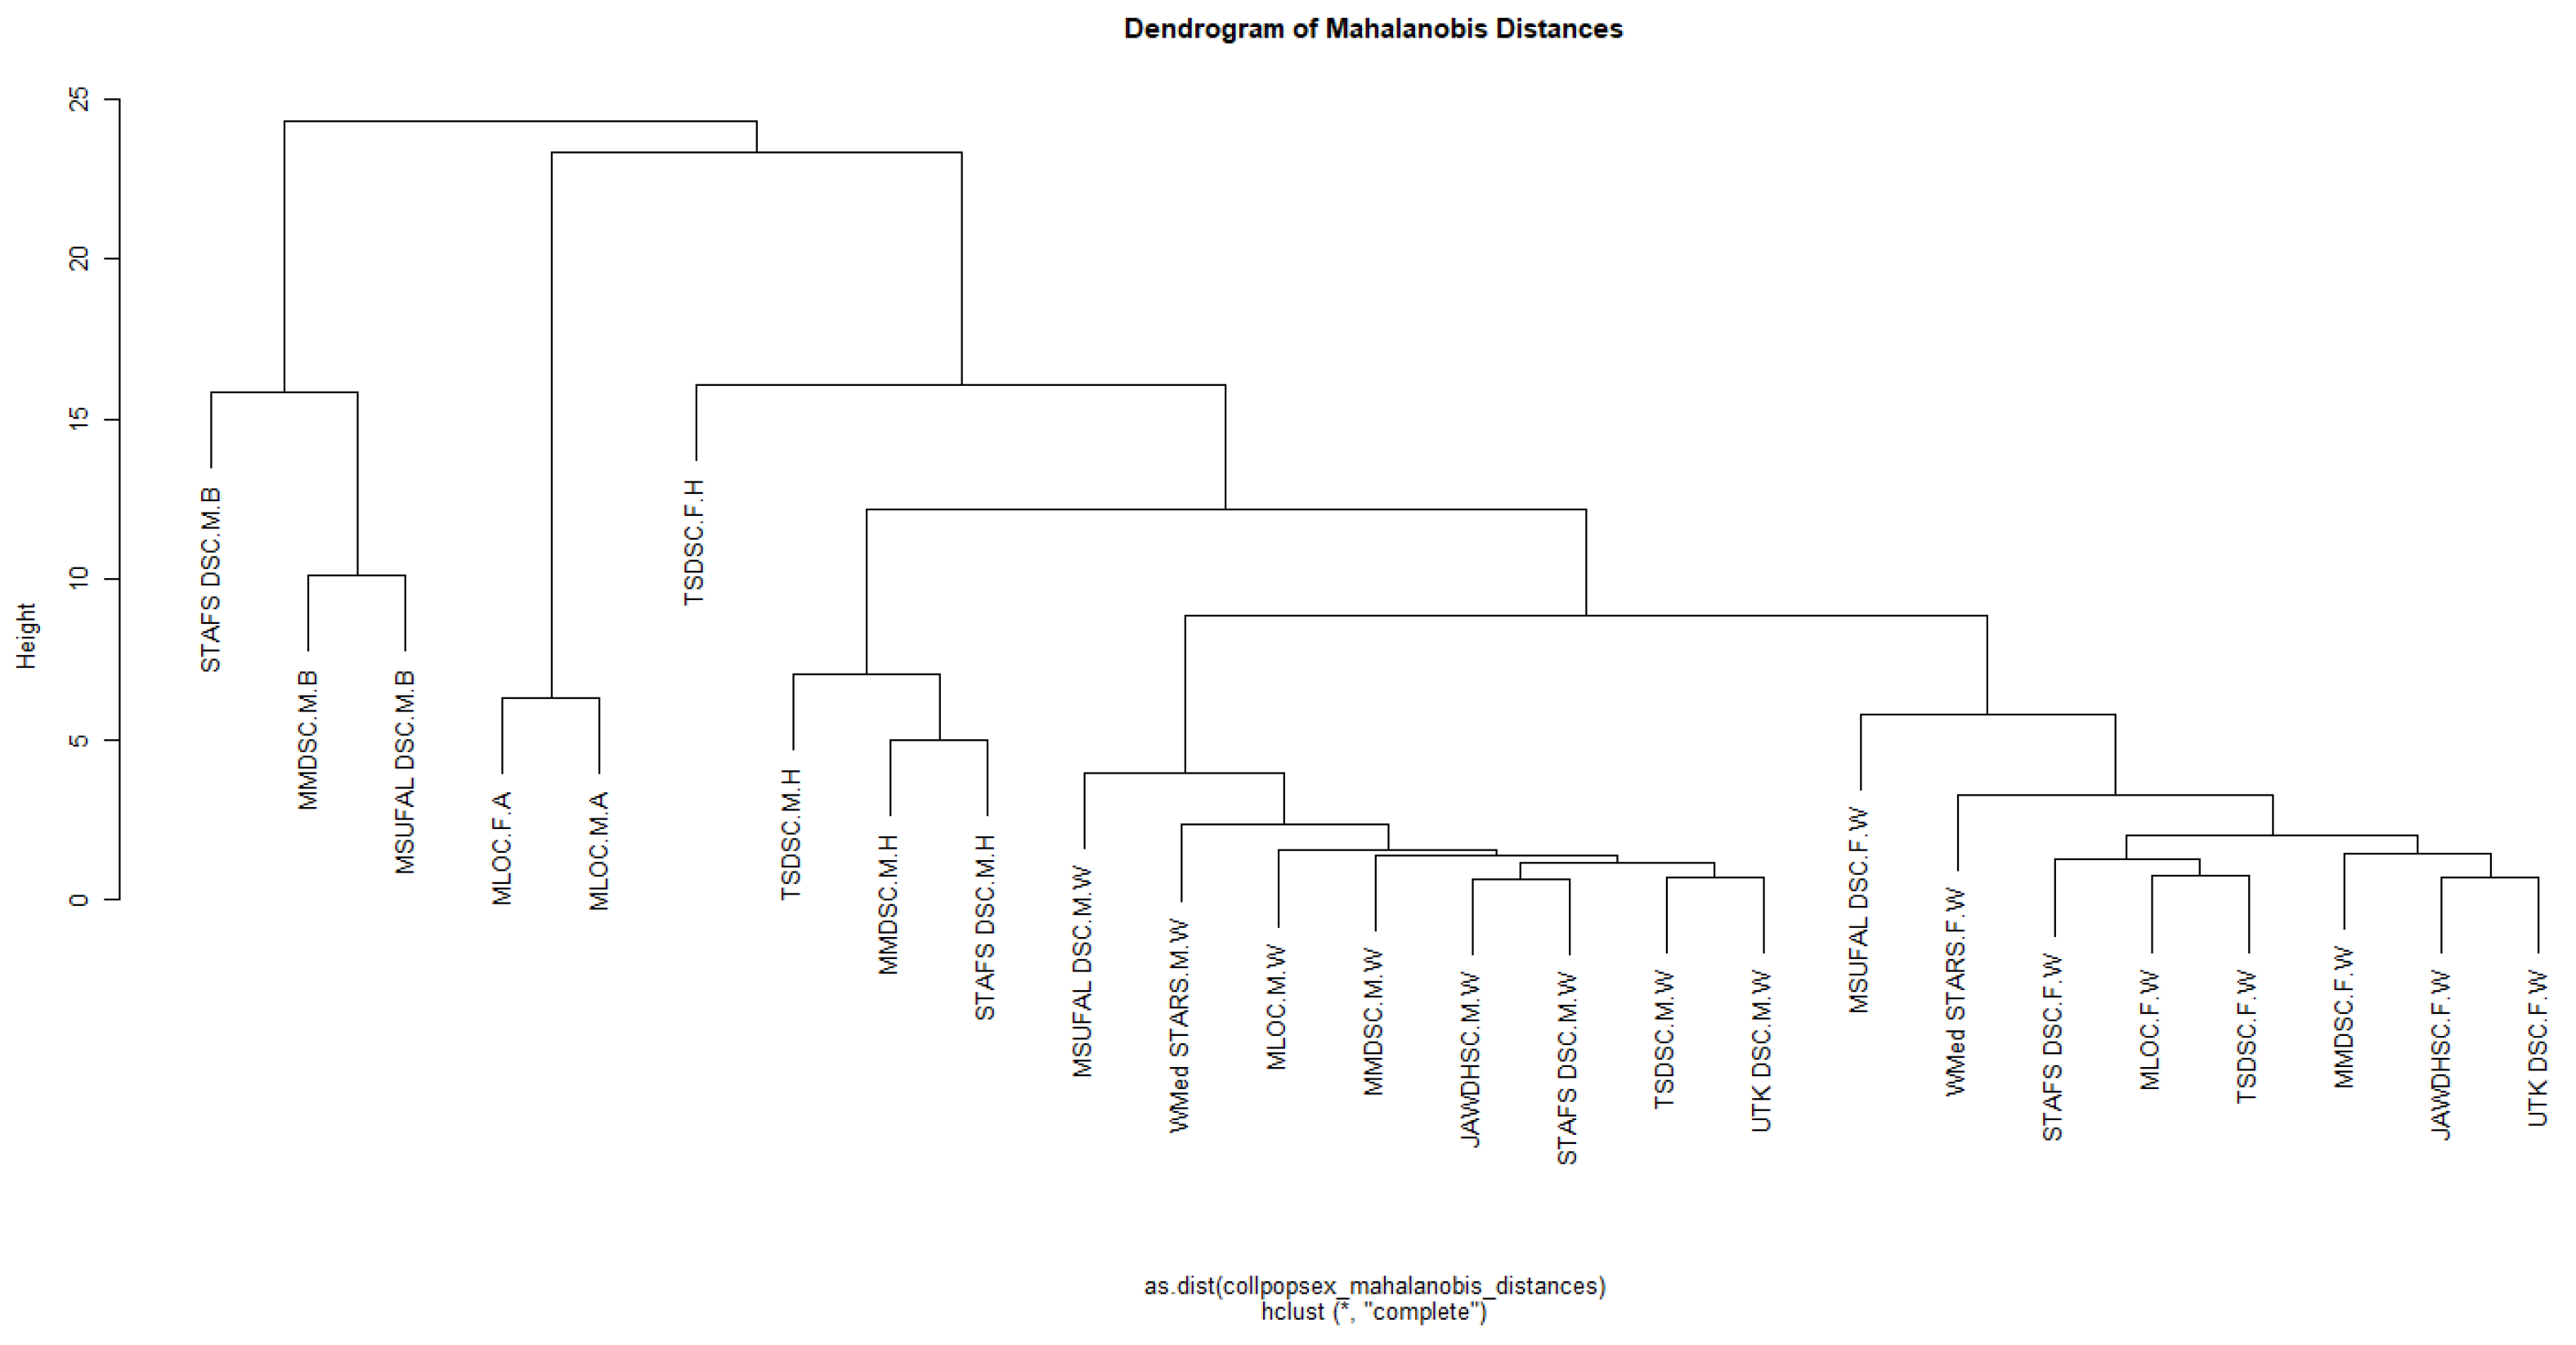
Mahalanobis distance (D2) matrices were calculated based on collection origin for all individuals and only European American individuals and are illustrated in Figure 5 and Figure 6, respectively. A Mahalanobis distance (D2) matrix between collections, populations, and sex-specific groups is presented in Figure 7.
Figure 5.
Heatmap of the Mahalanobis distance (D2) matrix calculated based on collection origin. Greater distances are represented by darker green tones.
Figure 6.
Heatmap of the Mahalanobis distance (D2) matrix calculated based on collection origin for European American samples. Greater distances are represented by darker green tones.
Figure 7.
Hierarchical clustering dendrogram based on the Mahalanobis distance (D2) matrix calculated based on collection, population, and sex-specific groups. “M” and “F” represent male and female. “A”, “B”, “H”, and “W” represent Asian, African American, Hispanic, and European American, respectively.
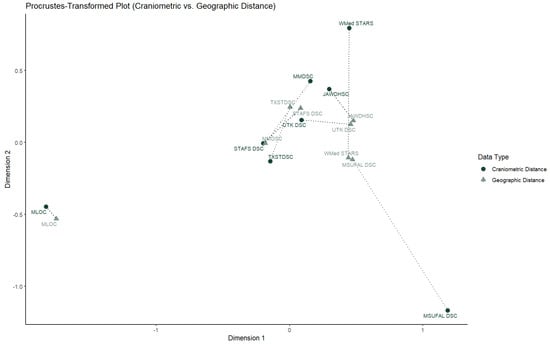
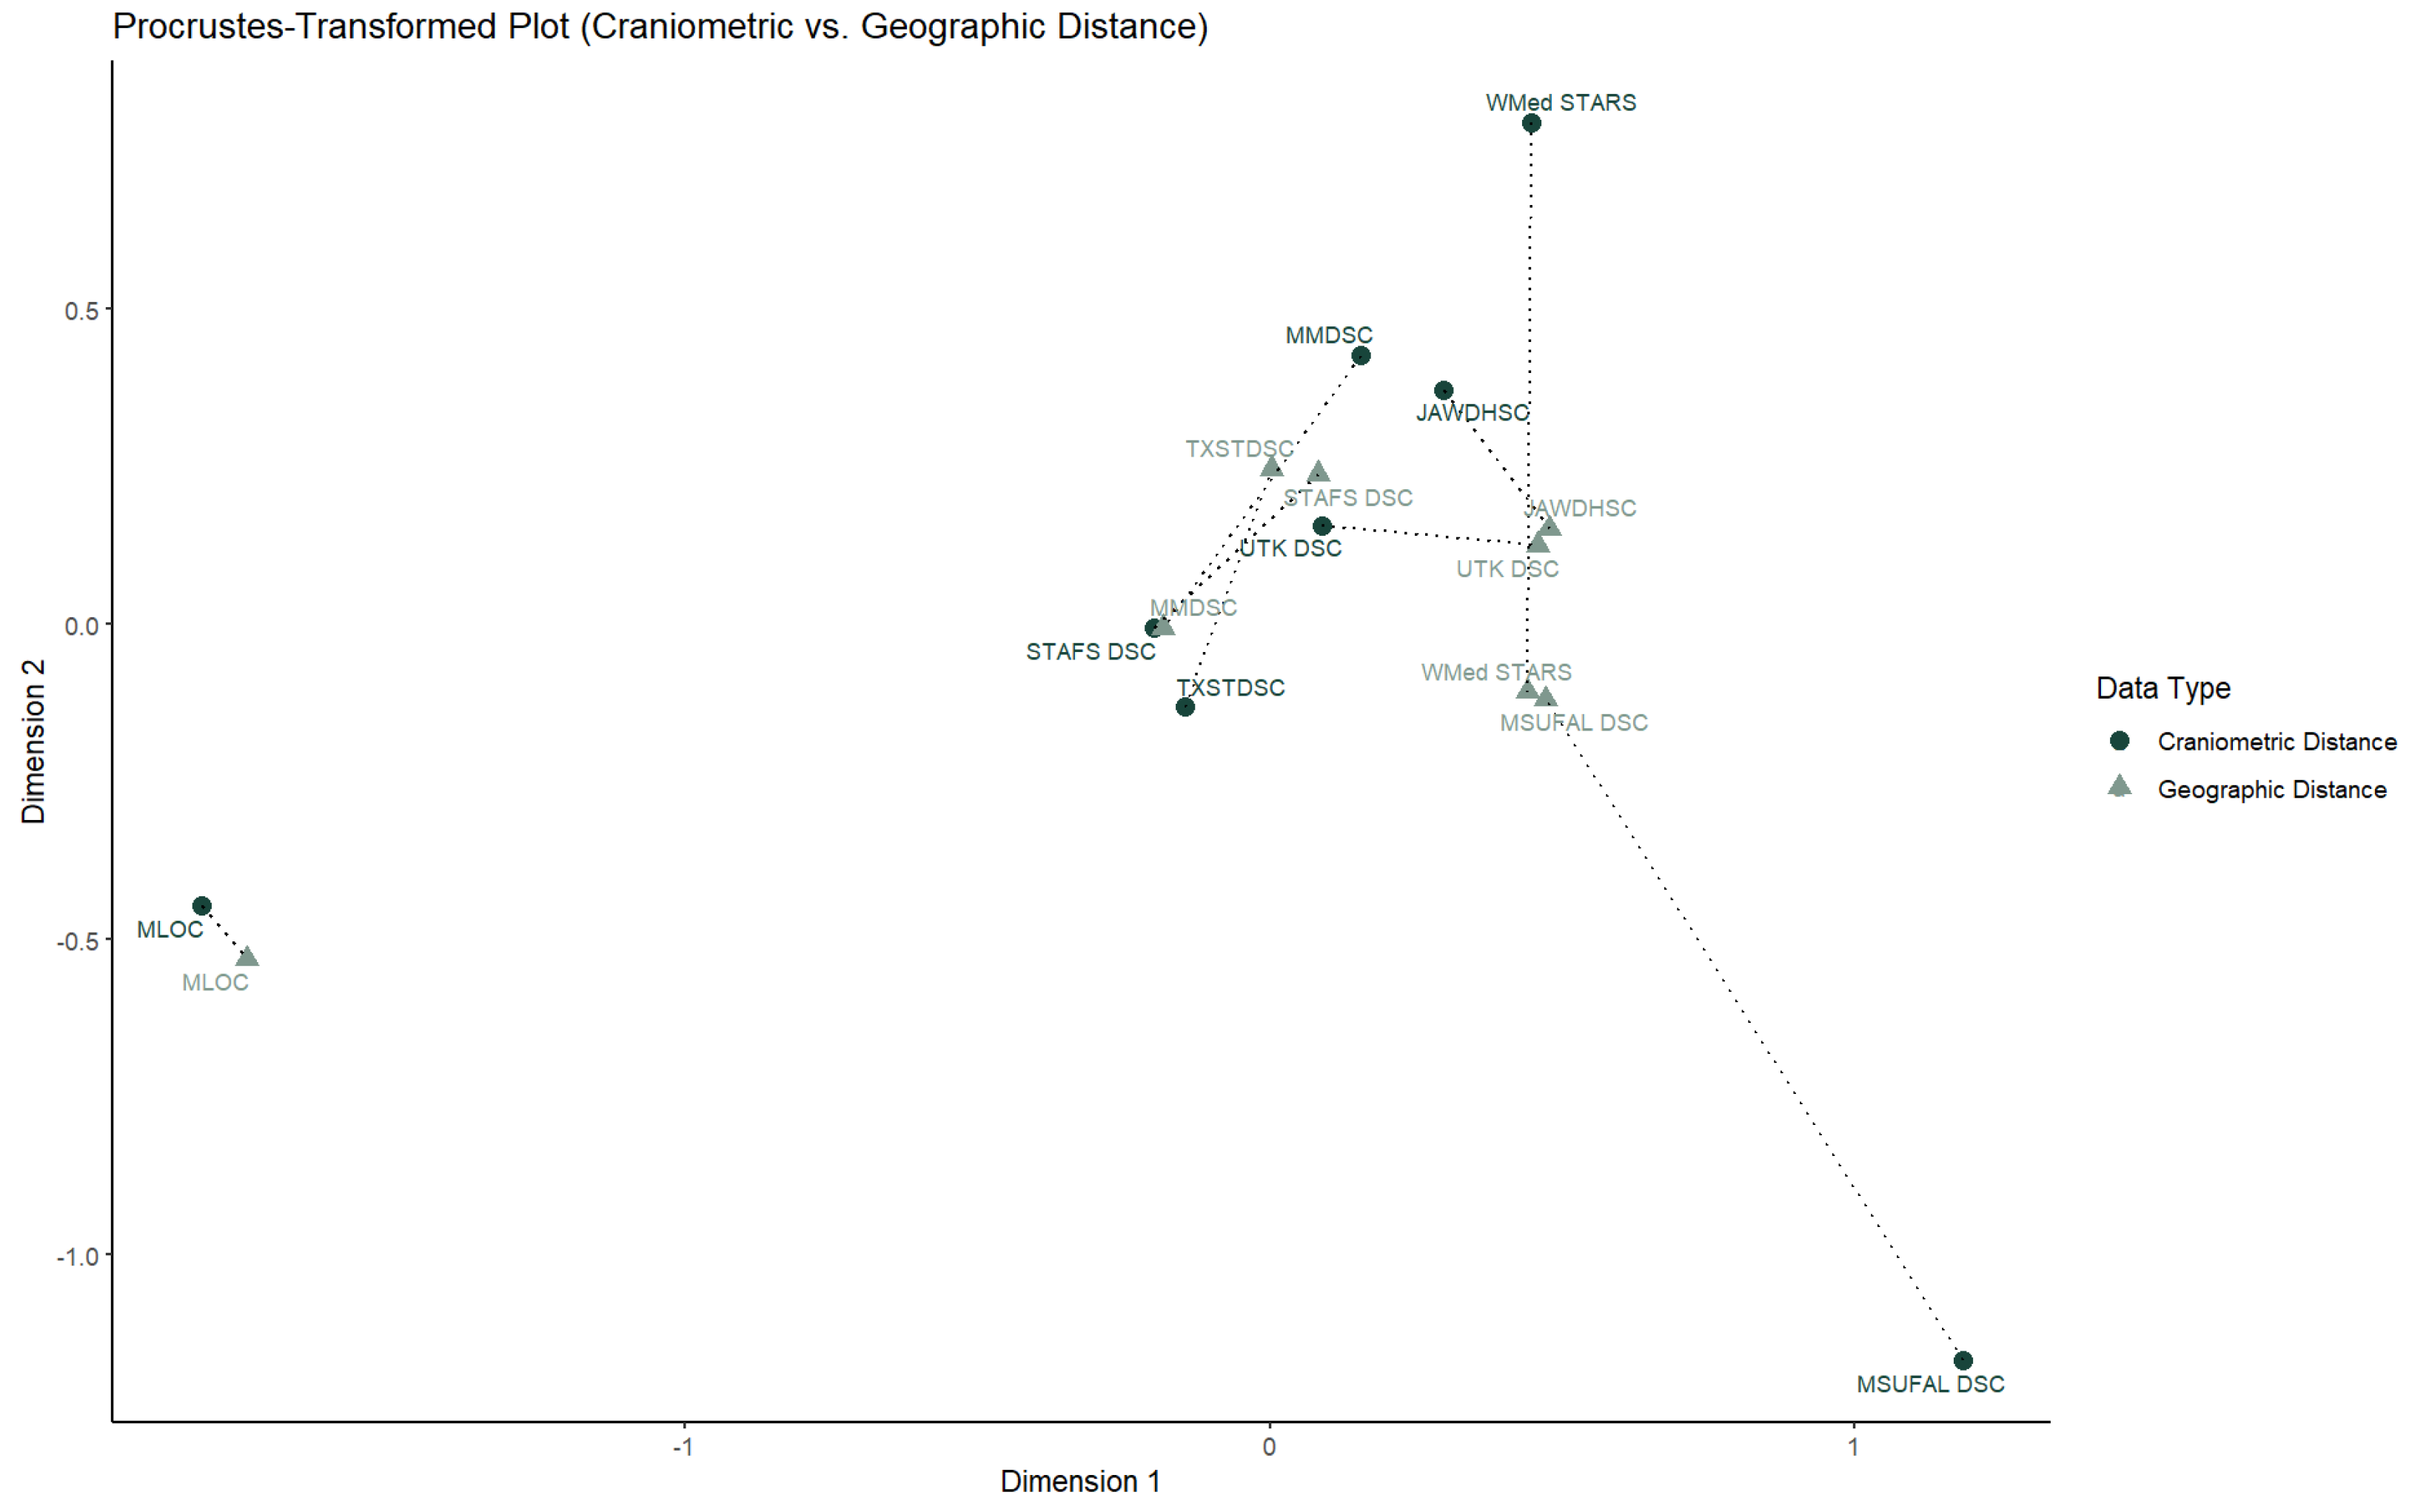
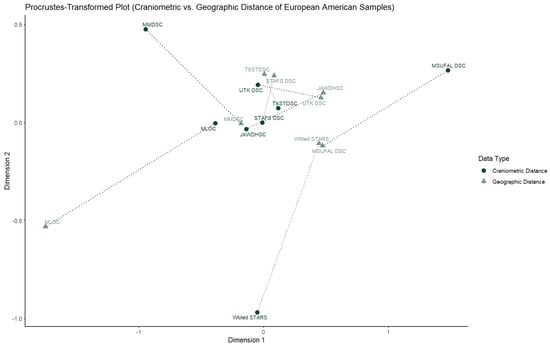
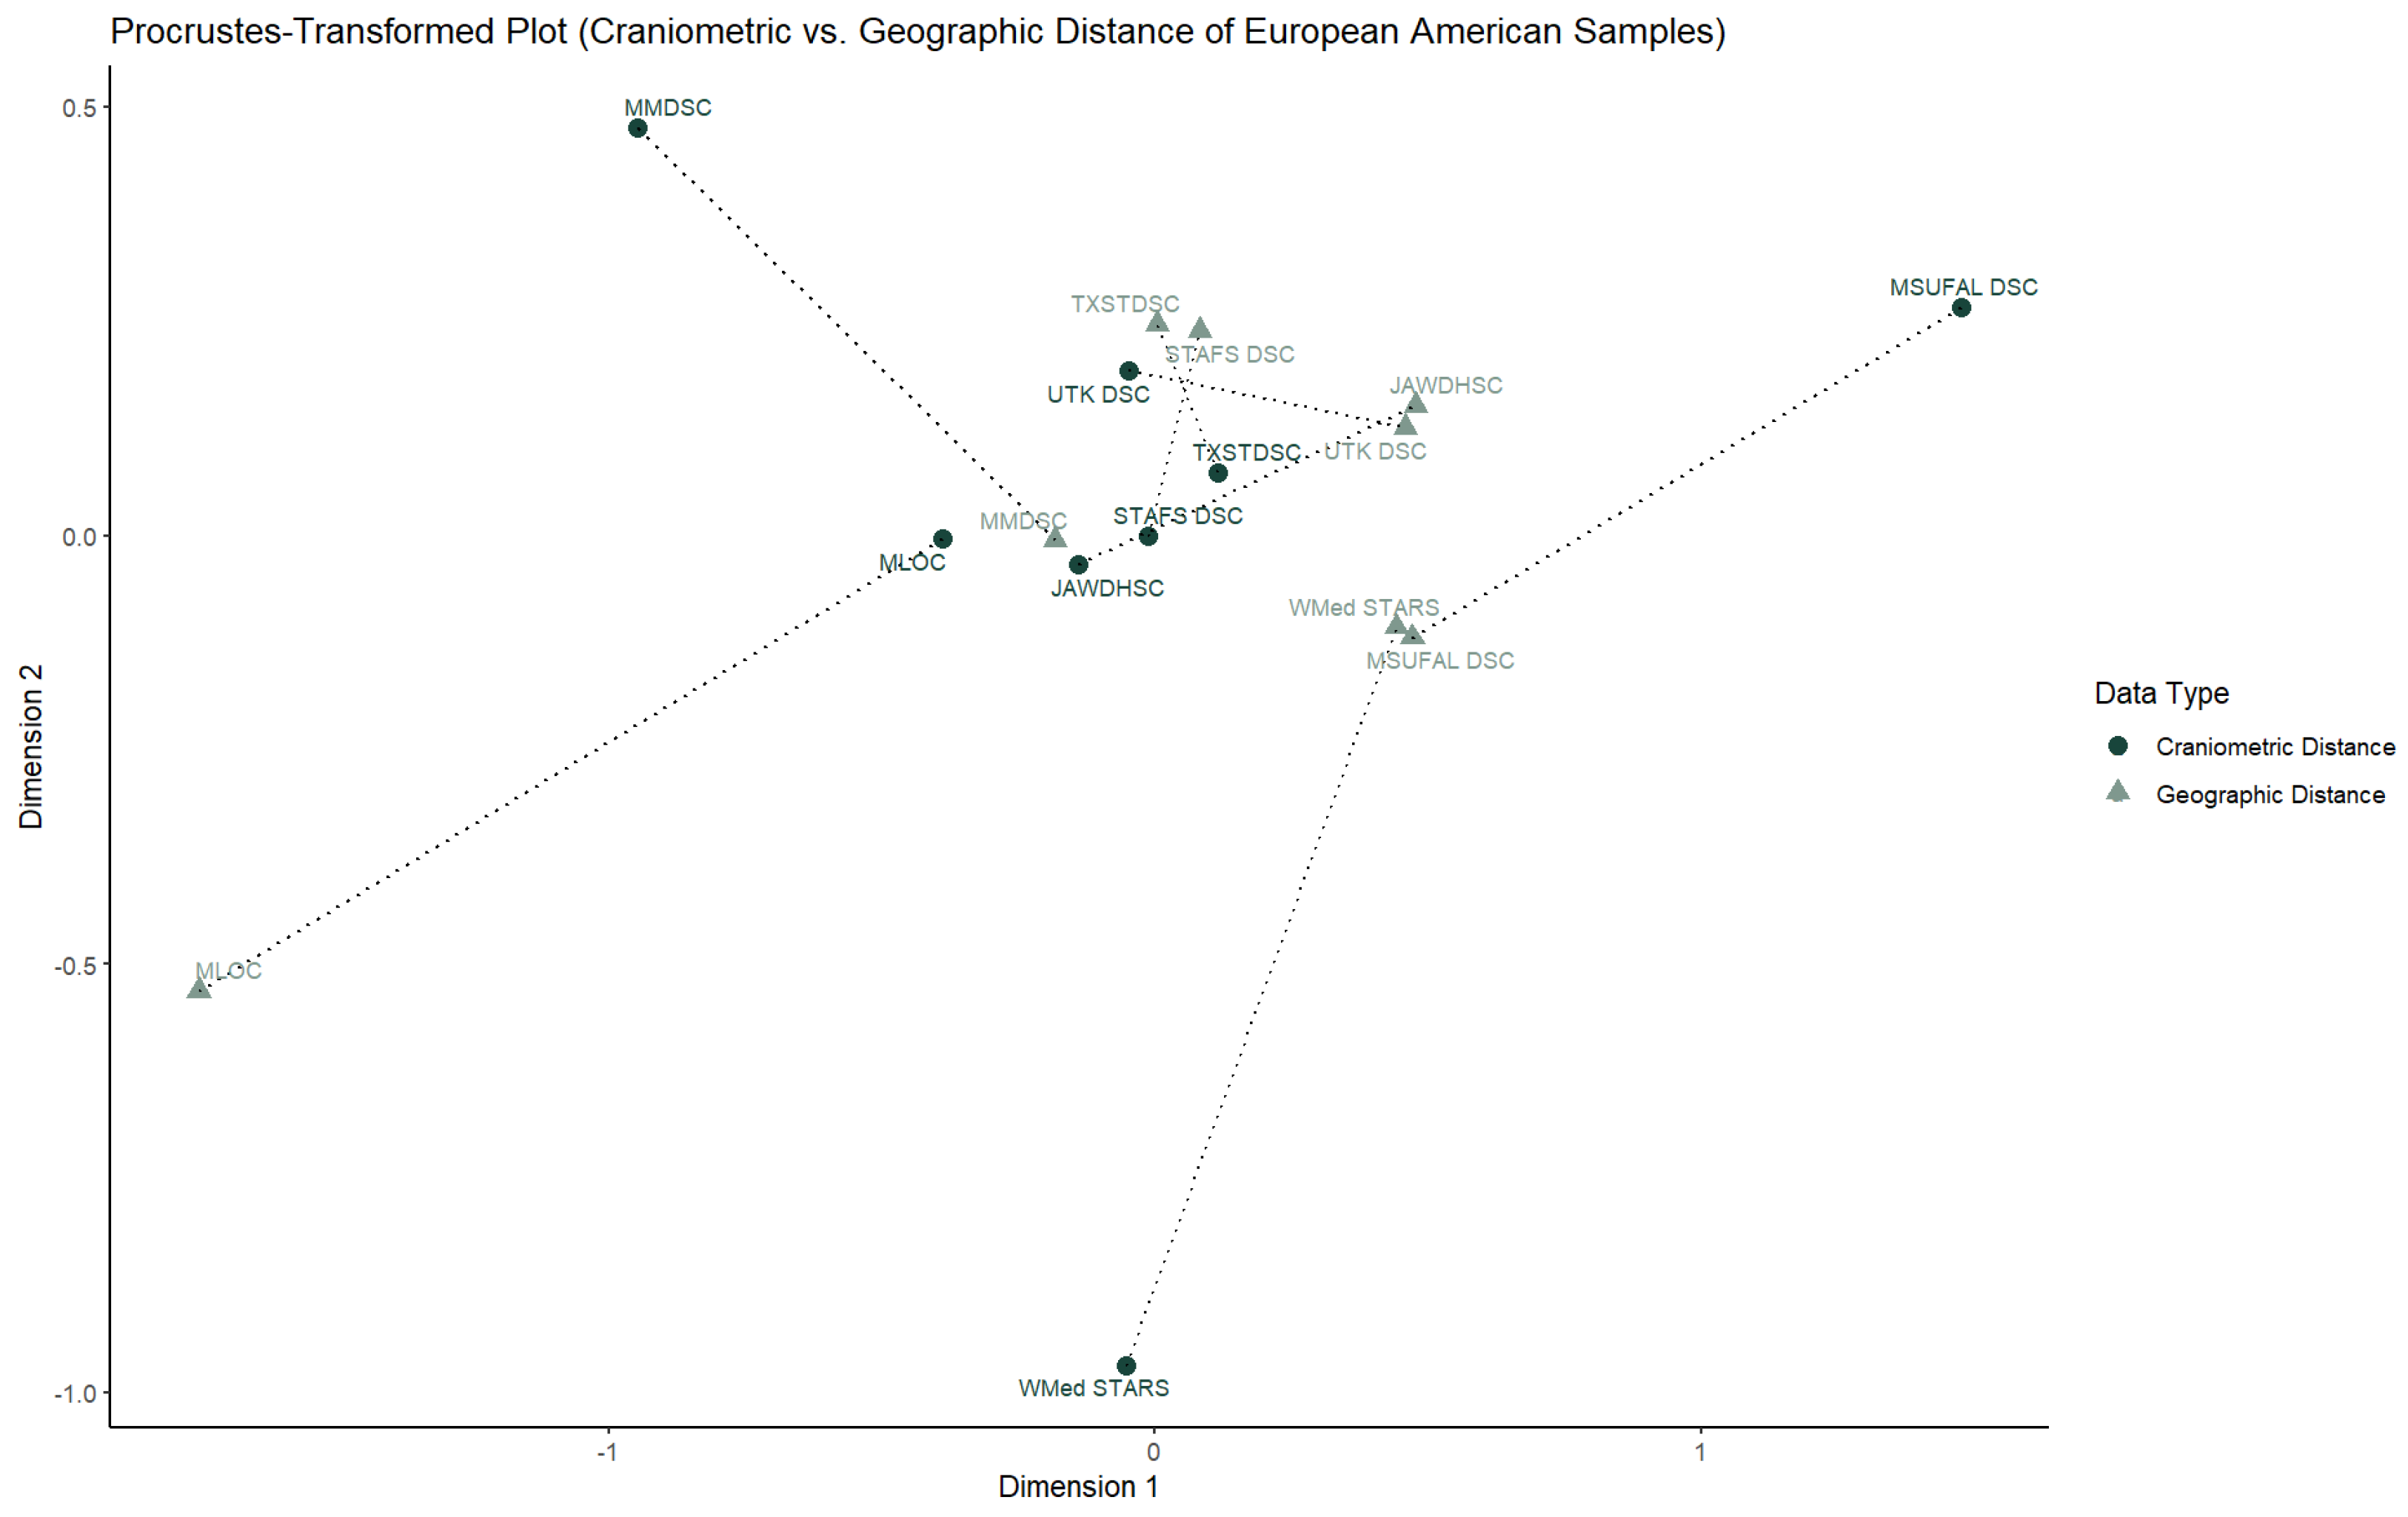
Plotting collection craniometric data and geographic locations together shows that the MSUFAL DSC and WMed STARS have the greatest separation between craniometric data and geographic location (Figure 8). Plotting craniometric and geographic data of the European American samples controls for any population differences driving craniometric separation and highlights the relationship between collections and geography. In Figure 9, the MLOC, MMDSC, MSUFAL DSC, and WMed STARS show unexpected differences from their geographic locations; while the MLOC craniometric sample moves closer to the other European craniometric samples, the MMDSC moves farther away.
Figure 8.
Procrustes-transformed data of cranial morphology and geographic distance among collections. Mahalanobis distances (D2) based on cranial measurements (dark green circles) and geographic distances based on collection locations (light green triangles) were transformed using multidimensional scaling and aligned via Procrustes analysis. Dotted lines connect craniometric centroids and geographic locations for each collection.
Figure 9.
Procrustes-transformed data of cranial morphology and geographic distance among collections using only European American samples. Mahalanobis distances (D2) based on cranial measurements (dark green circles) and geographic distances based on collection locations (light green triangles) were transformed using multidimensional scaling and aligned via Procrustes analysis. Dotted lines connect craniometric centroids and geographic location for each collection.
A linear discriminant function was used to classify all individuals by collection. Due to small sample sizes, the MSUFAL DSC and WMed STARS were excluded. The LOOCV model achieved an overall performance of 32.0% (1.92 times better than chance), with individual group classification rates ranging from 7.6% for JAWDHSC to 45.5% for MMDSC (Table 7).
Table 7.
Classification rate by collection origin (LOOCV).
A second linear discriminant function was created to classify individuals by population and sex; to balance samples, small population and sex groups were removed, and larger groups were downsampled. Overall performance of this model was 49.0% (or 3.92 times better than chance), with individual group classification rates ranging from 33.3% for Asian males and females to 66.7% for European males (Table 8).
Table 8.
Classification rate of individuals by population and sex (LOOCV). “M” and “F” represent male and female.
4. Discussion
This paper addresses whether collection-specific sample bias is reflected in skeletal variation. First, demographic variables were compared across collections to reveal potential sources of bias among the various collections. Second, craniometric data from each collection served as a potential proxy to quantify how sample bias may influence biological data results and whether that bias obscures expected patterns of human variation. Together, these analyses provide a broad perspective on how modern documented skeletal collection samples impact our understanding of human variation and influence the methods developed using that material.
4.1. Demographic Sample Bias
We identified significant differences in demographic composition across all collections. And while no single collection was significantly different from all other collections, all of the collections were significantly different from others for at least one demographic variable (see Table 4). These analyses suggest that demographic variables associated with each collection—whether intentional, such as procurement strategies, or unintentional, like geographic location—likely shape the donor population and result in unique samples that are characteristic of the individual collections.
This analysis highlights pitfalls potentially encountered if only one documented skeletal collection is used for a study. For example, the MLOC may not provide the best sample for age estimation methods since it is predominantly made up of significantly older individuals; however, if a researcher is interested in a diverse sample (ancestries and ethnicities), the MLOC may be one of the better choices. These sample biases are not detrimental, but they do have the potential to impact a study if researchers are unaware of potential biases. As Albanese (2018) said, to employ appropriate sampling strategies, the researcher is responsible for understanding the representativeness of a collection and any inherent sample bias therein.
4.2. Collection-Specific Cranial Variation
We were able to demonstrate that collection origin does influence the collective cranial morphology represented in modern collections (). However, collection is not the most influential factor in that variation—rather, sex has the greatest impact, followed by population, collection, state of birth, age, and birth year.
This supports the earlier work of Moore-Jansen (1989), who, after investigating collection-specific cranial variation between the historic Hamann–Todd and Terry Collections, found that sex was more influential on cranial morphology than collection origin. Although population variability was not directly assessed, he attributed significant differences observed between European Americans in each collection to differences in the European groups represented. During the early twentieth century, when both collections were actively acquiring cadavers, many European immigrants were settling in the United States—Germans and British in and around St. Louis, Missouri, where the Terry Collection originated, and eastern and southern Europeans in Cleveland, Ohio, home to the Hamann–Todd Collection (Moore-Jansen, 1989). As poor immigrants comprised a large proportion of the European sample in those historic collections (Moore-Jansen, 1989; Muller et al., 2017), the differences noted likely reflect population differences. However, Moore-Jansen (1989) argued that modern collections are not impacted by secular change and contain fewer immigrant samples, and therefore would avoid collection-specific sample biases—a conclusion disputed by our findings, as birth year still significantly influences cranial morphology in modern collections.
Visualization of these data to highlight the effect of sample bias on cranial morphology suggested geographic clustering and separation. For example, the JAWDHSC, MSUFAL DSC, STAFS DSC, TXSTDSC, UTK DSC, and WMed STARS cluster with their closest geographic neighbors (see Figure 3A). However, after accounting for variation in cranial morphology attributable to sex and population (see Figure 3B), changes in clustering and separation indicate that population composition at each collection has a confounding effect. Population appears to be the primary contributor to these apparent “geographic” clusters, as collections from similar regions tend to contain donors from similar population groups.
Further investigation using plots of both craniometric and geographic distances reinforces this interpretation (see Figure 8 and Figure 9). When the sample is restricted to European Americans, thereby removing the effect of population, craniometric samples no longer cluster by collection location. The original “geographic” clusters reflect higher proportions of African Americans (MSUFAL DSC), Asian Americans (MLOC), Hispanic individuals (STAFS DSC and TXSTDSC), and European Americans (JAWDHSC, MMDSC, and UTK DSC). Geographic location is therefore only correlated with cranial morphological variation insofar as collections from similar regions contain similar donor populations.
The divergence of the MSUFAL DSC and WMed STARS from other collections may reflect smaller sample sizes; however, the separation of the MMDSC when controlling for population (see Figure 3B–D and Figure 9) remains unexplained. Neither sample size, secular change, nor birthplace accounts for this pattern. The influence of questionable identification status was considered, and individuals transferred or without associated donation documentation were removed from the MMDSC sample (Figure 4); this increased divergence, indicating these individuals were not driving the separation. Intraobserver error was also ruled out. Childhood socioeconomic status may play a role, as low SES has been shown to influence skeletal morphology (Cardoso, 2007), but SES data were unavailable for several collections, including the MMDSC, precluding formal testing.
It is also possible that some individuals in the study sample were incorrectly documented with respect to population or were insufficiently documented (e.g., multiple categories not recorded), particularly given early documentation practices at the MMDSC (Komar & Grivas, 2008). Additionally, New Mexico has a large Hispanic and New Mexican Hispanic population, and census definitions of Hispanic identity as race versus ethnicity have changed over time (Alves-Cardoso et al., 2022; Komar & Grivas, 2008). Documentation reflects contemporary social definitions (Albanese, 2018), meaning individuals accurately documented at the time of donation may be classified differently today. Ultimately, some factor distinguishes the MMDSC from other collections, whether unique population histories or bias introduced through documentation practices. If the former, future work should compare the MMDSC with collections of similar population histories, such as other collections in the southwestern United States; if the latter, the MMDSC may be less representative of the modern U.S. population.
Although collection origin influences collective cranial morphology, it does not obscure broader patterns of human skeletal variation. Samples preferentially cluster by population and sex rather than by collection of origin (see Figure 7). This contrasts with Albanese (2018), who argued that similarities among individuals within the same collection reflect mortality bias and secular change rather than population structure. If that interpretation were correct, the samples in this study should have clustered primarily by collection despite a shared temporal and geographic context; instead, clustering by biological parameters persisted. Differences in temporal depth and geographic origin between the Terry and Coimbra collections may explain the discrepancies observed by Albanese (2003, 2018).
The classification results further suggest that sample bias does not obscure human variation. Higher accuracies were achieved when classifying individuals by population and sex than by collection. If sample bias created artificial “populations,” classification by collection would be substantially higher. Despite a larger sample size and fewer categories, the collection-based model produced lower accuracies, suggesting that differences attributable to sample bias are relatively subtle. Although population–sex classification relied on smaller sample sizes, numerous studies demonstrate high classification accuracy for these parameters (Dunn et al., 2020). Together, these analyses indicate that documented skeletal collections remain valid and reliable sources for understanding population diversity and sex differences, even in the presence of collection-specific bias.
One limitation of this study is the absence of a historic collection sample, which would have better contextualized patterns seen between modern collections. Although the use of eight United States-based modern collections allowed comparison beyond the effects of different geographic origins, temporal contexts, and population histories, the inclusion of a historic collection would have ensured direct comparability of this study to previous studies on sample bias (Albanese, 2003; Moore-Jansen, 1989). Future studies would benefit from such an inclusion.
4.3. Implications for Biological and Forensic Anthropology
This study has two primary implications for biological and forensic anthropology. First, significant demographic differences among collections indicate the presence of collection-specific sample bias. Researchers must therefore understand the historical and curatorial context of their study collections prior to analysis. Ethical considerations surrounding body donation have increased scholarly attention to documented collections (Alves-Cardoso et al., 2022), yet published information can become outdated as collections grow. Engagement with curators and collection managers is essential, and this study would not have been possible without their expertise. While sample bias exists, careful contextualization and sampling strategies can mitigate its effects (Albanese, 2018).
5. Conclusions
This study investigated the presence of collection-specific sample bias and its impact on interpretations of human skeletal variation. We identified significant demographic differences among collections, confirming the existence of collection-specific bias and underscoring the need for informed sampling strategies.
Importantly, although collection-specific bias affects cranial morphology, its influence is weaker than that of sex and population. Individuals consistently exhibit greater similarity with others of the same population and sex than with those from the same collection. These results support the continued use of documented skeletal collections for anthropological research and refute claims that population affinity studies are simply artifacts of sample bias.
Future research should further examine sample bias in collections from the southwestern United States, prioritize inclusion of modern and historic collections, extend analyses to other skeletal traits (e.g., nonmetric traits), and explore the potential influence of childhood socioeconomic status, which could not be assessed here due to limited documentation across collections.
Supplementary Materials
The following supporting information can be downloaded at https://www.mdpi.com/article/10.3390/humans6030034/s1, Supplementary File S1: R code used for processing and analysis of craniometric data; Supplementary File S2: R code used for processing and analysis of demographic data.
Author Contributions
Conceptualization, R.R.D. and J.T.H.; methodology, R.R.D. and J.T.H.; formal analysis, R.R.D.; investigation, R.R.D. and J.T.H.; data curation, R.R.D.; writing—original draft preparation, R.R.D. and J.T.H.; writing—review and editing, R.R.D. and J.T.H.; visualization, R.R.D. and J.T.H.; supervision, J.T.H.; project administration, R.R.D.; funding acquisition, R.R.D. and J.T.H. All authors have read and agreed to the published version of the manuscript.
Funding
This research was partially supported by the National Institute of Justice, Office of Justice Programs, U.S. Department of Justice, Graduate Research Fellowship, under Award No. 15PNIJ-23-GG-01939-RESS. The opinions, findings, and conclusions or recommendations expressed in this publication are those of the authors and do not necessarily reflect the views of the U.S. Department of Justice. This research was also partially supported by a Corey Endowment Award and a Research Scholars Award from the College of Social Science, Michigan State University.
Institutional Review Board Statement
This study was reviewed by the Michigan State University Human Research Protection Program and has been determined to be exempt under 28 CFR 46.101(b) 2 (MSU STUDY ID: STUDY00009767; determination date: 2 November 2023).
Informed Consent Statement
Not applicable.
Data Availability Statement
The code supporting the conclusions of this study (also provided as Supplementary Files) are openly available in a GitHub repository at: https://github.com/rhiandunn/Collection-Specific_Sample_Bias_in_United_States-Based_Documented_Skeletal_Collections/tree/main/Sample-Bias-R-Code (accessed on 26 April 2026).
Acknowledgments
The authors sincerely thank the silent teachers and donors who have made this research possible. Additionally, this research would not have been possible without the help of all curators and collection managers who answered our many questions. Lastly, the authors are grateful to C. Isaac, M. Schaefer, G. Wrobel, and M. Ancern for their support and useful insight.
Conflicts of Interest
The authors declare no conflicts of interest.
References
- Albanese, J. (2003). Identified skeletal reference collections and the study of human variation [Unpublished Doctoral dissertation]. McMaster University.
- Albanese, J. (2018). Strategies for dealing with bias in identified reference collections and implications for research in the 21st century. In C. Y. Henderson, & F. A. Cardoso (Eds.), Identified skeletal collections: The testing ground of anthropology? (pp. 59–82). Archaeopress Publishing Ltd. [Google Scholar]
- Alves-Cardoso, F., Campanacho, V., & Plens, C. R. (2022). Topical collection “The rise of forensic anthropology and documented human osteological collections”. Forensic Sciences, 2(3), 551–555. [Google Scholar] [CrossRef] [Scilit]
- Armelli, K., Dunn, R. R., & Isaac, C. V. (2025). Body donation: Opinions and practices in forensic anthropology. Forensic Anthropology, 9(1), 1–11. [Google Scholar] [CrossRef] [Scilit]
- Ateş, C., Kaymaz, Ö., Kale, H., & Tekindal, M. A. (2019). Comparison of test statistics of nonnormal and unbalanced samples for multivariate analysis of variance in terms of Type-I error rates. Computational and Mathematical Methods, 2019(1), 2173638. [Google Scholar] [CrossRef] [Scilit] [PubMed]
- Azur, M. J., Stuart, E. A., Frangakis, C., & Leaf, P. J. (2011). Multiple imputation by chained equations: What is it and how does it work? International Journal of Methods in Psychiatric Research, 20(1), 40–49. [Google Scholar] [CrossRef] [Scilit] [PubMed]
- Bass, B., & Jefferson, J. (2003). Death’s acre: Inside the legendary forensic lab the body farm where the dead do tell tales. C. P. Putnam’s Sons. [Google Scholar]
- Body Donation. (2024). Forensic Anthropology Center, University of Tennessee, Knoxville. Available online: https://fac.utk.edu/body-donation/ (accessed on 13 October 2024).
- Campanacho, V., Cardoso, F. A., & Ubelaker, D. H. (2021). Documented skeletal collections and their importance in forensic anthropology in the United States. Forensic Sciences, 1, 228–239. [Google Scholar] [CrossRef] [Scilit]
- Cardoso, H. F. V. (2007). Environmental effects on skeletal versus dental development. American Journal of Physical Anthropology, 132, 223–233. [Google Scholar] [CrossRef] [Scilit] [PubMed]
- Christensen, A. M. (2006). Moral considerations in body donation for scientific research: A unique look at the University of Tennessee’s Anthropological Research Facility. Bioethics, 20(3), 136–145. [Google Scholar] [CrossRef] [Scilit] [PubMed]
- de la Cova, C. (2019). Marginalized bodies and the construction of the Robert J. Terry collection. In M. L. Mant, & A. J. Holland (Eds.), Bioarchaeology of marginalized people (pp. 133–155). Springer. [Google Scholar]
- de la Cova, C. (2021). Making silenced voices speak: Restoring neglected and ignored identities in anatomical collections. In C. M. Cheverko, J. R. Prince-Buitenhuys, & M. Hubbe (Eds.), Theoretical approaches in bioarchaeology (pp. 150–169). Routledge. [Google Scholar]
- Dunn, R. R., Spiros, M. C., Kamnikar, K. R., Plemons, A. M., & Hefner, J. T. (2020). Ancestry estimation in forensic anthropology: A review. WIREs Forensic Science, 2, e1369. [Google Scholar] [CrossRef] [Scilit]
- George, R. L., Zejdlik, K., Messer, D. L., & Passalacqua, N. V. (2022). The John A. Williams human skeletal collection at Western Carolina University. Forensic Sciences, 2, 362–370. [Google Scholar] [CrossRef] [Scilit]
- Gocha, T. P., Mavroudas, S. R., & Wescott, D. J. (2022). The Texas State donated skeletal collection at the Forensic Anthropology Center at Texas State. Forensic Sciences, 2(1), 7–19. [Google Scholar] [CrossRef] [Scilit]
- Gordon, C. C., & Bradtmiller, B. (1992). Interobserver error in a large-scale anthropometric survey. American Journal of Human Biology, 4(2), 253–263. [Google Scholar] [CrossRef] [Scilit] [PubMed]
- Henderson, C. Y. (2018). Introduction. In C. Y. Henderson, & F. A. Cardoso (Eds.), Identified skeletal collections: The testing ground of anthropology? (pp. 1–10). Archaeopress Publishing Ltd. [Google Scholar][Green Version]
- Jantz, L. M., & Jantz, R. L. (2000). Secular change in craniofacial morphology. American Journal of Human Biology, 12(3), 327–338. [Google Scholar] [CrossRef] [Scilit]
- Jantz, R. L. (2019). Novel discoveries from the forensic anthropology data bank. The FASEB Journal, 33(S1), 202.1. [Google Scholar] [CrossRef] [Scilit]
- Jantz, R. L., & Meadows Jantz, L. (2016). The remarkable change in Euro-American cranial shape and size. Human Biology, 88(1), 56–64. [Google Scholar] [CrossRef] [Scilit] [PubMed]
- Jantz, R. L., Meadows Jantz, L., & Devlin, J. L. (2016). Secular changes in the postcranial skeleton of American Whites. Human Biology, 88(1), 65–75. [Google Scholar] [CrossRef] [Scilit] [PubMed]
- Kamnikar, K. R., Hefner, J. T., Monsalve, T., & Flórez, L. M. B. (2021). Craniometric variation in a regional sample from Antioquia, Medellín, Colombia: Implications for forensic work in the Americas. Forensic Anthropology, 5(3), 199–210. [Google Scholar] [CrossRef] [Scilit]
- Komar, D., & Grivas, D. (2008). Manufactured populations: What do contemporary reference skeletal collections represent? American Journal of Physical Anthropology, 137(2), 244–253. [Google Scholar] [CrossRef] [Scilit] [PubMed]
- Langley, N. R., Jantz, R. L., & Ousley, S. D. (2016). The effect of novel environments on modern American skeletons. Human Biology, 88(1), 5–13. [Google Scholar] [CrossRef] [Scilit] [PubMed]
- Mann, R. W., Labrash, S., & Lozanoff, S. (2020). A new osteological resource at the John A. Burn’s School of Medicine. Hawai’i Journal of Health & Social Welfare, 79(6), 202–203. [Google Scholar]
- Moore-Jansen, P. H. (1989). A multivariate craniometric analysis of secular change and variation among recent North American populations [Unpublished Doctoral dissertation]. University of Tennessee.
- Muller, J. L., Pearlstein, K. E., & de la Cova, C. (2017). Dissection and documented skeletal collections: Embodiments of legalized inequality. In K. C. Nystrom (Ed.), The bioarchaeology of dissection and autopsy in the United States (pp. 185–201). Springer. [Google Scholar]
- Ousley, S. D. (2014). 3Skull: Three-dimensional skeletal analysis software. Computer Software. Available online: https://statsmachine.net/software/ (accessed on 3 September 2026).
- R Core Team. (2023). R: A language and environment for statistical computing. R Foundation for Statistical Computing. Available online: https://www.R-project.org (accessed on 13 October 2024).
- Relethford, J. H. (2009). Race and global patterns of phenotypic variation. American Journal of Physical Anthropology, 139(1), 16–22. [Google Scholar] [CrossRef] [Scilit] [PubMed]
- Revware Inc. (2023). MicroScribe digitizer. Available online: https://www.revware.net (accessed on 3 September 2026).
- Sadler, A. M., Sadler, B. L., & Stason, E. B. (1968). The uniform anatomical gift act: A model for reform. JAMA, 206(11), 2501–2506. [Google Scholar] [CrossRef] [Scilit] [PubMed]
- Sharman, J., & Albanese, J. (2018). Bioarchaeology and identified skeletal collections: Problems and potential solutions. In C. Y. Henderson, & F. A. Cardoso (Eds.), Identified skeletal collections: The testing ground of anthropology? (pp. 107–122). Archaeopress Publishing Ltd. [Google Scholar]
- Singh, A. S., & Masuku, M. B. (2014). Sampling techniques and determination of sample size in applied statistics research: An overview. International Journal of Economics, Commerce and Management, 2(11), 1–22. [Google Scholar]
- Smith, J. R. (2019). Living with observational data in biological anthropology. American Journal of Physical Anthropology, 169, 591–598. [Google Scholar] [CrossRef] [Scilit] [PubMed]
- Sparks, C. S., & Jantz, R. L. (2002). A reassessment of human cranial plasticity: Boas revisited. Proceedings of the National Academy of Sciences, 99(23), 14636–14639. [Google Scholar] [CrossRef] [Scilit] [PubMed]
- Spradley, M. K. (2008). Biological anthropological aspects of the African diaspora [Unpublished Doctoral dissertation]. University of Tennessee.
- Spradley, M. K., Stull, K. E., & Hefner, J. T. (2016). Craniofacial secular change in Mexican migrants. Human Biology, 88(1), 15–29. [Google Scholar] [CrossRef] [Scilit] [PubMed]
- STAFS Research. (2024). Southeast texas applied forensic science facility. Sam Houston State University. Available online: https://ifrti.org/STAFS/research.html (accessed on 13 October 2024).
- Utermohle, C. J., & Zegura, S. L. (1982). Intra- and interobserver error in craniometry: A cautionary tale. American Journal of Physical Anthropology, 57(3), 303–310. [Google Scholar] [CrossRef] [Scilit] [PubMed]
- Utermohle, C. J., Zegura, S. L., & Heathcote, G. M. (1983). Multiple observers, humidity, and choice of precision statistics: Factors influencing craniometric data quality. American Journal of Physical Anthropology, 61(1), 85–95. [Google Scholar] [CrossRef] [Scilit] [PubMed]
- van Buuren, S., & Groothuis-Oudshoorn, K. (2011). mice: Multivariate imputation by chained equations in R. Journal of Statistical Software, 45(3), 1–67. [Google Scholar] [CrossRef] [Scilit]
- Winburn, A. P., Jennings, A. L., Steadman, D. W., & DiGangi, E. A. (2022). Ancestral diversity in skeletal collections: Perspectives on African American body donation. Forensic Anthropology, 5(2), 141–152. [Google Scholar] [CrossRef] [Scilit]

Disclaimer/Publisher’s Note: The statements, opinions and data contained in all publications are solely those of the individual author(s) and contributor(s) and not of MDPI and/or the editor(s). MDPI and/or the editor(s) disclaim responsibility for any injury to people or property resulting from any ideas, methods, instructions or products referred to in the content. |
© 2026 by the authors. Licensee MDPI, Basel, Switzerland. This article is an open access article distributed under the terms and conditions of the Creative Commons Attribution (CC BY) license.