


Abstract
Sargassum fusiforme is a commercially important macroalga in Eastern Asia. To support the conservation and restoration of S. fusiforme populations, we investigated its predominant reproductive mode using a population genetics approach. Two sampling schemes were employed: random sampling of 80 samples at >1 m intervals across four sites, and quadrat sampling of 207 samples using 50 cm × 50 cm quadrats subdivided into 10 cm grids at two sites. Clonemates were identified based on the microsatellite genotypes. In random sampling, only three clonal pairs were detected. In the quadrat sampling, each quadrat contained 4–7 genets, with an average extent of 23.2 ± 14.3 cm (standard deviation) and a maximum of 70.7 cm. The genetic indices (Pareto β, inbreeding coefficient, variance of inbreeding coefficient, genotypic richness, and synthetic linkage disequilibrium) suggested higher clonality at Site B than at Site D. Contemporary gene flow analysis indicated that over 65% of sexual recruitment was limited to within the quadrats, whereas at least 10% extended over meters to kilometers. Taken together, these results suggest that S. fusiforme disperses its offspring both sexually and clonally on a small scale and sexually on a larger scale.
1. Introduction
Sargassum fusiforme (Harvey) Setchell—a perennial macroalga belonging to the family Sargassaceae (class Phaeophyceae, order Fucales)—is widely distributed across Japan, Korea, and China [1]. This species inhabits the lower intertidal zones of rocky coasts and is extensively utilized as a food resource in East Asia. Aquaculture-based production is dominant in China (18,905 t DW: [2]) and Korea (36,170 t FW: [3]). In contrast, Japan relies exclusively on wild harvesting (8000–10,000 t FW; [4]). However, wild populations in Japan and China have been declining due to herbivory by fish [5,6,7] and profit-driven overharvesting [8]. Thus, the conservation and recovery of wild S. fusiforme populations has become an urgent priority.
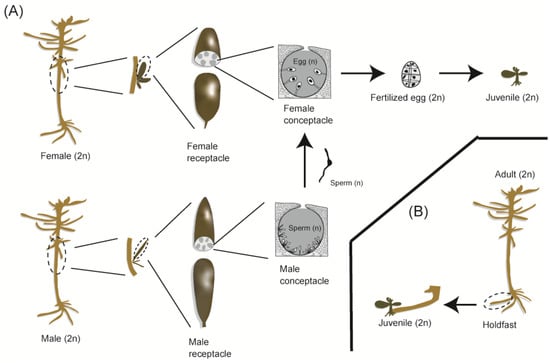
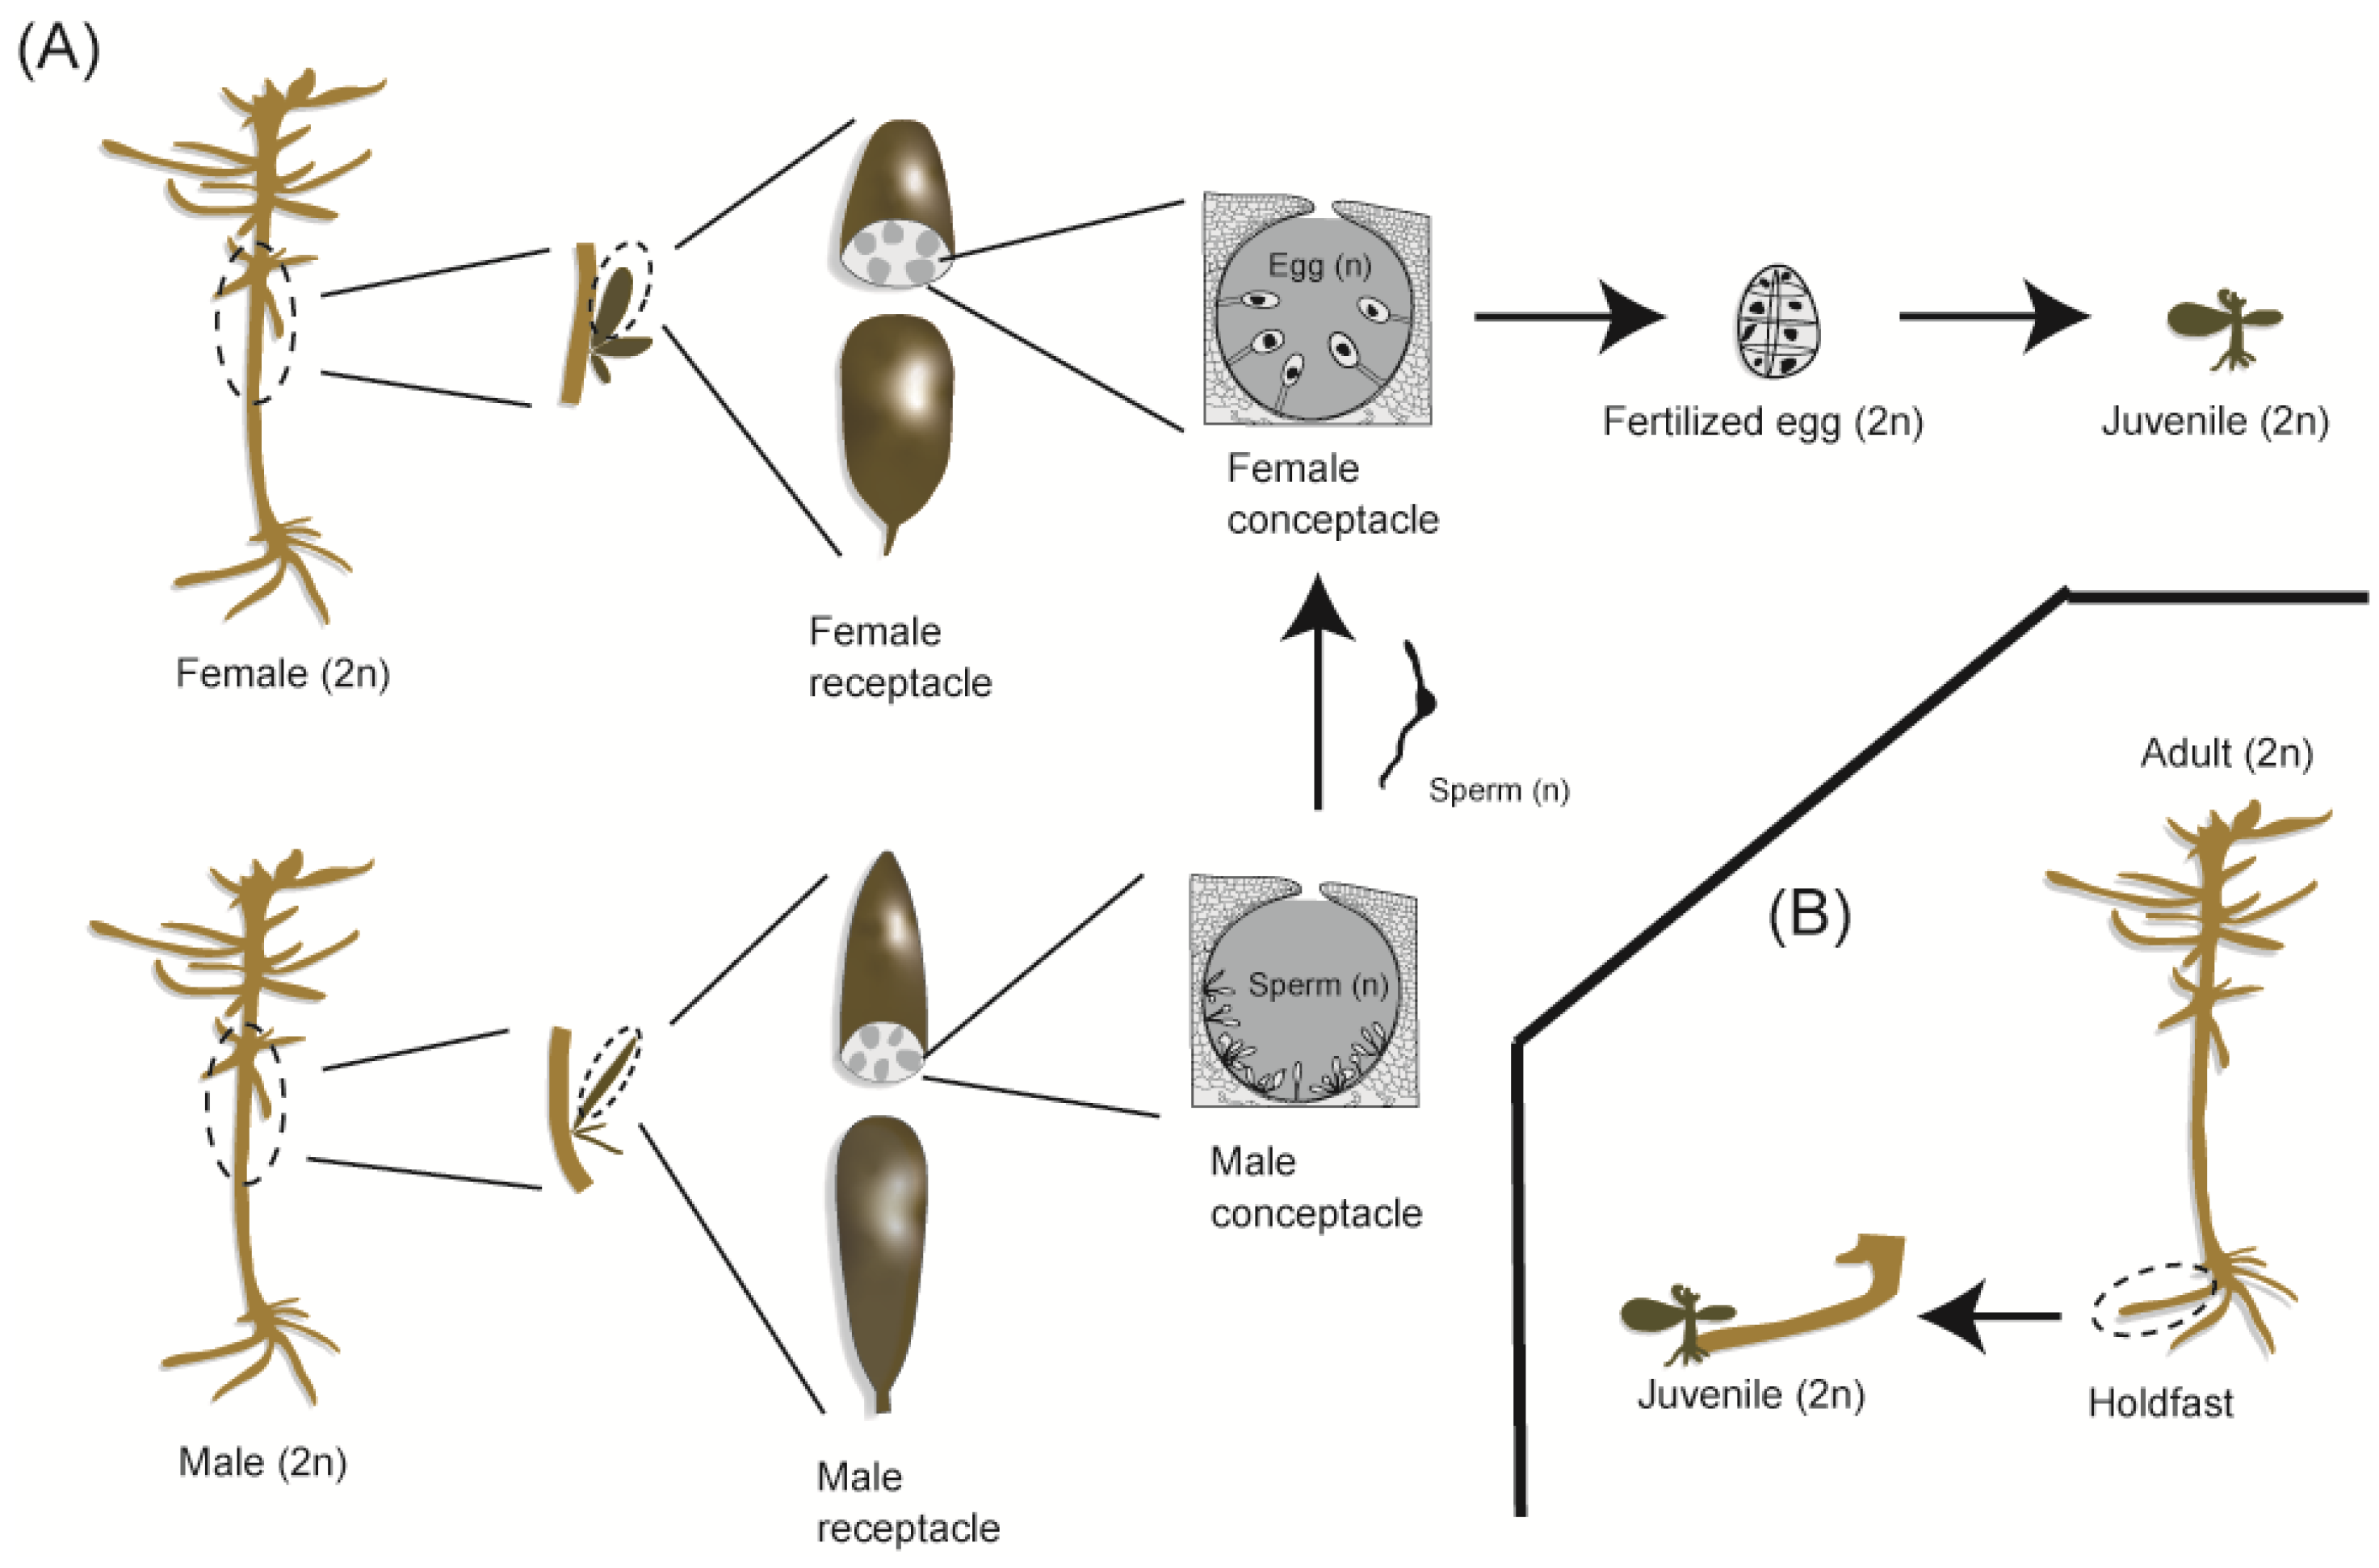
As with other members of the order Fucales, S. fusiforme exhibits a diplontic life cycle. However, while most fucalean species reproduce exclusively through sexual reproduction, S. fusiforme is unique in its ability to also reproduce via clonal propagation [9]. In its sexual phase, dioecious sporophytes bear receptacles and produce zygotes by fertilizing eggs with sperm released from female and male conceptacles, respectively (Figure 1A). Notably, parthenogenesis is known to be absent in Fucales [10]. Distinct from these sexual processes, clonal propagation in S. fusiforme involves new shoots emerging from the tip of filamentous holdfasts (Figure 1B). Each year, the axis, branches, and holdfasts are shed, leaving only the apical buds to persist. Consequently, the physical connection between clonemates is lost [9]. As a result, clonally produced ramets become physically independent and are indistinguishable from sexually derived recruits in natural populations. This fragmentation makes it difficult to identify clonal individuals based solely on field observations. Therefore, molecular markers are required to identify clonemates accurately and to evaluate the relative contributions of sexual and clonal reproduction in natural populations.
Figure 1.
Schematic illustration of reproductive modes of Sargassum fusiforme. (A) Sexual reproduction and (B) clonal propagation. This illustration was drawn by Sota Minamiguchi.
Despite the difficulty of distinguishing sexually and clonally derived recruits in the field, previous observations have suggested that clonal propagation predominates in gap recovery [11] and propagule recruitment [12]. However, egg release and receptacle formation occur commonly in S. fusiforme [12,13,14,15]. Moreover, the natural establishment of S. fusiforme beds on newly installed artificial concrete blocks has been reported [16,17], suggesting that zygotes released from nearby populations serve as a source of recruits. Therefore, in addition to clonal propagation, sexual reproduction may also play a significant role in maintaining S. fusiforme populations.
Despite the evidence for both clonal and sexual reproduction, their relative contributions to the maintenance of natural populations remain unclear. Population genetic analysis is an effective approach for identifying clonemates and inferring the prevailing reproductive mode in S. fusiforme. Similar approaches have been widely employed to investigate clonality in vascular plants (e.g., [18,19]). Therefore, the aim of this study was to infer the prevailing reproductive mode of S. fusiforme using a population genetic approach.
2. Materials and Methods
2.1. Sampling Location
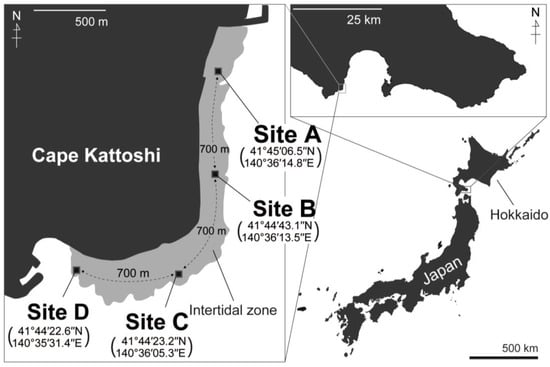
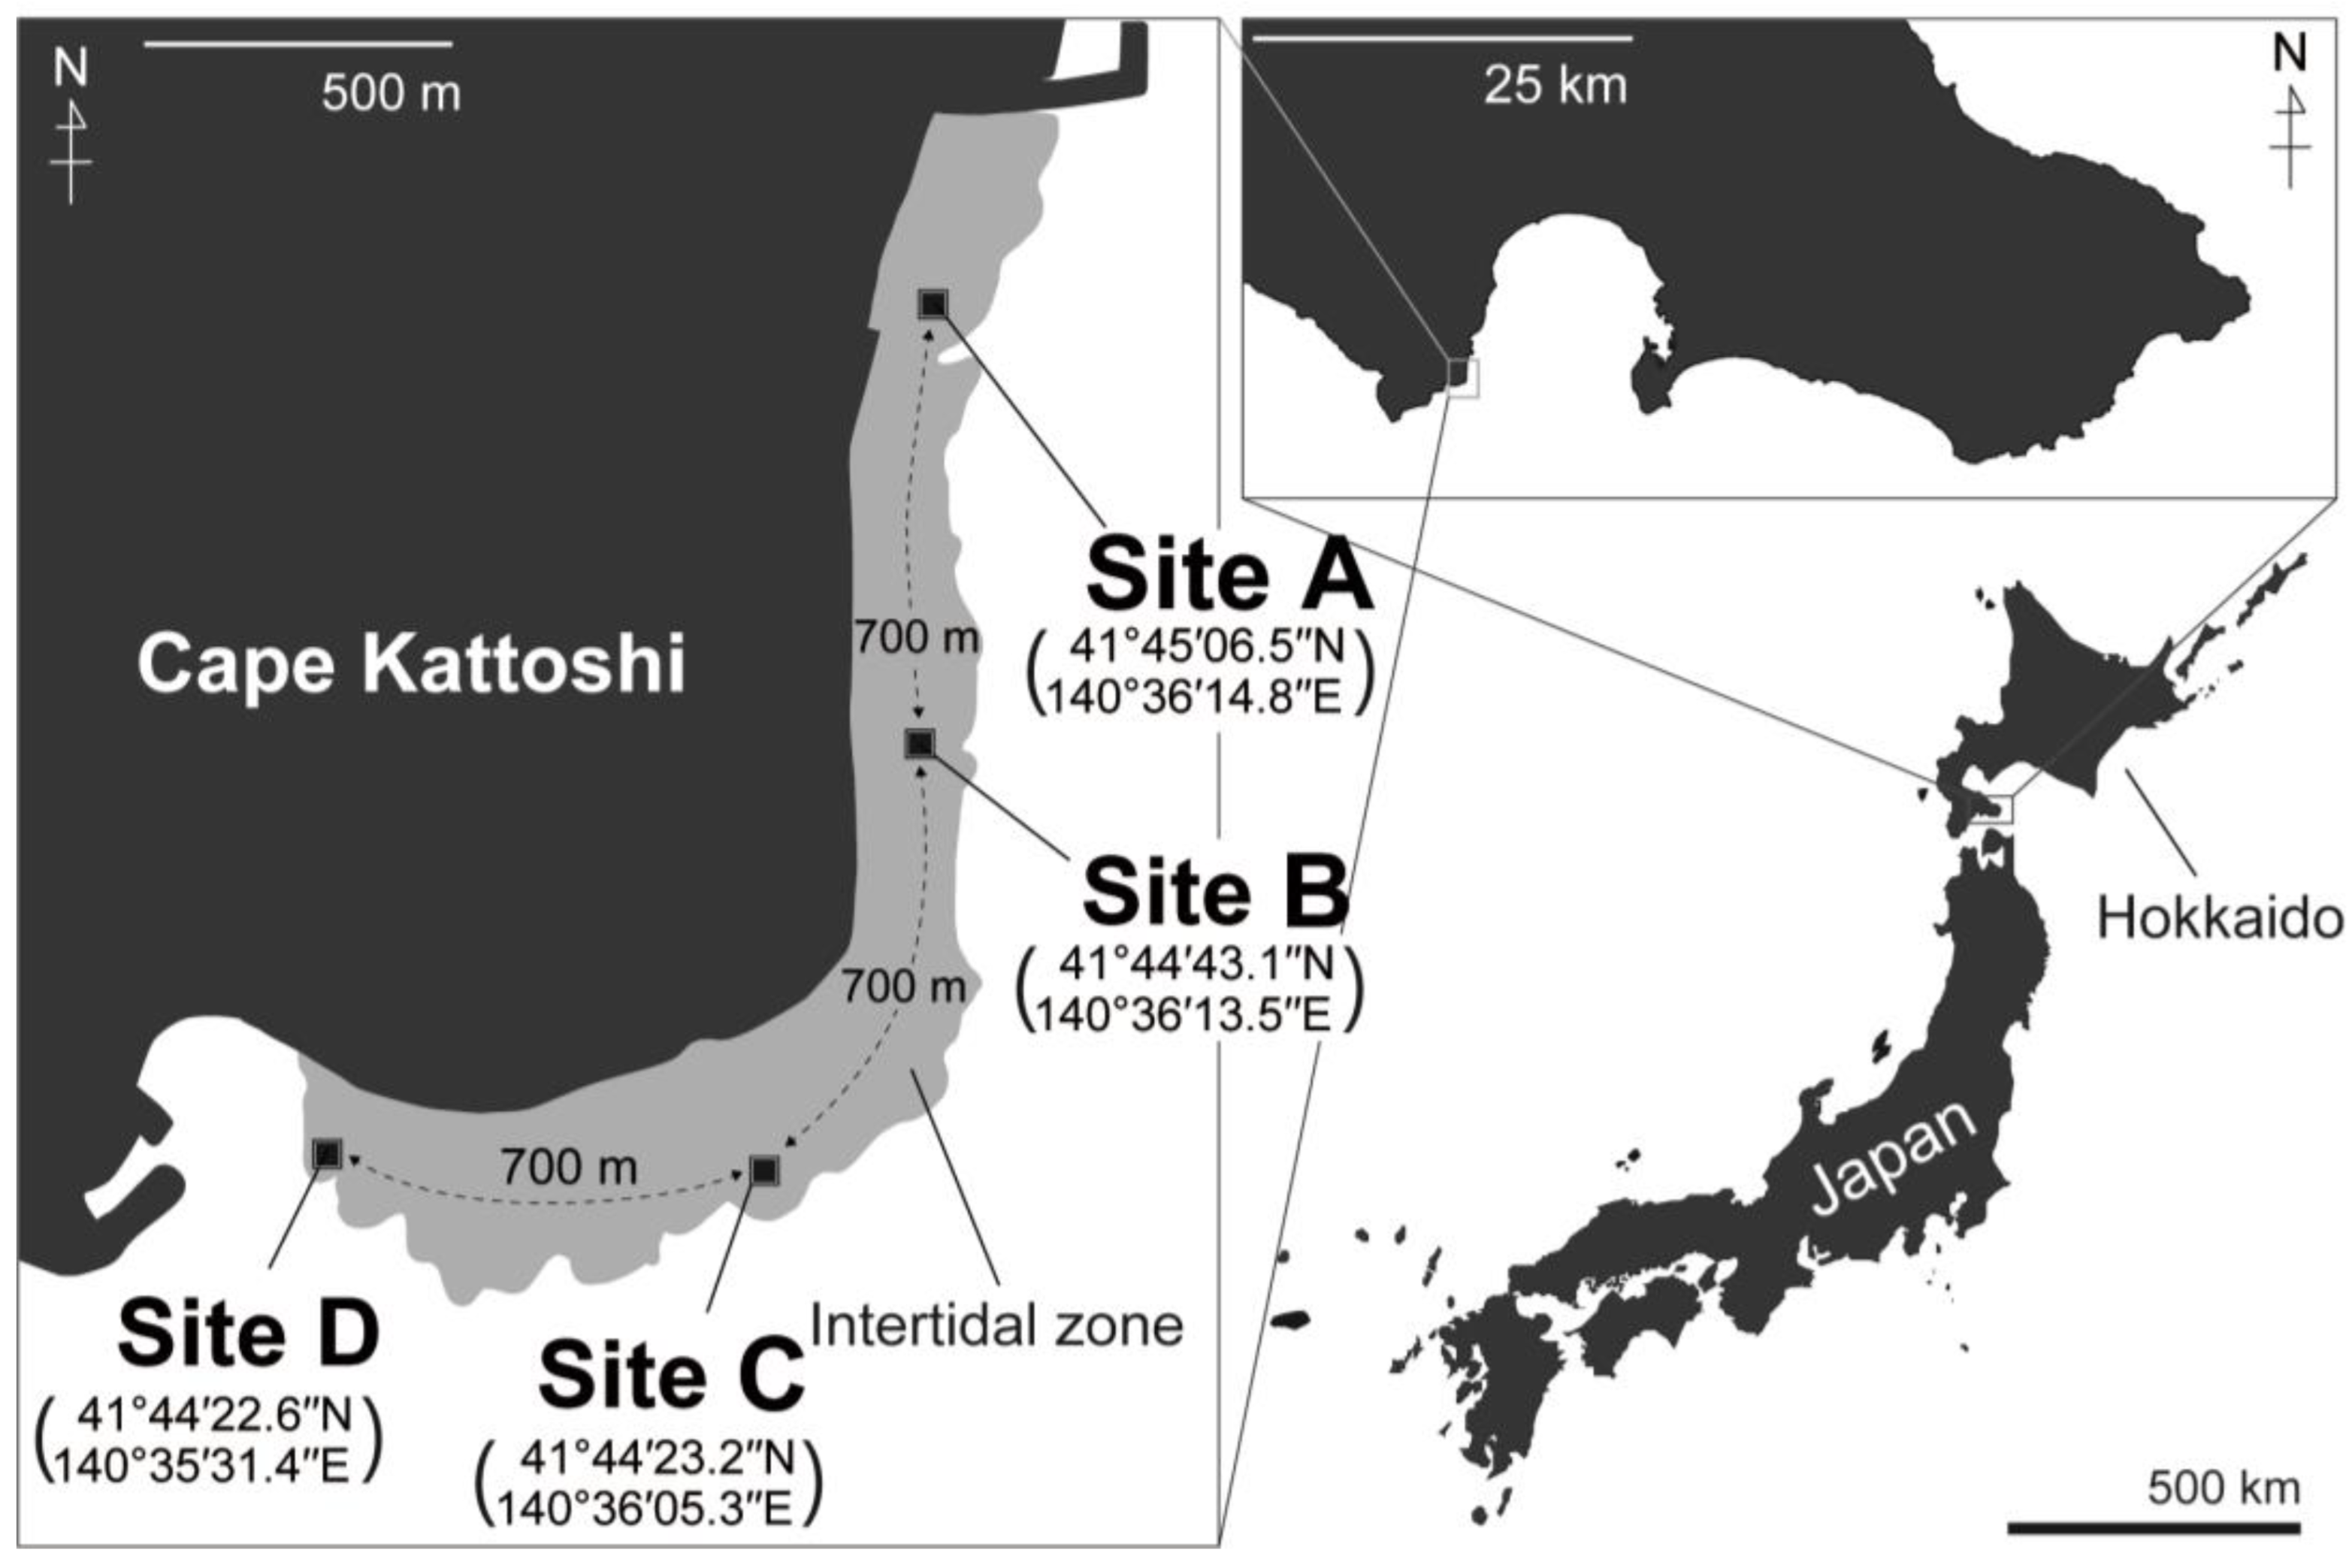
Sampling was conducted at Cape Kattoshi, Hokuto City, Hokkaido, Japan (Figure 2). This location was chosen because extensive S. fusiforme beds occur there. The intertidal zone at this cape consists of an extensive, flat rocky reef that extends approximately 3 km along the coastline. The distance from the shoreline to the edge of the rocky reef is approximately 100–300 m. S. fusiforme dominates the lower intertidal zone near the reef margin.
Figure 2.
Map of sampling site, Cape Kattoshi. Thalli of Sargassum fusiforme were collected from Sites A, B, C and D for random sampling and were collected from Sites B and D for quadrat sampling. This map was drawn by Sota Minamiguchi.
2.2. Random Sampling
Random sampling was conducted to investigate the occurrence of clonal pairs at a spatial scale of several meters. Thalli of S. fusiforme were collected on 20 April 2022 at four sites (Sites A, B, C, and D), each covering an area of approximately 20 m × 20 m (Figure 2). The sites were spaced approximately 700 m apart (Figure 2). At each site, twenty samples were collected with a minimum distance of 1 m between samples. In the laboratory, a small fragment was isolated from each thallus, rinsed thoroughly with sterile distilled water, and stored at −30 °C until DNA extraction. Although we deployed a data logger (HOBO Pendant Temperature/Light 64K Data Logger; Onset Computer Corporation, Bourne, MA, USA) at Sites A and D on 19 May 2022 for temperature monitoring, the logger at Site A was lost, likely due to wave action. Thus, water temperature at Site D was used as a proxy for temperature conditions at the study sites. Temperature was recorded every 30 min from 19 May to 13 September 2022. We did not evaluate the light conditions because the logger records light intensity in lux, which is not an appropriate measure of light availability for photosynthetic organisms.
2.3. Quadrat Sampling
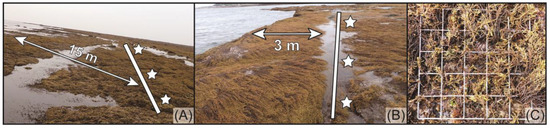
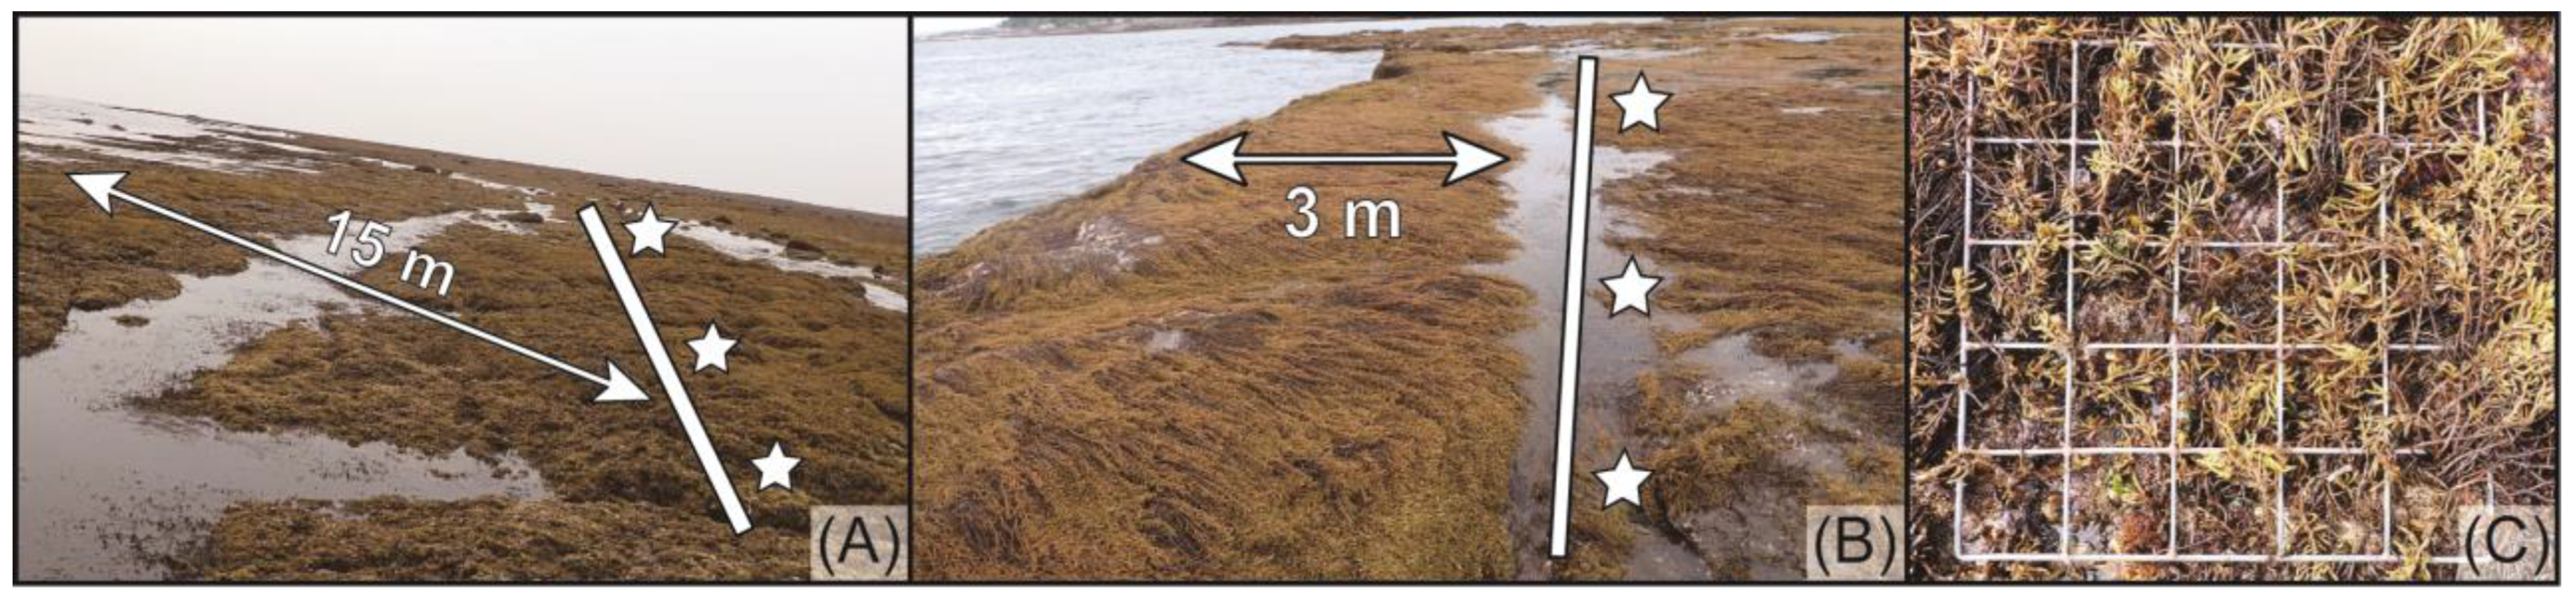
Quadrat sampling was conducted to investigate the occurrence of clonemates at the centimeter scale. On 19 April 2023, S. fusiforme samples were collected at Sites B and D (three quadrats at each site) using 50 cm × 50 cm quadrats subdivided into a 10 cm grid. The three quadrats were designated as B-i, B-ii, and B-iii at Site B, and D-i, D-ii, and D-iii at Site D. At each site, the quadrats were positioned 7.5 m apart along a 15 m transect running parallel to the shoreline at low tide (Figure 3A,B). The distance between the transect and the shoreline at low tide, measured on the same day, was approximately 15 m at Site B (Figure 3A) and 3 m at Site D (Figure 3B). Thalli whose holdfasts were located at the grid nodes within the quadrats were collected (Figure 3C), and the coordinates of each thallus were recorded. The collected thalli were processed and stored as described above for the random sampling.
Figure 3.
Overview of the quadrat sampling areas at Site B (A) and Site D (B) during low tide on 19 April 2023. The white lines indicate the transect ropes, and stars denote the points where quadrats were deployed. Thalli of Sargassum fusiforme whose holdfasts were located at the grid nodes within the quadrats were collected (C).
2.4. DNA Extraction, Genotyping, and Clone Detection
Genomic DNA was extracted using a DNeasy Plant Mini Kit (Qiagen, Hilden, Germany). Fifteen polymorphic microsatellite markers were used for both the random and quadrat sampling datasets (Table S1). Markers that were monomorphic were excluded from the analyses: HF13 in the random sampling, and SSR198 and HF05 in quadrat sampling. Among these, eight markers—HF03 (LC787699), HF04 (LC787700), HF05 (LC787701), HF13 (LC885393), HF27 (LC787702), HF37 (LC787703), HF40 (LC787704), and HF45 (LC787705)—were newly designed in this study based on sequences deposited in GenBank.
Polymerase chain reaction (PCR) was performed using a thermal cycler (GeneAtlas K02; Astec, Fukuoka, Japan) with KOD FX NEO DNA polymerase (Toyobo, Osaka, Japan). Forward primers were fluorescently labeled at the 5′ end with FAM, VIC, NED, or PET. The PCR conditions were as follows: initial denaturation at 95 °C for 5 min; 30 cycles of denaturation at 95 °C for 20 s, annealing at 58 °C for 75 s, and extension at 72 °C for 30 s; followed by 10 cycles of 95 °C for 20 s, 53 °C for 75 s, and 72 °C for 30 s; with a final extension at 55 °C for 10 min. Amplified products were genotyped using an ABI 3130xl DNA Analyzer (Applied Biosystems, Foster City, CA, USA) with GeneScan 600 LIZ size standards (Applied Biosystems, Foster City, CA, USA), and alleles were called using Peak Scanner Software v1.0 (Applied Biosystems, Foster City, CA, USA). The resolution of the loci for distinguishing genetically distinct individuals was assessed using the probability of identity (PI) and its variation for siblings (PIsibs) in GenAlEx 6.503 [20,21]. Although microsatellite loci are often screened for linkage disequilibrium (LD) in population genetics [22,23,24], we did not apply this criterion because clonality can generate apparent LD even among physically unlinked loci. Notably, LD is also frequently used as an indicator of the degree of asexuality [25,26].
Clonemates were identified using microsatellite genotypes separately for the random and quadrat sampling datasets. Clone detection was performed using GenoDive v.3.0 [27] based on pairwise genetic distances under a stepwise mutation model. We deliberately did not calculate Psex [28], which is commonly used to distinguish clonemates from identical multilocus genotypes generated by sexual reproduction [29,30], because its application could falsely reject true clonemates.
2.5. Level of Clonality
To characterize the clonal structure and assess the degree of asexuality, several indices were calculated using the GenPoPoly tab in GenAPoPop 1.0 [26]: the Pareto β parameter [28] for the Pareto distribution [31], the inbreeding coefficient (FIS) along with its variance [32], genotypic richness (R) [33], and synthetic linkage disequilibrium () [34]. These metrics are expected to shift predictably with the relative contribution of asexual reproduction. In S. fusiforme, asexual reproduction manifests exclusively through clonal propagation from the tip of the holdfasts, which is phenotypically analogous to the clonal propagation observed in seagrasses (e.g., Amphibolis antarctica (Labillardiere) Sonder & Ascherson ex Ascherson and A. griffithii (J.M. Black) Hartog [35] and Syringodium filiforme Kützing [36]) and other aquatic higher plants (e.g., Helanthium tenellum (Mart. ex Schult. f.) Britton [37] and Butomus umbellatus Linnaeus [38]). The Pareto β parameter is expected to be positive and tends to decrease as the degree of asexuality increases [28]. FIS, which ranges from −1 to 1, was calculated as the average value across all loci. As the contribution of asexual reproduction increases, FIS typically decreases toward −1, while its variance tends to increase [39]. R ranges from 0 (when all individuals share the same genotype) to 1 (when all individuals have unique genotypes) [33]. Synthetic linkage disequilibrium is always positive and tends to increase with higher levels of asexuality [26,40,41]. This multi-index approach has been employed in previous studies to evaluate the degree of asexuality in an aquatic plant, Ludwigia grandiflora subsp. hexapetala (Hook. & Arn.) G.L.Nesom & Kartesz [42] and a brown macroalga Laminaria rodriguezii Bornet [43]; the latter is known to propagate clonally through the emergence of diploid clones from stoloniferous holdfasts, analogous to S. fusiforme. Differences in these indices among the datasets were statistically compared using PERMANOVA with the “pairwise.adonis” function of the pairwiseAdonis package (version 0.4) [44] in R 4.4.2 [45]. The p-values were adjusted using the Bonferroni correction (p-adjusted). The significance level was set at p-adjusted < 0.05.
2.6. Dispersal via Sexual Reproduction
This analysis was conducted using the quadrat sampling dataset. To estimate contemporary dispersal, contemporary migration rates per generation were calculated using BayesAss 3.0.4 [46]. The analysis involved a burn-in of 1,000,000 iterations followed by 10,000,000 Markov chain Monte Carlo (MCMC) iterations, with a sampling interval of 100 iterations. To achieve the recommended acceptance rates (30–60%) for the mixing parameters, ΔA, Δf, and Δm were set to 0.50, 0.85, and 0.50, respectively. Convergence of the MCMC runs was confirmed using Tracer v.1.7.2. Migration rates were estimated within and among quadrats, as well as within and between sites. To avoid bias caused by clonemates, only one ramet per genet was randomly selected from each quadrat for the analysis.
2.7. Dispersal via Clonal Propagation
This analysis was conducted using the quadrat sampling dataset. The coordinates of each thallus, recorded at the grid nodes, were integrated with the clonal identification results to evaluate whether thalli within each quadrat were clonemates. Genet size was estimated by measuring the maximum linear distance between the most distantly located clonemates within each quadrat. Additionally, the number of ramets per genet was determined. To compare Sites B and D, differences in genet size and the number of ramets per genet were examined using a Wilcoxon rank-sum test (using the exactRankTests package [47] in R 4.4.2 [45]). This non-parametric approach was selected because the assumption of normality was not met for all datasets according to the Shapiro–Wilk test (genet size: Site B, W = 0.902, p = 0.073; Site D, W = 0.757, p = 0.002; number of ramets: Site B, W = 0.641, p < 0.001; Site D, W = 0.311, p < 0.001). A significance level of p < 0.05 was adopted for all statistical tests.
2.8. Spatial Genetic Structure
Spatial genetic structure (SGS) was quantified for each quadrat by assessing the relationship between kinship-coefficient indices and spatial distance [48]. This approach is widely employed in higher plants exhibiting a diplontic life cycle, and empirical studies have demonstrated that SGS is influenced by reproductive characteristics, such as dispersal range [49,50] and the extent of clonality [30,51,52,53]. SGS analysis has rarely been applied to seaweeds because most exhibit a haplodiplontic life cycle, which complicates the quantification of SGS. However, it is applicable to members of the Fucales, as they also possess a diplontic life cycle analogous to that of higher plants.
We calculated the following kinship-based indices using the “autocorrelation” function of the RClone 1.0.3 [54] package in R 4.4.2 [45]: Loiselle’s pairwise kinship coefficient (Fij) [55], the regression slope of kinship on the logarithm of spatial distance (blog), and the Sp statistic (Sp) [48]. These indices were calculated from the genotyped data, and their significance was assessed using 10,000 permutations. Fij measures the genetic similarity between pairs of individuals relative to the average allele frequencies of the entire population. An Fij value of zero indicates that the pair of individuals is as related as a random pair from the population, while positive values indicate higher genetic similarity (i.e., kinship) than the population average. The blog reflects the rate of decrease in kinship with increasing spatial distance, representing the strength of SGS. The Sp statistic provides a standardized measure to compare the intensity of SGS across different datasets or populations [47]. Spatial distance classes for this study were defined to contain approximately equal numbers of individuals: DClass 1 (0–16 cm), DClass 2 (16–26 cm), DClass 3 (26–36 cm), DClass 4 (36–46 cm), and DClass 5 (46–71 cm). Based on the indices and distance classes, the spatial relationships were analyzed at both the ramet and genet levels to assess dispersal via asexual and sexual propagation, respectively, following [55].
The kinship patterns in the ramet and among-genet datasets were compared to estimate the clonal subrange for each quadrat. For the ramet-level analysis, pairs of all individuals were used to calculate Fij. In contrast, for the among-genet analysis, pairs of individuals belonging to the same genet (clonemates) were excluded to remove the influence of clonal identity. In distance classes where clonemates are present, Fij is expected to be higher in the ramet-level than in the among-genet dataset. The clonal subrange was defined as the distance class at which the Fij values of the ramet-level and among-genet datasets converged to the same value. In addition to the Fij, blog and Sp were calculated for each dataset. To generate the among-genet dataset, the “autocorrelation” function in RClone was modified so that ramet pairs belonging to the same genets were identified in logical matrix calculations, and the corresponding Fij values were treated as missing values (NA) (File S1 in Supplementary Materials).
To specifically evaluate dispersal via sexual propagation, the spatial genetic pattern was further analyzed by reducing each genet to a single representative ramet. Two types of datasets—the centroid-representative genet and the randomly sampled genet—were prepared to verify whether the SGS results were biased by the positioning of the representative coordinates of genets. For the centroid-representative genet dataset, a single representative position for each genet was defined as the centroid (mean X and Y coordinates) of all its constituent ramets. For the randomly sampled genet dataset, one ramet was randomly selected to represent each genet, and this selection procedure was repeated 100 times. For each iteration, a permutation test was conducted 10,000 times. To test for the presence of SGS, the observed Fij values from the centroid-representative genet and randomly sampled genet datasets were compared with a 95% confidence interval (CI) generated by 10,000 permutations under the null hypothesis of a random spatial distribution of genets. Observed values falling outside the 95% CI were considered statistically significant, indicating a non-random genetic structure [55]. In the centroid-representative genet analysis, this statistical comparison and data processing were performed in Python 3.9.6 with the NumPy v1.2.4 [56] and pandas v1.3.3 [57] libraries using the prepared script (File S2 in Supplementary Materials). In the randomly sampled genet analysis, the statistical comparison and data processing were performed using the “autocorrelation” function in RClone. In the randomly sampled genet dataset, the ratio of significant values among the aforementioned 100 selection procedures was recorded as the significance ratio, following [55]. This ratio reflects the proportion of iterations yielding significant SGS rather than a single fixed value.
To estimate the spatial scale of dispersal and evaluate the relative contributions of sexual and clonal propagation, dispersal parameters were calculated using the centroid-representative genet dataset. This estimation was based on the relationship between pairwise kinship coefficients and the logarithm of spatial distance, following the theoretical framework of Vekemans and Hardy [48]. Under the assumption of a two-dimensional population at drift–dispersal equilibrium, σ2 is related to neighborhood size (Nb) and effective population density (D) as:
where σ2 represents half of the mean squared parent–offspring dispersal distance. The effective population density (D) was approximated by the observed multilocus genotype density following [55]. Distance classes defined in RClone 1.0.3 were retained for consistency with SGS analyses.
Neighborhood size (Nb) was estimated from the regression slope of kinship coefficients (blog) as:
where F1 is the mean kinship coefficient at the shortest distance class. This approach follows established methods linking SGS to dispersal parameters [58,59].
To evaluate the relative contributions of sexual and clonal dispersal, the total dispersal variance (σ2) was partitioned into sexual (σ2sex) and clonal (σ2veg) components as:
following the conceptual framework of Gliddon [60], here treated as a simplified approximation because direct partitioning of sexual and clonal dispersal variance is difficult in natural populations. The clonal dispersal variance (σ2veg) was estimated for each quadrat as:
where N is the total number of genets, NG is the number of genets composed of multiple ramets, ni is the number of ramets within genet i, and dij is the distance between ramet j and the centroid of genet i. For genets consisting of a single ramet, dispersal distance was set to 5 cm, corresponding to half of the minimum sampling interval. The sexual dispersal component (σ2sex) was obtained by subtracting σ2veg from σ2. The relative contribution of sexual versus clonal dispersal was expressed as σ2sex/σ2veg. Values of Nb, σ2, σ2sex, and σ2sex/σ2veg were calculated using a Python script (File S3 in Supplementary Materials) with the NumPy v1.2.4 and pandas v1.3.3 libraries. The script used the blog and F1 values estimated in RClone 1.0.3. All statistical tests were conducted at a significance level of 0.05.
3. Results
3.1. Statistical Power for Clone Identification
All samples obtained through random and quadrat sampling were successfully genotyped with no missing data. The complete genotyping results are provided in Supplementary Tables S2 and S3. The probability of identity (PI) and its sibling-corrected version (PIsibs), which represent the likelihood that two randomly selected individuals have identical genotypes by chance, were sufficiently low to permit reliable clone identification. For the random sampling dataset (14 loci), the average values were PI = 9.9 × 10⁻⁵ ± 8.8 × 10⁻⁵ (standard deviation) and PIsibs = 1.1 × 10⁻² ± 4.3 × 10⁻³ (Figure S1A). For the quadrat sampling dataset (13 loci), these were PI = 2.6 × 10⁻⁴ ± 3.8 × 10⁻⁴ and PIsibs = 1.2 × 10⁻² ± 1.0 × 10⁻² (Figure S1B). These results confirm that both marker sets possessed sufficient discriminatory power to distinguish between distinct genets and clonemates.
3.2. Summer Temperature at the Sampling Site
Water temperatures ranged from a minimum of 10.8 °C to a maximum of 39.7 °C, with an average of 19.6 °C (Figure S2). Notably, temperatures exceeding 30 °C were recorded during the low tide associated with spring tides between July and September.
3.3. Levels of Clonality
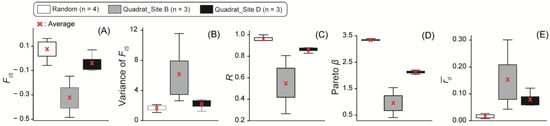
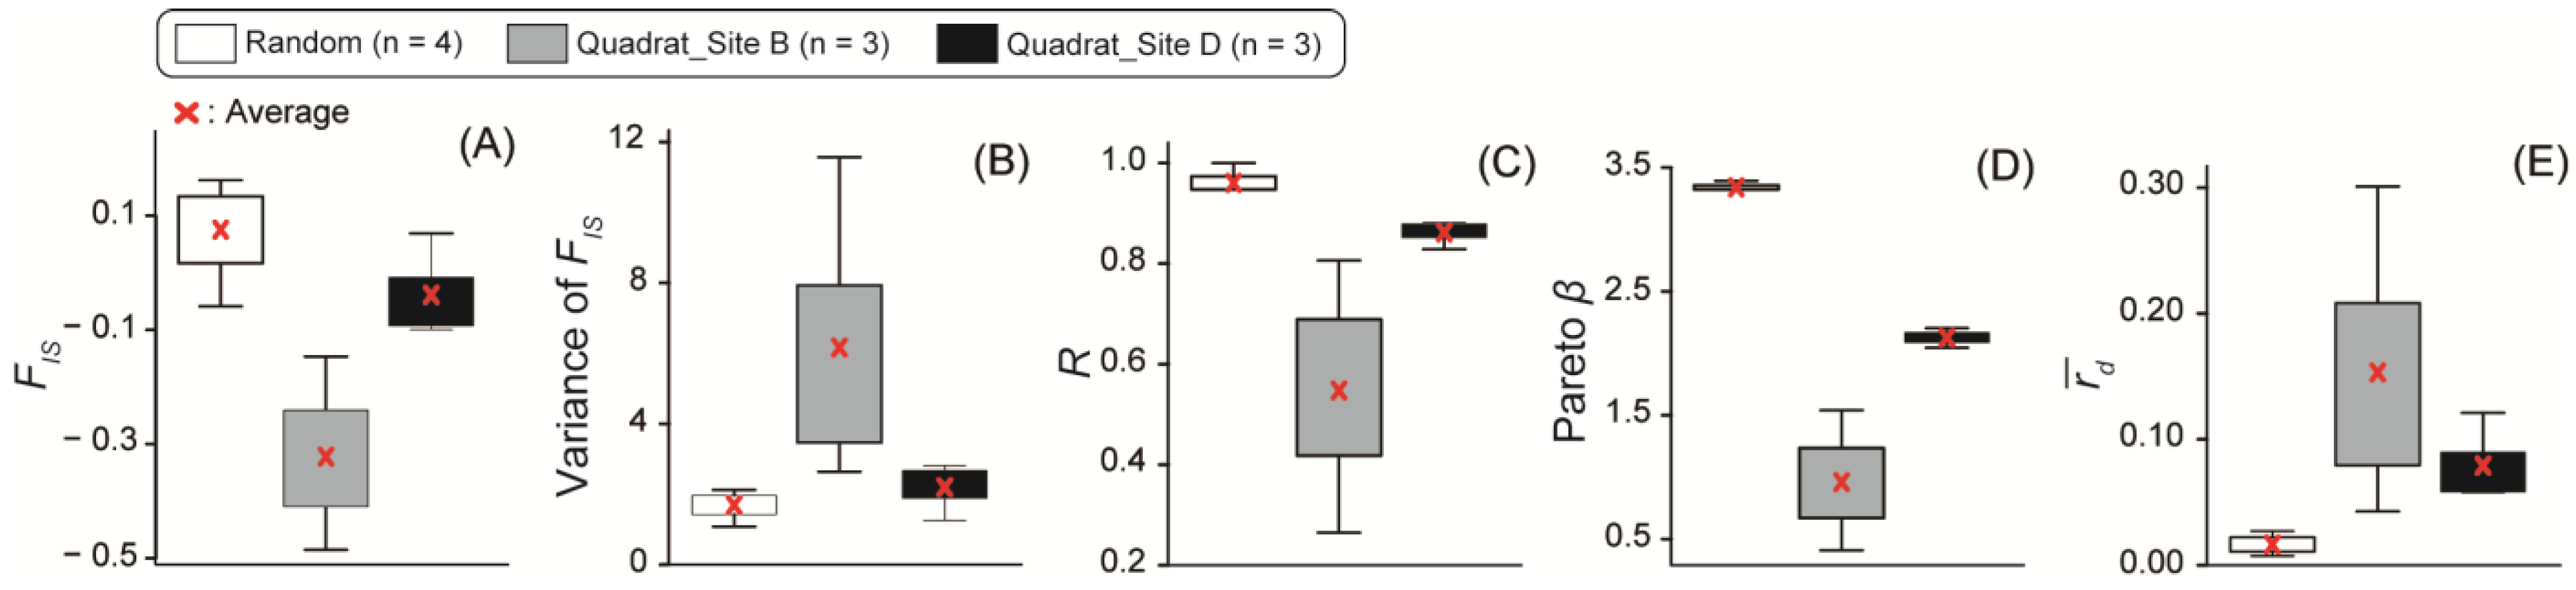
FIS (Figure 4A), R (Figure 4C), and Pareto β (Figure 4D) were highest in random sampling, intermediate in quadrat sampling at Site D, and lowest in quadrat sampling at Site B. In contrast, the variance of FIS (Figure 4B) and (Figure 4E) showed the opposite trend: lower in random sampling, higher in quadrat sampling at Site B, and intermediate for quadrat sampling at Site D. Although these five indices collectively showed a consisted pattern among datasets, the differences were insignificant p-value in PERMANOVA (random sampling vs. quadrat sampling at Site B, p = 0.096; random sampling vs. quadrat sampling at Site D, p = 0.090; quadrat sampling at Site B vs. D, p= 0.600; Table S4).
Figure 4.
Boxplots showing (A) inbreeding coefficient FIS, (B) variance of FIS, (C) genotypic richness R, (D) Pareto β parameter and (E) synthetic linkage disequilibrium . White, gray, and black boxes represent the results of random sampling (sample size: 4), quadrat sampling at Site B (sample size: 3), and quadrat sampling at Site D (sample size: 3), respectively. Red cross indicates the average value.
3.4. Dispersal via Sexual Reproduction
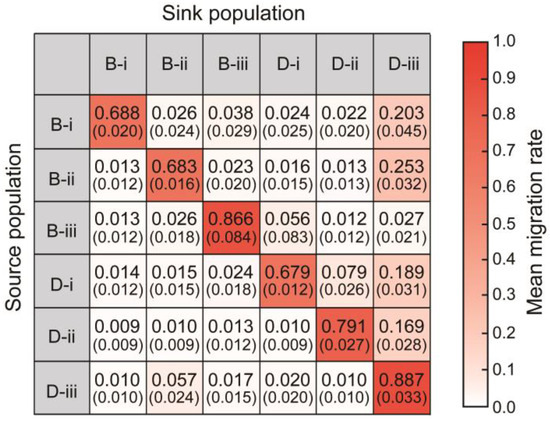
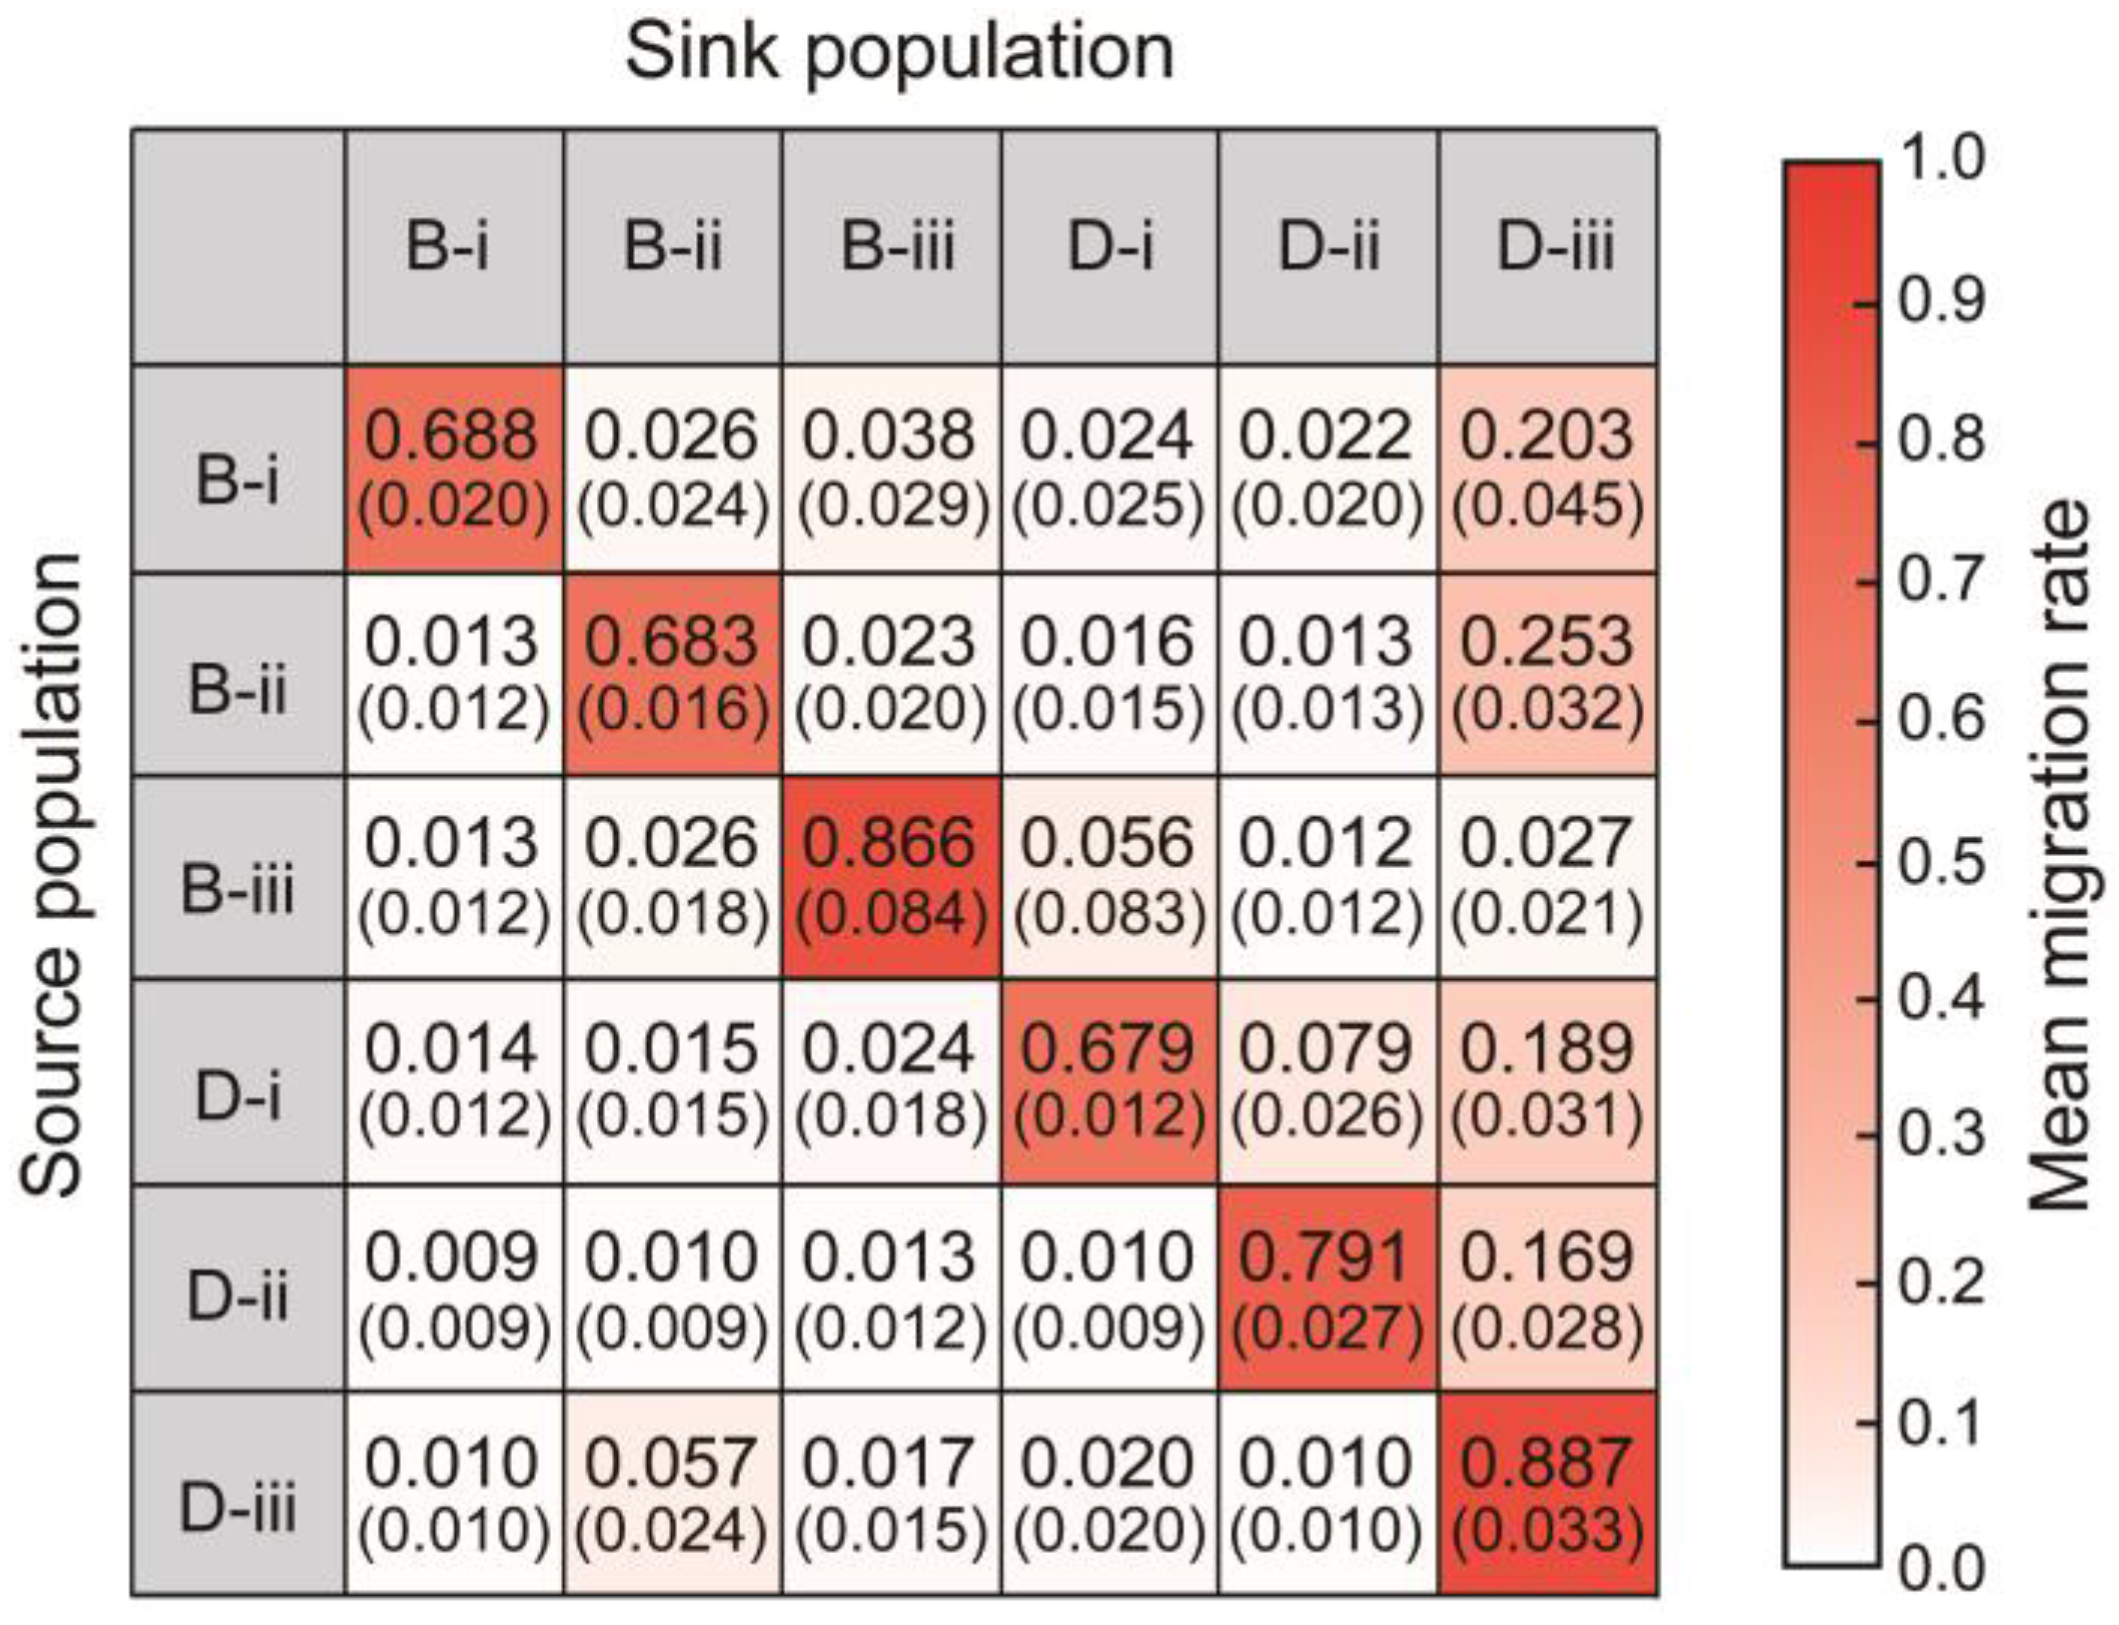
Mean contemporary migration rates per generation were higher within quadrats than among quadrats. Specifically, the rates ranged from 0.679 to 0.887 within quadrats, from 0.010 to 0.189 among quadrats within the same site, and from 0.009 to 0.253 among quadrats between different sites (Figure 5).
Figure 5.
Heat map showing migration rates per generation within and between quadrats. Values indicate mean migration rates from the source to sink populations, which correspond to the color gradation from white (when the mean migration rate is 0) to red (when the mean migration rate is 1). Values within brackets are the standard deviation.
3.5. Dispersal via Clonal Propagation
The stepwise mutation model indicated a clonal threshold genetic distance of zero in both the quadrat sampling (Figure S3A) and the random sampling (Figure S3B), based on the trough of the bimodal distribution. Therefore, only individuals sharing identical multilocus genotypes were treated as clonemates.
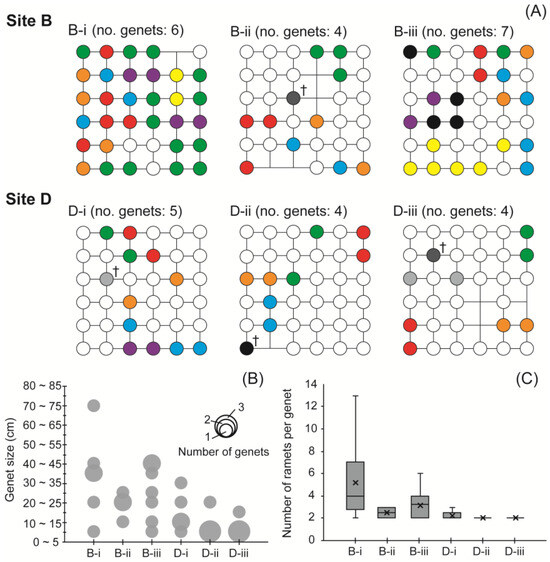
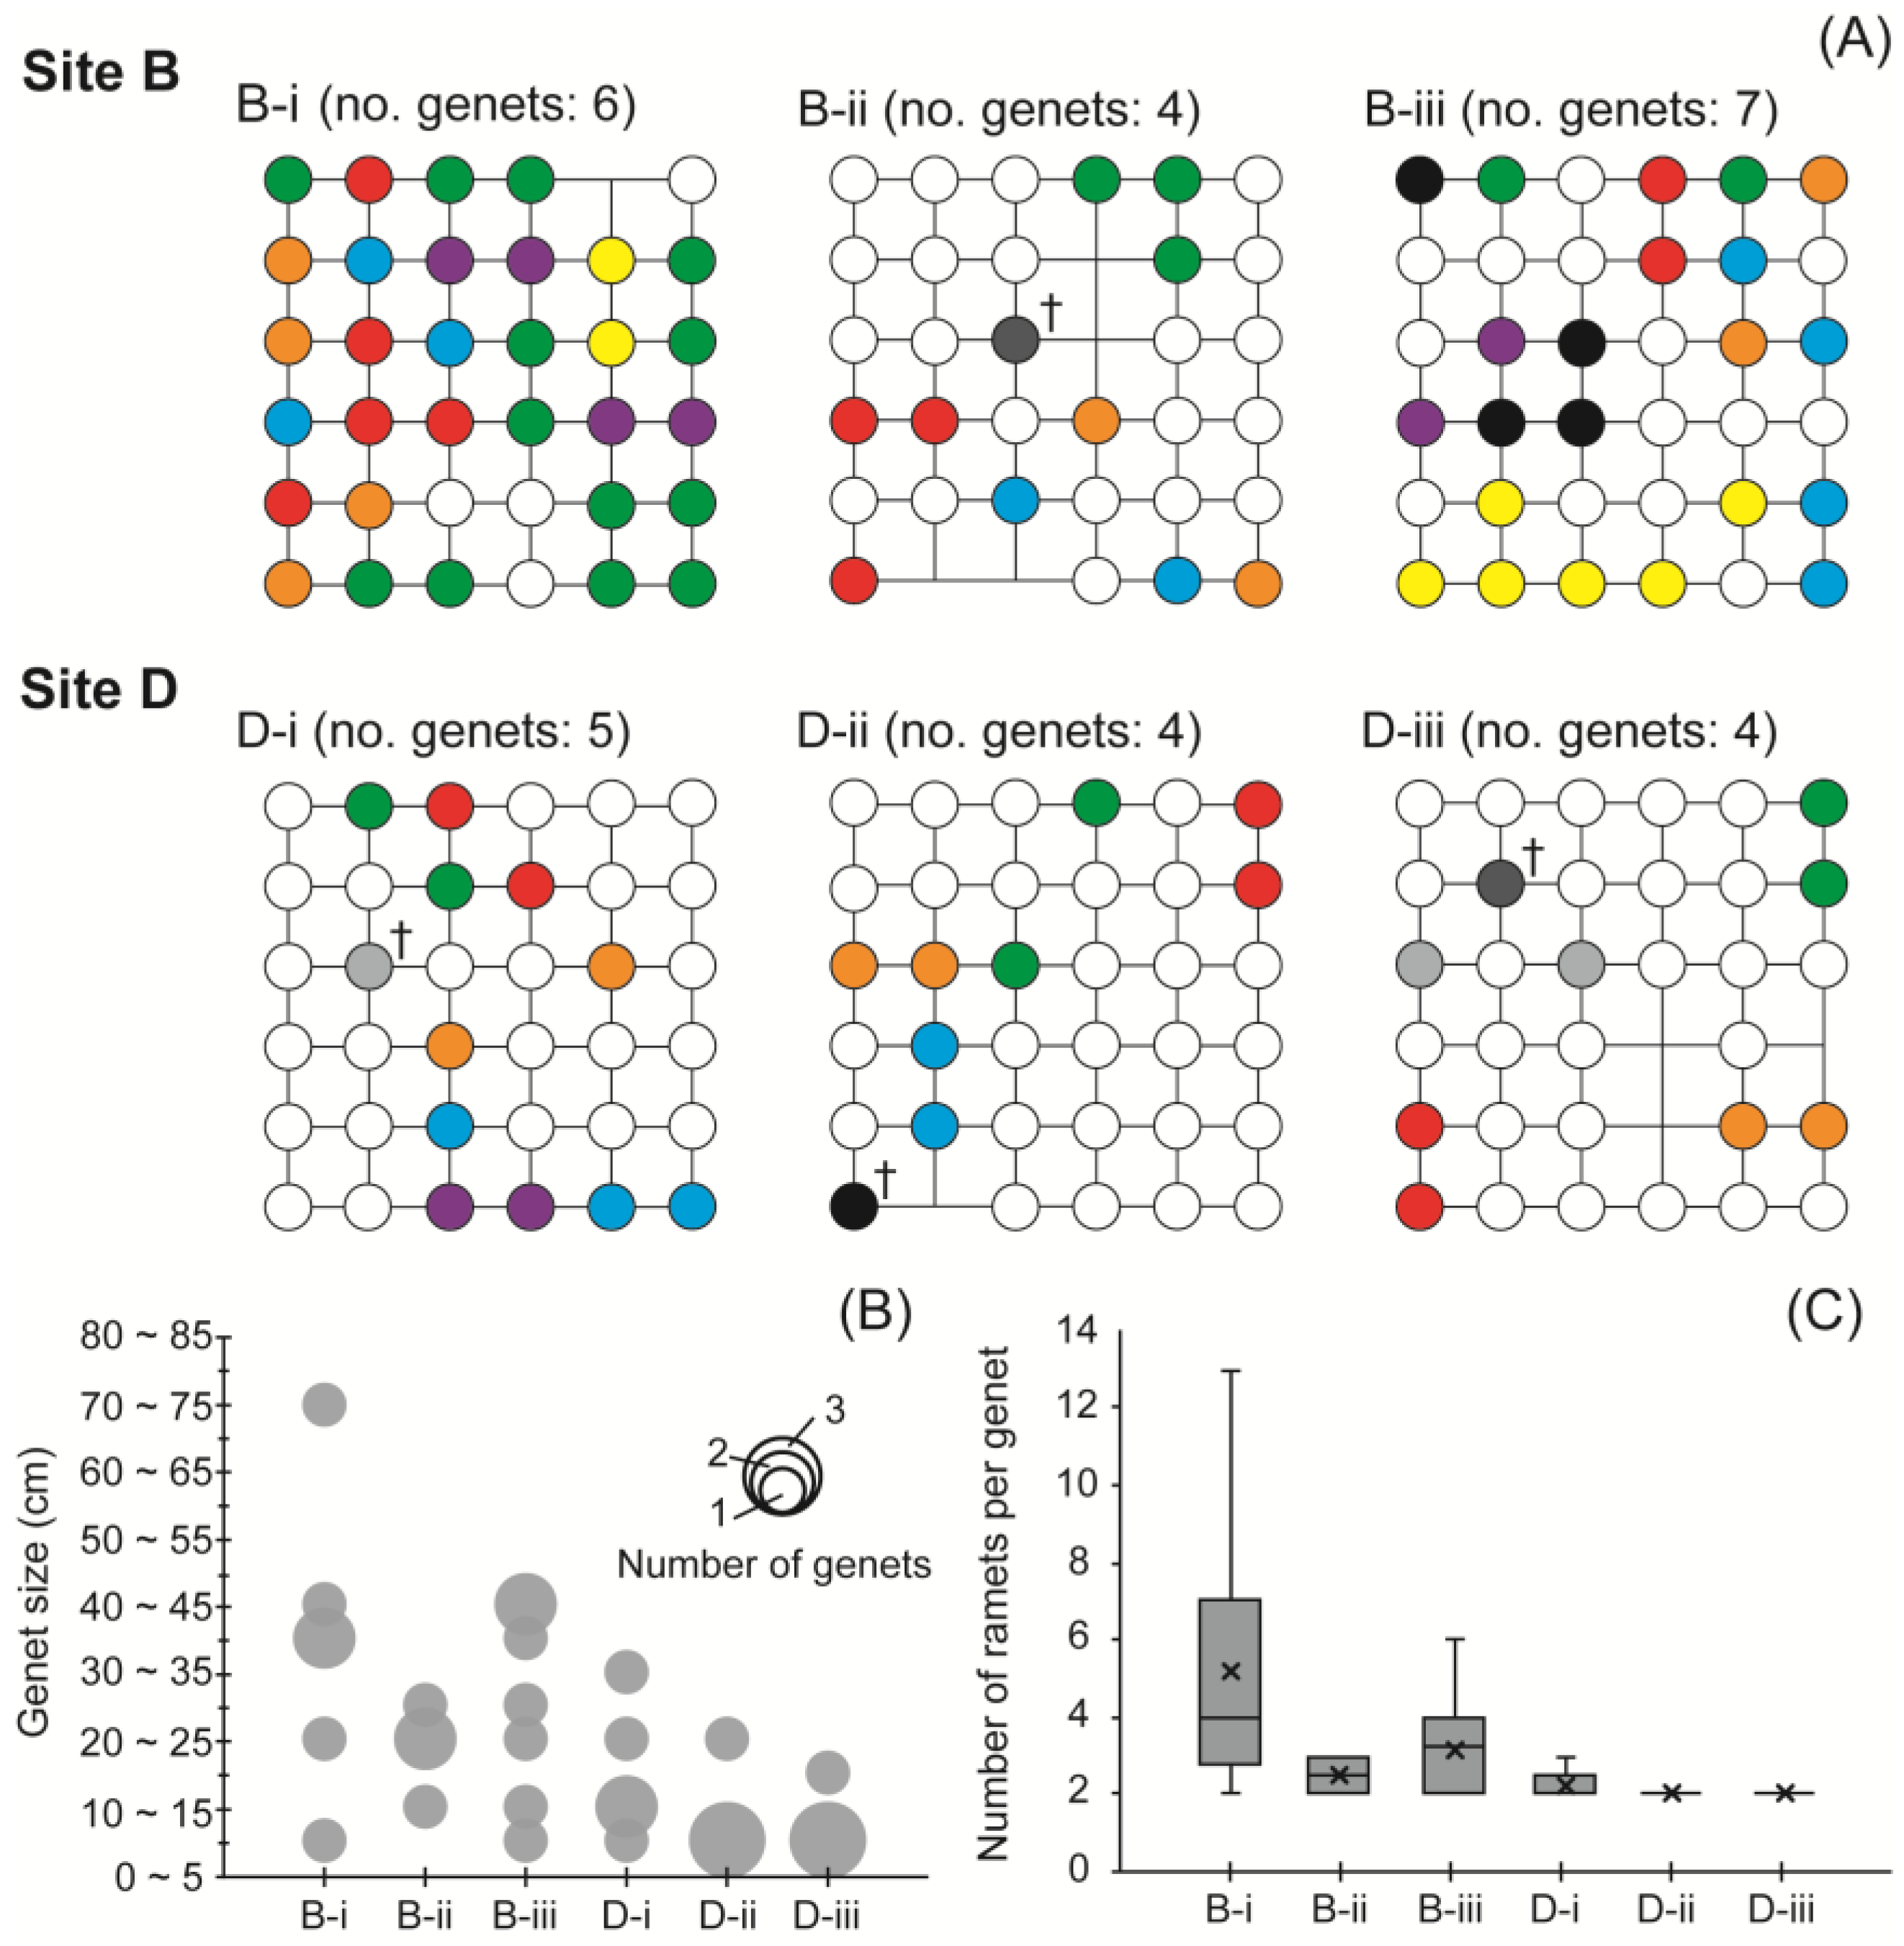
In the random sampling, single clonal pairs were detected at each of the following sites: Site A (sample ID: RA18 and RA20), Site B (RB10 and RB11), and Site C (RC14 and RC16) (Table S2). In the quadrat sampling, the number of genets per quadrat was 6, 4, and 7 for B-i, B-ii, and B-iii, and 5, 4, and 5 for D-i, D-ii, and D-iii, respectively. Notably, some individuals shared identical multilocus genotypes across different quadrats (Figure 6A).
Figure 6.
(A) Distribution and number of genets in each quadrat. Each circle corresponds to a grid of quadrats. Circles of the same color denote clonemates (i.e., ramets belonging to the same genet). Monochromatic circles (black, dark gray, and light gray) indicate clonemates distributed across two different quadrats. Monochromatic circles with a cross (†) indicate potentially misidentified clonemates. (B) Bubble chart shows the genet size and its frequency from quadrat sampling. (C) Boxplot showing the number of ramets per genet from quadrat sampling. Crosses denote the average values.
Genet sizes were significantly larger at Site B than at Site D (Figure 6A,B). At Site B, the maximum genet size within quadrats ranged from 28.3 to 70.7 cm, with an average of 29.6 ± 15.3 cm (standard deviation). At Site D, the maximum size ranged from 20.0 to 31.6 cm, with an average of 15.0 ± 7.0 cm. The difference was statistically significant (Wilcoxon rank-sum test: W = 184, p = 0.001). The average genet size across all quadrats was 23.2 ± 14.3 cm. The most frequent genet size class was 20–25 cm at Site B and 5–10 cm at Site D. The number of ramets per genet was also significantly higher at Site B than at Site D (Wilcoxon rank-sum test: W = 170.5, p = 0.003). At Site B, the number of ramets ranged from 2 to 13 per genet (ave. 3.7 ± 2.7), while at Site D, the range was 2 to 3 (ave. 2.0 ± 0.3). The average number of ramets per genet within each quadrat was B-i = 5.1 ± 4.0, B-ii = 2.5 ± 0.6, B-iii = 3.1 ± 1.6, D-i = 2.2 ± 0.4, D-ii = 2.0 ± 0.0, and D-iii = 2.0 ± 0.0 (Figure 6C).
3.6. Spatial Genetic Structure
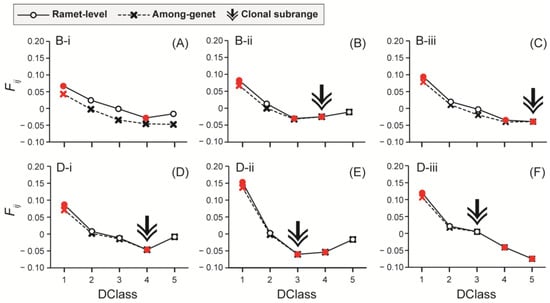
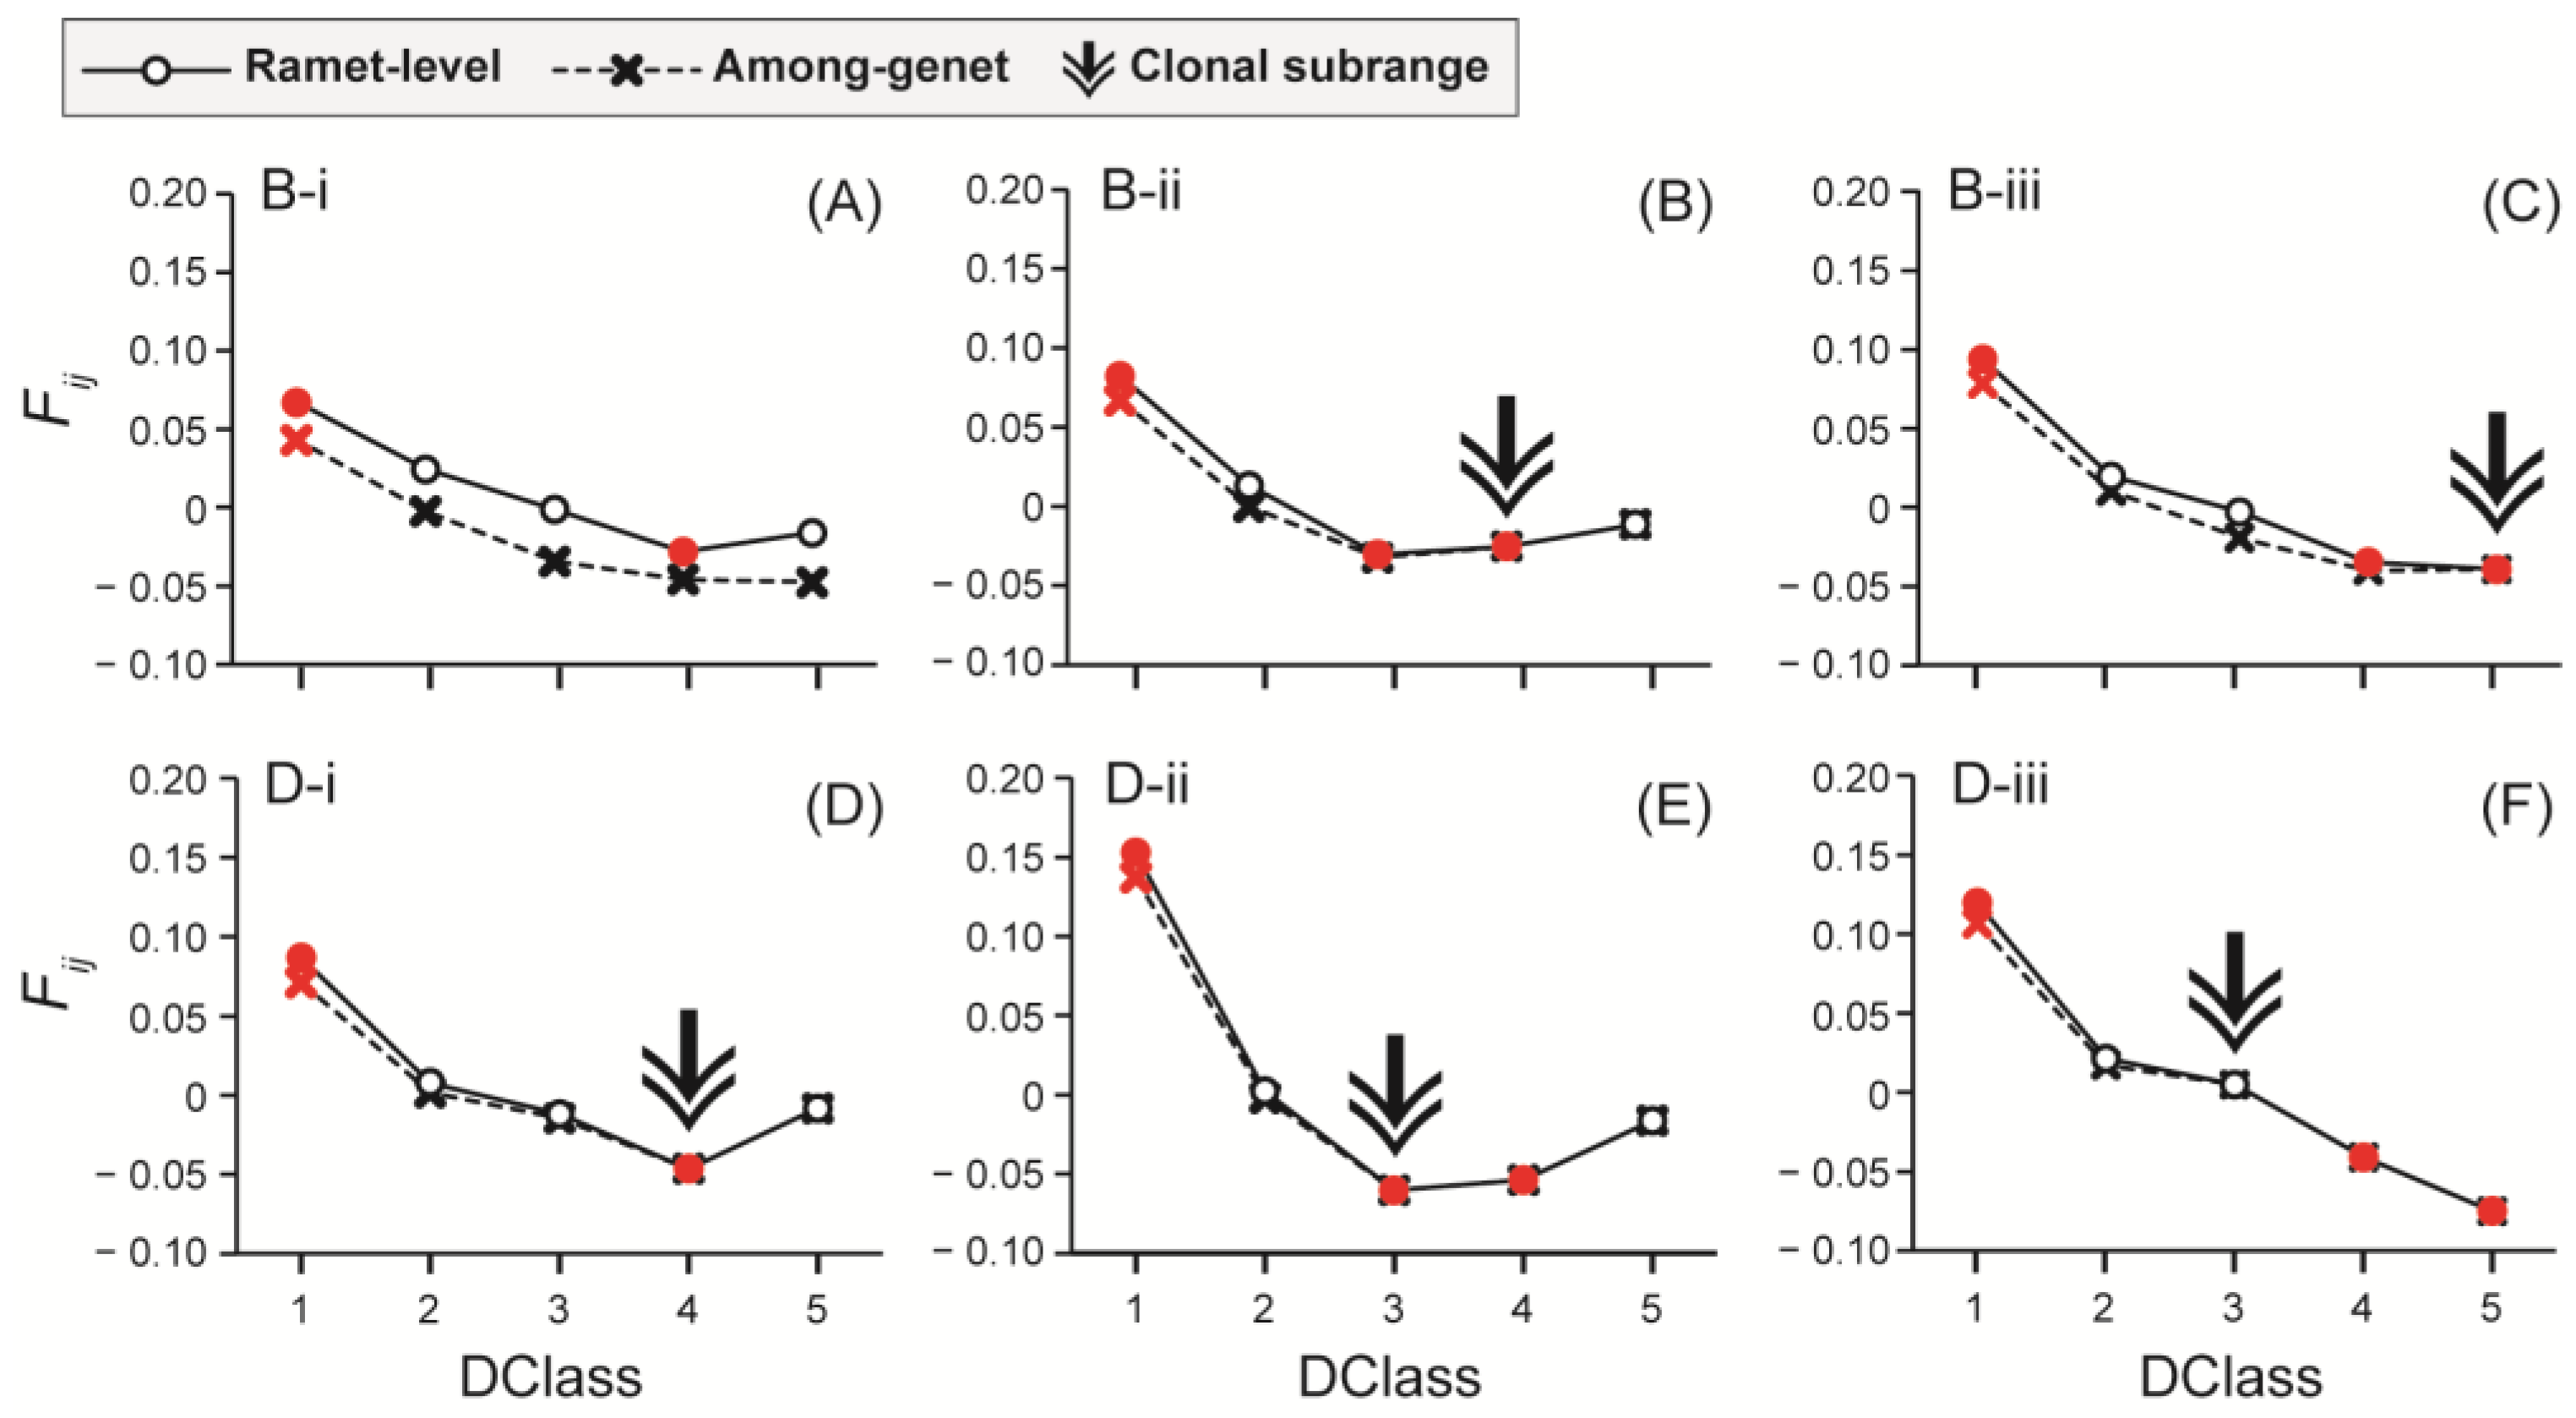
Fij was significantly positive in Distance Class (DClass) 1 at all quadrats for both ramet-level and among-genet datasets, and was consistently higher in the ramet-level dataset in all quadrats. Significantly negative Fij values were detected only in the ramet-level dataset and in DClass 4 across all quadrats except in DClass 3 at quadrats B-ii and D-ii (Figure 7). Convergence of Fij values in both datasets was observed, except for B-i. Accordingly, clonal subranges were DClass 3 at D-ii and D-iii, DClass 4 at B-ii and D-i, and DClass 5 at B-iii. Up to the convergence point, Fij values in the ramet-level dataset were higher than those in the among-genet dataset.
Figure 7.
Autocorrelograms of Loiselle’s kinship (Fij) with each distance level (DClass) at quadrats (A) B-i, (B) B-ii, (C) B-iii, (D) D-i, (E) D-ii, and (F) D-iii. Circle symbols with solid lines and cross symbols with dotted lines) are indicated for ramet-level and among-genet datasets, respectively. Red symbols indicate significant values (5% confidence level). Arrows indicate the convergence point (i.e., clonal subranges). Each DClass corresponds to the following intervals of distance: DClass 1 (0 to 16 cm), DClass 2 (16 to 26 cm), DClass 3 (26 to 36 cm), DClass 4 (36 to 46 cm), and DClass 5 (46 to 71 cm).
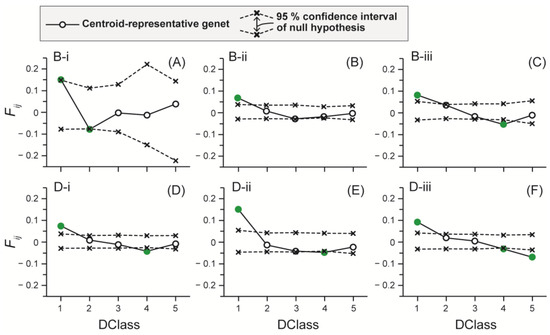
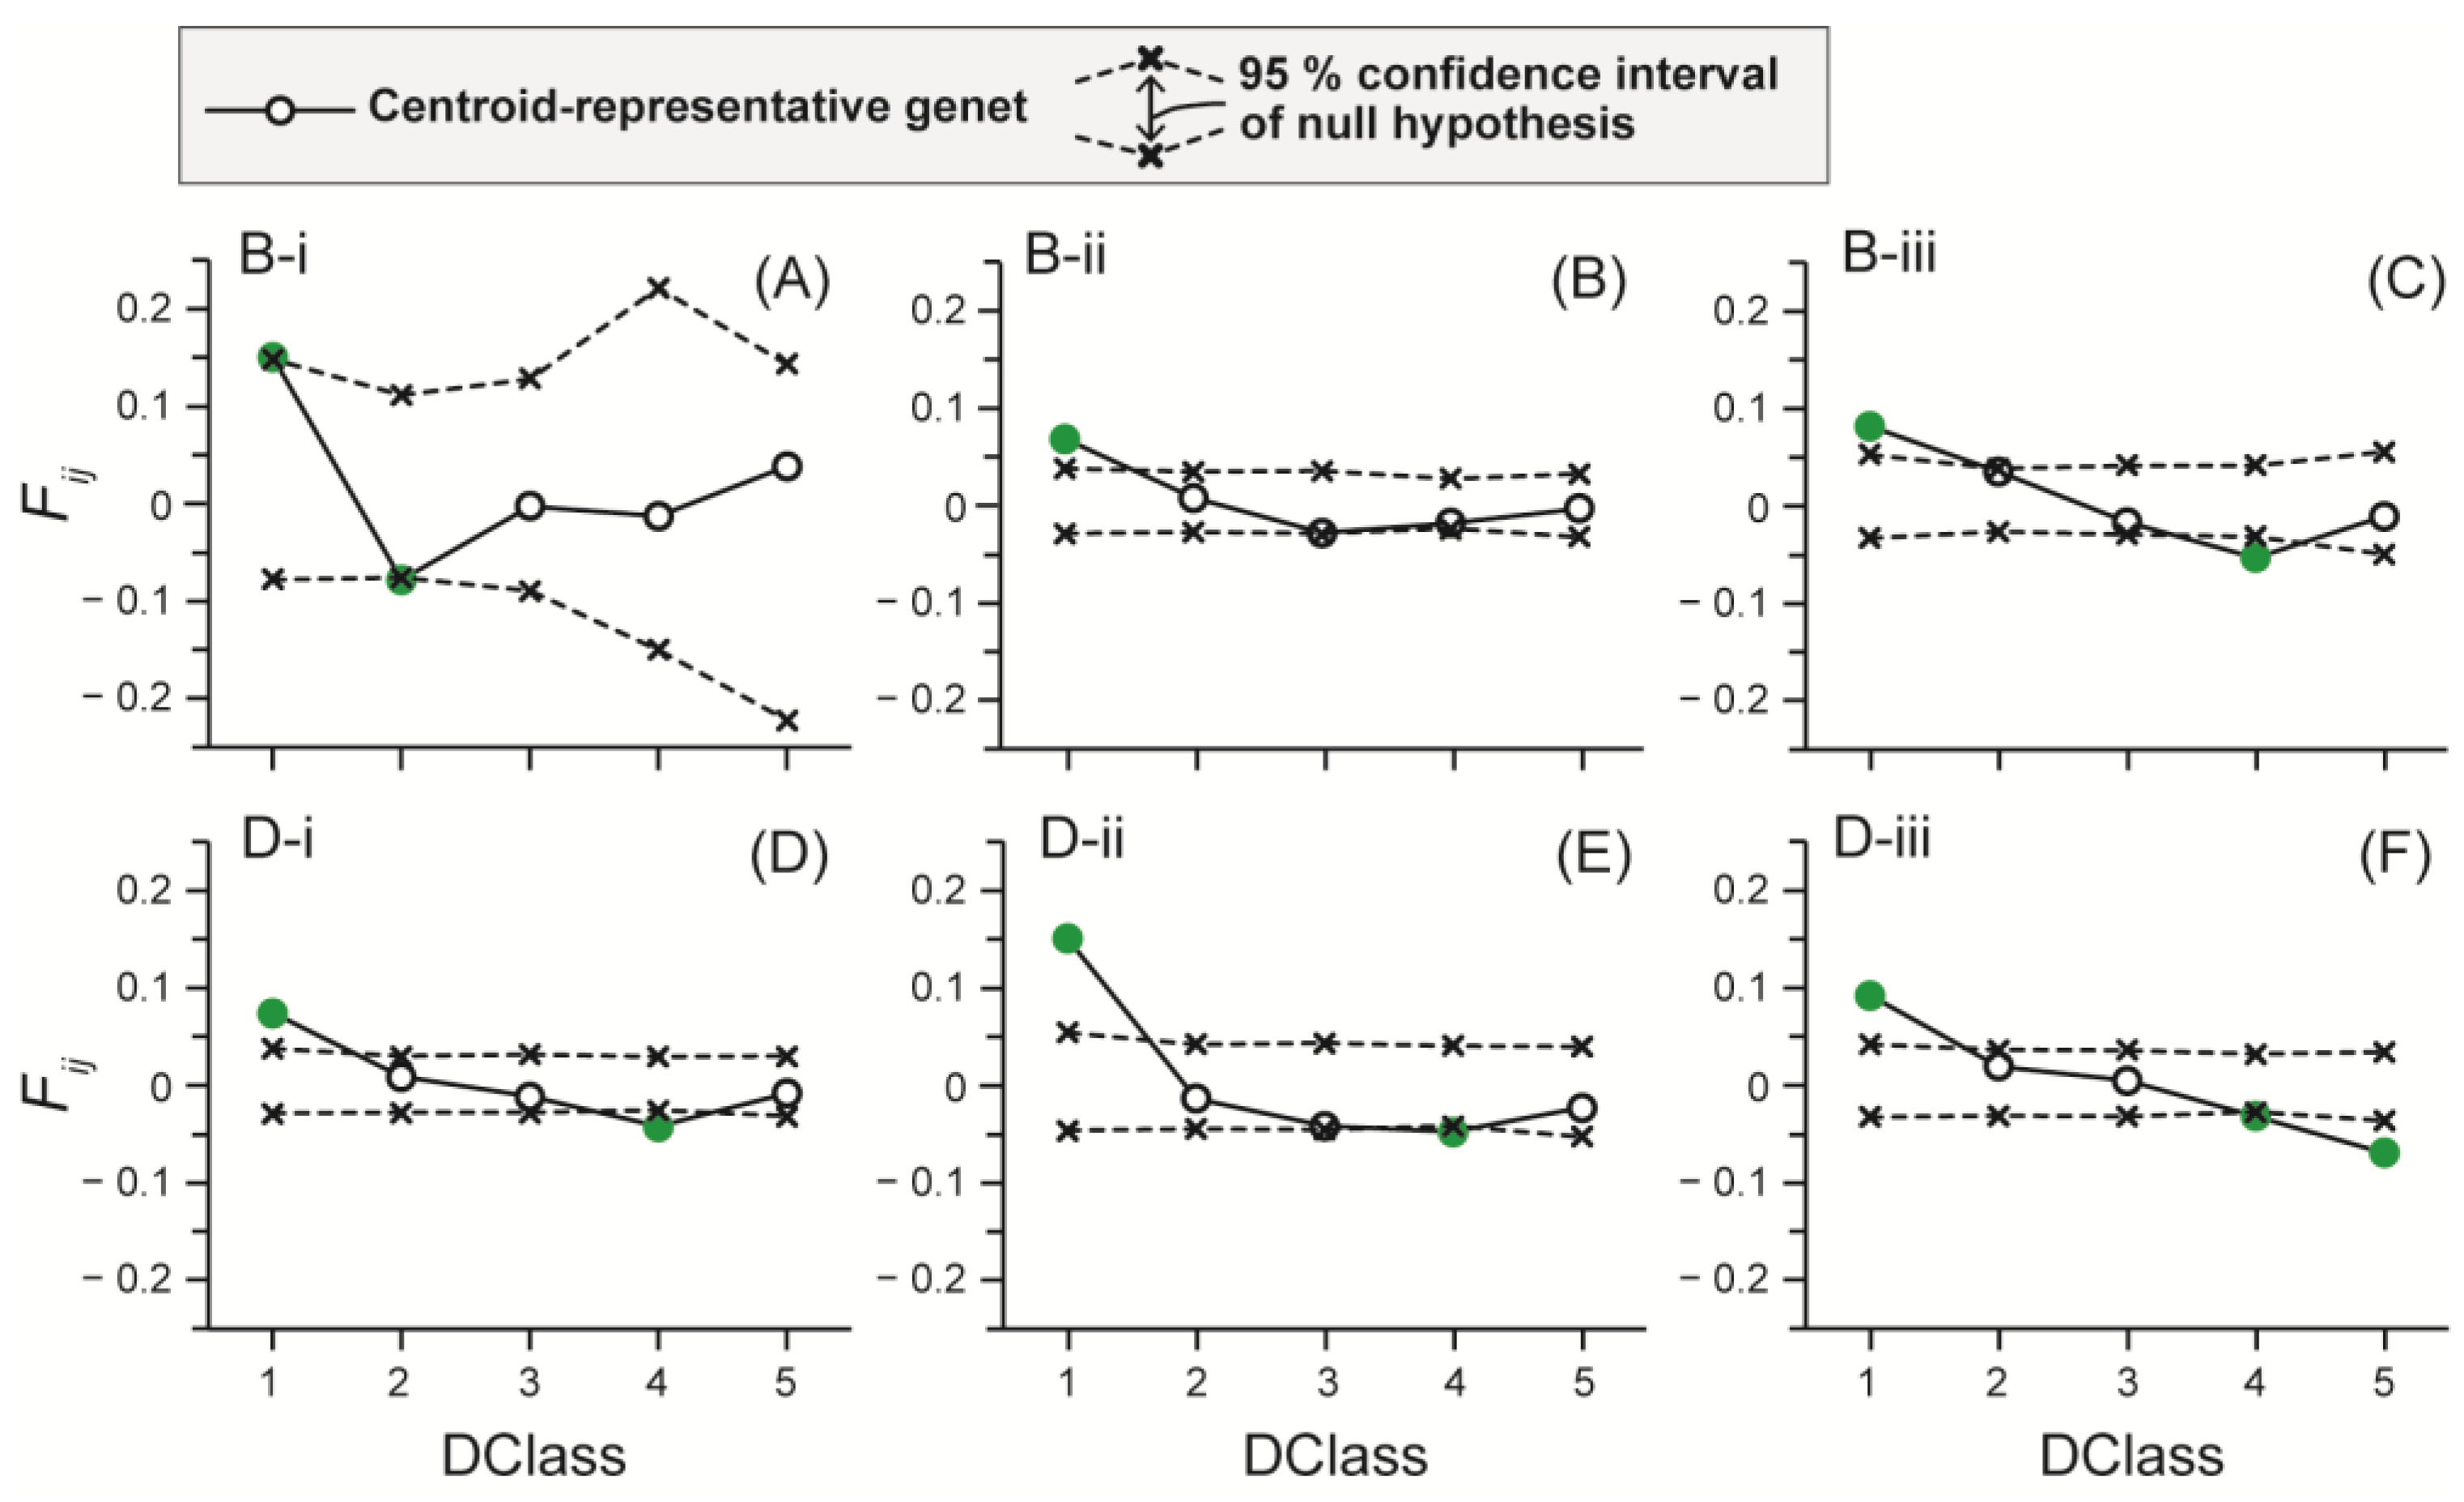
In the centroid-representative genet dataset, Fij values were significantly above the 95% confidence limit in DClass 1 at all quadrats (Figure 8). Fij values significantly below the lower 95% confidence limit were observed in DClass 2 at quadrat B-i, in DClass 4 at quadrats B-iii, D-i, D-ii, and D-iii, and in DClass 5 at quadrat D-iii (Figure 8A,C–F). In the randomly sampled genet dataset, Fij values fell within the 95% CI calculated from the random permutations at all quadrats and distance classes (Figure S4). Mean Fij values were positive only in DClass 1 and 2 at all quadrats except in DClass 2 at quadrat D-i, and in DClass 5 at quadrats B-i and B-iii (Figures S4 and S5). Among these, Fij values in DClass 1 at quadrats B-ii, D-i, D-ii, and D-iii were considered significantly positive because the proportion of significant iterations exceeded 0.5. All mean Fij values other than those described were negative. Among these negative mean values, Fij in DClass 4 at quadrat D-i was considered significantly negative because the proportion of significant iterations exceeded 0.5.
Figure 8.
Spatial autocorrelograms showing Loiselle’s kinship coefficient (Fij) at the centroid-representative genet across five distance classes (DClass 1–5) for quadrats (A) B-i, (B) B-ii, (C) B-iii, (D) D-i, (E) D-ii, and (F) D-iii. The dashed lines represent the upper and lower limits of the 95% confidence interval under the null hypothesis of a random spatial distribution. Green circles indicate statistically significant kinship values (p < 0.05).
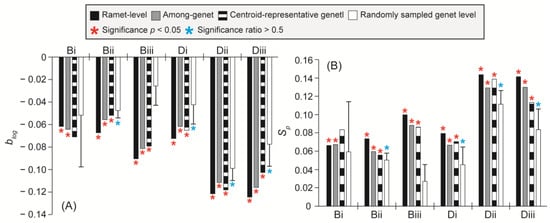
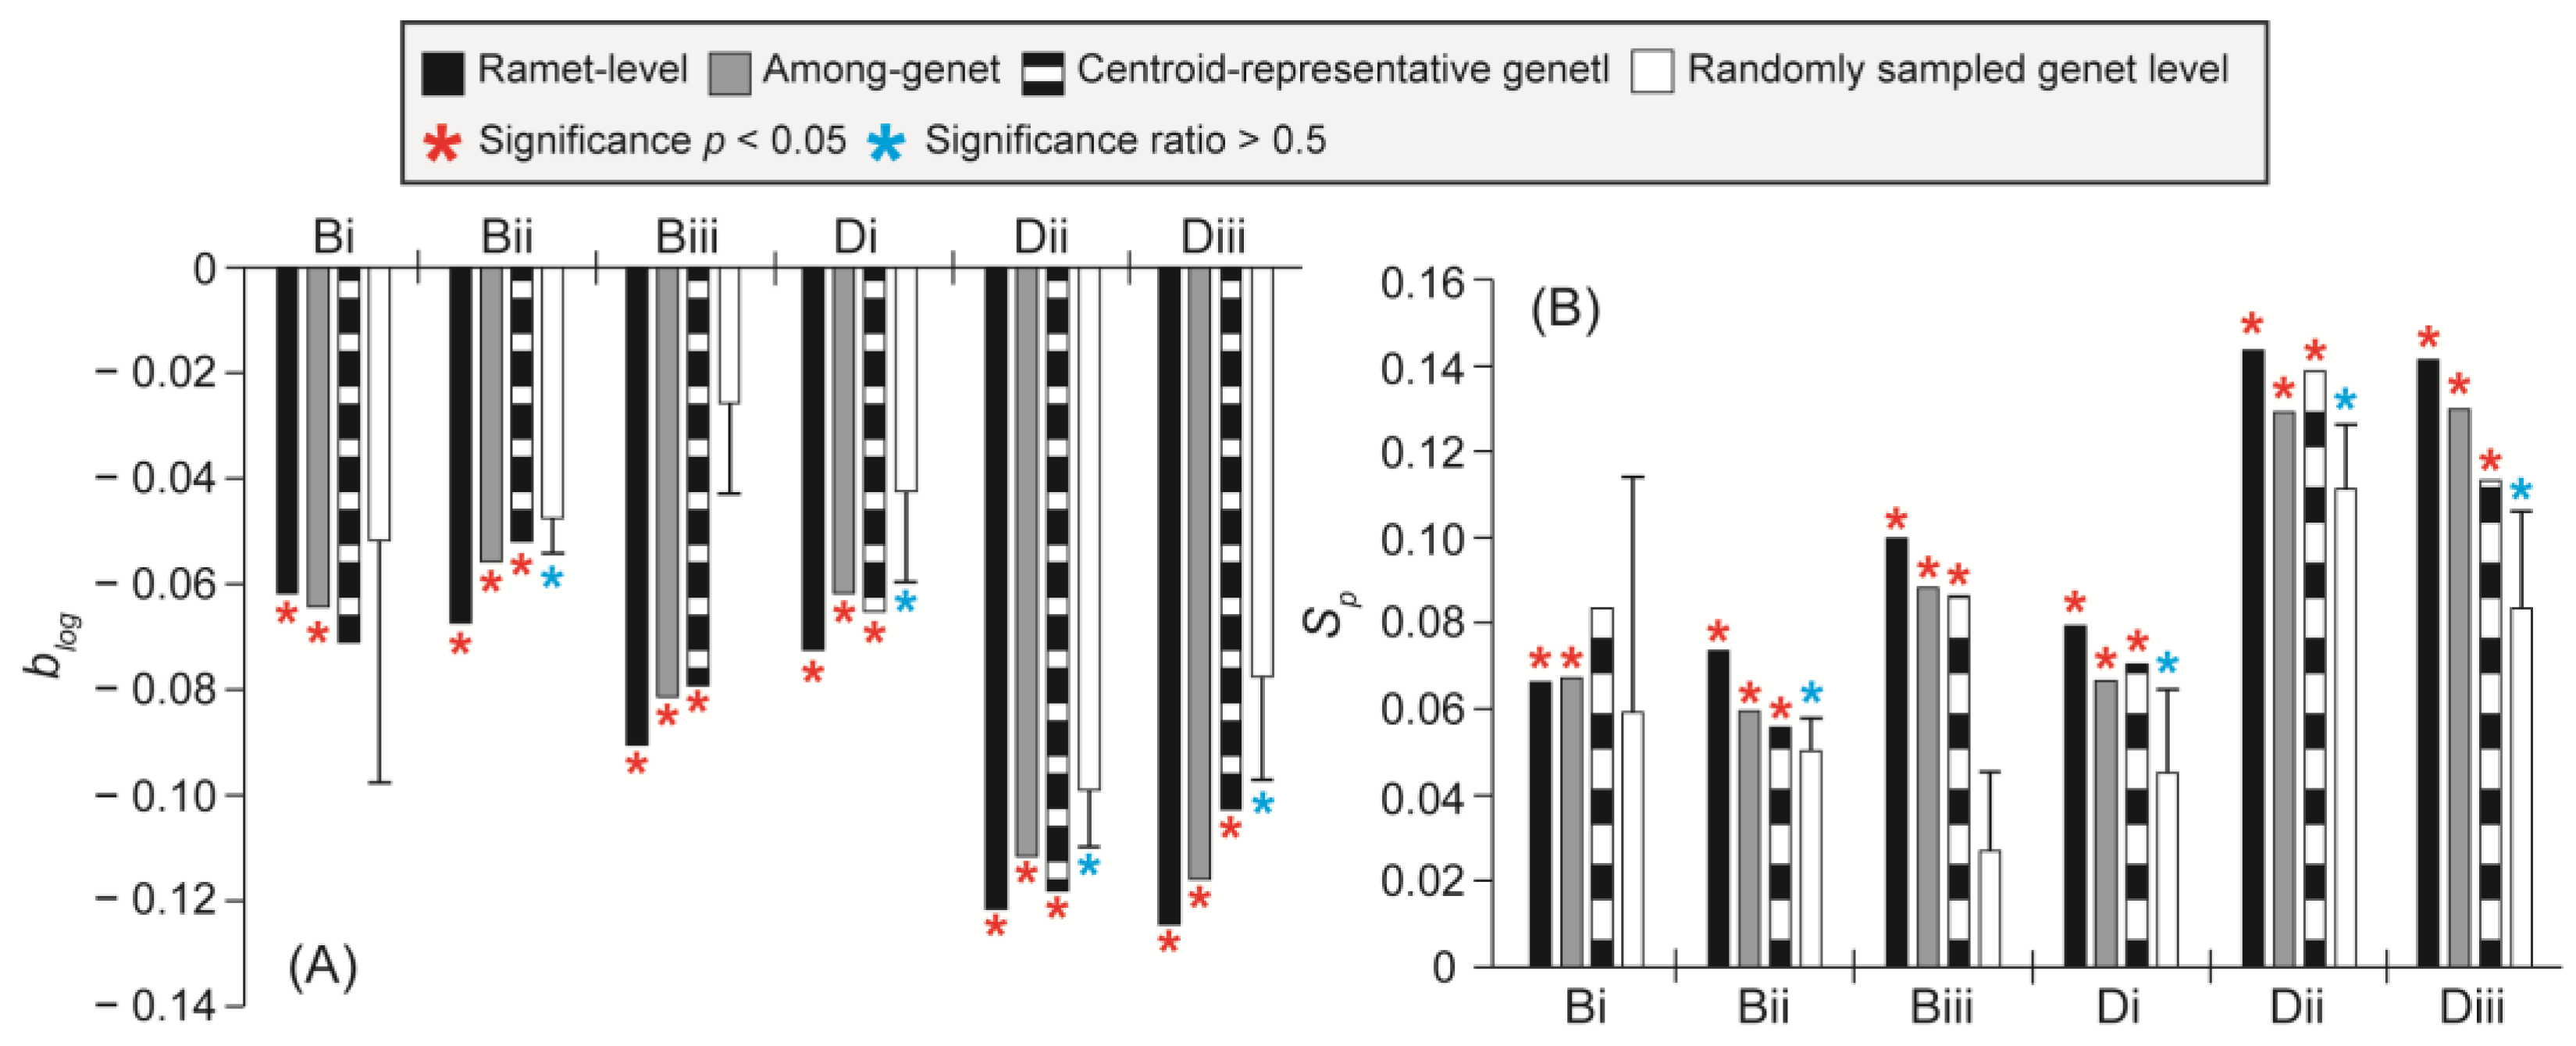
The blog values were significantly negative in all quadrats for the ramet-level, among-genet, and centroid-representative genet datasets, except at quadrat B-i in the centroid-representative genet dataset (Figure 9A). In the randomly sampled genet analysis, a significance ratio > 0.5 was observed at quadrat B-ii, D-i, D-ii, and D-iii. The blog values at Site B tended to be larger (i.e., less negative) than those at Site D: ramet-level (Site B: −0.073 ± 0.015; Site D: −0.106 ± 0.029), among-genet (Site B: −0.067 ± 0.013; Site D: −0.097 ± 0.030), centroid-representative genet (Site B: −0.067 ± 0.014; Site D: −0.095 ± 0.027), and randomly sampled genet (Site B: −0.042 ± 0.031; Site D: −0.073 ± 0.028) (Figure 9A). The significance patterns of the Sp statistic were consistent with those observed for blog. A similar difference between sites was observed in the Sp statistic: ramet-level (Site B: 0.080 ± 0.018; Site D: 0.12 ± 0.036), among-genet (Site B: 0.072 ± 0.015; Site D: 0.11 ± 0.037), centroid-representative genet (Site B: 0.075 ± 0.017; Site D: 0.11 ± 0.035), and randomly sampled genet (Site B: 0.046 ± 0.036; Site D: 0.080 ± 0.033) (Figure 9B).
Figure 9.
Bar plots for the data of (A) blog and (B) Sp at quadrats B-i, B-ii, B-iii, D-i, D-ii, and D-iii. Black bars, gray bars, black-and-white bars, and white bars correspond to the ramet-level, among-genet, centroid-representative genet, and randomly sampled genet dataset, respectively. Asterisks indicate significance (p < 0.05 confidence level) and the proportion of significant results among 100 iterations (>0.5). Error bars are standard deviations of randomly sampled genet data.
In the indirect estimation of dispersal scale (Table 1), the effective population density (D) at Site B (0.00760 ± 0.00327) was smaller than that at Site D (0.0120 ± 0.0004). Conversely, Nb, σ2, σ2veg and σ2sex, the values at Site B (Nb: 13.84 ± 3.57, σ2: 161.79 ± 67.62, σveg2: 45.10 ± 31.64, and σ2sex: 116.69 ± 41.38) were larger than those at Site D (Nb: 10.07 ± 3.65, σ2: 66.24 ± 24.83, σ2veg: 15.15 ± 2.081, and σ2sex: 51.09 ± 22.87). Finally, σ2sex/σ2veg ranged from 1.957 to 5.930 at Site B (3.344 ± 2.241) and from 2.276 to 4.359 at Site D (3.291 ± 1.043). On average, only a little difference in σ2sex/σ2veg values was observed between the two sites. The overall mean was 3.318 ± 1.563.
Table 1.
Values of effective population density (D), blog, Nb, σ2, σ2veg, σ2sex, and σ2sex/σ2veg at Sites B-i, B-ii, B-iii, D-i, D-ii, and D-iii. Asterisks indicate statistically significant blog values (p < 0.05).
4. Discussion
Understanding reproductive modes is essential for the conservation of wild populations. In this study, we evaluated the relative contributions of sexual reproduction and clonal propagation in S. fusiforme using a population genetic approach. Previous studies based on field observations have reported the dominance of clonal propagation during recovery [11] and in recruitment [12] within S. fusiforme beds. However, in the present study, we did not detect the dominance of a single or a few genets within quadrats. Although the size and number of ramets differed between the two sites, each quadrat contained 4–7 genets, and many thalli possessed unique multilocus genotypes. Therefore, in contrast to previous studies [11,12], both sexual reproduction and clonal propagation clearly contribute to population maintenance.
In the quadrat sampling, all indices characterizing clonal structure (i.e., genet size, number of ramets, indices of clonality, and clonal subrange) and the extent of clonal propagation (i.e., genotypic richness, fixation index and its variance, Pareto β, and synthetic linkage disequilibrium) consistently indicated a higher level of clonality at Site B than at Site D. Such spatial variation in clonality has also been reported in other partially clonal macrophytes: Potamogeton pectinatus Linnaeus [52], Cyperus papyrus Linnaeus [61], and L. rodriguezii [43], where such variation is driven by abiotic factors. Similarly, in the present study, the observed difference may be attributed to the difference in distance from the shoreline between Site B and Site D (15 m at Site B vs. 3 m at Site D). Site B is expected to experience a longer period of exposure during low tide, which likely results in greater environmental stress typical of the intertidal zone [62], such as UV radiation, desiccation, osmotic shock, and extreme temperatures. Salinity is unlikely to be a major stress factor, as S. fusiforme is a euryhaline species capable of tolerating wide salinity fluctuations over such exposure periods [63,64,65,66]. Although the effects of UV radiation have not been directly examined in any studies, desiccation [66] and high temperature [67,68] have been shown to reduce photochemical efficiency. Previous studies have also demonstrated that S. fusiforme is particularly vulnerable to temperatures exceeding 30 °C [68,69,70]. In addition, clonal shoots exhibit greater resistance to extremely high temperatures than young thalli derived from sexual reproduction [71]. In the present study, temperatures exceeding 30 °C were repeatedly recorded during low tide over a 15-day period, suggesting substantial thermal stress. Although the effects of desiccation require further investigation, the higher level of clonality observed at Site B may be related to the longer exposure period. Similar relationships between environmental stress and clonality have been reported in other macroalgae—for example, Chondrus crispus Stackhouse [72], Fucus vesiculosus Linnaeus and Fucus spiralis Linnaeus [73], and Mastocarpus papillatus (C.Agardh) Kützing [74]—despite differences in the mode of asexual reproduction. Finally, variation in clonality among quadrats within the same site may reflect microhabitat differences, such as small-scale topographic features (e.g., irregular substrates with channels or ridges).
Characteristics of sexual dispersal also differed between the two sampling sites. The larger value of σ2sex at Site B (116.69 ± 41.38) than at Site D (51.088 ± 22.870) indicates a larger spatial scale of sexual dispersal at Site B. The dispersal distance of seeds in seagrass and other aquatic plants is influenced by the strength of wave-driven oscillatory flows and microhabitat-scale topographic features or sediment type [75,76,77]. Given that the zygotes of S. fusiforme are transported by water currents, as are the seeds of seagrass and aquatic plants, some hydrodynamic or topographic conditions were likely to be different between Sites B and D. This likely contributed to the difference in the spatial scale of sexual reproduction. However, the environmental factors responsible for this difference remain to be identified and quantified.
Our results indicate that sexual dispersal is predominantly restricted to a small spatial scale within individual quadrats, although long-distance dispersal spanning meters to kilometers also contributes to the population structure despite its infrequency. The values of σ2sex/σ2veg suggest that sexual reproduction enables dispersal distances several times greater than those achieved by clonal propagation. Migration rate analyses indicated that more than 65% of dispersal occurred within a quadrat (50 cm × 50 cm), whereas at least 10% extended beyond this scale. Consistent with this predominance of localized migration, Fij values in the centroid-representative genet dataset were significantly positive only in DClass 1 (0–16 cm), exceeding the 95% confidence interval. A key finding emerged from comparing the results of the centroid-representative genet and randomly sampled genet database at DClass 1. In the randomly sampled genet, Fij values fell within the 95% confidence interval across all quadrats and distance classes. This discrepancy suggested that zygote dispersal is typically restricted to a scale comparable to the genet size, approximately 20 to 25 cm. This is because the random selection of a single ramet within a genet introduces spatial variation that effectively masks the genetic relatedness between neighboring individuals. In other words, the genetic signal of sexual recruitment is so highly localized that it can only be detected when the coordinates of genets are used. Despite this fine-scale pattern, the migration rate analysis also suggests the possibility of long-distance dispersal, which may be explained by two mechanisms: (1) the drifting of thalli bearing receptacles [78,79], and (2) sperm-mediated dispersal [80]. Long-distance dispersal has been previously reported in S. fusiforme, with populations becoming established on newly constructed breakwaters located kilometers away from natural populations [16].
In contrast to sexual reproduction, dispersal via clonal propagation appears to be largely restricted to within approximately 1 m. In the quadrat sampling, the maximum genet size was 70.7 cm with an average of 23.2 cm, while the clonal subrange was estimated to range from DClass 3 to 5 (26 to 71 cm). We also detected a few clonemates among samples collected at 1 m intervals in the random sampling. Taken together, S. fusiforme disperses offspring over long distances via sexual reproduction, and over short distances (<1 m) via both sexual reproduction and clonal propagation. This dispersal strategy is similar to that of seagrass species such as Enhalus acoroides (Linnaeus) Royle [30,81,82] and Zostera marina Linnaeus [83,84,85], which produce floating fruits or spathes. These species share many ecological characteristics with S. fusiforme, including shallow-water habitats, partial clonality, and clonal propagation involving regeneration of shoots from prostrate basal branches (analogous to stolon-like structures).
The results of the present study suggest that sexual reproduction may be more important than clonal propagation in maintaining S. fusiforme populations at the spatial scale examined here, contrary to previous studies [11,12] which did not employ population genetic approaches for identification of clonemates or spatial genetic structure analyses to estimate dispersal scale. The value of σ2sex/σ2veg was 3.318 on average, indicating that the spatial scale of sexual reproduction within quadrats was approximately three times greater than that of clonal propagation. Considering the high dispersal potential of sexual reproduction, which occasionally exceeds one kilometer, its cumulative contribution to population expansion may exceed that of clonal propagation despite the rarity of such long-distance dispersal events. However, this possibility could not be evaluated in the present study because sampling quadrats were designed to quantify maximum genet size rather than long-distance dispersal.
Based on recruitment patterns, two reproductive strategies are commonly recognized in clonal plants: repeated seedling recruitment (RSR) and initial seedling recruitment (ISR) [86]. S. fusiforme appears to conform to the RSR, which is characterized by continuous recruitment through sexual reproduction after colonization by the initial cohort [86]. Generally, RSR is prevalent in organisms inhabiting frequently disturbed environments. This is consistent with the habitat of S. fusiforme in the lower intertidal zone, which is subjected to drastic environmental changes due to the tidal cycle. RSR has been reported in many seagrass populations, including C. nodosa [87], E. acoroides [88], and Halodule wrightii Ascherson [89]. Conversely, ISR, characterized by substrate occupation by only the initial clonal cohort [84], has also been reported in some seagrasses, such as C. nodosa [90], Posidonia oceanica (Linnaeus) Delile [28,91], and Z. marina [92,93].
At quadrat B-i, the maximum genet scale (70.7 cm) reached the physical limit of the quadrat, and the clonal subrange could not be determined due to a lack of convergence between the ramet-level and among-genet datasets. This result suggests that some genets may extend beyond this estimate. Because clonemates were detected among samples at least 1 m apart in the random sampling, genet size may reach at least 1 m. Nevertheless, this anomalous result does not alter our overall conclusion that most genets extended only a few tens of centimeters. Alternatively, this discrepancy may simply reflect methodological limitations rather than a biological phenomenon. A similar discrepancy was observed at Site D, where the clonal subrange (DClass 3 and 4: 26 to 46 cm) was larger than the maximum genet scale (20.0 to 31.6 cm). In principle, however, clonal subrange values should align with the maximum genet scale within each quadrat [55]. This discrepancy may reflect the presence of undetected clones located between the grid nodes or insufficient sample size, which can introduce large variance in pairwise kinship estimates. In any case, future studies should employ a sampling strategy using larger quadrats or finer grids to collect more individuals. Such improvements may reduce the deviation between the centroid-representative genet and randomly sampled genet autocorrelogram (Figure S4), thereby enabling more accurate indirect estimation of dispersal using the centroid-representative genet.
5. Conclusions
In this study, we elucidated the reproductive strategy of the industrially important macroalga S. fusiforme by employing a population genetic approach. Our findings demonstrate that S. fusiforme disperses its progeny via both sexual reproduction and clonal propagation. Regarding sexual reproduction, while most sexual dispersal occurred within a single quadrat (typically within 20 cm), long-distance dispersal events, though infrequent, also contribute to population connectivity. In contrast, dispersal via clonal propagation was consistently limited to within 1 m, with an average extent of approximately 20 cm. Both the scale and frequency of these reproductive modes likely vary depending on environmental factors. Overall, our results suggest that sexual reproduction contributes more to the maintenance of S. fusiforme populations than previously recognized because of its greater dispersal potential and frequent local recruitment. This represents an important revision of the current understanding, which previously emphasized the predominance of clonal propagation [11,12]. Our results provide a foundation for the conservation and sustainable management of wild S. fusiforme populations.
Supplementary Materials
The following supporting information can be downloaded at: https://www.mdpi.com/article/10.3390/phycology6030072/s1, Figure S1: The function of probability of identity (PI), and probability of identity taken into account genetic similarity among siblings (PIsibs) in both marker sets used for random (A) and quadrat sampling (B); Figure S2: Daily mean, highest and lowest temperature at sampling site; Figure S3: Bar plot of pairwise genetic distance in quadrat sampling (A) and random sampling (B); Figure S4: Fij values of randomly sampled genet and 95% confidence interval of its null hypothesis at five distance classes in quadrat B-i (A), B-ii (B), B-iii (C), D-i (D), D-ii (E), and D-iii (F); Figure S5: Fij values of centroid-representative genet and randomly sampled genet at five distance classes in quadrat B-i (A), B-ii (B), B-iii (C), D-i (D), D-ii (E), and D-iii (F); Table S1: Microsatellite markers used for random sampling and quadrat sampling [94,95]; Table S2: Result of genotyping in random sampling; Table S3: Result of genotyping in quadrat sampling; Table S4: Result of PERMANOVA among the dataset of random sampling, quadrat samples in Site B and D including degrees of freedom, sum of squares, pseudo-F statistic, R-squared, p-value and p-value adjusted using Bonfferoni correction (p-adjusted); File S1: R script for calculating Fij values in among-genet; File S2: Python script for estimating 95% CI of the null hypothesis of a random spatial distribution of genets in centroid-representative genet analysis; File S3: Python script for calculating values of Nb, σ2, σ2sex, and σ2sex/σ2veg.
Author Contributions
Conceptualization: S.M. and S.A.; methodology: S.M. and S.A.; formal analysis: S.M.; investigation: S.M., Y.J. and S.A.; resources: T.H. and N.M.; data curation: S.M. and S.A.; writing—original draft preparation: S.M. and S.A.; writing—review and editing: all authors; visualization: S.M. and S.A.; supervision: S.A., H.M., and T.U.; project administration: S.M. and S.A.; Funding acquisition: S.M. and S.A. All authors have read and agreed to the published version of the manuscript.
Funding
The MIKIMOTO FUND FOR MARINE ECOLOGY, Japan (Grant no. 091-30-3), a JSPS Grant-in-Aid for Scientific Research (Grant no. 20J01345, 24K17948), a grant-in-aid from JST SPRING, Grant Number JPMJSP2119, and Regional University and Local Industrial Vitalization Grant Project (Hakodate City) adopted by the Cabinet Office (Japan) in March 2022.
Institutional Review Board Statement
Not applicable.
Informed Consent Statement
Not applicable.
Data Availability Statement
The data presented in this study are available on request from the corresponding authors.
Acknowledgments
We are grateful to the Kami-iso gun Fisheries Cooperative for their agreement of sample collection.
Conflicts of Interest
The authors declare no conflicts of interest. The funders had no role in the design of the study; in the collection, analyses, or interpretation of data; in the writing of the manuscript; or in the decision to publish the results.
References
- Yoshida, T. Marine Algae of Japan; Uchida Rokakuho Publishing: Tokyo, Japan, 1998. [Google Scholar]
- Zheng, Y.; Jin, R.; Zhang, X.; Wang, Q.; Wu, J. The considerable environmental benefits of seaweed aquaculture in China. Stoch. Environ. Res. Risk Assess. 2019, 33, 1203–1221. [Google Scholar] [CrossRef] [Scilit]
- Hwang, E.K.; Choi, H.G.; Kim, J.K. Seaweed resources of Korea. Bot. Mar. 2020, 63, 395–405. [Google Scholar] [CrossRef] [Scilit]
- Ito, R. Hiziki cultivation by clipping seedlings between culture ropes and an artificial seedling production technique using chopped filamentous roots. Aquabiology 2009, 31, 667–671. (In Japanese) [Google Scholar]
- Kiriyama, T.; Fujii, A.; Yotsui, T. Growth inhibiting factors for edible brown alga, Sargassum fusiforme, along coast of Nagasaki Prefecture, northwestern Kyushu, Japan. Aquacult. Sci. 2002, 50, 295–300, (In Japanese with English Abstract). [Google Scholar]
- Kiriyama, T.; Fujii, A.; Fujita, Y. Fish species causing poor growth phenomenon by feeding on Sargassum fusiforme along the coastal region of Nagasaki Prefecture, Western Japan. Aquacult. Sci. 2005, 53, 419–423, (In Japanese with English Abstract). [Google Scholar]
- Nakanishi, T. Cause of poor growth of Hijiki, Sargassum fusiforme off Mugi town. Bull. Tokushima Prefect. Agric. For. Fish. Technol. Support Cent. Fish. Res. Inst. 2012, 8, 23–26, (In Japanese with English Abstract). [Google Scholar]
- Zhang, Q.X.; Liu, G.M. The development and utilization on Sargassum fusiforme resources of Rongcheng coastal waters. Mar. Sci. 2009, 33, 45–48, (In Chinese with English Abstract). [Google Scholar]
- Suto, S. On growth of “Bush” in Hijikia fusiforme. Nippon Suisan Gakkaishi 1951, 17, 13–14, (In Japanese with English Abstract). [Google Scholar] [CrossRef] [Scilit]
- Bringloe, T.T.; Starko, S.; Wade, R.M.; Vieira, C.; Kawai, H.; De Clerck, O.; Cock, J.M.; Coelho, S.M.; Destombe, C.; Valero, M.; et al. Phylogeny and evolution of the brown algae. Crit. Rev. Plant Sci. 2020, 39, 281–321. [Google Scholar] [CrossRef] [Scilit]
- Arai, A.; Arai, S. Various factors affecting colonization of Hizikia fusiformis and Sargassum thunbergii. Aquacult. Sci. 1983, 30, 184–191. (In Japanese) [Google Scholar]
- Yoshida, G.; Shimabukuro, H. Seasonal population dynamics of Sargassum fusiforme (Fucales, Phaeophyta), Suo-Oshima Is., Seto Inland Sea, Japan—Development processes of a stand characterized by high density and productivity. J. Appl. Phycol. 2017, 29, 639–648. [Google Scholar] [PubMed]
- Nagato, Y.; Kawaguchi, S. Seasonal changes of Sargassum fusiforme at Shikanoshima on the northern coast of Kyushu, Japan, according to the fluctuations in weight of main branches. Nippon Suisan Gakkaishi 2003, 69, 30–35, (In Japanese with English Abstract). [Google Scholar] [CrossRef] [Scilit]
- Zou, D.; Gao, K.; Ruan, Z. Seasonal pattern of reproduction of Hizikia fusiformis (Sargassaceae, Phaeophyta) from Nanao Island, Shantou, China. J. Appl. Phycol. 2006, 18, 195–201. [Google Scholar] [CrossRef] [Scilit]
- Minamiguchi, S.; Jozawa, Y.; Hiyoshi, K.; Mizuta, H.; Uji, T.; Akita, S. Phenology of Sargassum fusiforme in its northernmost distribution limit in Japan. Jpn. J. Phycol. (Sôrui) 2026, 74, 1–8. [Google Scholar]
- Ito, R.; Nakagawa, A.; Tomitaka, I.; Terawaki, T.; Glenn, S.C.; Kitamura, H. Formation of Hiziki, Sargassum fusiforme, beds on the artificial breakwater in the tidal flat, northern Oita Prefecture. Bull. Oita Prefect. Agric. For. Fish. Res. Cent. Fish. Res. Inst. 2009, 2, 11–15. (In Japanese) [Google Scholar]
- Tanada, N.; Arai, S.; Makino, K. Sargassum fusiforme beds flourishing on artificial offshore breakwaters off Orino, on the northern coast of Tokushima Prefecture (Short Paper). Bull. Tokushima Prefect. Agric. For. Fish. Technol. Support Cent. Fish. Res. Inst. 2003, 2, 41–44. [Google Scholar]
- Araki, K.; Shimatani, K.; Ohara, M. Dynamics of distribution and performance of ramets constructing genets: A demographic–genetic study in a clonal plant, Convallaria keiskei. Ann. Bot. 2009, 104, 71–79. [Google Scholar] [CrossRef] [Scilit] [PubMed]
- Wilk, J.A.; Kramer, A.T.; Ashley, M.V. High variation in clonal vs. sexual reproduction in populations of the wild strawberry, Fragaria virginiana (Rosaceae). Ann. Bot. 2009, 104, 1413–1419. [Google Scholar] [CrossRef] [Scilit] [PubMed]
- Peakall, R.; Smouse, P.E. GENALEX 6: Genetic analysis in Excel. Population genetic software for teaching and research. Mol. Ecol. Notes 2006, 6, 288–295. [Google Scholar]
- Peakall, R.; Smouse, P.E. GenAlEx 6.5: Genetic analysis in Excel. Population genetic software for teaching and research—An update. Bioinformatics 2012, 28, 2537–2539. [Google Scholar] [PubMed]
- Durrant, H.M.; Barrett, N.S.; Edgar, G.J.; Coleman, M.A.; Burridge, C.P. Seascape habitat patchiness and hydrodynamics explain genetic structuring of kelp populations. Mar. Ecol. Prog. Ser. 2018, 587, 81–92. [Google Scholar] [CrossRef] [Scilit]
- González-Castellano, I.; González-López, J.; González-Tizón, A.M.; Martínez-Lage, A. Genetic diversity and population structure of the rockpool shrimp Palaemon elegans based on microsatellites: Evidence for a cryptic species and differentiation across the Atlantic–Mediterranean transition. Sci. Rep. 2020, 10, 10784. [Google Scholar] [CrossRef] [Scilit] [PubMed]
- Pérez-Alvarez, M.J.; Olavarría, C.; Moraga, R.; Baker, C.S.; Hamner, R.M.; Poulin, E. Microsatellite markers reveal strong genetic structure in the endemic Chilean dolphin. PLoS ONE 2015, 10, e0123956. [Google Scholar] [CrossRef] [Scilit] [PubMed]
- Uthicke, S.; Pratchett, M.S.; Messmer, V.; Harrison, H. Limited genetic signal from potential cloning and selfing within wild populations of coral-eating crown-of-thorns seastars (Acanthaster cf. solaris). Coral Reefs 2021, 40, 131–138. [Google Scholar]
- Stoeckel, S.; Becheler, R.; Bocharova, E.; Barloy, D. GenAPoPop 1.0: A user-friendly software to analyse genetic diversity and structure from partially clonal and selfed autopolyploid organisms. Mol. Ecol. Resour. 2024, 24, e13886. [Google Scholar] [PubMed]
- Meirmans, P.G. Genodive version 3.0: Easy-to-use software for the analysis of genetic data of diploids and polyploids. Mol. Ecol. Resour. 2020, 20, 1126–1131. [Google Scholar] [PubMed]
- Arnaud-Haond, S.; Duarte, C.M.; Alberto, F.; Serrao, E.A. Standardizing methods to address clonality in population studies. Mol. Ecol. 2007, 16, 5115–5139. [Google Scholar] [CrossRef] [Scilit] [PubMed]
- Coleman, M.A.; Wernberg, T. Genetic and morphological diversity in sympatric kelps with contrasting reproductive strategies. Aquat. Biol. 2018, 27, 65–73. [Google Scholar] [CrossRef] [Scilit]
- Yu, S.; Wu, Y.; Serrao, E.A.; Zhang, J.; Jiang, Z.; Huang, C.; Cui, L.; Thorhaug, A.; Huang, X. Fine-scale genetic structure and flowering output of the seagrass Enhalus acoroides undergoing disturbance. Ecol. Evol. 2019, 9, 5186–5195. [Google Scholar] [PubMed]
- Pareto, V. Cours d’Economie Politique; F. Rouge: Lausanne, Switzerland, 1897; Volume 2. [Google Scholar]
- Wright, S. Evolution and the Genetics of Populations. In The Theory of Gene Frequencies; University of Chicago Press: Chicago, IL, USA, 1969; Volume 2. [Google Scholar]
- Dorken, M.E.; Eckert, C.G. Severely reduced sexual reproduction in northern populations of a clonal plant, Decodon verticillatus (Lythraceae). J. Ecol. 2001, 89, 339–350. [Google Scholar]
- Agapow, P.M.; Burt, A. Indices of multilocus linkage disequilibrium. Mol. Ecol. Notes 2001, 1, 101–102. [Google Scholar]
- Kuo, J.; Cook, I.H.; Kirkman, H. Observations of propagating shoots in the seagrass genus Amphibolis C. Agardh (Cymodoceaceae). Aquat. Bot. 1987, 27, 291–293. [Google Scholar] [CrossRef] [Scilit]
- Schwarzschild, A.C.; Zieman, J.C. Apical dominance and the importance of clonal integration to apical growth in the seagrass Syringodium filiforme. Mar. Ecol. Prog. Ser. 2008, 360, 37–46. [Google Scholar] [CrossRef] [Scilit]
- Charlton, W.A. Studies in the Alismataceae. I. Developmental morphology of Echinodorus tenellus. Can. J. Bot. 1968, 46, 1345–1360. [Google Scholar] [CrossRef] [Scilit]
- Wilder, G.J. Symmetry and development of Butomus umbellatus (Butomaceae) and Limnocharis flava (Limnocharitaceae). Am. J. Bot. 1974, 61, 379–394. [Google Scholar] [CrossRef] [Scilit]
- Stoeckel, S.; Masson, J.P. The exact distributions of FIS under partial asexuality in small finite populations with mutation. PLoS ONE 2014, 9, e85228. [Google Scholar] [CrossRef] [Scilit] [PubMed]
- De Meeûs, T.; Balloux, F. Clonal reproduction and linkage disequilibrium in diploids: A simulation study. Infect. Genet. Evol. 2004, 4, 345–351. [Google Scholar] [CrossRef] [Scilit] [PubMed]
- De Meeûs, T.; Lehmann, L.; Balloux, F. Molecular epidemiology of clonal diploids: A quick overview and a short DIY (do it yourself) notice. Infect. Genet. Evol. 2006, 6, 163–170. [Google Scholar] [CrossRef] [Scilit] [PubMed]
- Stoeckel, S.; Becheler, R.; Portillo-Lemus, L.; Harang, M.; Besnard, A.L.; Lassalle, G.; Causse-Védrines, R.; Michon-Coudouel, S.; Park, D.J.; Pope, B.J.; et al. Reproductive modes in populations of late-acting self-incompatible and self-compatible polyploid Ludwigia grandiflora subsp. hexapetala in western Europe. Peer Community J. 2024, 4, e82. [Google Scholar]
- Reynes, L.; Thibaut, T.; Mauger, S.; Blanfuné, A.; Holon, F.; Cruaud, C.; Couloux, A.; Valero, M.; Aurelle, D. Genomic signatures of clonality in the deep water kelp Laminaria rodriguezii. Mol. Ecol. 2021, 30, 1806–1822. [Google Scholar] [CrossRef] [Scilit] [PubMed]
- Martinez Arbizu, P. pairwiseAdonis: Pairwise Multilevel Comparison Using Adonis, R Package Version 0.4. 2020. Available online: https://github.com/pmartinezarbizu/pairwiseAdonis (accessed on 30 June 2026).
- R Core Team. R: A Language and Environment for Statistical Computing; R Foundation for Statistical Computing: Vienna, Austria, 2024. [Google Scholar]
- Wilson, G.A.; Rannala, B. Bayesian inference of recent migration rates using multilocus genotypes. Genetics 2003, 163, 1177–1191. [Google Scholar] [CrossRef] [Scilit] [PubMed]
- Hothorn, T.; Hornik, K. exactRankTests: Exact Distributions for Rank and Permutation Tests, R Package Version 0.8-37. 2026. Available online: https://codeberg.org/thothorn/exactranktests (accessed on 30 June 2026).
- Vekemans, X.; Hardy, O.J. New insights from fine-scale spatial genetic structure analyses in plant populations. Mol. Ecol. 2004, 13, 921–935. [Google Scholar] [PubMed]
- Hardy, O.J.; Maggia, L.; Bandou, E.; Breyne, P.; Caron, H.; Chevallier, M.H.; Doligez, A.; Dutech, C.; Kremer, A.; Latouche-Hallé, C.; et al. Fine-scale genetic structure and gene dispersal inferences in 10 Neotropical tree species. Mol. Ecol. 2006, 15, 559–571. [Google Scholar] [PubMed]
- Monthe, F.K.; Hardy, O.J.; Doucet, J.L.; Loo, J.; Duminil, J. Extensive seed and pollen dispersal and assortative mating in the rain forest tree Entandrophragma cylindricum (Meliaceae) inferred from indirect and direct analyses. Mol. Ecol. 2017, 26, 5279–5291. [Google Scholar] [PubMed]
- Xu, N.N.; Jiang, K.; Biswas, S.R.; Tong, X.; Wang, R.; Chen, X.Y. Clone configuration and spatial genetic structure of two Halophila ovalis populations with contrasting internode lengths. Front. Ecol. Evol. 2019, 7, 170. [Google Scholar] [CrossRef] [Scilit]
- Triest, L.; Fénart, S. Clonal diversity and spatial genetic structure of Potamogeton pectinatus in managed pond and river populations. Hydrobiologia 2014, 737, 145–161. [Google Scholar]
- Holt, R.; Kwok, A.; Dorken, M.E. Increased spatial-genetic structure in a population of the clonal aquatic plant Sagittaria latifolia (Alismataceae) following disturbance. Heredity 2020, 124, 514–523. [Google Scholar] [PubMed]
- Bailleul, D.; Stoeckel, S.; Arnaud-Haond, S. RClone: A package to identify MultiLocus Clonal Lineages and handle clonal data sets in R. Methods Ecol. Evol. 2016, 7, 966–970. [Google Scholar] [CrossRef] [Scilit]
- Alberto, F.; Gouveia, L.; Arnaud-Haond, S.; Pérez-Lloréns, J.L.; Duarte, C.M.; Serrão, E.A. Within-population spatial genetic structure, neighbourhood size and clonal subrange in the seagrass Cymodocea nodosa. Mol. Ecol. 2005, 14, 2669–2681. [Google Scholar] [PubMed]
- Harris, C.R.; Millman, K.J.; Van Der Walt, S.J.; Gommers, R.; Virtanen, P.; Cournapeau, D.; Wieser, E.; Taylor, J.; Berg, S.; Smith, N.J.; et al. Array programming with NumPy. Nature 2020, 585, 357–362. [Google Scholar] [CrossRef] [Scilit] [PubMed]
- McKinney, W. Data structures for statistical computing in Python. In Proceedings of the 9th Python in Science Conference (SciPy 2010), Austin, TX, USA, 28 June–3 July 2010; Volume 445, pp. 51–56. [Google Scholar]
- Hardy, O.J.; Vekemans, X. Isolation by distance in a continuous population: Reconciliation between spatial autocorrelation and population genetics models. Heredity 1999, 83, 145–154. [Google Scholar] [CrossRef] [Scilit] [PubMed]
- Fenster, C.B.; Vekemans, X.; Hardy, O.J. Quantifying gene flow from spatial genetic structure data in a metapopulation of Chamaecrista fasciculata (Leguminosae). Evolution 2003, 57, 995–1007. [Google Scholar] [CrossRef] [Scilit] [PubMed]
- Gliddon, C.; Belhassen, E.; Gouyon, P.H. Genetic neighbourhoods in plants with diverse systems of mating and different patterns of growth. Heredity 1987, 59, 29–32. [Google Scholar] [CrossRef] [Scilit]
- Geremew, A.; Stiers, I.; Sierens, T.; Kefalew, A.; Triest, L. Clonal growth strategy, diversity and structure: A spatiotemporal response to sedimentation in tropical Cyperus papyrus swamps. PLoS ONE 2018, 13, e0190810. [Google Scholar] [CrossRef] [Scilit] [PubMed]
- Davison, I.R.; Pearson, G.A. Stress tolerance in intertidal seaweeds. J. Phycol. 1996, 32, 197–211. [Google Scholar] [CrossRef] [Scilit]
- Xie, X.J.; Wang, X.L.; Lin, L.D.; He, L.W.; Gu, W.H.; Gao, S.; Yan, X.F.; Pan, G.H.; Wu, M.J.; Wang, G.C. Effects of hypo-and hypersalinity on photosynthetic performance of Sargassum fusiforme (Fucales, Heterokontophyta). Photosynthetica 2016, 54, 210–218. [Google Scholar]
- Gao, S.; Huan, L.; Lu, X.P.; Jin, W.H.; Wang, X.L.; Wu, M.J.; Wang, G.C. Photosynthetic responses of the low intertidal macroalga Sargassum fusiforme (Sargassaceae) to saline stress. Photosynthetica 2016, 54, 430–437. [Google Scholar] [CrossRef] [Scilit]
- Li, J.; Liu, Y.; Liu, Y.; Wang, Q.; Gao, X.; Gong, Q. Effects of temperature and salinity on the growth and biochemical composition of the brown alga Sargassum fusiforme (Fucales, Phaeophyceae). J. Appl. Phycol. 2019, 31, 3061–3068. [Google Scholar] [CrossRef] [Scilit]
- Yonemori, Y.; Kokubu, S.; Nishihara, G.N.; Endo, H.; Terada, R. The effects of desiccation and salinity gradients on the PSII photochemical efficiency of an intertidal brown alga, Sargassum fusiforme from Kagoshima, Japan. Phycol. Res. 2023, 71, 3–12. [Google Scholar]
- Kokubu, S.; Nishihara, G.N.; Watanabe, Y.; Tsuchiya, Y.; Amamo, Y.; Terada, R. The effect of irradiance and temperature on the photosynthesis of a native alga Sargassum fusiforme (Fucales) from Kagoshima, Japan. Phycologia 2015, 54, 235–247. [Google Scholar] [CrossRef] [Scilit]
- Zuo, X.; Xu, L.; Luo, L.; Zeng, Y.; Ma, Z.; Wu, M.; Chen, B. Physiological responses of Sargassum fusiforme seedlings to high-temperature stress. Reg. Stud. Mar. Sci. 2023, 62, 102900. [Google Scholar] [CrossRef] [Scilit]
- Liang, M.; Jiang, J.; Wang, L.; Zhu, J. Transcriptomic insights into the heat stress response of Dunaliella bardawil. Enzym. Microb. Technol. 2020, 132, 109436. [Google Scholar] [CrossRef] [Scilit]
- Liu, X.; Huang, B. Heat stress injury in relation to membrane lipid peroxidation in creeping bentgrass. Crop Sci. 2000, 40, 503–510. [Google Scholar] [CrossRef] [Scilit]
- Endo, H.; Sugie, T.; Yonemori, Y.; Nishikido, Y.; Moriyama, H.; Ito, R.; Okunishi, S. Vegetative reproduction is more advantageous than sexual reproduction in a canopy-forming clonal macroalga under ocean warming accompanied by oligotrophication and intensive herbivory. Plants 2021, 10, 1522. [Google Scholar] [CrossRef] [Scilit] [PubMed]
- Krueger-Hadfield, S.A.; Roze, D.; Mauger, S.; Valero, M. Intergametophytic selfing and microgeographic genetic structure shape populations of the intertidal red seaweed Chondrus crispus. Mol. Ecol. 2013, 22, 3242–3260. [Google Scholar] [PubMed]
- Billard, E.; Serrão, E.; Pearson, G.; Destombe, C.; Valero, M. Fucus vesiculosus and spiralis species complex: A nested model of local adaptation at the shore level. Mar. Ecol. Prog. Ser. 2010, 405, 163–174. [Google Scholar] [CrossRef] [Scilit]
- Fierst, J.L.; Kübler, J.E.; Dudgeon, S.R. Spatial distribution and reproductive phenology of sexual and asexual Mastocarpus papillatus (Rhodophyta). Phycologia 2010, 49, 274–282. [Google Scholar] [CrossRef] [Scilit] [PubMed]
- Koch, E.W.; Ailstock, M.S.; Booth, D.M.; Shafer, D.J.; Magoun, A.D. The role of currents and waves in the dispersal of submersed angiosperm seeds and seedlings. Restor. Ecol. 2010, 18, 584–595. [Google Scholar]
- McMahon, K.; van Dijk, K.J.; Ruiz-Montoya, L.; Kendrick, G.A.; Krauss, S.L.; Waycott, M.; Verduin, J.; Lowe, R.; Statton, J.; Brown, E.; et al. The movement ecology of seagrasses. Proc. R. Soc. Lond. B Biol. Sci. 2014, 281, 20140878. [Google Scholar] [CrossRef] [Scilit]
- Orth, R.J.; Luckenbach, M.L.; Marion, S.R.; Moore, K.A.; Wilcox, D.J. Seagrass recovery in the Delmarva coastal bays, USA. Aquat. Bot. 2006, 84, 26–36. [Google Scholar] [CrossRef] [Scilit]
- Kendrick, G.A.; Walker, D.I. Dispersal distances for propagules of Sargassum spinuligerum (Sargassaceae, Phaeophyta) measured directly by vital staining and venturi suction sampling. Mar. Ecol. Prog. Ser. 1991, 79, 133–138. [Google Scholar] [CrossRef] [Scilit]
- van Hees, D.H.; Olsen, Y.S.; Mattio, L.; Ruiz-Montoya, L.; Wernberg, T.; Kendrick, G.A. Cast adrift: Physiology and dispersal of benthic Sargassum spinuligerum in surface rafts. Limnol. Oceanogr. 2019, 64, 526–540. [Google Scholar]
- Teixeira, S.; Pearson, G.A.; Candeias, R.; Madeira, C.; Valero, M.; Serrão, E.A. Lack of fine-scale genetic structure and distant mating in natural populations of Fucus vesiculosus. Mar. Ecol. Prog. Ser. 2016, 544, 131–142. [Google Scholar] [CrossRef] [Scilit]
- Kendrick, G.A.; Waycott, M.; Carruthers, T.J.B.; Cambridge, M.L.; Hovey, R.; Krauss, S.L.; Lavery, P.S.; Les, D.H.; Lowe, R.J.; Vidal, O.M.i.; et al. The central role of dispersal in the maintenance and persistence of seagrass populations. BioScience 2012, 62, 56–65. [Google Scholar] [CrossRef] [Scilit]
- Lacap, C.D.A.; Vermaat, J.E.; Rollon, R.N.; Nacorda, H.M. Propagule dispersal of the SE Asian seagrasses Enhalus acoroides and Thalassia hemprichii. Mar. Ecol. Prog. Ser. 2002, 235, 75–80. [Google Scholar] [CrossRef] [Scilit]
- Becheler, R.; Diekmann, O.; Hily, C.; Moalic, Y.; Arnaud-Haond, S. The concept of population in clonal organisms: Mosaics of temporally colonized patches are forming highly diverse meadows of Zostera marina in Brittany. Mol. Ecol. 2010, 19, 2394–2407. [Google Scholar] [CrossRef] [Scilit] [PubMed]
- Källström, B.; Nyqvist, A.; Åberg, P.; Bodin, M.; André, C. Seed rafting as a dispersal strategy for eelgrass (Zostera marina). Aquat. Bot. 2008, 88, 148–153. [Google Scholar] [CrossRef] [Scilit]
- Reusch, T.B.H. Microsatellites reveal high population connectivity in eelgrass (Zostera marina) in two contrasting coastal areas. Limnol. Oceanogr. 2002, 47, 78–85. [Google Scholar] [CrossRef] [Scilit]
- Eriksson, O. Dynamics of genets in clonal plants. Trends Ecol. Evol. 1993, 8, 313–316. [Google Scholar] [CrossRef] [Scilit] [PubMed]
- Ruggiero, M.V.; Capone, S.; Pirozzi, P.; Reusch, T.B.H.; Procaccini, G. Mating system and clonal architecture: A comparative study in two marine angiosperms. Evol. Ecol. 2005, 19, 487–499. [Google Scholar] [CrossRef] [Scilit]
- Dierick, J.; Phan, T.T.H.; Luong, Q.D.; Triest, L. Persistent clones and local seed recruitment contribute to the resilience of Enhalus acoroides populations under disturbance. Front. Plant Sci. 2021, 12, 658213. [Google Scholar] [CrossRef] [Scilit] [PubMed]
- Larkin, P.D.; Hamilton, A.M.; Lopez, A.I.; Rubiano-Rincon, S. How clone can you go? Seedbank density and a multiscale assessment of genotypic diversity in the seagrass Halodule wrightii. Aquat. Bot. 2020, 163, 103207. [Google Scholar] [CrossRef] [Scilit]
- Alberto, F.; Massa, S.; Manent, P.; Diaz-Almela, E.; Arnaud-Haond, S.; Duarte, C.M.; Serrão, E.A. Genetic differentiation and secondary contact zone in the seagrass Cymodocea nodosa across the Mediterranean-Atlantic transition region. J. Biogeogr. 2008, 35, 1279–1294. [Google Scholar]
- Arnaud-Haond, S.; Duarte, C.M.; Diaz-Almela, E.; Marba, N.; Sintes, T.; Serrão, E.A. Implications of Extreme Life Span in Clonal Organisms: Millenary Clones in Meadows of the Threatened Seagrass Posidonia oceanica. PLoS ONE 2012, 7, e30454. [Google Scholar] [CrossRef] [Scilit] [PubMed]
- Reusch, T.B.H.; Bostrom, C.; Stam, W.T.; Olsen, J.L. An ancient eelgrass clone in the Baltic. Mar. Ecol. Prog. Ser. 1999, 183, 301–304. [Google Scholar] [CrossRef] [Scilit]
- Olsen, J.L.; Stam, W.T.; Coyer, J.A.; Reusch, T.B.H.; Billingham, M.; Bostrom, C.; Calvert, E.; Christie, H.; Granger, S.; la Lumière, R.; et al. North Atlantic phylogeography and large-scale population differentiation of the seagrass Zostera marina L. Mol. Ecol. 2004, 13, 1923–1941. [Google Scholar] [PubMed]
- Horiuchi, H.; Kobayashi, H.; Iwasaki, T.; Shimada, S. Phylogeograchic analyses of Sargrassum fusiforme (Sargassaceae, Phaeophyceae) distributed around Japanese coast. Jpn. J. Phycol. (Sôrui) 2017, 65, 139–148, (In Japanese with English Abstract). [Google Scholar]
- Jia, R.; Lu, X.; Wang, W.; Liang, Z.; Yao, H.; Li, B. Development and validation of microsatellite markers for Sargassum fusiforme based on transcriptomic data. Bot. Mar. 2022, 65, 197–207. [Google Scholar] [CrossRef] [Scilit]

Disclaimer/Publisher’s Note: The statements, opinions and data contained in all publications are solely those of the individual author(s) and contributor(s) and not of MDPI and/or the editor(s). MDPI and/or the editor(s) disclaim responsibility for any injury to people or property resulting from any ideas, methods, instructions or products referred to in the content. |
© 2026 by the authors. Licensee MDPI, Basel, Switzerland. This article is an open access article distributed under the terms and conditions of the Creative Commons Attribution (CC BY) license.