


Simple Summary
Azawak cattle contribute to meat and milk production in West Africa, but their basic energy needs are poorly known. This study evaluated nine growing bulls fed the same diet at three energy levels. Gas measurements and urine analysis were used to estimate the energy required to maintain normal body functions. Higher feed intake increased methane production, nitrogen losses, and body heat. The results showed that Azawak bulls use about 62.9% of the feed energy supplied for maintenance. These findings can help improve diet formulation, reduce feed waste, and support more efficient and sustainable cattle production in West Africa.
Abstract
Accurate estimates of maintenance energy requirements are essential for precision feeding, yet breed-specific values remain scarce for Azawak cattle. This study quantified net energy for maintenance (NEm), metabolizable energy for maintenance (MEm), and the efficiency of metabolizable energy use for maintenance (km) in Azawak bulls. Nine bulls were evaluated in a replicated 3 × 3 Latin-square design and assigned to three graded metabolizable energy supply levels, designated low, intermediate, and high. The feeding levels were established by varying daily feed allowance while maintaining the same basal forage-based ration. Indirect calorimetry was performed using the GreenFeed system to quantify respiratory gas exchange, urinary nitrogen was determined, and heat production was calculated according to Brouwer’s equation. Increasing energy supply significantly (p < 0.05) enhanced oxygen consumption, carbon dioxide and methane production, urinary nitrogen excretion, and heat production. The heat production (HP) and metabolisable energy intake (MEI) relationship was analysed using a linear mixed-effects model, with bull included as a random effect to account for repeated measurements. The resulting population-level relationship was ln(HP) = −1.1246 + 0.8985 × MEI. The estimated intercept was −1.1246 ± 0.0536 (95% CI: −1.2297 to −1.0195), whereas the MEI slope was 0.8985 ± 0.0850 (95% CI: 0.7320 to 1.0651; p < 0.001). Back-transformation of the intercept yielded an NEm of 0.325 MJ/kg BW0.75/day (95% CI: 0.292–0.361), whereas MEm, estimated at the point where predicted heat production equalled metabolizable energy intake, was 0.517 MJ/kg BW0.75/day (95% CI: 0.467–0.576). The corresponding km was 0.629 (95% CI: 0.566–0.688), indicating that 62.9% of metabolizable energy supplied at maintenance was converted into net energy. These results provide the first breed-specific maintenance energy coefficients for Azawak bulls and offer a robust basis for improving ration formulation, energy-use efficiency, and feeding precision in this important indigenous cattle breed.
1. Introduction
Energy allocated to maintenance represents the primary energetic cost that must be met before nutrients can be directed toward growth, reproduction, or other productive functions in cattle [1]. Maintenance expenditure supports essential physiological processes, including cellular and protein turnover, ion transport, cardiorespiratory activity, thermoregulation, and the metabolism of highly active visceral organs [2]. Because maintenance accounts for a substantial proportion of total energy use in growing cattle, inaccurate estimates can lead to systematic errors in ration formulation, either constraining performance through underfeeding or increasing feed costs and nutrient losses through oversupply [3]. Within the net-energy framework, net energy for maintenance (NEm) corresponds to fasting heat production, metabolizable energy for maintenance (MEm) represents the energy intake required to achieve zero energy retention, and their ratio defines the efficiency of metabolizable energy utilization for maintenance (km) [4].
Most widely used feeding standards were developed from experiments conducted with commercial cattle genotypes under temperate or tightly controlled conditions [2,3]. Their direct application to indigenous West African cattle may be inappropriate because maintenance requirements are influenced by genotype, age, body composition, nutritional history, physical activity, and environmental conditions [1]. West African cattle have evolved under high temperatures, seasonal feed scarcity, fibrous diets, and persistent disease pressure, resulting in adaptive traits that may alter thermoregulatory expenditure, visceral-organ activity, tissue turnover, and basal metabolism [5]. Consistent with these differences, lower fasting heat production has frequently been reported in Bos indicus and indicine-influenced cattle than in temperate Bos taurus breeds [6,7,8]. The Azawak is a Sahelian zebu breed valued for its adaptation to high ambient temperatures, seasonal nutritional restriction, and low-input production systems [9]. Although its reproductive, growth, dairy, and adaptive characteristics have been investigated [10,11], quantitative information on its energy metabolism remains scarce. Recent estimates obtained for Borgou bulls provide an important regional reference [12], but differences in genetic background, ecological origin, mature size, and adaptive history preclude their direct extrapolation to Azawak cattle.
Indirect calorimetry provides a physiological approach for estimating maintenance requirements from oxygen consumption, carbon dioxide and methane production, and urinary nitrogen excretion using Brouwer’s equation [13]. Measurements across graded metabolizable energy intakes allow NEm to be estimated from the regression intercept and MEm to be identified where predicted heat production equals metabolizable energy intake [1,4]. Automated head-chamber systems such as GreenFeed facilitate repeated respiratory measurements in unrestrained animals [14], and their gas-flux estimates can support the assessment of whole-animal energy metabolism when appropriate sampling and quality-control procedures are applied [15]. Because heat production increases with the energetic costs of digestion, fermentation, absorption, and nutrient metabolism, its relationship with metabolizable energy intake provides the basis for estimating maintenance-energy coefficients [16].
Accordingly, the present study used indirect calorimetry based on automated respiratory gas measurements to evaluate energy metabolism in growing Azawak bulls. The objectives were to characterize the responses of respiratory gas exchange, urinary nitrogen excretion, and heat production to increasing metabolizable energy supply and to estimate NEm, MEm, and km. We hypothesized that heat production would increase with metabolizable energy intake and that the resulting coefficients would provide maintenance-energy values specifically applicable to growing Azawak bulls under tropical feeding conditions.
2. Materials and Methods
2.1. Ethical Approval
The experimental protocol was reviewed and authorized by the Ethics Committee of the University of Parakou before the commencement of the study (approval No. 113, issued on 3 April 2023). Throughout the experiment, animal management, feeding, handling, and measurement procedures were conducted in accordance with the institutional requirements for animal welfare and ethical use of livestock in research.
2.2. Study Zone
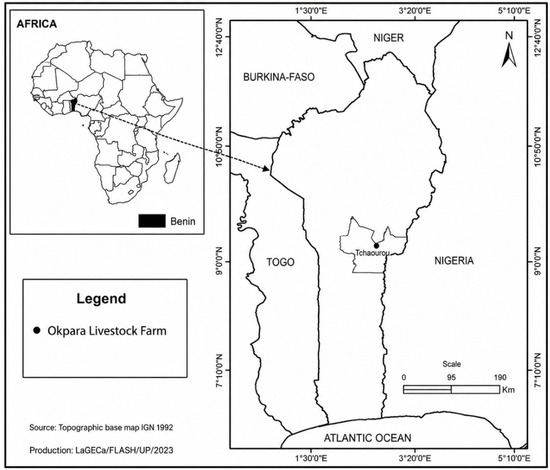
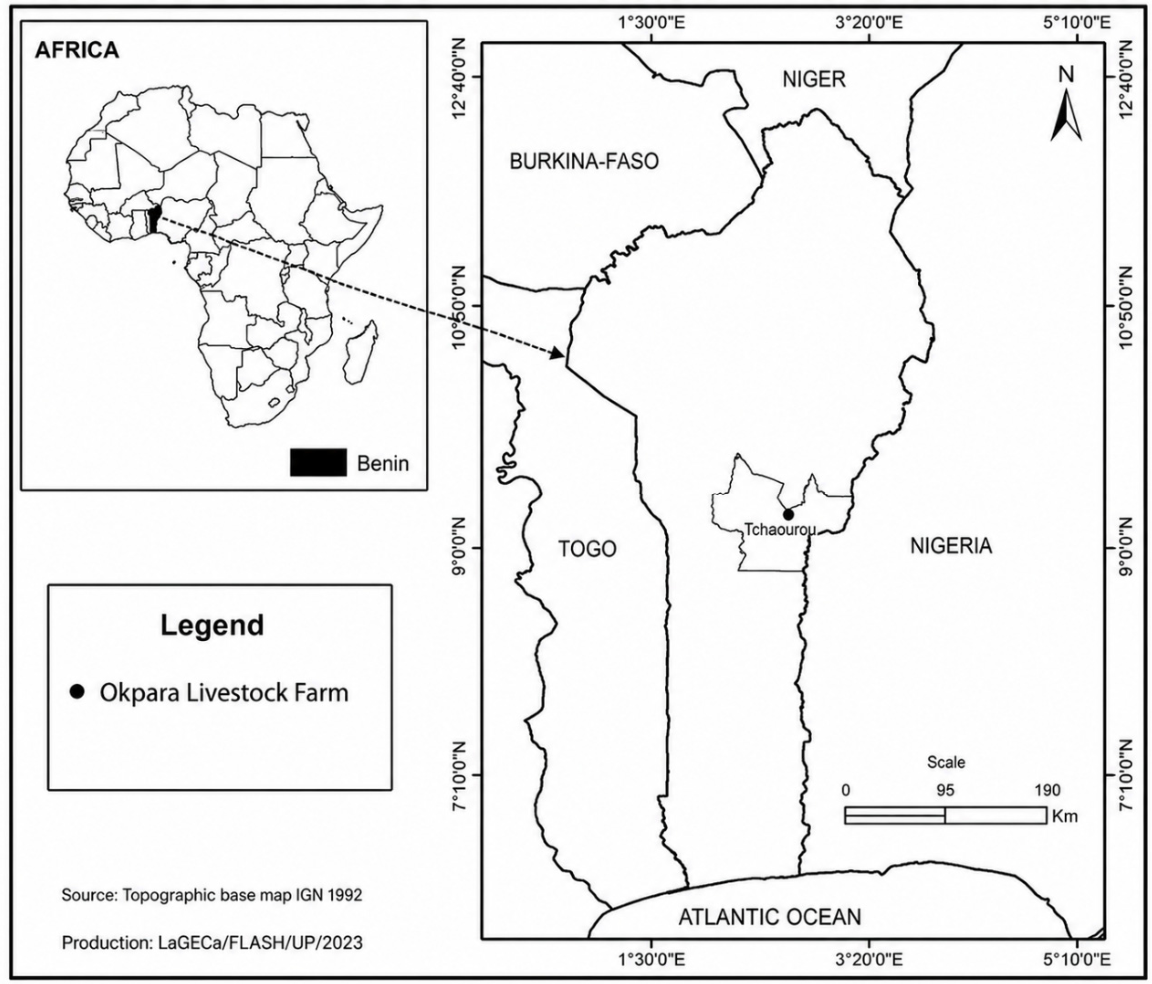
The experiment was carried out at the Okpara Livestock Farm, a public research and breeding facility located in the Kika district of Tchaourou municipality (Figure 1), approximately 15 km east of Parakou in north-eastern Benin. The farm lies between 9°15′ and 9°20′ N latitude and 2°40′ and 2°49′ E longitude and serves as one of the principal sites for cattle production and animal nutrition research in the country.
Figure 1.
Geographical location of Okpara Livestock Farm in Benin in which Azawak bulls were used to determine energy efficiency for maintenance.
The study area belongs to the South-Sudanian agroecological zone and experiences a unimodal rainfall regime. The wet season generally extends from May to October, followed by a dry period from November to April. Annual precipitation varies from approximately 700 to 1400 mm, while mean air temperature is generally between 26 and 27 °C [17]. The local landscape is composed mainly of plains and gently undulating plateaus developed over granitic and metamorphic parent materials, with tropical ferruginous soils predominating [18]. Vegetation is characterized by wooded and shrub savannas, interspersed with gallery forests along rivers and seasonal watercourses, reflecting the typical structure of Sudanian ecosystems in West Africa.
2.3. Experimental Animals, Dietary Treatments and Management
Nine clinically healthy, growing Azawak bulls, approximately 30 months of age and not yet considered physically mature, were enrolled in the experiment, with an initial mean body weight of 219.28 ± 2.56 kg. Selection was based on breed conformity, age, live weight, general health status, and the absence of visible locomotor or digestive disorders. Before the start of measurements, all bulls underwent routine veterinary examination, were treated against internal parasites, and were progressively accustomed to individual housing, the experimental diet, and the GreenFeed unit.
The study was arranged as a replicated 3 × 3 Latin square, with animals allocated randomly to treatment sequences so that each bull received each dietary treatment once during the experiment. Each bull remained in the same individual pen throughout the study, while dietary treatments rotated among bulls and, consequently, among pens according to the Latin-square sequences. Three graded feed allowances were established and designated low, intermediate, and high metabolizable energy supply. The purpose of these treatments was to generate a sufficiently broad gradient in metabolizable energy intake to characterize the relationship between heat production and energy intake and subsequently estimate maintenance energy requirements. No formal a priori power calculation was performed. The sample size was determined by the structure of the replicated 3 × 3 Latin-square design, which required nine animals to establish three complete Latin squares. It also reflected the availability of clinically healthy and relatively homogeneous Azawak bulls and the logistical capacity for individual housing, total urine collection, and repeated GreenFeed measurements.
A common forage-based diet was offered across all treatments. The ration consisted of rangeland fodder supplemented with cotton ginning waste, and its ingredient and chemical composition are reported in Table 1. The experimental energy gradient was generated by varying the daily amount of the basal diet offered rather than by changing its formulation. Feed allowances were predetermined to establish low, intermediate, and high levels of energy supply. Metabolizable energy intake was subsequently calculated from individual feed consumption and the metabolizable energy concentration of the feeds consumed. This strategy reduced potential confounding associated with differences in ingredient composition, nutrient density, or digestibility among treatments. Blinding of the personnel involved in animal management and data collection was not feasible owing to the visibly different feed allowances among treatments. However, GreenFeed measurements were recorded automatically.
Table 1.
Ingredient proportions (% on dry matter [DM] basis) and analyzed chemical composition of the basal diet and GreenFeed bait pellet used in the Azawak bull experiment.
For each bull, the daily feed allowance was calculated individually according to its metabolic body weight (BW0.75) and the energy treatment assigned for the corresponding experimental period. Feed allowance was updated using the most recent body-weight measurement to maintain the intended metabolizable energy supply throughout the experiment. Consequently, the amount of feed offered varied among bulls and experimental periods according to body weight and assigned treatment. The individually calculated daily allowance was divided into two equal meals and provided in the individual feeding trough of each pen at 08:00 and 16:00 h. Thus, the amount supplied at each meal corresponded to half of the bull’s calculated daily allowance. Refusals were collected and weighed before the morning feeding, and individual dry matter intake was determined as the difference between the dry matter offered and refused. Representative samples of the diet and feed refusals were collected and retained for laboratory analysis.
The experiment was conducted from March to June 2026 and comprised three consecutive 21-day periods. Each period included 14 days of adaptation followed by 7 days of measurement. During adaptation, bulls became accustomed to the assigned feed allowance, the feeding schedule, individual housing, and repeated visits to the GreenFeed system. The measurement phase was used to record feed intake, respiratory gas exchange, urinary nitrogen excretion, heat production, and body-weight change.
Animals were housed individually in 9-m2 pens within a naturally ventilated barn. Each pen had a concrete floor, an individual feeding trough, and continuous access to clean drinking water. Pens were cleaned daily to maintain hygienic conditions and facilitate accurate monitoring of feed refusals and animal health.
Body weight was recorded twice during each experimental period, on days 1 and 21, under standardized conditions and before the morning meal. Measurements were obtained using a calibrated livestock scale with a precision of 0.1 kg. Dietary treatments were changed on day 1 of each period according to the Latin-square sequence. Individual feed allowances were then adjusted using the day-1 body weight and maintained throughout the corresponding 21-day period. Each treatment change was followed by 14 days of adaptation and 7 days of measurement. Average daily gain (ADG, kg/d) was calculated as the difference between final and initial body weight divided by the 21-day experimental period. The mean body weight for each period was used to calculate metabolic body weight (BW0.75) and express metabolizable energy intake relative to metabolic size.
2.4. Chemical Analysis of the Experimental Diet
Representative samples of rangeland fodder, cotton ginning waste, and the complete experimental diet were collected throughout the trial. Chemical analyses were performed at the Laboratory of Ecology, Health and Animal Production, University of Parakou, Benin, for dry matter, organic matter, ash, and gross energy determinations, and at the Laboratory of Food Physico-chemistry and Sensory Evaluation, University of Abomey-Calavi, Benin, for the remaining analyses. Samples were oven-dried at 65 °C to constant weight and ground to obtain a homogeneous material for laboratory analysis.
Dry matter was determined according to [19], Method 934.01, by oven drying at 105 °C to constant weight. Ash was measured using Method 942.05, and organic matter was calculated as the difference between dry matter and ash. Total nitrogen was quantified by the Kjeldahl procedure according to Method 990.03, and crude protein was calculated as nitrogen × 6.25. Ether extract was determined following Method 2003.05, whereas crude fiber was analysed using Method 978.10.
Neutral detergent fiber and acid detergent fiber were determined following the detergent fiber procedures described by Van Soest et al. [20]. Gross energy was measured by bomb calorimetry, and metabolizable energy was estimated from the chemical composition of the diet using the predictive equations proposed by Baumont et al. [21]. Except for dry matter, all analytical results are expressed on a dry matter basis.
The GreenFeed pellets were analyzed for dry matter, organic matter, crude protein, crude fiber, ash, ether extract, and gross energy. However, NDF and ADF were not determined because detergent-fiber analyses were not included in the analytical panel applied to the pellet samples. This omission limited the complete fiber characterization of the GreenFeed pellets.
2.5. Respiratory Gas Measurements and Urinary Nitrogen Determination
Respiratory exchange was quantified individually using an automated GreenFeed system (C-Lock Inc., Rapid City, SD, USA). Although the bulls were maintained in separate pens, access to the equipment was restricted to predefined sampling sessions. At each scheduled time, animals were brought separately to the unit, allowing gas measurements to be attributed unambiguously to the corresponding bull and preventing simultaneous access by more than one animal.
Animal attendance at the unit was encouraged through the automatic delivery of approximately 32 ± 2 g of pelleted bait at 30-s intervals. These pellets were used solely as an attractant to encourage the bulls to visit the unit and maintain the correct head position during gas measurements; they were not part of the experimental basal-diet formulation or considered a separate dietary treatment. The same pellet formulation and dispensing settings were used for all bulls and treatments. The quantity consumed during each measurement session was recorded for each bull and subsequently incorporated into the calculations of total dry matter intake and metabolizable energy intake. Pellet intake was converted to dry matter using its measured dry matter content before being added to basal-diet intake. Its contribution to metabolizable energy intake was calculated using the metabolizable energy concentration reported in Table 1. Sampling sessions were distributed throughout the day at 06:00, 09:00, 14:00, 18:00, and 21:00 h to capture temporal variation in respiratory metabolism associated with feeding and ruminal fermentation. Each animal completed an average of 35 valid measurements per dietary treatment, which exceeded the minimum number of observations recommended for obtaining representative gas-emission estimates with automated head-chamber systems [22]. Individual measurement sessions lasted approximately 3 min.
The GreenFeed unit continuously recorded gas concentrations and airflow during animal visits. Instrument performance was checked weekly throughout the experiment. A certified reference gas containing 3513 ppm CH4, 10,970 ppm CO2, and 392.8 ppm H2 was used for weekly calibration of the corresponding gas channels. Oxygen concentration was measured using the paramagnetic O2 sensor integrated into the GreenFeed unit. The O2 channel was calibrated as part of the routine GreenFeed gas calibration procedure using zero and span gases containing approximately 200,000 ppm (20.0%, v/v) and 211,000 ppm (21.1%, v/v) O2, respectively. Standard gas calibrations were performed automatically by the GreenFeed system. The air filter and sampling components were cleaned and inspected daily, while sensor checks and carbon dioxide recovery tests were conducted at weekly intervals to assess measurement stability and recovery accuracy.
Total urine was collected during the 7-day measurement phase of each experimental period. As the bulls were housed in individual pens rather than metabolism crates, urine was recovered using collection harnesses specifically fitted to each animal. The apparatus directed urine into an individual container and was inspected repeatedly during the day to maintain correct positioning and reduce losses or contamination by faecal material.
Daily urine output was measured separately for each bull. Following thorough mixing of the collected urine, a representative aliquot was retained for laboratory determination of nitrogen concentration using the Kjeldahl procedure. Daily urinary nitrogen excretion was calculated by multiplying urine volume by nitrogen concentration and is expressed in grams per day.
2.6. Energy Calculations and Estimation of Maintenance Requirements
Whole-animal heat production was derived from respiratory gas exchange and urinary nitrogen losses using the indirect calorimetry equation of Brouwer [13]. For each bull and experimental period, daily oxygen consumption, carbon dioxide and methane production, and urinary nitrogen excretion were combined as follows (Equation (1)):
where O2, CO2, and CH4 are expressed in L/d, and UN represents urinary nitrogen excretion in g/d.
Heat production and metabolizable energy intake were subsequently standardized relative to metabolic body weight and are expressed as MJ/kg BW0.75/d. The association between the two variables was evaluated after natural-log transformation of heat production. This transformation was used to represent the proportional increase in metabolic heat expenditure across the range of energy intakes and to permit extrapolation toward zero metabolizable energy intake.
The following log-linear function was fitted (Equation (2)):
where HP is the heat production, MEI is metabolizable energy intake, a is the model intercept and b is the regression slope. This Equation (2) represents the population-level HP–MEI relationship. The statistical model used to estimate its parameters accounted for the repeated measurements obtained from each bull, as described in Section 2.7.
Net energy for maintenance was represented by fasting heat production, obtained by converting the intercept from the logarithmic to the original scale (Equation (3)):
where NEm is expressed in MJ/kg BW0.75/d. This extrapolation follows the principle that heat production predicted at zero metabolizable energy intake represents the net energetic cost of maintaining essential physiological functions [4].
The metabolizable energy requirement for maintenance was identified as the intake at which energy balance was zero. Accordingly, MEm corresponded to the point at which predicted heat production equalled metabolizable energy intake. Because the fitted function was exponential after back-transformation, MEm was obtained numerically by solving (Equation (4)):
The efficiency of metabolizable energy utilization for maintenance was then calculated as (Equation (5)):
where km is dimensionless and represents the proportion of metabolizable energy available at maintenance that is converted into net energy.
2.7. Statistical Analysis
Statistical analyses were conducted in R version 4.5.2 [23]. The experimental data were analysed according to a replicated 3 × 3 Latin square design. Variables related to animal performance, feed and energy intake, respiratory gas exchange, urinary nitrogen excretion, and heat production were evaluated using linear mixed-effects models fitted with the nlme package version 3.1-170 [24].
For the analysis of these response variables across dietary energy levels, dietary treatment, experimental period, and replicate square were included as fixed effects, whereas bull nested within replicate square was treated as a random effect to account for repeated observations on the same animal. Model assumptions were assessed by examining residual distributions, residual-versus-fitted plots, and normal quantile plots. When required, treatment-specific residual variance structures were fitted using the varIdent variance function to accommodate heterogeneity of variance.
Adjusted treatment means were estimated using the emmeans package version 2.0.4 [25], and pairwise comparisons were performed with Tukey adjustment. Results are reported as estimated marginal means ± standard errors. Within each response variable, means assigned different superscript letters were considered significantly different at p ≤ 0.05.
For maintenance energy estimation, heat production and metabolizable energy intake are expressed on a metabolic body-weight basis. Heat production was natural-log transformed before regression analysis. A separate linear mixed-effects model was fitted to account for the repeated measurements used to estimate the HP–MEI relationship. MEI was included as a continuous fixed covariate, experimental period and replicate square as fixed effects, and bull nested within replicate square as a random intercept. Dietary treatment was not included in this model because the experimentally imposed feeding levels were represented by the continuous MEI variable. The analysis included 27 bull-period observations obtained from nine bulls, with three repeated observations per bull. The fitted model was:
where β0 is the population-level intercept, β1 is the regression coefficient for MEI, Pj is the fixed effect of experimental period, Sk is the fixed effect of replicate square, ui(k) is the random intercept of bull nested within replicate square, and εijkl is the residual error. Sum-to-zero contrasts were applied to experimental period and replicate square so that β0 represented the population-level intercept averaged across these effects.
The fitted relationship was evaluated from the significance of the slope, the standard errors and 95% confidence intervals of the intercept and slope, the marginal and conditional coefficients of determination and residual diagnostics. Population-level predictions were generated across the observed MEI range, with random effects set to zero and period and replicate-square effects averaged using sum-to-zero contrasts. The fitted relationship was accompanied by a pointwise 95% confidence band calculated from the standard error of the predicted mean. Net energy for maintenance was obtained by back-transforming the regression intercept, whereas metabolizable energy for maintenance was determined numerically at the point where predicted heat production equalled metabolizable energy intake. The efficiency of metabolizable energy utilization for maintenance was calculated as the ratio of net to metabolizable energy requirements. Standard errors and 95% confidence intervals for NEm, MEm, and km were obtained using a parametric bootstrap that preserved the bull-level repeated-measures structure.
3. Results
3.1. Animal Performances
No animal was excluded after enrolment. All nine bulls completed the three experimental periods. Dietary energy supplies significantly influenced body weight and related performance traits (Table 2). Mean body weight increased progressively with increasing dietary energy level, from 214.90 ± 3.71 kg at the Low energy level to 219.10 ± 4.37 kg at the Intermediate level and 224.60 ± 5.03 kg at the High level, with significant differences among all treatment means (p = 0.018). ADG increased across the graded energy-supply levels, from −0.40 ± 0.04 kg/d under the Low treatment to 0.06 ± 0.03 kg/d under the Intermediate treatment and 0.65 ± 0.01 kg/d under the High treatment, with all treatment means differing significantly (p < 0.001). Thus, bulls shifted from weight loss at the low-energy level to near-zero weight change at the intermediate-energy level and positive weight gain at the high-energy level. Metabolic body weight also increased significantly (p = 0.024) with dietary energy supply, from 56.12 ± 0.73 kg0.75 at the low energy level to 56.93 ± 0.85 kg0.75 at the intermediate energy level and 58.00 ± 0.98 kg0.75 at the high energy level.
Table 2.
Body weight, average daily gain, dry matter intake, and energy intake of Azawak bulls receiving low, intermediate, and high energy supplies (means ± SE).
Dry matter intake differed among dietary energy-supply levels (p < 0.001). Bulls consumed 2.29 ± 0.07, 3.56 ± 0.12, and 5.91 ± 0.19 kg DM/d under the low, intermediate, and high treatments, respectively. Energy intake followed the same pattern. Gross energy intake increased from 39.09 ± 1.22 MJ/d at the low energy level to 60.74 ± 1.97 MJ/d at the intermediate energy level and 101.02 ± 3.21 MJ/d at the high energy level (p < 0.001). Likewise, metabolizable energy intake increased progressively across feeding levels, from 17.99 ± 0.56 MJ/d under the low treatment to 27.95 ± 0.91 MJ/d under the intermediate treatment and 46.49 ± 1.48 MJ/d under the high treatment (p < 0.001). After adjustment for metabolic body weight, MEI remained significantly different (p < 0.001) among treatments, increasing from 0.32 ± 0.006 MJ/kg BW0.75/d at the low energy level to 0.49 ± 0.009 MJ/kg BW0.75/d at the intermediate energy level and 0.80 ± 0.012 MJ/kg BW0.75/d at the high energy level.
3.2. Respiratory Gases, Urinary Nitrogen, and Heat Production
Respiratory metabolism was strongly influenced by dietary energy allowance (Table 3). Carbon dioxide production increased progressively across treatments, from 990 ± 14.30 L/d at the low energy level to 1135 ± 20.59 L/d at the intermediate energy level and 1475 ± 30.03 L/d at the high energy level. Oxygen consumption differed among treatments (p < 0.001), with values of 1181.56 ± 22.98, 1416.96 ± 34.12, and 1938.80 ± 57.61 L/d under the low, intermediate, and high treatments, respectively.
Table 3.
Effects of graded metabolizable energy supply on respiratory gas exchange, urinary nitrogen excretion, and heat production in growing Azawak bulls evaluated in a replicated 3 × 3 Latin-square design (mean ± SE).
In contrast, the respiratory quotient declined as energy intake increased. Values decreased from 0.84 ± 0.007 at the low energy level to 0.80 ± 0.008 at the intermediate energy level and 0.76 ± 0.01 at the high energy level, with significant differences (p = 0.002) among all treatments. The quotient remained below unity throughout the experiment, indicating that oxygen consumption consistently exceeded carbon dioxide production.
Methane production also increased with feeding level. Bulls fed at the low energy level emitted 45 ± 1.06 L CH4/d, compared with 75 ± 1.97 L/d at the intermediate energy level and 115 ± 3.03 L/d at the high energy level. This progressive increase resulted in complete statistical separation among the three treatments (p < 0.001). Urinary nitrogen excretion showed a similar pattern (p < 0.001), increasing from 7.50 ± 0.24 g/d at the low energy level to 10 ± 0.36 g/d at the intermediate energy level and 12.50 ± 0.48 g/d at the high energy level.
Total heat production rose significantly (p < 0.001) with dietary energy supply, from 24.07 ± 0.44 MJ/d at the low energy level to 28.54 ± 0.65 MJ/d at the intermediate energy level and 38.63 ± 1.07 MJ/d at the high energy level. The same response remained evident after adjustment for metabolic body weight, with adjusted heat production increasing from 0.43 ± 0.002 MJ/kg BW0.75/d at the low energy level to 0.50 ± 0.004 MJ/kg BW0.75/d at the intermediate energy level and 0.67 ± 0.007 MJ/kg BW0.75/d at the high energy level (p < 0.001). Collectively, these results indicate that increasing dietary energy allowance enhanced respiratory gas exchange, methane release, nitrogen excretion, and metabolic heat production, while reducing the respiratory quotient.
3.3. Maintenance Energy Requirements
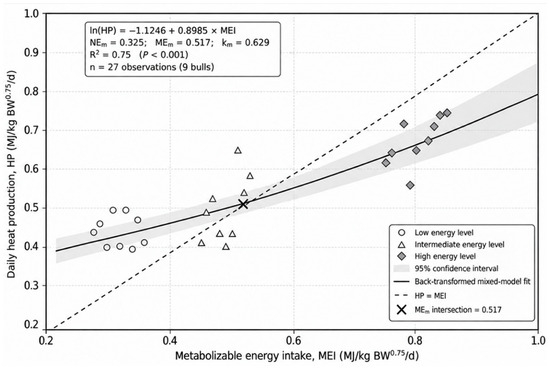
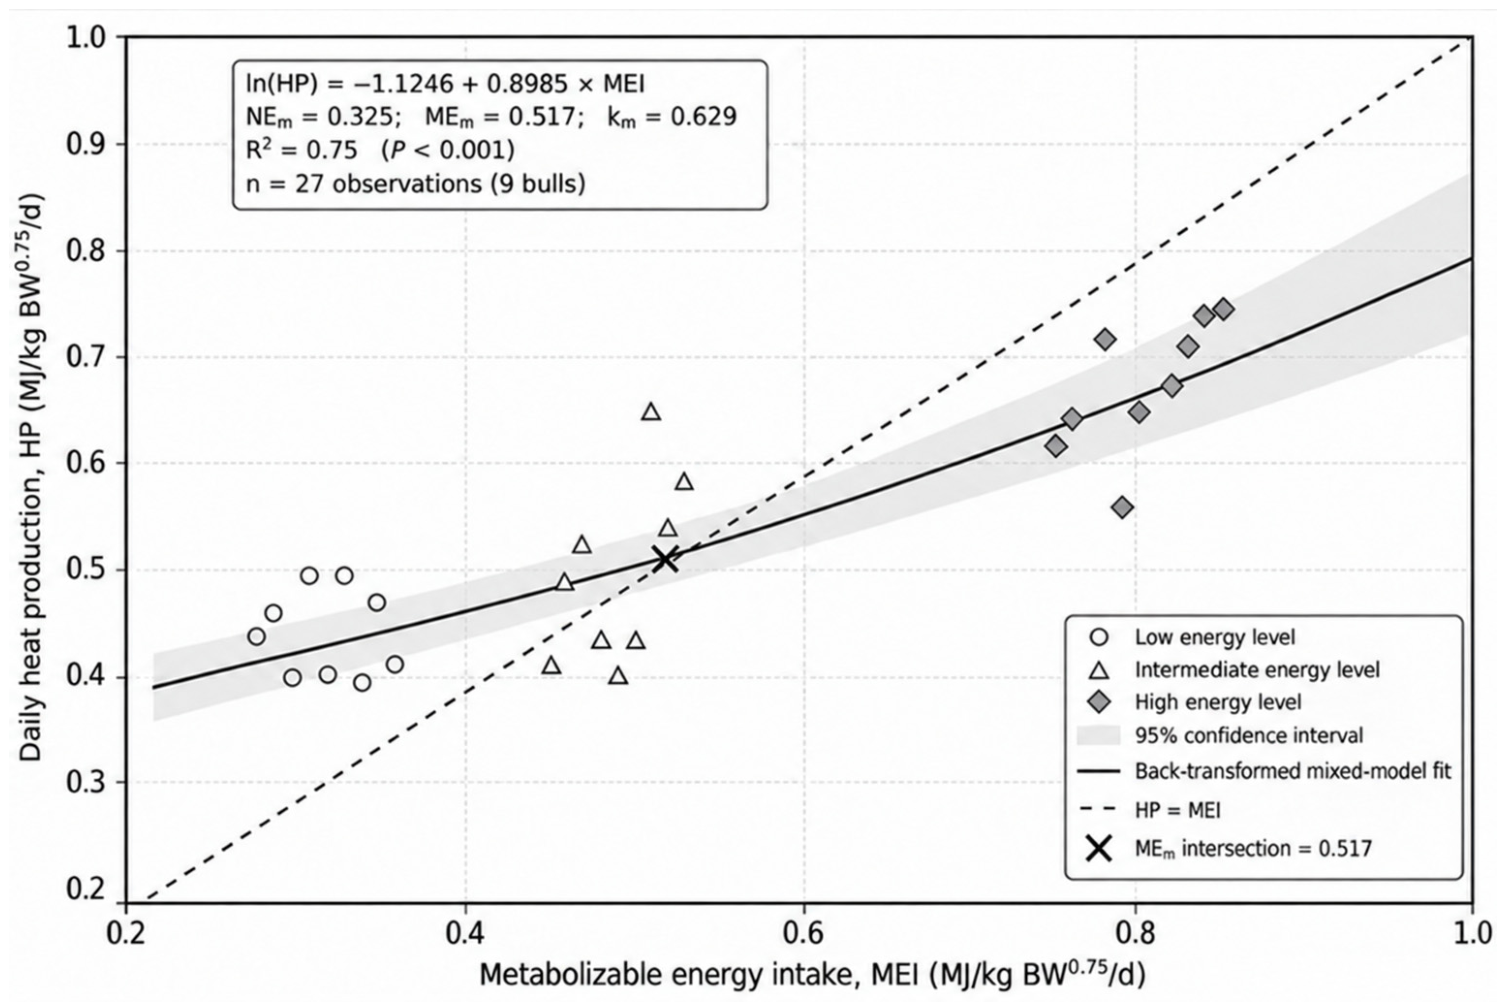
Heat production increased with metabolizable energy intake across the three dietary energy levels (Figure 2). After accounting for repeated measurements within bulls, the population-level intercept was −1.1246 ± 0.0536 (95% CI: −1.2297 to −1.0195), whereas the MEI slope was 0.8985 ± 0.0850 (95% CI: 0.7320 to 1.0651; p < 0.001; Table 4). The resulting population-level relationship was: ln(HP) = −1.1246 + 0.8985 × MEI.
Figure 2.
Relationship between heat production and metabolizable energy intake for estimating maintenance energy requirements in Azawak bulls. Points represent 27 bull-period observations from nine bulls. The solid curve represents the population-level prediction from a linear mixed-effects model including MEI as a continuous fixed effect and bull as a random intercept to account for repeated measurements. The shaded area represents the 95% confidence interval. The dashed line represents HP = MEI, and its first positive intersection with the fitted curve identifies MEm.
Table 4.
Mixed-effects model estimates of the heat production–metabolizable energy intake relationship and derived maintenance energy requirements in Azawak bulls.
After back-transformation, the fitted relationship was expressed as: HP = exp (−1.1246 + 0.8985 × MEI). The back-transformed intercept yielded an NEm of 0.325 ± 0.017 MJ/kg BW0.75/d (95% CI: 0.292–0.361). The first positive intersection between the predicted HP curve and the line HP = MEI occurred at an MEm of 0.517 ± 0.028 MJ/kg BW0.75/d (95% CI: 0.467–0.576). The resulting km was 0.629 ± 0.031 (95% CI: 0.566–0.688), indicating that approximately 62.9% of metabolizable energy supplied at maintenance was available to meet net maintenance requirements.
4. Discussion
4.1. Animal Performance
The progressive increases in dry matter intake, gross energy intake and metabolizable energy intake confirmed that the feeding protocol established three clearly differentiated nutritional conditions in Azawak bulls. As the same forage-based ration was used across treatments, these differences resulted from the quantities supplied rather than from changes in dietary composition. The preservation of this treatment gradient after MEI was expressed relative to metabolic body weight indicates that variation in energy intake could not be explained solely by differences in animal size. Similar experimental approaches based on graded allowances of a common diet have been used to generate contrasting energy balances for estimating maintenance requirements in cattle [26].
The increase in DMI from low to intermediate and high energy levels should be interpreted primarily as a consequence of the controlled feed allocation. It does not necessarily indicate that the higher energy supply stimulated voluntary appetite, because the quantities offered were predetermined according to treatment. Nevertheless, the resulting rise in GEI and MEI demonstrates that the bulls consumed sufficient additional feed to achieve the intended energy contrast. Hales et al. [27] similarly emphasized that ME intake in growing and finishing cattle is strongly influenced by both feed intake and dietary energy availability, while Kongphitee et al. [28] observed coordinated increases in feed intake and energy supply in native cattle offered nutritionally improved diets.
The ADG recorded under the High energy level in the present study was 0.65 kg/d, compared with overall values of 0.82–1.07 kg/d reported for Black Angus steers by Chen et al. [29] and 1.04–1.23 kg/d reported for fattening steers by Gado et al. [30]. These differences may reflect variation in breed, initial body weight, diet composition, energy density, and experimental duration. These comparisons support the biological direction of the response observed in Azawak bulls. However, body-weight responses should be interpreted cautiously because the experimental periods were short and designed primarily for calorimetric measurements; consequently, short-term changes in gut fill and hydration may have contributed to the observed differences, and the recorded gains should not be interpreted as direct measurements of long-term tissue deposition.
Despite the marked increase in MEI between intermediate and high energy levels, the corresponding difference in weight change was relatively limited. This lack of proportionality suggests that only part of the additional dietary energy was retained as body mass. The remainder was likely associated with greater energetic costs of ingestion, digestion, ruminal fermentation and intermediary metabolism. Andreini et al. [31] showed that changes in feeding level alter energy utilization and feed efficiency in beef steers, whereas Freetly et al. [32] demonstrated that metabolizable energy intake reflects both heat production and recovered body energy. These findings are consistent with the present observation that increased energy intake did not translate directly into an equivalent increase in live-weight gain.
The significant differences in mean BW and BW0.75 should, however, be interpreted conservatively. During short feeding periods, live weight is sensitive to gastrointestinal fill and body-water fluctuations, particularly when animals consume different amounts of a high-fibre ration. Woods et al. [33] observed that feeding level affected growth and energy utilization in cattle and sheep, while studies of restricted and unrestricted feeding have shown that short-term weight changes may include changes in digesta mass in addition to tissue accretion. Consequently, the larger weights observed under the supra-maintenance treatments probably represented a combination of modest energy retention and greater gastrointestinal contents rather than exclusively new tissue deposition.
The response of the Azawak bulls was more pronounced than that previously observed in Borgou bulls under a related experimental framework. Assani et al. [12] found that supra-maintenance feeding increased body-weight change in Borgou bulls, but mean BW and metabolic BW remained statistically comparable among treatments. In contrast, all three weight-related variables differed in the present Azawak experiment. This divergence may be associated with differences in initial live weight, age, achieved MEI, ration intake and short-term gut-fill responses, and should not be interpreted as a direct breed effect without a contemporaneous comparison under identical conditions.
Taken together, the intake data confirm that the experimental treatments successfully produced a broad and ordered range of energy supply. The modest but significant changes in live weight indicate the onset of positive energy retention above maintenance, whereas the much larger separation in adjusted MEI provides the stronger basis for modelling the relationship between energy intake and heat production. Thus, body-weight change should be considered a complementary performance response, rather than the principal criterion for evaluating the adequacy of the energy gradient in this short-term calorimetric experiment.
4.2. Respiratory Gas Exchange, Urinary Nitrogen Excretion and Heat Production
The graded energy allowances produced a clear and coordinated change in respiratory metabolism. Oxygen consumption and carbon dioxide production increased progressively from low to intermediate and high energy levels, indicating greater oxidative activity as metabolizable energy intake rose. This response is physiologically consistent with the higher amount of nutrients subjected to ruminal fermentation, absorption and intermediary metabolism at the greater feed allowances. Proctor et al. [15] similarly showed that automated head-chamber measurements of O2 and CO2 are responsive to changes in dietary energy use and can be integrated to characterize whole-animal heat production in beef cattle.
The respiratory quotient (RQ) declined across treatments, remaining below unity at all feeding levels. Because RQ is calculated as the ratio of CO2 production to O2 consumption, the observed decrease indicates that O2 consumption increased proportionally more than CO2 output. Morris et al. [34] noted that the respiratory quotient in cattle varies with diet, feeding level and the relative contribution of oxidized substrates. In the present study, the lower RQ at a high energy level may therefore reflect a shift in whole-body substrate oxidation as nutrient supply increased. However, this interpretation should remain cautious because the values were derived from repeated GreenFeed measurements rather than continuous respiration-chamber records.
Daily methane production increased with feed allowance. Since all bulls received the same forage-based diet and treatments differed mainly in the amount offered, the rise in CH4 output was most plausibly driven by the greater quantity of fermentable substrate entering the rumen. Hales et al. [27] identified dry matter intake as a major determinant of daily enteric methane production in growing and finishing cattle, while Herd et al. [35] also reported a strong positive relationship between intake and methane output. The present results are therefore consistent with an intake-mediated increase in ruminal fermentation rather than with a change in the intrinsic methanogenic characteristics of the diet.
Urinary nitrogen excretion was higher at the intermediate and high energy-supply levels than at the low level. Because diet composition was constant, higher feed intake necessarily increased daily nitrogen intake. Once microbial and tissue requirements were met, part of the additional absorbed nitrogen was likely deaminated and eliminated in urine. Jardstedt et al. [36] showed that nitrogen intake is one of the strongest predictors of urinary nitrogen losses in cattle. The modest increase in body-weight change relative to the large rise in feed intake suggests that nitrogen retention did not increase proportionally, particularly at a high energy level. This may indicate a decline in the marginal efficiency of nitrogen use when nutrient supply exceeded short-term anabolic demand.
Heat production increased substantially in both absolute terms and after adjustment for metabolic body weight. The persistence of the treatment effect after standardization to BW0.75 confirms that the response was not simply due to differences in body size. Rather, it reflects the additional energetic costs associated with consuming, fermenting, absorbing and metabolizing a larger quantity of feed. Reed et al. [37] demonstrated that excess nutrient supply can increase heat production through greater metabolic processing and nitrogen disposal, while Proctor et al. [15] showed that respiratory gas fluxes measured with automated systems capture diet-induced changes in whole-animal energy expenditure.
Ambient conditions may also influence heat production independently of dietary energy intake. Within the thermoneutral zone, metabolic heat production remains relatively stable, whereas exposure above the upper critical temperature increases the physiological effort required for heat dissipation. High relative humidity may further reduce evaporative cooling efficiency and increase thermoregulatory energy expenditure [38]. Because ambient temperature and relative humidity were not recorded, it was not possible to determine whether the bulls remained within their thermoneutral zone or to distinguish potential thermal effects from those of dietary energy supply.
The concurrent increases in urinary nitrogen and heat production provide further evidence that not all additional metabolizable energy was retained as body tissue. A greater proportion of the extra energy supplied at supra-maintenance intake was likely dissipated through the heat increment of feeding and the metabolic costs of nutrient turnover. This interpretation is consistent with the relatively small increase in body-weight change between intermediate and high energy levels, despite the much larger increase in metabolizable energy intake.
Taken together, the respiratory, excretory and calorimetric responses indicate that increasing feed allowance intensified ruminal fermentation, oxidative metabolism and nutrient turnover in Azawak bulls. The rise in methane production was primarily associated with greater substrate intake, whereas the increases in urinary nitrogen and adjusted heat production show that supra-maintenance feeding also increased metabolic losses. These coordinated responses provide the physiological basis for the observed relationship between metabolizable energy intake and heat production and confirm that the experimental treatments generated a sufficiently broad metabolic gradient for estimating maintenance energy requirements.
4.3. Maintenance Energy Requirements
The positive relationship between metabolizable energy intake and heat production provided a robust basis for estimating maintenance energy requirements in Azawak bulls. The log-linear model explained 75% of the variation in heat production, showing that dietary energy supply accounted for a substantial proportion of the observed metabolic response. After back-transformation, the model yielded estimates of 0.325 MJ/kg BW0.75/d for NEm, 0.517 MJ/kg BW0.75/d for MEm, and 0.629 for km.
The NEm estimated for Azawak bulls was close to the conventional value of approximately 0.322 MJ/kg BW0.75/d commonly applied to beef cattle. It was also slightly higher than the 0.300 MJ/kg BW0.75/d reported by Assani et al. [12] for growing Borgou bulls under tropical conditions. Although the difference between the two West African breeds was modest, it may indicate a slightly greater basal energy expenditure in Azawak bulls. Variations in mature size, growth potential, body composition and metabolically active organ mass may contribute to differences in maintenance requirements among cattle populations.
The present estimate was also consistent with values reported for several Bos indicus and tropically adapted cattle populations. Silva et al. [39] estimated an NEm of approximately 0.320 MJ/kg BW0.75/d in Nellore bulls, which closely agrees with the value obtained for Azawak bulls. Tedeschi et al. [40] reported a somewhat higher estimate of approximately 0.340 MJ/kg BW0.75/d in Nellore steers fed forage-based diets, whereas Goulart et al. [41] obtained approximately 0.363 MJ/kg BW0.75/d in Nellore and Nellore-crossbred steers. The lower requirement observed in Azawak bulls relative to the latter estimates may reflect differences in genotype, physiological maturity, body composition and production level. Nevertheless, comparisons should account for the distinction between requirements expressed relative to live BW and those based on empty BW.
The MEm estimate of 0.517 MJ/kg BW0.75/d was approximately 6.2% higher than the value of 0.487 MJ/kg BW0.75/d reported for Borgou bulls by Assani et al. [12]. This relatively small difference is consistent with the corresponding difference in NEm and suggests that Azawak bulls required slightly more metabolizable energy to support basal functions under the conditions of the present experiment. The value obtained was also close to the estimate of approximately 0.476 MJ/kg BW0.75/d reported by Silva et al. [39] for Nellore bulls, but lower than the 0.575 MJ/kg BW0.75/d reported by Goulart et al. [41]. These comparisons place the Azawak estimate within the range reported for tropical beef cattle, while emphasizing the variation associated with breed, diet and experimental methodology.
Tangjitwattanachai et al. [42] estimated an MEm of 0.520 MJ/kg BW0.75/d in Thai native cattle using indirect calorimetry and graded metabolizable energy intakes. This value is remarkably close to the 0.517 MJ/kg BW0.75/d obtained for Azawak bulls in the present study. The agreement between these estimates supports the biological plausibility of the maintenance requirement determined for Azawak cattle, despite differences in breed and production environment. Both populations consist of indigenous cattle adapted to tropical conditions, where prolonged exposure to heat and seasonal variation in feed availability may influence energy metabolism. The small numerical difference between the two estimates may be related to differences in animal age, body composition, diet characteristics and experimental conditions.
The estimated km of 0.629 indicates that approximately 63% of metabolizable energy supplied at maintenance was available to meet net maintenance functions. This value was close to the 0.616 obtained in Borgou bulls by Assani et al. [12], suggesting broadly comparable efficiencies of maintenance energy utilization in the two West African breeds. It also closely matched the value of 0.632 reported by Goulart et al. [41] for Nellore and Nellore-crossbred steers, but was lower than the values of approximately 0.67 reported by Paulino et al. [43].
The moderate efficiency observed in Azawak bulls is compatible with the forage-based ration used in this study. Diets rich in structural carbohydrates generally incur greater energetic losses through ruminal fermentation and a higher heat increment than more digestible diets. Variability in km among studies may therefore arise from differences in dietary metabolizability, fermentation pattern, feeding level and genotype. Cabezas-Garcia et al. [1] similarly emphasized that both maintenance expenditure and the efficiency of ME utilization are influenced by animal and dietary factors. In the present study, the concurrent increases in heat production and urinary nitrogen excretion with feeding level further indicate that part of the additional nutrient supply was dissipated through metabolic processing rather than retained.
Overall, the estimates obtained for Azawak bulls were biologically consistent with those reported for other tropical and indicine cattle. Their close agreement with the values reported by Assani et al. [12] for Borgou bulls suggests that both breeds have broadly similar efficiencies of ME utilization for maintenance, although Azawak bulls exhibited slightly higher NEm and MEm. These breed-specific coefficients provide a more relevant basis for defining maintenance allowances and improving ration formulation for Azawak cattle raised under tropical feeding conditions.
4.4. Study Limitations
The maintenance-energy estimates should be interpreted in light of several methodological constraints. The observed energy gradient comprised a sub-maintenance level, a level close to maintenance, and a supra-maintenance level, corresponding to approximately 0.62, 0.95, and 1.55 × the estimated MEm, respectively. Although this range allowed the HP–MEI relationship to be characterized on both sides of maintenance, it was based on only three unequally spaced energy levels. Moreover, NEm was estimated by extrapolating the fitted relationship to zero MEI rather than being measured directly under fasting conditions. Consequently, the resulting NEm, MEm, and km values remain model-derived and may be sensitive to the number, spacing, and distribution of the observed energy-intake levels.
The study involved nine bulls measured repeatedly across three periods. Although this design improved control of animal variability, the limited number of independent animals restricts the precision of population-level inference and the characterization of between-animal differences in maintenance expenditure. In addition, each experimental period lasted only 21 days, including 14 days of adaptation and 7 days of measurement. Although this duration was adequate for short-term calorimetric measurements, it was insufficient for a robust assessment of ADG or sustained tissue accretion. Therefore, the observed ADG values may partly reflect short-term changes in gastrointestinal fill and hydration and should not be interpreted as long-term growth responses.
Beyond these design-related constraints, gas exchange was estimated from repeated GreenFeed measurements rather than continuous respiration-chamber monitoring. As shown by Proctor et al. [15], the accuracy of automated head-chamber estimates depends on the number and temporal distribution of valid visits. Uneven sampling across the day may therefore have contributed to residual variation in heat-production estimates. In addition, ambient temperature and relative humidity were not recorded during the experimental periods. Therefore, their potential effects on heat production could not be quantified. This limitation is particularly relevant because the bulls were housed in a naturally ventilated barn under tropical conditions, where variations in the thermal environment may influence maintenance energy expenditure.
The energy gradient was generated by varying the amount of a common forage-based ration, which reduced confounding from diet composition. However, the large difference in intake among treatments may have modified the heat increment of feeding, visceral metabolic activity, and gastrointestinal fill. Because energy variables were expressed relative to live BW0.75, rather than empty body weight, variation in gut contents may also have affected treatment comparisons.
These estimates are therefore most applicable to growing Azawak bulls managed under conditions similar to those tested. Greater precision would require larger animal numbers, longer experimental periods, a wider and more evenly distributed range of energy intakes, and more continuous respiratory measurements.
5. Conclusions
This study provides breed-specific estimates of net and metabolizable energy requirements for maintenance and the efficiency of metabolizable energy utilization in growing Azawak bulls. The graded energy supply produced consistent changes in respiratory gas exchange and heat production, enabling characterization of the HP–MEI relationship under tropical feeding conditions. The resulting coefficients improve current knowledge of energy metabolism in this indigenous breed and may support more accurate maintenance allowances and ration formulation. Their application should nevertheless remain restricted to animals and production conditions comparable to those evaluated in the present study.
Author Contributions
Conceptualization, A.S.A., Y.I. and M.J.H.; methodology, A.S.A., Y.I. and H.S.W.; software, A.S.A. and Y.I.; validation, A.S.A., Y.I. and I.A.T.; formal analysis, A.S.A. and Y.I.; investigation, A.S.A., Y.I., M.J.H. and H.S.W.; resources, A.S.A. and I.A.T.; data curation, A.S.A., Y.I. and M.J.H.; writing—original draft preparation, A.S.A.; writing—review and editing, Y.I., M.J.H., H.S.W. and I.A.T.; visualization, A.S.A.; supervision, Y.I. and I.A.T.; project administration, A.S.A.; funding acquisition, A.S.A. All authors have read and agreed to the published version of the manuscript.
Funding
The authors declare that financial support was received for the research, authorship, and/or publication of this article. This document has been produced with the financial assistance of the European Union (grant no. DCI-PANAF/2020/420-028), through the African Research Initiative for Scientific Excellence (ARISE) pilot programme. ARISE is implemented by the African Academy of Sciences with the support of the European Commission and the African Union Commission. The contents of this document are the sole responsibility of the authors and can in no way be considered to reflect the position of the European Union, the African Academy of Sciences, and the African Union Commission.
Institutional Review Board Statement
The animal study protocol was approved by the Ethics Committee of the University of Parakou (protocol code No. 113, approved on 3 April 2023).
Informed Consent Statement
Not applicable.
Data Availability Statement
The original contributions presented in this study are included in the article. Further inquiries can be directed to the corresponding author.
Acknowledgments
The authors gratefully acknowledge the staff of the Okpara Livestock Farm, Directorate of Livestock, Ministry of Agriculture, Livestock and Fisheries, Benin, for their valuable technical assistance with animal management, data collection, and the implementation of the experimental procedures.
Conflicts of Interest
The authors declare no conflicts of interest.
References
- Cabezas-Garcia, E.H.; Lowe, D.; Lively, F. Energy requirements of beef cattle: Current energy systems and factors influencing energy requirements for maintenance. Animals 2021, 11, 1642. [Google Scholar] [CrossRef] [Scilit]
- National Academies of Sciences, Engineering, and Medicine. Nutrient Requirements of Beef Cattle, 8th ed.; The National Academies Press: Washington, DC, USA, 2016. [Google Scholar]
- Tedeschi, L.O. Harnessing extant energy and protein requirement modeling for sustainable beef production. Animal 2023, 17, 100835. [Google Scholar] [CrossRef] [Scilit]
- Lofgreen, G.P.; Garrett, W.N. A system for expressing net energy requirements and feed values for growing and finishing beef cattle. J. Anim. Sci. 1968, 27, 793–806. [Google Scholar] [CrossRef] [Scilit]
- Ouédraogo, D.; Soudré, A.; Yougbaré, B.; Ouédraogo-Koné, S.; Zoma-Traoré, B.; Khayatzadeh, N.; Traoré, A.; Sanou, M.; Mészáros, G.; Burger, P.A.; et al. Genetic Improvement of Local Cattle Breeds in West Africa: A Review of Breeding Programs. Sustainability 2021, 13, 2125. [Google Scholar] [CrossRef] [Scilit]
- Sainz, R.D.; Cruz, G.D.; Mendes, E.; Magnabosco, C.U.; Farjalla, Y.B.; Araujo, F.R.C.; Gomes, R.C.; Leme, P.R. Performance, efficiency and estimated maintenance energy requirements of Bos taurus and Bos indicus cattle. In Energy and Protein Metabolism and Nutrition in Sustainable Animal Production; Oltjen, J.W., Kebreab, E., Lapierre, H., Eds.; Wageningen Academic Publishers: Wageningen, The Netherlands, 2013; pp. 69–70. [Google Scholar] [CrossRef] [Scilit]
- Chizzotti, M.L.; Valadares Filho, S.C.; Del Bianco Benedeti, P.; Silva, F.A.S. California net energy system for Bos taurus indicus. Transl. Anim. Sci. 2019, 3, 991–998. [Google Scholar] [CrossRef] [Scilit]
- Cooke, R.F.; Daigle, C.L.; Moriel, P.; Smith, S.B.; Tedeschi, L.O.; Vendramini, J.M. Cattle adapted to tropical and subtropical environments: Social, nutritional, and carcass quality considerations. J. Anim. Sci. 2020, 98, skaa014. [Google Scholar] [CrossRef] [Scilit]
- Belemsaga, D.; Lombo, Y.; Thevenon, S.; Sylla, S. Inventory analysis of West African cattle breeds. In Applications of Gene-Based Technologies for Improving Animal Production and Health in Developing Countries; Makkar, H.P.S., Viljoen, G.J., Eds.; Springer: Dordrecht, The Netherlands, 2005; pp. 167–173. [Google Scholar] [CrossRef] [Scilit]
- Camara, Y.; Moula, N.; Sow, F.; Sissokho, M.M.; Antoine-Moussiaux, N. Analysing innovations among cattle smallholders to evaluate the adequacy of breeding programs. Animal 2019, 13, 417–426. [Google Scholar] [CrossRef] [Scilit]
- Ibrahim, A.K.; Moumouni, I.; Mogueza, C. Genetic profile of milk production traits and analysis of correlations with reproductive performance in the Azawak Zebu in Niger. Vet. Anim. Sci. 2024, 25, 100365. [Google Scholar] [CrossRef] [Scilit]
- Assani, A.S.; Idrissou, Y.; Alkoiret Traoré, I.; Houngbedji, M.J.; Naitchede, H.; Sanni Worogo, S.H.; Alabi, C.D.; Dossa, A.K.; Alimi, N.; Imorou, H.S.; et al. Estimating maintenance energy requirements of Borgou cattle to improve feeding precision under tropical conditions. Front. Anim. Sci. 2026, 7, 1823228. [Google Scholar] [CrossRef] [Scilit]
- Brouwer, E. Report of sub-committee on constants and factors. In Energy Metabolism: Proceedings of the 3rd Symposium; Academic Press: London, UK, 1965. [Google Scholar]
- Hristov, A.N.; Oh, J.; Giallongo, F.; Frederick, T.; Harper, M.T.; Weeks, H.; Branco, A.F.; Price, W.J.; Moate, P.J.; Deighton, M.H.; et al. Comparison of the GreenFeed system with the sulfur hexafluoride tracer technique for measuring enteric methane emissions from dairy cows. J. Dairy Sci. 2016, 99, 5461–5465. [Google Scholar] [CrossRef] [Scilit]
- Proctor, J.A.; Smith, J.K.; Long, N.S.; Gunter, S.A.; Gouvêa, V.N.; Beck, M.R. Utilizing gas flux from automated head chamber systems to estimate dietary energy values for beef cattle fed a finishing diet. J. Anim. Sci. 2024, 102, skae167. [Google Scholar] [CrossRef] [Scilit]
- Kebreab, E.; Dijkstra, J.; Bannink, A.; France, J. Recent advances in modeling nutrient utilization in ruminants. J. Anim. Sci. 2009, 87, E111–E122. [Google Scholar] [CrossRef] [Scilit]
- Guidimè, S.L.; Odo, B.P.; Djenontin, A.J.; Yacoubou, A.M.; Worogo, S.H.S.; Idrissou, Y. Évaluation de la complémentation au Vitanimal sur les performances laitières de vaches Borgou au Bénin. Rev. Marocaine Sci. Agron. Vét. 2023, 11, 465–473. [Google Scholar] [CrossRef]
- Kassa, S.K.; Ahounou, G.S.; Dayo, G.K.; Salifou, C.F.A.; Dotché, O.I.; Issifou, T.M.; Gandonou, P.; Kountinhouin, G.B.; Mensah, G.A.; Yapi-Gnaoré, V.; et al. Évaluation et modélisation de la production de lait des vaches Girolando, Borgou, Lagunaire et croisées Azawak × Lagunaire, élevées dans le système semiamélioré au Bénin. J. Appl. Biosci. 2016, 103, 9829–9840. [Google Scholar]
- AOAC. AOAC Guidelines for Single Laboratory Validation of Chemical Methods for Dietary Supplements and Botanicals; Association of Official Analytical Chemists: Gaithersburg, MD, USA, 2019; pp. 5–13. [Google Scholar]
- Van Soest, P.J.; Robertson, J.B.; Lewis, B.A. Methods for dietary fiber, neutral detergent fiber, and nonstarch polysaccharides in relation to animal nutrition. J. Dairy Sci. 1991, 74, 3583–3597. [Google Scholar] [CrossRef] [Scilit]
- Baumont, R.; Dulphy, J.P.; Sauvant, D.; Meschy, F.; Aufrère, J.; Peyraud, J.-L. Valeur alimentaire des fourrages et des matières premières: Tables et prévision. In Alimentation des Bovins, Ovins et Caprins: Besoins des Animaux—Valeurs des Aliments; Editions Quae: Versailles, France, 2007; p. 179. [Google Scholar]
- Manafiazar, G.; Zimmerman, S.; Basarab, J.A. Repeatability and variability of short-term spot measurement of methane and carbon dioxide emissions from beef cattle using GreenFeed Emissions Monitoring System. Can. J. Anim. Sci. 2017, 97, 118–126. [Google Scholar] [CrossRef] [Scilit]
- R Core Team. R: A Language and Environment for Statistical Computing; R Foundation for Statistical Computing: Vienna, Austria, 2025; Available online: https://www.R-project.org/ (accessed on 20 August 2026).
- Pinheiro, J.; Bates, D.; DebRoy, S.; Sarkar, D.; Heisterkamp, S.; Van Willigen, B.; Ranke, J. nlme: Linear and Nonlinear Mixed Effects Models, R Package Version 3.1-170. 2016. Available online: https://CRAN.R-project.org/package=nlme (accessed on 20 August 2026).
- Lenth, R.V.; Piaskowski, J.; Banfai, B.; Bolker, B.; Buerkner, P.; Giné-Vázquez, I.; Hervé, M.; Jung, M.; Love, J.; Miguez, F.; et al. emmeans: Estimated Marginal Means, aka Least-Squares Means, R Package Version 2.0.4. 2026. Available online: https://CRAN.R-project.org/package=emmeans (accessed on 20 August 2026).
- Canterbury, L.G.; Galyean, M.L.; Dornbach, C.W.; Childress, K.D.; Thompson-Smith, A.C.; Baker, M.; Sitka, B.; Loeffler, T.; Grant, M.S.; Sanchez, N.C.B.; et al. 404 Energy balance and net energy for maintenance of beef × dairy crossbred steers. J. Anim. Sci. 2025, 103, 299–300. [Google Scholar] [CrossRef] [Scilit]
- Hales, K.E.; Coppin, C.A.; Smith, Z.K.; McDaniel, Z.S.; Tedeschi, L.O.; Cole, N.A.; Galyean, M.L. Predicting metabolizable energy from digestible energy for growing and finishing beef cattle and relationships to the prediction of methane. J. Anim. Sci. 2022, 100, skac013. [Google Scholar] [CrossRef] [Scilit]
- Kongphitee, K.; Sommart, K.; Phonbumrung, T.; Gunha, T.; Suzuki, T. Feed intake, digestibility and energy partitioning in beef cattle fed diets with cassava pulp instead of rice straw. Asian-Australas. J. Anim. Sci. 2018, 31, 1431–1441. [Google Scholar] [CrossRef] [Scilit]
- Chen, K.; Shui, Y.; Deng, M.; Guo, Y.; Sun, B.; Liu, G.; Liu, D.; Li, Y. Effects of different dietary energy levels on growth performance, meat quality and nutritional composition, rumen fermentation parameters, and rumen microbiota of fattening Angus steers. Front. Microbiol. 2024, 15, 1378073. [Google Scholar] [CrossRef] [Scilit]
- Gado, H.M.; Ahmed, D.A.; Elghandour, M.M.M.Y.; De Palo, P.; D’Alessandro, A.G.; Salem, A.Z.M. Impact of increasing dietary energy on fattening steers growth performance, feed efficiency, and metabolic traits. Trop. Anim. Health Prod. 2025, 57, 345. [Google Scholar] [CrossRef] [Scilit]
- Andreini, E.M.; Augenstein, S.M.; Fales, C.S.; Sainz, R.D.; Oltjen, J.W. Effects of feeding level on efficiency of high- and low-residual feed intake beef steers. J. Anim. Sci. 2020, 98, skaa286. [Google Scholar] [CrossRef] [Scilit]
- Freetly, H.C.; Jacobs, D.R.; Thallman, R.M.; Snelling, W.M.; Kuehn, L.A. Heritability of beef cow metabolizable energy for maintenance. J. Anim. Sci. 2023, 101, skad145. [Google Scholar] [CrossRef] [Scilit]
- Woods, V.B.; Moloney, A.P.; O’Mara, F.P.; Mulligan, F.; Kenny, M.J. The effect of animal species and level of consumption by cattle on in vivo digestibility of concentrate ingredients. In Proceedings of the British Society of Animal Science; Cambridge University Press: Cambridge, UK, 1998; p. 77. [Google Scholar] [CrossRef] [Scilit]
- Morris, D.L.; Brown-Brandl, T.M.; Miller, P.S.; Weiss, W.P.; White, R.R.; Kononoff, P.J. Factors that affect heat production in lactating Jersey cows. J. Dairy Sci. 2021, 104, 346–356. [Google Scholar] [CrossRef] [Scilit]
- Herd, R.M.; Arthur, P.F.; Donoghue, K.A.; Bird, S.H.; Bird-Gardiner, T.; Hegarty, R.S. Measures of methane production and their phenotypic relationships with dry matter intake, growth, and body composition traits in beef cattle. J. Anim. Sci. 2014, 92, 5267–5274. [Google Scholar] [CrossRef] [Scilit]
- Jardstedt, M.; Hessle, A.; Nørgaard, P.; Richardt, W.; Nadeau, E. Feed intake and urinary excretion of nitrogen and purine derivatives in pregnant suckler cows fed alternative roughage-based diets. Livest. Sci. 2017, 202, 82–88. [Google Scholar] [CrossRef] [Scilit]
- Reed, K.F.; Bonfá, H.C.; Dijkstra, J.; Casper, D.P.; Kebreab, E. Estimating the energetic cost of feeding excess dietary nitrogen to dairy cows. J. Dairy Sci. 2017, 100, 7116–7126. [Google Scholar] [CrossRef] [Scilit]
- Silanikove, N. Effects of heat stress on the welfare of extensively managed domestic ruminants. Livest. Prod. Sci. 2000, 67, 1–18. [Google Scholar] [CrossRef] [Scilit]
- Silva, L.F.C.; Valadares Filho, S.C.; Zanetti, D.; Rotta, P.P.; Marcondes, M.I.; Prados, L.F.; Paulino, M.F.; Azevedo, H.O. Energy and protein nutritional requirements for Nellore bulls. Rev. Bras. Zootec. 2012, 41, 1516–1524. [Google Scholar] [CrossRef] [Scilit][Green Version]
- Tedeschi, L.O.; Boin, C.; Fox, D.G.; Leme, P.R.; Alleoni, G.F.; Lanna, D.P.D. Energy requirement for maintenance and growth of Nellore bulls and steers fed high-forage diets. J. Anim. Sci. 2002, 80, 1671–1682. [Google Scholar] [CrossRef] [Scilit]
- Goulart, R.S.; Tedeschi, L.O.; Silva, S.L.; Leme, P.R.; de Alencar, M.M.; Lanna, D.P. The energy requirement for maintenance of Nellore crossbreds in tropical conditions during the finishing period. J. Anim. Sci. 2022, 100, skac125. [Google Scholar] [CrossRef] [Scilit]
- Tangjitwattanachai, N.; Phaowphaisal, I.; Otsuka, M.; Sommart, K. Enteric methane emission, energetic efficiency and energy requirements for the maintenance of beef cattle in the tropics. Jpn. Agric. Res. Q. 2015, 49, 399–407. [Google Scholar] [CrossRef] [Scilit]
- Paulino, P.V.R.; Fonseca, M.A.; Henriques, L.T.; Valadares Filho, S.C.; Detmann, E. Nutritional requirements of Nellore cows and calves. In Nutrient Requirements of Zebu Beef Cattle—BR-CORTE; Valadares Filho, S.C., Marcondes, M.I., Chizzotti, M.L., Paulino, P.V.R., Eds.; Suprema Gráfica Ltda.: Visconde do Rio Branco, Brazil, 2010; pp. 167–185. [Google Scholar]

Disclaimer/Publisher’s Note: The statements, opinions and data contained in all publications are solely those of the individual author(s) and contributor(s) and not of MDPI and/or the editor(s). MDPI and/or the editor(s) disclaim responsibility for any injury to people or property resulting from any ideas, methods, instructions or products referred to in the content. |
© 2026 by the authors. Licensee MDPI, Basel, Switzerland. This article is an open access article distributed under the terms and conditions of the Creative Commons Attribution (CC BY) license.