


Simple Summary
This study focused on understanding the early growth pattern of young Bargur cattle from birth (age code 1) to approximately 16 months of age (age code 17). Bargur cattle are an endangered breed of cattle from Tamil Nadu that inhabit the Bargur hillocks of the Erode District. They are known for their ability to survive in a difficult environment with zero input system and also support rural livelihoods through draught power and manure. However, there is limited information on the growth pattern of Bargur cattle during the early growth period. To address this, body weight records from 174 calves were analysed from birth (age code 1) to approximately 16 months of age (age code 17). Different non-linear growth models were used to describe how body weight changes with age and to identify which model best represents their growth pattern. Among the models tested, the Von Bertalanffy model provided the best overall statistical fit to the observed data. The Logistic model showed the highest maturation rate parameter (K), indicating a faster early growth phase. The Generalized Weibull and Von Bertalanffy models also adequately described the growth pattern of Bargur calves. The results showed that the growth rate was faster during the early months and gradually slowed as the animals aged. The study also highlighted that asymptotic weight estimates should be interpreted cautiously because they are model-derived projections based on early growth data. Overall, these findings improve the understanding of growth in Bargur cattle and can help farmers and researchers make better decisions regarding breeding, management, and conservation of this important indigenous breed at an early stage.
Abstract
This study presents the growth data of indigenous Bargur cattle calves maintained at the Bargur Cattle Research Station, Tamil Nadu, India. Bargur cattle are an endangered breed known for their adaptability to hilly environments and production potential. The dataset included 1803 weight–age records collected from 174 calves, covering measurements from birth (age code 1) to approximately 16 months of age (age code 17). In the research station database, birth weight was recorded as age code 1, with subsequent age codes representing approximately monthly weight records. To describe the growth pattern, five non-linear models, Brody, Logistic, Von Bertalanffy, Gompertz, and Generalized Weibull, were fitted to the data. Key growth parameters, such as asymptotic weight, initial weight, and growth rate were estimated, along with indicators like age and weight at inflection. Because the available records covered growth from birth (age code 1) to approximately 16 months of age (age code 17), asymptotic weight estimates should be interpreted as model-derived projections rather than observed mature body weight. Among the models evaluated, the Von Bertalanffy model showed the best overall statistical fit based on AIC, BIC, and RMSE criteria, followed by the Gompertz model. The Logistic model, although not the best-fitting model statistically, retained biological interpretability in describing early growth patterns in calves. The dataset, along with graphical outputs of growth curves and residuals, provides useful insights into the early growth trajectory of Bargur cattle and may support conservation, management, and future breeding programs.
Keywords:
growth curve; Bargur cattle; non-linear models; body weight; birth weight; goodness of fit; Logistic 1. Introduction
Bargur cattle are an endangered indigenous breed native to the Bargur hills of Tamil Nadu, and are well adapted to the hilly terrain and forest ecosystem of this region. The breed is known for its hardiness, grazing ability, and suitability for low input management systems. It plays an important role in the livelihoods of local communities and represents a valuable genetic resource. Despite their ecological and socio-economic importance, Bargur cattle populations have declined drastically during the last few decades because of mechanization of agriculture, reduced demand for draught animals, restrictions on forest grazing, lack of systematic breeding programs, and limited awareness regarding breed conservation [1]. In addition, scientific information on the growth characteristics of Bargur cattle remains limited compared with other indigenous and commercial cattle breeds. Understanding growth patterns using appropriate mathematical models is important for evaluating growth performance, improving management practices, and supporting conservation and breed improvement strategies for this endangered indigenous cattle breed. This breed exhibits strong adaptability and good production potential, along with distinct characteristics and management practices [2]. Growth is an important indicator of livestock performance, and body weight is widely used to monitor growth over time. Regular weight recording helps in understanding growth patterns and improving animal management and selection. In indigenous cattle, including Bargur cattle, body weight can be estimated using morphometric body measurements when direct weighing is difficult, and this approach has been previously validated in Bargur cattle under field conditions [3]. Mathematical models are commonly used to describe growth patterns in animals and non-linear growth models are particularly suitable because they can capture the sigmoidal relationship between age and body weight. The growth curve can be quantified more accurately using nonlinear models to synthesize data over a given time interval for a group of animals in a given physiological state [4]. Non-linear growth models provide biologically interpretable parameters such as asymptotic weight (A) and maturation rate (K), which describe the model-derived asymptotic growth level and the rate at which animals approach it [5]. Non-linear growth models have been effective in describing the growth curve and estimating biologically meaningful parameters in cattle [6]. These models provide biologically meaningful parameters, such as asymptotic weight and growth rate. Non-linear growth functions have been successfully applied to different livestock species, including goats [7] cattle [8] and buffalo [9], demonstrating their usefulness in describing growth trajectories under varying conditions. In this study, the data were obtained from a nucleus herd of 100 breedable Bargur cows and their followers, maintained at the Bargur Cattle Research Station since 2015 to the present under a standardized management system, including controlled feeding, routine health care, and systematic performance recording. Records of birth weight, animal ID, sex, birth date, date of weight recording, body weight, and age at recording were collected from the herd database. In the research station database, birth weight was recorded using age code 1, and subsequent age codes corresponded approximately to monthly weight recordings. The dataset included animals with body weight records available from birth (age code 1) to approximately 16 months of age (age code 17). Both raw and processed age-weight records of Bargur calves were used to estimate growth parameters, evaluate goodness-of-fit, and generate fitted growth curves and residual plots for model comparison.
To identify the most suitable model, statistical criteria including Akaike Information Criterion (AIC) and Bayesian Information Criterion (BIC) were used. These criteria are widely applied in model selection because they account for both model fit and model complexity, helping to identify the most appropriate model for a given dataset [10]. Therefore, the present study was undertaken to describe the growth patterns of indigenous Bargur Cattle calves using different non-linear growth models. The objective of this study was to compare the performance of these models using longitudinal weight–age data and to provide information that may support further research and management of this breed.
2. Materials and Methods
2.1. Data Source
The present study was conducted using data from Bargur Cattle maintained at the Bargur Cattle Research Station, Bargur, located in Anthiyur (tk) of Tamil Nadu (11.816909° N latitude and 77.537855° E longitude) at an altitude of approximately 1050 m above the mean sea level. The station primarily focuses on the conservation of Bargur Cattle an indigenous hilly breed. Weight–age records (n = 1803) along with information on calf identification number, date of birth, sex, date of weight recording, and age at recording, were obtained from the station records. In the station database, age was recorded using sequential monthly age codes, where age code 1 represented birth weight and subsequent codes corresponded approximately to monthly weight recordings. Thus, the age variable ranged from code 1 (birth) to code 17 (approximately 16 months of age). The dataset comprised repeated body weight measurements of Bargur calves capturing growth variability within the population. The dataset included records from 76 male and 98 female calves collected between 2017 and 2023. Both sexes were included together in the analysis to evaluate the overall growth pattern of Bargur calves under field conditions. Although male and female calves were represented during the pre-weaning period, the distribution of observations across age classes became less balanced due to differences in the lactation length of the dams (Table S1). Therefore, sex was not included as a fixed effect in the growth models, and the analysis focused on describing the overall growth trajectory of Bargur calves rather than sex-specific growth patterns. Animals were maintained under a relatively uniform scientific management system, including feeding with green fodder, dry fodder, and concentrate supplementation according to body weight and nutritional requirements. The study period (2017–2023) included all seasonal variations; however, animals were maintained under a standardized feeding and management system to minimize environmental variation. Data quality was assessed through biological plausibility checks and graphical inspection of residuals after model fitting. No observations were identified as biologically implausible or influential enough to warrant exclusion. Therefore, all 1803 weight–age records were retained for growth curve analysis. The descriptive statistics of age, body weight and number of records per animal are presented in Table 1.
Table 1.
Descriptive Statistics for Age, Weight and Number of Records per animal of Bargur Calves.
2.2. Growth Models
Non-linear growth models were used to describe the relationship between age and body weight of Bargur calves. Commonly used sigmoidal growth functions, namely the Brody, Logistic, Von Bertalanffy, Gompertz, and Generalized Weibull models, were considered in the analysis. These models are widely applied in livestock studies because of their ability to capture the nonlinear and asymptotic nature of biological growth [11,12]. Among these, the Brody, Logistic, Von Bertalanffy, and Gompertz models are three-parameter functions in their conventional form, with parameters representing asymptotic weight (A), an integration constant (b), and maturation rate (K). The Generalized Weibull model includes an additional shape parameter (n), allowing greater flexibility in describing the curvature of the growth trajectory.
2.3. Model Equations
The mathematical forms of the selected growth models and their reparameterized expressions are listed in Table 2. All models were parameterized to estimate biologically meaningful parameters, including asymptotic weight (A), initial (birth) weight (W0), and maturation rate (K). The shape parameter (n) of the Generalized Weibull model was specified in the theoretical formulation; however, it could not be reliably estimated in the nonlinear mixed-effects framework due to convergence constraints. Therefore, the final model was fitted without estimating n as a free parameter. The Brody, Logistic, Von Bertalanffy, and Gompertz models are commonly expressed in terms of the parameters A, b, and K, where b is an integration constant. In the present study, these models were reparameterized by expressing b as a function of birth weight (W0), thereby replacing the integration constant with a biologically interpretable parameter while retaining the same number of model parameters. For models that do not explicitly include the initial weight in their standard formulation, a reparameterization approach was applied to express W0 as a model parameter, following the procedure described [13]. This ensured the consistency and comparability of the parameter estimates across the models. Because the available data covered growth from birth (age code 1) to approximately 16 months of age (age code 17) (age codes 1–17), the asymptotic weight parameter (A) should be interpreted as a model-derived asymptotic projection rather than as an observed mature body weight.
Table 2.
Description of models and model re-parameterizations fitted to describe the growth curve of Bargur Cattle Calves from Bargur Cattle Research Station.
2.4. Statistical Analysis
Growth models were fitted to the age–weight data using a nonlinear mixed-effects modelling approach. The general form of the model is expressed as:
where represents the observed body weight of the i-th animal at age t, A denotes the asymptotic weight, is the random effect associated with animal i on parameter A, is the initial weight, and K is the maturation rate parameter, where n denotes the shape parameter included only in the Generalized Weibull formulation. However, due to convergence limitations, n was not estimated in the final nlme implementation and the Weibull model was fitted in a reduced form, where represents the residual error associated with observation i at time t.
The random effects and residuals were assumed to follow normal distributions, such that and . In all models, random effects were initially evaluated for asymptotic weight (A), maturation rate (K), and initial weight (W0), individually and in combination. However, only the asymptotic weight (A) was retained as a random effect in the final model due to convergence stability and reliable parameter estimation. Since observations began at birth (age code 1), W0 represents a model-derived estimate of birth weight rather than a true measurement at time zero.
2.5. Goodness-of-Fit Criteria
Model performance was evaluated using standard goodness-of-fit criteria, including −2 log-likelihood, Akaike Information Criterion (AIC), Bayesian Information Criterion (BIC), standard error of regression (Sy/x), and Root Mean Square Error (RMSE). Lower values of AIC, BIC, Sy/x, and RMSE indicate better model performance and predictive accuracy. These criteria are widely used for model selection because they consider both model fit and complexity, with lower values indicating better model performance (Multimodel inference: Understanding AIC and BIC in model selection).
In addition, the standard error of regression (Sy/x) was calculated as an indicator of prediction accuracy using the following equation:
where n is the number of observations, p is the number of parameters, and is the residual. The models were ranked based on these criteria to identify the best-fitting function.
2.6. Software
All statistical analyses were performed using R software (version 4.5.3). Nonlinear mixed-effects models were fitted using the nlme package [15]. Graphical outputs, including growth curves and residual diagnostic plots, were generated to assess model adequacy. Normal Q–Q plots and residual-versus-fitted plots were used to evaluate the assumptions of normality and homogeneity of variance for all fitted models. Diagnostic Q–Q plots of standardized residuals and animal-level random effects for the selected best-fitting Von Bertalanffy nonlinear mixed-effects model are provided in the Supplementary Material (Figure S1).
3. Results
3.1. Growth Parameter Estimates
The estimated growth parameters obtained from the different non-linear models are presented in Table 3. The asymptotic weight (A) varied across the fitted models. The Generalized Weibull model yielded the highest asymptotic estimate (176.19 kg), followed by the Von Bertalanffy (126.09 kg), Gompertz (115.01 kg), Brody (107.84 kg), and Logistic (99.38 kg) models, whereas the Logistic model showed the lowest estimate (99.38 kg).
Table 3.
Model-derived parameter estimates from nonlinear mixed-effects growth models fitted to birth through approximately 16 months of age–weight data of Bargur cattle calves.
A similar variation was observed in the initial weight parameter (W0), which ranged from 5.26 kg (model-derived estimate from the Brody model) to 66.94 kg (model-derived estimate from the Generalized Weibull model). The maturation rate parameter (K) was highest in the Logistic model (0.301), indicating a faster approach toward its model-derived asymptotic weight under the Logistic formulation. It should be noted that asymptotic weight (A) represents a model-derived projection based on early growth data and does not correspond to observed mature body weight.
3.2. Inflection Point Analysis
A growth turning point estimated from raw longitudinal data, based on the age corresponding to the maximum observed growth rate across age classes, was computed and compared with model-based inflection points (Table 4). The age and weight at the point of inflection derived from the fitted nonlinear growth models are presented in Table 5. The Gompertz model indicated an inflection weight of 42.31 kg occurring at approximately 4.77 months of age. The Logistic model showed a higher inflection weight of 49.69 kg at around 1.00 month of age. The Von Bertalanffy model estimated the inflection weight as 37.53 kg at 4.05 months of age, whereas the Generalized Weibull model showed an inflection weight of 111.63 kg at approximately 1.00 month, derived numerically from the fitted growth curve. Since the shape parameter (n) was not estimable in the nonlinear mixed-effects framework, analytical derivation of the inflection point was not possible for the Weibull model; therefore, the inflection point was obtained directly from the predicted growth trajectory. As expected, the Brody model did not exhibit a biologically defined inflection point.
Table 4.
Comparison of empirical and model-based inflection points derived from nonlinear growth models fitted to Bargur cattle calves.
Table 5.
Model-derived age and weight at inflection points from nonlinear growth models fitted to Bargur cattle calves.
3.3. Variance Components
The estimates of the variance components for asymptotic weight and residual variance are presented in Table 6. The asymptotic variance (σ2A) differed substantially across the fitted models. The Logistic, Gompertz, Von Bertalanffy, and Generalized Weibull models showed relatively higher asymptotic variance estimates (398.28, 539.09, 648.75, and 1260.66, respectively), indicating greater between-animal variability in mature weight. In contrast, the Brody model failed to produce reliable variance component estimates due to convergence instability, and therefore σ2A and σ2e were not available for this model. The residual variance (σ2e) was relatively consistent across models, ranging from 22.20 to 24.47, indicating similar within-animal variability across the fitted growth functions.
Table 6.
Variance estimates for asymptotic weight and residual variance from non-linear growth models fitted to the Bargur Cattle Calves data.
3.4. Model Comparison and Goodness-of-Fit
A comparison of the models based on the goodness-of-fit criteria is presented in Table 7. The Von Bertalanffy model ranked first according to the AIC, BIC, and Sy/x values, and RMSE values, indicating the best overall fit to the observed growth data. The Gompertz model ranked second based on all three criteria. The Logistic model showed intermediate performance, followed by the Generalized Weibull model, while the Brody model exhibited the poorest fit among the evaluated models. Overall, the lower AIC, BIC, and residual error values obtained for the Von Bertalanffy and Gompertz models suggest that they provided a better statistical description of the growth pattern of Bargur cattle calves in the present study. To further evaluate predictive performance at the individual observation level, Root Mean Square Error (RMSE) was computed (Table 8). The prediction accuracy of the fitted nonlinear growth models was evaluated using RMSE, and the results are presented in Table 8. The RMSE values varied across models, ranging from 4.4864 to 11.4996, indicating differences in predictive performance at the individual trajectory level. The Von Bertalanffy model showed the lowest RMSE (4.4864), closely followed by the Gompertz (4.5263) and Logistic (4.7099) models, while the Generalized Weibull model showed a comparatively higher RMSE (6.1373). The Brody model exhibited the highest RMSE (11.4996). Overall, the variation in RMSE values suggests differences in predictive accuracy among the fitted nonlinear growth models for Bargur cattle calves.
Table 7.
Model ranking and model goodness of fit estimators after fitting five non-linear functions to describe the growth curve of Bargur Cattle Calves from Bargur Cattle Research Station.
Table 8.
Root Mean Square Error (RMSE) of fitted nonlinear growth models.
3.5. Growth Curves and Residual Analysis
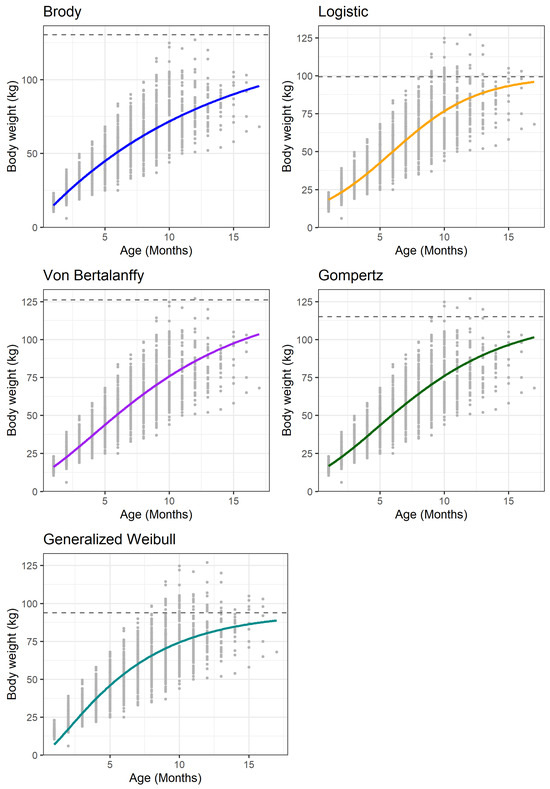
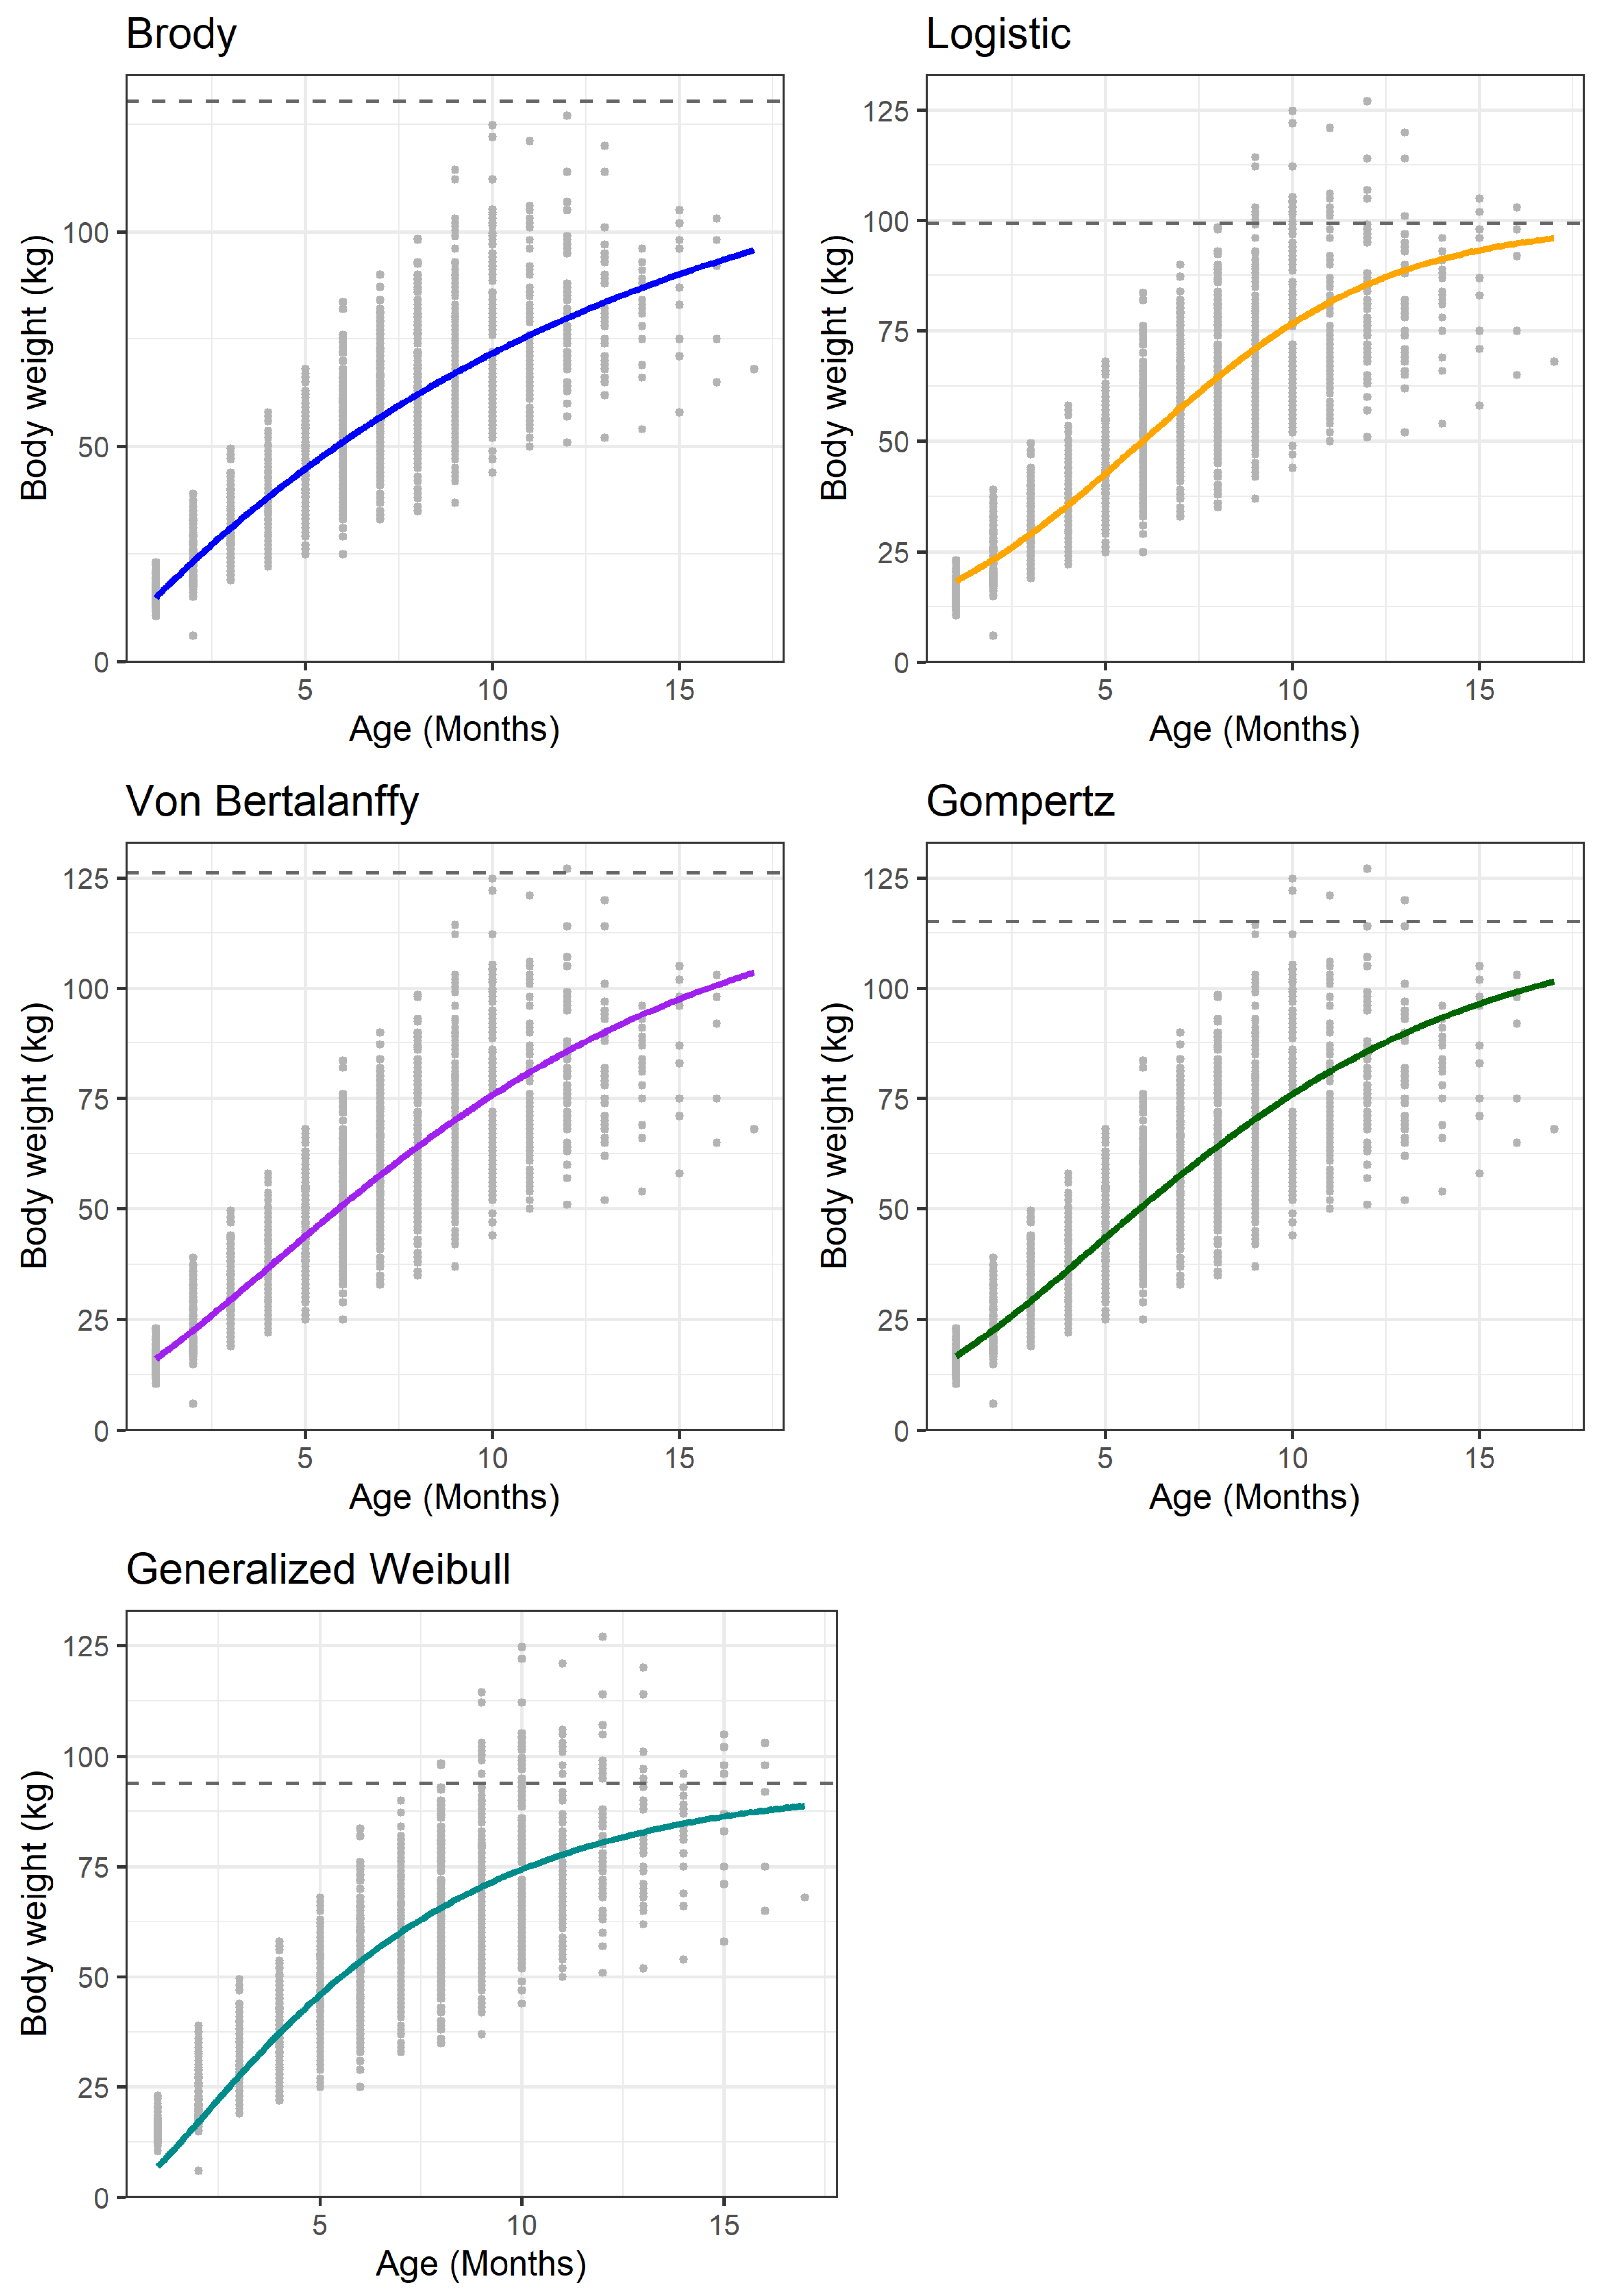
The predicted growth curves for the different nonlinear mixed-effects models are shown in Figure 1. Overall, all models were able to capture the general sigmoidal pattern of growth, although some differences in the fit were observed across age groups. The Von Bertalanffy model showed a comparatively better fit to the observed growth trajectory based on the goodness-of-fit criteria.
Figure 1.
Visual representation of the growth curves of Bargur calves fitted using five non-linear models. Black dots represent observed body weights at different ages, and the solid lines indicate the predicted average growth curves for each model. The horizontal dashed line corresponds to the estimated asymptotic body weight (A).
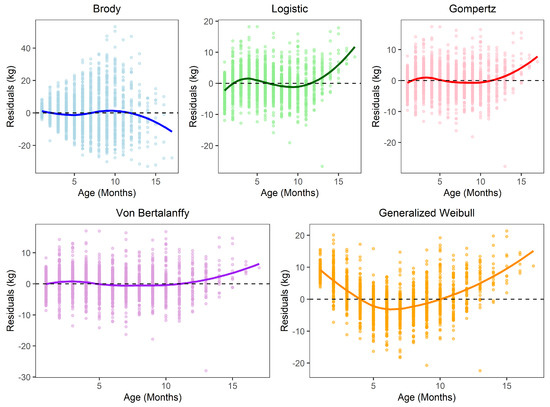
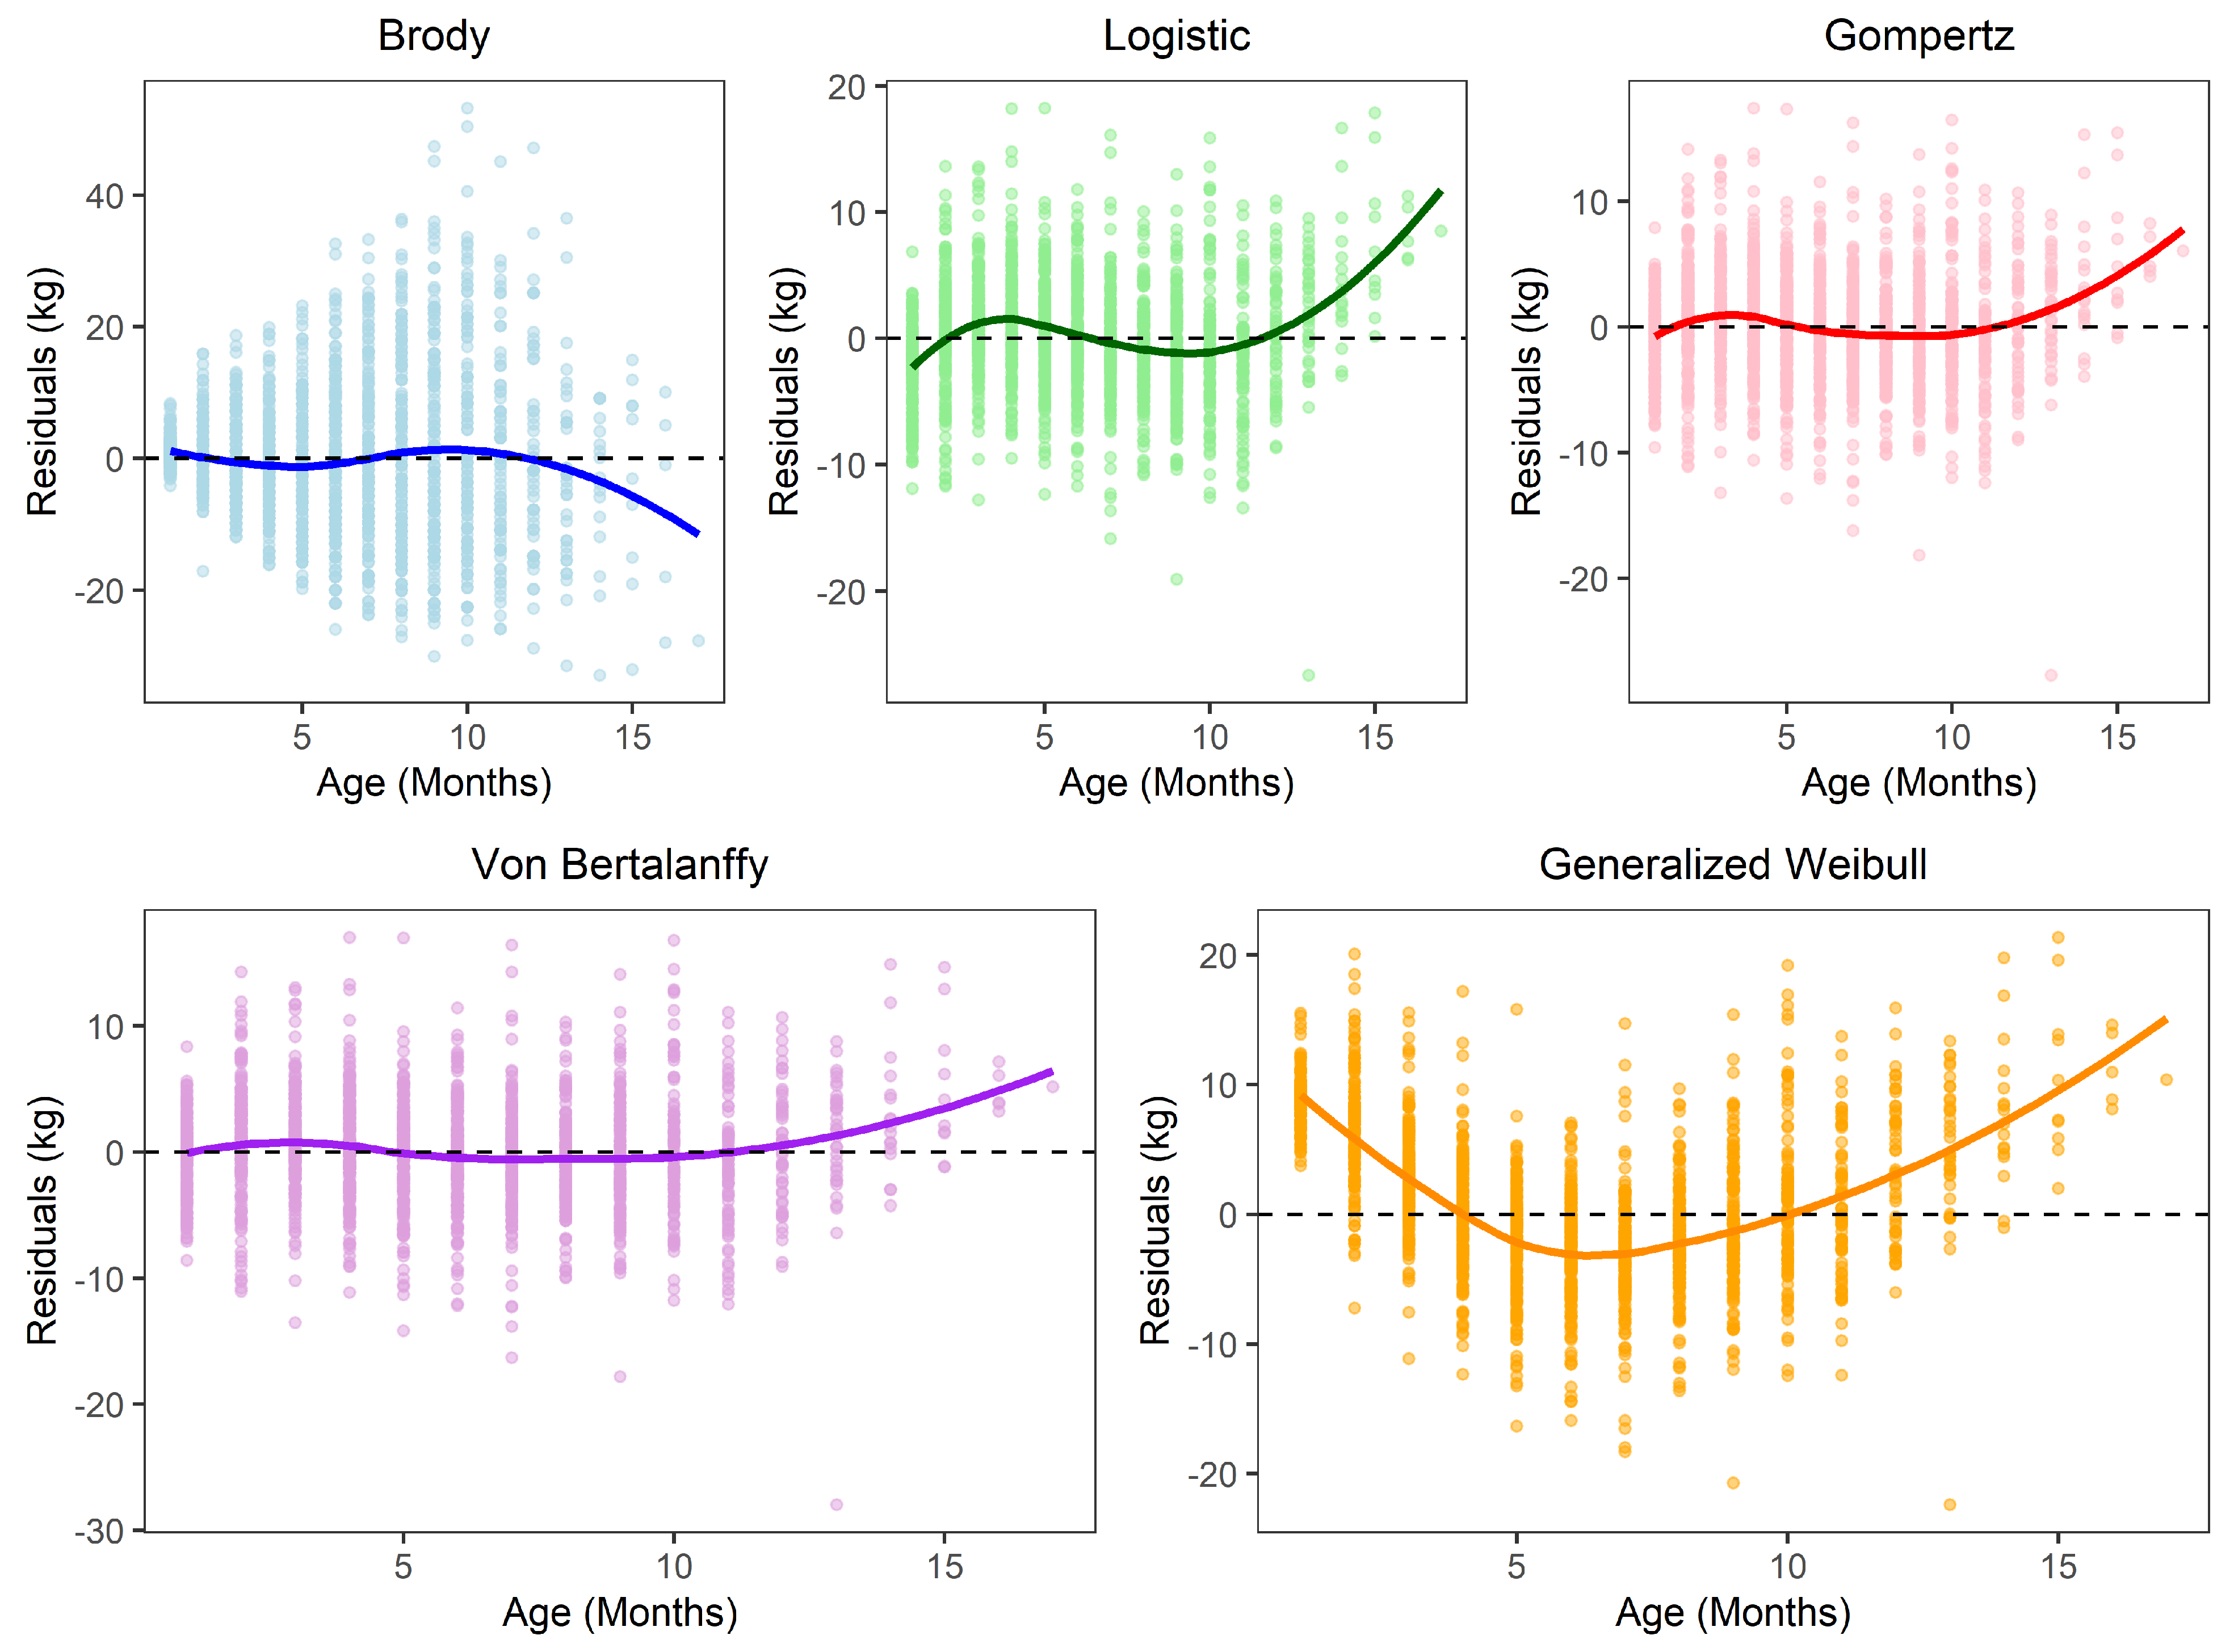
The residual plots (Figure 2) provide an overview of the distribution of prediction errors. Models with a better fit showed a more uniform distribution of residuals around zero, whereas models with a poorer fit exhibited relatively greater dispersion and mild systematic trends in residuals.
Figure 2.
Residual plots of five non-linear growth models fitted to Bargur cattle calves, showing deviations between observed and predicted values across age.
4. Discussion
The present study evaluated the suitability of different non-linear growth models to describe the early growth trajectory of Bargur cattle calves based on age–weight records from birth to approximately 16 months. Non-linear mixed models have been widely applied in animal growth studies because of their flexibility in estimating biologically meaningful parameters and incorporating random effects, which improve model accuracy and allow better representation of individual variability [16]. One method of condensing the information contained in such a data series into a few biologically interpretable parameters is the use of non-linear models [14]. Non-linear growth models such as Logistic, Gompertz, and von Bertalanffy have been reported to provide high predictive accuracy (R2 > 0.90) in describing cattle growth, although their performance may vary depending on age, environment, and duration of data recording [17]. Similarly, these models have been shown to predict growth trajectories from incomplete or partially recorded field data, enhancing their applicability under practical livestock production conditions [18]. A similar pattern has been reported in previous studies, where different models produced varying asymptotic estimates owing to differences in model structure and flexibility [19,20,21]. Because the current dataset includes growth records only up to 15–17 months of age and does not include the plateau phase of growth, the estimated asymptotic weights should be interpreted as model-derived theoretical parameters rather than true observed mature weights. Consequently, asymptotic estimates are influenced by model-based extrapolation beyond the observed age range. The maturation rate parameter (K) was highest in the Logistic model (0.301), indicating a relatively faster early growth phase under this mathematical formulation. However, despite the higher K value, the Von Bertalanffy model provided the best overall statistical fit to the observed data based on AIC, BIC, and RMSE criteria. Compared with improved or exotic cattle breeds, indigenous breeds such as Bargur cattle generally exhibit comparatively lower adult body weights and slower overall growth patterns. However, these growth characteristics are often associated with superior adaptability, hardiness, and survival under harsh environmental conditions and low-input production systems. The relatively faster early growth indicated by the higher maturation rate parameter in the Logistic model may therefore have practical importance for calf management, particularly with respect to nutritional supplementation and health care during the juvenile growth stage. K is commonly referred to as the maturation rate parameter and reflects the rate at which an animal approaches its asymptotic size [22]. This observation is consistent with the characteristic behavior of the logistic function, which represents rapid early growth followed by gradual stabilization [23,24]. Similarly, Ref. [25] reported that the Logistic model provided reliable predictions during the early growth period of Holstein calves, supporting its suitability for describing early growth phases. In the present study, differences in inflection points among models highlighted variations in growth dynamics. The Logistic and Generalized Weibull models indicated earlier inflection ages (approximately 1.00 month), whereas the Von Bertalanffy and Gompertz models reached inflection at approximately 4.05 and 4.77 months, respectively. Since the shape parameter (n) was not estimable, analytical derivation of the inflection point was not possible for the Generalized Weibull model; therefore, the inflection point was obtained directly from the predicted growth curve. The discrepancy between empirical and model-based inflection points is expected, as empirical estimates are based on observed mean growth patterns, whereas nonlinear models estimate inflection as the point of maximum growth velocity derived from fitted mathematical functions. The model-based inflection ages ranged from approximately 1.00 to 4.77 months, indicating that rapid growth acceleration occurs during early postnatal development, whereas later observed weight peaks reflect cumulative growth rather than true inflection. The empirical inflection point was identified from raw data as the age corresponding to maximum observed growth velocity (Δweight/Δage) across successive weight recordings. It is important to note that empirical inflection was derived from observed mean growth trends, whereas model-based inflection points were estimated from fitted nonlinear growth functions. Such variations in growth patterns among models have also been reported in comparative growth studies, where different functions capture growth curvature differently depending on the dataset [26]. The variance component associated with the asymptotic parameter (A) in the present study reflected between-animal variability captured through the random-effect structure. Similar observations have been reported in mixed-model analyses of cattle growth, where the incorporation of random effects improves parameter estimation and accounts for individual variability [7]. Based on model selection criteria, the Von Bertalanffy showed the best overall performance. Previous studies have reported that different nonlinear models may perform better depending on breed, age range, management system, and data structure. For example, Ref. [25] found the Logistic model to be suitable for describing early growth in Holstein calves, whereas the present study identified the Von Bertalanffy model as the best-performing model for Bargur cattle. However, other studies have indicated that the optimal model may vary depending on breed, data structure, and environmental conditions [27,28], suggesting that model selection should be context-specific. To our knowledge, this represents one of the first comprehensive applications of nonlinear mixed-effects growth models in Bargur cattle and provides breed-specific growth parameter estimates for an indigenous cattle population for which detailed growth modelling information is limited. Variation in asymptotic weight estimates across models reflected differences in model structure and flexibility. The present findings also provide breed-specific biological insights into Bargur cattle. The moderate growth pattern and model-derived asymptotic projections observed across the fitted models may reflect the adaptation of this indigenous breed to hilly terrain, harsh grazing conditions, and low-input production systems. Bargur cattle are traditionally maintained under extensive management conditions, where adaptability, hardiness, and survival ability are important functional traits. Therefore, growth characteristics observed in the present study may represent adaptive responses associated with the ecological and management conditions under which the breed has evolved. In addition, the present study provides baseline growth information that may support future conservation, breeding, and management programs for Bargur cattle, offering scientifically derived growth parameters and model-based growth predictions. Although the dataset covered only the early growth phase of Bargur cattle, the fitted non-linear models remain valuable for monitoring juvenile growth, comparing growth trajectories, and supporting breeding, management, and conservation decisions. Overall, the present findings demonstrate that non-linear growth models can effectively describe early growth in Bargur calves. The inclusion of RMSE provided an additional assessment of model performance at the individual observation level. Although differences in RMSE values were observed among the fitted nonlinear models, the variation was generally small among the best-performing models. The Von Bertalanffy model showed the lowest RMSE (4.4864), followed closely by the Gompertz (4.5263) and Logistic (4.7099) models, indicating comparable predictive performance among these functions. In contrast, the Generalized Weibull (6.1373) and Brody (11.4996) models exhibited relatively higher RMSE values, suggesting lower predictive accuracy. Overall, despite differences in AIC and BIC rankings, the RMSE results indicate that the Von Bertalanffy model provided the best predictive performance for the present dataset. Therefore, model selection should be interpreted based on both biological interpretability and statistical performance.
5. Conclusions
The present study demonstrated that non-linear growth models are effective in describing the early growth trajectory of Bargur cattle calves based on longitudinal age–weight data from birth to approximately 16 months. Among the models evaluated, the von Bertalanffy model provided the best overall fit based on AIC, BIC, and residual error criteria, followed by the Gompertz, Logistic, and Generalized Weibull models, respectively, while the Brody model showed the poorest performance. The variation observed in parameter estimates and inflection characteristics across models reflects differences in their mathematical structure and extrapolation behavior rather than biological variation, particularly because the dataset does not cover the complete growth period up to maturity. The estimated asymptotic weights obtained from the models should therefore be interpreted with caution, as they were derived from early growth data and involve extrapolation beyond the observed age range and do not represent true mature body weights. Overall, the findings provide useful insights into the growth pattern of Bargur calves and demonstrate the applicability of non-linear mixed-effects modelling approaches for describing growth in indigenous cattle. The fitted models may also be useful for monitoring juvenile growth performance and supporting early management and selection decisions in Bargur cattle.
Supplementary Materials
The following supporting information can be downloaded at: https://www.mdpi.com/article/10.3390/ruminants6030046/s1, Figure S1: Diagnostic Q-Q plots for the Von Bertalanffy nonlinear mixed-effects model; Table S1: Distribution of male and female weight-age records across age classes used in the growth curve analysis.
Author Contributions
G.P. and A.S.: Conceptualization, Data curation, Formal analysis, Writing—original draft preparation; S.R. (Subash Ramu), V.C. and S.V.: Investigation, Data collection; S.R. (Saravanan Ramasamy), R.R. and V.R.: Supervision; G.P., A.S. and H.T.: Methodology, Writing—review & editing. All authors have read and agreed to the published version of the manuscript.
Funding
This research received no external funding.
Institutional Review Board Statement
Not Applicable. The study used body weight and morphometric records collected as part of routine management, conservation, and genetic improvement activities at the Bargur Cattle Research Station. No invasive procedures or experimental interventions were performed specifically for this research. According to institutional policy and applicable local regulations, ethical review and approval were not required for analysis of these routine non-invasive management records.
Informed Consent Statement
Not Applicable.
Data Availability Statement
The data presented in this study are openly available in Mendeley Data at https://data.mendeley.com/datasets/grdx9pymf2/1 (accessed on 10 June 2026), reference number 10.17632/grdx9pymf2.1.
Acknowledgments
This study was supported by Tamil Nadu Veterinary and Animal Sciences University (TANUVAS). The authors sincerely acknowledge the Director, Centre for Animal Production and Studies TANUVAS, for granting approval and providing the necessary support to carry out this study.
Conflicts of Interest
The authors declare no conflicts of interest.
References
- Ganapathi, P.; Rajendran, R.; Kathiravan, P. Detection of occurrence of a recent genetic bottleneck event in Indian hill cattle breed Bargur using microsatellite markers. Trop. Anim. Health Prod. 2012, 44, 2007–2013. [Google Scholar] [CrossRef] [Scilit]
- Ganapathi, P.; Rajendran, R.; Subramanian, A.; Meenakshisundaram, S. Bargur cattle: Characterization and management practices. Indian Vet. J. 2013, 90, 9–10. [Google Scholar]
- Ganapathi, P.; Subash, R.; Surya, K.; Kavithaa, N.; Anitha, S.; Meenakshisundaram, S. Comparative analysis of measuring body weight in indigenous Bargur hill cattle by direct and indirect methods using morphometric measurements. Agric. Sci. Dig. 2025, 45, 194–201. [Google Scholar]
- Araujo Neto, F.R.; Oliveira, D.P.; Aspilcueta-Borquis, R.R.; Vieira, D.A.P.; Guimarães, K.C.; Oliveira, H.N.; Tonhati, H. Selection of nonlinear mixed models for growth curves of dairy buffaloes (Bubalus bubalis). J. Agric. Sci. 2020, 158, 218–224. [Google Scholar] [CrossRef] [Scilit]
- Araújo, R.O.D.; Marcondes, C.R.; Damé, M.C.F.; Garnero, A.D.V.; Gunski, R.J.; Everling, D.M.; Rorato, P.R.N. Classical nonlinear models to describe the growth curve for Murrah buffalo breed. Cienc. Rural 2012, 42, 520–525. [Google Scholar] [CrossRef] [Scilit]
- Bahashwan, S.; Alrawas, A.S.; Alfadli, S.; Johnson, E.S. Dhofari cattle growth curve prediction by different non-linear model functions. Livest. Res. Rural Dev. 2015, 27, 236. [Google Scholar]
- DeNise, R.S.; Brinks, J.S. Genetic and environmental aspects of the growth curve parameters in beef cows. J. Anim. Sci. 1985, 61, 1431–1440. [Google Scholar] [CrossRef] [Scilit] [PubMed]
- Adinata, Y.; Noor, R.R.; Priyanto, R.; Cyrilla, L.; Sudrajad, P. Comparison of growth curve models for Ongole grade cattle. Trop. Anim. Health Prod. 2022, 54, 252. [Google Scholar] [CrossRef] [Scilit] [PubMed]
- Abbas, A.; Basheer, A.; Kallon, M.N.; Sharif, N.; Ghiasi, H.; Mehmood, T.; Azam, B.; Khalique, A.; Dawood, M.; Za-hoor, I. Development of growth curve and estimation of genetic parameters of Nili-Ravi buffalo calves from birth to one year of age through non-linear models. Trop. Anim. Health Prod. 2024, 56, 390. [Google Scholar] [CrossRef] [Scilit] [PubMed]
- Burnham, K.P.; Anderson, D.R. Multimodel inference: Understanding AIC and BIC in model selection. Sociol. Methods Res. 2004, 33, 261–304. [Google Scholar] [CrossRef] [Scilit]
- Tjørve, E.; Tjørve, K.M.C. A unified approach to the Richards-model family for use in growth analyses: Why we need only two model forms. J. Theor. Biol. 2010, 267, 417–425. [Google Scholar] [CrossRef] [Scilit] [PubMed]
- Henderson, P.A.; Seaby, R.M.H.; Somes, J.R. Growth II; Pisces Conservation Ltd.: Lymington, UK, 2006. [Google Scholar]
- Koya, P.R.; Goshu, A.T. Solutions of rate-state equation describing biological growths. Am. J. Math. Stat. 2013, 3, 305–311. [Google Scholar]
- Brown, J.E.; Fitzhugh, H.A., Jr.; Cartwright, T.C. A comparison of nonlinear models for describing weight-age relationships in cattle. J. Anim. Sci. 1976, 42, 810–818. [Google Scholar] [CrossRef] [Scilit]
- Pinheiro, J.; Bates, D.; DebRoy, S.; Sarkar, D.; R Core Team. nlme: Linear and Nonlinear Mixed Effects Models; R Package Version 3.1-168; R Foundation for Statistical Computing: Vienna, Austria, 2025. [Google Scholar]
- Araujo, J.I.M.; Carneiro, P.L.S.; Glória, L.S.; Filho, R.M.; Araujo, A.C.; de Rezende, M.P.G.; Malhado, C.H.M. Strate-gies for the identification of precocity in Zebu beef cattle based on mixed nonlinear models and multivariate ap-proach. Trop. Anim. Health Prod. 2023, 55, 362. [Google Scholar] [CrossRef] [Scilit] [PubMed]
- Budimulyati, L.; Noor, R.R.; Saefuddin, A.; Talib, C. Comparison on accuracy of logistic, Gompertz and von Bertalanffy models in predicting growth of newborn calf until first mating of Holstein Friesian heifers. J. Indones. Trop. Anim. Agric. 2012, 37, 151–160. [Google Scholar] [CrossRef] [Scilit]
- Sultana, N.; Khan, M.K.I.; Momin, M.M. Nonlinear models for the prediction of yearly live weight of cattle. Asian J. Dairy Food Res. 2022, 41, 168–172. [Google Scholar]
- Lopes, F.B.; da Silva, M.C.; Marques, E.G.; McManus, C.M. Analysis of longitudinal data of beef cattle raised on pasture from northern Brazil using nonlinear models. Trop. Anim. Health Prod. 2012, 44, 1945–1951. [Google Scholar] [CrossRef] [Scilit] [PubMed]
- Camargo Júnior, R.N.C.; Araújo, C.V.; Silva, W.C.; Araújo, S.I.; Lôbo, R.B.; Nakabashi, L.R.M.; Castro, L.M.; Menezes, F.L.; Silva, A.G.M.; Silva, L.K.X.; et al. Mixed models in nonlinear regression for description of the growth of Nelore cattle. Animals 2023, 13, 101. [Google Scholar]
- Hossein-Zadeh, N.G.; Ardalan, M. Comparison of non-linear growth models to describe the growth curve of Mehraban sheep. J. Appl. Anim. Res. 2018, 46, 499–504. [Google Scholar] [CrossRef] [Scilit]
- López de Torre, G.; Candotti, J.J.; Reverter, A.; Bellido, M.M.; Vasco, P.; García, L.J.; Brinks, J.S. Effects of growth curve parameters on cow efficiency. J. Anim. Sci. 1992, 70, 2668–2672. [Google Scholar] [CrossRef] [Scilit] [PubMed]
- Selvaggi, M.; Laudadio, V.; D’Alessandro, A.G.; Dario, C.; Tufarelli, V. Comparison on accuracy of different nonlinear models in predicting growth of Podolica bulls. Anim. Sci. J. 2017, 88, 1128–1133. [Google Scholar] [PubMed]
- Teleken, J.T.; Galvão, A.C.; Robazza, W.S. Comparing non-linear mathematical models to describe growth of different animals. Acta Sci. Anim. Sci. 2017, 39, 73–81. [Google Scholar] [CrossRef] [Scilit]
- Koskan, O.; Ozkaya, S. Determination of growth curves of female Holstein calves using five non-linear models. Pak. J. Agric. Sci. 2014, 51, 225–228. [Google Scholar]
- Waiz, S.A.; Gautam, L.; Ali, S.; Waiz, H.A. Appraisal of growth curve in Sirohi goat using non-linear growth curve models. Trop. Anim. Health Prod. 2019, 51, 1135–1140. [Google Scholar] [CrossRef] [Scilit] [PubMed]
- Domínguez-Viveros, J.; Rodríguez-Almeida, F.A.; Aguilar-Palma, G.N.; Castillo-Rangel, F.; Saiz-Pineda, J.F.; Villegas-Gutiérrez, C. Fitting of non-linear models to characterize the growth of five zebu cattle breeds. Livest. Sci. 2020, 242, 104303. [Google Scholar] [CrossRef] [Scilit]
- Gbangboche, A.B.; Glele-Kakai, R.; Salifou, S.; Albuquerque, L.G.; Leroy, P.L. Comparison of non-linear growth models to describe the growth curve in West African Dwarf sheep. Animal 2008, 2, 1003–1012. [Google Scholar] [CrossRef] [Scilit]

Disclaimer/Publisher’s Note: The statements, opinions and data contained in all publications are solely those of the individual author(s) and contributor(s) and not of MDPI and/or the editor(s). MDPI and/or the editor(s) disclaim responsibility for any injury to people or property resulting from any ideas, methods, instructions or products referred to in the content. |
© 2026 by the authors. Licensee MDPI, Basel, Switzerland. This article is an open access article distributed under the terms and conditions of the Creative Commons Attribution (CC BY) license.