


Abstract
Active mobility is central to healthier, more sustainable, and inclusive cities, yet its assessment remains fragmented across tools that separately emphasise accessibility, infrastructure, urban form, street quality, behaviour, or governance. This study develops the Active Mobility Matrix (AMM), a multidimensional framework for organising and operationalising the interacting conditions that enable or constrain walking, cycling, and related active modes. A framework-development design combined interdisciplinary literature synthesis with comparative analysis of established active-mobility assessment and planning approaches. Recurring determinants were progressively abstracted, categorised, and refined through hierarchical construction and cross-domain consistency review. The resulting AMM comprises three interrelated meta-dimensions—Spatial Capability, Human Experience, and System Enablement—operationalised through seven domains: Network & Connectivity, Urban Characteristics, Safety & Security, Environment & Comfort, Socio-Cultural, Policy & Governance, and Technology & Smart Mobility. These domains are linked to factors, indicators, and candidate variables through six functional conditions: Capability, Opportunity, Protection, Experience, Motivation, and Enablement. The AMM’s principal contribution lies in integrating spatial, experiential, socio-cultural, institutional, and technological determinants within a common analytical structure while distinguishing conceptually related constructs and reducing cross-domain duplication. It provides a transparent foundation for context-sensitive diagnosis, indicator selection, planning, and policy evaluation. The AMM is not presented as a universally weighted or empirically validated index; its candidate measures, domain relationships, weighting, aggregation, reliability, and validity require staged testing across modes, populations, scales, and urban contexts.
1. Introduction
1.1. Active Mobility: Context and Importance
Active mobility refers to everyday travel generated wholly or partly through physical activity, principally walking and cycling, but also wheeling and other context-appropriate human-powered or electrically assisted modes. Its growing policy importance reflects the connections among mobility, public health, environmental sustainability, accessibility, social inclusion, and urban quality of life [1,2,3]. Consistent with the sustainable mobility paradigm, active mobility shifts attention from movement provision alone towards access to opportunities, low-carbon travel, inclusion, and quality of life [4]. Walking and cycling are consequently positioned within integrated mobility systems that connect people to employment, education, services, recreation, and social participation [5,6,7]. The benefits extend across health, environmental, urban, and social domains. Regular walking and cycling increase physical activity and can reduce the risks associated with several non-communicable diseases [1,2,3]. When they substitute for motorised trips, active modes can reduce greenhouse-gas emissions, air pollution, noise, and energy use [5,6]. They can also support street activity, public-space vitality, and more human-centred urban environments [1,8]. As relatively affordable modes, walking, cycling, and wheeling may improve access for children, older adults, people with disabilities, and lower-income groups, although these benefits depend on safe, accessible, and inclusive conditions [2,6,7].
Despite these benefits, adoption remains uneven. Inadequate or fragmented infrastructure, traffic danger, environmental discomfort, limited destination accessibility, socio-cultural constraints, and insufficient institutional support can restrict active travel [2,5,6,9]. Automobile dependence, dispersed land-use patterns, and weak coordination across transport, planning, and governance systems compound these barriers. Active mobility therefore cannot be understood through infrastructure or accessibility alone; it requires assessment of the interacting spatial, experiential, social, and institutional conditions that enable or constrain behaviour. Section 1.2 examines the extent to which existing frameworks capture these conditions.
1.2. Limitations of Existing Assessment Frameworks
The growing importance of active mobility has generated diverse tools for assessing walkability, bikeability, accessibility, street quality, transit-oriented development, and neighbourhood proximity. These approaches have advanced planning and policy by translating relevant urban conditions into measurable indicators [1,5]. However, most were designed for specific purposes and therefore capture only part of the interacting conditions shaping active mobility. Walk Score and Bike Score primarily assess destination accessibility, network connectivity, and selected environmental characteristics. They facilitate neighbourhood comparison and communicate complex spatial information through accessible metrics [10,11,12]. Yet their emphasis on proximity and spatial configuration underrepresents perceived safety, environmental comfort, social norms, governance, and technological support, limiting their capacity to interpret differences across populations and urban contexts [10,13]. Engineering-based level-of-service and low-traffic-stress approaches evaluate route or facility conditions such as width, traffic exposure, intersections, and infrastructure quality [14,15]. They are valuable for diagnosing operational performance and guiding infrastructure interventions but are less suited to examining the wider environmental, social, behavioural, and institutional conditions influencing active mobility adoption.
Broader planning approaches partly address this limitation. Healthy Streets incorporates safety, comfort, attractiveness, inclusivity, and social interaction, whereas the 15-Minute City emphasises proximity to daily needs in compact, mixed-use neighbourhoods [16,17]. Although these approaches extend beyond infrastructure provision, institutional capacity, governance, technology, and some socio-cultural influences are not consistently operationalised as dedicated assessment dimensions. Transit-Oriented Development (TOD) similarly integrates density, diversity, accessibility, and proximity to transit, supporting walking and cycling within multimodal journeys [18,19]. Its principal purpose, however, is to structure development around public transport rather than assess active mobility as a complete system; environmental comfort, community perceptions, behavioural motivations, governance capacity, and smart-mobility support consequently receive uneven or indirect treatment.
Across these approaches, coverage is selective, typically prioritising accessibility, infrastructure, urban form, street quality, or transit integration. These differences reflect their particular assessment and planning purposes rather than deficiencies. Multidimensional frameworks also provide important foundations: Pikora et al. [20] organise environmental determinants of walking and cycling, while Götschi et al. [21] integrate behavioural processes and contextual influences within the PASTA framework. The need is therefore not simply for another framework that recognises multiple determinants, but for a clearly specified assessment structure linking relevant constructs to candidate measures and distinguishing overlapping components.
This assessment need motivates the Active Mobility Matrix (AMM), proposed as a multidimensional conceptual structure that integrates spatial, experiential, socio-cultural, governance, institutional, and technological determinants. Rather than replacing specialised tools, the AMM organises their complementary insights within a domain–factor–indicator–variable hierarchy and relates its domains to their proposed functions in supporting active mobility.
1.3. Research Gap, Aim, and Contributions
Although the determinants of active mobility are increasingly well documented, their conceptualisation and assessment remain fragmented. Built-environment research primarily examines connectivity, urban form, land use, and accessibility [1,18], while environmental and public-health studies address thermal comfort, air quality, noise, green space, streetscape quality, and associated health effects [2,22,23]. Other research highlights safety perceptions, equity, participation, and mobility culture [24,25], whereas policy and governance studies emphasise institutional support, funding, regulation, and road-safety strategies [9,26]. Digital tools and mobility data further support information provision, navigation, monitoring, and data-informed management [26]. Although existing multidimensional frameworks integrate many of these influences, translating them into a coherent urban assessment structure requires explicit distinctions between related constructs and links to candidate measures. The specific gap addressed here concerns the organisation and operational interpretation of spatial, experiential, socio-cultural, institutional, and technological conditions within a common assessment hierarchy.
Accordingly, this study aims to develop the Active Mobility Matrix (AMM) as a multidimensional conceptual framework for organising and interpreting the conditions that enable or constrain active mobility. Drawing on urban design, transport planning, public health, environmental psychology, and governance research, the AMM brings spatial, experiential, socio-cultural, institutional, and technological determinants into a unified relational structure. It is intended to complement specialised assessment tools by making relationships among domains explicit rather than treating individual determinants as isolated influences. The study makes three principal contributions. First, it develops an assessment hierarchy linking three meta-dimensions and seven domains to factors, indicators, and candidate variables. Second, it clarifies boundaries between related constructs and identifies the proposed functions through which the domains support active mobility. Third, it provides a structured basis for context-sensitive indicator selection, subsequent empirical testing, and planning and policy applications. The AMM is therefore presented as a conceptual and operational foundation, rather than as a universally weighted or already validated index.
2. Theoretical Foundations of Active Mobility
2.1. Active Mobility as Human Behaviour
Active mobility is neither a direct outcome of infrastructure provision nor solely a matter of individual preference. Walking and cycling emerge from interactions between individual agency and the spatial, social, environmental, and institutional contexts of everyday travel. Explaining when active mobility becomes feasible, attractive, and practised therefore requires attention to both personal agency and enabling or constraining conditions.
This section draws on four complementary theoretical perspectives: the Capability Approach, the Socio-Ecological Perspective, Built Environment–Behaviour research, and Governance and Institutional Perspectives. These are used as analytical lenses rather than as behavioural categories or AMM dimensions. Together, they establish the theoretical basis for conceptualising active mobility as multidimensional human behaviour and organising its determinants within the Active Mobility Matrix [27,28].
2.1.1. Capability Approach
Developed by Sen [29] and extended by Nussbaum [30], the Capability Approach provides a normative and evaluative lens that treats mobility as more than physical movement. It focuses on capabilities—the genuine opportunities to achieve ways of living people have reason to value—rather than on resources or services alone. Mobility is therefore valuable because it enables access to employment, education, healthcare, social relationships, recreation, and wider participation in urban life.
The distinction among resources, capabilities, and functioning is central. Sidewalks, cycle routes, crossings, and public spaces constitute resources; the genuine freedom to use them to reach valued destinations represents capability; and actual walking or cycling is a realised functioning. Infrastructure provision alone therefore does not establish an effective capability for active mobility. Converting resources into genuine opportunities depends on personal, social, and environmental conditions, including physical ability, confidence, cultural acceptance, safety, accessibility, network continuity, and environmental suitability [27]. Observed behaviour is similarly insufficient: the same walking journey may be freely chosen or undertaken because alternatives are unavailable, while non-participation may reflect barriers rather than preference. The relevant question is therefore whether active mobility constitutes a real and equitable option.
Accessibility is central because it connects movement with the opportunities people seek to reach. Mobility systems should consequently be evaluated not only by the amount or speed of movement provided, but also by how opportunities to access valued destinations and participate in urban life are distributed among population groups [27,31]. The Capability Approach is not, by itself, a predictive model of walking or cycling; its contribution is to distinguish resource provision from effective freedom.
2.1.2. Socio-Ecological Perspective
Whereas the Capability Approach focuses on effective opportunities and freedoms, the Socio-Ecological Perspective explains behaviour through interacting influences at individual, social, environmental, and institutional levels. Drawing on ecological theories of human development and their application in public health and active-living research, it rejects explanations based on individual characteristics alone and situates behaviour within relationships connecting people, social groups, physical environments, institutions, and policies [28,32]. At the individual level, age, health, physical ability, knowledge, attitudes, confidence, motivation, travel preferences, and risk perceptions influence whether active travel is considered possible or desirable. However, favourable intentions may not translate into behaviour where safe routes, suitable destinations, or social acceptance are absent. Social influences—including family and peer expectations, community values, mobility cultures, and social norms—may reinforce or constrain participation independently of infrastructure availability.
Environmental influences include connectivity, land use, destination accessibility, traffic conditions, public-space design, environmental quality, and infrastructure provision. Supportive environments can make walking and cycling more convenient, safe, and attractive, whereas fragmented networks, unsafe crossings, poor maintenance, and environmental discomfort may restrict them despite favourable attitudes [18,33]. Institutional and policy influences—including planning systems, investment, regulation, enforcement, governance, and educational programmes—operate directly through interventions and indirectly by shaping infrastructure, land use, safety, and resource allocation.
The perspective’s principal contribution is its multilevel and relational logic. Individual motivation may be reinforced or suppressed by social norms; environmental opportunities may remain unused when safety is perceived negatively; and supportive policies may fail where institutional capacity is insufficient. Active mobility therefore emerges from combinations of conditions rather than any single determinant.
2.1.3. Built Environment–Behaviour Relationship
Built Environment–Behaviour research provides a spatial explanation of active mobility by examining how urban form and environmental characteristics influence travel practices. It is not a single behavioural theory, but an established body of theoretical and empirical research showing that the built environment structures the destinations, routes, distances, risks, and experiences through which mobility occurs [18,34].
Urban form shapes active mobility through interrelated mechanisms of proximity, accessibility, and connectivity. Compact, mixed-use development can shorten distances and place more activities within walking or cycling reach, whereas dispersed, single-use, automobile-oriented patterns can increase distances and reduce the practicality of active modes. Accessibility determines whether employment, education, services, recreation, and social opportunities can be reached; dedicated infrastructure may therefore provide limited capability where relevant destinations remain distant. Connectivity affects route directness, continuity, permeability, and choice: connected networks offer shorter and alternative paths, while barriers, cul-de-sacs, and discontinuous facilities increase effort and restrict movement. Although greater connectivity and continuity are generally associated with more walking and cycling, these relationships vary by trip purpose and urban context and should not be interpreted as deterministic [18,35]. Environmental quality connects spatial provision with lived experience. Traffic conditions, shade, greenery, air quality, maintenance, cleanliness, aesthetics, human scale, and public-realm design influence comfort and attractiveness. A technically connected and accessible network may remain underused if perceived as unsafe, uncomfortable, or unpleasant, whereas well-designed public spaces can improve the experience of movement and engagement with the urban environment [8].
The contribution of this research is therefore twofold: it identifies the spatial mechanisms that make active mobility more or less feasible and demonstrates that objective provision cannot be fully separated from subjective experience. This supports an integrated framework without implying that spatial conditions determine behaviour independently of personal, social, or institutional influences.
2.1.4. Governance and Institutional Perspectives
Built environments and mobility practices are shaped by political and institutional processes. Governance and Institutional Perspectives explain how policies, regulations, organisational arrangements, funding priorities, administrative capacities, and planning decisions create, distribute, implement, and maintain supportive or restrictive conditions for active mobility. Their contribution is therefore not to explain individual mode choice directly, but to account for how mobility environments are produced and sustained [4,36]. Policy provides strategic direction across infrastructure investment, land-use regulation, street design, safety standards, speed management, parking, and integration with wider transport systems. Translating these priorities into sustained action depends on institutional capacity to coordinate sectors, allocate resources, enforce regulations, monitor performance, maintain infrastructure, engage stakeholders, and adapt interventions. Consequently, fragmented responsibilities, limited expertise, and unstable funding can impede implementation despite formally supportive policies.
Regulatory frameworks translate priorities into street-design requirements, accessibility standards, development controls, parking regulations, speed limits, and safety provisions. Coherent and effectively enforced regulations can support active mobility, whereas standards prioritising traffic flow, road capacity, or parking may reproduce automobile-oriented development. Strategic planning is equally necessary because active mobility intersects with transport, land use, public health, environmental policy, social inclusion, climate resilience, and public-space management. Coordinating these sectors and levels of government requires attention not only to technical interventions but also to institutional context, resources, power, legitimacy, and decision-making arrangements [36]. Active mobility is therefore not only a spatial and behavioural phenomenon, but also an outcome of institutional choices and implementation processes.
2.1.5. Synthesis of Theoretical Perspectives
The four perspectives perform distinct but complementary functions. The Capability Approach distinguishes mobility resources from genuine opportunities and realised behaviour [31]; the Socio-Ecological Perspective explains interactions among personal, social, environmental, and institutional influences [28]; Built Environment–Behaviour research identifies the spatial mechanisms enabling or constraining active mobility [18]; and Governance and Institutional Perspectives explain how these conditions are produced, implemented, coordinated, and sustained [36]. Their explanatory domains overlap rather than represent four categories of behaviour or correspond directly to framework dimensions. Together, they establish the need to consider spatial opportunities, lived experiences, and enabling systems within a common analytical structure. Section 2.2 examines the empirical determinants associated with these interrelated conditions.
2.2. Determinants of Active Mobility
Building on the theoretical foundation established in Section 2.1, this section synthesises empirical evidence on the conditions associated with walking, cycling, and related active modes. The evidence spans urban planning, transport, public health, environmental psychology, governance, and smart-mobility research, reflecting the multidimensional character of active mobility. For analytical clarity, the discussion groups determinants according to their primary spatial, experiential and socio-cultural, or institutional and technological influence. These groups overlap and are not treated as isolated or independent causes.
2.2.1. Spatial Determinants
Spatial determinants are the most extensively examined influences on active mobility. Research across transport planning, urban design, and public health associates built-environment characteristics with walking and cycling through their effects on destination access, route availability, travel distance, and network continuity and directness [1,18,33]. These relationships are probabilistic rather than deterministic and vary by mode, trip purpose, population group, and urban context.
Accessibility concerns the ease of reaching destinations and participating in everyday activities. Proximity to employment, education, services, recreation, and social opportunities can shorten journeys and increase the feasibility of active travel, whereas dispersed destinations may constrain it even where pedestrian or cycling infrastructure exists [18,37]. Connectivity concerns network configuration and continuity. Connected streets and paths provide direct routes, alternatives, and permeability, while cul-de-sacs, physical barriers, impermeable plots, and discontinuous facilities increase effort and restrict movement. Intersection density, block structure, route continuity, and network permeability are therefore common indicators of supportive environments [35,38].
Density and land-use diversity influence the proximity and range of available destinations. Higher residential and employment densities can support local services, but density alone is insufficient; empirical evidence shows that pedestrian activity reflects the combined effects of activity distribution, accessibility, land-use mix, development grain, density, and street-network configuration [6,18,39]. Mixed-use environments can place residential, commercial, educational, recreational, and service functions within shorter distances and are generally associated with utilitarian walking. However, relationships depend on the scale of land-use measurement and the relevance of destinations to different users [1,34].
Urban form and public-realm design affect both movement feasibility and journey quality. Compact development, smaller blocks, active frontages, and human-scale streets can strengthen route choice and pedestrian continuity, whereas superblocks, inactive edges, extensive setbacks, and road-dominated environments may weaken them [8,40]. Sidewalks, cycling facilities, crossings, street furniture, landscaping, shade, maintenance, and public-space design further influence convenient and inclusive use. Infrastructure presence alone is insufficient; quality, continuity, accessibility, and integration with surrounding land uses also matter. The resulting perceptions of comfort and attractiveness are experiential responses and therefore also contribute to Human Experience [6,8].
2.2.2. Experiential and Socio-Cultural Determinants
Spatial conditions establish opportunities for movement, but their use depends on how they are perceived, experienced, and socially interpreted. People may respond differently to the same environment because of variations in safety perceptions, comfort, social acceptance, identity, and prior experience. These experiential and socio-cultural influences help explain how objective conditions are translated into confidence, willingness, satisfaction, or avoidance [41].
Personal security concerns the perceived risk of crime, harassment, isolation, or threatening behaviour. Lighting, visibility, natural surveillance, maintenance, activity levels, and the presence of others can influence whether streets and public spaces feel secure. These experiences are unevenly distributed: women, children, older people, people with disabilities, and other potentially vulnerable groups may interpret and use the same setting differently [2,42]. Traffic safety is related but conceptually distinct. Vehicle speed and volume, crossings, junction design, separation from traffic, driver behaviour, and modal conflicts shape both actual collision risk and perceived safety. Although these risks may not correspond, both can discourage participation, particularly where speeds are high or pedestrian and cycling protection is discontinuous [6,9].
Environmental comfort is context-dependent because active travellers are directly exposed to temperature, solar radiation, shade, humidity, wind, air pollution, and noise. Extreme heat or poor air quality may reduce the feasibility and desirability of longer journeys and disproportionately affect health-vulnerable users; thermal conditions are therefore especially important in hot and arid cities [2,22,43]. Broader environmental quality—including greenery, cleanliness, maintenance, visual interest, human scale, aesthetics, and opportunities for rest or interaction—also shapes journey experience. Neglected, polluted, noisy, or monotonous settings may discourage use despite technically adequate infrastructure, demonstrating how physical conditions acquire behavioural significance through comfort and satisfaction [2,8,44].
Socio-cultural influences shape whether walking and cycling are considered normal, desirable, safe, or appropriate. Social norms, cultural expectations, mobility status, gender roles, community values, and transport cultures can support participation or associate active travel with low status, inconvenience, or necessity [1,25]. Trust, social cohesion, neighbourhood interaction, and familiarity may further strengthen security and belonging, while weak cohesion may reduce confidence in local environments [42]. Place attachment adds an emotional and identity-based dimension: familiarity and belonging may encourage local walking, while repeated walking and interaction may themselves strengthen attachment. The relationship is therefore reciprocal rather than unidirectional [45].
2.2.3. Institutional and Technological Determinants
Institutional and technological determinants concern the upstream conditions and supporting tools through which spatial opportunities and positive mobility experiences are created and sustained. Policies, governance arrangements, institutional capacities, funding, and technology are not direct expressions of individual behaviour, but they shape mobility environments and determine whether initiatives extend beyond isolated or temporary interventions. Policy establishes priorities through infrastructure investment, road-space allocation, land-use regulation, speed and parking management, accessibility standards, and active-travel promotion. Evidence suggests that coordinated packages combining infrastructure, regulation, safety, land-use planning, and promotion are more effective than isolated measures [1,6]. Policy documents alone are insufficient without coherence, implementation, and continuity. Institutional capacity determines whether these commitments become sustained action through inter-agency coordination, clear responsibilities, technical expertise, stakeholder engagement, enforcement, maintenance, and performance monitoring. Fragmentation, limited resources, and weak coordination can impede programmes despite supportive intentions [6,36].
Funding determines the scale, continuity, and quality of provision. Capital investment supports new infrastructure, while sustained operational funding is needed for maintenance, safety improvements, monitoring, community programmes, and network expansion. Short-term funding can produce disconnected interventions; stable commitments better support continuous networks and long-term implementation. Funding must therefore be assessed alongside prioritisation, allocation, and institutional capacity, not solely by its amount [6,9]. Technology supports active mobility through user-facing and institutional applications. Journey planning, digital wayfinding, route information, bike-sharing access, safety reporting, feedback, and incentives can assist users, while automated or crowdsourced data, network monitoring, route-use analysis, infrastructure reporting, and decision-support tools can strengthen planning and evaluation. However, evidence of sustained behavioural effects remains mixed and depends on application quality, engagement, motivation, and supportive physical environments [46]. Technology cannot compensate for unsafe, disconnected, or inaccessible settings; its value also depends on data quality, interoperability, digital access, trust, and institutional capacity to translate information into action.
2.2.4. Synthesis of Active Mobility Determinants
The evidence identifies interrelated spatial, experiential, socio-cultural, institutional, and technological determinants. These neither operate independently nor follow a universal causal hierarchy. A connected network may remain unused where destinations are absent or safety is poor; favourable perceptions cannot compensate for limited spatial opportunities; and supportive policies may fail without institutional capacity or sustained funding. Active mobility therefore emerges from mutually conditioning configurations whose relative importance varies across populations, modes, purposes, and urban contexts.
Evidence nevertheless remains dispersed: built-environment research emphasises spatial associations; public-health and behavioural research examines experiential influences; transport-policy research addresses governance and implementation; and technological studies investigate digital interventions and data-driven services [18,27,36]. Relationships among these determinants are not consistently represented within a common assessment structure. This provides the rationale for their integration within the AMM. Section 3 explains the framework-development method, and Section 4 presents the resulting conceptual structure.
3. Research Design and Framework Development
3.1. Research Design and Evidence Synthesis
This study adopted a framework-development design to construct the Active Mobility Matrix (AMM) as a multidimensional structure for organising and assessing active mobility determinants. Such designs are appropriate when the purpose is to synthesise fragmented interdisciplinary knowledge rather than test a specific hypothesis [47]. The methodology combined theoretical perspectives, empirical findings, and comparison of existing assessment approaches across urban design, transport planning, active-travel research, public health, environmental psychology, accessibility, governance, sustainable mobility, and smart mobility.
Evidence was assembled through a purposive interdisciplinary exploration of the conceptual and empirical literature concerning the determinants, assessment, and promotion of walking, cycling, and related active modes. Searches were undertaken using Google Scholar, Scopus, Web of Science, ScienceDirect, and relevant publishers’ websites, and were completed in September 2026. Representative search terms included “active mobility”, “walkability”, “cycling”, and “non-motorised transport”, used individually or in combination with terms concerning health, environmental benefits, transport, determinants, and implementation. Searches were progressively refined to investigate specific factors, indicators, and their operational definitions as the framework developed. The exploration addressed built-environment relationships, walkability and bikeability, safety, environmental quality, socio-cultural influences, policy and governance, and digital technologies. Existing approaches—including Walk Score, Bike Score, PLOS/BLOS, Healthy Streets, TOD, and the 15-Minute City—were examined to identify recurring dimensions and indicators, areas of emphasis, conceptual gaps, and underrepresented determinants. Priority was given to studies published between 2016 and September 2026, while seminal earlier works were retained where they provided continuing theoretical or methodological foundations.
Source selection and interpretation were undertaken by the author. Abstracts and relevant sections of publications were examined to identify their contribution to understanding active-mobility determinants, defining factors and indicators, distinguishing related constructs, or specifying candidate variables and measures. Sources were retained where they informed one or more of these purposes. Relevant definitions, findings, and operational descriptions were assembled in successive working spreadsheets alongside candidate framework components and their references.
Findings were compared across disciplines and approaches to identify recurring determinants and areas of convergence. Conceptually similar determinants were consolidated and grouped according to their functional relationships with active mobility. Comparison of their definitions and, where available, operational descriptions informed decisions about placement within domains and the identification of overlap among factors, indicators, and variables. This process accords with integrative review and conceptual framework-development methods based on synthesis, abstraction, categorisation, and the generation of new conceptual structures from existing knowledge [47,48,49].
The study did not employ a formal systematic-review protocol, seek an exhaustive inventory of all possible indicators, or establish expert or statistical consensus. The retained working versions document sources associated with candidate framework components, but do not constitute a complete search and screening log. Consequently, an exact total of publications examined during the iterative literature exploration cannot be reliably reported. Its purpose was evidence-informed conceptual integration [47,50]. As illustrated in Figure 1, literature exploration and comparison of existing frameworks informed determinant identification and classification, framework refinement, and development of the hierarchical AMM structure. These activities were iterative, with successive working versions supporting reconsideration of component definitions, placement, and overlap. The literature synthesis therefore served both as an evidence base and as a structuring process linking theory, empirical findings, and assessment components.
Figure 1.
Framework-development process used to construct the Active Mobility Matrix. Colours distinguish development activities and the three AMM meta-dimensions; arrows show the progression and integration of development activities.
3.2. Framework Construction
The identified determinants were translated into the AMM through progressive abstraction and categorisation [47,50]. Determinants were first grouped by their primary relationship with active mobility, and conceptually related items were clustered into broader categories. Placement was guided by the meaning of each construct and its primary assessment function, informed by definitions and descriptions in the reviewed literature. Related components were retained separately where they represented distinct aspects of active mobility; a relationship between domains was not, by itself, treated as duplication. Comparison with existing approaches helped identify recurring themes, overlap, and underrepresented areas. Higher-order organising principles then produced three meta-dimensions—Spatial Capability, Human Experience, and System Enablement—representing how active mobility is spatially enabled, experienced, and systemically supported.
Within these meta-dimensions, the categories were organised into seven domains: Network & Connectivity, Urban Characteristics, Safety & Security, Environment & Comfort, Socio-Cultural, Policy & Governance, and Technology & Smart Mobility. Each domain was then developed into factors, indicators, and variables. Factors group related themes; indicators express measurable aspects of those factors; and variables specify the measures through which indicators may be operationalised. This hierarchy translates broad concepts into observable assessment components without implying that universal measures or weights have already been established.
Candidate indicators and variables were assessed according to their relevance to active mobility, recurrence in the literature, cross-context applicability, measurability, and conceptual distinctiveness. These considerations guided qualitative judgements by the author rather than a numerical screening procedure. Conceptually equivalent measures were consolidated to limit duplication and improve coherence. As illustrated in Figure 1, these activities formed an iterative process linking literature and framework exploration, determinant identification and classification, refinement, and development of the AMM’s meta-dimensions, domains, factors, indicators, and variables.
3.3. Refinement and Consolidation
The preliminary hierarchy was iteratively reviewed to clarify concepts, reduce redundancy, and strengthen internal consistency. Relationships among domains, factors, indicators, and variables were repeatedly examined; equivalent items were consolidated within the most conceptually appropriate domain, while unclear, weakly relevant, or substantially duplicated items were removed or merged. Terminology and measurement logic were also standardised. Multiple variables were retained under one indicator only where they represented complementary aspects of the same construct. Refinement distinguished between consolidating equivalent items, clarifying related but distinct constructs, and relocating components to the domain that best represented their primary function. Selected examples of these refinements are summarised in Appendix A, Table A1, based on retained working versions of the matrix.
Cross-domain review examined whether each domain retained a distinct primary function while acknowledging interactions across the framework. Particular attention was given to the boundaries between Network & Connectivity and Urban Characteristics, Safety & Security and Socio-Cultural, and Policy & Governance and Technology & Smart Mobility. For example, Access to Transit and Services was retained within Network & Connectivity to represent access through movement networks and connections to transit. Urban Characteristics addresses the provision, distribution, diversity, and intensity of destinations and urban activities. Accordingly, network distance and service availability within network catchments were distinguished from destination density, land-use diversity, and straight-line proximity to public space. These measures describe related but different attributes; straight-line proximity does not establish the availability of a usable route.
Similarly, physical and perceptual characteristics of the urban setting were distinguished from residents’ emotional attachment and community identity. Monitoring components were also differentiated by function: institutional monitoring practices, reporting, and use of evidence were assigned to Policy & Governance, while automated counting infrastructure and digital platforms were assigned to Technology & Smart Mobility. These distinctions clarify conceptual responsibilities without implying that the domains are independent.
Existing approaches were used as reference points to assess relative coverage and identify over- or underrepresented areas, particularly governance, socio-cultural conditions, and technological enablement; they were not treated as equivalent frameworks or benchmarks of superiority.
A final consistency review examined alignment among the theoretical foundations, three meta-dimensions, seven domains, six functional behavioural conditions, and the factor–indicator–variable hierarchy. The resulting AMM provides a coherent structure for future assessment across different urban contexts. This process establishes conceptual organisation and traceability between evidence and framework components; it does not, by itself, establish empirical validity, universal weights, or expert consensus.
4. Conceptual Framework of the Active Mobility Matrix (AMM)
Building on the theoretical and empirical synthesis in Section 2 and the framework-development method in Section 3, this section presents the conceptual architecture of the Active Mobility Matrix (AMM). It progresses from the framework’s philosophical premises (Section 4.1) and three interrelated meta-dimensions (Section 4.2) to seven assessment domains (Section 4.3), their functional behavioural logic (Section 4.4), and the AMM’s positioning relative to selected assessment and planning approaches (Section 4.5).
4.1. Philosophical Foundation of the AMM
The Active Mobility Matrix adopts a relational understanding of active mobility as human behaviour emerging from interactions among individuals, urban environments, and enabling systems. Walking, cycling, and related modes are therefore not treated merely as transport outcomes or direct responses to infrastructure. They depend on whether people have meaningful opportunities to move, how they experience mobility environments, and whether institutional and technological systems create and sustain supportive conditions.
The complementary perspectives reviewed in Section 2 inform this structure through their respective emphasis on effective opportunities, interacting levels of influence, spatial conditions, and institutional processes [18,28,29,36]. Together, they support four premises. First, active mobility is capability-dependent: effective opportunities matter more than nominal infrastructure provision. Second, it is experience-mediated: spatial conditions are interpreted through safety, comfort, environmental quality, social acceptance, and place experience. Third, it is system-dependent: supportive environments require governance, institutional capacity, resources, and appropriate technologies. Fourth, it is context-sensitive: determinant relevance varies across populations, modes, places, and urban scales.
The AMM consequently treats active mobility as an outcome of interacting enabling and constraining conditions, without assuming that any determinant is sufficient or equally influential across contexts. It distinguishes conceptual organisation from establishing causal or statistical effects. The framework supports assessment and subsequent empirical testing but does not prescribe universal weights or fixed relationships. These premises organise the determinants identified in Section 2 into Spatial Capability, Human Experience, and System Enablement. The three meta-dimensions are an evidence-informed analytical synthesis, not a one-to-one relabelling of the four theoretical perspectives. Capability reasoning and built-environment research primarily inform spatial opportunities; socio-ecological theory connects these opportunities with individual, social, and experiential influences; and governance perspectives explain their institutional support. These contributions overlap across the meta-dimensions rather than establish exclusive theoretical boundaries.
4.2. Conceptual Structure of the AMM
The AMM comprises three interrelated meta-dimensions: Spatial Capability, Human Experience, and System Enablement. They represent, respectively, the spatial conditions that make active movement feasible, the experiences that influence whether those conditions are acceptable and desirable, and the systems that create, maintain, and enhance them.
Spatial Capability concerns the effective physical opportunities provided by the urban environment, including network continuity and connectivity, destination accessibility, land-use organisation, density, and urban form. It does not imply that infrastructure alone determines individual capability; rather, it identifies the spatial conditions through which personal abilities and resources may—or may not—be converted into opportunities for movement. It is therefore an AMM-specific assessment construct, not a direct equivalent of capability in the Capability Approach.
Human Experience concerns how people perceive, interpret, and respond to mobility environments. It encompasses safety, security, environmental quality, comfort, attractiveness, social norms, mobility culture, and relationships with place. Similar spatial opportunities may generate different responses across individuals and population groups; this meta-dimension addresses the experiential and social conditions influencing their use.
System Enablement concerns the policy, governance, institutional, financial, and technological conditions supporting the creation and sustained operation of active mobility environments. It includes policy commitment, interinstitutional coordination, implementation capacity, funding, monitoring, data systems, digital information, and appropriate smart-mobility applications. Its role is cross-cutting, influencing spatial provision, user experience, management, and responsiveness to changing needs.
Although analytically distinct, the meta-dimensions are functionally interdependent. Routes and destinations may remain unused if experienced as unsafe, uncomfortable, or socially unacceptable, while positive attitudes cannot compensate for disconnected routes or inaccessible destinations. Institutional and technological support influences the provision, maintenance, and adaptation of these conditions.
Figure 2 maps Spatial Capability to Network & Connectivity and Urban Characteristics; Human Experience to Safety & Security, Environment & Comfort, and Socio-Cultural; and System Enablement to Policy & Governance and Technology & Smart Mobility. These seven domains form the intermediate level between the meta-dimensions and the factors, indicators, and variables developed in Section 5.
Figure 2.
Conceptual architecture of the Active Mobility Matrix, showing the relationships among its three meta-dimensions, seven domains, and active mobility outcomes.
The architecture is neither a linear sequence nor three independently scored components. It is a relational structure in which domains identify what should be examined, while the factors, indicators, and variables in Section 5 specify how they may be operationalised.
4.3. AMM Domains and Guiding Questions
Table 1 summarises the translation of the three meta-dimensions into seven distinct but interconnected domains and presents the guiding question associated with each. These questions express the domains’ primary analytical purposes and function as heuristic prompts for organising assessment, not as indicators, measurement items, or exhaustive definitions of domain scope.
Table 1.
AMM meta-dimensions, domains, and guiding questions.
The domain boundaries reflect their primary assessment functions. Network & Connectivity addresses usable movement networks, while Urban Characteristics addresses the urban form and distribution of activities that provide opportunities for travel. Safety & Security concerns actual and perceived harm; Environment & Comfort concerns environmental exposure and journey conditions; and Socio-Cultural concerns norms, practices, community relationships, and place attachment. Policy & Governance addresses institutional direction and implementation, while Technology & Smart Mobility addresses the digital tools and services supporting users and management. These distinctions guide classification without implying that the domains operate independently. The seven domains establish the hierarchy through which domains are translated into factors, indicators, and measurable variables in Section 5.
4.4. Behavioural Logic of the AMM
Beyond organising determinants, the AMM proposes a functional behavioural logic for interpreting how its seven domains support active mobility. It comprises six interrelated conditions: Capability, Opportunity, Protection, Experience, Motivation, and Enablement. These are neither behavioural categories nor a rigid temporal sequence or six empirically validated stages. They express the proposed assessment functions of the domains in relation to movement feasibility, destination access, safety, journey experience, willingness, and sustained support.
The terminology partly overlaps with the Capability–Opportunity–Motivation–Behaviour (COM-B) model, which distinguishes individual physical and psychological capability, physical and social opportunity, and reflective and automatic motivation [51]. The AMM uses these terms for a different analytical purpose. Its Capability condition concerns network-based movement feasibility, which relates substantially to physical opportunity in COM-B; its Opportunity condition focuses more narrowly on reachable destinations and purposes for travel. Its Motivation condition addresses selected socio-cultural and habitual influences that overlap with both motivation and social opportunity in COM-B, rather than comprehensively assessing individual motivation. Protection, Experience, and Enablement make safety, environmental experience, and institutional and technological support explicit within the urban assessment structure; they are not presented as influences absent from COM-B or the wider Behaviour Change Wheel. The six conditions therefore provide a domain-linked interpretation of active-mobility environments, rather than a direct extension of COM-B or six independent behavioural mechanisms.
Figure 3 relates the three meta-dimensions and seven domains to these six functions and active mobility outcomes. Spatial Capability contributes primarily through Capability and Opportunity; Human Experience through Protection, Experience, and Motivation; and System Enablement through the institutional and technological foundations that create, maintain, and enhance the other conditions.
Figure 3.
Behavioural logic of the Active Mobility Matrix, linking its meta-dimensions, domains, functional conditions, and active mobility outcomes. Note: The relationships shown are conceptual and primarily indicate assessment functions. They do not represent a validated causal sequence or a direct mapping of COM-B constructs.
Within Spatial Capability, Capability represents the fundamental feasibility of movement and is associated primarily with Network & Connectivity: whether routes are present, continuous, accessible, connected, and usable. It concerns the opportunities afforded by the network rather than a direct measure of an individual’s physical or psychological capacity. Opportunity concerns whether Urban Characteristics—including destination distribution, land-use diversity, density, urban form, and proximity—provide accessible destinations and purposes for movement. A connected network may enable travel, but active mobility remains limited when everyday destinations cannot be reached within reasonable distances.
Within Human Experience, Protection concerns limiting exposure to actual or perceived harm and is represented primarily through Safety & Security, encompassing traffic safety and personal security. Experience, represented through Environment & Comfort, concerns thermal conditions, air and noise quality, comfort, attractiveness, maintenance, and whether a journey is acceptable enough to undertake and repeat. Motivation, represented through Socio-Cultural, concerns how social norms, mobility culture, habits, community support, inclusion, identity, place attachment, and interaction shape willingness to choose active mobility.
Enablement concerns the institutional and technological capacity to establish, coordinate, maintain, monitor, and improve these conditions. Represented jointly through Policy & Governance and Technology & Smart Mobility, it includes policy commitment, funding, organisational capacity, regulation, implementation, data, information systems, and appropriate technologies. Enablement is not a final step; it is an upstream and cross-cutting function influencing the production and long-term sustainability of the other five conditions.
Domain–function relationships are primary rather than exclusive. Network design can affect Capability and Protection; urban characteristics can influence Opportunity and Experience; and governance can shape safety, connectivity, environmental quality, and inclusion. The framework does not assume that the six conditions compensate through a simple additive relationship: strength in one may not overcome a critical deficiency in another. A pleasant public realm cannot repair an interrupted route; a connected route may remain unused if perceived as dangerous; supportive policy may fail without implementation capacity; and digital applications cannot substitute for inaccessible infrastructure.
The contribution of this functional structure is to connect determinant classification with interpretation of the assessment domains: it makes explicit what each domain is intended to support and where related constraints may require coordinated attention. The logic supports assessment and hypothesis development, while the relative importance and relationships of its components require context-specific empirical investigation.
4.5. Positioning the AMM in Relation to Existing Active Mobility Approaches
Active mobility tools and planning approaches serve different purposes and operate at different spatial and analytical scales. Accessibility indices, street- and network-assessment methods, and broader planning concepts should therefore not be treated as equivalent frameworks. Table 2 instead compares their indicative conceptual coverage relative to the seven AMM domains. The illustrative rather than exhaustive selection spans accessibility and mobility indices (Walk Score and Bike Score); street- and network-assessment methods (pedestrian and bicycle level of service and bicycle low traffic stress); and broader approaches (Healthy Streets, the TOD Standard, and the 15-Minute City) [14,15,16,17,19,52,53]. It clarifies differences in scope rather than ranking quality or effectiveness. The AMM row identifies the intended coverage of the proposed framework; the comparison does not establish its originality.
Table 2.
Indicative conceptual coverage of selected active mobility assessment and planning approaches and the proposed AMM.
Table 2 applies three categories: Full indicates explicit, central, and systematic representation of a domain; Partial indicates narrower, indirect, or secondary coverage; and Limited indicates little or no systematic treatment. These ratings concern conceptual scope only, not empirical validity, reliability, practical usefulness, or implementation performance.
Spatial domains receive the most consistent coverage. Walk Score emphasises destination proximity and accessibility, whereas Bike Score incorporates cycling infrastructure, topography, destinations, and connectivity [52,53]. Pedestrian and bicycle level-of-service and low-traffic-stress methods examine route and street conditions, including traffic stress, safety, and comfort, but have narrower spatial and behavioural scope [14,15].
Healthy Streets extends to safety, comfort, environmental quality, accessibility, inclusion, and the social function of streets [16]. The TOD Standard structures land use and transport through its Walk, Cycle, Connect, Transit, Mix, Densify, Compact, and Shift principles [19], while the 15-Minute City foregrounds proximity, diversity, density, and digitalisation [17]. Digitalisation is an explicit component of the latter, including support for service access and shared mobility. Its Partial rating therefore reflects correspondence with the AMM’s particular technology assessment domain, rather than a claim that digitalisation is marginal to the 15-Minute City. These approaches make substantial but differently configured contributions.
The AMM must also be positioned against frameworks that already integrate multiple determinants of active travel. Pikora et al. [20] organised environmental influences on walking and cycling into functional, safety, aesthetic, and destination features. These features overlap substantially with the AMM’s network, urban-characteristic, safety, and environmental domains. The AMM retains these established concerns while placing them within an assessment hierarchy that also explicitly organises socio-cultural influences, institutional support, and technological provision. Its contribution is therefore not the discovery of these environmental determinants.
The PASTA framework integrates behavioural processes, socio-spatial scales, and multiple domains of active-travel determinants, supporting data collection, analysis, and behavioural modelling [21]. It demonstrates that multidimensional integration and attention to relationships across scales are already established. The AMM offers a complementary emphasis on organising urban assessment through a domain–factor–indicator–variable hierarchy. Its functional conditions identify the proposed assessment role of each domain, while the distinctions illustrated in Appendix A, Table A1 clarify boundaries between related constructs.
The AMM’s contribution therefore lies in integration, not replacement. More specifically, it combines a structured catalogue of candidate measures, explicit distinctions between related assessment constructs, and domain-linked functional interpretation within one framework for context-sensitive diagnosis. Its proposed value rests on this combination and its usefulness for selecting and interpreting measures, rather than the number of domains covered. Scientific and practical value depends on clear operational definitions, appropriate and available indicators, contextual adaptability, and empirical examination of reliability and validity. Table 2 therefore positions the AMM conceptually, while later sections develop its operational structure and requirements for future testing.
5. The Active Mobility Matrix (AMM)
Section 5 presents the final structure of the Active Mobility Matrix resulting from the evidence synthesis, hierarchical construction, and iterative refinement described in Section 3. During that process, overlapping constructs were consolidated, domain boundaries clarified, and components reviewed for relevance, measurability, cross-context applicability, and internal consistency. Existing approaches served as comparative reference points rather than benchmarks of superiority, helping identify areas receiving limited attention in conventional assessments, particularly governance, socio-cultural conditions, and technological enablement [47,50].
The resulting AMM comprises three interrelated meta-dimensions, seven domains, and a hierarchy of factors, indicators, and variables. This structure connects the conceptual understanding of active mobility developed in Section 2 and Section 4 with assessment components that can be adapted and tested across urban contexts. Figure 4 summarises the operational architecture of the AMM by linking its three meta-dimensions to seven domains and their constituent factors. Detailed indicators, candidate variables/measures, and supporting references are presented in Table 3, Table 4, Table 5, Table 6, Table 7, Table 8 and Table 9.
Figure 4.
Operational architecture of the Active Mobility Matrix, showing its three meta-dimensions, seven domains, and constituent factors. Note: Sector size and position indicate hierarchical organisation only and do not represent weighting, priority, causal sequence, or relative importance.
Table 3.
Network & Connectivity domain of the Active Mobility Matrix: factors, indicators, candidate variables/measures, and supporting references.
Table 4.
Urban Characteristics domain of the Active Mobility Matrix: factors, indicators, candidate variables/measures, and supporting references.
Table 5.
Safety & Security domain of the Active Mobility Matrix: factors, indicators, candidate variables/measures, and supporting references.
Table 6.
Environment & Comfort domain of the Active Mobility Matrix: factors, indicators, candidate variables/measures, and supporting references.
Table 7.
Socio-Cultural domain of the Active Mobility Matrix: factors, indicators, candidate variables/measures, and supporting references.
Table 8.
Policy & Governance domain of the Active Mobility Matrix: factors, indicators, candidate variables/measures, and supporting references.
Table 9.
Technology & Smart Mobility domain of the Active Mobility Matrix: factors, indicators, candidate variables/measures, and supporting references.
Indicator selection distinguishes broadly applicable assessment concerns from context-dependent measures. Network continuity, destination access, crossing safety, and accessibility provide a broadly relevant starting point, although their operational measures differ between walking, cycling, and other active modes. Measures concerning particular climatic exposures, shared-mobility services, or digital systems require justification according to local conditions and the assessment purpose. Inclusion in the AMM therefore identifies a potentially relevant assessment component rather than a requirement to measure every variable in every application. Selection should consider the evidence supporting its relationship with active mobility, relevance to the population and mode examined, spatial scale, data availability, and overlap with other selected measures.
Across Table 3, Table 4, Table 5, Table 6, Table 7, Table 8 and Table 9, the listed variables represent candidate operational measures rather than universally validated or weighted indicators. They include direct measurements, measures based on published methods, and proposed assessments requiring an explicitly specified protocol. Appendix A, Table A2 clarifies calculation rules and measurement requirements for entries whose interpretation is not sufficiently explicit in the tables, including age-friendly coverage and architectural quality. References supporting a construct’s relevance should be distinguished from references providing an operational measurement method. Their local applicability and measurement performance require examination before comparative use or aggregation. Accordingly, the AMM is offered at this stage as a structured foundation for context-sensitive assessment, not as a universally weighted or already validated index.
Candidate measures are selected according to the assessment context. Percentage measures require an explicitly defined numerator, denominator and assessment boundary. Survey-based scores require specified questionnaire items, response anchors and scoring procedures; where a published instrument is adopted, its original measurement procedure should be followed.
5.1. Network & Connectivity
Network & Connectivity is a foundational domain within Spatial Capability, assessing whether urban environments provide functional networks through which active journeys can occur. Although active mobility is also shaped by experiential, social, institutional, and technological conditions, movement requires routes that allow people to travel efficiently and continuously between origins and destinations. The domain extends beyond the presence of walking and cycling infrastructure to encompass network availability, quality, accessibility, connectivity, continuity, and integration with destinations and public transport. It comprises six factors: Network Infrastructure, Network Connectivity, Network Continuity, Universal Accessibility, Access to Transit and Services, and Wayfinding and Legibility. Access to Transit and Services concerns network reach and multimodal integration rather than land-use distribution, while Wayfinding and Legibility is included because of its primary role in enabling spatial navigation. Table 3 presents the domain’s operational structure, translating these six factors into indicators and candidate variables supported by the literature.
Together, these components assess whether active-mobility networks are available, usable, connected, continuous, universally accessible, integrated with transit and services, and legible. They operationalise the AMM’s Capability function and establish the network component of Spatial Capability, complemented by Urban Characteristics.
5.2. Urban Characteristics
Urban Characteristics is the second domain within Spatial Capability. Whereas Network & Connectivity assesses the availability, continuity, and reach of movement networks, Urban Characteristics examines the surrounding spatial context: the intensity and distribution of development and destinations, built-form qualities, public-space provision, and patterns of urban activity. The domain therefore addresses whether urban structure provides proximate destinations and supportive settings for active travel.
Within the AMM, the domain focuses primarily on observable spatial, morphological, functional, and activity-related conditions. It comprises six factors: Density & Intensity, Land-Use Diversity, Human Scale & Spatial Enclosure, Visual Character & Spatial Imageability, Public Space Provision & Proximity, and Urban Vitality. Destination density and diversity are treated as characteristics of urban distribution, whereas network-based reach is assessed under Network & Connectivity. Resident-reported attachment, identity, uniqueness, and belonging are addressed under Socio-Cultural. Table 4 presents the factors, indicators, candidate variables, and supporting references through which the domain is operationalised.
Together, these components assess how development intensity, land-use diversity, human-scale form, visual character, public-space provision, and urban vitality shape opportunities and destinations for active mobility. They operationalise the AMM’s Opportunity function, complement Network & Connectivity, and complete the operational basis of Spatial Capability.
5.3. Safety & Security
Safety & Security is the first domain within Human Experience and corresponds primarily to the AMM’s Protection function. It assesses whether active travel can occur without unacceptable exposure to traffic danger, crime-related risks, or perceived insecurity. Connected and accessible routes may remain unused when people do not feel sufficiently protected; the domain therefore addresses both measurable environmental conditions and subjective perceptions of safety and security. To preserve conceptual clarity, the domain distinguishes Personal Security from Traffic Safety. Personal Security addresses perceived exposure to crime and the environmental conditions influencing confidence in public space, while Traffic Safety covers speed, crossings, traffic-calming provision, and conflict risk. Surveillance & Emergency Support captures formal monitoring, security presence, and emergency-response provision. These measures should be interpreted jointly: protective infrastructure or surveillance coverage does not, by itself, demonstrate that an environment is safe or experienced as secure. Table 5 presents the domain’s three factors, indicators, candidate variables, and supporting references.
Together, these components assess the objective and perceived conditions affecting protection from traffic danger, crime-related risks, and insecurity. They operationalise the AMM’s Protection function and establish the safety component of Human Experience.
5.4. Environment & Comfort
Environment & Comfort is the second domain within Human Experience and corresponds primarily to the AMM’s Experience function. It assesses whether climatic exposure, environmental quality, natural elements, amenities, and public-realm upkeep make active journeys sufficiently healthy, comfortable, and pleasant to undertake and repeat. Connected and safe routes may remain unattractive or unusable when heat, pollution, noise, inadequate rest facilities, or poor environmental conditions create excessive discomfort. The domain comprises five factors: Thermal Comfort, Air & Acoustic Quality, Green Infrastructure & Natural Environment, Amenities & Rest Opportunities, and Environmental Upkeep. It focuses on environmental conditions affecting lived experience rather than network availability or traffic and personal safety. Green-space and amenity measures express environmental exposure, provision, and proximity, while route connectivity and universal accessibility remain within Network & Connectivity. Environmental Upkeep concerns the cleanliness and condition of public-realm amenities; structural defects affecting route usability are assessed under Network Infrastructure. Table 6 presents the domain’s operational structure, translating the five factors into indicators and candidate variables supported by the literature.
Together, these components assess how thermal exposure, air and acoustic quality, green infrastructure, supporting amenities, and public-realm upkeep shape the comfort and acceptability of active journeys. They operationalise the AMM’s Experience function within Human Experience, complementing the protective and motivational conditions assessed by Safety & Security and Socio-Cultural.
5.5. Socio-Cultural
Socio-Cultural is the third domain within Human Experience and corresponds primarily to Motivation in the AMM’s functional logic. It captures the social, cultural, behavioural, and place-based conditions that influence whether active mobility is regarded as normal, supported, and meaningful. Supportive infrastructure may create opportunities for movement, but social expectations, established routines, community relationships, and emotional connections to place affect whether walking and cycling become accepted and sustained practices.
The domain comprises four factors. Mobility Culture & Social Norms addresses the social acceptance of active travel and perceived community support. Mobility Habits & Practices concerns the automaticity of mode choice and the extent to which active travel is embedded in recurring daily journeys. Community Cohesion & Social Capital captures neighbourhood trust, connectedness, interaction, and civic engagement. Place Attachment & Community Identity addresses affective bonds, local identity, pride, and belonging. Table 7 translates these factors into candidate indicators and variables. Because these conditions may influence active mobility and be reinforced by it, their relationships should be interpreted as potentially reciprocal rather than inherently one-directional.
Together, these components assess how mobility culture, habitual practices, community cohesion, and place-based attachment shape willingness to adopt and sustain active mobility. They operationalise the AMM’s Motivation function and, alongside Safety & Security and Environment & Comfort, complete the operational basis of Human Experience.
5.6. Policy & Governance
Policy & Governance is the first domain within System Enablement and represents the institutional capacity to prioritise, coordinate, finance, implement, and sustain active mobility. Sustaining spatial opportunities and positive mobility experiences beyond isolated projects requires supportive policy systems. The domain therefore addresses the upstream conditions through which active-mobility environments and programmes are planned, delivered, monitored, and improved.
The domain comprises six factors. Policy Framework assesses whether active mobility is formally adopted and integrated with land-use and transport policy. Strategic Vision & Targets examines measurable mode-share and safety commitments. Governance & Institutional Capacity addresses organisational responsibility, staffing, and inter-agency coordination. Funding & Implementation evaluates financial commitment, budget execution, and delivery. Programmatic & Participatory Support covers promotional, incentive, and public-engagement mechanisms. Monitoring, Evaluation & Transparency assesses whether performance is systematically measured and reported, relevant data are publicly accessible, and findings inform policy review. Table 8 translates these factors into indicators and candidate variables/measures.
Together, these components assess whether active mobility is institutionally prioritised, coordinated, financed, implemented, monitored, and publicly accountable. They operationalise the institutional component of the AMM’s cross-cutting Enablement function and establish the governance component of System Enablement, complemented by Technology & Smart Mobility.
5.7. Technology & Smart Mobility
Technology & Smart Mobility is the second domain within System Enablement and concerns the digital systems, intelligent infrastructure, and integrated services that can support active mobility users and institutions. Its role is enabling rather than substitutive: technology may improve information, navigation, safety, participation, monitoring, and multimodal integration, but it cannot compensate for disconnected networks, inaccessible destinations, or unsafe physical environments. The domain comprises five factors. Mobility Information & Navigation addresses real-time information, route guidance, and digital displays. Digital Participation & User Support covers applications, feedback channels, and inclusive access to digital services. Intelligent Safety Systems examines detection, warning, and responsive-crossing technologies. Shared & Integrated Mobility Services addresses eligible active or physically assisted shared modes and their integration with public transport and MaaS platforms. Digital Monitoring & Planning Support captures automated data collection, dashboards, and decision-support systems. Table 9 presents the corresponding candidate indicators and measures.
Together, these components assess how digital information, participation platforms, intelligent safety systems, shared and integrated services, and monitoring technologies support active-mobility users and institutions. They operationalise the technological component of the AMM’s cross-cutting Enablement function, complement Policy & Governance, and complete the operational basis of System Enablement.
5.8. Synthesis of the Active Mobility Matrix
As summarised in Figure 4, the Active Mobility Matrix integrates active-mobility determinants within three interrelated meta-dimensions. Spatial Capability comprises Network & Connectivity and Urban Characteristics; Human Experience encompasses Safety & Security, Environment & Comfort, and Socio-Cultural; and System Enablement comprises Policy & Governance and Technology & Smart Mobility. Together, these seven domains represent the spatial opportunities, lived experiences, and institutional and technological conditions through which active mobility is enabled, experienced, and sustained. The AMM connects these meta-dimensions to domains, factors, indicators, and candidate variables through six functional conditions: Capability, Opportunity, Protection, Experience, Motivation, and Enablement. This hierarchy translates interdisciplinary evidence into a structured basis for context-sensitive assessment while recognising that domains interact rather than operate independently or through a universal linear sequence. The candidate measures therefore require context-specific definition, data specification, and empirical testing before aggregation or comparative application.
The AMM’s principal contribution lies in integration. Whereas selected established approaches emphasise particular aspects of accessibility, cycling conditions, street quality, or neighbourhood proximity, the AMM brings spatial, experiential, socio-cultural, governance, and technological determinants into a common analytical structure [12,16,17,52]. It can therefore support integrated diagnosis, indicator selection, planning, and policy development, while comparative benchmarking will require subsequent operationalisation and validation. The following section discusses the framework’s theoretical contributions, practical implications, limitations, and future research directions.
6. Discussion
The AMM responds to the fragmentation of active-mobility research by organising spatial, experiential, institutional, and technological determinants within a common conceptual and operational structure. This section discusses its theoretical contribution, its position relative to existing approaches, its potential practical applications, and the limitations that must guide its interpretation. Because the AMM remains a framework for subsequent application and testing, the claims made here concern conceptual integration and prospective analytical utility rather than demonstrated causal or predictive performance.
6.1. Theoretical Contributions of the AMM
The principal theoretical contribution of the AMM lies in conceptualising active mobility as a relational phenomenon emerging from interactions among people, urban environments, and enabling systems. It brings together complementary insights concerning genuine opportunities to access valued activities [27,31], interacting individual and environmental influences [28], spatial conditions for movement [18], and institutional implementation [36]. The AMM treats these perspectives as complementary lenses rather than competing theories or directly corresponding framework categories. The three meta-dimensions described in Section 4 connect individual mobility opportunities with their spatial and systemic contexts without assuming that any dimension independently determines behaviour.
The six functional conditions discussed in Section 4.4 clarify the principal roles performed by the seven domains. These conditions are interactive rather than sequential stages or validated causal mechanisms. Connected routes may remain ineffective without accessible destinations, protection, or acceptable experience; favourable attitudes cannot compensate for absent infrastructure. Enablement is therefore an upstream and cross-cutting function rather than the final stage of a behavioural sequence. A further contribution is the hierarchy connecting meta-dimensions, domains, factors, indicators, and candidate variables. This structure provides a transparent pathway from theoretical abstraction to prospective measurement, consistent with conceptual-framework methodologies emphasising synthesis, categorisation, and operational clarity [47,50]. It does not establish that the proposed variables are universally valid or that the relationships among them are fixed. Rather, it provides an organised foundation through which those propositions can be examined empirically.
6.2. Framework Innovation and Comparison with Existing Approaches
The AMM should be positioned relative to existing approaches according to differences in purpose and scope rather than as a universally superior alternative. As discussed in Section 4.5 and Table 2, existing frameworks, specialised assessment tools, and planning approaches make substantial but differently configured contributions and should not be expected to fulfil identical assessment functions. Within this landscape, the AMM’s contribution lies primarily in organising complementary determinants within an explicit hierarchy linking conceptual dimensions to candidate measures. It is therefore intended as a bridging framework through which established determinants and existing measures can be organised, rather than as a replacement for specialised tools.
The operational tables clarify cross-domain boundaries, as illustrated by the refinement examples in Appendix A. Walking and cycling frequency and active-mode share remain outcome or validation measures rather than scored socio-cultural determinants, while pedestrian volume and public-space occupancy are treated as contextual vitality measures when included under Urban Characteristics. These distinctions help limit circular assessment. The hierarchy also allows candidate measures to be adapted to different modes, scales, data environments, and policy questions while retaining a stable conceptual architecture. However, flexibility should not be confused with immediate comparability. The AMM is not yet a standardised index, and its Full coverage across the seven domains in Table 2 reflects its intended scope rather than demonstrated measurement performance. Its added value must ultimately be assessed through the reliability, validity, feasibility, and explanatory usefulness of its operational components.
6.3. Practical Implications for Planning, Policy, and Assessment
At its present stage, the AMM’s most defensible practical use is as a diagnostic and indicator-selection framework. Spatial Capability can help planners examine whether network provision, continuity, universal accessibility, destination distribution, urban form, and public-space conditions create meaningful opportunities for active travel. Human Experience directs attention to whether those opportunities are experienced as safe, comfortable, socially supported, and place-responsive. System Enablement enables institutions to examine whether policy commitment, coordination, funding, implementation, monitoring, digital services, and data systems can create and sustain the required conditions. This multidimensional diagnosis can reveal why infrastructure provision alone may not produce the intended mobility response. The framework may also support coordination across urban planning, transport, public health, environmental management, and municipal governance. Spatial indicators can inform network and land-use interventions [18], while governance indicators can expose gaps between formal policy commitments and delivery capacity [36]. Environmental and experiential measures can connect mobility planning with public-health, climate, and quality-of-life objectives [2]. The six functional conditions can assist practitioners in formulating diagnostic questions, although they should not be used to infer causal barriers without supporting empirical evidence.
The AMM retains its seven-domain structure across route, neighbourhood, and city applications. The scale of an assessment does not restrict the relevance of particular domains; rather, it determines how their indicators are observed and interpreted. Each application should identify its assessment boundary, travel modes, population groups, and purpose before selecting measures. A distinction is necessary between the primary assessment unit and the scale at which supporting evidence is available. Local infrastructure conditions may be measured directly, while policies, institutional capacity, or funding arrangements affecting the same location may operate at municipal or wider scales. Table 10 illustrates how evidence at different scales contributes to AMM assessments and provides examples of selecting measures, identifying data requirements, and interpreting findings from Table 3, Table 4, Table 5, Table 6, Table 7, Table 8 and Table 9.
Table 10.
Illustrative assessment scales and application of selected AMM measures.
Where several assessed locations share the same municipal policy or budget, that information should be identified as a shared contextual condition rather than treated as an independent local observation. Local variation in implementation should be assessed separately where evidence permits. Similarly, summaries of street-level observations should state their sampling coverage and aggregation basis rather than imply that all parts of a neighbourhood or city were observed.
A comprehensive application examines all seven domains through context-relevant indicators and suitable measures, while documenting any gaps in coverage. It does not necessarily require every candidate variable, since some provide alternative measures of the same indicator or apply only to particular modes and settings. Researchers may undertake focused applications addressing selected domains or factors, or partial applications constrained by data availability, provided that their scope and exclusions are explicit. Missing data leave a relevant component unassessed; they do not indicate satisfactory performance or remove that component from the conceptual framework.
Mode and population differences also guide operationalisation. Walking and cycling may require different network definitions, catchment distances, infrastructure criteria, and safety measures. Accessibility requirements, environmental exposure, and reported experiences should be examined for the population groups relevant to the assessment, with disaggregated results where feasible. Contextual adaptation therefore concerns the selection and interpretation of measures while retaining the AMM’s overall assessment structure.
For monitoring applications, the hierarchy provides a basis for selecting locally relevant measures, documenting data sources, and establishing baseline conditions. Comparative assessment, benchmarking, or composite-index development would require a further stage in which definitions, denominators, spatial and temporal units, thresholds, missing-data procedures, and aggregation rules are standardised and validated. Until then, domain profiles or dashboards may be more defensible than a single composite score, particularly because strong performance in one condition may not compensate for a critical deficiency in another.
6.4. Strengths, Limitations, and Future Research
The AMM’s main strengths are its interdisciplinary foundation, explicit conceptual hierarchy, integration of objective and perceived conditions, and inclusion of socio-cultural, governance, and technological determinants. Its three meta-dimensions and seven domains provide sufficient breadth to represent active mobility as a socio-spatial and system-enabled phenomenon, while the functional logic makes relationships among the domains explicit. The refined domain boundaries further improve conceptual consistency and reduce avoidable duplication. These strengths must be interpreted in relation to the study’s methodology. The AMM was developed through interdisciplinary literature exploration, conceptual synthesis, and comparison with selected existing approaches rather than through a formal systematic review, meta-analysis, Delphi process, or expert-consensus study. The evidence base was intended to support conceptual integration, not exhaustive retrieval of every determinant or quantitative estimation of effect sizes. Consequently, source selection, disciplinary coverage, and author judgement may have influenced the resulting structure, and the completeness and reproducibility associated with systematic-review protocols should not be claimed.
The framework has also not undergone content, construct, criterion, or predictive validation. The inclusion of a determinant indicates evidence-informed conceptual relevance, not a confirmed causal effect or universal importance. Candidate variables employ different units, spatial scales, data sources, and measurement methods, and some combine objective audits with resident perceptions. Their reliability, sensitivity, feasibility, and susceptibility to collinearity or double-counting remain to be established. The framework also does not assign weights or specify an aggregation model. A simple additive index could conceal critical deficiencies by allowing strong performance in one domain to compensate for failure in another, contrary to the AMM’s interactive logic. Contextual applicability represents a further limitation. The application principles in Section 6.3 distinguish assessment scope from measurement scale, but they do not establish that measures perform equivalently across modes, populations, climates, or institutional settings. Aggregate results may obscure unequal conditions, while missing data may limit domain coverage. The transferability and measurement performance of selected indicators therefore require empirical examination, with assessment scope, exclusions, and relevant population differences reported explicitly. Future research should proceed in stages. First, content validity and domain boundaries should be examined through expert review, practitioner consultation, and engagement with diverse mobility users. Second, pilot applications should test data availability, measurement protocols, inter-rater reliability, internal consistency, and the feasibility of combining objective and perceptual evidence. Third, studies across different cities, modes, purposes, and population groups should examine construct and criterion validity and test the proposed relationships among the three meta-dimensions, six functional conditions, and active-mobility outcomes. Longitudinal and intervention-based designs would be especially valuable for distinguishing association from causal influence.
Only after these stages should weighting and aggregation be developed through approaches such as expert elicitation, multi-criteria analysis, latent-variable methods, or machine learning, accompanied by sensitivity and uncertainty analysis. Integration with GIS, urban analytics, digital twins, and smart-city monitoring systems may subsequently support scenario testing and adaptive assessment, provided that data governance, privacy, interoperability, representativeness, and digital inclusion are addressed. The AMM should therefore be understood as a structured research and assessment foundation whose value depends on transparent operationalisation, context-sensitive application, and progressive empirical validation.
7. Conclusions
This study addressed the fragmented treatment of active-mobility determinants by developing the Active Mobility Matrix (AMM), an interdisciplinary framework integrating spatial, experiential, institutional, and technological conditions. The AMM organises these conditions into three interrelated meta-dimensions—Spatial Capability, Human Experience, and System Enablement—and seven domains linked to factors, indicators, and candidate variables. This hierarchy connects the theoretical understanding of active mobility with a structured foundation for context-sensitive assessment.
The AMM’s principal contribution lies in integration rather than the replacement of established tools. It extends conventional emphasis on infrastructure, accessibility, and urban form by incorporating safety, environmental experience, socio-cultural influences, governance capacity, and technological enablement within a common analytical structure. Its six functional conditions—Capability, Opportunity, Protection, Experience, Motivation, and Enablement—clarify how the domains contribute to active mobility without implying a universal sequence or validated causal model. At its present stage, the framework can support multidimensional diagnosis and indicator selection; applications involving monitoring, comparison, benchmarking, or composite scoring require further operationalisation and validation.
The AMM should therefore be understood as an evidence-informed framework rather than a final, universally weighted assessment model. Future research should establish content and measurement validity, test reliability and relationships across different modes, population groups, scales, and urban contexts, and examine appropriate weighting and aggregation methods. Subject to this progressive validation, the AMM can provide a coherent basis for developing assessment tools and informing integrated planning and policy concerned with accessible, inclusive, healthy, resilient, and sustainable urban mobility.
Funding
This research received no external funding.
Institutional Review Board Statement
Not applicable. This conceptual framework-development study synthesised the published literature and did not involve human participants or animals.
Informed Consent Statement
Not applicable.
Data Availability Statement
No new empirical data were created or analysed in this study. The framework components and supporting sources are presented within the article.
Acknowledgments
During the preparation of this manuscript, the author used ChatGPT-6 (OpenAI) to support drafting, language refinement, and editorial improvement. All AI-assisted content was reviewed, revised, and supervised by the author, who takes full responsibility for the accuracy, integrity, and final content of the manuscript.
Conflicts of Interest
The author declares no conflicts of interest.
Appendix A
Table A1.
Selected examples of framework refinement reconstructed from retained working versions.
- Operational Clarifications for Candidate Measures
For percentage measures in Table 3, Table 4, Table 5, Table 6, Table 7, Table 8 and Table 9, the numerator is the quantity meeting the stated condition and the denominator is the corresponding assessed quantity, expressed on the same basis—for example, network length, surface area, facilities, or respondents. The study boundary, qualifying criteria, and any exclusions must be specified. Missing observations are not treated as zero. Named indices and instruments should be applied using their published methods, with adaptations reported. For route-coverage measures, state the qualifying condition and observation period and count overlapping coverage only once. For equipped facilities, define eligibility before assessment.
Table A2.
Definitions of selected candidate measures requiring additional specification.
References
- Pucher, J.; Buehler, R. Walking and cycling for healthy cities. Built Environ. 2010, 36, 391–414. [Google Scholar] [CrossRef] [Scilit]
- World Health Organization. Global Status Report on Physical Activity 2022; WHO: Geneva, Switzerland, 2022; Available online: https://www.who.int/publications/i/item/9789240059153 (accessed on 18 November 2026).
- World Health Organization. Physical Activity; WHO: Geneva, Switzerland, 2024; Available online: https://www.who.int/news-room/fact-sheets/detail/physical-activity (accessed on 18 November 2026).
- Banister, D. The sustainable mobility paradigm. Transp. Policy 2008, 15, 73–80. [Google Scholar] [CrossRef] [Scilit]
- International Transport Forum. ITF Transport Outlook 2023; OECD Publishing: Paris, France, 2023. [Google Scholar] [CrossRef] [Scilit]
- OECD. Sustainable Accessibility for All; OECD Publishing: Paris, France, 2024. [Google Scholar] [CrossRef] [Scilit]
- United Nations Human Settlements Programme. World Cities Report 2024: Cities and Climate Action; United Nations Human Settlements Programme: Nairobi, Kenya, 2024; Available online: https://unhabitat.org/knowledge/publications/world-cities-report-2024-cities-and-climate-action (accessed on 18 November 2026).
- Gehl, J. Cities for People; Island Press: Washington, DC, USA, 2010. [Google Scholar]
- International Transport Forum. The Safe System Approach in Action; OECD Publishing: Paris, France, 2022. [Google Scholar] [CrossRef] [Scilit]
- Carr, L.J.; Dunsiger, S.I.; Marcus, B.H. Validation of Walk Score for estimating access to walkable amenities. Br. J. Sports Med. 2011, 45, 1144–1148. [Google Scholar] [CrossRef] [Scilit] [PubMed]
- Duncan, D.T.; Aldstadt, J.; Whalen, J.; Melly, S.J.; Gortmaker, S.L. Validation of Walk Score® for estimating neighborhood walkability: An analysis of four US metropolitan areas. Int. J. Environ. Res. Public Health 2011, 8, 4160–4179. [Google Scholar] [CrossRef] [Scilit] [PubMed]
- Winters, M.; Brauer, M.; Setton, E.M.; Teschke, K. Mapping bikeability: A spatial tool to support sustainable travel. Environ. Plan. B Plan. Des. 2013, 40, 865–883. [Google Scholar] [CrossRef] [Scilit]
- Brown, J.A.; Curtin, K.D.; Thomson, M.; Kung, J.Y.; Nykiforuk, C.I.J. Contributions and limitations of Walk Score® in the context of walkability: A scoping review. Environ. Behav. 2023, 55, 468–519. [Google Scholar] [CrossRef] [Scilit]
- Landis, B.W.; Vattikuti, V.R.; Ottenberg, R.M.; McLeod, D.S.; Guttenplan, M. Modeling the roadside walking environment: A pedestrian level of service. Transp. Res. Rec. 2001, 1773, 82–88. [Google Scholar] [CrossRef] [Scilit]
- Mekuria, M.C.; Furth, P.G.; Nixon, H. Low-Stress Bicycling and Network Connectivity; Mineta Transportation Institute: San Jose, CA, USA, 2012; Available online: https://transweb.sjsu.edu/research/Low-Stress-Bicycling-and-Network-Connectivity (accessed on 18 November 2026).
- Transport for London. Healthy Streets for London: Prioritising Walking, Cycling and Public Transport to Create a Healthy City; Transport for London: London, UK, 2017. Available online: https://content.tfl.gov.uk/healthy-streets-for-london.pdf (accessed on 18 November 2026).
- Moreno, C.; Allam, Z.; Chabaud, D.; Gall, C.; Pratlong, F. Introducing the “15-minute city”: Sustainability, resilience and place identity in future post-pandemic cities. Smart Cities 2021, 4, 93–111. [Google Scholar] [CrossRef] [Scilit]
- Ewing, R.; Cervero, R. Travel and the built environment: A meta-analysis. J. Am. Plan. Assoc. 2010, 76, 265–294. [Google Scholar] [CrossRef] [Scilit]
- Institute for Transportation and Development Policy. TOD Standard, 3rd ed.; Institute for Transportation and Development Policy: New York, NY, USA, 2017; Available online: https://itdp.org/publication/tod-standard/ (accessed on 18 November 2026).
- Pikora, T.; Giles-Corti, B.; Bull, F.; Jamrozik, K.; Donovan, R. Developing a framework for assessment of the environmental determinants of walking and cycling. Soc. Sci. Med. 2003, 56, 1693–1703. [Google Scholar] [CrossRef] [Scilit] [PubMed]
- Götschi, T.; de Nazelle, A.; Brand, C.; Gerike, R.; PASTA Consortium. Towards a comprehensive conceptual framework of active travel behavior: A review and synthesis of published frameworks. Curr. Environ. Health Rep. 2017, 4, 286–295. [Google Scholar] [CrossRef] [Scilit] [PubMed]
- Nieuwenhuijsen, M.J. Urban and transport planning, environmental exposures and health—New concepts, methods and tools to improve health in cities. Environ. Health 2016, 15, 38. [Google Scholar] [CrossRef] [Scilit] [PubMed]
- World Health Organization Regional Office for Europe. Walking and Cycling: Latest Evidence to Support Policy-Making and Practice; WHO: Geneva, Switzerland, 2022; Available online: https://www.who.int/europe/publications/i/item/9789289057882 (accessed on 18 November 2026).
- Aldred, R.; Woodcock, J.; Goodman, A. Does more cycling mean more diversity in cycling? Transp. Rev. 2016, 36, 28–44. [Google Scholar] [CrossRef] [Scilit]
- Fishman, E. Cycling as transport. Transp. Rev. 2016, 36, 1–8. [Google Scholar] [CrossRef] [Scilit]
- International Transport Forum. Improving the Quality of Walking and Cycling in Cities: Summary and Conclusions; ITF Roundtable Reports No. 192; OECD Publishing: Paris, France, 2023. [Google Scholar] [CrossRef] [Scilit]
- Pereira, R.H.M.; Schwanen, T.; Banister, D. Distributive justice and equity in transportation. Transp. Rev. 2017, 37, 170–191. [Google Scholar] [CrossRef] [Scilit]
- Sallis, J.F.; Cervero, R.B.; Ascher, W.; Henderson, K.A.; Kraft, M.K.; Kerr, J. An ecological approach to creating active living communities. Annu. Rev. Public Health 2006, 27, 297–322. [Google Scholar] [CrossRef] [Scilit] [PubMed]
- Sen, A. Development as Freedom; Oxford University Press: Oxford, UK, 1999. [Google Scholar]
- Nussbaum, M.C. Creating Capabilities: The Human Development Approach; Harvard University Press: Cambridge, MA, USA, 2011. [Google Scholar]
- Vecchio, G.; Tiznado-Aitken, I.; Hurtubia, R. Transport and equity in Latin America: A critical review of socially oriented accessibility assessments. Transp. Rev. 2020, 40, 354–381. [Google Scholar] [CrossRef] [Scilit]
- Bronfenbrenner, U. The Ecology of Human Development: Experiments by Nature and Design; Harvard University Press: Cambridge, MA, USA, 1979. [Google Scholar]
- Sallis, J.F.; Cerin, E.; Conway, T.L.; Adams, M.A.; Frank, L.D.; Pratt, M.; Salvo, D.; Schipperijn, J.; Smith, G.; Cain, K.L.; et al. Physical activity in relation to urban environments in 14 cities worldwide: A cross-sectional study. Lancet 2016, 387, 2207–2217. [Google Scholar] [CrossRef] [Scilit] [PubMed]
- Handy, S.L.; Boarnet, M.G.; Ewing, R.; Killingsworth, R.E. How the built environment affects physical activity: Views from urban planning. Am. J. Prev. Med. 2002, 23, 64–73. [Google Scholar] [CrossRef] [Scilit] [PubMed]
- Southworth, M. Designing the walkable city. J. Urban Plan. Dev. 2005, 131, 246–257. [Google Scholar] [CrossRef] [Scilit]
- Marsden, G.; Reardon, L. Questions of governance: Rethinking the study of transportation policy. Transp. Res. Part A Policy Pract. 2017, 101, 238–251. [Google Scholar] [CrossRef] [Scilit]
- Pajares, E.; Büttner, B.; Jehle, U.; Nichols, A.; Wulfhorst, G. Accessibility by proximity: Addressing the lack of interactive accessibility instruments for active mobility. J. Transp. Geogr. 2021, 93, 103080. [Google Scholar] [CrossRef] [Scilit]
- Boeing, G. Street network models and indicators for every urban area in the world. Geogr. Anal. 2022, 54, 519–535. [Google Scholar] [CrossRef] [Scilit]
- Kashef, M. The building blocks of walkability: Pedestrian activity in Abu Dhabi city center. Front. Archit. Res. 2022, 11, 203–223. [Google Scholar] [CrossRef] [Scilit]
- Dovey, K.; Pafka, E. What is walkability? The urban DMA. Urban Stud. 2020, 57, 93–108. [Google Scholar] [CrossRef] [Scilit]
- Visvizi, A.; Abdel-Razek, S.A.; Wosiek, R.; Malik, R. Conceptualizing walking and walkability in the smart city through a model composite w2 smart city utility index. Energies 2021, 14, 8193. [Google Scholar] [CrossRef] [Scilit]
- Buffel, T.; Phillipson, C.; Scharf, T. Ageing in urban environments: Developing age-friendly cities. Crit. Soc. Policy 2012, 32, 597–617. [Google Scholar] [CrossRef] [Scilit]
- Shawesh, R.; Mohamed, M. Post-occupancy evaluation of outdoor thermal comfort in hot arid zone. Int. J. Low-Carbon Technol. 2021, 16, 50–60. [Google Scholar] [CrossRef] [Scilit]
- Refaat, A.M.; Ghazoliy, S.; El Samaty, H.S.; Waseef, A.A.E. Integrating humanising aspects into urban design: A comprehensive framework for enhancing quality of life in Jeddah city. Urban Sci. 2024, 8, 172. [Google Scholar] [CrossRef] [Scilit]
- Lewicka, M. Place attachment: How far have we come in the last 40 years? J. Environ. Psychol. 2011, 31, 207–230. [Google Scholar] [CrossRef] [Scilit]
- Siriaporn, N.; de Nazelle, A.; Vuillemin, A. Promoting active transportation through technology: A scoping review of mobile apps for walking and cycling. BMC Public Health 2025, 25, 952. [Google Scholar] [CrossRef] [Scilit] [PubMed]
- Jabareen, Y. Building a conceptual framework: Philosophy, definitions, and procedure. Int. J. Qual. Methods 2009, 8, 49–62. [Google Scholar] [CrossRef] [Scilit]
- Snyder, H. Literature review as a research methodology: An overview and guidelines. J. Bus. Res. 2019, 104, 333–339. [Google Scholar] [CrossRef] [Scilit]
- Torraco, R.J. Writing integrative literature reviews: Guidelines and examples. Hum. Resour. Dev. Rev. 2005, 4, 356–367. [Google Scholar] [CrossRef] [Scilit]
- Ravitch, S.M.; Riggan, M. Reason & Rigor: How Conceptual Frameworks Guide Research, 2nd ed.; SAGE: Thousand Oaks, CA, USA, 2017. [Google Scholar]
- Michie, S.; van Stralen, M.M.; West, R. The behaviour change wheel: A new method for characterising and designing behaviour change interventions. Implement. Sci. 2011, 6, 42. [Google Scholar] [CrossRef] [Scilit] [PubMed]
- Carr, L.J.; Dunsiger, S.I.; Marcus, B.H. Walk Score™ as a global estimate of neighborhood walkability. Am. J. Prev. Med. 2010, 39, 460–463. [Google Scholar] [CrossRef] [Scilit] [PubMed]
- Winters, M.; Teschke, K.; Brauer, M.; Fuller, D. Bike Score®: Associations between urban bikeability and cycling behavior in 24 cities. Int. J. Behav. Nutr. Phys. Act. 2016, 13, 18. [Google Scholar] [CrossRef] [Scilit] [PubMed]
- Handy, S.; Xing, Y.; Buehler, T.J. Factors associated with bicycle ownership and use: A study of six small U.S. cities. Transportation 2010, 37, 967–985. [Google Scholar] [CrossRef] [Scilit]
- Global Designing Cities Initiative; National Association of City Transportation Officials. Global Street Design Guide; Island Press: Washington, DC, USA, 2016; Available online: https://globaldesigningcities.org/publication/global-street-design-guide/ (accessed on 18 November 2026).
- Austroads. Guide to Road Design Part 6A: Paths for Walking and Cycling (Version 2.1). 2021. Available online: https://austroads.gov.au/publications/road-design/agrd06a-17-ed2.1 (accessed on 14 November 2026).
- Institute of Transportation Engineers. Designing Walkable Urban Thoroughfares: A Context Sensitive Approach; Institute of Transportation Engineers: Washington, DC, USA, 2010; Available online: https://nacto.org/docs/usdg/designing_walkable_urban_thoroughfares.pdf (accessed on 18 November 2026).
- Millstein, R.A.; Cain, K.L.; Sallis, J.F.; Conway, T.L.; Geremia, C.; Frank, L.D.; Chapman, J.; Van Dyck, D.; Dipzinski, L.R.; Kerr, J.; et al. Development, scoring, and reliability of the Microscale Audit of Pedestrian Streetscapes (MAPS). BMC Public Health 2013, 13, 403. [Google Scholar] [CrossRef] [Scilit] [PubMed]
- Smith, M.; Hosking, J.; Woodward, A.; Witten, K.; MacMillan, A.; Field, A.; Baas, P.; Mackie, H. Systematic literature review of built environment effects on physical activity and active transport—An update and new findings on health equity. Int. J. Behav. Nutr. Phys. Act. 2017, 14, 158. [Google Scholar] [CrossRef] [Scilit] [PubMed]
- Clifton, K.J.; Smith, A.D.L.; Rodriguez, D. The development and testing of an audit for the pedestrian environment. Landsc. Urban Plan. 2007, 80, 95–110. [Google Scholar] [CrossRef] [Scilit]
- Heinen, E.; Buehler, R. Bicycle parking: A systematic review of scientific literature on parking behaviour, parking preferences, and their influence on cycling and travel behaviour. Transp. Rev. 2019, 39, 630–656. [Google Scholar] [CrossRef] [Scilit]
- Buehler, R.; Dill, J. Bikeway networks: A review of effects on cycling. Transp. Rev. 2016, 36, 9–27. [Google Scholar] [CrossRef] [Scilit]
- Dill, J.; McNeil, N. Four types of cyclists? Examination of typology for better understanding of bicycling behavior and potential. Transp. Res. Rec. J. Transp. Res. Board 2013, 2387, 129–138. [Google Scholar] [CrossRef] [Scilit]
- Frank, L.D.; Schmid, T.L.; Sallis, J.F.; Chapman, J.; Saelens, B.E. Linking objectively measured physical activity with objectively measured urban form: Findings from SMARTRAQ. Am. J. Prev. Med. 2005, 28, 117–125. [Google Scholar] [CrossRef] [Scilit] [PubMed]
- Southworth, M.; Ben-Joseph, E. Streets and the Shaping of Towns and Cities; Island Press: Washington, DC, USA, 2013. [Google Scholar]
- Marshall, S. Streets and Patterns; Routledge: New York, NY, USA, 2005. [Google Scholar]
- Sharmin, S.; Kamruzzaman, M. Meta-analysis of the relationships between space syntax measures and pedestrian movement. Transp. Rev. 2018, 38, 524–550. [Google Scholar] [CrossRef] [Scilit]
- van Nes, A. Spatial configurations and walkability potentials: Measuring urban compactness with space syntax. Sustainability 2021, 13, 5785. [Google Scholar] [CrossRef] [Scilit]
- Hillier, B. Space Is the Machine: A Configurational Theory of Architecture; Cambridge University Press: Cambridge, UK, 1996. [Google Scholar]
- Carmona, M. Public Places, Urban Spaces: The Dimensions of Urban Design, 3rd ed.; Routledge: New York, NY, USA, 2021. [Google Scholar]
- PeopleForBikes Foundation. City Ratings Methodology; PeopleForBikes Foundation: Boulder, CO, USA, 2024; Available online: https://cityratings.peopleforbikes.org/about/methodology (accessed on 18 November 2026).
- Winters, M.; Teschke, K.; Grant, M.; Setton, E.M.; Brauer, M. How far out of the way will we travel? Built environment influences on route selection for bicycle and car travel. Transp. Res. Rec. J. Transp. Res. Board 2010, 2190, 1–10. [Google Scholar] [CrossRef] [Scilit]
- U.S. Access Board. Public Right-of-Way Accessibility Guidelines; U.S. Access Board: Washington, DC, USA, 2023. Available online: https://www.access-board.gov/prowag/ (accessed on 18 November 2026).
- U.S. Department of Justice. 2010 ADA Standards for Accessible Design; U.S. Department of Justice: Washington, DC, USA, 2010. Available online: https://www.ada.gov/law-and-regs/design-standards/2010-stds/ (accessed on 18 November 2026).
- ISO 23599:2019; Assistive Products for Blind and Vision-Impaired Persons—Tactile Walking Surface Indicators. International Organization for Standardization: Geneva, Switzerland, 2019. Available online: https://www.iso.org/standard/76106.html (accessed on 18 November 2026).
- Department for Transport. Inclusive Mobility: A Guide to Best Practice on Access to Pedestrian and Transport Infrastructure; UK Government: London, UK, 2021. Available online: https://www.gov.uk/government/publications/inclusive-mobility-making-transport-accessible-for-passengers-and-pedestrians (accessed on 18 November 2026).
- van Hoof, J.; Marston, H.R. Age-friendly cities and communities: State of the art and future perspectives. Int. J. Environ. Res. Public Health 2021, 18, 1644. [Google Scholar] [CrossRef] [Scilit] [PubMed]
- World Health Organization. Global Age-Friendly Cities: A Guide; WHO: Geneva, Switzerland, 2007; Available online: https://www.who.int/publications/i/item/9789241547307 (accessed on 18 November 2026).
- Federal Highway Administration. Manual on Uniform Traffic Control Devices for Streets and Highways, 11th ed.; U.S. Department of Transportation: Washington, DC, USA, 2023. Available online: https://mutcd.fhwa.dot.gov (accessed on 18 November 2026).
- Boisjoly, G.; El-Geneidy, A.M. The insider: A planners’ perspective on accessibility. J. Transp. Geogr. 2017, 64, 33–43. [Google Scholar] [CrossRef] [Scilit]
- Currie, G. Quantifying spatial gaps in public transport supply based on social needs. J. Transp. Geogr. 2010, 18, 31–41. [Google Scholar] [CrossRef] [Scilit]
- Moura, F.; Cambra, P.; Gonçalves, A.B. Measuring walkability for distinct pedestrian groups with a participatory assessment method: A case study in Lisbon. Landsc. Urban Plan. 2017, 157, 282–296. [Google Scholar] [CrossRef] [Scilit]
- Handy, S.L.; Clifton, K.J. Local shopping as a strategy for reducing automobile travel. Transportation 2001, 28, 317–346. [Google Scholar] [CrossRef] [Scilit]
- Murray, A.T.; Davis, R.; Stimson, R.J.; Ferreira, L. Public transportation access. Transp. Res. Part D Transp. Environ. 1998, 3, 319–328. [Google Scholar] [CrossRef] [Scilit]
- Calori, C.; Vanden-Eynden, D. Signage and Wayfinding Design: A Complete Guide to Creating Environmental Graphic Design Systems, 2nd ed.; Wiley: Hoboken, NJ, USA, 2015. [Google Scholar]
- Arthur, P.; Passini, R. Wayfinding: People, Signs, and Architecture; McGraw-Hill: New York, NY, USA, 1992. [Google Scholar]
- Lynch, K. The Image of the City; MIT Press: Cambridge, MA, USA, 1960. [Google Scholar]
- van Nes, A.; Yamu, C. Introduction to Space Syntax in Urban Studies; Springer: Cham, Switzerland, 2021. [Google Scholar] [CrossRef] [Scilit]
- Frank, L.D.; Sallis, J.F.; Saelens, B.E.; Leary, L.; Cain, K.L.; Conway, T.L.; Hess, P.M. The development of a walkability index: Application to the Neighborhood Quality of Life Study. Br. J. Sports Med. 2010, 44, 924–933. [Google Scholar] [CrossRef] [Scilit] [PubMed]
- Cervero, R.; Kockelman, K. Travel demand and the 3Ds: Density, diversity, and design. Transp. Res. Part D Transp. Environ. 1997, 2, 199–219. [Google Scholar] [CrossRef] [Scilit]
- Fonseca, F.; Ribeiro, P.J.G.; Conticelli, E.; Jabbari, M.; Papageorgiou, G.; Tondelli, S.; Ramos, R.A.R. Built environment attributes and their influence on walkability. Int. J. Sustain. Transp. 2021, 16, 660–679. [Google Scholar] [CrossRef] [Scilit]
- Leslie, E.; Coffee, N.; Frank, L.; Owen, N.; Bauman, A.; Hugo, G. Walkability of local communities: Using geographic information systems to objectively assess relevant environmental attributes. Health Place 2007, 13, 111–122. [Google Scholar] [CrossRef] [Scilit] [PubMed]
- Ewing, R.; Handy, S. Measuring the unmeasurable: Urban design qualities related to walkability. J. Urban Des. 2009, 14, 65–84. [Google Scholar] [CrossRef] [Scilit]
- Long, Y.; Ye, Y. Measuring human-scale urban form and its performance. Landsc. Urban Plan. 2019, 191, 103612. [Google Scholar] [CrossRef] [Scilit] [PubMed]
- Nasar, J.L. Urban design aesthetics: The evaluative qualities of building exteriors. Environ. Behav. 1994, 26, 377–401. [Google Scholar] [CrossRef] [Scilit]
- Ewing, R.; Handy, S.; Brownson, R.C.; Clemente, O.; Winston, E. Identifying and measuring urban design qualities related to walkability. J. Phys. Act. Health 2006, 3, S223–S240. [Google Scholar] [CrossRef] [Scilit] [PubMed]
- Nasar, J.L. The Evaluative Image of the City; SAGE: Thousand Oaks, CA, USA, 1998. [Google Scholar]
- United Nations Educational, Scientific and Cultural Organization. Recommendation on the Historic Urban Landscape; United Nations Educational, Scientific and Cultural Organization: Paris, France, 2011; Available online: https://whc.unesco.org/en/hul/ (accessed on 18 November 2026).
- United Nations Human Settlements Programme. World Cities Report 2020: The Value of Sustainable Urbanization; United Nations Human Settlements Programme: Nairobi, Kenya, 2020; Available online: https://digitallibrary.un.org/record/3905819 (accessed on 14 November 2026).
- World Health Organization Regional Office for Europe. Urban Green Spaces: A Brief for Action; WHO: Geneva, Switzerland, 2017; Available online: https://www.who.int/europe/publications/i/item/9789289052498 (accessed on 18 November 2026).
- Kim, S. Urban vitality, urban form, and land use: Their relations within a geographical boundary for walkers. Sustainability 2020, 12, 10633. [Google Scholar] [CrossRef] [Scilit]
- Jacobs, J. The Death and Life of Great American Cities; Random House: New York, NY, USA, 1961. [Google Scholar]
- Wangzom, D.; White, M.; Paay, J. Perceived safety influencing active travel to school—A built environment perspective. Int. J. Environ. Res. Public Health 2023, 20, 1026. [Google Scholar] [CrossRef] [Scilit] [PubMed]
- Rahm, J.; Sternudd, C.; Johansson, M. “In the evening, I don’t walk in the park”: The interplay between street lighting and greenery in perceived safety. Urban Des. Int. 2021, 26, 42–52. [Google Scholar] [CrossRef] [Scilit]
- Saelens, B.E.; Handy, S.L. Built environment correlates of walking: A review. Med. Sci. Sports Exerc. 2008, 40, S550–S566. [Google Scholar] [CrossRef] [Scilit] [PubMed]
- Piza, E.L.; Welsh, B.C.; Farrington, D.P.; Thomas, A.L. CCTV surveillance for crime prevention: A 40-year systematic review with meta-analysis. Criminol. Public Policy 2019, 18, 135–159. [Google Scholar] [CrossRef] [Scilit]
- Cozens, P.; Love, T. A review and current status of crime prevention through environmental design (CPTED). J. Plan. Lit. 2015, 30, 393–412. [Google Scholar] [CrossRef] [Scilit]
- Commission Internationale de l’Éclairage. Lighting of Roads for Motor and Pedestrian Traffic, 2nd ed.; CIE 115:2010; Commission Internationale de l’Éclairage: Vienna, Austria, 2010. [Google Scholar]
- Trop, T.; Shoshany Tavory, S.; Portnov, B.A. Factors affecting pedestrians’ perceptions of safety, comfort, and pleasantness induced by public space lighting: A systematic literature review. Environ. Behav. 2023, 55, 3–46. [Google Scholar] [CrossRef] [Scilit]
- National Association of City Transportation Officials. Urban Street Design Guide; Island Press: Washington, DC, USA, 2013. [Google Scholar] [CrossRef] [Scilit]
- Federal Highway Administration. PEDSAFE: Pedestrian Safety Guide and Countermeasure Selection System; U.S. Department of Transportation: Washington, DC, USA, 2013. Available online: https://highways.dot.gov/safety/data-analysis-tools/rsdp/rsdp-tools/pedestrian-safety-guide-and-countermeasure-selection (accessed on 14 November 2026).
- Ewing, R.; Dumbaugh, E. The built environment and traffic safety: A review of empirical evidence. J. Plan. Lit. 2009, 23, 347–367. [Google Scholar] [CrossRef] [Scilit]
- Zegeer, C.V.; Stewart, J.R.; Huang, H.H.; Lagerwey, P.A. Safety effects of marked versus unmarked crosswalks at uncontrolled locations: Analysis of pedestrian crashes in 30 cities. Transp. Res. Rec. 2001, 1773, 56–68. [Google Scholar] [CrossRef] [Scilit]
- World Health Organization. Global Status Report on Road Safety 2023; WHO: Geneva, Switzerland, 2023; Available online: https://www.who.int/publications/i/item/9789240086517/ (accessed on 14 November 2026).
- International Transport Forum. Road Safety Annual Report 2024; OECD Publishing: Paris, France, 2024; Available online: https://www.itf-oecd.org/road-safety-annual-report-2024 (accessed on 13 November 2026).
- European Conference of Ministers of Transport. Speed Management; OECD Publishing: Paris, France, 2006. [Google Scholar] [CrossRef] [Scilit]
- Pu, L.; Joshi, R. Surrogate Safety Assessment Model (SSAM): Software User Manual; Report No. FHWA-HRT-08-050; Federal Highway Administration: Washington, DC, USA, 2008. Available online: https://www.fhwa.dot.gov/publications/research/safety/08050/ (accessed on 14 November 2026).
- Hydén, C. The Development of a Method for Traffic Safety Evaluation: The Swedish Traffic Conflicts Technique; Bulletin 70; Department of Traffic Planning and Engineering, Lund University: Lund, Sweden, 1987. [Google Scholar]
- Laureshyn, A.; de Goede, M.; Saunier, N.; Fyhri, A. Cross-comparison of three surrogate safety methods to diagnose cyclist safety problems at intersections in Norway. Accid. Anal. Prev. 2017, 105, 11–20. [Google Scholar] [CrossRef] [Scilit] [PubMed]
- International Transport Forum. Monitoring Progress in Urban Road Safety: 2022 Update; International Transport Forum Policy Papers No. 108; OECD Publishing: Paris, France, 2022. [Google Scholar] [CrossRef] [Scilit]
- Welsh, B.C.; Farrington, D.P. Effects of closed-circuit television surveillance on crime. Campbell Syst. Rev. 2008, 4, 1–73. [Google Scholar] [CrossRef] [Scilit]
- Cozens, P.; Babb, C.; Stefani, D. Exploring and developing crime prevention through environmental design (CPTED) audits: An iterative process. Crime Prev. Community Saf. 2023, 25, 1–19. [Google Scholar] [CrossRef] [Scilit]
- Cozens, P.; Saville, G.; Hillier, D. Crime prevention through environmental design (CPTED): A review and modern bibliography. Prop. Manag. 2005, 23, 328–356. [Google Scholar] [CrossRef] [Scilit]
- ISO 22320:2018; Security and Resilience—Emergency Management—Guidelines for Incident Management. International Organization for Standardization: Geneva, Switzerland, 2018. Available online: https://www.iso.org/standard/67851.html (accessed on 14 November 2026).
- United Nations Office for Disaster Risk Reduction. Principles for Resilient Infrastructure; United Nations Office for Disaster Risk Reduction: Geneva, Switzerland, 2022; Available online: https://www.undrr.org/publication/principles-resilient-infrastructure (accessed on 14 November 2026).
- World Health Organization. WHO Emergency Care System Framework; WHO: Geneva, Switzerland, 2018; Available online: https://www.who.int/publications/i/item/who-emergency-care-system-framework (accessed on 14 November 2026).
- Abuwaer, N.; Ullah, S.; Al-Ghamdi, S.G. Establishing the nexus between urban walkability and thermal comfort in a changing climate. Nat. Cities 2025, 2, 801–811. [Google Scholar] [CrossRef] [Scilit]
- Nasrollahi, N.; Ghosouri, A.; Khodakarami, J.; Taleghani, M. Heat-mitigation strategies to improve pedestrian thermal comfort in urban environments: A review. Sustainability 2020, 12, 10000. [Google Scholar] [CrossRef] [Scilit]
- Potchter, O.; Cohen, P.; Lin, T.-P.; Matzarakis, A. Outdoor human thermal perception in various climates: A comprehensive review of approaches, methods and quantification. Sci. Total Environ. 2018, 631–632, 390–406. [Google Scholar] [CrossRef] [Scilit] [PubMed]
- Oke, T.R. Boundary Layer Climates, 2nd ed.; Routledge: New York, NY, USA, 1987. [Google Scholar]
- Blocken, B.; Stathopoulos, T.; van Beeck, J.P.A.J. Pedestrian-level wind conditions around buildings: Review of wind-tunnel and CFD techniques and their accuracy for wind comfort assessment. Build. Environ. 2016, 100, 50–81. [Google Scholar] [CrossRef] [Scilit]
- Lawson, T.V. Building Aerodynamics; Imperial College Press: London, UK, 2001. [Google Scholar]
- NEN 8100; Wind Comfort and Wind Danger in the Built Environment. Netherlands Standardization Institute: Delft, The Netherlands, 2006.
- World Health Organization. WHO Global Air Quality Guidelines: Particulate Matter (PM2.5 and PM10), Ozone, Nitrogen Dioxide, Sulfur Dioxide and Carbon Monoxide; WHO: Geneva, Switzerland, 2021; Available online: https://www.who.int/publications/i/item/9789240034228 (accessed on 14 November 2026).
- Nieuwenhuijsen, M.J. Urban and transport planning pathways to carbon neutral, liveable and healthy cities: A review of the current evidence. Environ. Int. 2020, 140, 105661. [Google Scholar] [CrossRef] [Scilit] [PubMed]
- Mueller, N.; Rojas-Rueda, D.; Khreis, H.; Cirach, M.; Andrés, D.; Ballester, J.; Bartoll, X.; Daher, C.; Deluca, A.; Echave, C.; et al. Changing the urban design of cities for health: The superblock model. Environ. Int. 2020, 134, 105132. [Google Scholar] [CrossRef] [Scilit] [PubMed]
- World Health Organization Regional Office for Europe. Environmental Noise Guidelines for the European Region; WHO: Geneva, Switzerland, 2018; Available online: https://www.who.int/publications/i/item/9789289053563 (accessed on 14 November 2026).
- Clark, C.; Crumpler, C.; Notley, H. Evidence for environmental noise effects on health for the United Kingdom policy context: A systematic review of the effects of environmental noise on mental health, wellbeing, quality of life, cancer, dementia, birth outcomes, and cognition. Int. J. Environ. Res. Public Health 2020, 17, 393. [Google Scholar] [CrossRef] [Scilit] [PubMed]
- Abhijith, K.V.; Kumar, P.; Gallagher, J.; McNabola, A.; Baldauf, R.; Pilla, F.; Broderick, B.; Di Sabatino, S.; Pulvirenti, B. Air pollution abatement performances of green infrastructure in open road and built-up street canyon environments: A review. Atmos. Environ. 2017, 162, 71–86. [Google Scholar] [CrossRef] [Scilit]
- Van Renterghem, T.; Forssén, J.; Attenborough, K.; Jean, P.; Defrance, J.; Hornikx, M.; Kang, J. Using natural means to reduce surface transport noise during propagation outdoors. Appl. Acoust. 2015, 92, 86–101. [Google Scholar] [CrossRef] [Scilit]
- World Health Organization Regional Office for Europe. Assessing the Value of Urban Green and Blue Spaces for Health and Well-Being; WHO: Geneva, Switzerland, 2023; Available online: https://www.who.int/europe/publications/i/item/WHO-EURO-2023-7508-47275-69347 (accessed on 14 November 2026).
- Ekkel, E.D.; de Vries, S. Nearby green space and human health: Evaluating accessibility metrics. Landsc. Urban Plan. 2017, 157, 214–220. [Google Scholar] [CrossRef] [Scilit]
- Yu, J.; Zhang, H.; Dong, X.; Shen, J. The impact of street greenery on active travel: A narrative systematic review. Front. Public Health 2024, 12, 1337804. [Google Scholar] [CrossRef] [Scilit] [PubMed]
- Ye, Y.; Richards, D.; Lu, Y.; Song, X.; Zhuang, Y.; Zeng, W.; Zhong, T. Measuring daily accessed street greenery: A human-scale approach for informing better urban planning practices. Landsc. Urban Plan. 2019, 191, 103434. [Google Scholar] [CrossRef] [Scilit]
- Lu, Y.; Sarkar, C.; Xiao, Y. The effect of street-level greenery on walking behavior: Evidence from Hong Kong. Soc. Sci. Med. 2018, 208, 41–49. [Google Scholar] [CrossRef] [Scilit] [PubMed]
- Manca, F.; Daina, N.; Sivakumar, A.; Yi, J.W.X.; Zavistas, K.; Gemini, G.; Vegetti, I.; Dargan, L.; Marchet, F. Using digital social market applications to incentivise active travel: Empirical analysis of a smart city initiative. Sustain. Cities Soc. 2022, 77, 103595. [Google Scholar] [CrossRef] [Scilit]
- Makahleh, H.Y.; Taamneh, M.M.; Dissanayake, D. Promoting sustainable transport: A systematic review of walking and cycling adoption using the COM-B model. Future Transp. 2025, 5, 79. [Google Scholar] [CrossRef] [Scilit]
- Ajzen, I. The theory of planned behavior. Organ. Behav. Hum. Decis. Processes 1991, 50, 179–211. [Google Scholar] [CrossRef] [Scilit]
- Guell, C.; Panter, J.; Jones, N.R.; Ogilvie, D. Towards a differentiated understanding of active travel behaviour: Using social theory to explore everyday commuting. Soc. Sci. Med. 2012, 75, 233–239. [Google Scholar] [CrossRef] [Scilit] [PubMed]
- Pentenrieder, M.; Selzer, S.; Lanzendorf, M. Walking versus cycling? Negotiating active travel practices over logics of automobility and productivity during the COVID-19 pandemic. Mobilities 2026, 21, 395–417. [Google Scholar] [CrossRef] [Scilit]
- Verplanken, B.; Orbell, S. Reflections on past behavior: A self-report index of habit strength. J. Appl. Soc. Psychol. 2003, 33, 1313–1330. [Google Scholar] [CrossRef] [Scilit]
- Gardner, B.; Abraham, C.; Lally, P.; de Bruijn, G.-J. Towards parsimony in habit measurement: Testing the convergent and predictive validity of an automaticity subscale of the Self-Report Habit Index. Int. J. Behav. Nutr. Phys. Act. 2012, 9, 102. [Google Scholar] [CrossRef] [Scilit] [PubMed]
- Sampson, R.J.; Raudenbush, S.W.; Earls, F. Neighborhoods and violent crime: A multilevel study of collective efficacy. Science 1997, 277, 918–924. [Google Scholar] [CrossRef] [Scilit] [PubMed]
- Kim, H.; Yang, S. Neighborhood walking and social capital: The correlation between walking experience and individual perception of social capital. Sustainability 2017, 9, 680. [Google Scholar] [CrossRef] [Scilit]
- Kaczynski, A.T.; Glover, T.D. Talking the talk, walking the walk: Examining the effect of neighbourhood walkability and social connectedness on physical activity. J. Public Health 2012, 34, 382–389. [Google Scholar] [CrossRef] [Scilit] [PubMed]
- Gao, Z.; Chee, C.S.; Omar Dev, R.D.; Liu, Y.; Gao, J.; Li, R.; Li, F.; Liu, X.; Wang, T. Social capital and physical activity: A literature review up to March 2024. Front. Public Health 2025, 13, 1467571. [Google Scholar] [CrossRef] [Scilit] [PubMed]
- Moustakas, L.; Wagner, J. Conceptualisation and measurement of social cohesion within the sport and physical activity context: A scoping review. Sports 2023, 11, 231. [Google Scholar] [CrossRef] [Scilit] [PubMed]
- Morales-Flores, P.; Marmolejo-Duarte, C. Can we build walkable environments to support social capital? Towards a spatial understanding of social capital: A scoping review. Sustainability 2021, 13, 13259. [Google Scholar] [CrossRef] [Scilit]
- Ramkissoon, H.; Smith, L.D.G.; Weiler, B. Relationships between place attachment, place satisfaction and pro-environmental behaviour in an Australian national park. J. Sustain. Tour. 2013, 21, 434–457. [Google Scholar] [CrossRef] [Scilit]
- Kamruzzaman, L.; Diemer, M.J.; Currie, G.; Pimenta, A.; De Gruyter, C.; Hopkins, I. Making sense of place: A new framework for place-based research in the transport realm. Transp. Rev. 2025, 45, 573–604. [Google Scholar] [CrossRef] [Scilit]
- Eng, J.; McCormack, G.R. Place attachment and walkability and their associations with walking in urban neighbourhoods. Sci. Rep. 2025, 15, 35474. [Google Scholar] [CrossRef] [Scilit] [PubMed]
- Wood, L.; Frank, L.D.; Giles-Corti, B. Sense of community and its relationship with walking and neighborhood design. Soc. Sci. Med. 2010, 70, 1381–1390. [Google Scholar] [CrossRef] [Scilit] [PubMed]
- Escalera-Reyes, J. Place attachment, feeling of belonging and collective identity in socio-ecological systems: Study case of Pegalajar. Sustainability 2020, 12, 3388. [Google Scholar] [CrossRef] [Scilit]
- European Parliament; Council of the European Union; European Commission. European declaration on cycling (C/2024/2377). Off. J. Eur. Union 2024, C/2024/2377, 3 April 2024. Available online: http://data.europa.eu/eli/C/2024/2377/oj (accessed on 18 November 2026).
- United Nations Human Settlements Programme. Planning and Design for Sustainable Urban Mobility: Global Report on Human Settlements 2013; United Nations Human Settlements Programme: Nairobi, Kenya, 2013; Available online: https://unhabitat.org/planning-and-design-for-sustainable-urban-mobility-global-report-on-human-settlements-2013 (accessed on 18 November 2026).
- Johansson, R. Vision Zero: Implementing a policy for traffic safety. Saf. Sci. 2009, 47, 826–831. [Google Scholar] [CrossRef] [Scilit]
- Semler, C.; Vest, A.; Kingsley, K.; Mah, S.; Kittelson, W.; Sundstrom, C.; Brookshire, K. Guidebook for Developing Pedestrian and Bicycle Performance Measures; Report No. FHWA-HEP-16-037; Federal Highway Administration: Washington, DC, USA, 2016. Available online: https://www.fhwa.dot.gov/environment/bicycle_pedestrian/publications/performance_measures_guidebook/ (accessed on 14 November 2026).
- Götschi, T.; Garrard, J.; Giles-Corti, B. Cycling as a part of daily life: A review of health perspectives. Transp. Rev. 2016, 36, 45–71. [Google Scholar] [CrossRef] [Scilit]
- Arnstein, S.R. A ladder of citizen participation. J. Am. Inst. Plan. 1969, 35, 216–224. [Google Scholar] [CrossRef] [Scilit]
- European Commission. Creating a Common European Mobility Data Space; Directorate-General for Mobility and Transport: Brussels, Belgium, 2023; Available online: https://transport.ec.europa.eu/transport-themes/smart-mobility/creating-common-european-mobility-data-space_en (accessed on 18 November 2026).
- United Nations Economic Commission for Europe. Intelligent Transport Systems (ITS) for Sustainable Mobility, 2nd ed.; United Nations: New York, NY, USA, 2024. [Google Scholar] [CrossRef] [Scilit]
- Litman, T. Introduction to Multi-Modal Transportation Planning: Principles and Practices; Victoria Transport Policy Institute: Victoria, BC, Canada, 2024; Available online: https://www.vtpi.org/multimodal_planning.pdf (accessed on 14 November 2026).
- Marques, D.L.; Coelho, M.C. A literature review of emerging research needs for micromobility—Integration through a life cycle thinking approach. Future Transp. 2022, 2, 135–164. [Google Scholar] [CrossRef] [Scilit]
- Shaheen, S.; Cohen, A. Shared Micromobility Policy Toolkit: Docked and Dockless Bike and Scooter Sharing; Report No. FHWA-HOP-19-039; Federal Highway Administration: Washington, DC, USA, 2019. Available online: https://escholarship.org/uc/item/00k897b5 (accessed on 13 November 2026).
- Gössling, S. Integrating e-scooters in urban transportation: Problems, policies, and the prospect of system change. Transp. Res. Part D Transp. Environ. 2020, 79, 102230. [Google Scholar] [CrossRef] [Scilit]
- Hietanen, S. Mobility as a Service—The new transport model? Eurotransport 2014, 12, 2–4. [Google Scholar]
- International Transport Forum. Integrating Public Transport into Mobility as a Service; OECD Publishing: Paris, France, 2021. [Google Scholar] [CrossRef] [Scilit]
- Goulding, R.; Kamargianni, M. The Mobility as a Service Maturity Index: Preparing the cities for the Mobility as a Service era. In Proceedings of the 7th Transport Research Arena (TRA 2018), Vienna, Austria, 16–19 April 2018; Available online: https://discovery.ucl.ac.uk/id/eprint/10063087/1/Contribution_10902_fullpaper.pdf (accessed on 13 November 2026).
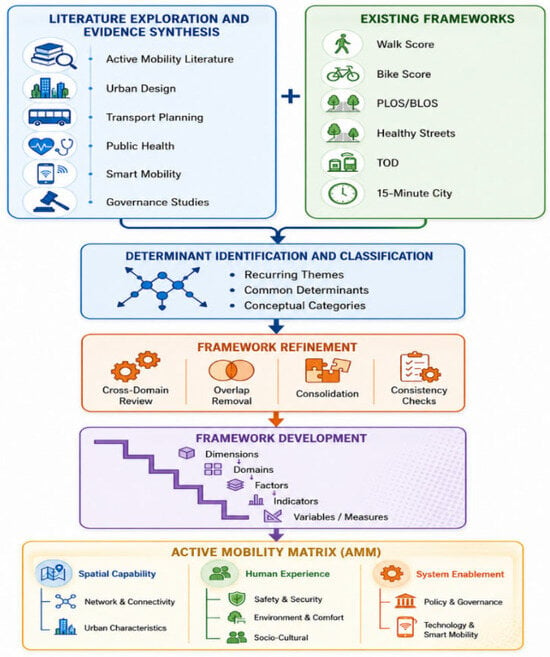
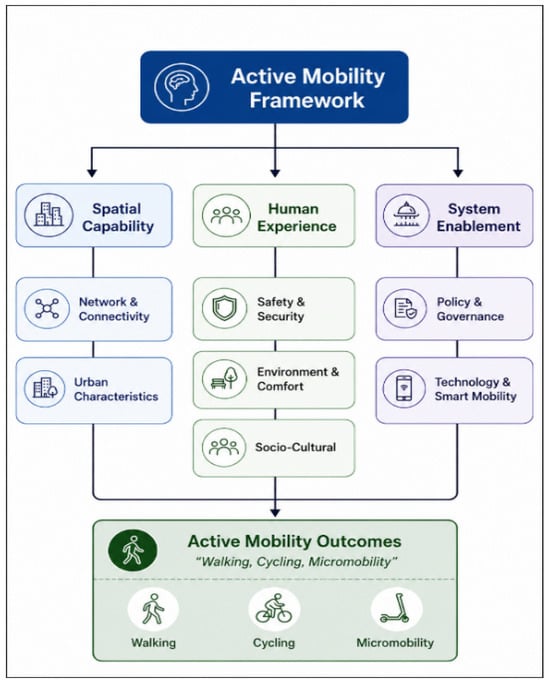
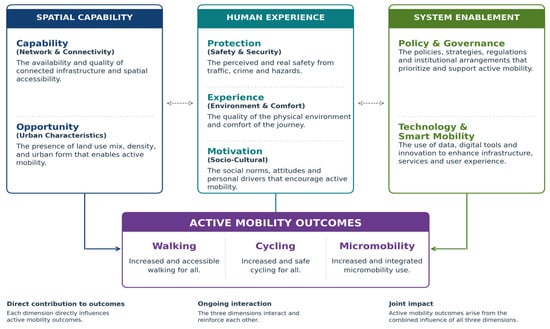
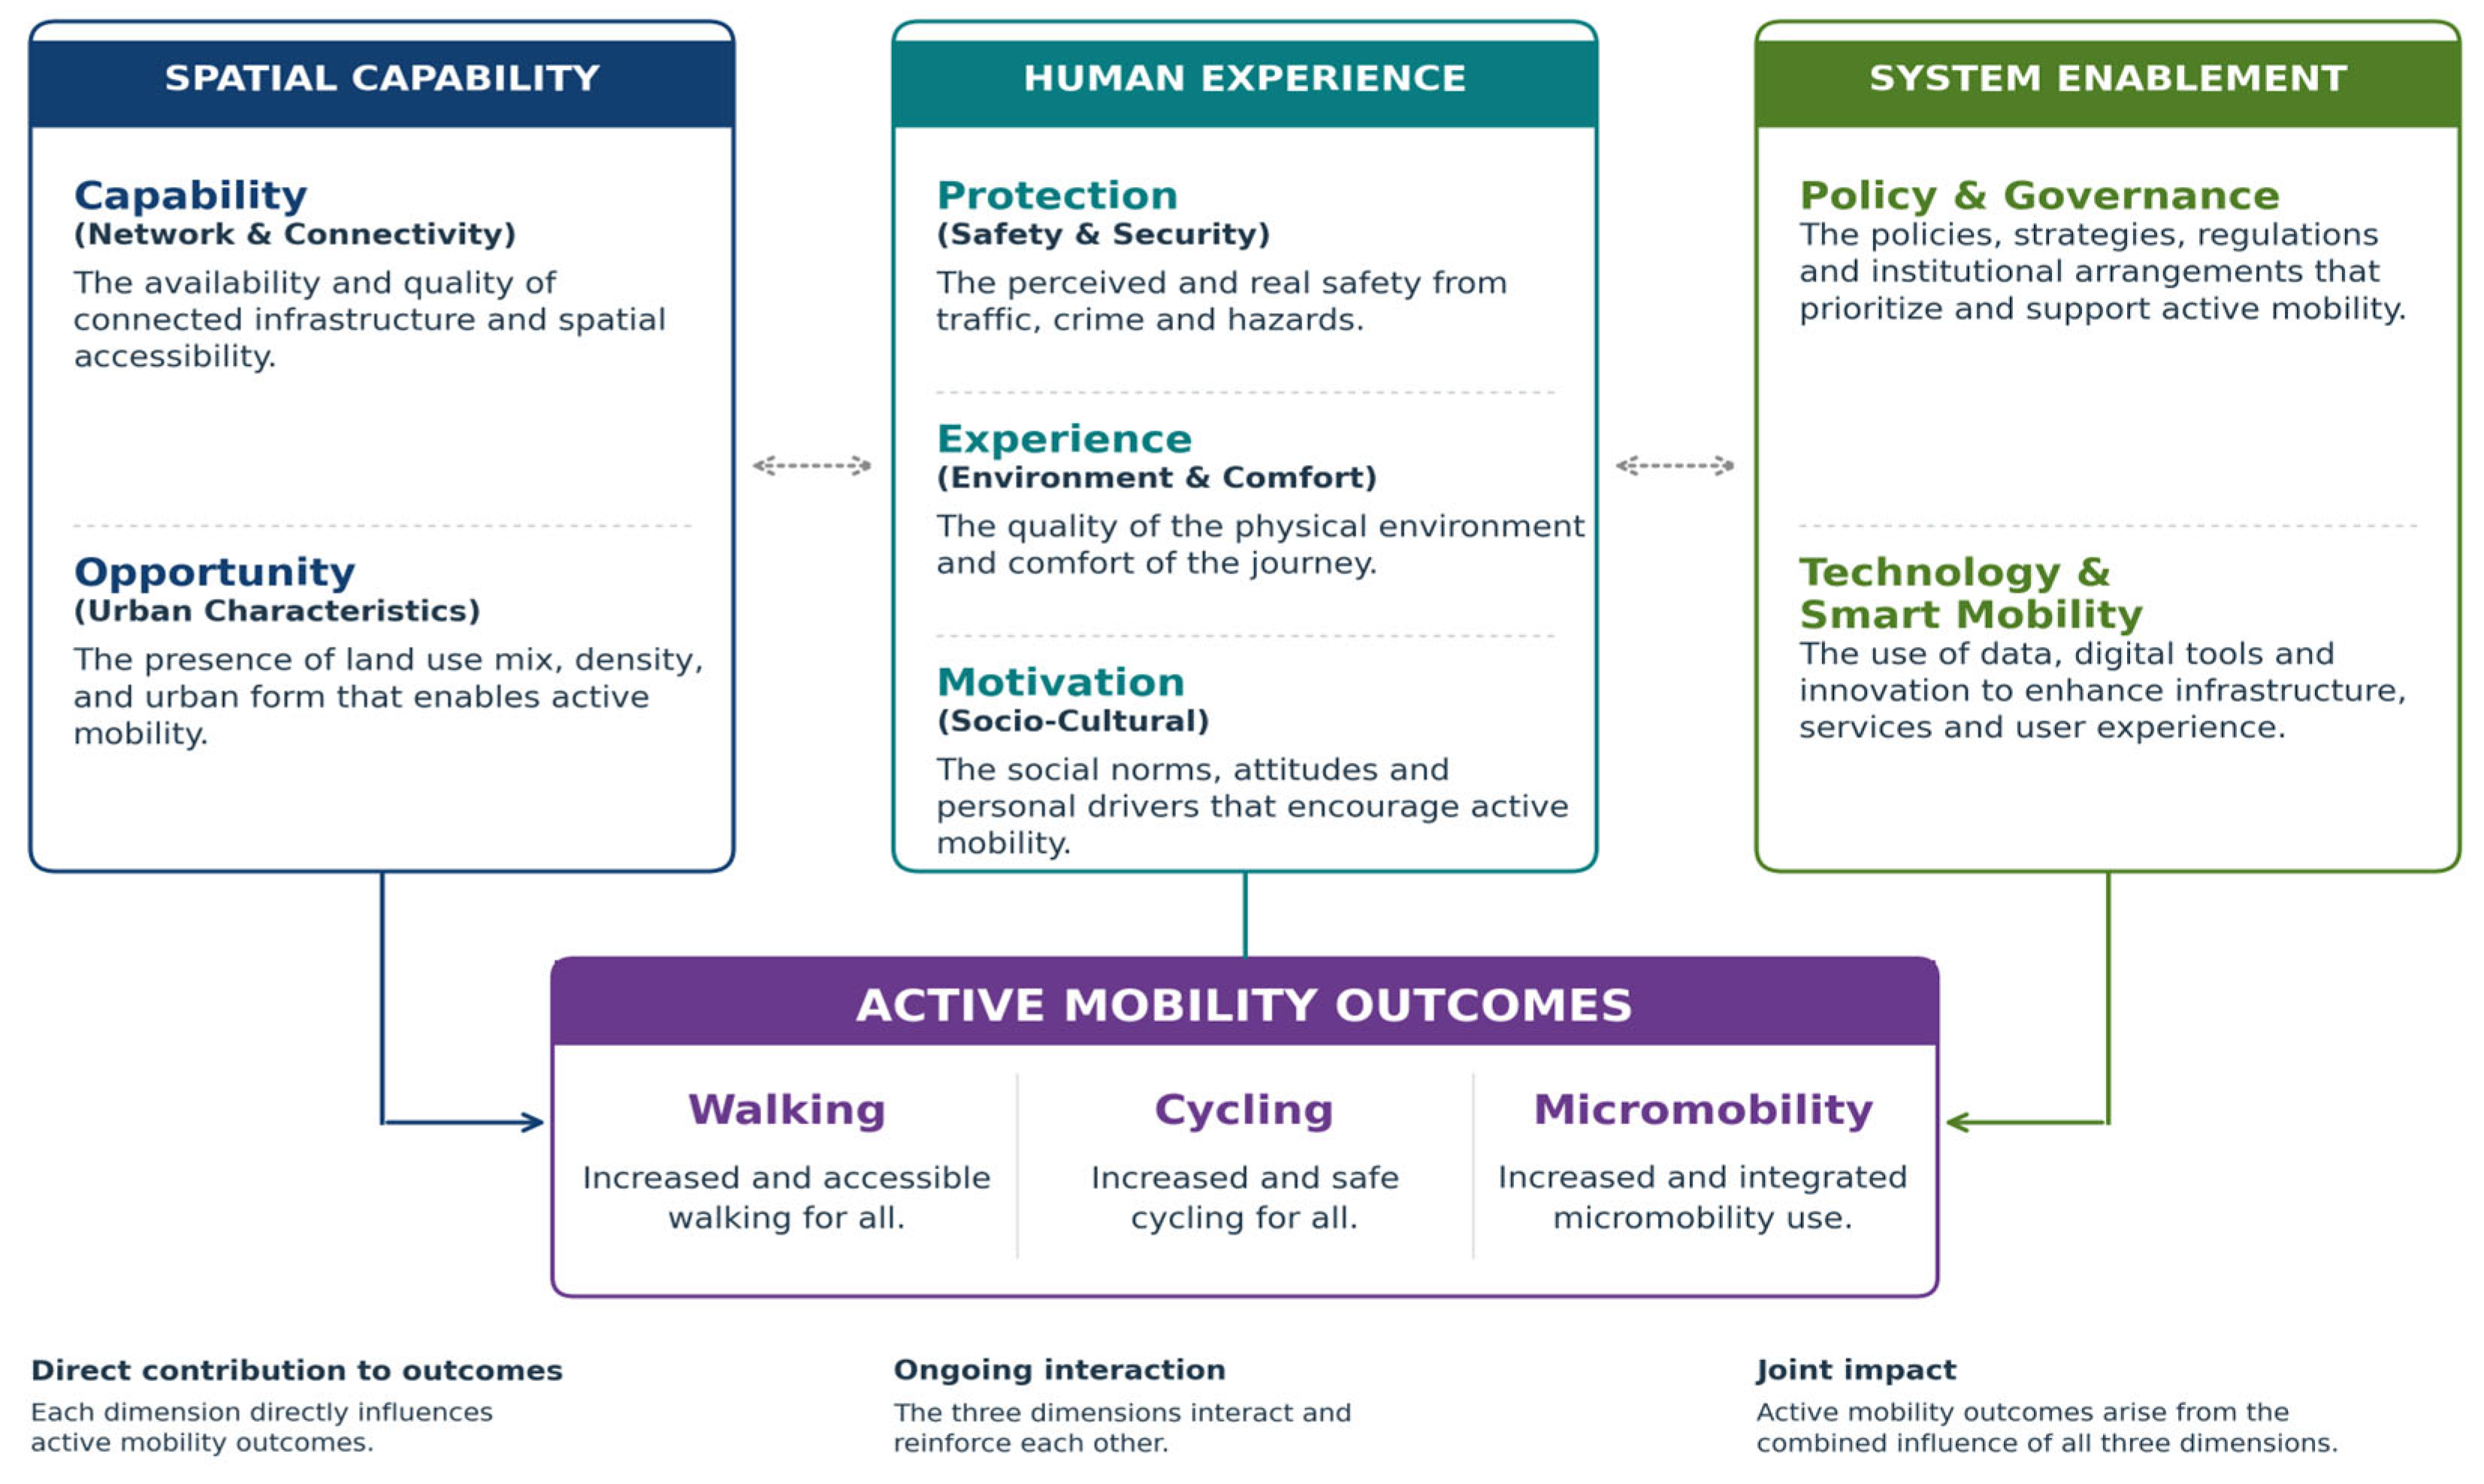
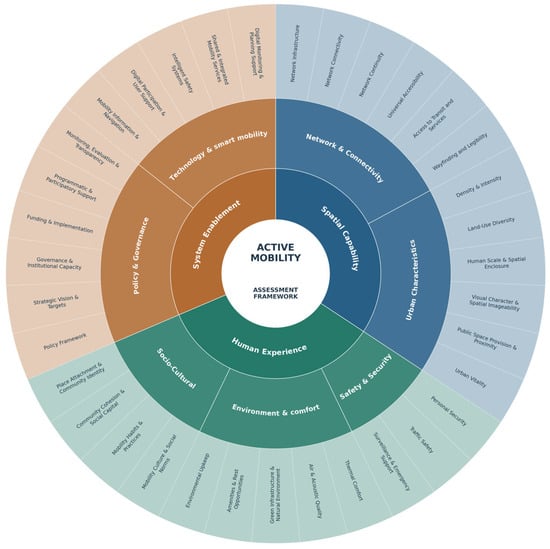
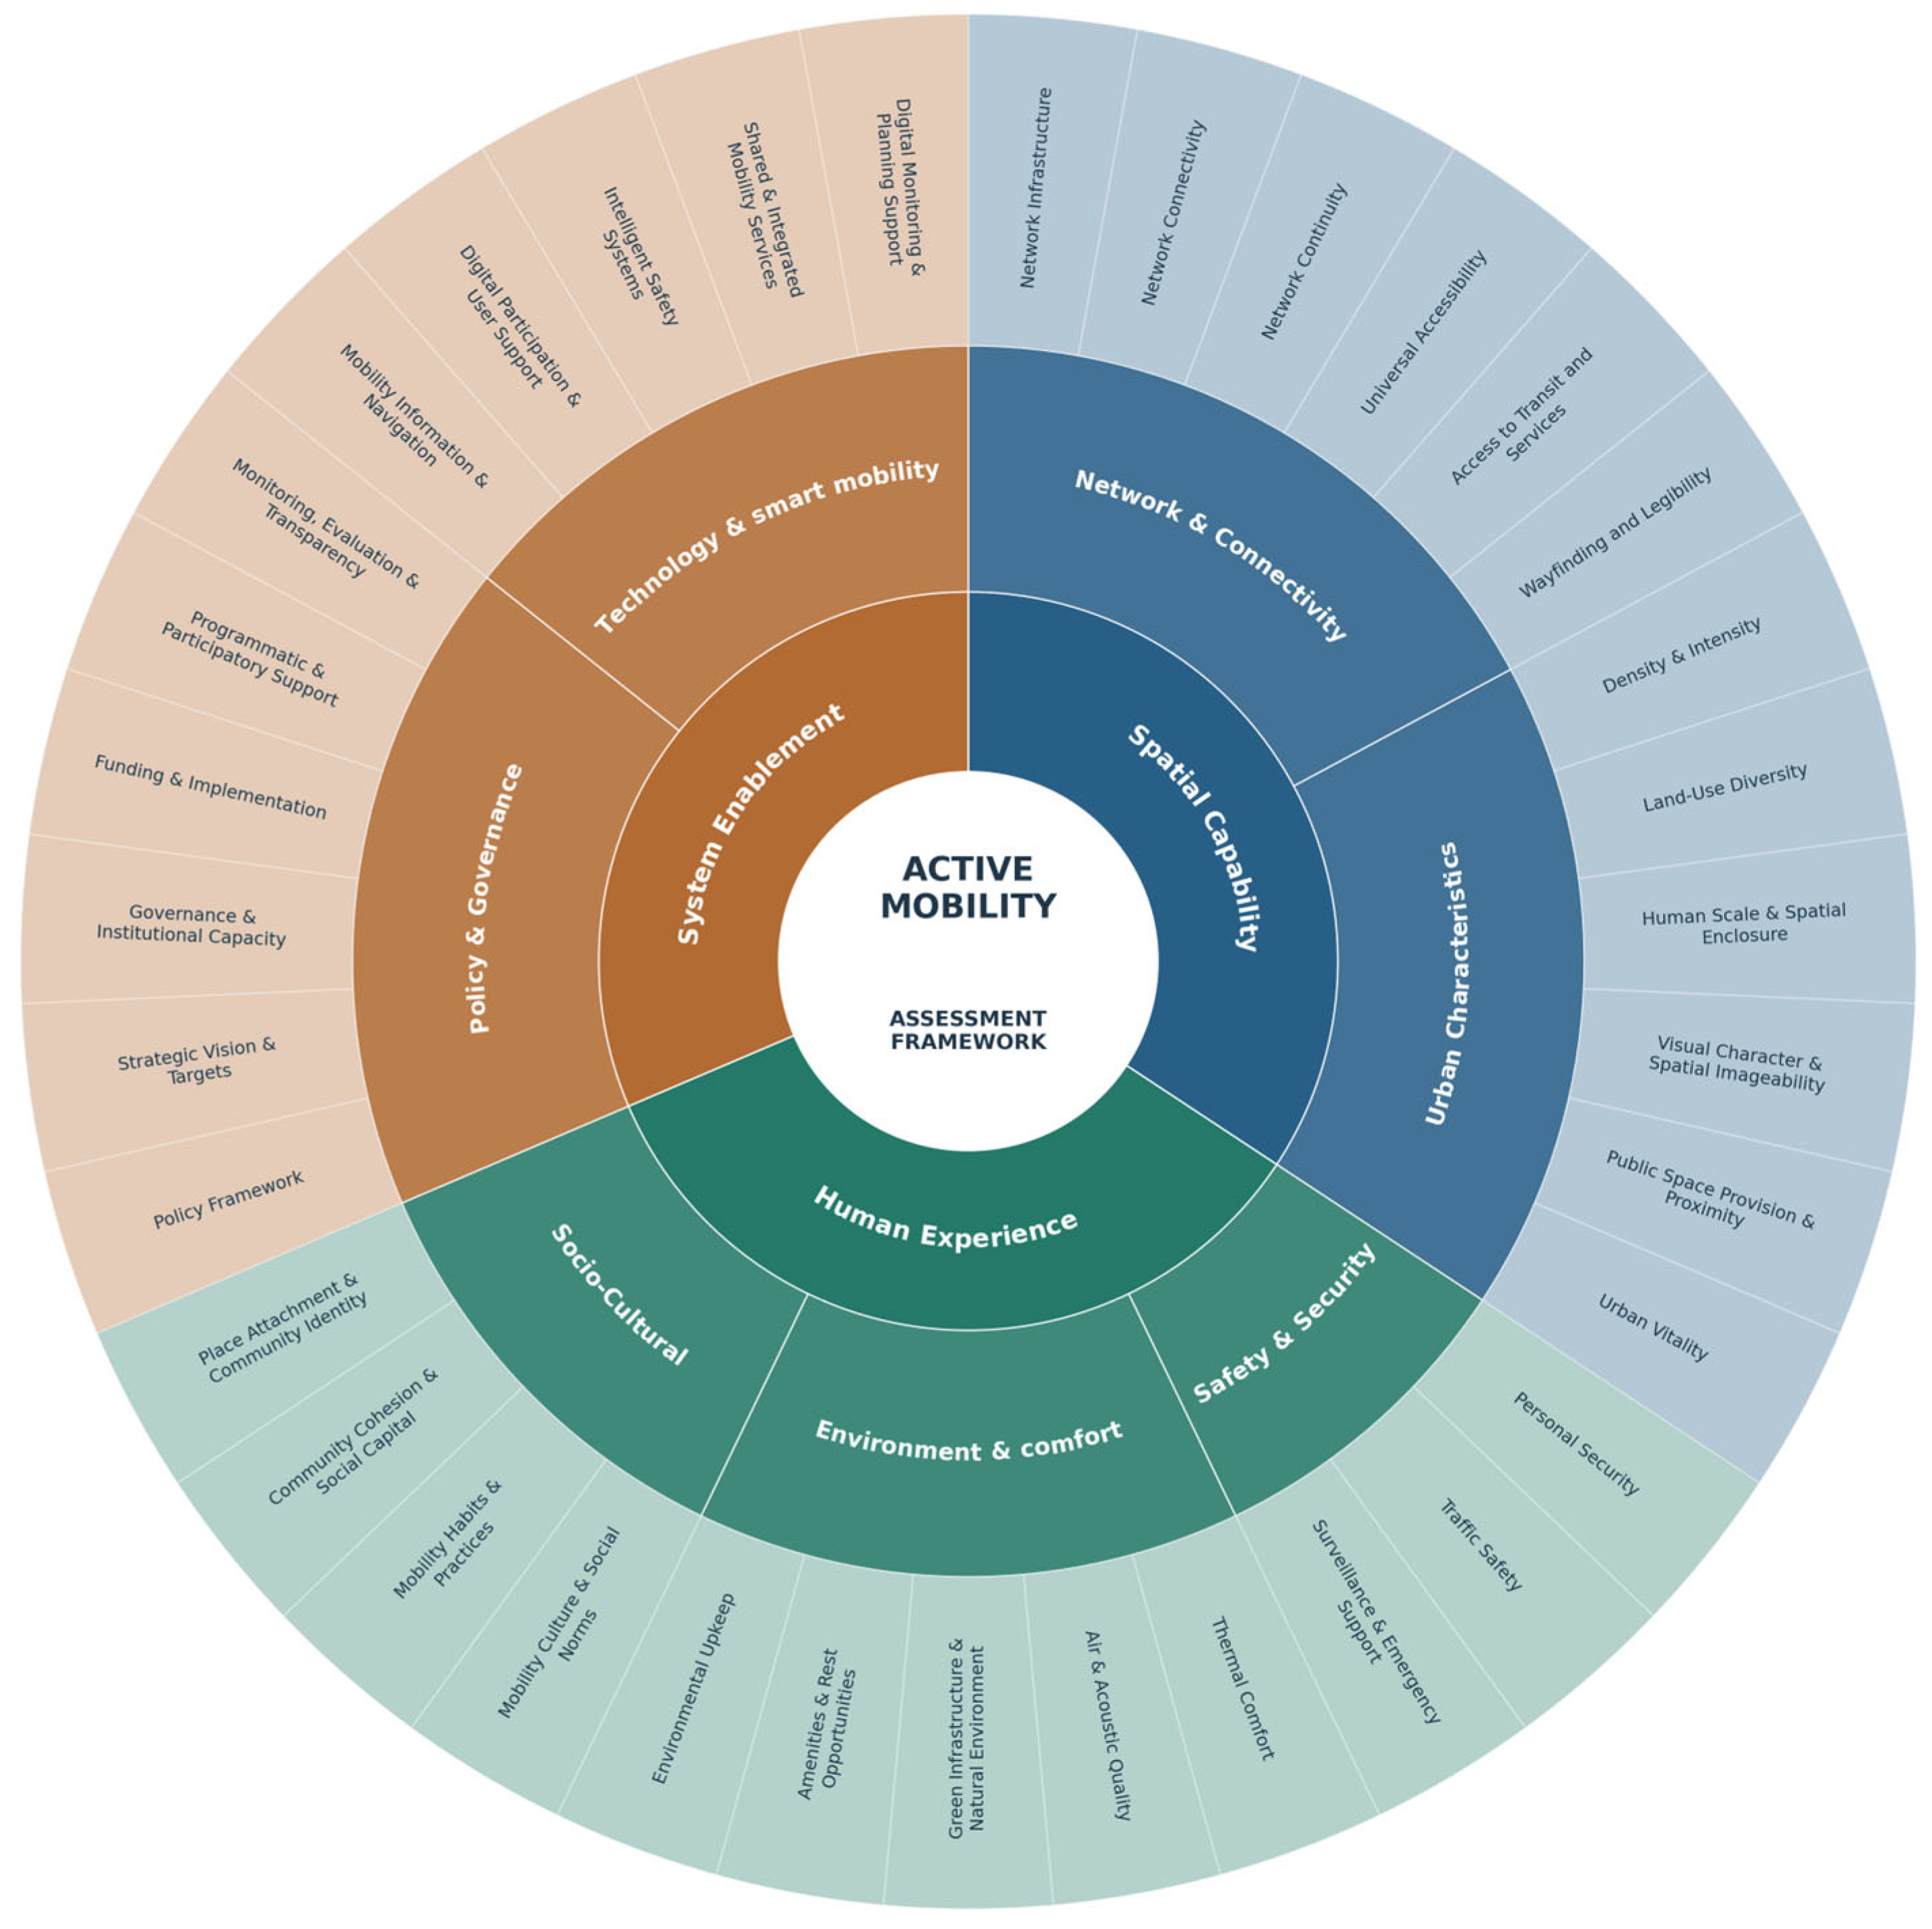

Disclaimer/Publisher’s Note: The statements, opinions and data contained in all publications are solely those of the individual author(s) and contributor(s) and not of MDPI and/or the editor(s). MDPI and/or the editor(s) disclaim responsibility for any injury to people or property resulting from any ideas, methods, instructions or products referred to in the content. |
© 2026 by the author. Licensee MDPI, Basel, Switzerland. This article is an open access article distributed under the terms and conditions of the Creative Commons Attribution (CC BY) license.