


Abstract
Urban greening is frequently advocated as a method to alleviate pedestrian heat stress in hot-arid and hot-humid coastal cities; however, planting schemes are frequently designed according to quantitative objectives rather than performance-based thermal outcomes. The thermal comfort gains achieved by the Al-Yamamah walkway in Jeddah, Saudi Arabia, as a result of the corridor’s vegetative transformation between 2008 and 2026 are quantified in this study, which also explores, through a single evolutionary optimization run, whether an alternative tree arrangement lowers mean UTCI in a separate simulation framework/The Universal Thermal Climate Index (UTCI) was employed to reconstruct and evaluate historical and contemporary tree configurations during peak summer conditions (12:00–16:00, July) using Autodesk Forma. The ground area under very strong heat stress was reduced from 99% to 92% as a result of the nearly three-fold increase in in-walkway trees (from 10 to 25) and an 86% increase in canopy diameter (from 3.5 m to 6.5 m). In Rhino/Grasshopper, a subsequent parametric optimization was conducted using the Galapagos evolutionary solver to maintain a fixed canopy diameter of 6 m. This single optimization run identified a 46-tree configuration as the best solution found in that run, with a mean UTCI of 40.06 °C across the same peak window. Because tree count (25 in 2026 versus 46) and tree placement were varied together, and because this value comes from a different tool and metric than the Forma ground-area percentages reported for 2008 and 2026, it is presented as a separate optimization result and not as a like-for-like improvement over the 2026 condition. The empirical 2008–2026 comparison suggests that comfort outcomes are more strongly associated with canopy maturation than with tree count alone, although the study design does not allow these geometric factors to be statistically isolated from one another. Additionally, the optimization run indicates that layouts with a lower simulated mean UTCI can be found for a fixed 6 m canopy specification, although the separate contributions of tree count and tree placement were not isolated. A transferable, performance-validated framework for aligning Vision 2030 greening investments with measurable pedestrian thermal benefits in Jeddah and analogous coastal cities is provided by the two-stage workflow, which consists of empirical before/after assessment and evolutionary placement optimization.
1. Introduction
In hot-arid and hot-humid coastal environments, insufficient shade at street level exacerbates heat exposure for pedestrians, raises surface and near-surface air temperatures, and amplifies the urban heat island phenomenon. In Saudi Arabian urban centers like Jeddah, the summer climate, characterized by elevated temperatures and high humidity due to proximity to the Red Sea, can result in excessive thermal discomfort for pedestrians during peak daylight hours, deterring walking and compromising overall urban livability goals. Flora, especially urban trees, continues to be one of the most efficient and economical measures for alleviating this exposure via canopy shading, evapotranspirative cooling, and alteration of surface radiative heat exchange [1].
Notwithstanding this evidence, tree-planting initiatives in swiftly urbanizing Gulf cities are often executed without a measurable performance objective. The dimensions of the canopy, the spacing between trees, and the density of trees inside a corridor are frequently dictated by aesthetic norms, financial constraints for planting, or standard greening requirements, rather than by empirical analysis of the unique solar geometry and pedestrian exposure characteristics of a specific corridor [2,3]. Consequently, significant augmentations in tree population and canopy dimensions may not alleviate the fundamental thermal comfort shortfall, especially in corridors oriented to expose most of their ground surface to prolonged direct sunlight throughout the day [4].
This disparity is particularly apparent within the framework of Saudi Vision 2030, where the Quality-of-Life Program has significantly enhanced urban greening and walkability infrastructure in prominent cities such as Jeddah [5]. Although this expansion is thoroughly illustrated through enhanced canopy coverage, streetscape renovations, and pedestrian-centric corridor improvements, there is still a lack of empirical evidence to confirm if these measures fulfill their desired microclimatic effects [6]. Limited research has combined a longitudinal thermal comfort evaluation before and after a genuine greening initiative with a follow-up computational analysis to determine if the constructed design performs well relative to alternative layouts that computational search can identify for comparable resources, rather than simply enhancing a non-vegetated baseline.
Parametric and evolutionary optimization techniques, progressively utilized in environmental and architectural design studies, provide a solution to bridge this divide. Instruments like Grasshopper’s Galapagos evolutionary solver, combined with verified thermal comfort simulation engines (e.g., Ladybug Tools’ UTCI implementation), enable researchers to progress from mere descriptive before/after analyses to prescriptive optimization—evaluating not only the comfort achieved by a specific planting arrangement but also the potential for enhanced comfort from the same canopy specification through refined spatial distribution [7,8]. This differentiation is crucial for implementation in congested metropolitan areas, where root-zone issues, subterranean utilities, and restricted planting space limit the number of trees that may be feasibly added, rendering the configuration of a set tree budget as significant as its magnitude [9,10].
This research investigates the Al-Yamamah walkway in Jeddah as a case study, highlighting its significant vegetative changes from 2008 to 2026, transitioning from a sparse, narrow-canopy planting design to a more robust, wide-canopy arrangement in line with the recent Vision 2030 streetscape investments. This research utilizes the Universal Thermal Climate Index (UTCI) as the main comfort measure to conduct an empirical, simulation-driven analysis of pedestrian thermal stress in relation to the corridor’s historical and contemporary vegetation arrangements. It subsequently employs a Galapagos-based evolutionary optimization process, developed in Rhino/Grasshopper and integrated with Ladybug Tools’ solar and UTCI simulation engines, to identify, within the limits of a single optimization run, a tree arrangement that lowers average UTCI throughout the corridor given the existing canopy parameters. This study inquires not only whether greening was beneficial, but also whether a computational search suggests room for improvement, and what the best arrangement identified in that search looks like transforming the corridor from a mere descriptive case study into a reproducible, performance-validated framework.
Although UTCI-based assessment, parametric modelling, and evolutionary optimization have each been applied individually to urban thermal-comfort problems, prior studies have generally used these tools in isolation: either to describe existing conditions, or to generate a hypothetical optimized layout benchmarked only against an unplanted or generically simulated baseline. The methodological gap addressed here is the absence of a single workflow that (i) empirically documents a real, historically observed before/after greening transformation using field-reconstructed tree geometry, and (ii) subsequently subjects the resulting canopy specification to evolutionary spatial optimization reported alongside that same empirically reconstructed as-built condition (using a separate simulation framework and metric; see Section 3.2 and Section 5.5), rather than a synthetic baseline. The two-stage workflow proposed here therefore contributes a reproducible bridge between descriptive, empirically grounded thermal-comfort assessment and prescriptive, optimization-based design guidance—an integration that, to the authors’ knowledge, has not been jointly demonstrated in the existing UTCI, parametric-modelling, or evolutionary-optimization literature on urban street trees.
The main aim of this study is to create and showcase a cohesive workflow that combines simulation and optimization to measure the thermal comfort effects of a current street-tree initiative and to identify, through a single optimization run, a tree arrangement that lowers simulated mean UTCI within practical spatial and canopy limitations. To direct this aim, the subsequent research inquiries are formulated:
Q1: How significantly did the recorded rise in tree density and canopy diameter along Al-Yamamah route from 2008 to 2026 enhance pedestrian thermal comfort, as assessed by UTCI?
Q2: Can an evolutionary optimization method identify an alternative tree arrangement (with tree count and placement varying jointly) that lowers mean UTCI in the Rhino/Grasshopper–Ladybug framework while retaining the same canopy diameter?
Q3: In what manner can the optimized setup provide practical, data-driven planting recommendations for forthcoming greening initiatives associated with Vision 2030 in Jeddah and analogous coastal towns with hot climates?
2. Literature Review
2.1. The Limitations of Conventional Urban Planning in Addressing Pedestrian Heat Exposure
Conventional planning instruments—zoning ordinances, density regulations, and landscaping codes—were not designed with pedestrian-level thermal performance as a governing criterion, and this omission becomes consequential in hot-arid and hot-humid coastal cities, where pedestrians’ outdoor thermal stress—not merely the buildings’ indoor energy demand that these instruments were originally calibrated to manage—directly constrains walkability [11,12]. The underlying issue is not merely that greening requirements exist in weaker or stronger forms across jurisdictions, but that where they exist, they are typically specified as a quantity—a minimum tree count, a percentage canopy-cover target, a landscaping ratio—rather than as a performance outcome tied to solar geometry, canopy continuity, or corridor orientation [13,14]. This distinction matters because tree count and thermal comfort are not linearly related: shading performance is governed by canopy diameter, spacing, and overlap acting jointly, meaning two corridors with identical tree counts can differ substantially in achieved shade continuity, and by extension, in pedestrian UTCI outcomes. This disconnection is significant for the current research: as illustrated in Section 4, the nearly three-fold increase in tree count along the Al-Yamamah walkway from 2008 to 2026 resulted in only a marginal alleviation of severe heat stress, highlighting that merely quantitative greening objectives are inadequate indicators of thermal comfort results.
2.2. UTCI and Pedestrian Thermal Comfort Assessment in Hot Climates
The Universal Thermal Climate Index (UTCI) has emerged as a prevalent measure for assessing thermal stress on outdoor pedestrians, amalgamating air temperature, mean radiant temperature, humidity, and wind speed into a unified physiologically informed comfort scale [15]. The utilization of this approach in Gulf and wider MENA urban microclimate studies has increased as scholars pursue measures that are more responsive to radiant heat load compared to basic indices like WBGT or PET [16,17]. Coastal urban areas like Jeddah pose a unique difficulty for UTCI evaluations, as increased humidity exacerbates the impact of intense solar radiation, frequently relegating shaded corridors to the most extreme UTCI stress classifications during most daylight hours [18]. This research expands upon the existing literature by utilizing UTCI not merely as a descriptive baseline measure, but as the objective function guiding a future spatial optimization procedure.
2.3. The Emergence of Climate-Responsive Urban Design
Climate-responsive urban design (CRUD) has emerged as a solution to the realization that uniform planning strategies are insufficient for managing localized microclimatic differences influenced by factors such as building height, street orientation, and surface materials [19]. CRUD frameworks prioritize the tactical use of green infrastructure, shading components, and passive cooling techniques to balance the interplay between climate, location, and human comfort [20]. The disparity between CRUD’s theoretical focus on cohesive, multifunctional green infrastructure and its practical application at the street level is a recurring issue in this literature [20,21]. Parametric accuracy is required for elements such as solar geometry, canopy structure, and biological spacing limitations, which standard design guidelines are unable to provide. This implementation gap is addressed by current research, which integrates empirical UTCI evaluations with a parametric, corridor-specific optimization procedure.
2.4. Street Trees, Canopy Geometry, and Shade Performance
A growing body of research suggests that the efficacy of shade is more significantly impacted by the interplay of canopy overlap, canopy diameter, and spacing than by the mere number of trees [13]. The same number of trees positioned at greater distances with reduced canopies may result in significant shading voids during optimal sun angles, whereas tightly planned plantations with interlacing canopies can provide uninterrupted shade. This concept has a direct impact on the scenario sensitivity analysis presented in this study (Section 4.4), which identifies canopy shape as a variable that is not dependent on the total planting budget. Parametric investigations that have employed generative design methodologies to improve tree distribution in restricted urban configurations have demonstrated substantial improvements in shade coverage and radiant temperature [14,20]. However, they have also cautioned that uniform-grid planting arrangements may result in ineffective canopy overlaps rather than optimized coverage [20,21]—a conclusion that is consistent with the rationale behind the use of evolutionary tree placement in this research, as opposed to uniform-grid.
2.5. Computational and Evolutionary Optimization in Environmental Design
Researchers have been able to transition from static shade assessments to truly optimized spatial arrangements by utilizing parametric modeling platforms such as Rhino/Grasshopper and evolutionary solvers like Galapagos. This approach involves determining tree location and canopy characteristics as variables rather than constant inputs [7]. In urban environments characterized by high temperatures, regions that surpass critical thermal limits have experienced significant decreases in previous implementations of this methodology, which integrate solar-radiation simulation with evolutionary algorithms [7,8]. However, non-analytical, heuristic planting strategies are unable to account for real-time solar geometry or pedestrian exposure patterns with the same precision [9,22]. This research specifically develops the methodological approach for a pedestrian corridor in Jeddah by utilizing UTCI as the optimization fitness metric, rather than relying solely on shaded-area percentage or MRT. The optimized results are reported alongside an actual, empirically reconstructed as-built condition, rather than a purely simulated baseline, although the two are evaluated with different tools and metrics and are not directly comparable [23,24].
2.6. Saudi Vision 2030 and Urban Greening Policy
Saudi Arabia’s Vision 2030 initiative, particularly its Quality-of-Life Program, has placed a high priority on the enhancement of public spaces, urban greening, and walkability. This has led to significant streetscape investments in critical cities, including Jeddah [25]. There is a scarcity of published, performance-validated evidence that verifies whether these interventions achieve their intended thermal comfort objectives, rather than merely enhancing vegetative cover, despite the significant physical greening that has been induced by this policy, as evidenced by the tree density and canopy growth recorded along the Al-Yamamah walkway from 2008 to 2026 [26,27]. This research is situated within the policy framework, offering an empirical and computational approach to evaluate and improve the current greening initiatives, rather than proposing greening as a theoretical solution.
3. Methodology
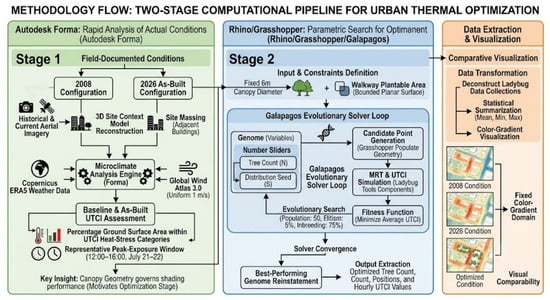
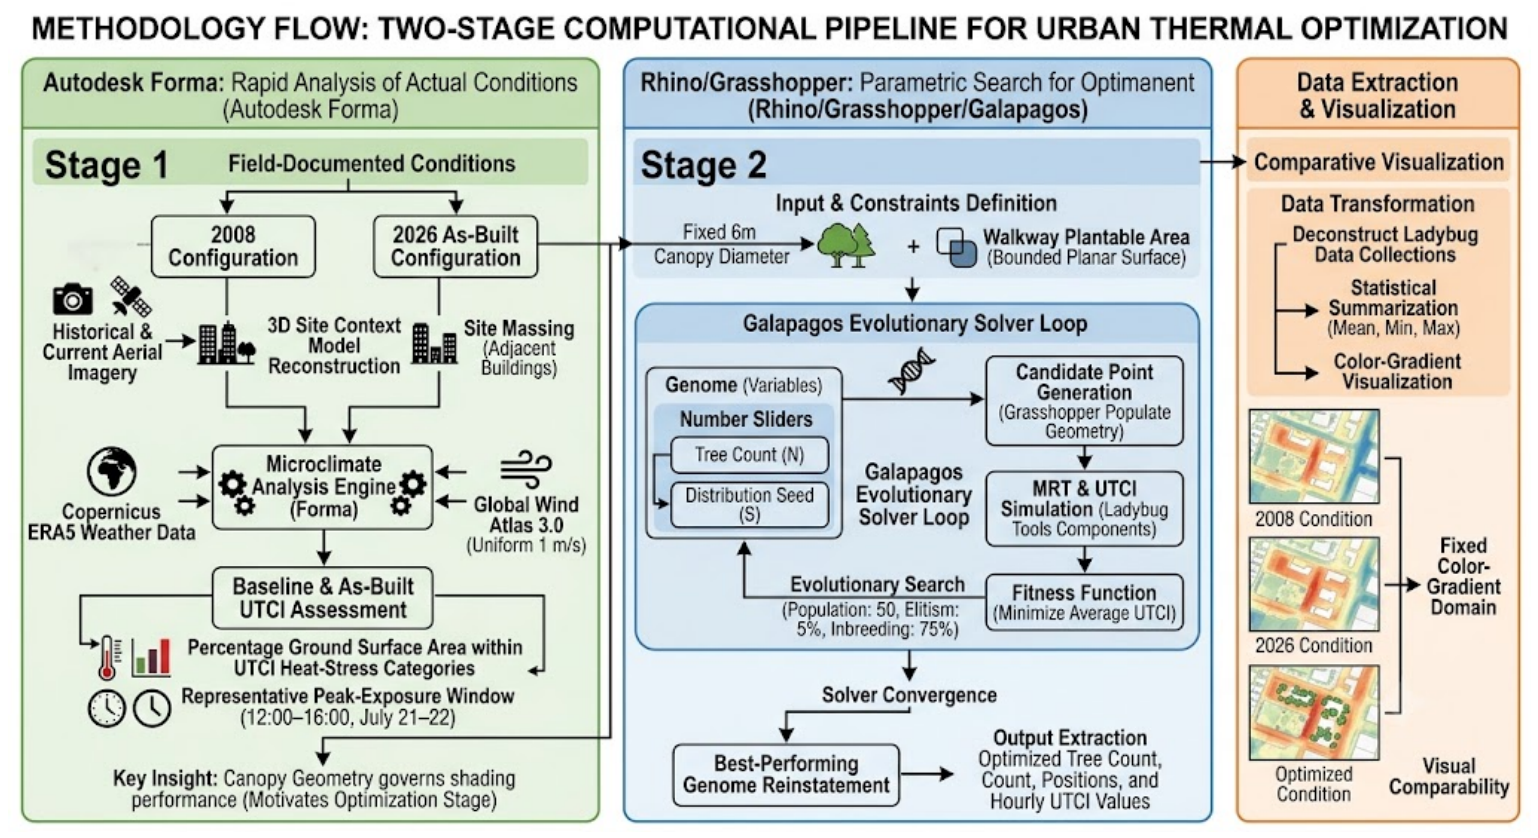
The following Figure 1 showcased the overall methodology of the paper.
Figure 1.
Methodology Flow. Source: Authors.
3.1. Study Area
The Al-Yamamah promenade in Jeddah, Saudi Arabia, was chosen as the case corridor for the study due to its substantial and well-documented vegetative transformation between 2008 and 2026, which coincided with Saudi Vision 2030’s greening and walkability initiatives [28]. The physical foundation for the tree configuration comparison presented in Section 4 was established by utilizing historical and current aerial imagery of the corridor. The corridor, a linear pedestrian path that is north–south oriented and flanked by mid-rise residential and institutional buildings, was reconstructed as a 3D site context model that includes the massing of adjacent buildings. This was done to capture the shadow-casting conditions that are relevant to the environmental analyses delineated below.
3.2. Software Framework: A Two-Stage Computational Pipeline
This research implemented two computational environments that were complementary and each appropriate for a specific phase of the analysis. Thermal simulations were conducted using Autodesk Forma, accessed in June 2026. Autodesk Forma was employed to document the real-world tree configurations of 2008 and 2026, as well as to conduct the corresponding baseline and as-built UTCI assessments (Section 3.3 and Section 3.4). The built-in microclimate analysis engine, which utilizes Copernicus ERA5 reanalysis weather data [15] and Global Wind Atlas 3.0 wind data [29], was employed. The parametric tree-placement optimization (Section 3.5) was subsequently conducted using Rhinoceros 3D and Grasshopper, the Ladybug Tools module suite (v1.8), and the Galapagos evolutionary solver, which is a capability that is not currently included in Forma’s conceptual-design feature set. The study was able to integrate the efficiency of Forma for rapid, context-rich environmental analysis of actual site conditions with the capacity of Grasshopper for open-ended parametric search through this two-stage pipeline. Because Autodesk Forma and the Rhino/Grasshopper–Ladybug Tools pipeline compute mean radiant temperature through different underlying radiation and view-factor algorithms, the two environments are not guaranteed to produce numerically identical UTCI outputs for an identical geometry; this two-stage pipeline is therefore used to obtain the best available result from each tool for its respective task (real-condition documentation in Forma; spatial optimization in Grasshopper) rather than to guarantee strict cross-tool numerical equivalence, a limitation addressed further in Section 5.5. Accordingly, results from the two environments are reported separately, and no direct quantitative improvement between the 2026 and optimized conditions is inferred.
3.3. Field-Documented Tree Configuration: 2008 and 2026 Conditions
The corridor’s tree population and canopy geometry were documented for two real, historically distinct conditions—the 2008 configuration and the current (2026) as-built configuration—by reconstructing each condition as a 3D context model in Autodesk Forma, using historical and current aerial imagery as a spatial reference for tree location, count, and approximate canopy extent.
Tree locations were digitized manually from georeferenced historical (2008) and current (2026) high-resolution aerial imagery (Google Earth Pro), with each canopy centroid marked as a point and cross-checked against ground-level photographs of the corridor where available. Tree counts were obtained by direct enumeration of discrete canopy masses visible in the imagery; where adjacent canopies had merged into a continuous mass in the 2026 imagery, individual stems were distinguished using shadow-cast boundaries and, where accessible, corridor-level photographic surveys. Canopy diameter and radius for each condition were estimated by measuring the horizontal extent of representative canopy masses in the imagery at known scale and averaging across a sample of trees per condition, rather than measuring every individual tree; tree height was estimated from shadow-length analysis calibrated to solar elevation angle at the image capture date and cross-referenced against typical mature heights for the species observed. These reconstructions carry inherent uncertainty: aerial-imagery resolution limits the precision of individual-tree boundary delineation, particularly where canopies overlap; the 2008 imagery is of lower resolution than the 2026 imagery, so the historical canopy and height estimates carry a wider margin of error than the as-built values; and averaging canopy dimensions across trees within each condition necessarily smooths over real tree-to-tree variability. The reported 2008 and 2026 parameters (Table 1 and Table 2) should therefore be read as best-estimate representative values for each condition rather than as survey-grade measurements of every individual tree. The as-built 2026 canopy diameter documented through this process is reported in Table 2 as 6.5 m (Section 4.1); this is the field-reconstructed value referenced by the parametric optimization in Section 3.5, which instead uses a rounded 6 m specification, as clarified there.
Table 1.
Tree count by condition.
Table 2.
Canopy geometry by condition, with percentage change.
3.4. Baseline and As-Built UTCI Assessment (Autodesk Forma)
Pedestrian thermal comfort for both the 2008 and 2026 conditions was evaluated in Autodesk Forma using the Universal Thermal Climate Index (UTCI), a physiologically based index integrating air temperature, mean radiant temperature, relative humidity, and wind velocity into a single equivalent-temperature comfort scale [16]. UTCI was selected over alternative indices (e.g., PET, WBGT) for its established sensitivity to radiant heat load, particularly relevant in a coastal, high-solar-exposure context such as Jeddah [30]. For each condition, the corresponding tree geometry (Table 1 and Table 2) was placed within the 3D site context model, and Forma’s microclimate analysis tool was run to generate ground-level UTCI classifications across the corridor and surrounding site extent. In the absence of a resolved site-specific wind-flow simulation, the tool’s default assumption of a uniform 1 m/s wind speed across the site was applied. Weather inputs were obtained from Forma’s integrated Copernicus ERA5 dataset, with wind conditions referenced against Global Wind Atlas 3.0 data. The analysis was conducted for a representative peak-exposure window (12:00–16:00, 21–22 July), which corresponds to the period of highest cumulative solar radiation and pedestrian heat risk. The results were presented as the percentage of ground surface area that fell within each UTCI heat-stress category (e.g., “very strong heat stress,” “strong heat stress”) for both a corridor-focused extent and a wider surrounding site extent. This allowed for a direct comparison of thermal performance between the 2008 and 2026 real-world conditions (Section 4.2 and Section 4.3). In order to contextualize the corridor’s underlying solar exposure independent of vegetation, a complementary sun-hours analysis was also computed in Forma for each condition. This analysis quantified the percentage of ground area receiving direct sun for at least three hours within the same time window. The 21–22 July, 12:00–16:00 window was selected because it corresponds to the period of solar culmination around the summer solstice at Jeddah’s latitude, when solar altitude and cumulative direct-beam radiation on a north–south corridor are at their annual maximum; this window therefore represents a worst-case, peak-exposure scenario for pedestrian thermal stress rather than a typical or average summer condition, and the reported UTCI values should be interpreted accordingly. The uniform 1 m/s wind speed reflects Forma’s default microclimate assumption in the absence of a resolved computational-fluid-dynamics wind-flow simulation for the corridor; because UTCI is sensitive to wind speed through its influence on convective heat loss, this simplification likely overstates thermal stress in more wind-exposed segments of the corridor and understates it in more sheltered, building-flanked segments, and the absolute UTCI values reported here should be read as indicative of relative, rather than absolute, spatial and temporal comfort differences.
3.5. Parametric Tree Placement and Evolutionary Optimization (Rhino/Grasshopper/Galapagos)
Based on the as-built canopy geometry documented in Forma (Section 3.3; 6.5 m diameter, rounded to 6 m for the optimization as justified below), a parametric optimization process was created in Rhino/Grasshopper to search for the tree arrangement within the walkway that gives the lowest mean UTCI the solver could identify—exploring whether layouts that perform better in the Ladybug framework exist for that canopy specification, with both tree count and placement free to vary. Parametric modelling and evolutionary optimization were performed using Rhino and Grasshopper (v2024), including the Galapagos evolutionary solver. This phase necessitated Grasshopper’s parametric and evolutionary-solving functionalities, which surpassed the existing analytical skills of Forma. A rounded 6 m diameter, rather than the measured 6.5 m as-built value, was adopted as the fixed genome parameter to provide a slightly conservative canopy assumption and to align with a standard nursery-stock specification available for future planting; this 0.5 m rounding is a deliberate simplification, and any lower mean UTCI found for the optimized configuration reflects the combined effect of tree count and tree placement under an equal-or-smaller canopy than the true as-built condition, rather than a larger canopy, and cannot be attributed to spatial redistribution alone.
Site constraint definition. The walkway’s plantable area was extracted as a bounded planar surface via a Boolean union of its constituent path geometry, ensuring all candidate tree positions were generated strictly within the walkway’s physical extent.
Candidate point generation. Tree positions were generated using Grasshopper’s Populate Geometry component, distributing points constrained to the walkway surface as a function of a target count (N) and random seed (S).
Genome definition. Tree count (N) and distribution seed (S) were exposed as Grasshopper number sliders connected to the Galapagos genome pool, allowing the solver to search for candidate tree quantities and spatial distributions within the walkway boundary. Canopy diameter was held fixed at 6 m throughout, rounded down from the 6.5 m as-built 2026 value, so that canopy size did not vary between candidate layouts. Note that tree count (N) was also a free variable, so the optimization explores count and placement jointly.
Fitness function. For each candidate configuration, the corresponding tree geometry was evaluated using Ladybug Tools’ MRT and UTCI simulation components (replicating Forma’s UTCI methodology within the Grasshopper environment to enable iterative solver evaluation), and the resulting mean UTCI across the analysis period was returned to Galapagos as the fitness value, with the solver configured to minimize this value.
Solver configuration. The evolutionary solver was run using a population size of 50 individuals per generation, an initial population boost factor of 2, an elitism (“maintain”) rate of 5%, and an inbreeding rate of 75%, with a stagnation limit of 50 generations without fitness improvement used as the convergence criterion [31].
Convergence and output extraction. The best-performing genome identified across all generations was reinstated into the live Grasshopper definition, and the corresponding tree count, positions, and resulting hourly UTCI values were extracted for reporting (Section 4.5). Fitness convergence across generations was recorded to verify solver stability. A single optimization run was conducted to obtain the reported 46-tree configuration; the robustness of this result to solver stochasticity is discussed as a limitation in Section 5.6. Accordingly, the 46-tree arrangement is referred to throughout as the best solution identified in the reported run, not as a proven optimum; this manuscript reports one run, with no additional independent runs or sensitivity tests.
3.6. Data Extraction and Visualization
Hourly UTCI findings from the optimization phase were transformed from Ladybug’s inherent data-collection format into distinct numerical values, facilitating statistical summation (mean, minimum, maximum) and color-gradient representation of thermal comfort outcomes. A uniform color-gradient domain was continually utilized throughout 2008, 2026, and optimized scenarios to guarantee visual consistency among results produced in the two software environments. This shared color scale ensures visual comparability only; it does not make the Forma and Ladybug outputs numerically equivalent.
4. Results
4.1. Tree Configuration and Canopy Geometry, 2008–2026
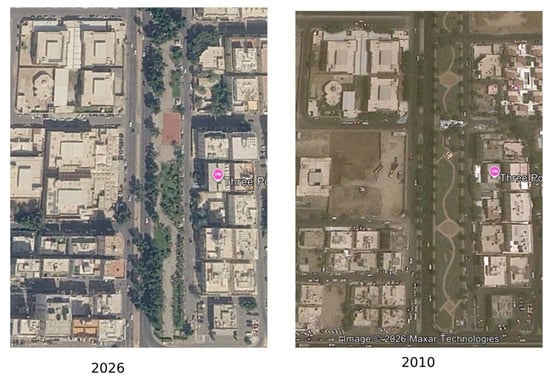
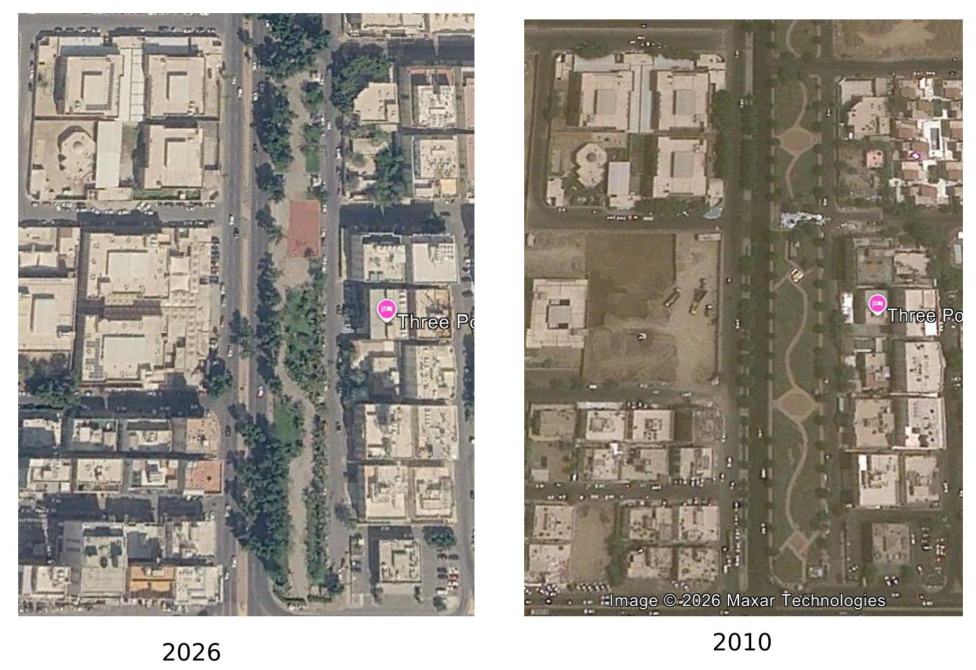
The corridor’s tree population and canopy geometry were documented for two real, historically distinct conditions—2008 and the current (2026) as-built state—using historical and current aerial imagery and 3D context reconstruction in Autodesk Forma (Section 3.3) as seen in Figure 2. Two complementary parameter sets were recorded: tree count (Table 1) and canopy geometry (Table 2).
Figure 2.
Aerial comparison of the study corridor, 2010 and 2026, showing the expansion of canopy cover along the walkway. Source: Google Earth.
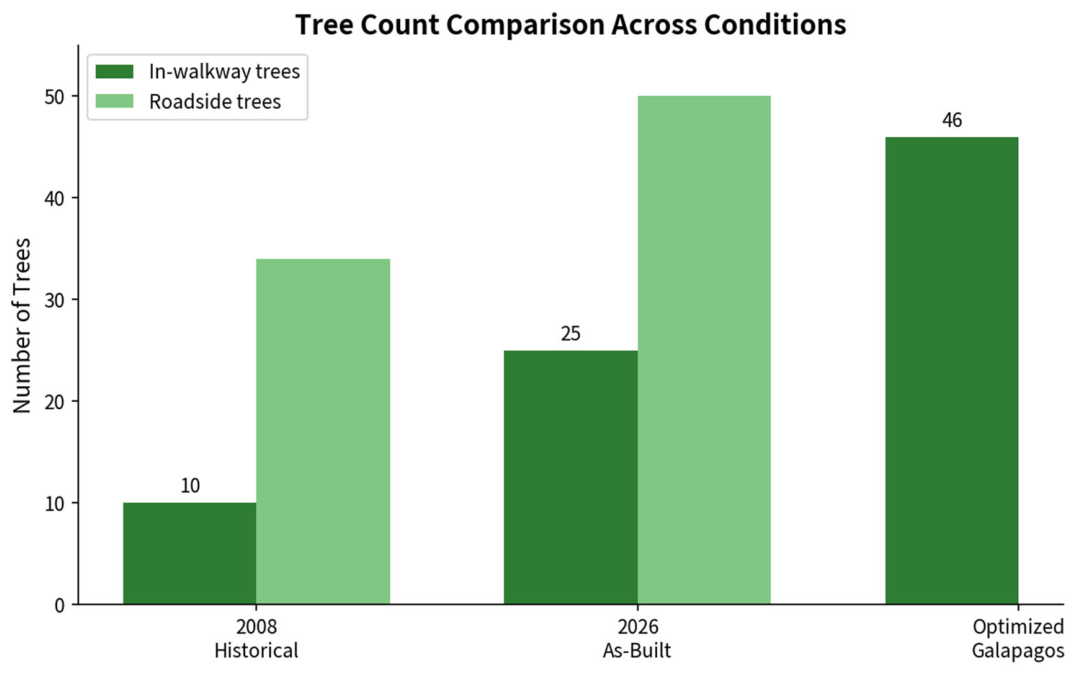
The number of trees situated within the walkway itself and along the flanking roadway margins for each condition is reported in Table 1. Between 2008 and 2026, the number of trees in the in-walkway area nearly tripled, from 10 to 25 trees. Similarly, the number of trees on the roadside increased from 34 to 50 trees.
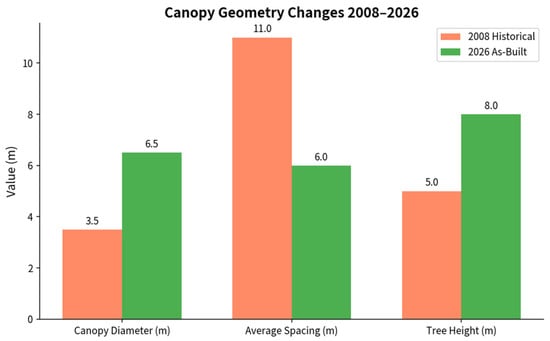
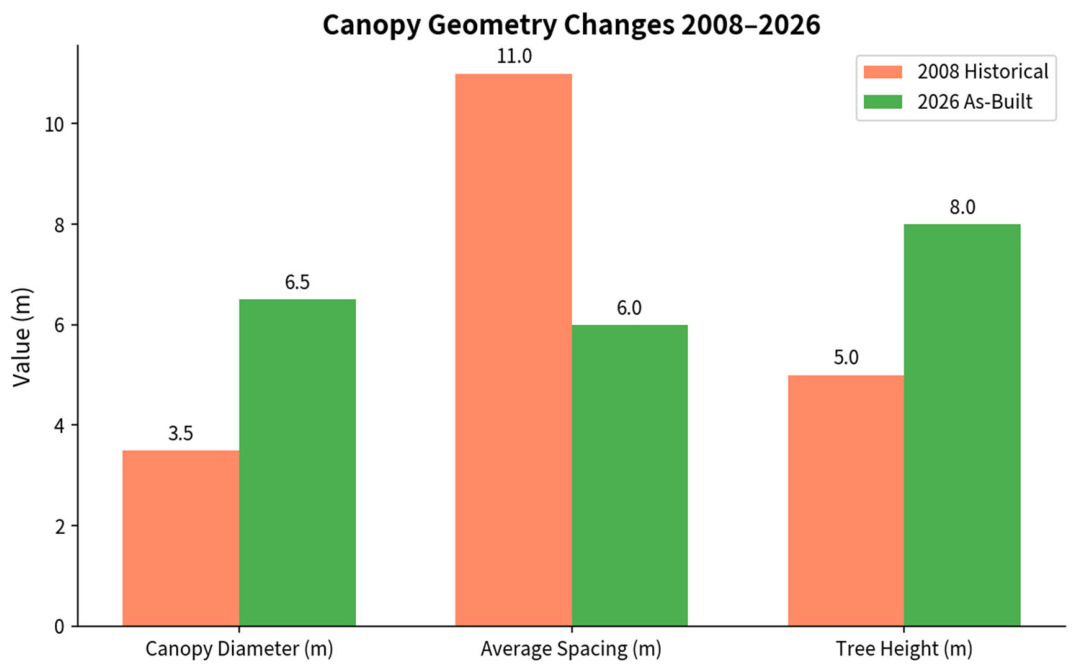
Table 2 provides the corresponding canopy geometry, including the average spacing, tree height, canopy radius, and diameter, as well as the resulting shade continuity and canopy overlap condition. In 2008, the trees were more widely spaced (approximately 11 m), shorter (approximately 5 m), and had a narrower canopy (approximately 1.75 m radius; 3.5 m diameter), resulting in low shade continuity and no canopy overlap. By 2026, the spacing had been reduced by approximately 6 m, the tree height had increased by approximately 8 m, and the canopy radius had nearly doubled (approximately 3.25 m in radius and 6.5 m in diameter). This resulted in a moderate amount of canopy overlapping and high shade continuity. Notably, the canopy diameter increased by nearly 86% while the spacing was reduced by only 45%. This is consistent with canopy maturation, rather than densification alone, being an important contributor to the transition to continuous shade, although the factors changed simultaneously and cannot be separated in this before/after design (Section 5.1).
4.2. Empirical Before–After Comparison (2008 → 2026) and Separately Reported Optimization Result
Table 3 places the three conditions side by side for reference only. Its first two columns (2008 and 2026; Autodesk Forma; percentage of ground area per UTCI category) constitute the empirical before–after finding. Its third column (best solution identified in one Galapagos run; Rhino/Grasshopper–Ladybug; mean UTCI) is a separate optimization result that is not numerically comparable with the first two, so no quantitative improvement between the 2026 and optimized conditions is claimed. The 2008 and 2026 conditions are reported as the percentage of ground area within each UTCI heat-stress category, whereas the optimized configuration is reported as a mean UTCI value across the peak window; these are related but not numerically equivalent metrics, and the comparison below should be read with that distinction in mind (see Section 5.5).
Table 3.
Comparative performance card—2008 historical, 2026 as-built, and Galapagos-optimized conditions. Columns 1–2 (Forma; ground-area percentage) are the empirical before–after comparison; column 3 (Ladybug; mean UTCI) is a separate optimization result and is not directly comparable with them.
4.3. Solar Exposure Context
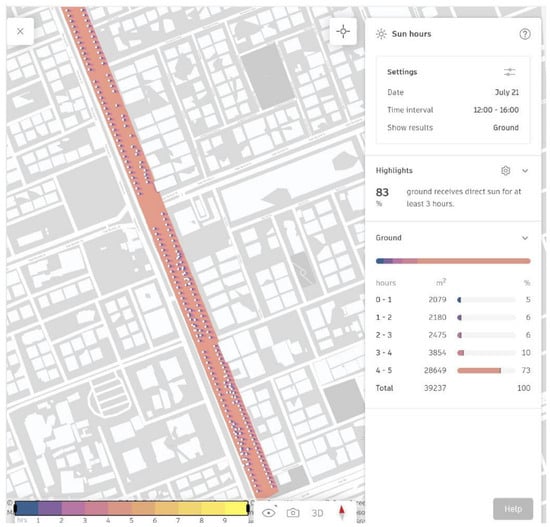
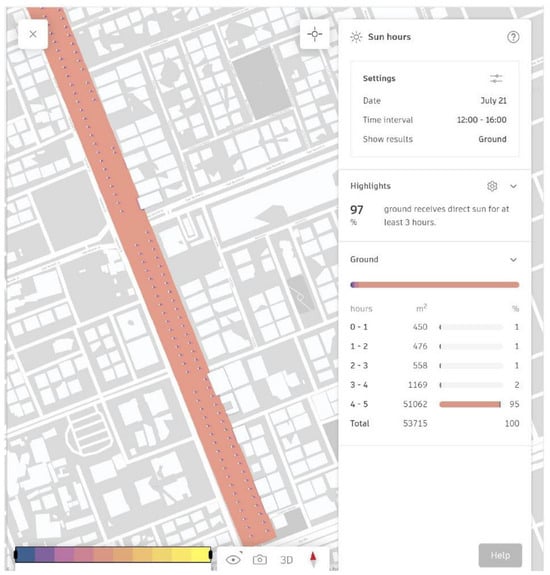
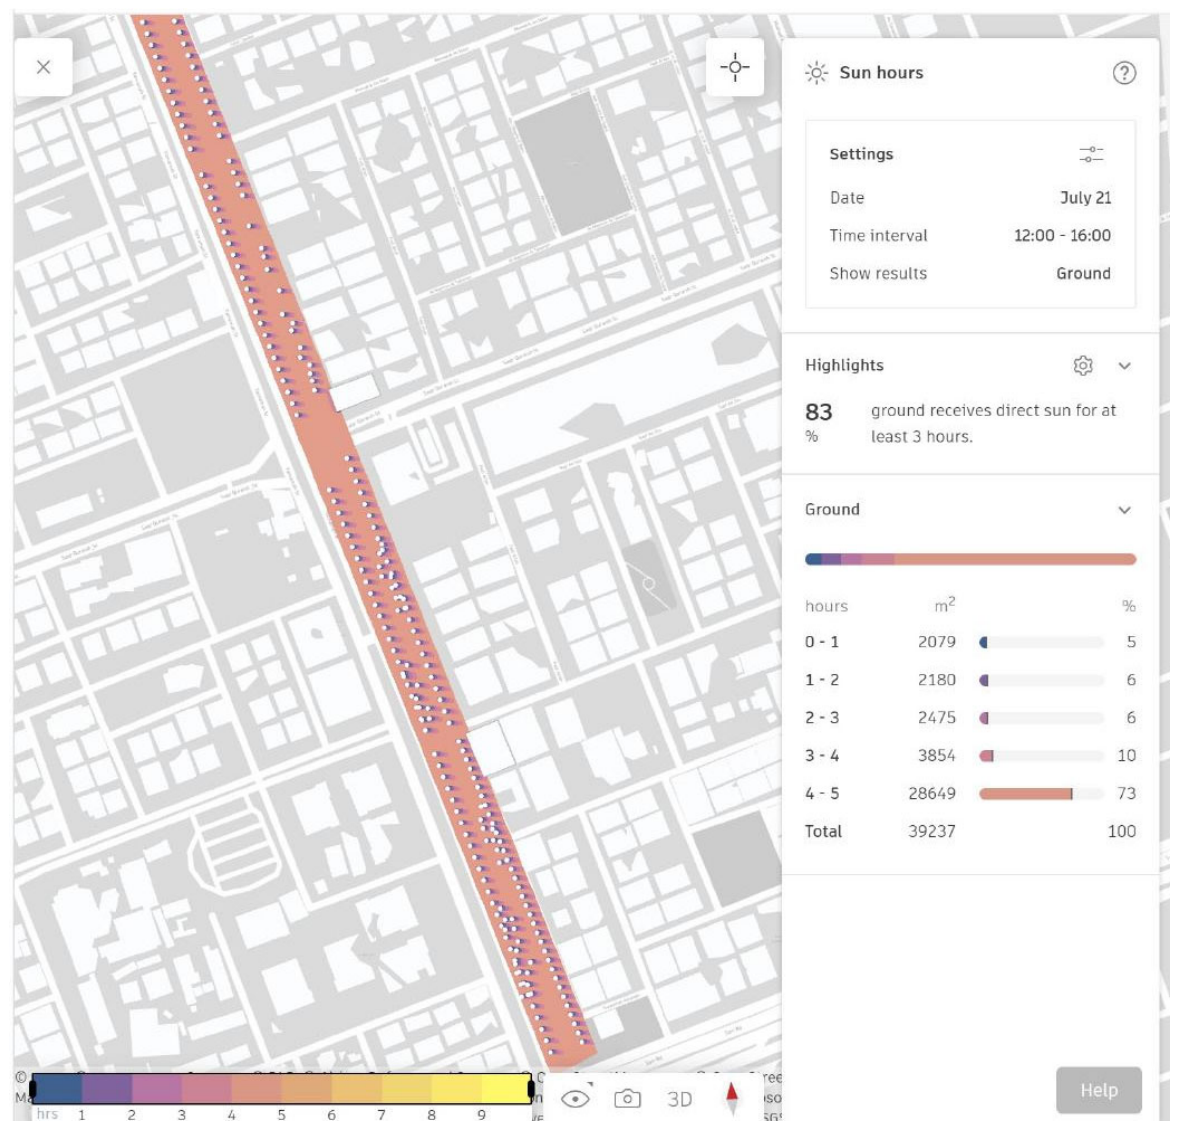
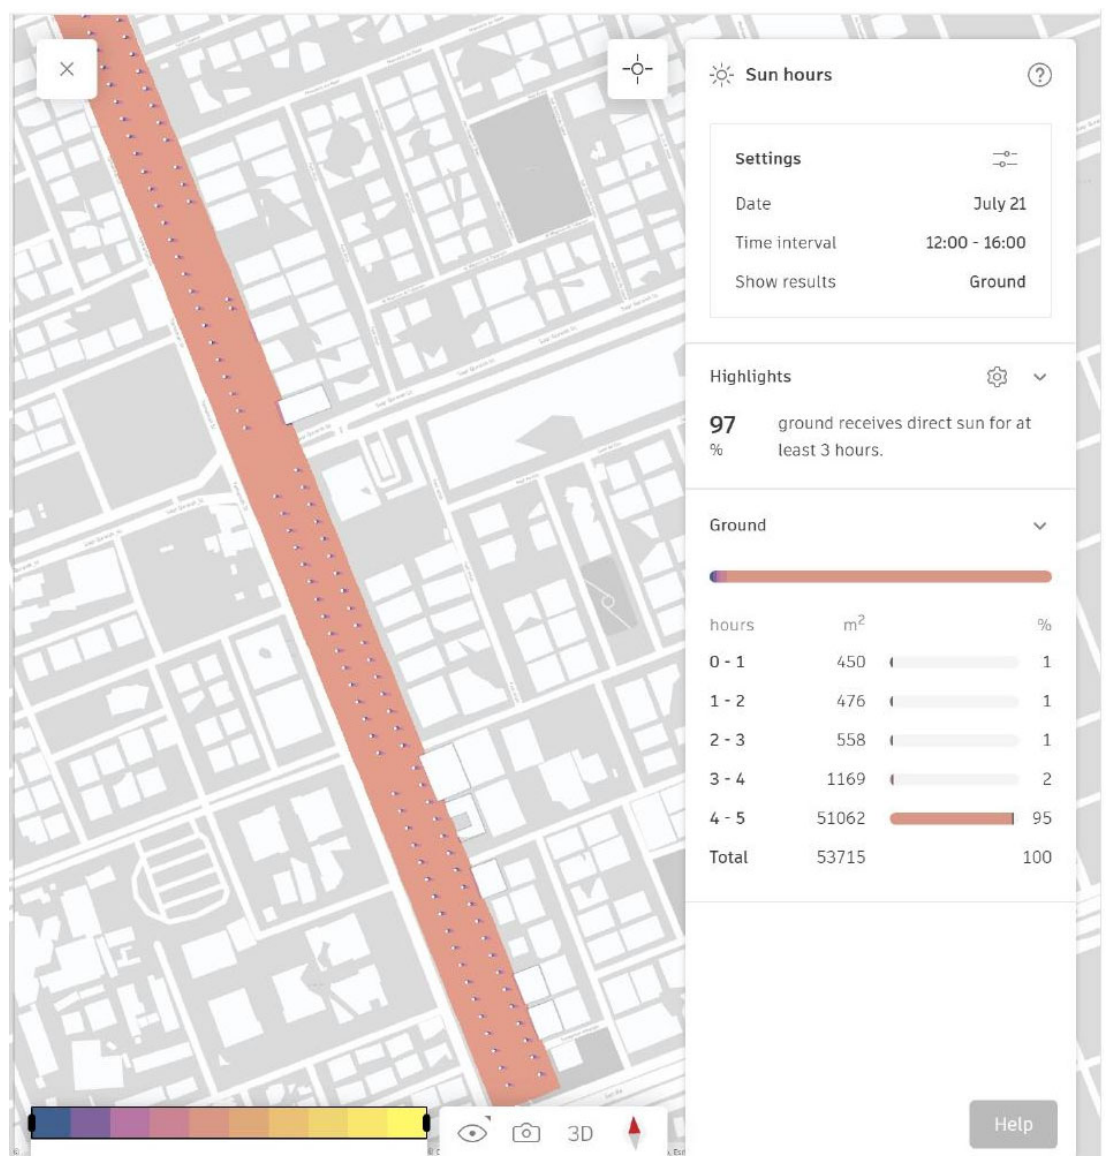
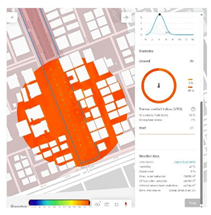
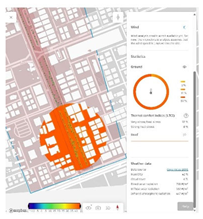
The pattern observed above is corroborated by solar exposure analysis: the corridor’s north–south alignment relative to the summer sun path results in the majority of ground area receiving more than three hours of direct sun during the 12:00–16:00 window. This figure is 83% of ground area under the 2008 tree layout and increases to 97% under the 2026 layout (a sun-hours metric independent of the UTCI comfort classification).as seen in Figure 3. This elucidates why a significant portion of the walkway remains in the most severe UTCI category, despite a near-tripling of the number of trees in the walkway and an 86% increase in canopy diameter: the corridor’s orientation generates a structurally high solar exposure load that was only partially mitigated by the canopy growth observed between 2008 and 2026.
Figure 3.
Sun-hour exposure across the corridor, 12:00–16:00, July 21, historical (top) vs. current (bottom) tree layout. Source: Authors.
4.4. Best-Identified Configuration from the Optimization Run: Hourly Performance
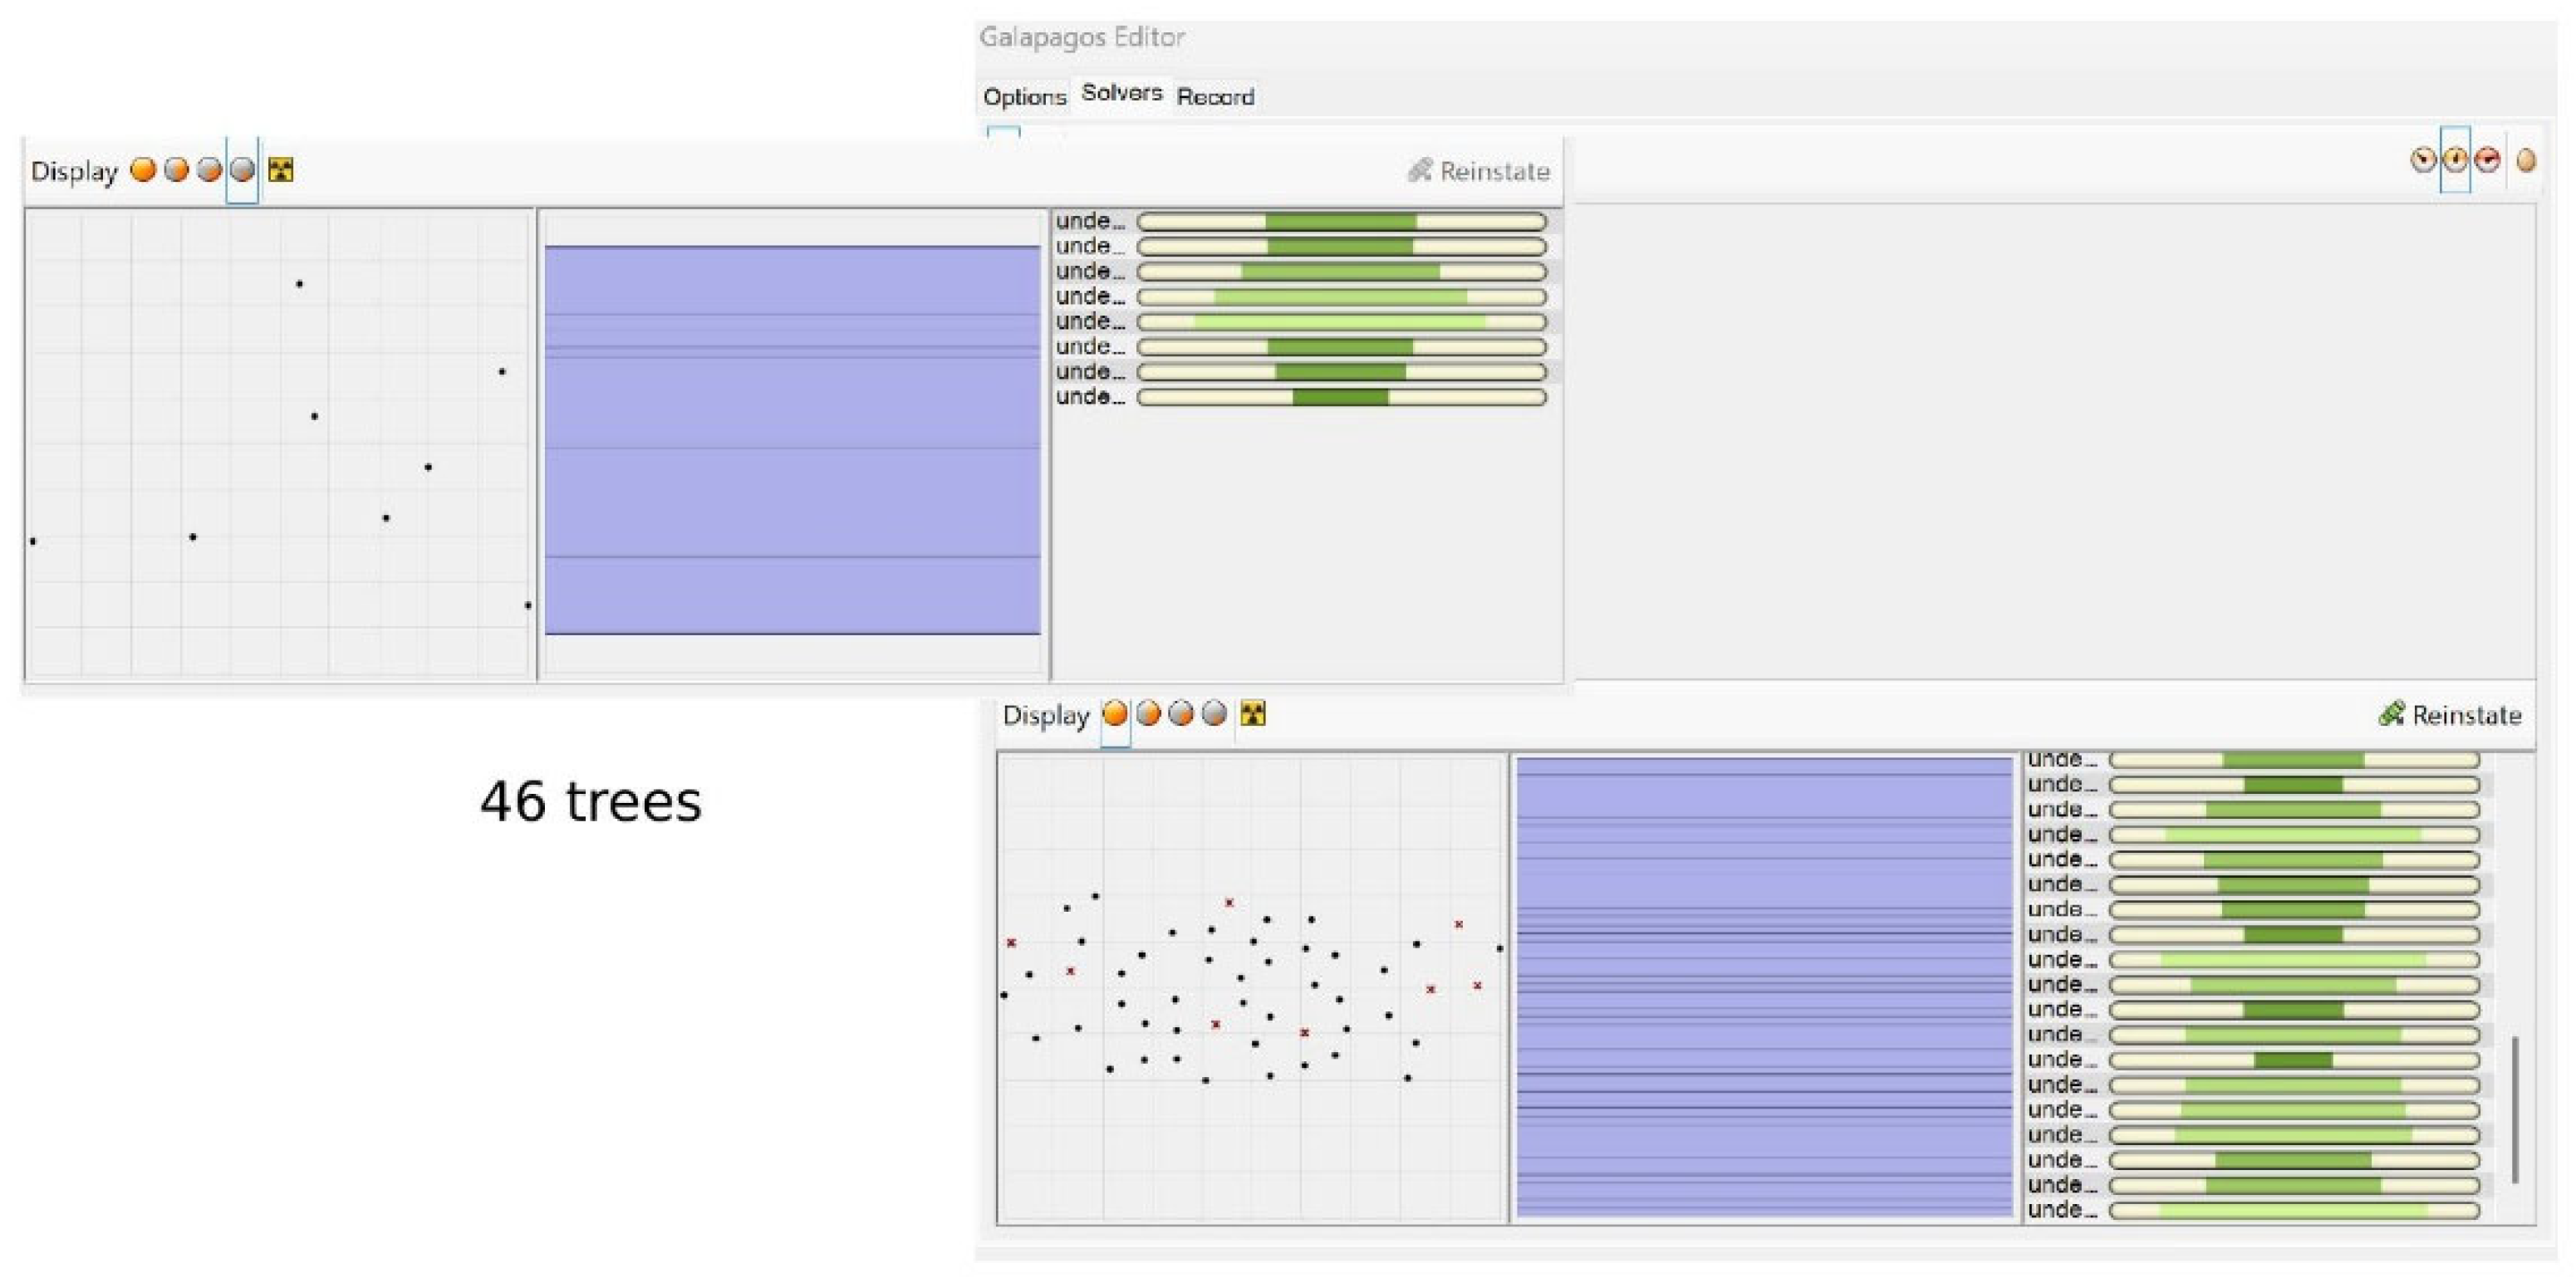
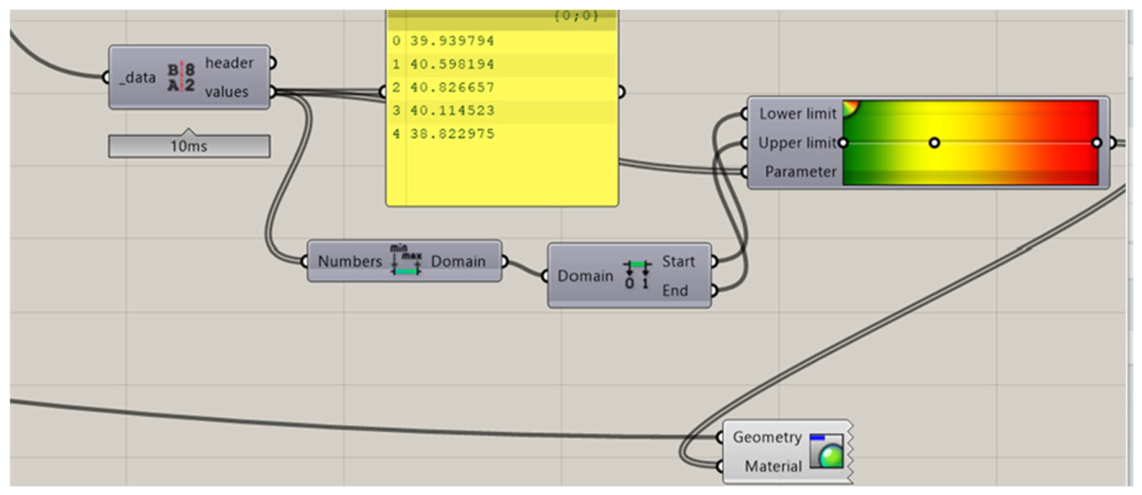
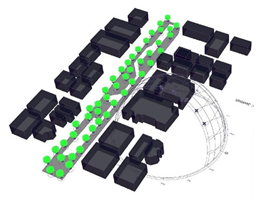
The best-identified Galapagos configuration (single run), which consists of 46 in-walkway trees at a fixed 6 m canopy diameter. was assessed during five representative daytime hours (12:00–16:00, July 22). The mean UTCI for the analysis window was 40.06 °C, with a range of 38.82 °C (16:00) to 40.83 °C (14:00) as seen in Figure 4 and Figure 5. This is in line with the anticipated diurnal peak in solar heat burden during the early-to-mid afternoon (Table 4). This is the best solution identified in the single reported run, not a demonstrated global optimum. Its mean UTCI is a Ladybug-based value that is not directly comparable with the Forma ground-area percentages for 2008 and 2026, and because the genome allowed tree count (25 in 2026 versus 46 here) as well as placement to vary, the result cannot be attributed to spatial redistribution alone.
Figure 4.
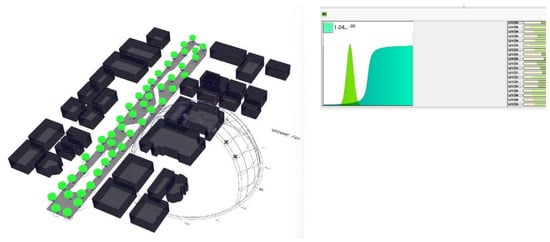
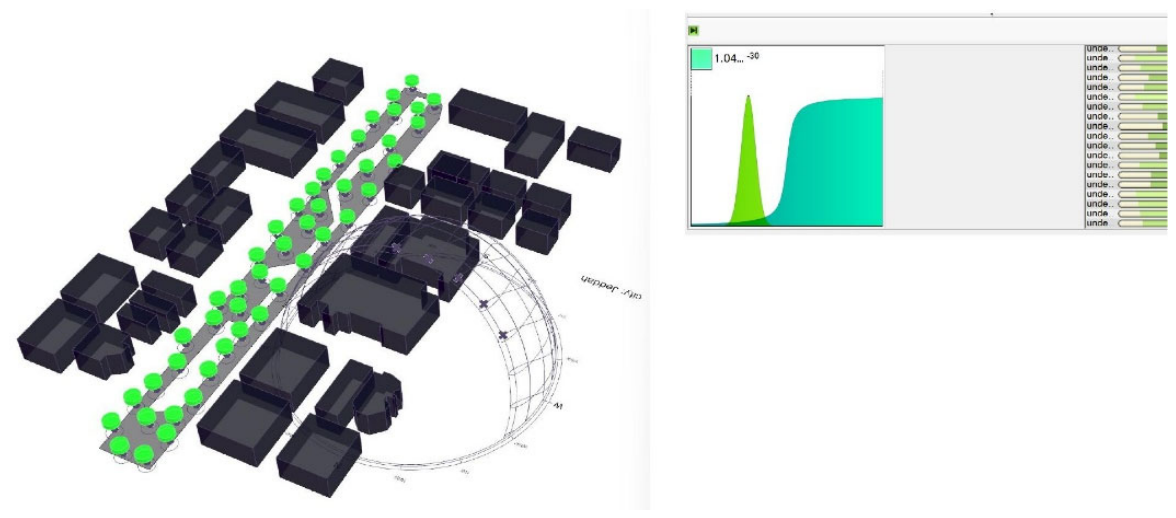
Galapagos-optimized tree distribution (46 trees, 6 m canopy diameter) along the walkway surface. Source: Authors.
Figure 5.
Extracted hourly UTCI values (top) and gradient-mapped visualization (bottom) for the optimized configuration. Source: Authors.
Table 4.
Hourly UTCI values under the optimized (46-tree) configuration.
4.5. Optimization Convergence
Fitness values stabilized after successive generations without further improvement, indicating that the fitness landscape had converged for this run (Figure 6). This convergence behavior indicates that the search stagnated at the reported solution, which is the best solution identified in the single Galapagos run conducted; because Galapagos is a stochastic evolutionary solver, single-run convergence does not by itself establish that the 46-tree configuration is a global optimum. Multiple independent runs with varied random seeds, together with a sensitivity analysis of the genome parameters (population size, mutation/inbreeding rates), would be required to fully establish solution robustness—a limitation acknowledged in Section 5.6 and identified as a priority for follow-up work. For this reason, the 46-tree arrangement is described throughout as the best solution identified in the reported run rather than as the optimal configuration.
Figure 6.
Optimized tree placement (left) and Galapagos fitness convergence plot (right), confirming solver stability at the reported optimum. Source: Authors.
4.6. Statistical Analysis of Thermal and Geometric Trends
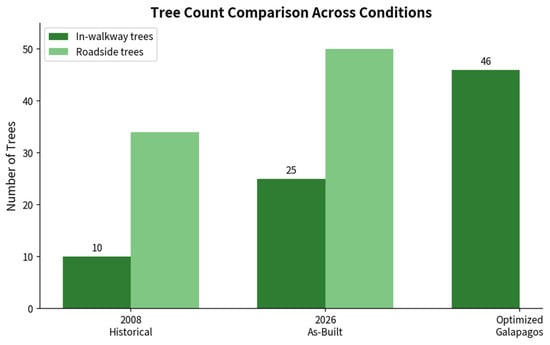
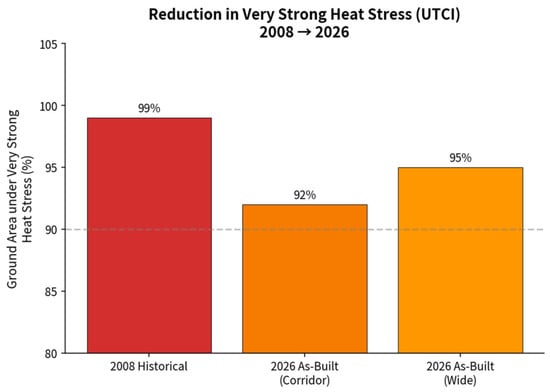
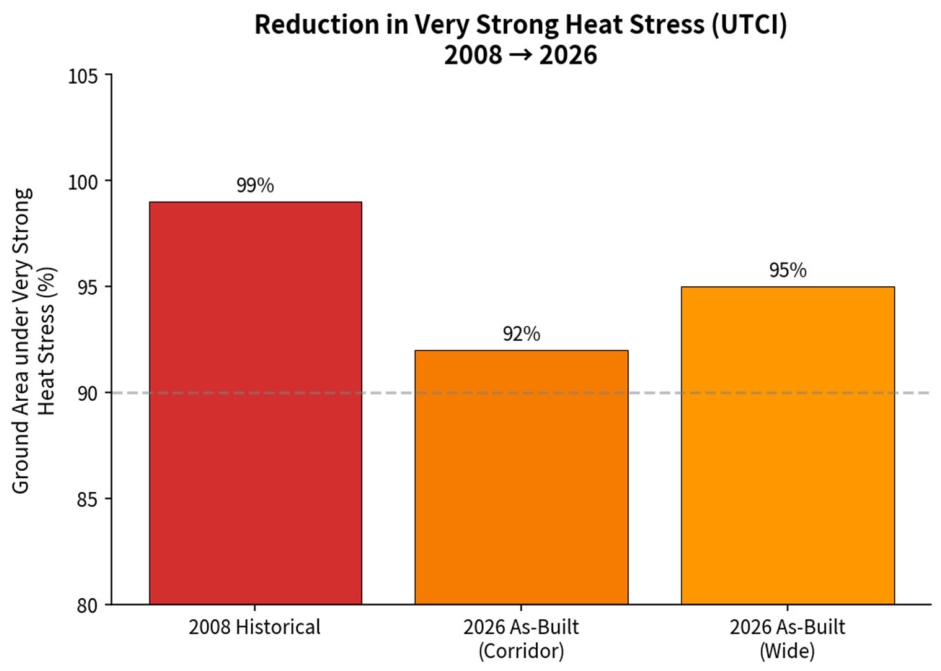
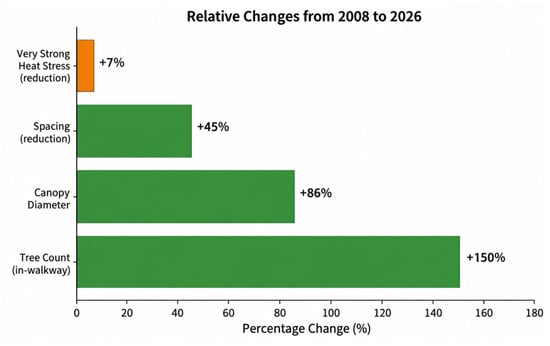
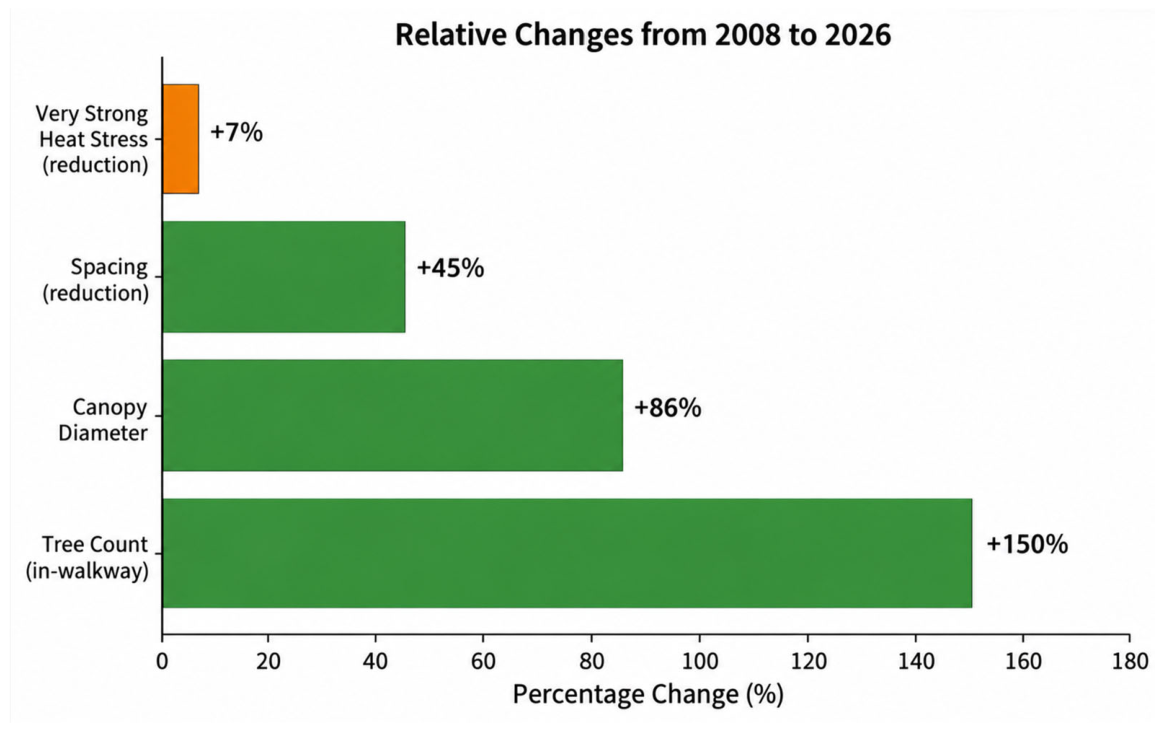
To quantify the magnitude and direction of change across the three conditions, descriptive statistics and relative-change metrics were computed from the primary simulation outputs. The in-walkway tree count increased by 150% from 2008 to 2026 and by a further 84% from the 2026 as-built state to the optimized configuration (Figure 7, Figure 8 and Figure 9). Canopy diameter expanded by 86% over the same historical interval, while average spacing contracted by 45%. The percentage of ground area under very strong heat stress declined by only 7 percentage points (from 99% to 92%), illustrating a markedly non-linear relationship between planting intensity and thermal relief. Tree-count and canopy-geometry changes are reported for all three conditions, but heat-stress outcomes are compared quantitatively only between 2008 and 2026, where the same Forma metric was used; the 40.06 °C value from the optimization run is not compared numerically with them.
Figure 7.
Tree-count comparison across the 2008 historical, 2026 as-built, and Galapagos-optimized conditions.
Figure 8.
Changes in canopy diameter, average spacing, and tree height between 2008 and 2026.
Figure 9.
Percentage of ground area under very strong heat stress (UTCI) for the 2008 and 2026 configurations.
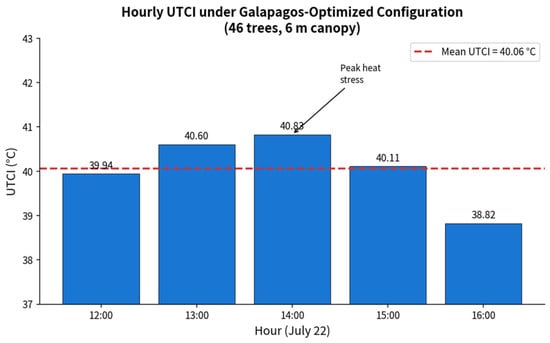
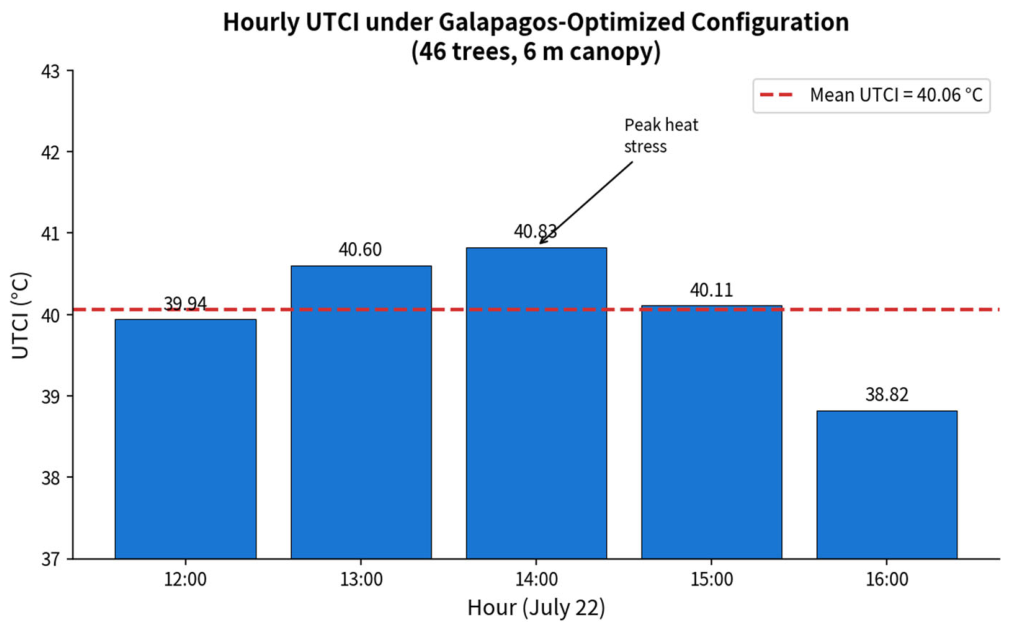
The optimized layout results in hourly UTCI values that exhibit a distinct diurnal pattern. These values increase from 39.94 °C at 12:00 to a climax of 40.83 °C at 14:00 and then decrease to 38.82 °C at 16:00 (Figure 10 and Figure 11). The redistributed canopy maintains relatively stable comfort conditions throughout the peak window, as evidenced by the low coefficient of variation across the five hours (approximately 1.9%). The average temperature of 40.06 °C is still classified as “strong heat stress” in the UTCI system. This underscores the fact that the most extreme conditions are systematically reduced in intensity and spatial extent, despite the optimized placement of a 6 m canopy, which does not eliminate severe stress under Jeddah’s midsummer solar load.
Figure 10.
Hourly UTCI under the Galapagos-optimized 46-tree configuration (mean = 40.06 °C).
Figure 11.
Relative percentage changes in key metrics from 2008 to 2026, highlighting the disparity between planting effort and thermal-comfort return.
Collectively, these statistical summaries are consistent with the descriptive finding that canopy maturation may deliver larger comfort gains than simple tree-count increases, although the study design cannot isolate these factors (Section 5.1). The 150% rise in in-walkway trees produced only a 7-point reduction in the most severe heat-stress category, whereas the separate optimization run reports a mean UTCI of 40.06 °C for a 46-tree layout at a fixed 6 m canopy; because that value comes from a different tool and metric, and because tree count and placement varied together, it is not read here as a quantified further improvement over the 2026 condition or as evidence of the separate effect of placement.
5. Discussion
5.1. Vegetation Growth Outpaced Densification—And Comfort Gains Followed Canopy, Not Count
The 2008–2026 comparison demonstrates an asymmetry that is worth emphasizing: the number of trees in the walkway nearly tripled (10→25), but the canopy diameter increased by a comparable 86% (3.5 m→6.5 m) and the spacing constricted by only 45%. The observed decrease in severe heat stress (99%→92%) is more directly explained by the resulting shift from a non-overlapping to a moderately overlapping canopy, rather than the raw tree count. This reframes a prevalent planning heuristic: the under-crediting of the comfort return that is explicitly derived from canopy maturation and overlap, as well as the over-crediting of simple tree addition, when budgeting greening investment by tree count. These observations align with earlier parametric studies that identified canopy continuity—rather than stem density—as the dominant control on mean radiant temperature reduction in hot-arid street canyons [32,33]. Similar non-linear relationships between tree number and shade efficacy have been reported in Mediterranean and Middle-Eastern urban forestry assessments, reinforcing the need for performance-based rather than purely quantitative planting standards [34,35]. This interpretation should be treated with appropriate caution: because tree number, canopy diameter, tree height, spacing, and canopy overlap all changed simultaneously between 2008 and 2026, the present before/after design cannot statistically isolate the independent contribution of any single geometric parameter to the observed change in UTCI. The relative-magnitude comparison presented here—a 150% change in tree count versus an 86% change in canopy diameter, against a 7-percentage-point change in heat-stress area—is suggestive of canopy geometry as the more influential factor, but it is a descriptive association rather than a controlled attribution; a parametric sensitivity analysis that varies each geometric factor independently would be required to formally isolate their relative contributions.
5.2. Planting Alone Plateaus Before It Resolves the Problem
Even after this substantial 2008→2026 transformation, 92–95% of the corridor’s ground area remained in the most severe UTCI category. This is the paper’s central practical finding: conventional greening—however well-funded and visually substantial—appears to plateau well short of resolving pedestrian thermal stress on a structurally high-exposure, north–south corridor. The sun-hours analysis (Section 4.3) clarifies why: rising canopy cover increased the 9+ hour direct-sun-free fraction only modestly relative to the corridor’s underlying solar geometry, which is fixed by orientation and building massing rather than vegetation. In corridors with this exposure profile, tree planting should be understood as a necessary but not sufficient intervention—a finding with direct budget-planning implications for future Vision 2030 streetscape phases. Comparable plateaus have been documented in other Gulf and North-African studies where high solar altitudes and narrow street canyons limit the marginal benefit of additional canopy once a baseline coverage threshold is reached [11,36].
5.3. The Optimization Run Identifies a Lower-UTCI Layout, but Tree Count and Placement Are Confounded
The best-identified Galapagos layout (single run), which includes 46 in-walkway trees, nearly double the as-built count, obtained a mean UTCI of 40.06 °C during peak hours at a 6 m canopy diameter (rounded from the 6.5 m as-built value). This enhancement reflects the combined effect of a larger tree count (46 vs. 25) and spatial redistribution at constant canopy diameter, which this single-objective run does not separate; the solver concentrates trees in the corridor segments with the highest solar exposure in this run, rather than spacing them at a fixed uniform interval as the as-built layout does [31]. Canopy diameter was held constant, but tree count was a free variable, so this result cannot be attributed to spatial redistribution alone: the relative contribution of “where” (placement) versus “how many” (count, from 25 to 46) was not separated, and a controlled comparison at a fixed tree count (for example, 25 optimized trees against the 25 as-built trees) would be needed to isolate it. The methodological contribution of the paper is therefore the two-stage workflow itself and the identification of a lower-UTCI candidate layout, not a demonstrated advantage of placement over tree number. In space-constrained corridors, where root zones, utilities, and paving width limit the number of trees that can be added, such a fixed-count comparison would be the most informative next step. The use of evolutionary search is consistent with a growing body of generative-design literature that has reported advantages of evolutionary or multi-objective search over uniform-grid planting for both shade continuity and outdoor thermal comfort [37,38,39,40]
5.4. Reading the Comparative Card: A Design Heuristic
The comparative card illustrated in Table 3 is intentionally designed to render one relationship immediately apparent: as the corridor progresses from left to right—from 2008 to 2026 to optimized—both canopy geometry and spatial logic evolve, despite the tree count alone implying a straightforward linear narrative. The 2008 column shows sparse, non-overlapping canopy paired with near-total heat stress; the 2026 column shows dense, overlapping canopy paired with partial, spatially uneven relief; the optimized column shows a separately simulated 46-tree layout at a fixed 6 m canopy (versus 25 trees at 6.5 m in 2026), so it differs from 2026 in both tree count and placement and is not on the same metric. Read with that caveat, the columns suggest a tentative planting sequence: first consider canopy dimensions and continuity (as evidenced by the 2008→2026 comparison), then use computational placement search with tree count treated as an explicit design variable (as explored, though not isolated, in this study’s optimization), instead of relying on tree quantity alone. This heuristic echoes climate-responsive urban design principles that call for site-specific, performance-driven green infrastructure rather than generic landscaping ratios [41,42]
5.5. Alignment with Saudi Vision 2030, and a Note on Cross-Tool Metrics
These findings directly support Vision 2030’s Quality of Life Program objectives around urban greening and walkability and empirically validate the direction of Jeddah’s 2008–2026 streetscape investment while identifying where it falls short of its likely intent [43,44,45]. A performance-validated, two-stage protocol—document and assess real conditions in a fast, context-rich tool such as Forma; then optimize placement in a parametric environment such as Grasshopper/Galapagos—offers planners a replicable method for evaluating and improving future greening investments before construction, rather than after.
A crucial point of transparency is required: the conditions for 2008 and 2026 were analyzed in Autodesk Forma and expressed as a percentage of ground area within each UTCI stress category, whereas the optimized configuration was assessed in Grasshopper/Ladybug and conveyed as an average UTCI value over representative hours, given that Forma’s optimization functionality does not encompass evolutionary spatial search. Despite both engines employing the identical UTCI framework, their MRT computation processes may not yield numerically equivalent results, and the two metrics reported (area-percentage versus point-based mean) are not strictly interchangeable. Reassessing a Forma-based area categorization for the enhanced layout—bridging the gap between the two instruments—is recognized as the most immediate subsequent action for future endeavors and is regarded here as a constraint rather than obscured as a direct comparison. This cross-tool difference means that Table 3 does not support a quantitative improvement claim between the 2026 and optimized conditions: the 2008–2026 results are the empirical before–after finding, and the 40.06 °C value is a separate optimization result. A like-for-like comparison would require re-evaluating the optimized layout in Forma, or the 2008 and 2026 layouts in Ladybug, with a common metric, which is left for future work.
5.6. Limitations
This analysis is based on a single corridor and a discrete simulation window (12:00–16:00, 21–22 July), which captures peak-stress conditions but does not represent full annual or diurnal variability. The confidence that the 46-tree configuration represents a stable global optimum rather than a single favorable convergence would be enhanced by conducting multiple optimization runs, as Galapagos utilizes a stochastic evolutionary solver. Wind effects were maintained at a constant 1 m/s throughout the site in both the Forma and Grasshopper analyses, in accordance with the default microclimate assumption of each tool in the absence of a resolved wind-flow simulation. This simplification may understate or overstate comfort in more wind-exposed or sheltered segment of the corridor. Finally, Table 3 should be read as a side-by-side presentation of an empirical before–after comparison (2008 and 2026) and a separate optimization result, not as a three-way quantitative comparison, until a common metric is applied to all three conditions (Section 5.5). In addition, the optimization genome allowed both tree count and distribution to vary, and no controlled comparison at a fixed tree count was performed; the contributions of “where” and “how many” are therefore confounded and cannot be separated here. Because only one Galapagos run was conducted, the 46-tree arrangement should be understood as the best solution identified in that run, not as an optimal configuration.
6. Conclusions
In this study, the thermal-comfort trajectory of the Al-Yamamah walkway in Jeddah was quantified, transitioning from a sparse 2008 planting regime to a denser 2026 configuration. Additionally, a single evolutionary optimization run was used to explore an alternative arrangement for a comparable canopy diameter. The empirical comparison demonstrated that the recorded increase in tree density and canopy size resulted in a measurable but limited reduction in the most severe UTCI category—from 99% to 92% of ground area—despite a 150% increase in in-walkway trees and an 86% increase in canopy diameter. This was in response to the three research questions posed at the outset. A single Galapagos run, in which both tree count and placement varied, identified a 46-tree layout of 6 m canopy diameter with a mean peak-hour UTCI of 40.06 °C in the Rhino/Grasshopper–Ladybug framework. Because this value comes from a different tool and metric than the Forma results for 2008 and 2026, it is reported as the best solution identified in that run, not as a quantified improvement over the as-built 2026 condition, and it does not by itself show that the as-built arrangement is suboptimal or that placement matters more than tree count. These results provide practical, data-driven planting advice: When designing future Vision 2030 streetscape interventions in north–south corridors of similar solar exposure, prioritize canopy continuity and evaluate tree placement and tree count jointly, rather than relying on uniform spacing or simple head-count objectives.
The research contributes a reproducible two-stage workflow that combines evolutionary spatial search with a rapid, context-rich microclimate assessment of real conditions. Consequently, greening practice transitions from descriptive inventory to prescriptive performance optimization. The statistical analysis of the geometric and thermal metrics indicated a non-linear association between planting effort and comfort return, suggesting that canopy maturation may influence outcomes more strongly than absolute tree numbers, although this cannot be attributed to any single factor given the study design. In space-constrained corridors, where root zones and utilities limit the number of trees that can be added, the relative value of “how many” versus “where” remains an open question, because tree count and placement varied together in the optimization and no fixed-count comparison was made. The results empirically validate the direction of Jeddah’s recent greening investments and suggest, pending a fixed-count comparison and a common metric, that algorithmic search may identify layouts with lower simulated UTCI. In summary, the 150% increase in in-walkway tree count, 86% increase in canopy diameter, and 45% reduction in average spacing between 2008 and 2026 corresponded to only a 7-percentage-point reduction in severe heat-stress area (99% to 92%), while a separate single-run evolutionary optimization, in which tree count and placement varied together, identified a best-solution 46-tree, 6 m-canopy configuration with a mean peak-hour UTCI of 40.06 °C (range 38.82–40.83 °C across the analysis window). The optimization value is not directly comparable with the Forma-based 2008 and 2026 results. These findings should be read in light of the study’s scope a single corridor, a limited summer peak-exposure window, a uniform wind-speed assumption, and the cross-tool metric comparability constraints discussed in Section 5.5 and Section 5.6.
In order to evaluate the transferability of the observed placement patterns, future research should expand the analysis to encompass multiple corridors with varying orientation and aspect ratios. The integration of comprehensive diurnal and seasonal weather files would enable the evaluation of annual comfort hours, rather than relying solely on peak-window means. The current uniform 1 m/s assumption simplifies wind-flow interactions, which could be captured by combining the UTCI optimization with resolved computational fluid dynamics. The confidence in global optimality would be enhanced by the use of alternative meta-heuristics, such as genetic algorithms with multi-objective fitness landscapes, or multiple independent Galapagos runs. Additional genome variables, such as species-specific canopy growth trajectories, root-volume constraints, and life-cycle cost metrics, could be implemented to facilitate multi-objective optimization that effectively balances biodiversity, maintenance burden, and thermal performance. Lastly, the cross-tool metric gap can be bridged by re-evaluating the optimized layout within a single simulation engine. This would enable fully commensurate before–after–optimized comparisons and further solidify the evidence base for performance-driven urban forestry under Saudi Vision 2030 and comparable climate-adaptation programs in hot coastal cities. A controlled comparison at a fixed tree count (for example, optimizing the placement of 25 trees against the as-built 25) would separate the effect of “where” from that of “how many”.
Author Contributions
Conceptualization, R.A. and S.E.K.; methodology, R.A.; software, R.A.; validation, R.A. and S.E.K.; formal analysis, R.A.; investigation, R.A.; resources, R.A. and S.E.K.; data curation, R.A.; writing—original draft preparation, R.A.; writing—review and editing, R.A. and S.E.K.; visualization, R.A.; supervision, S.E.K.; project administration, R.A.; funding acquisition, S.E.K. All authors have read and agreed to the published version of the manuscript.
Funding
This research received no external funding.
Institutional Review Board Statement
Not applicable. This study did not involve human participants, animals, or the collection of personal or biological data. The research was based on computational thermal simulations, spatial analysis, and parametric optimization.
Informed Consent Statement
Not applicable. This study did not involve human participants.
Data Availability Statement
The data supporting the findings of this study are available from the corresponding author upon reasonable request.
Acknowledgments
The authors would like to acknowledge the technical and computational resources that supported the development of this research.
Conflicts of Interest
The authors declare no conflicts of interest.
References
- Ebi, K.L.; Capon, A.; Berry, P.; Broderick, C.; de Dear, R.; Havenith, G.; Honda, Y.; Kovats, R.S.; Ma, W.; Malik, A.; et al. Hot weather and heat extremes: Health risks. Lancet 2021, 398, 698–708. [Google Scholar] [CrossRef] [Scilit] [PubMed]
- Effat, H.A.; Hassan, O.A.K. Change detection of urban heat islands and some related parameters using multi-temporal Landsat images; a case study for Cairo city, Egypt. Urban Clim. 2014, 10, 171–188. [Google Scholar] [CrossRef] [Scilit]
- Zhan, D.; Sezer, N.; Hou, D.; Wang, L.; Hassan, I.G. Integrating Urban Heat Island Impact into Building Energy Assessment in a Hot-Arid City. Buildings 2023, 13, 1818. [Google Scholar] [CrossRef] [Scilit]
- Tuholske, C.; Caylor, K.; Funk, C.; Verdin, A.; Sweeney, S.; Grace, K.; Peterson, P.; Evans, T. Global urban population exposure to extreme heat. Proc. Natl. Acad. Sci. USA 2021, 118, e2024792118. [Google Scholar] [CrossRef] [Scilit] [PubMed]
- Shaheen, R.Z.; Maatouk, M.M.H.; Qurban, R. Investigation of Quality-of-Life Indicators across Jeddah City Neighbourhoods: Residents’ Experience and Satisfaction. Front. Built Environ. 2026, 12, 1830841. [Google Scholar] [CrossRef] [Scilit]
- Mahboob, A.M. Transforming Riyadh: Urban development, quality of life, and spatial equity under Vision 2030. Int. J. Low-Carbon Technol. 2025, 20, 1842–1854. [Google Scholar] [CrossRef]
- Koenig, R.; Miao, Y.; Aichinger, A.; Knecht, K.; Konieva, K. Integrating urban analysis, generative design, and evolutionary optimization for solving urban design problems. Environ. Plan. B Urban Anal. City Sci. 2020, 47, 997–1013. [Google Scholar] [CrossRef] [Scilit]
- van Veghel, J.; Dane, G.; Agugiaro, G.; Borgers, A. Human-centric computational urban design: Optimizing high-density urban areas to enhance human subjective well-being. Comput. Urban Sci. 2024, 4, 13. [Google Scholar] [CrossRef] [Scilit]
- Serangeli, B.; Ciardiello, A.; Mannucci, S.; Rosso, F.; Ferrero, M. Transforming the Built Environment Through Computational Techniques: An Overview of Parametric, Generative, and Algorithmic Design. In Envisioning the Futures—Designing and Building for People and the Environment; Springer: Cham, Switzerland, 2025; pp. 790–809. [Google Scholar] [CrossRef] [Scilit]
- Hazbei, M.; Rafati, N.; Kharma, N.; Eicker, U. Optimizing architectural multi-dimensional forms; a hybrid approach integrating approximate evolutionary search, clustering and local optimization. Energy Build. 2024, 318, 114460. [Google Scholar] [CrossRef] [Scilit]
- Arya, S. Harnessing Big Data and Machine Learning for Climate Change Predictions and Mitigation. In Maintaining a Sustainable World in the Nexus of Environmental Science and AI; IGI Global Scientific Publishing: Hershey, PA, USA, 2024; pp. 383–408. [Google Scholar] [CrossRef] [Scilit]
- Derix, C. Digital masterplanning: Computing urban design. Proc. Inst. Civ. Eng. Urban Des. Plan. 2012, 165, 203–217. [Google Scholar] [CrossRef] [Scilit]
- Hanzl, M.; Tofiluk, A.; Zinowiec-Cieplik, K.; Grochulska-Salak, M.; Nowak, A. The Role of Vegetation in Climate Adaptability: Case Studies of Lodz and Warsaw. Urban Plan. 2021, 6, 9–24. [Google Scholar] [CrossRef] [Scilit]
- Carter, N. Greening the mainstream: Party politics and the environment. Env. Polit. 2013, 22, 73–94. [Google Scholar] [CrossRef] [Scilit]
- Kim, Y.J.; Brown, R.D. Climate-sensitive street design: Evaluating summer pedestrian activity and behavioral thermal adaptation on the high line, NYC. Build. Environ. 2025, 281, 113203. [Google Scholar] [CrossRef] [Scilit]
- Chen, L.; Ng, E. Outdoor thermal comfort and outdoor activities: A review of research in the past decade. Cities 2012, 29, 118–125. [Google Scholar] [CrossRef] [Scilit]
- Lin, T.P. Thermal perception, adaptation and attendance in a public square in hot and humid regions. Build. Environ. 2009, 44, 2017–2026. [Google Scholar] [CrossRef] [Scilit]
- Lai, D.; Guo, D.; Hou, Y.; Lin, C.; Chen, Q. Studies of outdoor thermal comfort in northern China. Build. Environ. 2014, 77, 110–118. [Google Scholar] [CrossRef] [Scilit]
- Tamminga, K.; Cortesão, J.; Bakx, M. Convivial Greenstreets: A Concept for Climate-Responsive Urban Design. Sustainability 2020, 12, 3790. [Google Scholar] [CrossRef] [Scilit]
- Brandsma, S.; Lenzholzer, S.; Carsjens, G.J.; Brown, R.D.; Tavares, S. Implementation of urban climate-responsive design strategies: An international overview. J. Urban Des. 2024, 29, 598–623. [Google Scholar] [CrossRef] [Scilit]
- Lenzholzer, S.; Carsjens, G.-J.; Brown, R.D.; Tavares, S.; Vanos, J.; Kim, Y.; Lee, K. Awareness of urban climate adaptation strategies—An international overview. Urban Clim. 2020, 34, 100705. [Google Scholar] [CrossRef] [Scilit]
- Elnabawi Mahgoub, M.H.; Alshehhi, S.S.; Elgendy, L.; Al Madhani, L.A.; Almehairi, M.A.; Alefari, F.G. Outdoor thermal comfort in hot arid and semi-arid cities of the Middle East and North Africa: Current knowledge, gaps, and a framework for climate-sensitive urban design. Front. Sustain. Cities 2026, 8, 1792739. [Google Scholar] [CrossRef] [Scilit]
- Abdelmejeed, A.Y.; Gruehn, D. Optimization of Microclimate Conditions Considering Urban Morphology and Trees Using ENVI-Met: A Case Study of Cairo City. Land 2023, 12, 2145. [Google Scholar] [CrossRef] [Scilit]
- Meliouh, F.; Ghanemi, F.; Hamel, K.; Nasri, M.; Makhloufi, S. Greening the arid: The impact of urban vegetation on the outdoor thermal comfort in hot and dry city. South Fla. J. Dev. 2024, 5, e4718. [Google Scholar] [CrossRef] [Scilit]
- Santhanam, N.; Batra, G.; Arora, N.; Gupta, N. Saudi Arabia’s Vision 2030: Towards a Transformed Future; Ayna: San Jose, CA, USA, 2023. [Google Scholar]
- Gov, W.E. Country Analysis Brief: Saudi Arabia. 2024. Available online: www.eia.gov (accessed on 15 October 2026).
- Saudi Green Initiative (SGI). Saudi Arabia Accelerates Climate Action: By 2030, 278 Mtpa Emissions to be Reduced, over 600 Million Trees Planted and 30% of the Country’s Land and Sea Protected. 2022. Available online: https://www.vision2030.gov.sa/en/explore/projects/saudi-green-initiative (accessed on 7 October 2025).
- Sadaoui, N.; Benlaria, H.; Almawishir, N.F.; Abdelrhman, B.S.; Ahmed, S.A.K.; Zabat, L.; Abdulrahman, B.M.A. How technological innovation and organizational culture influence circular economy adoption over time in Saudi Arabian manufacturing. Discov. Sustain. 2025, 6, 713. [Google Scholar] [CrossRef] [Scilit]
- Wakayama, M.; Mameno, K.; Owake, T.; Aikoh, T.; Shoji, Y. Climate change-induced heat reduces urban green space use: Insights from mobile phone location big data. Urban For. Urban Green. 2025, 107, 128771. [Google Scholar] [CrossRef] [Scilit]
- Alshehri, A.J.; Alqahtany, A.M.; Alshammari, M.S. Towards a Sustainable Future: Transportation Solutions and Urban Development in Jeddah, Saudi Arabia. Preprints 2025, 2025050840. [Google Scholar] [CrossRef] [Scilit]
- Elkhateeb, S.; Anwar, R. Parametric Optimization of Urban Street Tree Placement: Computational Workflow for Dynamic Shade Provision in Hot Climates. Urban Sci. 2025, 9, 504. [Google Scholar] [CrossRef] [Scilit]
- Meng, Y.; Du, W.; Chen, L.; Zhao, Z.; Du, H.; Li, Z.; Song, M.; Tuohetaerhan, S. Ecosystem services in the Northern Tianshan Urban Agglomeration: Nonlinear responses to natural and human factors and threshold-based spatial optimization strategies. J. Hydrol. Reg. Stud. 2025, 61, 102682. [Google Scholar] [CrossRef] [Scilit]
- Liu, F.; Wang, L.; Cao, Q.; Gao, J.; Zhang, Z.; Sun, J. Quantifying the cooling benefits driven by global urban tree cover restoration. Appl. Geogr. 2025, 185, 103798. [Google Scholar] [CrossRef] [Scilit]
- Jia, J.; Wang, L.; Yao, Y.; Jing, Z.; Zhai, Y.; Ren, Z.; He, X.; Li, R.; Zhang, X.; Chen, Y.; et al. Nonlinear relationships between canopy structure and cooling effects in urban forests: Insights from 3D structural diversity at the single tree and community scales. Sustain. Cities Soc. 2025, 118, 106012. [Google Scholar] [CrossRef] [Scilit]
- Zhang, Y.; Shi, G.; Wen, J.; Zhang, Y.; Wang, B. Response of vegetation productivity and resilience to extreme climate events under a grazing pressure gradient on the Qinghai-Tibetan Plateau. J. Environ. Manag. 2025, 392, 126851. [Google Scholar] [CrossRef] [Scilit] [PubMed]
- Li, Y. Resilient Urban Design Concept in the Context of Climate Change. Adv. Econ. Manag. Political Sci. 2024, 123, 79–85. [Google Scholar] [CrossRef] [Scilit]
- Cai, S.; Pang, Y. A tree crown edge-aware clipping algorithm for airborne LiDAR point clouds. Int. J. Appl. Earth Obs. Geoinf. 2025, 136, 104381. [Google Scholar] [CrossRef] [Scilit]
- Krischke, J.; Beckmann-Wübbelt, A.; Glaser, R.; Dey, S.; Saha, S. Relationship Between Urban Tree Diversity and Human Well-being: Implications for Urban Planning. Sustain. Cities Soc. 2025, 124, 106294. [Google Scholar] [CrossRef] [Scilit]
- Shen, W.; Liu, Q.; Ji, M.; He, J.; He, T.; Huang, C. Impacts of urban forests and landscape characteristics on land surface temperature in two urban agglomeration areas of China. Sustain. Cities Soc. 2023, 99, 104909. [Google Scholar] [CrossRef] [Scilit]
- Xiao, Y.; Huang, Y.; Pan, X. Optimizing Thermal Comfort in Urban Squares of Hot-Humid Regions: A Case Study Considering Tree Growth, Species, and Planting Intervals. Atmosphere 2025, 16, 63. [Google Scholar] [CrossRef] [Scilit]
- Sharifi, A. Co-benefits and synergies between urban climate change mitigation and adaptation measures: A literature review. Sci. Total Environ. 2021, 750, 141642. [Google Scholar] [CrossRef] [Scilit] [PubMed]
- Daniel, R.; Cortesão, J.; Steeneveld, G.J.; Stremke, S.; Lenzholzer, S. Performance of urban climate-responsive design interventions in combining climate adaptation and mitigation. Build. Environ. 2023, 236, 110227. [Google Scholar] [CrossRef] [Scilit]
- Al Shehri, T.; Braun, J.F.; Howarth, N.; Lanza, A.; Luomi, M. Saudi Arabia’s Climate Change Policy and the Circular Carbon Economy Approach. Clim. Policy 2023, 23, 151–167. [Google Scholar] [CrossRef] [Scilit]
- Saudi Vision 2030. Vision 2030 Annual Report 2023. Available online: https://www.vision2030.gov.sa/media/xi2jlj0y/english_vision2030_annual_report_2023.pdf (accessed on 15 October 2026).
- Berkhout, F.; Verbong, G.; Wieczorek, A.J.; Raven, R.; Lebel, L.; Bai, X. Sustainability experiments in Asia: Innovations shaping alternative development pathways? Environ. Sci. Policy 2010, 13, 261–271. [Google Scholar] [CrossRef] [Scilit]

Disclaimer/Publisher’s Note: The statements, opinions and data contained in all publications are solely those of the individual author(s) and contributor(s) and not of MDPI and/or the editor(s). MDPI and/or the editor(s) disclaim responsibility for any injury to people or property resulting from any ideas, methods, instructions or products referred to in the content. |
© 2026 by the authors. Licensee MDPI, Basel, Switzerland. This article is an open access article distributed under the terms and conditions of the Creative Commons Attribution (CC BY) license.