


Abstract
Urban public spaces matter for young people, yet how youth visually engage with the spatial elements of Indian cities remains largely unstudied. This exploratory study uses screen-based eye tracking to examine how 43 design-discipline students (aged 18–29) allocate visual attention across urban public space scenes in Jaipur, India. Thirty photographic stimuli sampling five Lynch-derived spatial elements—edge, landmark, path, plaza, and transit node—across six public spaces were each analyzed through four semantic areas of interest (built form, human and vehicular activity, natural elements, and circulation), using fixation count, total fixation duration, time to first fixation, and visit count. Attention was allocated unevenly: built form and human activity dominated the youth gaze, while natural elements consistently drew less focal attention—interpreted as restorative background rather than low importance. Landmarks anchored attention most strongly and transit nodes least. Notably, socially active and visually complex elements did not capture the gaze earliest but held it longest, suggesting that what sustains youth attention is dissociable from what initially attracts it. Inferential tests are treated as exploratory given the repeated-measures design. As the first AOI-based account of youth visual attention in Indian heritage public space, this study offers a transferable protocol and preliminary, exploratory directions for youth-responsive design—including visual anchoring at neglected transit nodes and the use of greenery for ambient comfort rather than focal emphasis.
1. Introduction
Urban public spaces are important settings in daily city life. They support movement, leisure, social interaction, and informal social activities. These spaces are especially important for young people as they not only support social interaction and movement but also provide opportunities to have informal social activities, spend free time, and develop independence. Public space study is a key area in studies of the built environment and environmental psychology, considering human experiences in various spatial contexts. Visual characteristics, including legibility, imageability, and spatial coherence, have been repeatedly recognized in the literature on urban design as having a major impact on people’s understanding and use of urban surroundings [1,2,3]. For the purpose of this study, the five spatial elements are operationally defined as follows. An edge is a linear boundary that separates or encloses spatial zones, such as boundary walls, water edges, or continuous building frontages. A landmark is a visually prominent reference object, such as a monument, gate, or distinctive façade. A path is a channel of pedestrian or vehicular movement. A plaza is an open public gathering space, and a transit node is a point of modal interchange, such as a bus stop, drop-off, or junction. These definitions adapt Kevin Lynch’s [3] elements of urban imageability, discussed further in Section 2.1. Therefore, it is believed that evaluating the quality of public spaces requires both perceptual and emotional responses.
Young people aged 18–29 are intensive users of urban public space for informal socializing, leisure, and the development of independence and identity, and they form a demographically significant group in rapidly urbanizing Indian cities. However, Indian planning instruments rarely differentiate the spatial needs of youth, and empirical evidence on how young people visually engage with public space in the Indian context remains largely absent. Understanding youth visual attention can therefore inform more inclusive and age-responsive public space design.
This study aims to investigate the youths’ engagement with different spatial elements of urban public spaces using eye-tracking technology. The findings aim to support planners and designers in creating more inclusive and youth-responsive public spaces. To address the research gap, the following research questions are framed for the scope of the study:
RQ1: How do youth visually perceive and engage with different spatial elements of urban public spaces?
RQ2: How do environmental characteristics influence visual attention patterns in public spaces?
RQ3: Do socially vibrant and visually prominent spatial elements attract earlier and stronger visual attention from youth?
This study addresses these gaps and makes a contribution that is primarily methodological and contextual rather than theoretical. Although eye tracking is now established in built environment research, most prior studies examine façades, streetscapes, or wayfinding in Western or East Asian settings; to our knowledge, this is the first study to apply an area-of-interest (AOI) eye-tracking protocol to youth visual attention across the spatial elements of Indian heritage public space. Specifically, it offers three contributions: (1) an empirical dissociation between attention capture (time to first fixation) and attention holding (total fixation duration) in real public space scenes; (2) a transferable AOI-based “semantic attention budget” (built form, human and vehicular activity, natural elements, and circulation) for quantifying how attention is distributed within a scene; and (3) the translation of these patterns into preliminary, youth-responsive design implications for a non-Western heritage context.
2. Background and Literature Review
To provide background for the study, we presented a synthesis of the existing literature across several subsections, including typologies of public spaces, youth engagement in urban public spaces, environmental and social factors of engagement, eye-tracking studies in the built environment, and existing tools and study methods. Public spaces have been classified in varied ways across planning systems and cultural contexts; rather than adopting a broad typology, this study operationalizes five Lynchian spatial elements observable within public space scenes, as defined in Section 2.1.
2.1. Urban Imageability and Spatial Elements
The selection of spatial elements in this study is grounded in Kevin Lynch’s [3] theory of urban imageability, which proposes that people form mental images of cities through five recurring elements: paths, edges, districts, nodes, and landmarks. Paths are the channels along which observers move; edges are linear boundaries between zones; districts are medium-to-large areas with a recognizable character; nodes are strategic points or junctions a person can enter; and landmarks are external point references that aid orientation. These elements have become a foundational vocabulary in urban design for analyzing legibility and wayfinding, and they translate well to the study of visual attention because each is a perceptually distinct feature that the eye can locate within a scene. Beyond Lynch’s legibility elements, the geometric and structural properties of the environment—such as the layered symmetries, boundaries, and ordered complexity described by Alexander [4]—also shape visual salience, and recent eye-tracking work links such geometric features to measurable patterns of attention (Section 2.5).
This study adapts Lynch’s framework to the Indian public space context rather than applying it wholesale. District is excluded because it is a regional cognitive zone perceived over time and movement and cannot be represented within a single static photographic scene. Plaza is added because open gathering forecourts are functionally and culturally central to Indian public space—for example, the forecourts of Albert Hall and Patrika Gate—and they constitute a discrete, observable element distinct from a path or node. Finally, the broad category node is narrowed to a transit node so that it can be operationalized as a concrete, photographable point of interchange (bus stop, drop-off, junction) rather than an abstract decision point. Together, edge, landmark, path, plaza, and transit nodes provide a Lynch-derived yet locally meaningful set of elements for examining youth visual attention in Jaipur.
2.2. Youth Engagement in Urban Public Spaces
Youth are not simply pedestrians in general: young people aged 18–29 differ from other age groups in how they use and read public space. They are disproportionately affected by exclusionary regulation and surveillance, and their environmental preferences and risk perceptions differ measurably from those of older adults [5,6,7,8]. Treating youth as a distinct user group is therefore both theoretically justified and practically consequential. We emphasize that this distinction is behavioral, social, and cultural rather than physiological: we make no claim that the visual system of young adults differs biologically from that of older adults, only that their patterns of use, valuation, and regulation in public space differ in ways that are relevant to design.
Young people’s use of public areas is influenced by environmental factors, according to research; accessibility, greenery, seating, shade, and safety are all factors that attract young people to come and stay longer [9,10]. Young people are more likely to roam about and unwind in public areas when there are cozy areas and well-maintained walkways [11]. Peer-contact opportunities encourage youth involvement, whereas stringent regulation, monitoring, and surveillance can deter young people from using public areas [12], and places where youth feel excluded may remain underused even when well designed. Beyond these physical factors, social variables—particularly perceived safety—and cultural elements strongly shape young people’s spatial experience of, and attachment to, public space [6,7,8]. Stronger affiliation, connection, and a sense of belonging are typically fostered by places where youth can congregate freely and participate in casual get-togethers.
2.3. Environmental, Social, Cultural, and Governance Factors
Public areas are preferred by young people due to a variety of interrelated causes. These include elements of the surroundings, including use, comfort, and esthetic appeal. The influencing factors of youth engagement in public spaces are presented in Table 1 below.
Table 1.
Presents factors, attributes, and influence directions.
While previous studies have identified environmental, social, cultural, and governance factors shaping youth engagement in public spaces, most research relies on surveys, interviews, or observational methods. Many studies employ short-term data, concentrate on a small number of places, rely mostly on surveys or interviews, and use cross-sectional case studies. Longitudinal research is limited, and just a small number of studies addressed the use of user experience data in conjunction with geographical analytic methods. There are not many studies that look at how these spatial features affect visual attention and perception in real time. Eye tracking provides a means of impartially analyzing how people visually engage with their surroundings in public areas. The studies’ uneven and dispersed representation fails to adequately reflect young people’s evolving needs and geographical experiences.
2.4. Urban Spatial Elements and Visual Perception and Visual Attention
Research on public places is intimately related to visual attention, which influences how people perceive public areas by converting spatial cues into behavioral reactions. Important details on cognitive functions, decision-making, and interaction with spatial cues can be gleaned from eye movements. This area of study is also closely related to another term, visual perception. The mechanisms by which people use sight to monitor, interpret, and comprehend their surroundings are referred to as visual perception. The interplay of spatial form, scale, movement, activity, and environmental factors shapes this sense in urban public places [26]. The interpretation of objects, phenomena, and environmental processes based on cues acquired through the visual system is known as visual perception, and it is acknowledged as a sophisticated cognitive process [26,27]. This process connects to neuro-urbanism [28], an emerging field that guides evidence-based urban planning to enhance human experience, health, and well-being. Neuro-urbanism bridges evidence-based urban design and application by proposing a reproducible paradigm for detecting urban problems and their cognitive impacts.
2.5. Eye Tracking in Built Environment Research
Eye-tracking (ET) technology offers a dependable and impartial way to investigate visual and cognitive interaction with spatial settings. According to an earlier study, eye tracking is a cutting-edge technique in perceptual and cognitive studies that is applied in a variety of academic fields [29]. It tracks eye movements to capture real-time gaze data and analyzes visual attention and perception in relation to human–environment interaction. Eye tracking creates measurable measurements by capturing eye movements. The majority of ET systems use corneal reflection and infrared illumination to comprehend users’ eye movements, visual patterns, and concentration duration [30]. Depending on design, research goals, and the geographical context, the stationary desktop trackers are utilized for controlled laboratory tests, mobile head-mounted systems for field-based investigations, and VR-integrated devices for immersive simulations. In urban research, eye-tracking investigations are carried out in a variety of settings with unique uses [31,32]. Static images or videos are used in lab or desktop research to analyze visual preferences and perceptions using tools like Tobii Pro Fusion or EyeLink. Wearable trackers like Tobii Glasses or Dikablis are used in mobile or field-based studies to investigate wayfinding and walking behavior in real-world settings (streets, parks, routes). VR-based research assesses design scenarios and emotional reactions in virtual settings using tools like HTC Vive Pro Eye. Webcam-based eye tracking is used in online or remote studies for remote visual attention analysis and large-scale screening. Eye-tracking technology is mostly utilized in urban planning and architecture research to analyze people’s preferences for and behavior in public landscapes as well as various public spaces. Researchers have also found eye tracking to be a promising technique for urban architecture and its limitations are highlighted in subjective assessment by highlighting eye-tracking measurements’ objectivity [33,34].
A growing body of work in cognitive and neuro-architecture has used eye tracking—and, more recently, AI-based gaze-prediction tools such as Visual Attention Software—to show how façade complexity, ordered geometry, and biophilic detail shape where viewers look and how engaged they feel [35,36,37]. This strand indicates that blank or minimalist surfaces tend to disengage the eye whereas contrast and detail sustain attention, and it has begun to extend from individual buildings to the public realm [38].
Rather than treating this work as peripheral, we take it as a direct methodological precedent: software that predicts where the eye lands on a façade, and biometric studies linking ordered geometry and biophilic detail to sustained attention and perceived restorativeness, establish that measurable gaze behavior tracks the visual properties of the built surface. The present study builds on that principle and extends it from single façades to the composite spatial elements of a public space scene, testing whether the same attention-holding effect of visual complexity and detail operates at the scale of edges, landmarks, plazas, paths, and transit nodes. However, these studies concentrate on façades, esthetic preference, and largely Western streetscapes; comparatively little work applies this biometric approach to the composite spatial elements of everyday public space, to youth as a distinct user group, or to non-Western heritage cities.
Limited studies analyze visual attention across different urban spatial elements in real-world public spaces. To determine how frequently people look at something (attentional frequency) and how closely they pay attention (processing depth), researchers utilize a variety of performance measurements, such as total fixation duration (TFD) and fixation count (FC) [39]. Another metric, time to first fixation (TTFF), shows how soon people become aware of something for the first time. A number of studies employed duration-based metrics, including average fixation duration (AFD) and initial fixation duration (FFD) [40]. Visit count (VC) is a measure of emotional involvement and recurring attention to particular areas of interest. All things considered, these measurements allow researchers to make a clear connection with spatial characteristics, visual behavior, and sensory quality in public space settings. Across urban studies, eye tracking has been applied to visual preference, wayfinding and navigation, emotion and well-being, multisensory, and decision-making research, often in combination with surveys or physiological measures [15,29,40,41,42].
This study explains the experimental method for studying urban public spaces using eye-tracking technology and data collected to assess individuals’ attention to within and across elements of public space in the context of Indian cities. The objective of this study is to identify attention patterns across various compositions, such as visually simple and complex elements of public spaces, natural vs. built spaces, and socially vibrant and visually important elements, by comparing cognitive responses. To ensure a focused, behavior-based analysis, the present study reports only the eye-tracking data. A perceptual questionnaire was administered to the same participants as part of the wider doctoral research program; those data are analyzed separately and are deliberately not combined with the gaze data in this paper, so that the analysis reported here remains behavior-based and free of self-report bias. The findings will provide clear guidance for attention patterns of youth and youth-centric urban design and planning strategies to take care of while developing new or redeveloping existing urban public spaces, especially in the context of Indian cities.
2.6. The Indian and Jaipur Public Space Context
Public and green space in India is shaped by national and city-level planning instruments that differ from Western typologies. The Urban and Regional Development Plans Formulation and Implementation (URDPFI) Guidelines [43] set hierarchical norms for open spaces from the neighborhood to the city level, while the Urban Green Guidelines [44] specify standards for parks, gardens, and green buffers. At the city scale, the Jaipur Master Development Plan 2025 [45] designates heritage precincts, recreational zones, and major corridors that structure how residents and youth access public space.
These frameworks indicate that, in the Indian context, “public space” encompasses heritage forecourts, ceremonial gates, lakeside promenades, and active commercial streets as much as formal parks. The six study sites selected here—Albert Hall, Patrika Gate, Hawa Mahal, Jal Mahal, GT Road, and MI Road—reflect this locally grounded understanding of where young people actually gather and move, and the five spatial elements are read against this backdrop rather than against a generic park typology.
2.7. Research Objectives
Building on the gaps identified above, the objective of this study is to examine how youth visually engage with the spatial elements of public space in an Indian heritage city, using an AOI-based eye-tracking protocol to characterize how attention is distributed across edges, landmarks, paths, plazas, and transit nodes in Jaipur.
3. Hypotheses Development
Visual attention in urban public space is distributed unevenly across spatial and functional elements. Previous research shows that visually salient features such as landmarks, greenery, and comfortable spaces attract greater attention, reflected in higher fixation duration and count. The spatial organization of environments influences the sequence of visual exploration, with prominent and socially active elements. Further, the elements that generate higher visual engagement are more likely to be revisited and indicate sustained cognitive processing. Initial attention also tends to influence continued engagement over time. Finally, visually complex elements increase cognitive demand, leading to higher fixation counts and longer viewing durations. In this section, the hypotheses are presented in brief and discussed in detail in the Results Section.
H1: Visual attention varies across spatial elements. Following [3], spatial elements differ in imageability, so we expect visual attention to vary across them.
H2: Green elements attract less attention than built elements. Restoration research suggests that greenery is processed as a calming background rather than a focal stimulus [46], so green elements may attract less fixation than built ones.
H3: Social/prominent elements get earlier and sustained attention. Saliency and social attention literature indicates that prominent and socially active features draw earlier and longer gazes [26].
H4: Earlier attention (lower TTFF) sustains over time. According to the eye–mind hypothesis [47], fixation reflects ongoing cognitive processing, so elements that capture the gaze earlier (shorter TTFF) initiate deeper processing and accumulate longer total fixation duration.
H5: Complex elements attract more attention than simple ones. Visual complexity increases cognitive demand, predicting higher fixation counts and longer viewing [39].
H6: High visual importance increases revisit frequency. Revisit (visit count) is an established index of sustained interest and re-inspection [39], so elements of higher visual importance are expected to be revisited more frequently, reflecting stronger cognitive engagement.
4. Methods
To examine the pattern of visual attention in various spatial contexts, a set of visual stimuli representing five key urban spatial elements—edges, landmarks, plazas, paths, and transit nodes—was selected across Jaipur city from six important public spaces. These elements of urban public spaces are frequently discussed in the urban design literature. We discuss the entire experimental procedure, elements, and the selection of the study area in sequence in this section.
4.1. Study Area Selection
Jaipur is the 10th largest metropolitan area in India. The city’s largely pink color scheme and complementary color schemes have earned it the moniker “Pink City” [48]. The capital of India’s largest state, Rajasthan, is a multifunctional city [49] that serves as a major center for business, administration, tourism, and education. The city attracts a lot of tourists, both domestic and foreign, and is the most important center for education in Rajasthan State. It has a lovely ambiance and superb architecture [49]. Recreational and sociocultural amenities are distributed fairly in Jaipur to meet the demands of residents at both the urban and regional levels. Therefore, we have chosen widely dispersed public venues in both new and ancient cities as our study regions.
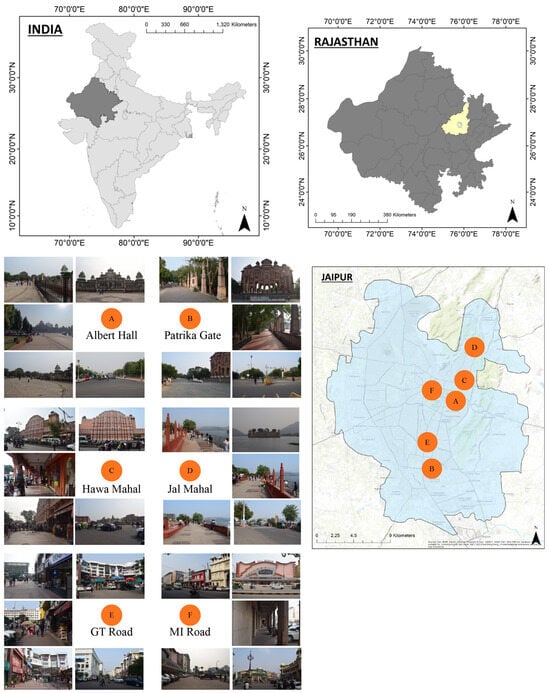
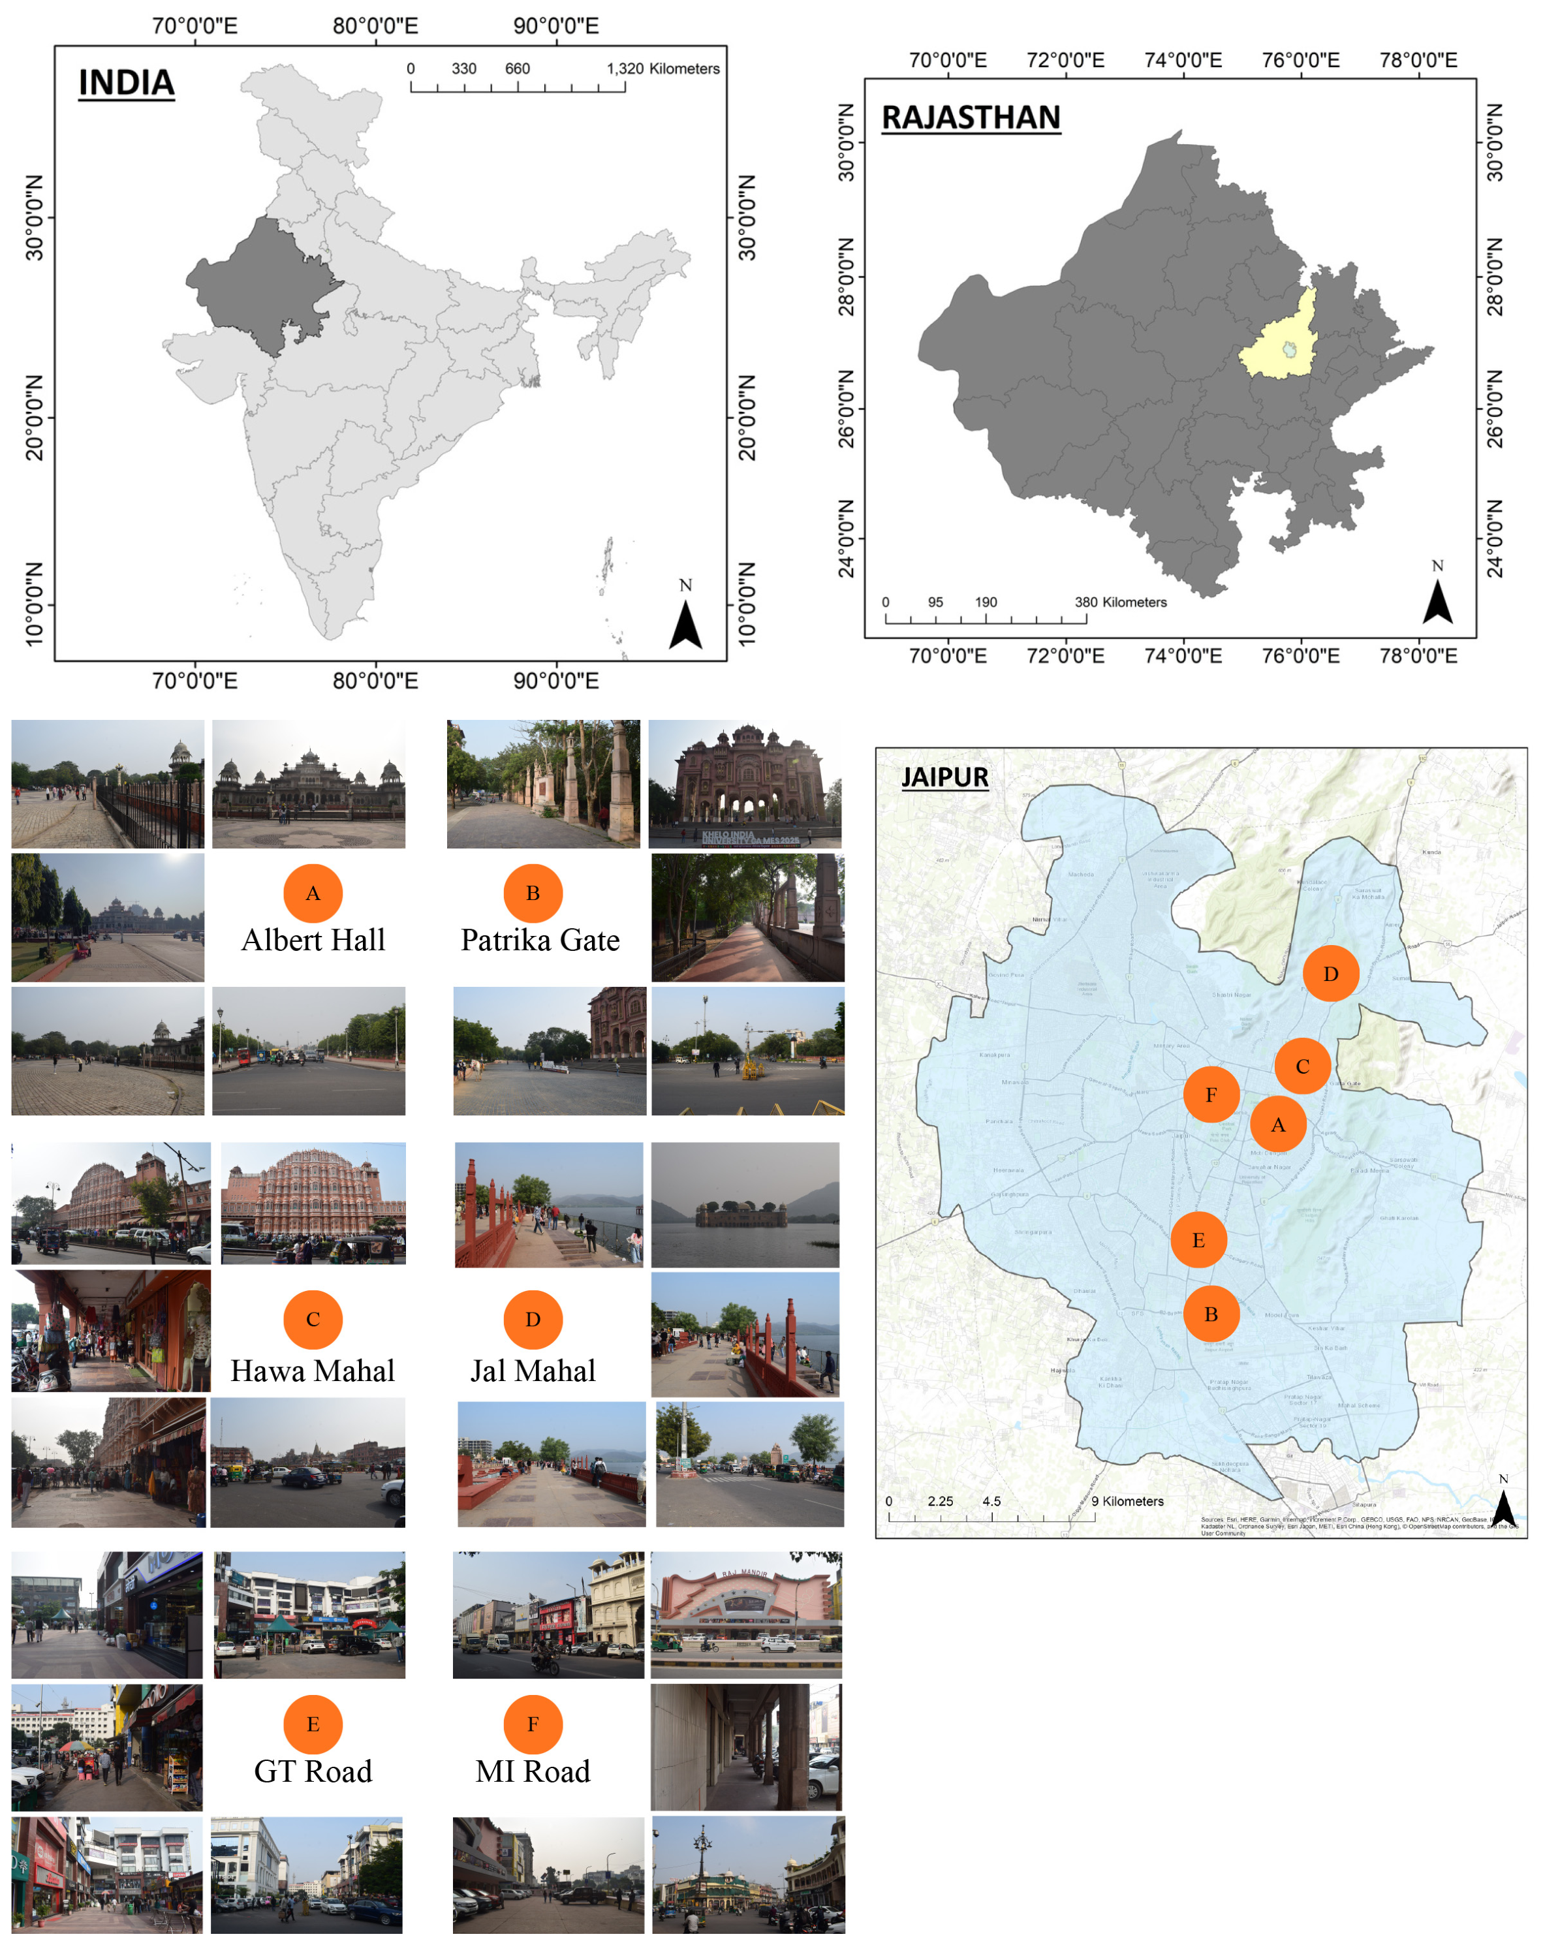
Six well-known public areas—Albert Hall, Patrika Gate, Hawa Mahal, Jal Mahal, GT Road, and MI Road—were found in the study region (see Figure 1 below). Albert Hall is a prominent heritage and popular public space with a grand plaza and iconic Albert Hall Museum, which supports diverse social, cultural, and recreational gatherings among residents, youth, and tourists. Another culturally vibrant public space is Patrika Gate, which attracts youth and tourists for photography, informal social interaction, and a range of leisure activities. The next important heritage public space is the iconic Hawa Mahal area, which is characterized by active street life and tourism-based interaction. The next scenic lakeside public space along Man Sagar Lake offers views of historic Jal Mahal. The large plaza is widely used for leisurely walks, informal youth gatherings, and photography. Next, the public space, GT (Gaurav Tower) Road, is a major arterial corridor that functions as an active space for everyday social interactions, with commercial frontage. Another historically significant commercial area, MI (Mirza Ismail) Road, is selected for the study, known for its prominent built frontage, vibrant retail environment, and active pedestrian spaces.
Figure 1.
Map showing all locations of the study area in Jaipur with reference to the map of India and Rajasthan. The orange markers A–F denote the six study sites: A—Albert Hall; B—Patrika Gate; C—Hawa Mahal; D—Jal Mahal; E—GT Road; F—MI Road.
4.2. Selection of Urban Public Space Elements
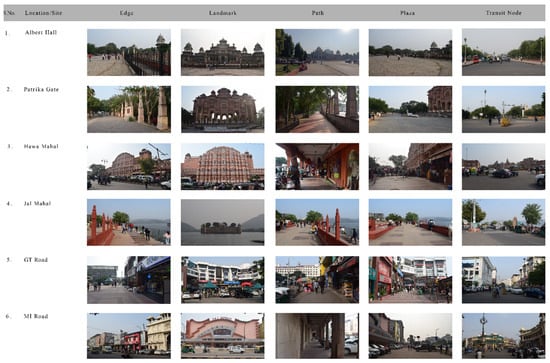
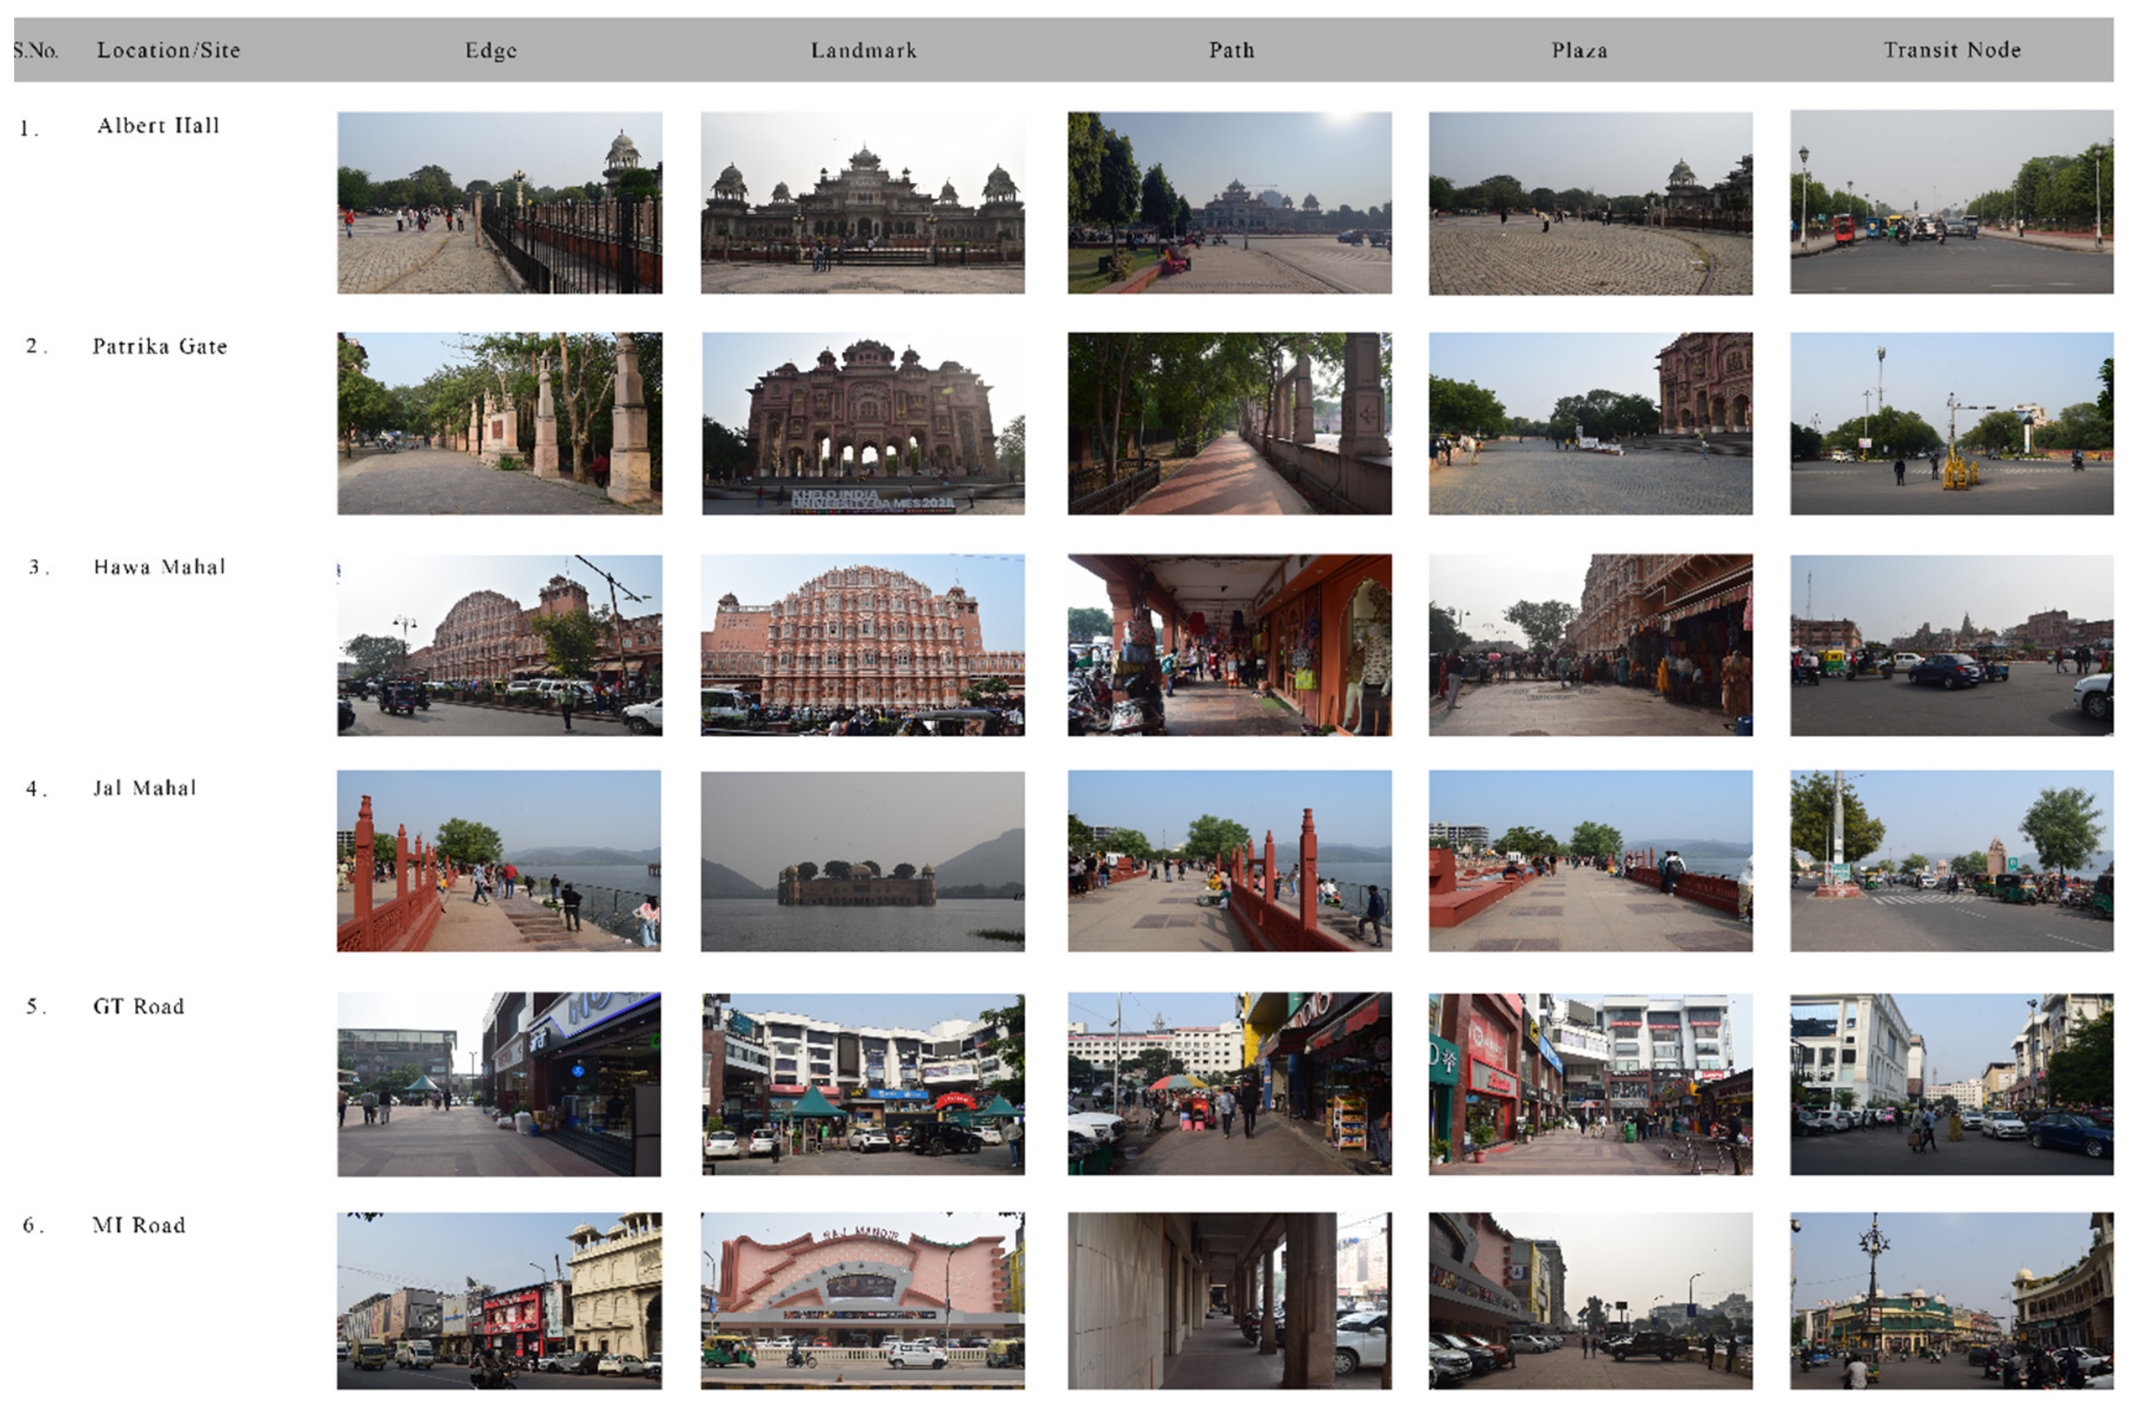
The images were captured in real urban settings for this study. For the eye-tracking experiment, this photograph was used as a stimulus that replaces real urban public spaces. The following steps were followed to create a stimulus. First, we captured high-quality urban public spaces with a single-lens reflex camera with a wide-angle lens and a tripod. Standardized shooting times and camera settings were used to ensure consistent lighting conditions across all photos. The time frame for shooting was chosen to be between 3 and 5:00 PM on a sunny afternoon in November 2025. During the shooting, the camera’s angle and height were fixed, and to avoid overexposure, white balance was manually set. To maintain visual consistency and correct the white balance of all images, post-processing in Photoshop was performed. Next, we invited 20 professionals from urban planning, architecture, design, and landscape for a panel to give expert advice on final image selection for our study. A detailed explanation of the aim of the experiment, its objectives, and the process was presented before selecting the images. They were also informed that this eye tracker would be used for a perception evaluation of urban public spaces. The experts identified five types of public spaces: edge, landmark, path, plaza, and transit node. For each type of public space, photographs with the highest expert agreement were retained, and any disagreements were resolved through discussion. Ultimately, 30 photos representing 5 types of elements, with each type represented by 6 study areas, were selected (refer to Figure 2 and Table 2).
Figure 2.
Represents six popular public spaces and their elements of public spaces.
Table 2.
Urban spatial elements used as visual stimuli in the eye-tracking experiment.
4.3. Participants and Sampling
After reviewing relevant eye-tracking experimental research, our observation was that the sample sizes ranged from 20 to 60 participants [15,29]. Based on the research objectives, resource considerations, and time, 43 national and international students from Architecture, Design, Urban Planning, and allied disciplines were recruited. Although the sample is modest, the within-subjects design—43 participants each viewing 30 stimuli across four AOIs—yields a large pool of gaze observations per condition, consistent with comparable eye-tracking studies [15,29]. To achieve the study objective, a group of youth aged 18–29 years with normal or corrected visual acuity, no visual impairments, no color blindness, and no weak color vision was recruited. In this experiment, the 43 participants, including 26 males and 17 females, had a moderately balanced gender distribution. Finally, we collected a total of 43 valid datasets. We selected participants from a similar age group and academic background to ensure consistency across the sample. To minimize the influence of prior experiences, we informed participants that they had not previously resided in the study area or its vicinity. We also informed them about the experimental procedure and research objectives and obtained their consent to participate before the experiment began.
4.4. Experimental Environment and Equipment
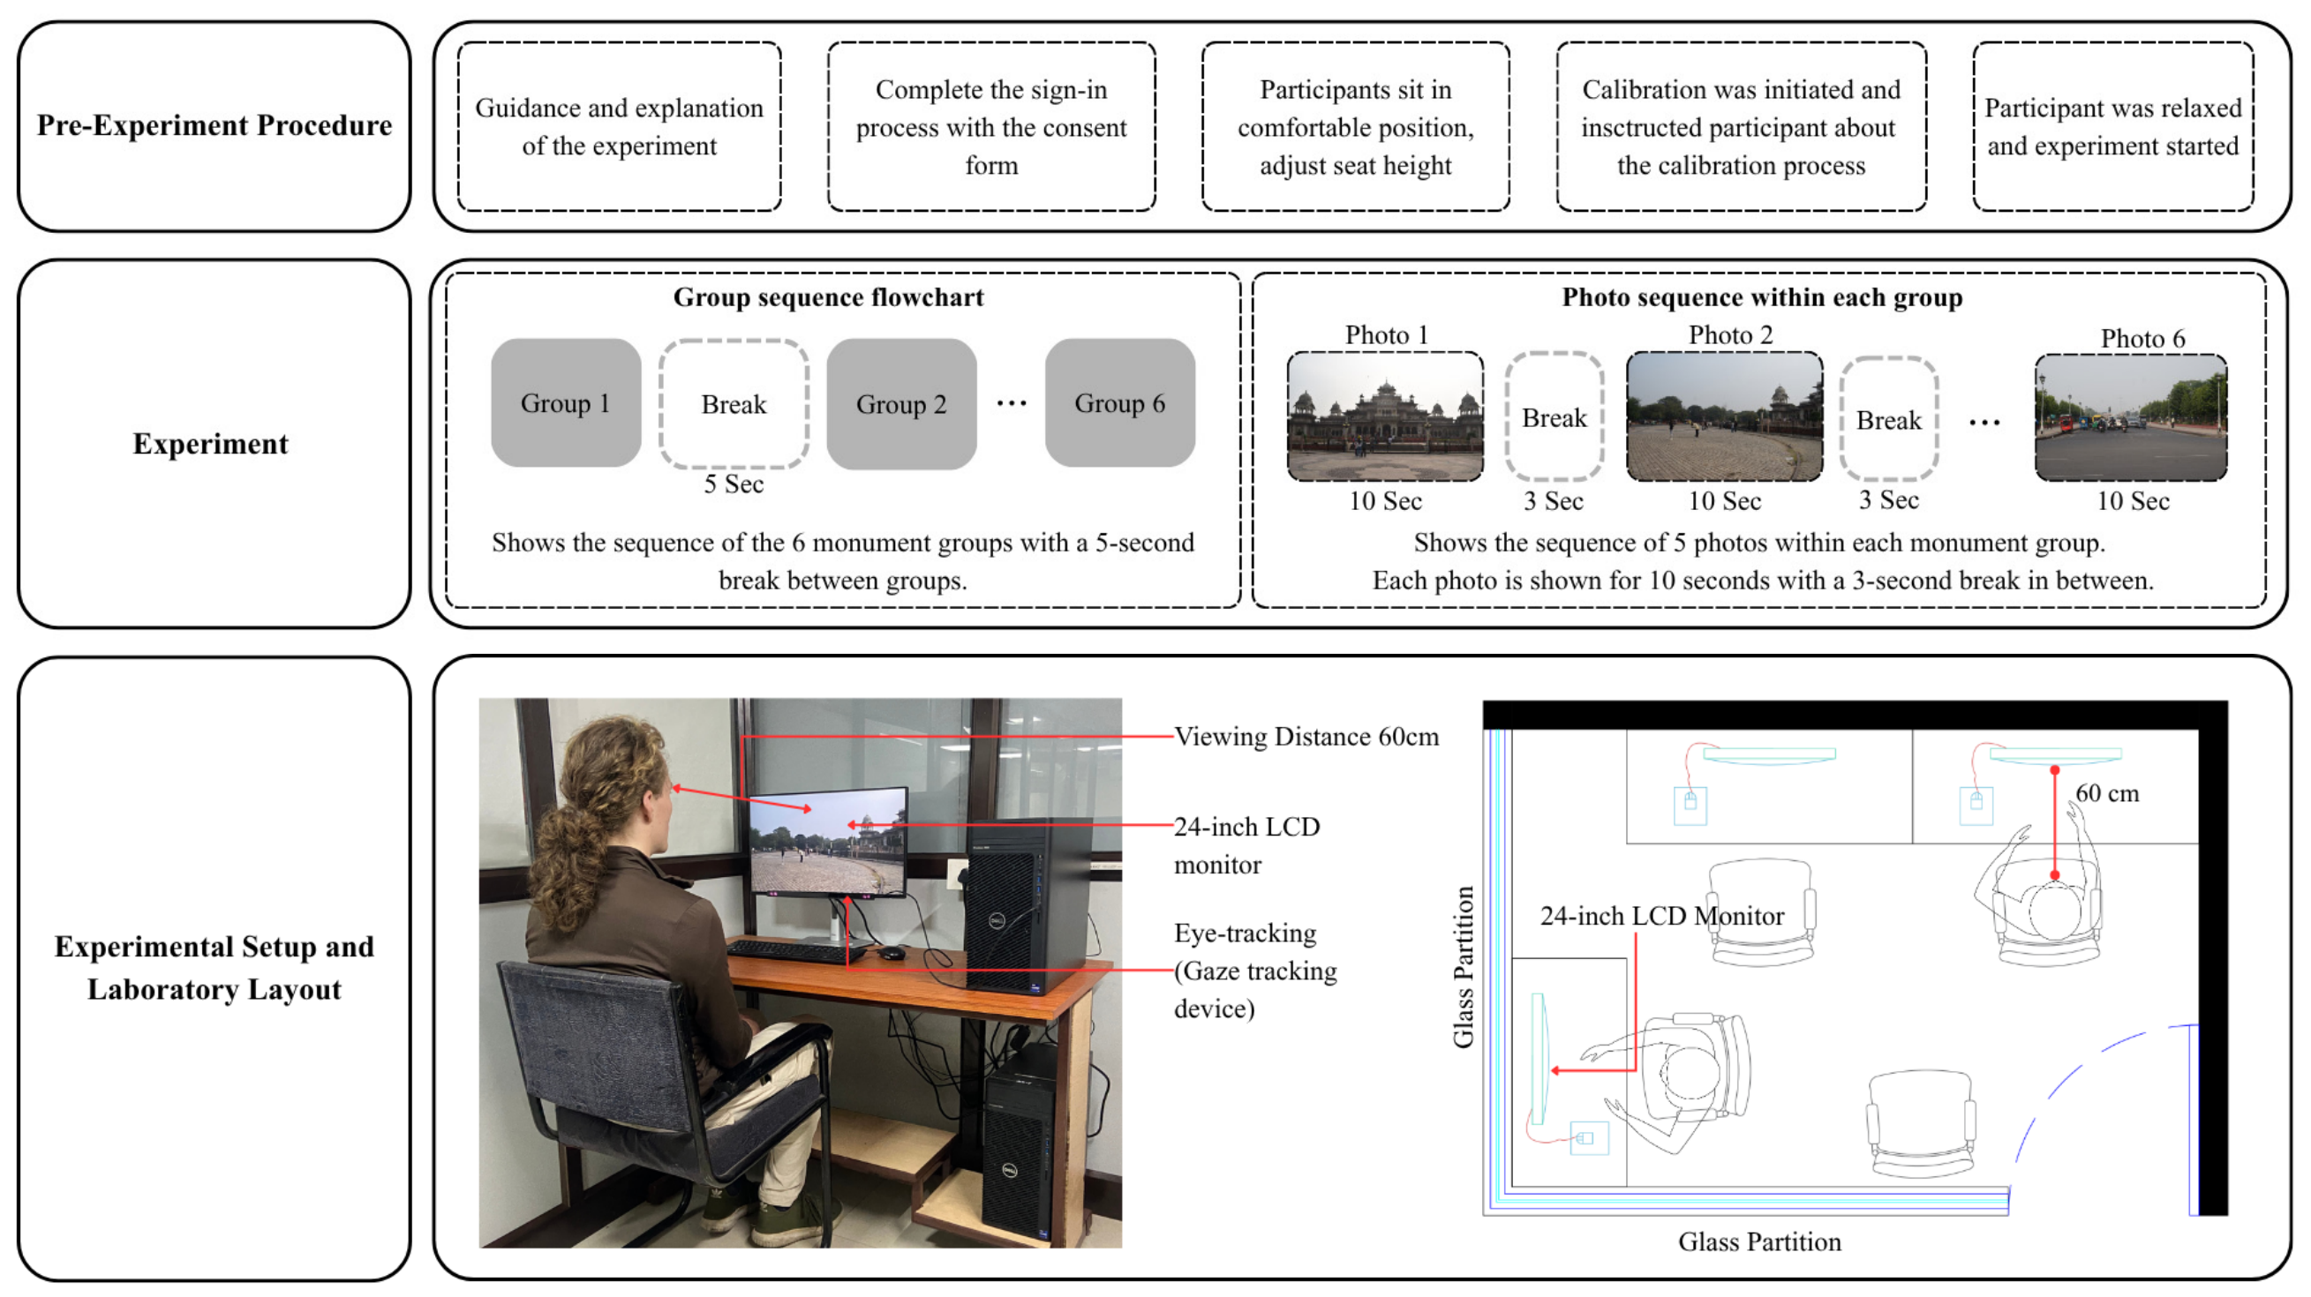
The experiment was conducted using a screen-based Tobii Pro Fusion eye tracker (Tobii, Stockholm, Sweden) and a computer (Intel Core i9 14th Gen, 64 GB DDR5 Memory) equipped with an NVIDIA T1000 8 GB, running 64-bit Windows 11 Professional. It had a resolution of 1920 × 1080 on a 24-inch LCD monitor (Dell, Bengaluru, India). A 24-inch LCD computer monitor was used, and participants maintained approximately 60 cm distance from the monitor. Lighting in the room was consistent, a comfortable temperature and humidity were maintained throughout the experiment, and there was no interference from noise. This setup enabled consistent collection of eye movement data at 120 Hz. The analysis software, Tobii Pro Lab (version 25.23.1545), was installed for the experiment.
4.5. Experimental Procedure
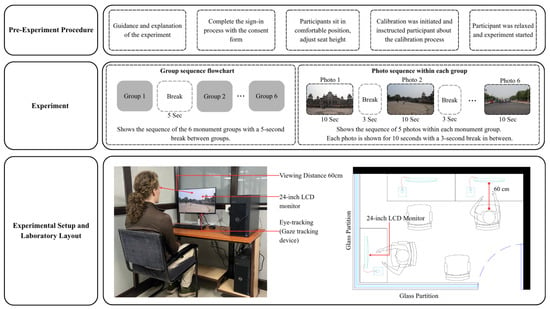
The experiment began with a briefing on the experiment details, the calibration process of the eye-tracking device, and a description of the participant’s task. Participants sat one by one in a comfortable position in front of the monitor for 10 s to stabilize their mood. A screen-based eye-tracker-attached computer monitor was employed [26,29,39]. Participants were instructed to look at the calibration targets displayed at multiple locations on the screen before the actual experiment began. In the experiment, 30 photographs of urban public spaces were presented to participants in 6 groups. Each image was used for 10 s at an interval of 3 s and the remaining 5 s after each group. It was a completely controlled computer lab experiment; each participant’s session lasted for approximately 20 min. Before each test, the seat adjustment, the eye-tracker angle, and the experimental distance were adjusted according to each participant’s height. Throughout the experiment, each participant’s eye-tracking data were continuously recorded. For each location, representative images of these elements were presented in a controlled sequence (edge, landmark, plaza, path, and transit node) during the eye-tracking experiment to analyze variations in visual attention across different spatial characteristics. See Figure 3 below:
Figure 3.
Experiment process.
4.6. Data Processing
Metrics used in this study: 1. Fixation duration. 2. Fixation count. 3. Time to first fixation. 4. Visit count. 5. Heatmaps. 6. Scan paths [39]. Eye-tracking indicators used in this study and their relevance are explained in the table below [refer to Table 3].
Table 3.
Indicators of eye tracking used in this study.
4.7. Statistical Analysis
The experimental design is a repeated-measures one: each participant viewed all 30 stimuli, and several AOIs were analyzed per scene, so the observations are not fully independent. We therefore adopt a deliberately conservative, descriptive–exploratory approach rather than a confirmatory one. Analyses use independent-samples t-tests, ANOVA, and correlations to characterize broad, first-order patterns of visual attention, and every inferential result is reported with effect sizes and within-group variances alongside p-values so that readers can judge the magnitude and reliability of each pattern rather than relying on significance thresholds alone. We deliberately did not fit linear mixed-effects (hierarchical) models at this stage for two reasons. First, this study is framed as an exploratory, hypothesis-generating account—the first of its kind in this context—for which descriptive characterization of the main effects is the appropriate goal; over-fitting a complex random-effects structure to a modest, single-site sample (n = 43) risks unstable variance-component estimates and a false impression of confirmatory power. Second, the metrics analyzed are strongly interdependent (e.g., fixation count and total fixation duration), so the value added by full variance partitioning is limited relative to the risk of over-interpretation. Accordingly, all inferential results are positioned as indicative rather than confirmatory. Mixed-effects modeling, which would more fully partition participant- and stimulus-level variance, is identified as the appropriate next step for confirmatory analysis on larger, multi-site samples.
5. Results and Discussion
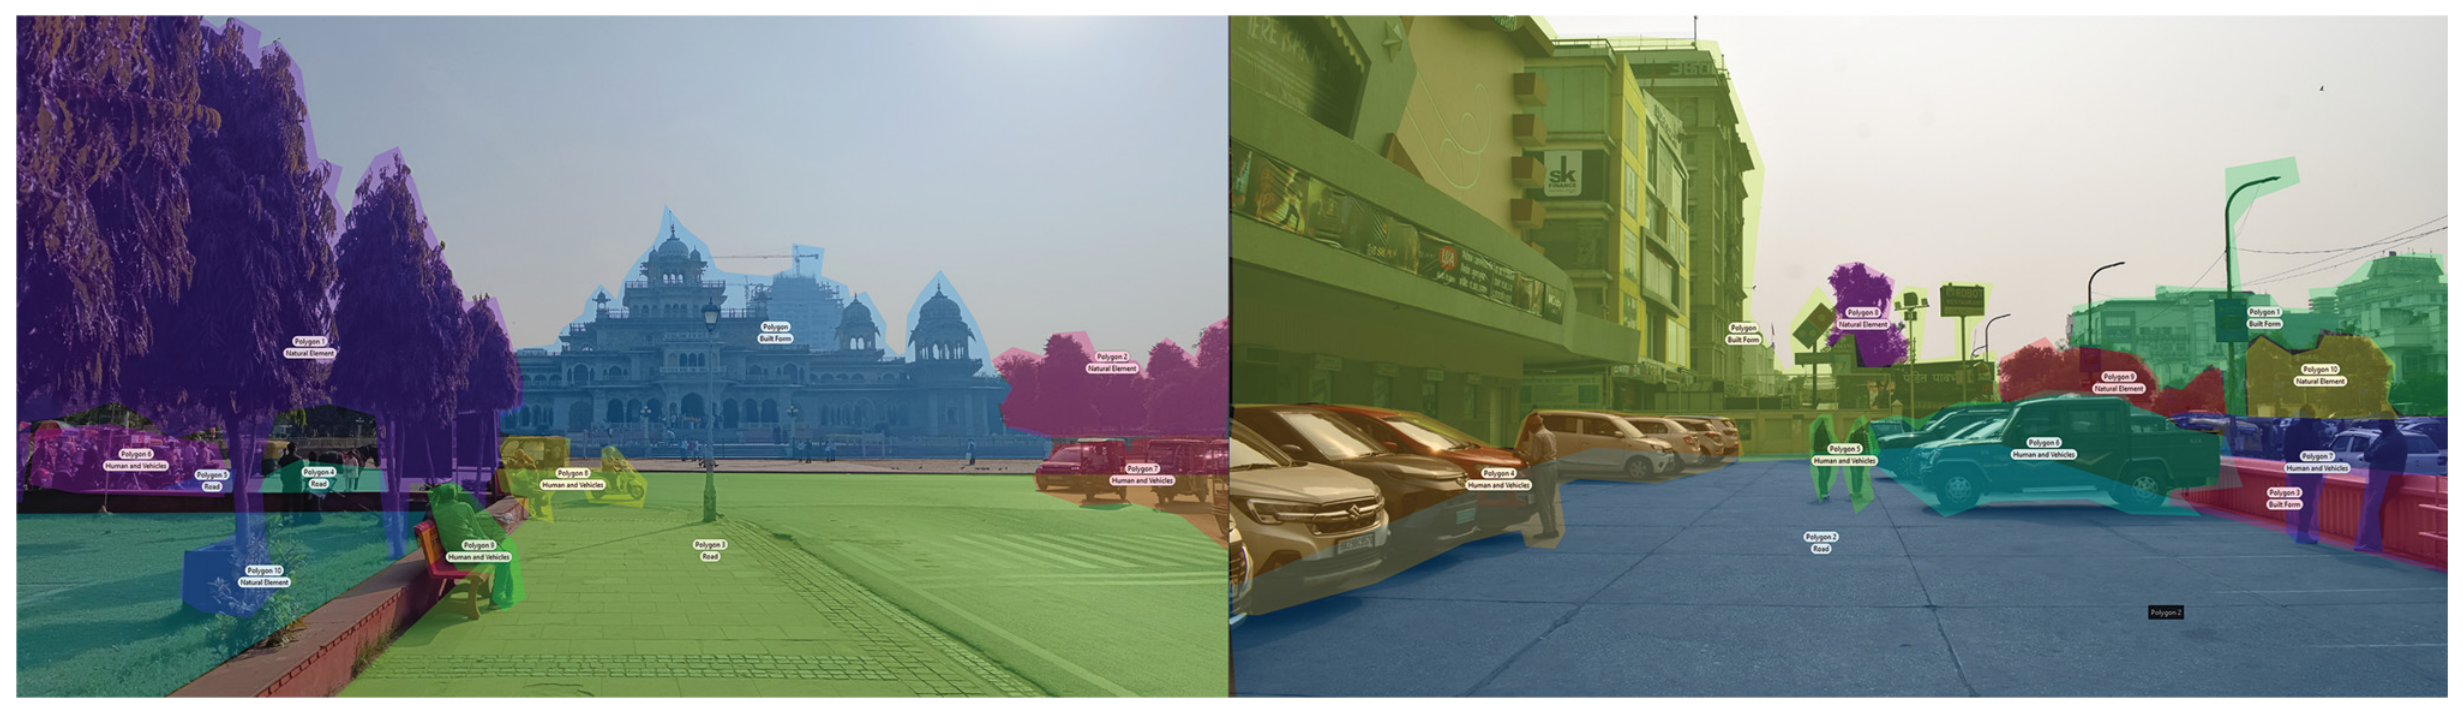
The results of the experiments are divided into two parts in this study. Part one explains the distribution of visual attention as inferred from the heatmap and scan path generated during the experiments, and the second part explains the interpretation of the statistical analysis and hypothesis testing. Each stimulus was divided into four areas of interest (AOIs) representing the dominant spatial elements within the scene for the scope of the study. The number of AOIs was kept consistent across all images to ensure comparability and analytical clarity. Eye-tracking data were collected using an area of interest (AOI)-based approach, in which each stimulus was divided into four predefined AOIs (AOI 1–AOI 4) corresponding to the scene’s dominant spatial elements. For each AOI, the main eye-tracking metrics for the scope of the study—including fixation count (FC), total fixation duration (TFD), visit count (VC), and time to first fixation (TTFF)—were extracted. The dataset comprises six study locations, five categories of spatial elements (edge, landmark, path, plaza, transit node), and 43 participants. Two levels of analysis are distinguished throughout the results. The five spatial elements operate at the scene level: they define how the 30 stimuli were sampled and are the unit for element-wise comparisons (e.g., H1). The four AOIs—built form, human and vehicular activity, natural elements, and circulation—operate at the within-scene level: they define how gaze was partitioned inside each stimulus and are the units for the semantic comparisons of built versus green and simple versus complex content (e.g., H2, H5). Visual attention data were therefore recorded AOI-wise for each participant across all stimuli, enabling both within-scene (AOI-level) and between-element (scene-level) comparisons. The AOI-based extraction allows the transformation of raw gaze data into quantifiable measures of visual attention. AOI details and the combination of marking in polygons, as an example, are presented in the combination of stimuli in Figure 4.
Figure 4.
AOI 1—built form, AOI 2—human and vehicle, AOI 3—natural elements, and AOI 4—road/circulation, presented in the eye-tracking experiment. The next sections discuss visual and analytical results. Colors indicate the four areas of interest: AOI 1 built form; AOI 2 human and vehicle; AOI 3 natural elements; AOI 4 road/circulation.
5.1. Visual Attention Distribution
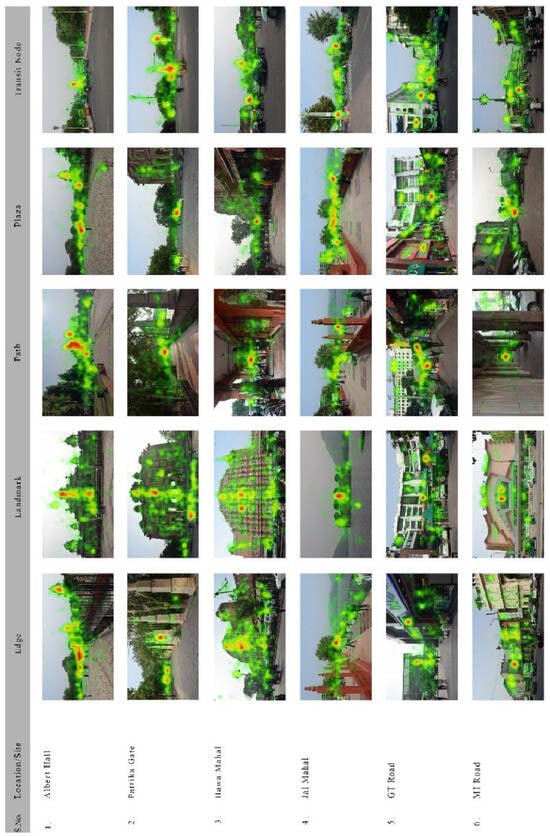
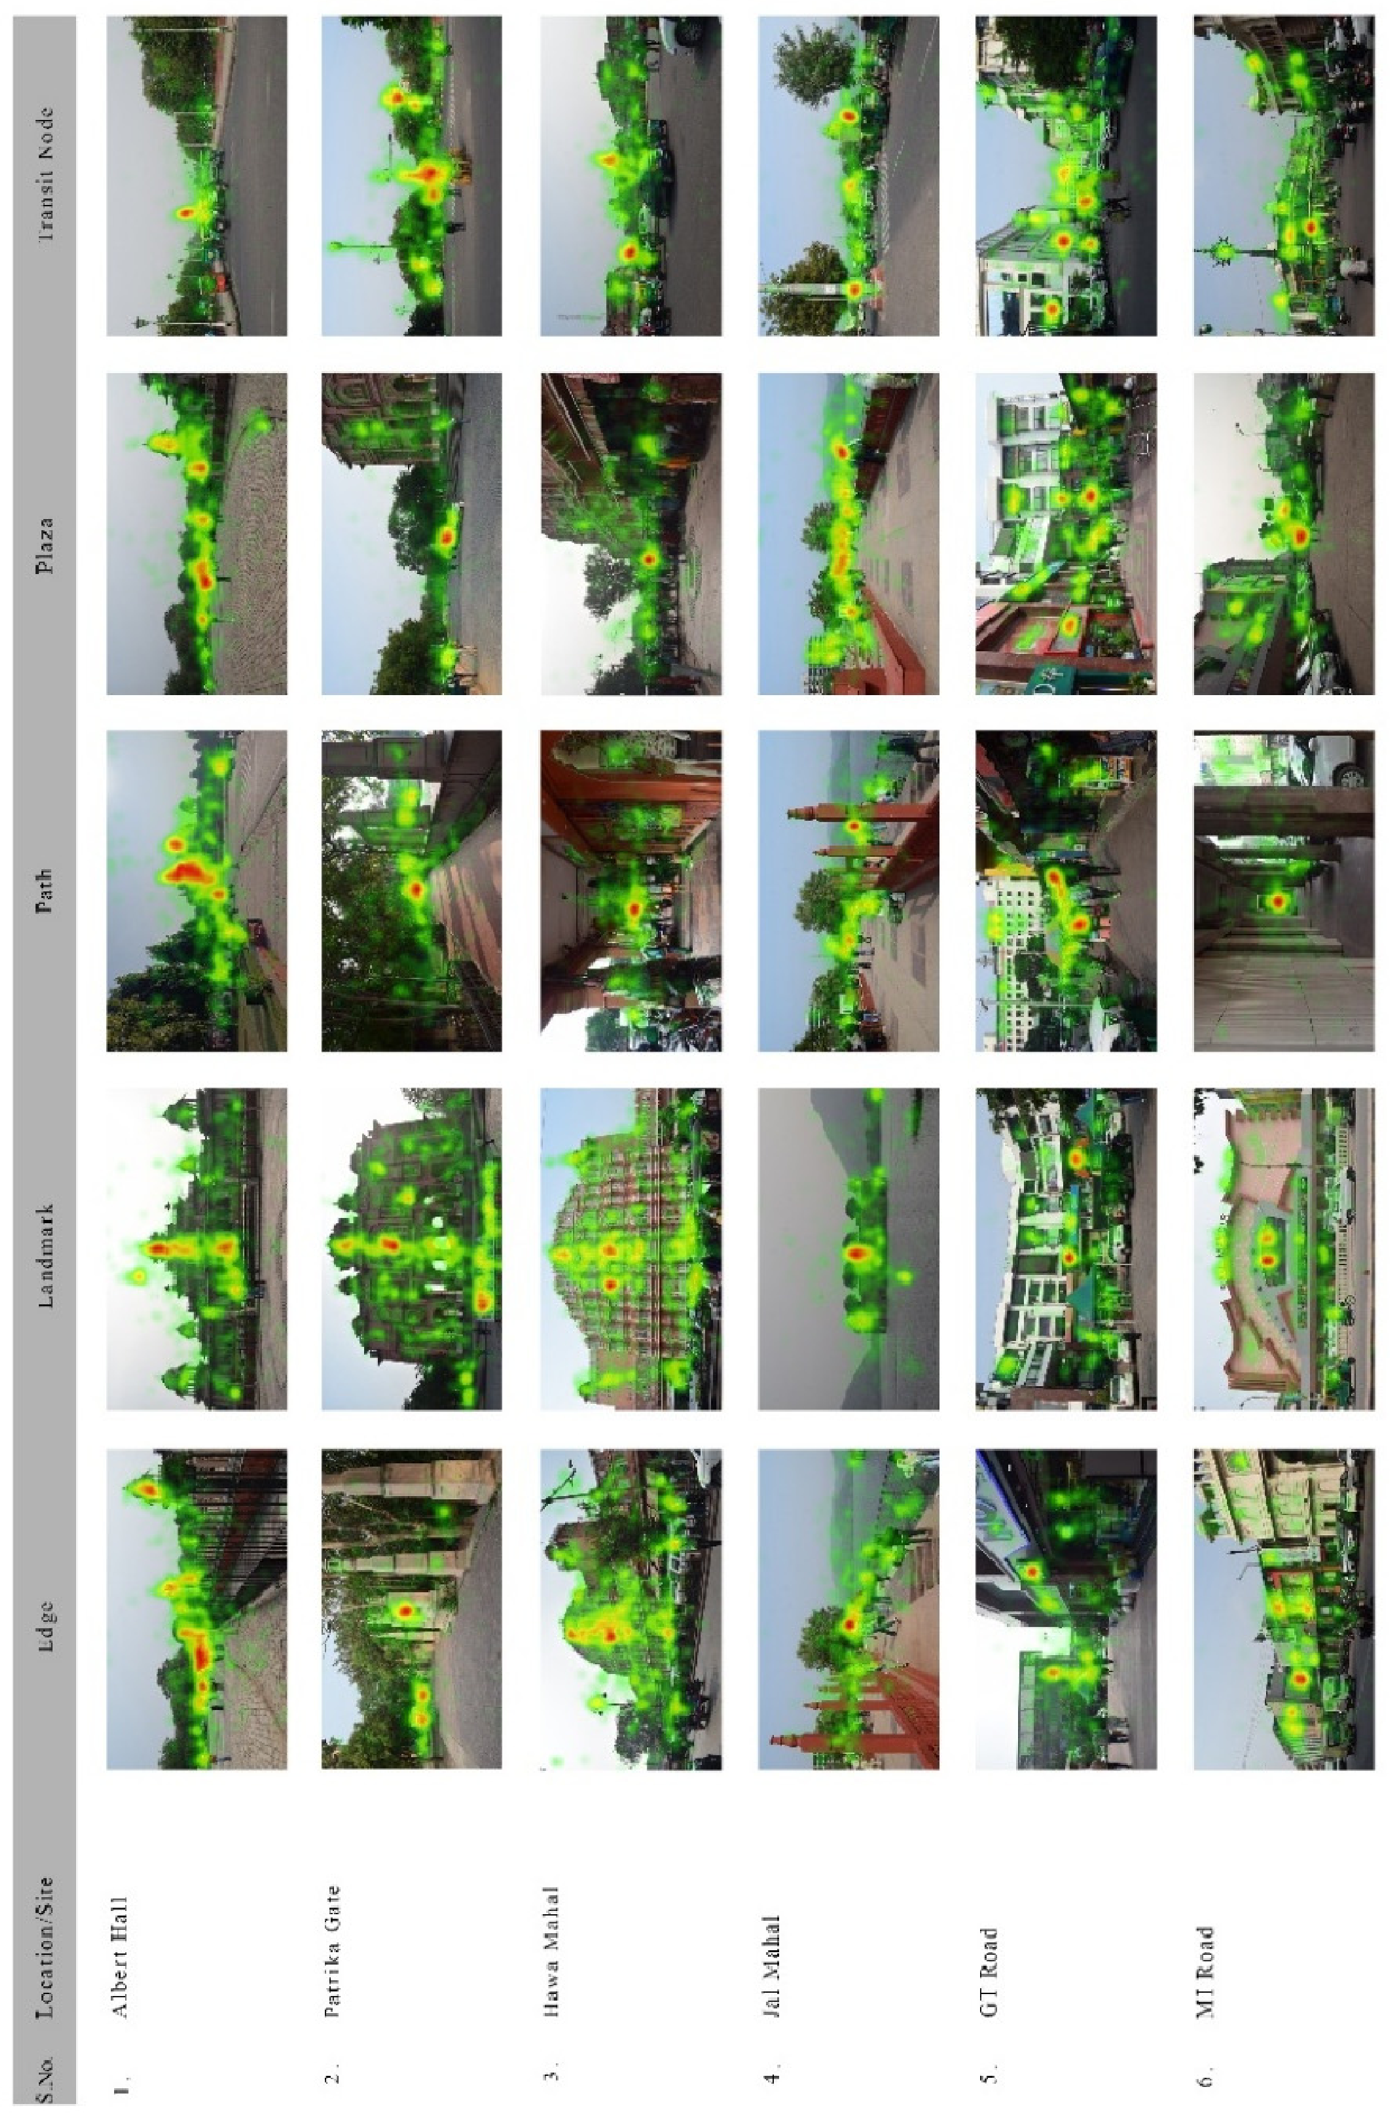
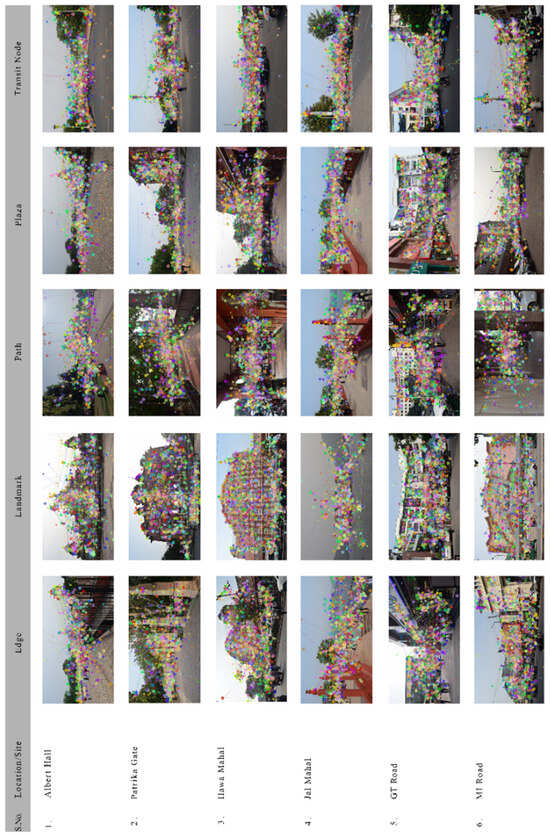
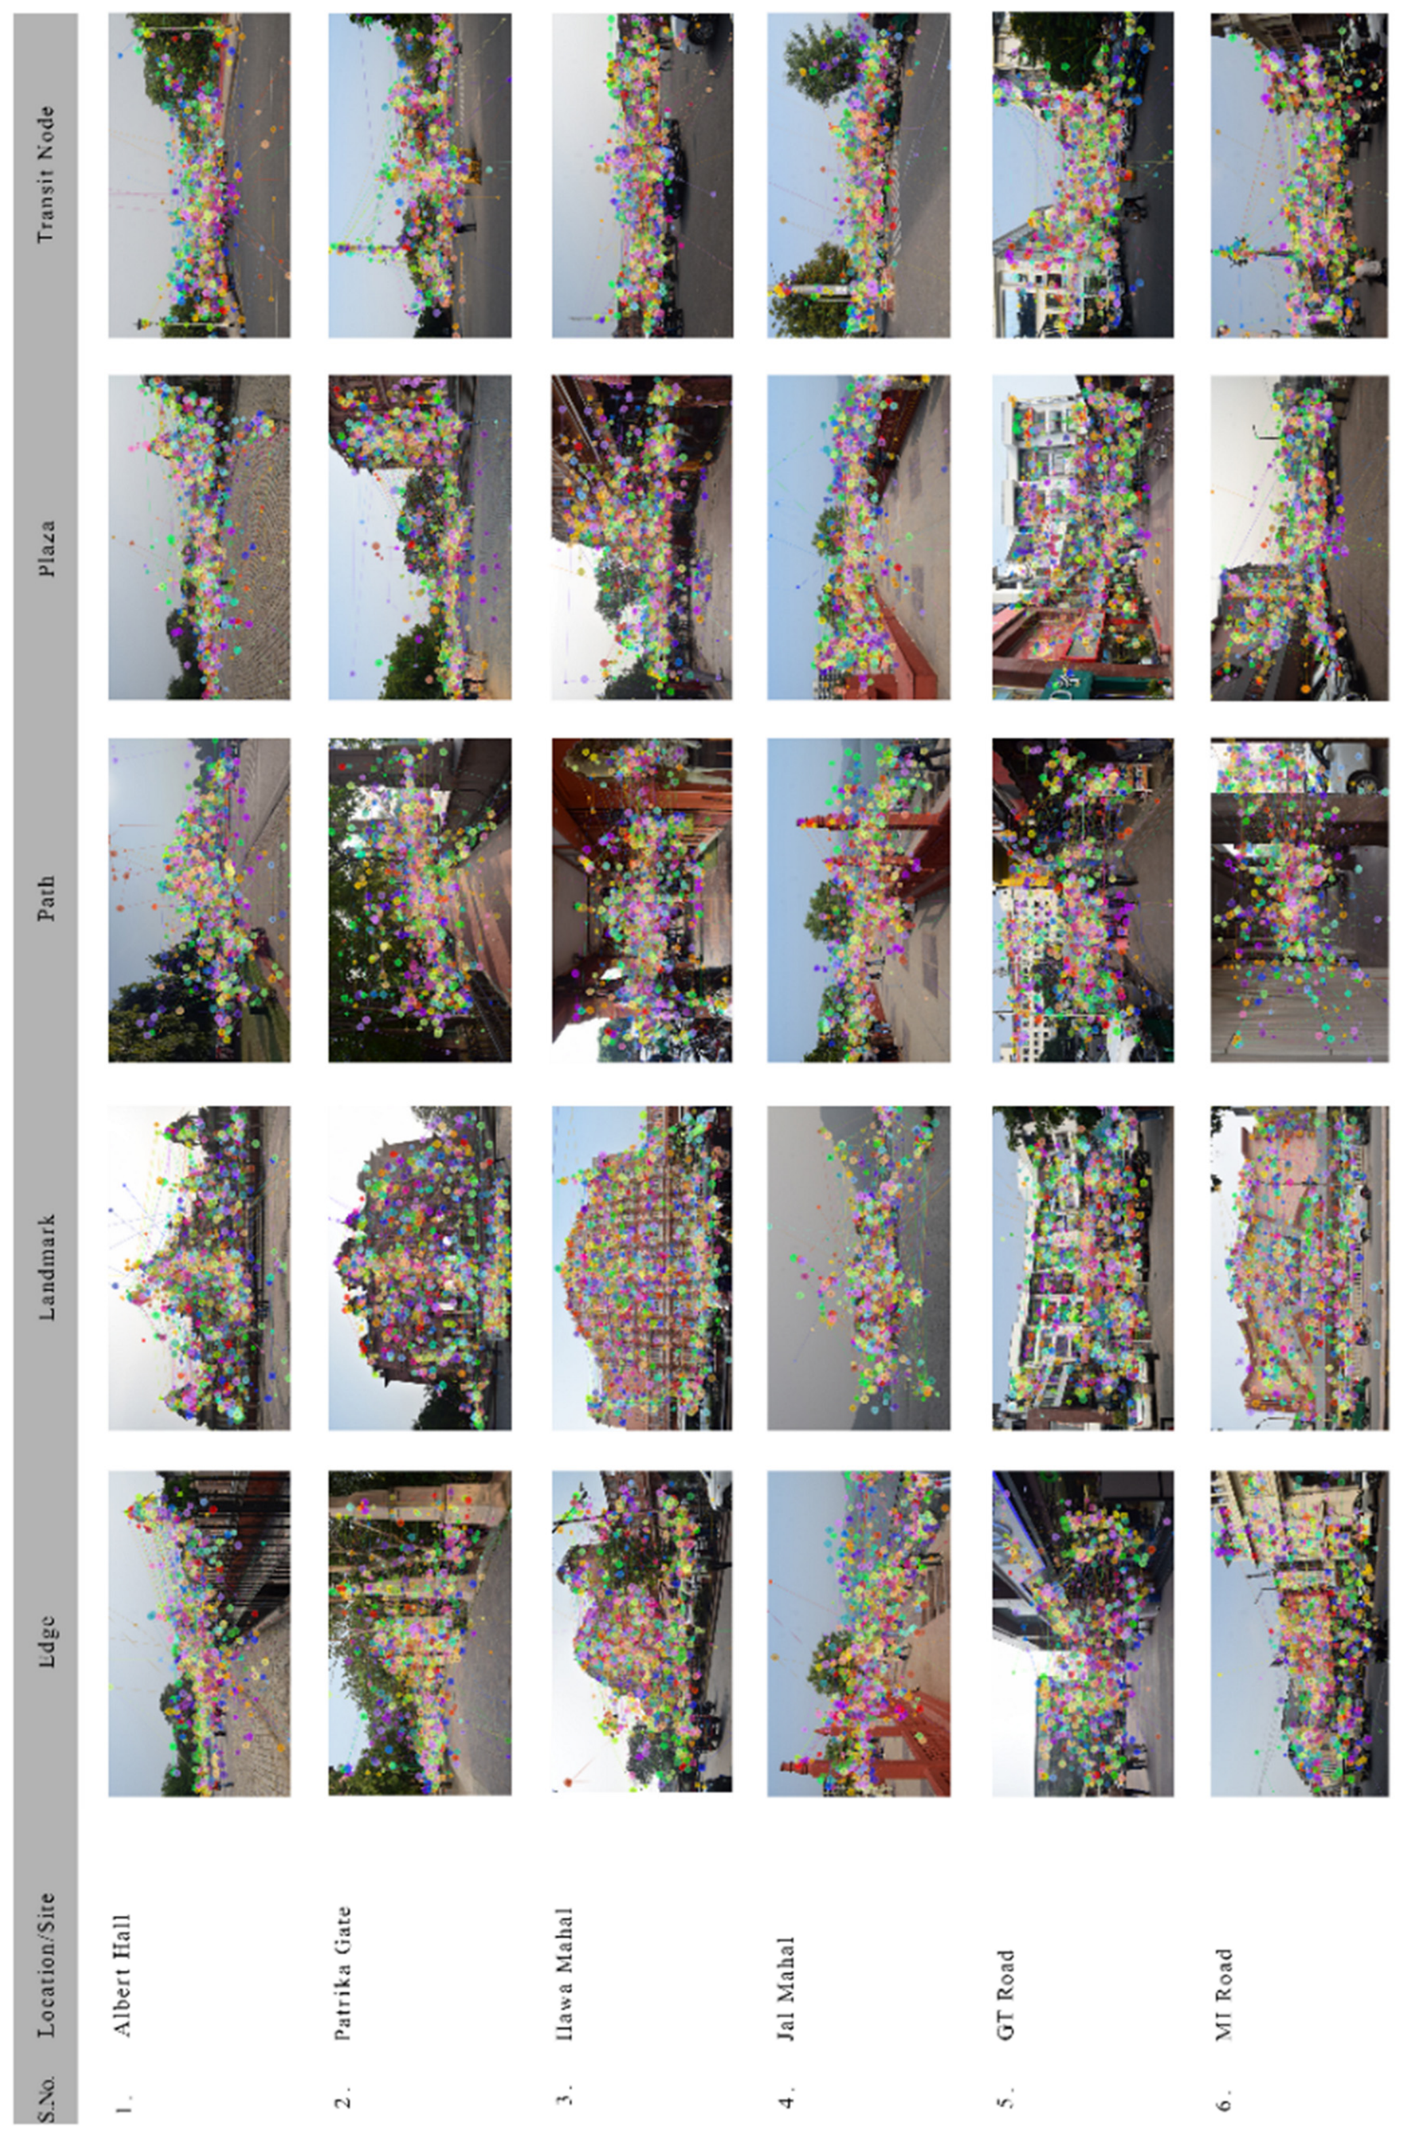
Visual representation of the results through heatmaps and scan paths is shown. These were analyzed to understand the distribution and sequence of visual attention across the six study areas. Across all six locations, visual attention is highly concentrated on landmarks and activity zones as reflected in heatmaps. At Albert Hall, Hawa Mahal, and Patrika Gate, participants mostly looked at architectural landmarks and showed a strong fixation, confirming high visual salience and dominance. In contrast, in the Jal Mahal area, attention is more linear and dispersed, focusing on the waterfront edge and promenade, which indicates scenic engagement rather than focal dominance. In the next two public spaces, GT Road and MI Road, heatmaps show distributed attention across shopfronts, signage, and active edges, which reflects commercial activity and visual complexity. The other mode of representation, which is the scan path, reveals clear differences in visual exploration behavior. In landmark-dominated spaces (Albert Hall, Hawa Mahal), gaze paths are clustered and repetitive, indicating a strong focal attraction and revisits. In linear environments (Jal Mahal, MI Road), scan paths are directional, following paths and edges, showing guided visual movement. In the commercial areas (GT Road), scan paths are scattered and dense, showing high visual complexity and multiple competing stimuli [refer to Figure 5 and Figure 6].
Figure 5.
Heatmap interpretation (combination of heatmaps across the study area). Warmer colors (red/orange) indicate longer, more concentrated fixation; cooler colors (green) indicate shorter fixation.
Figure 6.
Scan path interpretation (combination of scan paths across the study area). Colored dots represent successive fixations, and connecting lines represent the gaze (scan) path; colors distinguish individual participants.
5.2. Fixation Metrics
In the eye-tracking experiment, raw data is combined with fixation points, coordinates, and event labels for all stimuli. The experiment generated a multimodal dataset in the form of numerical and visual data. Filtering data for particular metrics was required for the analysis of this study. We have considered selected fixation metrics (TFD, FC, VC, and TTFF) along with the visual data heatmap and scan path for our study. We have organized it AOI-wise (AOI1—built form, AOI2—human and vehicle, AOI3—natural elements, AOI4—roads/circulation) in different combinations of urban element categories, such as visually complex vs. visually simple, and a tendency to revisit urban elements, as discussed earlier in the hypothesis development.
5.3. Hypothesis Testing Results
In this section, the analytical results of the eye-tracking experiment, based on fixation metrics (TFD, FC, VC, and TTFF), are presented. These metrics were extracted AOI-wise (AOI 1–AOI 4) across all study locations and participants to enable a structured comparison of visual attention across spatial elements. All hypotheses, their results, and interpretations are presented below in Table 4 from Hypothesis 1 (H1) to Hypothesis 6 (H6).
Table 4.
Summary of exploratory hypothesis tests for youth visual attention across spatial elements.
H1: Visual Attention Distribution: Visual attention (measured by fixation duration and fixation count) is expected to vary across different spatial elements of urban public spaces, with certain element categories attracting greater visual engagement than others.
H2: Attention to Green and Comfort-Supportive Elements: Green and comfort-supportive elements (such as vegetation, shaded areas, shaded seating, and open spaces) attract shorter fixation durations and lower fixation counts compared to non-green built elements.
H3: Visual Saliency and Attention to Socially Active and Prominent Spatial Elements: Spatial elements associated with social activity and prominent physical features attract earlier and more sustained visual attention than other spatial elements, reflected in shorter Time to First Fixation (TTFF) and longer Total Fixation Duration (TFD).
H4: Attention Sustainability Hypothesis: Spatial elements that attract earlier visual attention (shorter Time to First Fixation) tend to sustain attention over time, as indicated by longer total fixation durations.
H5: Spatial Complexity Hypothesis: Visually complex spatial elements attract higher fixation counts and longer viewing times compared to visually simple elements.
H6: Revisit Behavior Hypothesis: Spatial elements with higher visual importance are more frequently revisited during viewing sessions, indicating stronger cognitive engagement.
5.4. Results and Interpretations of Hypothesis Testing
In interpreting the results below, we distinguish three registers: observations drawn directly from the data (descriptive means, correlations, and test statistics), interpretations that we infer from those observations, and hypotheses that remain open and require further research. Statements of the first kind are reported with statistics; interpretive claims are flagged with hedged language (“suggests,” “may,” “is consistent with”); and open questions are identified explicitly as directions for future work.
- H1 was not supported by inferential analysis: the ANOVA showed no significant difference in fixation duration or count across the five elements. Descriptively, however, landmarks recorded the highest mean attention (TFD M = 1.98 s; FC M = 8.05) and transit nodes the lowest (TFD M = 0.81 s; FC M = 2.89), a tendency consistent with Lynchian imageability. Given the high within-group variance (notably for landmarks, FC variance = 130.0), this is interpreted as an observed tendency only, not a confirmed effect.
- The data are consistent with H2: green and comfort-supportive elements descriptively received less focal attention than built elements (TFD t = −3.13, p = 0.001; FC t = −3.08, p = 0.001, under independence assumptions). Lower fixation should not, however, be read as lower importance. Green elements may function as restorative background, contributing ambient and atmospheric value and supporting well-being without demanding focal attention [46]. Eye tracking captures visual saliency, not preference, restorative benefit, or place meaning.
- Combined result of H3 and H5 shows that socially active and prominent elements did not attract significantly earlier first fixation (TTFF t = 1.02, p = 0.845), and the direction was opposite to expectation; H3 is therefore only partially supported, holding for sustained attention (TFD) but not initial capture. Visually complex elements descriptively drew more fixations and longer viewing than simple elements (FC t = 1.99, p = 0.025; TFD t = 1.73, p = 0.044), consistent with H5. Together, these patterns suggest that complexity and social activity hold the youth gaze once engaged, even if they do not capture it first.
- Relationships between attention metrics (H4) show that fixation count and total fixation duration were almost perfectly correlated (r = 0.996). This near-perfect value partly reflects the mathematical interdependence of the two metrics (TFD ≈ FC × mean fixation duration) and is best read as confirming internal metric consistency rather than as an independent finding. A moderate negative correlation between TTFF and TFD (r = −0.65) indicates that elements fixated earlier also tended to be viewed longer, consistent with H4.
- H6 was not supported: elements judged more visually important were not revisited significantly more often (t = 0.73, p = 0.235). Revisit behavior may instead be shaped by spatial layout, navigational logic, or individual viewing strategies rather than visual importance alone.
Taken together, these patterns echo Lynch’s premise that urban elements are read as an interdependent system rather than in isolation: youth distributed attention across edges, landmarks, paths, plazas, and nodes rather than fixating on any single category. By combining time to first fixation, fixation count, and fixation duration, this study shows how the visual properties of these elements shape where and for how long young people engage, most clearly in the dissociation between what captures the gaze and what holds it. The findings contribute to emerging research that combines objective behavioral data with urban design theory and environmental perception. Because this study used static two-dimensional photographs, a modest sample of design-discipline students, and a single city, the following implications are offered as preliminary and hypothesis-generating rather than as prescriptive design guidance; each would require confirmation with larger, more diverse samples and in situ study before informing practice.
With that caution, these exploratory patterns suggest several directions for youth-responsive public space design in Indian cities. First, because landmarks consistently anchored the youth gaze, heritage plazas and forecourts should be designed to frame and reveal landmark views rather than presenting undifferentiated open space. Second, transit nodes attracted the least visual attention, so introducing landmark-like visual anchors, legible signage, or activity at these points could improve their perceived legibility and safety for young users. Third, since green elements functioned as restorative background rather than focal features, vegetation can be used to shape the atmosphere and comfort without needing to compete visually with built form. Finally, the sustained attention drawn by visually complex, commercially active edges such as GT Road and MI Road indicates that managed visual richness supports youth engagement and should be retained, rather than over-sanitized, in redevelopment.
6. Conclusions
This study applied screen-based eye tracking to examine how youth visually engage with the spatial elements of urban public space in Jaipur, India. Its contribution is primarily methodological and contextual rather than theoretical, and three contributions emerge. First, attention was allocated unevenly across the scene—built form and human activity dominated the gaze while natural elements functioned as restorative background—offering an AOI-based “semantic attention budget” that other researchers can reuse. Second, socially active and visually complex elements did not capture the gaze earliest but held it longest, indicating that what sustains youth attention is dissociable from what initially attracts it. Third, these patterns translate into concrete, youth-responsive design directions for Indian heritage public space.
Several limitations should be noted, together with their bearing on interpretation. First, static two-dimensional photographs cannot reproduce the embodied, multisensory, and locomotor experience of real space; this most likely inflates the apparent dominance of visually salient built form and understates the role of elements—such as greenery, sound, and movement—that are experienced dynamically, so the AOI attention shares reported here should be read as scene-level saliency rather than real-world preference. Second, because eye tracking captures visual saliency rather than preference or meaning, low fixation (as for natural elements) must not be equated with low value. Third, the sample of design-discipline students aged 18–29 is not representative of the general youth population; their trained visual attention may differ systematically from that of lay users, which limits generalization of the specific attention patterns while leaving the methodological contribution intact. Fourth, AOI delineation involved some subjective judgment and occasional unavoidable element overlap, adding noise to between-element comparisons. Finally, observations were treated as independent rather than modeled with mixed-effects methods (Section 4.7). For all these reasons, the inferential results are exploratory and warrant confirmation on larger, more diverse, multi-site samples using immersive or in situ stimuli.
Future work could integrate 3D simulation and virtual reality with eye tracking to reduce element overlap and improve experimental control and could compare gaze behavior across ages, backgrounds, and degrees of familiarity with a place. Extending the approach to renovation comparisons, pedestrian walkability, children’s engagement with neighborhood spaces, and night-time settings would further support data-driven development of inclusive, youth-responsive public spaces in rapidly changing Indian cities.
Author Contributions
Conceptualization, U.H., H.S.L., S.K. (Saptarshi Kolay) and S.K. (Sandipan Karmakar); methodology, U.H., H.S.L. and S.K. (Saptarshi Kolay); software, U.H.; validation, U.H., H.S.L. and S.K. (Saptarshi Kolay); formal analysis, U.H. and S.K. (Sandipan Karmakar); investigation, U.H.; data curation, U.H.; writing—original draft preparation, U.H.; writing—review and editing, H.S.L., S.K. (Saptarshi Kolay) and S.K. (Sandipan Karmakar); visualization, U.H.; supervision, H.S.L. and S.K. (Saptarshi Kolay). All authors have read and agreed to the published version of the manuscript.
Funding
This research received no external funding.
Institutional Review Board Statement
This study was conducted as part of doctoral research at the Indian Institute of Technology Roorkee, India. The research involved a non-invasive, screen-based eye-tracking experiment and an anonymous perceptual questionnaire administered to adult participants. Formal prior approval from the Institute Human Ethics Committee (IHEC), IIT Roorkee, was not obtained, as the Committee does not grant retrospective approval or waivers for completed studies. However, all research procedures adhered to established ethical principles for human-participant research: participation was voluntary, written informed consent was obtained from all participants prior to data collection, and participants were informed of the study objectives and their right to withdraw at any time. Participant anonymity, confidentiality, and secure data handling were maintained throughout. The research posed minimal risk to participants and was conducted in accordance with the ethical principles of the Declaration of Helsinki (1975, revised 2013).
Informed Consent Statement
Informed consent was obtained from all subjects involved in the study.
Data Availability Statement
The data presented in this study are available from the corresponding author upon reasonable request. The dataset is not publicly available because it contains participant-level research data. Anonymized data may be provided for research purposes upon reasonable request.
Conflicts of Interest
The authors declare no conflicts of interest.
References
- Abeynayake, T.; Meetiyagoda, L.; Kankanam, N.; Mahanama, P.K.S. Imageability and legibility: Cognitive analysis and visibility assessment in Galle heritage city. J. Archit. Urban. 2022, 46, 126–136. [Google Scholar] [CrossRef] [Scilit]
- Ewing, R.; Handy, S. Measuring the unmeasurable: Urban design qualities related to walkability. J. Urban Des. 2009, 14, 65–84. [Google Scholar] [CrossRef] [Scilit]
- Lynch, K. The Image of the City; MIT Press: Cambridge, MA, USA, 1960. [Google Scholar]
- Alexander, C. The Nature of Order: An Essay on the Art of Building and the Nature of the Universe. Book One: The Phenomenon of Life; Center for Environmental Structure: Berkeley, CA, USA, 2002. [Google Scholar]
- Omar, K.A.; Omar, D.; Othman, S. Youth well-being index in the neighbourhood space: Outdoor vs indoor space. WIT Trans. Ecol. Environ. 2017, 214, 163–171. [Google Scholar] [CrossRef] [Scilit]
- Crane, P.; Dee, M. Young people, public space & new urbanism. Youth Stud. Aust. 2001, 20, 11–18. [Google Scholar]
- Ito, K.; Kang, Y.; Zhang, Y.; Zhang, F.; Biljecki, F. Understanding urban perception with visual data: A systematic review. Cities 2024, 152, 105169. [Google Scholar] [CrossRef] [Scilit]
- Shtebunaev, S.; Gullino, S.; Larkham, P.J. Planning the smart city with young people: Teenagers’ perceptions, values and visions of smartness. Urban Plan. 2023, 8, 57–69. [Google Scholar] [CrossRef] [Scilit]
- Gómez-Varo, I.; Delclòs-Alió, X.; Miralles-Guasch, C.; Marquet, O. Youth perception of urban vitality: A PhotoVoice study on the everyday experiences of public space. J. Plan. Educ. Res. 2024, 44, 2196–2213. [Google Scholar] [CrossRef] [Scilit]
- Zhang, W.; Yang, B.; Wang, R.; Guo, X. An analysis of the effects of different urban park space environment construction on national health. Front. Environ. Sci. 2024, 12, 1433319. [Google Scholar] [CrossRef] [Scilit]
- Mehta, V. Lively streets: Determining environmental characteristics to support social behavior. J. Plan. Educ. Res. 2007, 27, 165–187. [Google Scholar] [CrossRef] [Scilit]
- Sabyrbekov, R.; Dallimer, M.; Navrud, S. Nature affinity and willingness to pay for urban green spaces in a developing country. Landsc. Urban Plan. 2020, 194, 103700. [Google Scholar] [CrossRef] [Scilit]
- Abdul Rahman, N.; Ghani, I.; Teh, M.Z.; Ibrahim, K.A. Rethinking urban public space: Physical and functional analysis through visual surveys. IOP Conf. Ser. Earth Environ. Sci. 2020, 409, 012002. [Google Scholar] [CrossRef] [Scilit]
- Bottero, M.; Bravi, M.; Caprioli, C.; Dell’Anna, F. Combining revealed and stated preferences to design a new urban park in a metropolitan area of North-Western Italy. Ecol. Model. 2023, 483, 110436. [Google Scholar] [CrossRef] [Scilit]
- Dupont, L.; Antrop, M.; Van Eetvelde, V. Eye-tracking analysis in landscape perception research: Influence of photograph properties and landscape characteristics. Landsc. Res. 2014, 39, 417–432. [Google Scholar] [CrossRef] [Scilit]
- Xu, S.; Yuan, S.; Li, J.; Gao, X.; Hu, J. Urban park green space use analysis based on trajectory big data: Experience from a medium-sized city in China. Heliyon 2024, 10, e26445. [Google Scholar] [CrossRef] [Scilit] [PubMed]
- Berta, M.; Bottero, M.; Ferretti, V. A mixed methods approach for the integration of urban design and economic evaluation: Industrial heritage and urban regeneration in China. Environ. Plan. B Urban Anal. City Sci. 2018, 45, 208–232. [Google Scholar] [CrossRef] [Scilit]
- Quang, P.V.; Dung, P.A.; Anh, H.; Tuyet, C.T.A. Building identities in public spaces through cultural language analysis framework: A case study of public spaces along the Ha Thanh river, Quy Nhon city, Central Vietnam. E3S Web Conf. 2023, 403, 01028. [Google Scholar] [CrossRef] [Scilit]
- Shukla, A.; Chhabra, P. Public space development dimensions: A critical review. ShodhKosh J. Vis. Perform. Arts 2023, 4, 316. [Google Scholar] [CrossRef] [Scilit]
- Ewertowski, W. Public space in different cultural conditions: The cases of Glasgow and Poznań. Quaest. Geogr. 2023, 42, 115–129. [Google Scholar] [CrossRef] [Scilit]
- Li, Y.; Sahari, F. The application of regional culture in urban public space design. Cogent Arts Humanit. 2022, 9, 2116773. [Google Scholar] [CrossRef] [Scilit]
- Mateo-Babiano, I.; Fong, A. Integrating multiculturalism in public space policy and place governance. Urban Gov. 2024, 4, 56–67. [Google Scholar] [CrossRef] [Scilit]
- Siláči, I.; Vitková, Ľ. Public spaces as the reflection of society and its culture. IOP Conf. Ser. Mater. Sci. Eng. 2017, 245, 042009. [Google Scholar] [CrossRef] [Scilit]
- Purnomo, A. Youth social behaviour in using the city’s public space (case study of Menteng Bintaro park). IOP Conf. Ser. Earth Environ. Sci. 2022, 969, 012074. [Google Scholar] [CrossRef] [Scilit]
- Zeadat, Z.F. Strategies toward greater youth participation in Jordan’s urban policymaking. J. Sustain. Real Estate 2023, 15, 2204534. [Google Scholar] [CrossRef] [Scilit]
- Noland, R.B.; Weiner, M.D.; Gao, D.; Cook, M.P.; Nelessen, A. Eye-tracking technology, visual preference surveys, and urban design: Preliminary evidence of an effective methodology. J. Urban. 2017, 10, 98–110. [Google Scholar] [CrossRef] [Scilit]
- Ma, S.; Zhang, W.; Noland, R.B.; Andrews, C.J. Eye tracking measures of bicyclists’ behavior and perception: A systematic review. Transp. Res. Part F Traffic Psychol. Behav. 2024, 107, 52–68. [Google Scholar] [CrossRef] [Scilit]
- Charalambous, E. Neurourbanism and Neuroarchitecture: How Can Cognitive Sciences Inform Design? University of Cyprus: Nicosia, Cyprus, 2023. [Google Scholar] [CrossRef]
- Ren, H.; Yang, F.; Zhang, J.; Wang, Q. Evaluation of cognition of rural public space based on eye tracking analysis. Buildings 2024, 14, 1525. [Google Scholar] [CrossRef] [Scilit]
- Simpson, J.; Freeth, M.; Simpson, K.J.; Thwaites, K. Visual engagement with urban street edges: Insights using mobile eye-tracking. J. Urban. 2019, 12, 259–278. [Google Scholar] [CrossRef] [Scilit]
- de Winter, J.; Bazilinskyy, P.; Wesdorp, D.; de Vlam, V.; Hopmans, B.; Visscher, J.; Dodou, D. How do pedestrians distribute their visual attention when walking through a parking garage? An eye-tracking study. Ergonomics 2021, 64, 793–805. [Google Scholar] [CrossRef] [Scilit] [PubMed]
- Tang, J.; Long, Y. Measuring visual quality of street space and its temporal variation: Methodology and its application in the Hutong area in Beijing. Landsc. Urban Plan. 2019, 191, 103436. [Google Scholar] [CrossRef] [Scilit]
- Rusnak, M.A.; Rabiega, M. The potential of using an eye tracker in architectural education: Three perspectives for ordinary users, students and lecturers. Buildings 2021, 11, 245. [Google Scholar] [CrossRef] [Scilit]
- Xing, Y.; Leng, J. Evaluation of public space in traditional villages based on eye tracking technology. J. Asian Archit. Build. Eng. 2024, 23, 125–139. [Google Scholar] [CrossRef] [Scilit]
- Sussman, A.; Hollander, J.B. Cognitive Architecture: Designing for How We Respond to the Built Environment, 2nd ed.; Routledge: New York, NY, USA, 2021. [Google Scholar]
- Lavdas, A.A.; Salingaros, N.A.; Sussman, A. Visual Attention Software: A new tool for understanding the “subliminal” experience of the built environment. Appl. Sci. 2021, 11, 6197. [Google Scholar] [CrossRef] [Scilit]
- Berto, R.; Barbiero, G.; Salingaros, N.A. Biophilic design of building façades from an evolutionary psychology framework: Visual Attention Software compared to perceived restorativeness. Vis. Sustain. 2022, 18, 7054. [Google Scholar]
- Hollander, J.B.; Sussman, A. (Eds.) Urban Experience and Design: Contemporary Perspectives on Improving the Public Realm; Routledge: New York, NY, USA, 2021. [Google Scholar]
- Li, N.; Zhang, S.; Xia, L.; Wu, Y. Investigating the visual behavior characteristics of architectural heritage using eye-tracking. Buildings 2022, 12, 1058. [Google Scholar] [CrossRef] [Scilit]
- Rudenko, S.; Danilina, N.; Hristov, B. Using a mobile eye-tracking technology to explore pedestrians’ gaze distribution on street space. E3S Web Conf. 2021, 263, 05015. [Google Scholar] [CrossRef] [Scilit]
- Yang, C.; Lyu, C. Study the nighttime visual attention in urban waterfront public space: Insights using mobile eye-tracking. Front. Archit. Res. 2025, 15, 216–237. [Google Scholar] [CrossRef] [Scilit]
- Fleming, W.; Rizowy, B.; Shwartz, A. The nature gaze: Eye-tracking experiment reveals well-being benefits derived from directing visual attention towards elements of nature. People Nat. 2024, 6, 1469–1485. [Google Scholar] [CrossRef] [Scilit]
- Town and Country Planning Organisation, Ministry of Urban Development, Government of India. URDPFI Guidelines; Town and Country Planning Organisation, Ministry of Urban Development, Government of India: New Delhi, India, 2015.
- Ministry of Urban Development, Government of India. Urban Greening Guidelines; Ministry of Urban Development, Government of India: New Delhi, India, 2014.
- Jaipur Development Authority. Jaipur Master Development Plan 2025; Jaipur Development Authority: Jaipur, India, 2011; Volume 1.
- Kaplan, S. The restorative benefits of nature: Toward an integrative framework. J. Environ. Psychol. 1995, 15, 169–182. [Google Scholar] [CrossRef] [Scilit]
- Just, M.A.; Carpenter, P.A. A theory of reading: From eye fixations to comprehension. Psychol. Rev. 1980, 87, 329–354. [Google Scholar] [CrossRef]
- Jawaid, M.F.; Sharma, M.; Pipralia, S.; Kumar, A. City profile: Jaipur. Cities 2017, 68, 63–81. [Google Scholar] [CrossRef] [Scilit]
- Mishra, S.; Kolay, S. Visual perception of the street façade of a historic town: Case study of the walled city of Jaipur, India. In Smart Innovation, Systems and Technologies; Springer: Singapore, 2019; Volume 135, pp. 377–389. [Google Scholar] [CrossRef] [Scilit]

Disclaimer/Publisher’s Note: The statements, opinions and data contained in all publications are solely those of the individual author(s) and contributor(s) and not of MDPI and/or the editor(s). MDPI and/or the editor(s) disclaim responsibility for any injury to people or property resulting from any ideas, methods, instructions or products referred to in the content. |
© 2026 by the authors. Licensee MDPI, Basel, Switzerland. This article is an open access article distributed under the terms and conditions of the Creative Commons Attribution (CC BY) license.