


Abstract
High-density central business districts (CBDs) often appear highly walkable because they combine transit accessibility, functional density and active frontages. Yet their pedestrian environments may lose usability under routine disturbances such as crowding, e-bike encroachment, blind-path obstruction and effective-width erosion. This study reframes walkability as baseline pedestrian capacity and everyday resilience as the ability of that capacity to remain safe, continuous, inclusive and comfortable under ordinary urban stressors. Taking Beijing Guomao as a case, we integrated a field street audit, sidewalk-width measurement, route timing, traffic-interference observation, POI-based vitality assessment and 145 valid questionnaires. The objective indicator table produced a capacity-oriented score of 0.868 on a 0–1 scale, while the perception index was 3.17/5. The gap was explained by weak disturbance-sensitive indicators: non-motorized vehicle intrusion (0.46), blind-path continuity (0.60), motor-vehicle encroachment (0.67) and acoustic comfort (0.72). Field measurements showed mean physical and effective sidewalk widths of 3.62 m and 2.36 m, respectively. The mean section-level width loss was 30.9%, while the maximum loss of 88.2% occurred at one severely obstructed section, where the effective width was 0.50 m. The findings suggest that CBD pedestrian improvement should shift from facility provision to operational resilience through width recovery, micromobility governance, barrier-free continuity and last-mile route integration.
1. Introduction
Walking is the elementary mode through which urban residents access public transport, workplaces, retail services, civic spaces, and everyday social life. In compact and transit-rich districts, pedestrian infrastructure is therefore not merely an amenity but a precondition for low-carbon mobility, public-space quality, and equitable access [1,2,3,4,5]. The research literature has long associated walkability with connectivity, density, mixed land use, accessibility, safety, comfort, and urban design qualities such as imageability and human scale [6,7,8,9,10,11]. Meta-analytic evidence further confirms that travel behavior and walking activity are strongly shaped by the built environment across diverse urban contexts [12]. These dimensions remain indispensable, but they do not fully explain how pedestrian environments perform under the intense and fluctuating loads of high-density CBDs.
CBDs such as Beijing Guomao present a distinctive paradox. Their regional transit accessibility, commercial density, and high level of service provision can produce strong walkability potential. At the same time, concentrated commuting flows, complex ground-floor interfaces, micromobility parking, delivery activities, taxi pick-up and drop-off, underground/ground-level route fragmentation, and temporary construction can substantially reduce actual pedestrian capacity. The difference between nominal facility provision and operational usability is especially important for resilient and sustainable urban planning. A sidewalk that is physically wide but functionally narrowed by bicycles, poles, commercial spillover, or blind-path occupation cannot be considered resilient simply because it exists.
Resilience has been interpreted differently across engineering, ecological, and urban studies, including the capacities to resist disturbance, recover functionality, adapt to changing conditions, and support longer-term transformation [13,14,15,16,17,18]. This conceptual diversity does not preclude empirical application, but it requires each study to clarify the system function and stressors under consideration [14,17,18,19].
Accordingly, this paper integrates conventional walkability assessment with an everyday-resilience perspective. Everyday pedestrian infrastructure resilience is defined here as the capacity of the pedestrian system to sustain safe, continuous, legible, inclusive, and comfortable movement under recurring urban pressures. The study focuses on the operational expression of resilience, in which robustness—the ability to retain essential functions during disturbance—is particularly relevant. The disturbances examined include effective-width erosion and crowding, route and blind-path discontinuity, motorized and micromobility conflicts, and environmental discomfort. This perspective extends pedestrian resilience analysis from exceptional emergencies to the routine operating conditions of high-density urban centers.
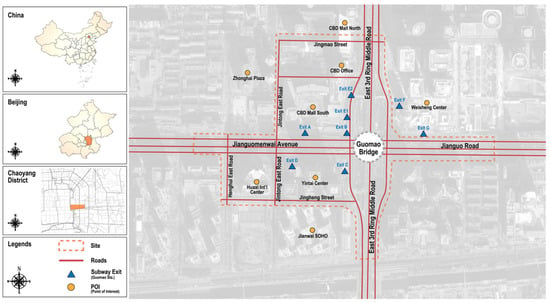
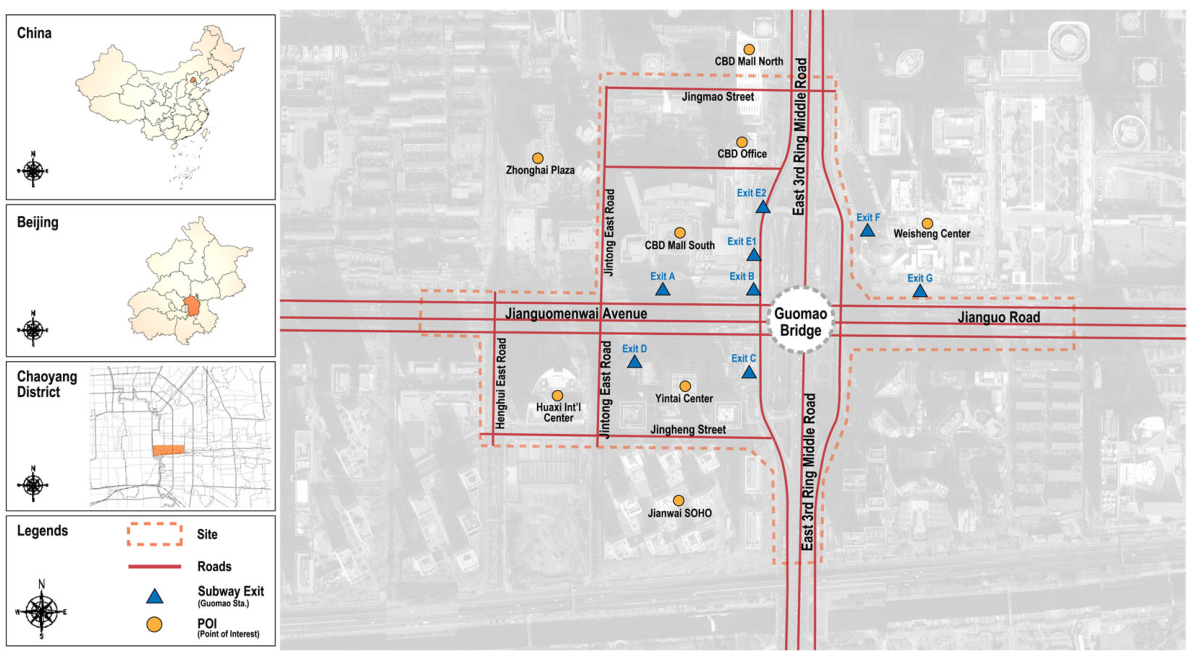
Beijing Guomao, located in Jianwai Subdistrict, Chaoyang District, is a representative high-density CBD and a major interchange environment around Guomao Station. It combines high-grade office towers, commercial complexes, hotels, residential and service functions, and multiple public transport nodes. The study area covers seven main roads and surrounding pedestrian spaces, including East 3rd Ring Middle Road, Jianguomenwai Avenue, Jingmao Street, Jintong East Road, Henghui Road, Jingheng Street, and Henghui East Road. The case provides a suitable setting for examining whether strong baseline walkability can be converted into robust everyday pedestrian performance.
Research Objectives and Scope
The objectives of this study are (1) to assess the baseline walkability capacity of Beijing Guomao using multi-source evidence; (2) to identify the routine disturbances that reduce effective pedestrian usability and inclusive accessibility; and (3) to translate the diagnosed weaknesses into spatial-design, network-integration, and governance strategies for everyday pedestrian resilience in high-density CBDs.
Correspondingly, three research questions guide the study: (1) How does Guomao perform when its pedestrian environment is assessed through a multi-source walkability framework? (2) Which routine disturbances most strongly erode pedestrian capacity and inclusive accessibility? (3) How can walkability evidence be translated into design and governance strategies for everyday pedestrian resilience in high-density CBDs?
The empirical scope covers the surface pedestrian system around Guomao Station and seven surrounding streets. Field observations and questionnaire data were collected in December 2025 to provide a diagnostic assessment of routine operating conditions in the study area. The principal methodological limitations are discussed in Section 5.6.
The contribution of this paper is threefold. First, it clarifies the conceptual link between walkability and resilience by treating walkability as baseline capacity and everyday disturbances as stressors that test that capacity. Second, it introduces effective-width erosion, blind-path continuity, and micromobility intrusion as operational indicators that connect built-environment measurement to resilience diagnosis. Third, it offers a transferable planning logic for CBD pedestrian improvement that combines spatial design, network integration, and co-governance.
2. Literature Review and Conceptual Framework
2.1. Walkability as Baseline Pedestrian Capacity
Walkability has been defined and operationalized in multiple ways. Morphological studies emphasize density, diversity, design, destination accessibility, and distance to transit [7,8]. Urban design studies add qualities such as imageability, enclosure, transparency, and complexity [9]. Public-health and transportation research links walkable environments to active mobility, transit use, and health-supportive behavior [10,11,20]. In the Chinese planning context, recent studies have also adapted walkability assessment to street space, old communities, commercial blocks, and elderly-friendly walking environments [21,22,23,24]. Recent studies have applied big data and deep learning to comprehensively assess walkability at scale, providing new empirical tools for evaluation [25,26]. Influential design-oriented frameworks have similarly emphasized that walkable cities must prioritize the human scale of streets and public spaces [27,28,29,30]. Despite differences in disciplinary emphasis, most approaches converge on a basic claim: walkable environments provide spatial capacity for safe, convenient, comfortable, and meaningful pedestrian movement.
For CBDs, however, capacity is not equivalent to performance. The same physical sidewalk width may support fluent movement in one segment and fail in another if the effective width is reduced by parked bicycles, poles, vendors, taxi queues, or crowd spillover. Likewise, the presence of transit stations does not guarantee convenient last-mile walking if station exits, commercial entrances, and office lobbies are poorly aligned or difficult to understand. Research shows that walkability relationships vary significantly by socioeconomic and spatial context, and that meso- and micro-scale environmental factors jointly shape pedestrian satisfaction [31,32]. Assessment methods incorporating participatory and multi-profile approaches have been proposed to capture these differential experiences [33,34]. For this reason, CBD walkability assessment requires more attention to the difference between designed provision and usable capacity.
2.2. Spatial Disorder and Everyday Pedestrian Disturbances
The concept of spatial disorder is useful for connecting walkability to resilience. In public-space research, disorder refers to visible or functional disruptions caused by insufficient maintenance, weak management, or competing uses, such as damaged pavements, unmanaged parking, litter, construction interruption, and occupation of pedestrian space [35]. These conditions do not always eliminate pedestrian routes, but they reduce reliability, perceived safety, and inclusiveness. Research has also shown that walkability perceptions vary by gender and socio-spatial context, with women and peripheral residents often reporting more nuanced sensitivity to disorder [36]. In dense CBDs, disorder is often not an exceptional event but a routine operating condition.
Everyday pedestrian disturbances can be grouped into four types. Capacity disturbances reduce the effective space available for walking, such as width erosion and crowding. Continuity disturbances interrupt route coherence, including blind-path obstruction, inaccessible ramps, or fragmented crossings. Conflict disturbances increase risk through interactions with motor vehicles, e-bikes, shared bicycles, delivery activities, and curbside operations; shared micromobility can further generate sidewalk parking, pedestrian right-of-way blockage, and safety-perception conflicts in transit-rich districts [37,38,39]. Comfort disturbances reduce willingness to walk through noise, heat exposure, inadequate shade, or lack of rest facilities; acoustic environments in particular have been shown to meaningfully affect pedestrian experience and route choice [40]. These disturbances are treated as everyday resilience stressors because they test the robustness of walkability capacity under ordinary urban pressure.
2.3. CBDs, TOD, and the Last-Mile Problem
Transit-oriented development is often associated with pedestrian-oriented urban form, but high transit accessibility can also concentrate pedestrian demand into short time windows and limited spatial channels [41]. CBDs are especially sensitive to last-mile conditions because many walking trips are not complete door-to-door journeys but short connections between metro exits, bus stops, office towers, shopping malls, hotel entrances, and underground or elevated circulation systems. The quality of these 300–600 m connections strongly influences perceived efficiency and willingness to walk [42]. The 15 min community planning concept further underscores the importance of walkable route quality within compact service catchments [43]. Therefore, TOD environments should be evaluated not only by the presence of rail and bus services, but also by the resilience of pedestrian routes that distribute passengers after they leave the transit node [42,44].
2.4. Conceptual Framework
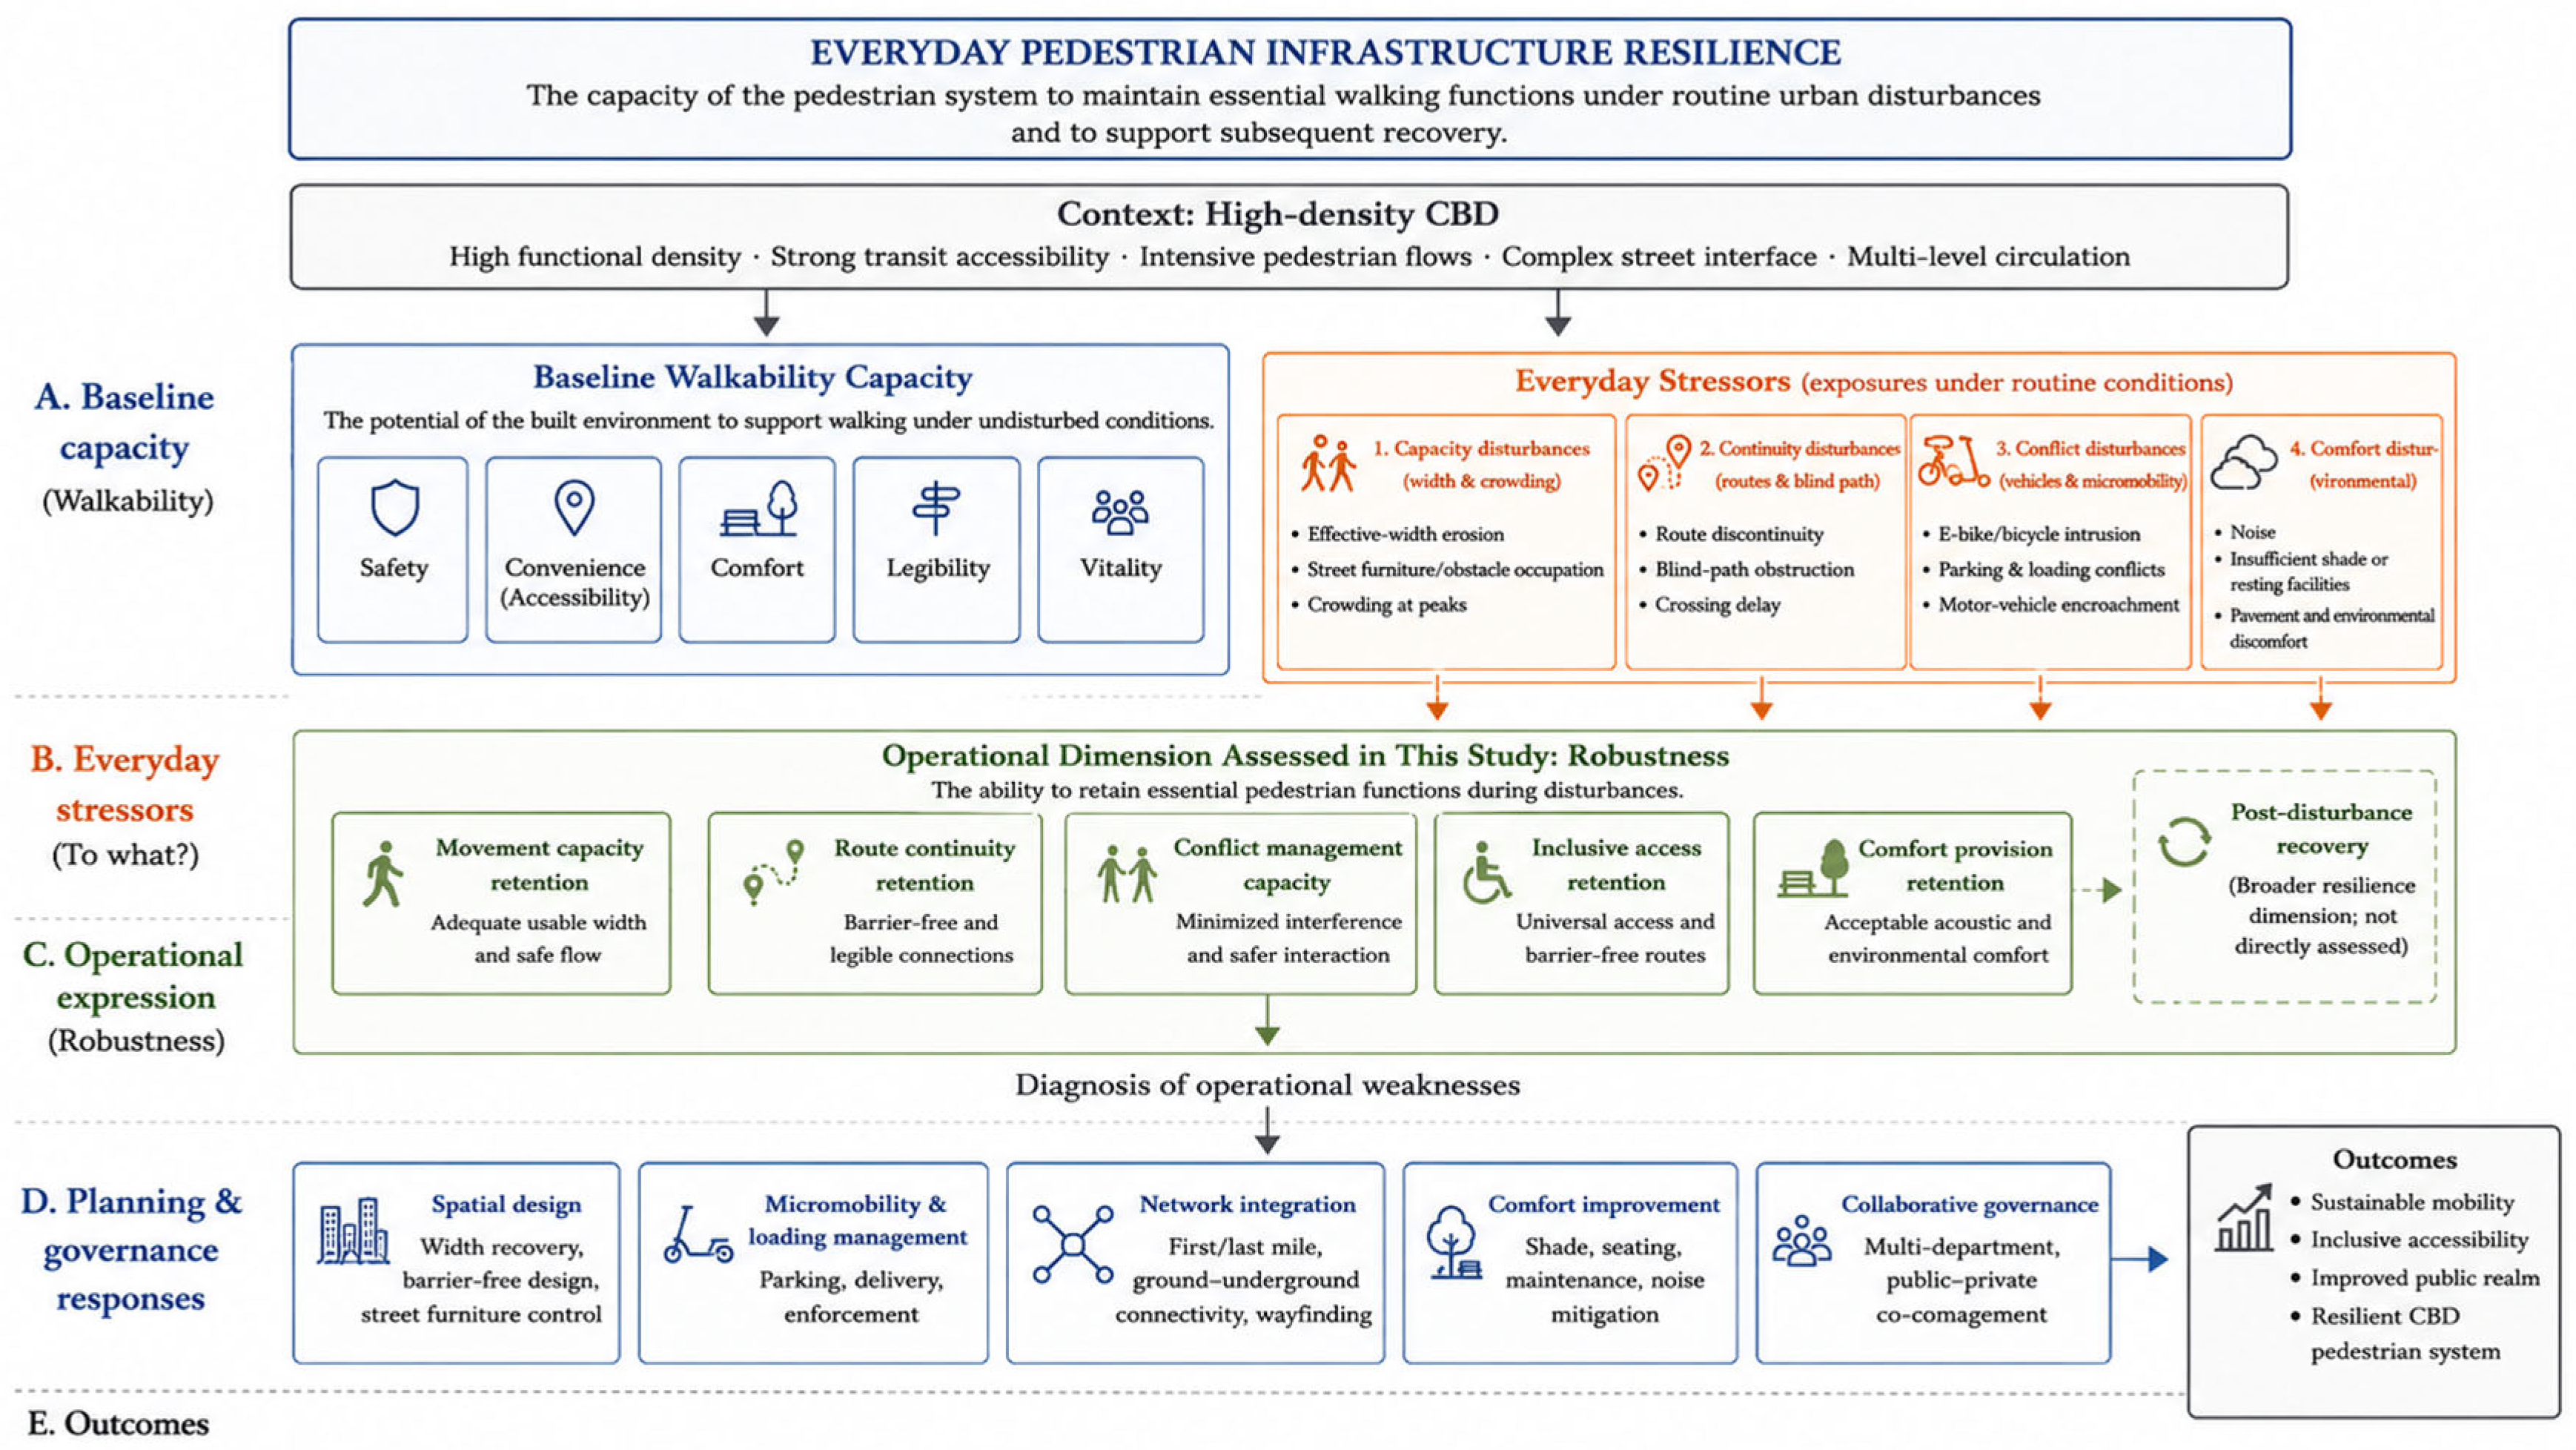
Figure 1 summarizes the conceptual framework linking baseline walkability, everyday stressors, pedestrian resilience, and planning responses. Walkability is understood as the baseline capacity generated by safety, convenience, comfort, legibility, and vitality. Everyday disturbances may erode this capacity through spatial occupation, route interruption, traffic conflict, and environmental discomfort. Pedestrian infrastructure demonstrates everyday resilience when it retains five interrelated operational capabilities: movement capacity, route continuity, conflict management, inclusive access, and comfort provision. Robustness therefore represents the immediate operational expression of resilience within the framework, while the combined indicators support the diagnosis of weaknesses and the formulation of planning strategies.
Figure 1.
Conceptual framework linking high-density CBD context, baseline walkability capacity, everyday stressors, operational robustness, and planning and governance responses.
3. Materials and Methods
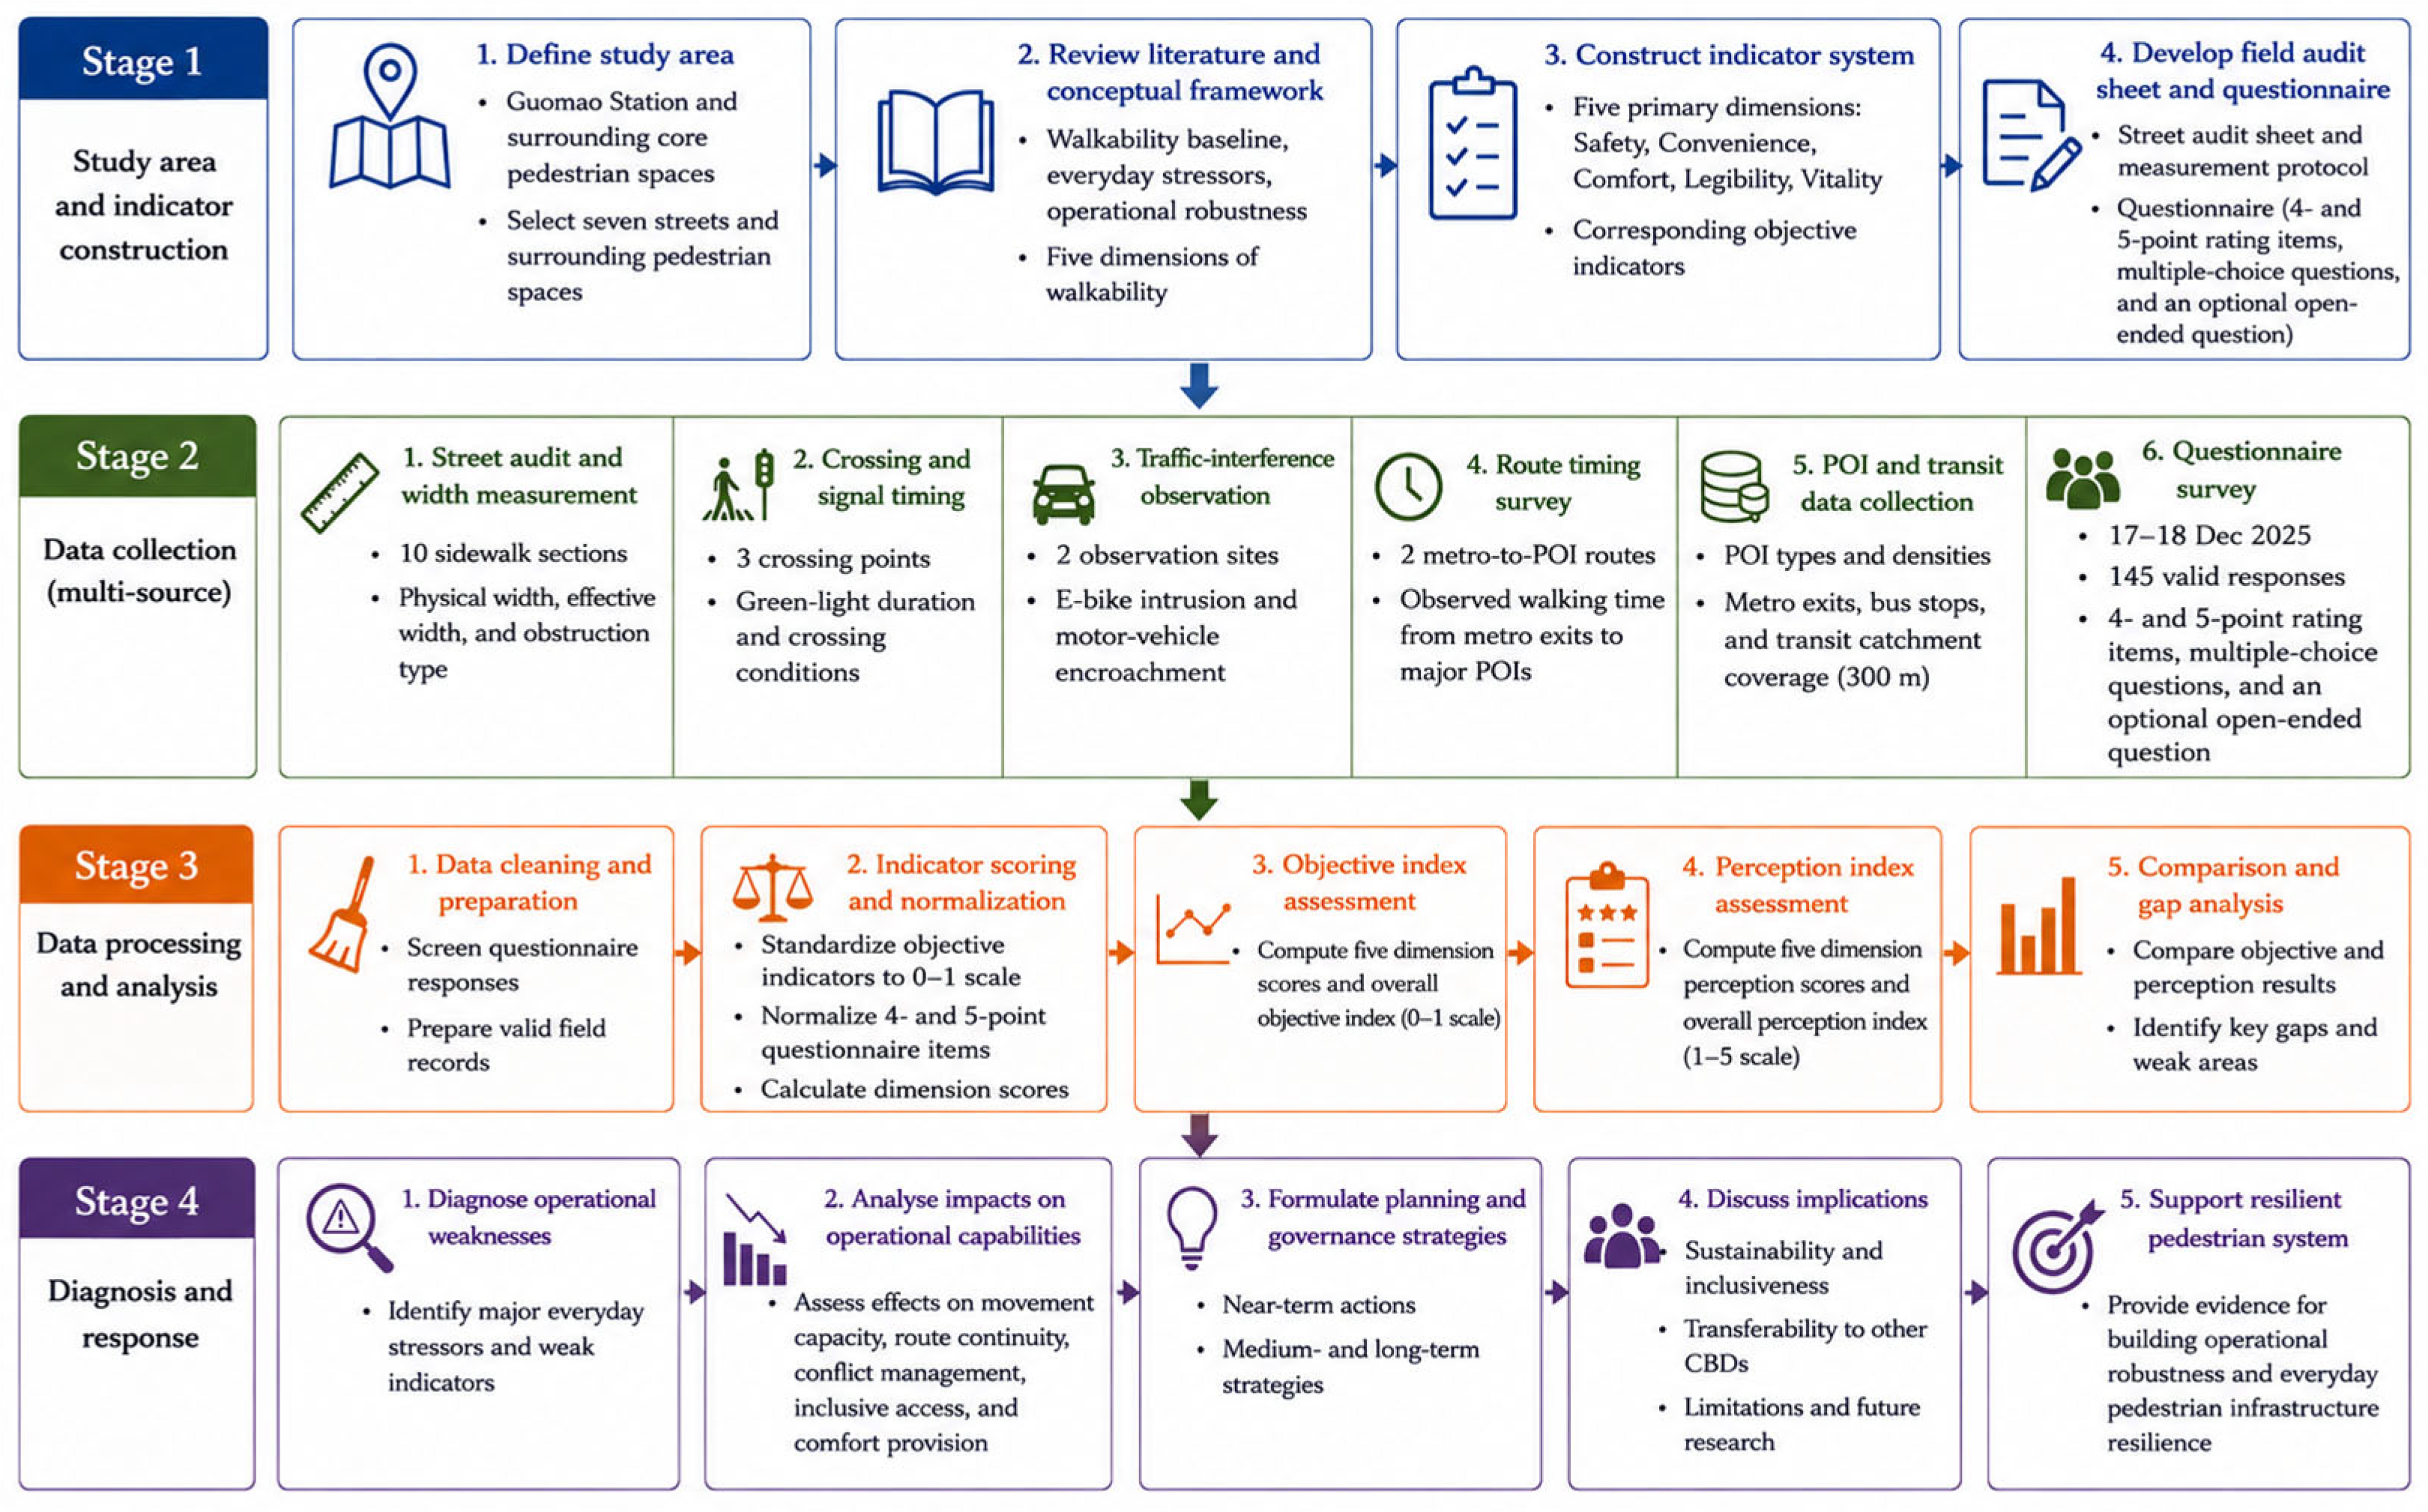
To address the research objectives, the study adopted a cross-sectional, multi-source research design. The research proceeded through four connected stages: (1) study-area definition and indicator construction; (2) field measurement, questionnaire survey, route timing, traffic-interference observation, and POI data collection; (3) data standardization and comparison of objective and perceived performance; and (4) disturbance diagnosis and the formulation of planning and governance strategies. Objective measurements and questionnaire-based perceptions were analyzed separately and then compared to identify gaps between baseline capacity and everyday pedestrian experience. The overall methodological workflow is illustrated in Figure 2.
Figure 2.
Research design and methodological workflow of the study.
3.1. Study Area
The study area is located around Guomao Station and the surrounding core pedestrian spaces of Jianwai Subdistrict, Beijing. The selected streets include East 3rd Ring Middle Road, Jianguomenwai Avenue, Jingmao Street, Jintong East Road, Henghui Road, Jingheng Street, and Henghui East Road, as well as the perimeter pedestrian spaces of major buildings such as Guomao Mall, Yintai Center, and Zhonghai Plaza. These streets jointly represent the surface pedestrian system of a mature high-density CBD with strong transit access, intensive commercial functions, and complex pedestrian–micromobility conflicts, as shown in Figure 3.
Figure 3.
Study area, street segments, transit exits and major POIs.
3.2. Data Sources and Field Protocol
The study used a multi-source design combining field measurement, questionnaire survey, route timing, traffic-interference observation, and online POI-based interpretation, as summarized in Table 1. Field measurements were conducted around Guomao Station on 17 December 2025 between 15:00 and 17:00 under sunny weather conditions. The field audit recorded physical sidewalk width, effective pedestrian width, sidewalk obstruction type, signal timing, pedestrian volume, non-motorized vehicle intrusion, and walking time from metro exits to major POIs. The questionnaire was collected from 17 to 18 December 2025 and yielded 145 valid responses. POI and transit-access information was manually extracted from Amap (Gaode Map, Version: AMap GS(2026)3437) during the same fieldwork period in December 2025. POIs were classified into business services, restaurants, retail/leisure, and daily-life services, and duplicate records along the same street frontage were removed through manual checking.
Table 1.
Data sources and analytical roles. (for more details see S1 Jianwai Data).
3.3. Questionnaire Design and Respondent Profile
The questionnaire was designed around pedestrian experience and spatial disorder. It included questions on age, travel purpose, walking frequency, crowding influence, walking-time expectation, sidewalk width, path connectivity, encroachment, four spatial-disorder items, transit accessibility, public facilities, signage, barrier-free facilities, pavement comfort, noise, air quality, greenery, lighting, crossing safety, security, and an optional open-ended question. Several items explicitly asked respondents to evaluate occupation of sidewalks, bicycle and commercial spillover, damaged pavements, unmanaged construction, and environmental disorder, allowing perception data to be connected with field observations. (see original Questionnaire in S2).
The sample was dominated by active users of the CBD. Respondents aged 19–30 accounted for 53.8%, those aged 31–45 for 21.4%, and those aged 46–60 for 16.6%. Because travel purpose was multi-select, the main categories were shopping/leisure (62.1%), daily residential travel (62.1%), business/office travel (60.7%), and transit transfer or through movement (25.5%). In terms of walking frequency, 58.6% reported walking in the area every day, indicating that the dataset mainly reflects routine users rather than occasional visitors.
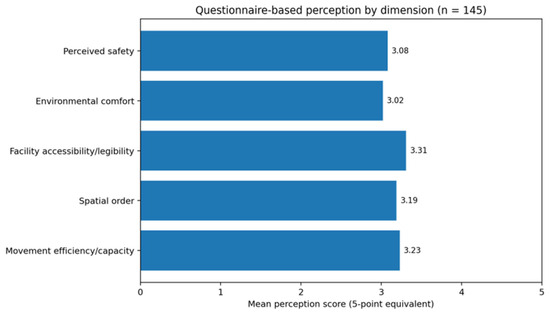
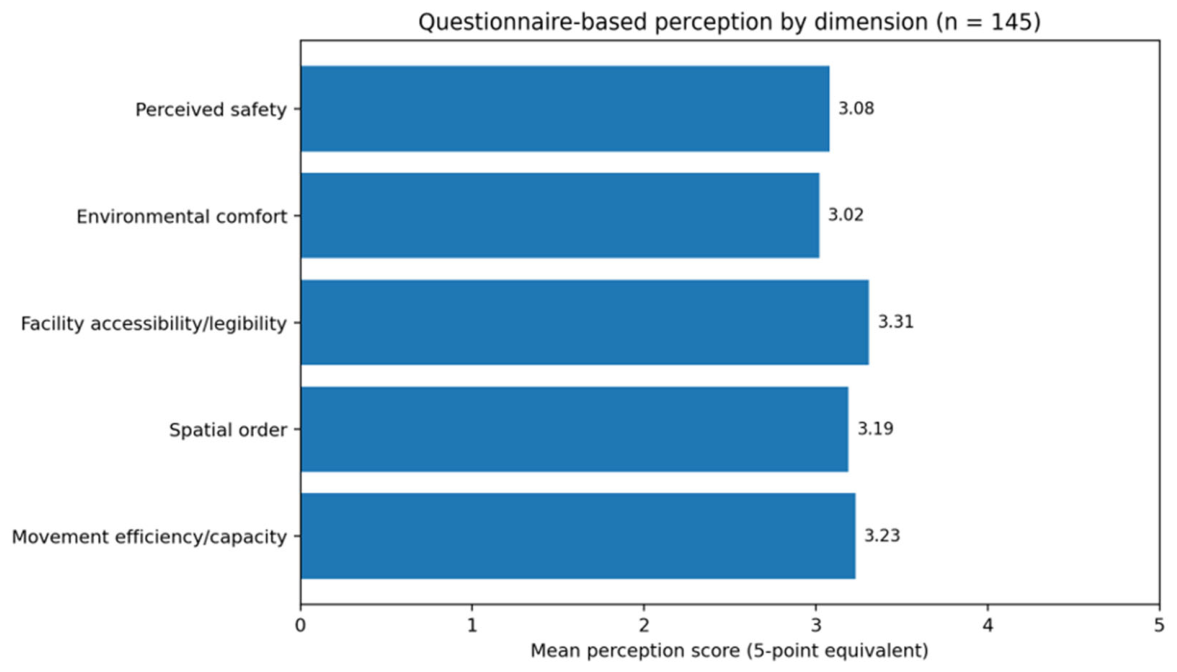
The mean scores and reliability statistics are reported in Table 2, while Figure 4 compares the five perception dimensions.
Table 2.
Perception dimensions, mean scores, and reliability statistics from the 145 valid questionnaires.
Figure 4.
Questionnaire-based perception scores by dimension.
3.4. Indicator System and Resilience Interpretation
The objective walkability indicator system retained five primary dimensions adapted to the CBD context: safety, convenience, comfort, legibility, and vitality. The first-level weights were 0.25, 0.22, 0.20, 0.13, and 0.20, respectively. Safety included sidewalk physical quality, crossing and signal facilities, monitoring and lighting, and traffic-interference control. Convenience included transit access, barrier-free movement, route flexibility, and signage. Comfort included sidewalk dimension, green shade, street furniture, and environmental perception. Legibility included landmark visibility and façade/order characteristics. Vitality included pedestrian flow, staying ratio, frontage density, business diversity, seating occupancy, and temporary activity facilities.
To link this walkability system with resilience, indicators were further interpreted as either capacity-oriented or disturbance-sensitive. Capacity-oriented indicators describe the planned or normally available support for walking, such as crossing density, signal duration, transit coverage, seating, trees, POI density, and landmark visibility. Disturbance-sensitive indicators capture conditions that erode operational performance, including non-motorized vehicle intrusion, motor-vehicle encroachment, blind-path discontinuity, effective width, acoustic discomfort, and excessive last-mile walking time. This distinction, summarized in Table 3, avoids treating a high composite walkability score as automatically equivalent to resilience (see S3 Current Indicator Sheet).
Table 3.
Objective indicator system and its resilience interpretation.
3.5. Data Processing
Physical sidewalk width and effective pedestrian width were measured separately. Effective width excluded vegetation belts, fixed facilities, parked bicycles/e-bikes, temporary obstacles, and unusable edge space. Width reduction ratio was calculated as WRR = (Wphysical − Weffective)/Wphysical. Objective indicators were standardized to a 0–1 scale using positive or negative scoring rules according to their reference standards. The weighted objective score was calculated as the sum of standardized indicator scores multiplied by their weights. Because some indicators were based on short observation windows, the results were interpreted diagnostically rather than as a definitive citywide performance rating.
Survey items were normalized before aggregation. Four-point items, including crowding, time expectation, and barrier-free adequacy, were divided by 4; five-point items were divided by 5. The normalized scores were converted to a five-point equivalent for interpretability. Internal consistency was assessed using Cronbach’s alpha for the full 20-item perception scale and for each perception dimension.
3.6. Ethical Considerations
The questionnaire preamble informed respondents that the survey was anonymous, that responses would be used only for academic research, and that there were no right or wrong answers. Platform-generated IP information was not used in the analysis.
4. Results
4.1. Overall Walkability Capacity and Perception
The objective indicator system yielded a weighted capacity-oriented walkability score of 0.868. This value indicates that Guomao has a strong baseline provision of pedestrian-supportive resources, especially in transit coverage, crossing supply, monitoring facilities, green view, seating and sanitation, business diversity, and pedestrian vitality. However, the questionnaire-based perception index was 3.17/5, which is notably more moderate than the objective capacity score. This mismatch suggests that facility abundance does not automatically translate into a resilient pedestrian experience. The dimension-level results are reported in Table 4.
Table 4.
Objective dimension scores from the updated indicator sheet. Legibility indicators were assessed through available route-cognition and landmark-recognition variables.
Several perception results help explain the gap. Although average dimension scores were all around the middle-to-upper range, 44.1% of respondents reported that crowding affected passage, 47.6% reported that walking time exceeded expectations, 37.2% perceived frequent sidewalk encroachment, 33.8% reported that barrier-free facilities did not or only partially met their needs, and 42.8% rated the noise environment unfavorably. These results point to a system that is resource-rich but vulnerable to routine operational stress.
4.2. Effective-Width Erosion and Capacity Fragility
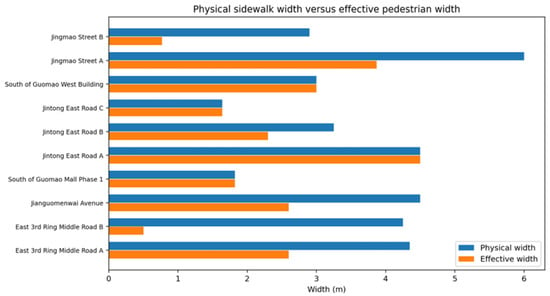
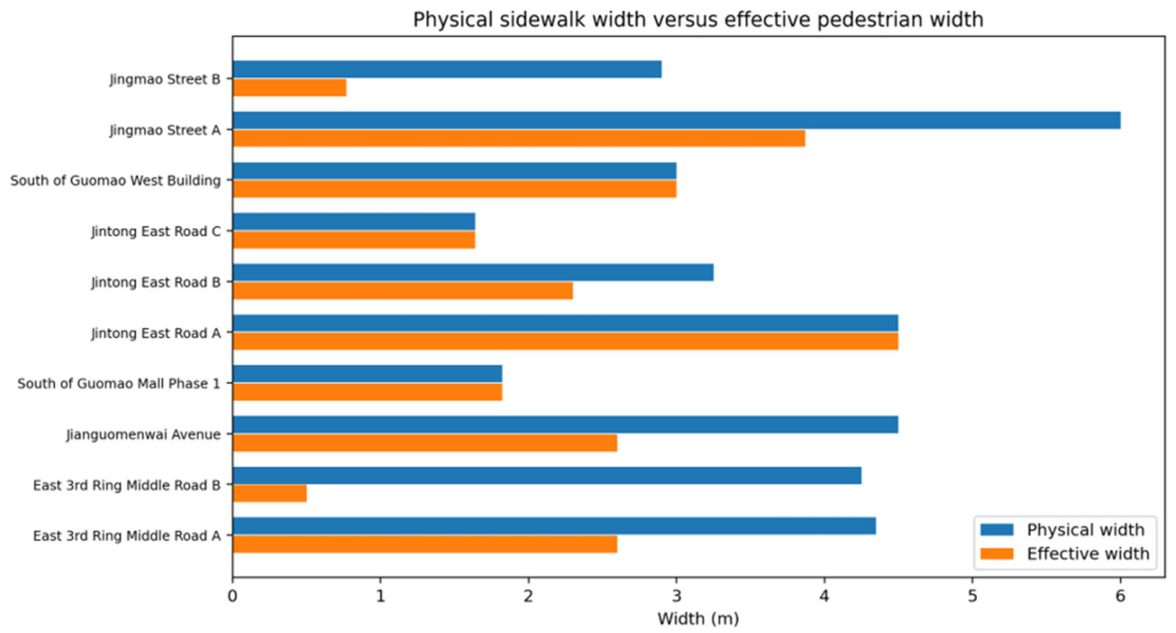
The most important field finding is that sidewalk capacity in Guomao is often not limited by nominal provision but by effective-width erosion. Across ten measured sidewalk sections, mean physical width was 3.62 m, while mean effective width was 2.36 m. The mean width loss was 30.9%. The smallest effective width was only 0.50 m on East 3rd Ring Middle Road, where a large number of non-motorized vehicles occupied the pedestrian space. Another severe bottleneck occurred on Jingmao Street, where a 2.90 m sidewalk was reduced to 0.77 m by illegal e-bike parking, corresponding to a 73.4% capacity loss. The maximum recorded loss was 88.2% at one severely obstructed section (Table 5 and Figure 5).
Table 5.
Physical width, effective width, and width-loss ratio of measured sidewalk sections.
Figure 5.
Physical sidewalk width versus effective pedestrian width across measured sections.
These measurements demonstrate why a walkability assessment that relies only on designed or mapped sidewalk width is insufficient. In a high-density CBD, the resilience problem is not necessarily the absence of sidewalks; it is the loss of usable width during routine operation. Effective-width erosion directly reduces capacity resilience, forces lateral avoidance behavior, and disproportionately affects wheelchair users, people with luggage, older adults, children, and visually impaired pedestrians. Studies combining street view image recognition and deep learning have demonstrated that older adults with varying mobility abilities experience walkability barriers very differently, reinforcing the need for effective-width analysis rather than physical provision alone [45].
4.3. Traffic Interference, Blind-Path Obstruction, and Spatial Disorder
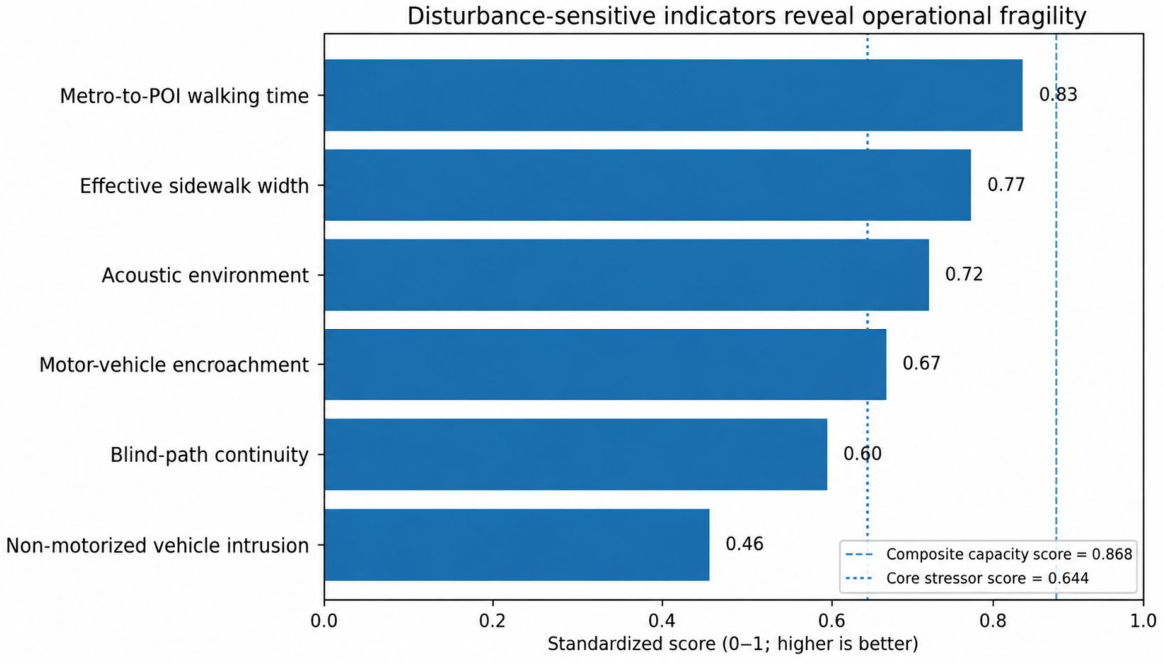
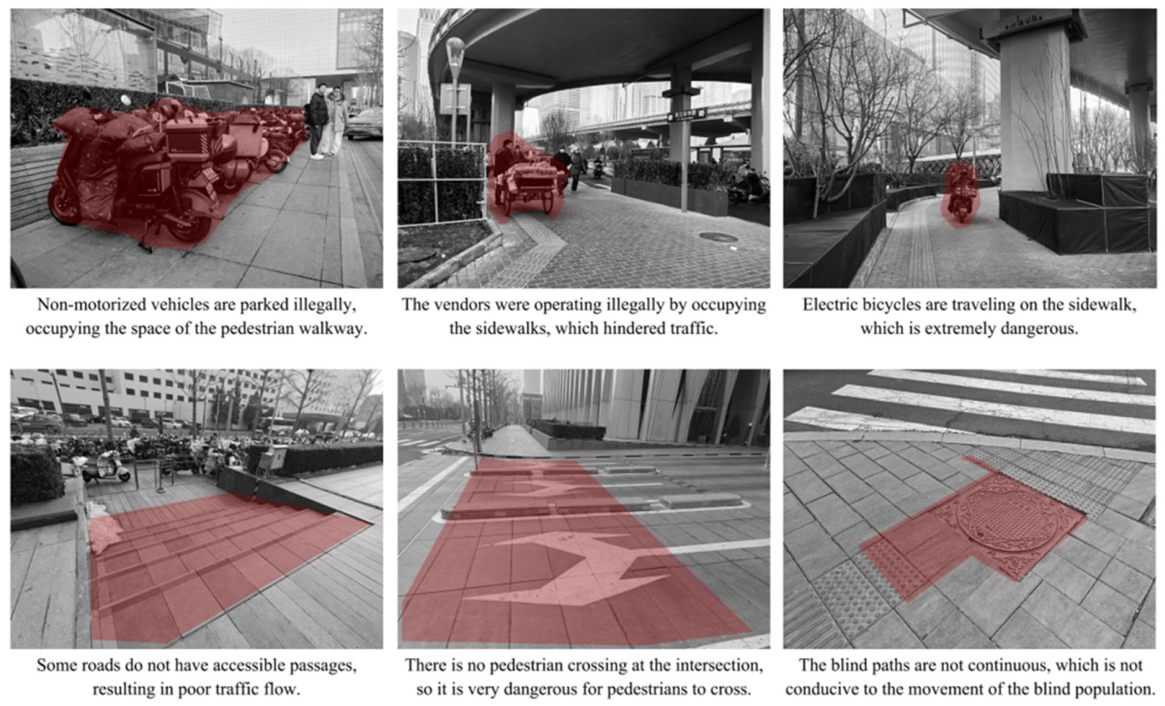
Traffic-interference observations identified the northwest corner of Guomao Bridge and the south side of Guomao Mall Phase 1 as high-pressure conflict points. At one point on East 3rd Ring Middle Road, eight non-motorized vehicles entered the pedestrian space within five minutes; at the Jianguomenwai Avenue observation point, five such intrusions were recorded within five minutes. In the objective indicator system, non-motorized vehicle intrusion received the lowest standardized score among all measured indicators (0.46), while motor-vehicle encroachment scored 0.67. Blind-path continuity also scored only 0.60, and field notes reported that non-motorized occupation often coincided with blind-path obstruction.
Questionnaire results supported these observations. Encroachment by vehicles, stalls, or other uses was rated unfavorably by 37.2% of respondents, and 32.4% rated the shared-bicycle or commercial spillover item unfavorably. Barrier-free facilities were another weakness: 33.8% of respondents reported that blind paths, ramps, elevators, or related facilities could not or only partially meet their needs. These findings show that spatial disorder is not a purely visual problem. It directly affects continuity resilience and inclusive access.
4.4. Transit Access and Last-Mile Route Performance
The transit-access indicators show a second mismatch. Guomao has strong regional accessibility, and the indicator table recorded a 300 m bus-stop catchment coverage of 92%. Two field route-timing tests, however, showed different last-mile experiences. The route from Guomao Station to Yintai Center took approximately 4 min, meeting the 5 min benchmark. Another route between Guomao Station and Zhonghai Plaza took approximately 8 min, exceeding the benchmark. The objective indicator for metro-to-core-POI walking time therefore scored 0.83 rather than 1.00.
Perception data again confirmed that access is not only a matter of distance. Nearly half of respondents (47.6%) reported that walking time exceeded expectations. This result may reflect route indirectness, vertical transfers, crowd avoidance, unclear signage, or waiting time at crossings. For TOD planning, the implication is clear: dense transit supply must be supported by legible, direct, and disturbance-resistant pedestrian routes between station exits and building entrances.
4.5. Vitality as Both Asset and Pressure
Guomao’s vitality indicators were strong. One observation point near Guomao Bridge recorded 48 pedestrians within five minutes, equivalent to 96 pedestrians in 10 min and exceeding the high-activity benchmark. POI-based interpretation indicated approximately eight street-facing shops per 100 m on core segments, covering business services, restaurants, retail/leisure, and daily-life services. The vitality dimension therefore contributed 0.199 out of a nominal 0.20 to the objective score.
Yet the same vitality also generates pressure. High pedestrian flows, commercial entrances, taxis, delivery vehicles, e-bikes, and street furniture compete for limited ground-level space. Guomao’s resilience challenge is therefore not to create activity from scratch, but to manage the interface between activity and movement. Active frontages must be supported by clear curb management, micromobility parking boundaries, unobstructed blind paths, and adequate waiting/standing space at entrances and crossings.
4.6. Synthesis: A Walkability–Resilience Mismatch
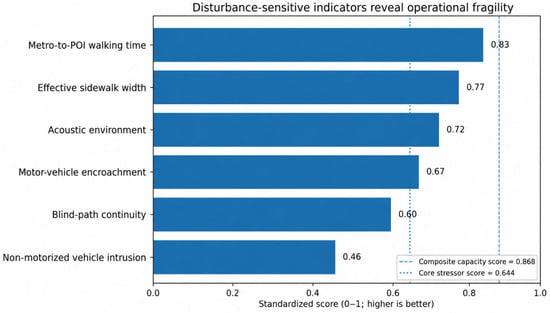
The results reveal a walkability–resilience mismatch. Guomao has high baseline walkability capacity, but its disturbance-sensitive performance is much weaker. The core disturbance-sensitive indicators—non-motorized vehicle intrusion, blind-path continuity, motor-vehicle encroachment, acoustic comfort, and effective sidewalk width—averaged 0.644, substantially below the composite capacity score of 0.868 (Figure 6). The implication is that a CBD can be highly walkable in terms of resources and still insufficiently resilient in terms of everyday operation.
Figure 6.
Disturbance-sensitive indicators compared with the overall capacity-oriented score.
This mismatch explains why the objective indicator score is higher than the user perception score. Users do not experience sidewalk width, transit coverage, and POI density as isolated resources; they experience them through actual movement under crowding, obstruction, noise, conflicts, and wayfinding uncertainty. Therefore, pedestrian resilience should be evaluated through the interaction between baseline provision and stressor exposure, not through static provision alone.
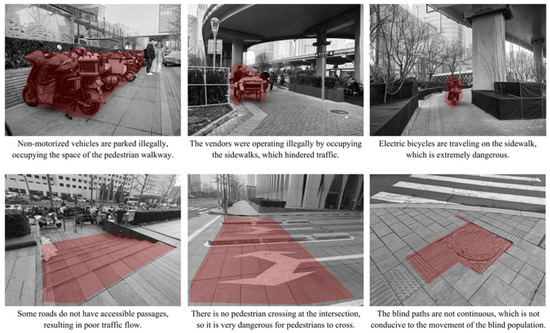
Figure 7 illustrates representative cases of sidewalk occupation, traffic conflict, and blind-path obstruction observed during the field survey.
Figure 7.
Representative field observations of pedestrian infrastructure disturbances in the CBD study area.
5. Discussion
5.1. From Designed Walkability to Operational Walkability
The Guomao case suggests that the central problem of mature CBD pedestrian environments is no longer simply whether walking facilities exist. Rather, the problem is whether the designed walkability of a district remains operationally usable when competing activities and peak flows place pressure on pedestrian space. This finding echoes broader walkability research that emphasizes the multidimensional nature of walking environments, while extending it toward resilience by focusing on routine stressors and failure modes. Recent perception-based studies further demonstrate that walkability quality intersects with place identity and cultural experience, meaning that operational improvements must also attend to the experiential character of streetscapes [46]. Large-scale assessments combining big data and deep learning confirm that objective provision and subjective experience frequently diverge, validating the multi-method approach adopted here [25,34].
Operational walkability requires that sidewalks, crossings, station exits, entrances, and public-space edges work together as an integrated pedestrian infrastructure [47]. A generous sidewalk segment does not compensate for a 0.50 m bottleneck, and a high-density POI environment does not guarantee a comfortable walking experience if ground-level space is congested or noisy. For this reason, CBD pedestrian assessment should include effective width, obstruction type, conflict frequency, and accessibility continuity as core variables rather than optional observations.
5.2. Spatial Disorder as an Everyday Resilience Stressor
Spatial disorder provides the mechanism through which walkability capacity is eroded. In Guomao, disorder appears as illegal e-bike parking, sidewalk encroachment, blind-path occupation, uneven surfaces, noisy traffic, and unclear route experiences. These are not rare disruptions; they are ordinary conditions that users encounter during daily movement. Spatial analysis of shared micromobility trips has documented that e-scooter and bicycle parking conflicts cluster heavily around transit nodes and commercial areas—precisely the zones that already face the highest pedestrian pressure [48]. Sidewalk level-of-service methodologies have also long identified obstacle density and effective-width restriction as primary determinants of pedestrian flow quality [49]. These conditions are therefore resilience stressors even if they are not disaster events.
The resilience interpretation changes the policy question. A conventional facility-based approach may ask whether a sidewalk exists, whether a crossing exists, or whether a transit stop is within a catchment radius. A resilience-oriented approach asks whether the sidewalk remains usable when e-bikes are parked, whether the blind path remains continuous when commercial frontage is active, whether the crossing remains safe at peak crowding, and whether users can still find efficient routes when surface and underground systems intersect.
5.3. Planning and Design Implications
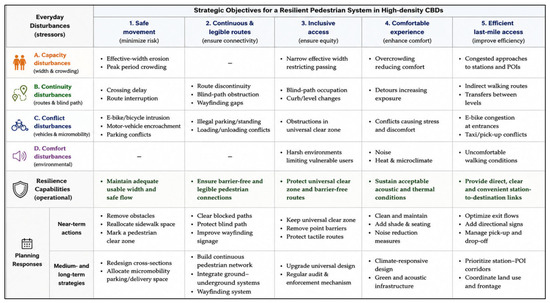
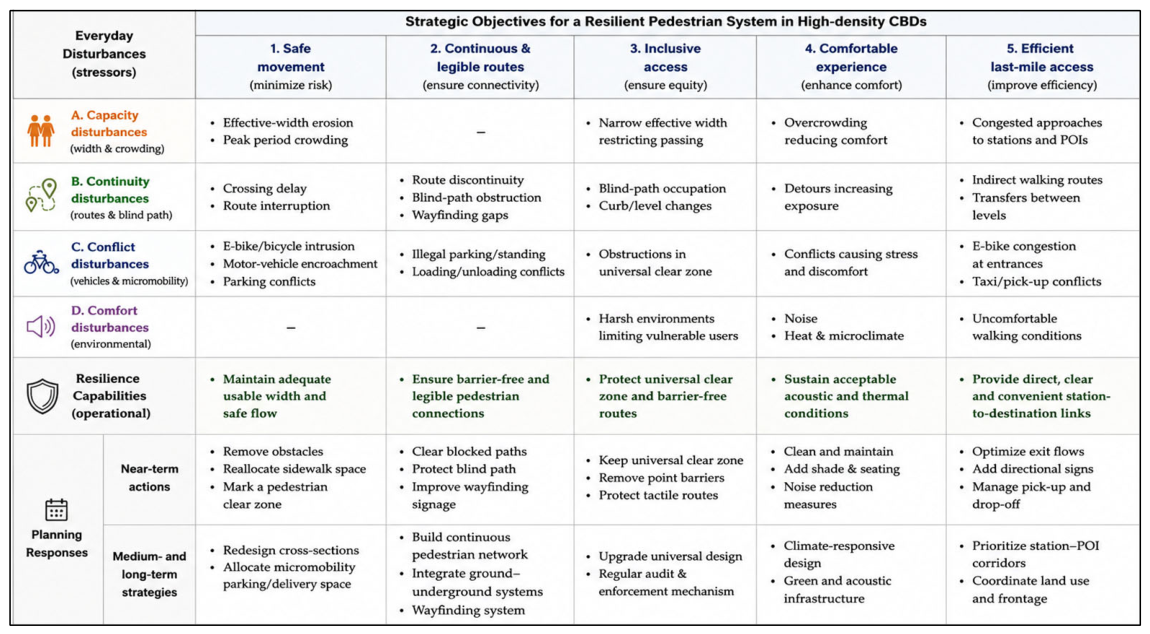
Three implications follow. First, spatial design should recover effective width before pursuing large-scale expansion. Removing unmanaged obstacles, relocating e-bike parking, adjusting poles and street furniture, and protecting blind paths can immediately increase operational capacity without changing the road right-of-way. Second, network integration should focus on the 300–600 m last-mile routes that connect metro exits, bus stops, office lobbies, commercial entrances, and public spaces. These routes should be treated as priority pedestrian corridors with clear signage, step-free continuity, weather protection where feasible, and fewer conflict points. Third, governance is as important as design. CBD pedestrian resilience requires coordination among street-management departments, traffic police, transit operators, building owners, commercial property managers, delivery platforms, and micromobility providers. The corresponding interventions are summarized in Table 6 and visually synthesized in Figure 8, which links the identified disturbances with resilience capabilities and near- and longer-term planning responses.
Table 6.
Planning and governance strategies for everyday pedestrian infrastructure resilience.
Figure 8.
Strategy matrix linking everyday disturbances, resilience capabilities, and planning interventions.
5.4. Implications for Sustainability and Inclusiveness
The sustainability value of pedestrian improvement lies not only in encouraging walking as a low-carbon mode, but also in supporting the efficiency of the public transport system. If metro and bus passengers experience poor last-mile routes, crowding, or conflicts after exiting stations, the attractiveness of transit-oriented travel is reduced. Conversely, recovering pedestrian capacity can increase the practical reach of transit without adding motorized capacity.
The inclusiveness value is equally important. Effective-width erosion and blind-path occupation affect all users but create disproportionate burdens for visually impaired pedestrians, wheelchair users, older adults, children, and people carrying luggage [44,50]. In international CBDs, pedestrian infrastructure must also serve business visitors, service workers, shoppers, residents, and commuters who differ in time pressure, familiarity, physical ability, and route knowledge. Everyday resilience therefore requires universal design as an operational standard rather than a symbolic facility provision.
5.5. Transferability to Other CBDs
Although this study focuses on Beijing Guomao, the analytical logic is transferable. Many high-density CBDs combine strong baseline walkability with complex operational stress. Comparative walkability indices applied across cities globally have consistently shown that high aggregate scores can mask localized performance failures [51]. The proposed distinction between baseline capacity and disturbance-sensitive performance can be applied to districts with elevated walkways, underground malls, station-area complexes, or mixed pedestrian–micromobility streets. The exact indicators should be calibrated to local context, but the core question remains the same: does the pedestrian system remain safe, continuous, inclusive, and comfortable when routine stressors occur?
5.6. Limitations and Future Research
Several limitations should be acknowledged. First, the field audit was conducted within a limited time window and does not capture seasonal variation, weather stress, night-time conditions, or repeated peak/off-peak differences. Second, the traffic-interference observations used short five-minute windows and should be repeated across weekdays, weekends, and commuting peaks before drawing stronger statistical conclusions. Third, the questionnaire sample mainly represents active adult users, and targeted samples of older adults, children, visually impaired pedestrians, wheelchair users, and service workers are needed. Fourth, some online POI and transit indicators require a clear scraping date, platform source, and classification protocol. Fifth, the legibility dimension could be strengthened by incorporating additional measured variables such as route directness, sign visibility, multilingual information, and station-to-building wayfinding continuity. Future research should combine GIS network analysis, repeated pedestrian counts, thermal and lighting measurements, computer-vision street audits, and before–after simulations of obstruction removal. With larger repeated segment-level datasets, regression, sensitivity, or contribution analysis could further estimate the comparative effects of individual stressors and the relative benefits of alternative mitigation scenarios.
6. Conclusions
This study developed a multi-source walkability assessment of Beijing Guomao and reframed it through the lens of everyday pedestrian infrastructure resilience. The results show that Guomao has strong baseline walkability capacity, with an objective score of 0.868 and high performance in transit coverage, facilities, commercial vitality, and pedestrian activity. However, user perception was more moderate at 3.17/5, and disturbance-sensitive indicators revealed important operational weaknesses.
A central empirical finding is the gap between physical provision and effective usability. Mean physical and effective sidewalk widths were 3.62 m and 2.36 m, respectively. The mean section-level width loss was 30.9%, while the maximum loss of 88.2% occurred at one severely obstructed section, where the effective width was 0.50 m. Non-motorized intrusion, vehicle encroachment, blind-path discontinuity, acoustic discomfort, and last-mile route delay further weakened the pedestrian experience. These issues demonstrate that walkability is a necessary baseline, but resilience depends on whether that baseline capacity remains usable under routine disturbances.
For high-density CBDs, pedestrian planning should therefore shift from static facility provision to operational resilience. Priority actions include recovering effective sidewalk width, governing e-bike and delivery conflicts, protecting barrier-free routes, improving station-to-POI wayfinding, integrating ground and underground pedestrian systems, and coordinating public–private management of sidewalk interfaces. This approach can support more sustainable, inclusive, and resilient CBD pedestrian environments.
Supplementary Materials
The following supporting information can be downloaded at: https://www.mdpi.com/article/10.3390/architecture6030135/s1, S1 JianWai Data, S2 Questionnaire, and S3 Current Indicator Sheet.
Author Contributions
Conceptualization, X.H. and B.Z.; methodology, X.H., B.Z. and Y.W.; investigation, Y.W., Z.X., Y.D., Z.Y. and D.H.; data curation, Y.W., Z.X., Y.D., Z.Y. and D.H.; formal analysis, X.H. and Y.W.; writing—original draft preparation, X.H. and Y.W.; writing—review and editing, X.H. and B.Z.; supervision, X.H. and B.Z.; project administration, X.H. All authors have read and agreed to the published version of the manuscript.
Funding
This research was supported by the Beijing Urban Governance Research Base Open Funding (2025CSZL13) and R&D Program of Beijing Municipal Education Commission (110052972508-06).
Institutional Review Board Statement
The study was conducted in accordance with the Declaration of Helsinki and approved by the Research Ethics Subcommittee of the School of Architecture and Art, North China University of Technology (protocol code 20250019 and 16 October 2025).
Informed Consent Statement
Informed consent was obtained from all questionnaire participants through the questionnaire preamble, which explained the research purpose, anonymous participation, and academic use of data.
Data Availability Statement
The anonymized data supporting the findings of this study are available from the corresponding authors upon reasonable request. Raw questionnaire exports containing platform-generated metadata are not publicly available for privacy reasons.
Acknowledgments
The authors thank all respondents who participated in the questionnaire survey and field investigation.
Conflicts of Interest
The authors declare no conflicts of interest.
References
- Gehl, J. Life Between Buildings: Using Public Space; Island Press: Washington, DC, USA, 2011. [Google Scholar]
- Jacobs, J. The Death and Life of Great American Cities; Random House: New York, NY, USA, 1961. [Google Scholar]
- Appleyard, D. Livable Streets; University of California Press: Berkeley, CA, USA, 1981. [Google Scholar]
- Carmona, M. Public Places, Urban Spaces: The Dimensions of Urban Design, 2nd ed.; Routledge: London, UK, 2010. [Google Scholar]
- Mehta, V. Lively streets: Determining environmental characteristics to support social behavior. J. Plan. Educ. Res. 2007, 27, 165–187. [Google Scholar]
- Southworth, M. Designing the walkable city. J. Urban Plan. Dev. 2005, 131, 246–257. [Google Scholar] [CrossRef] [Scilit]
- Cervero, R.; Kockelman, K. Travel demand and the 3Ds: Density, diversity, and design. Transp. Res. Part D Transp. Environ. 1997, 2, 199–219. [Google Scholar] [CrossRef] [Scilit]
- Forsyth, A. What is a walkable place? The walkability debate in urban design. Urban Des. Int. 2015, 20, 274–292. [Google Scholar] [CrossRef] [Scilit]
- Ewing, R.; Handy, S. Measuring the unmeasurable: Urban design qualities related to walkability. J. Urban Des. 2009, 14, 65–84. [Google Scholar] [CrossRef] [Scilit]
- Dovey, K.; Pafka, E. What is walkability? The urban DMA. Urban Stud. 2020, 57, 93–108. [Google Scholar] [CrossRef] [Scilit]
- Saelens, B.E.; Handy, S.L. Built environment correlates of walking: A review. Med. Sci. Sports Exerc. 2008, 40, S550–S566. [Google Scholar] [CrossRef] [Scilit] [PubMed]
- Ewing, R.; Cervero, R. Travel and the built environment: A meta-analysis. J. Am. Plan. Assoc. 2010, 76, 265–294. [Google Scholar] [CrossRef] [Scilit]
- Holling, C.S. Resilience and stability of ecological systems. Annu. Rev. Ecol. Syst. 1973, 4, 1–23. [Google Scholar] [CrossRef] [Scilit]
- Meerow, S.; Newell, J.P.; Stults, M. Defining urban resilience: A review. Landsc. Urban Plan. 2016, 147, 38–49. [Google Scholar] [CrossRef] [Scilit]
- Walker, B.; Holling, C.S.; Carpenter, S.R.; Kinzig, A. Resilience, adaptability and transformability in social–ecological systems. Ecol. Soc. 2004, 9, 5. [Google Scholar] [CrossRef] [Scilit]
- Vale, L.J.; Campanella, T.J. (Eds.) The Resilient City: How Modern Cities Recover from Disaster; Oxford University Press: New York, NY, USA, 2005. [Google Scholar]
- Davoudi, S. Resilience: A Bridging Concept or a Dead End? Plan. Theory Pract. 2012, 13, 299–307. [Google Scholar] [CrossRef] [Scilit]
- Mohabat Doost, D.; Brunetta, G. Just Territorial Resilience: Disentangling EU Policy Narratives between Geopolitical Stability and Spatial Justice. Eur. J. Spat. Dev. 2026, 23, 67–92. [Google Scholar] [CrossRef]
- Sharifi, A.; Yamagata, Y. On the suitability of assessment tools for guiding communities towards disaster resilience. Int. J. Disaster Risk Reduct. 2016, 18, 115–124. [Google Scholar] [CrossRef] [Scilit]
- Frank, L.D.; Sallis, J.F.; Conway, T.L.; Chapman, J.E.; Saelens, B.E.; Bachman, W. Many pathways from land use to health: Associations between neighborhood walkability and active transportation, body mass index, and air quality. J. Am. Plan. Assoc. 2006, 72, 75–87. [Google Scholar] [CrossRef] [Scilit]
- Cao, Z.; Ren, S. Measurement and application of walkability of urban street space: A case study of Shanghai. Urban Rural Plan. 2022, 1, 1–12. (In Chinese) [Google Scholar]
- Bi, Q.; Lin, X.; Huang, K.; Wang, W. Indicator evaluation of old community street space from the perspective of walkability: A case study of Machang Community in Fuzhou. Resid. Dist. 2024, 1, 71–79. (In Chinese) [Google Scholar]
- Li, M.; Yin, Y.; Lin, Z. Research on walkability evaluation of external space in commercial blocks: A case study of Beijing Road, Guangzhou. South Archit. 2024, 7, 36–47. (In Chinese) [Google Scholar]
- Qian, T. Evaluation of elderly walking friendliness of urban streets based on walking index and narrative preference method: A case study of Huangpu District, Shanghai. Urban Archit. 2025, 22, 34–40. (In Chinese) [Google Scholar]
- Huang, X.; Zeng, L.; Liang, H.; Li, D.; Yang, X.; Zhang, B. Comprehensive walkability assessment of urban pedestrian environments using big data and deep learning techniques. Sci. Rep. 2024, 14, 26993. [Google Scholar] [CrossRef] [Scilit] [PubMed]
- Huang, X.; Liang, H.; Zeng, L.; White, M. Evaluating urban walkability: A comprehensive review of tools and techniques. Archit. Sci. Rev. 2025, 68, 263–277. [Google Scholar] [CrossRef] [Scilit]
- National Association of City Transportation Officials; Global Designing Cities Initiative. Global Street Design Guide; Island Press: Washington, DC, USA, 2016. [Google Scholar]
- Institute for Transportation and Development Policy. Pedestrians First: Tools for a Walkable City; ITDP: New York, NY, USA, 2018. [Google Scholar]
- Gehl, J. Cities for People; Island Press: Washington, DC, USA, 2010. [Google Scholar]
- Speck, J. Walkable City: How Downtown Can Save America, One Step at a Time; North Point Press: New York, NY, USA, 2012. [Google Scholar]
- Adkins, A.; Makarewicz, C.; Scanze, M.; Ingram, M.; Luhr, G. Contextualizing walkability: Do relationships between built environments and walking vary by socioeconomic context? J. Am. Plan. Assoc. 2017, 83, 296–314. [Google Scholar] [CrossRef] [Scilit] [PubMed]
- Kim, S.; Park, S.; Lee, J.S. Meso- or micro-scale? Environmental factors influencing pedestrian satisfaction. Transp. Res. Part D Transp. Environ. 2014, 30, 10–20. [Google Scholar] [CrossRef] [Scilit]
- Moura, F.; Cambra, P.; Gonçalves, A.B. Measuring walkability for distinct pedestrian groups with a participatory assessment method: A case study in Lisbon. Landsc. Urban Plan. 2017, 157, 282–296. [Google Scholar] [CrossRef] [Scilit]
- De Vos, J.; Lättman, K.; van der Vlugt, A.-L.; Welsch, J.; Otsuka, N. Determinants and effects of perceived walkability: A literature review, conceptual model and research agenda. Transp. Rev. 2023, 43, 303–324. [Google Scholar] [CrossRef] [Scilit]
- Chen, J.; Long, Y. Identification, measurement, externality and intervention of urban public space disorder. Time Archit. 2021, 1, 44–50. (In Chinese) [Google Scholar]
- Gong, W.; Huang, X.; White, M.; Langenheim, N. Walkability perceptions and gender differences in urban fringe new towns: A case study of Shanghai. Land 2023, 12, 1339. [Google Scholar] [CrossRef] [Scilit]
- James, O.; Swiderski, J.I.; Hicks, J.; Teoman, D.; Buehler, R. Pedestrians and E-Scooters: An Initial Look at E-Scooter Parking and Perceptions by Riders and Non-Riders. Sustainability 2019, 11, 5591. [Google Scholar] [CrossRef] [Scilit]
- Laa, B.; Leth, U. Survey of e-scooter users in Vienna: Who are they and how do they ride? J. Transp. Geogr. 2020, 89, 102874. [Google Scholar] [CrossRef] [Scilit]
- Bozovic, T.; Parkin, J.; Chatterjee, K.; Flower, J. Pedestrian experiences of rental e-scooter use and parking. Transp. Plan. Technol. 2025, 48, 783–806. [Google Scholar] [CrossRef] [Scilit]
- Ozturk, Z.S.; Kang, J.; Aletta, F. Soundscape Research in Streets: A Scoping Review. Sustainability 2025, 17, 3329. [Google Scholar] [CrossRef] [Scilit]
- Calthorpe, P. The Next American Metropolis: Ecology, Community, and the American Dream; Princeton Architectural Press: New York, NY, USA, 1993. [Google Scholar]
- Ha, J.; Ki, D.; Lee, S.; Ko, J. Mode choice and the first-/last-mile burden: The moderating effect of street-level walkability. Transp. Res. Part D Transp. Environ. 2023, 116, 103646. [Google Scholar] [CrossRef] [Scilit]
- Xu, X.; Zhang, B.; Wang, Y.; Wang, R.; Li, D.; White, M.; Huang, X. Evaluating and Optimizing Walkability in 15-Min Post-Industrial Community Life Circles. Buildings 2025, 15, 3143. [Google Scholar] [CrossRef] [Scilit]
- Tokey, A.I.; Liu, L.; Miller, H.J. Measuring the impacts of sidewalks on public transit first mile/last mile accessibility and their association with social and demographic factors. Transp. Res. Interdiscip. Perspect. 2025, 33, 101576. [Google Scholar] [CrossRef] [Scilit]
- Chen, Y.; Huang, X.; White, M. A study on street walkability for older adults with different mobility abilities combining street view image recognition and deep learning-The case of Chengxianjie Community in Nanjing (China). Comput. Environ. Urban Syst. 2024, 112, 102151. [Google Scholar] [CrossRef] [Scilit]
- Gao, X.; Ueda, H.; Qu, M.; Li, G.; Li, X.; Xu, M. Reimagining tourism pedestrian street aesthetics through machine learning: Understanding the role of spatial form based on a case study in Luoyang, China. Front. Archit. Res. 2026, 15, 238–258. [Google Scholar] [CrossRef] [Scilit]
- Rhoads, D.; Rames, C.; Solé-Ribalta, A.; González, M.C.; Szell, M.; Borge-Holthoefer, J. Sidewalk networks: Review and outlook. Comput. Environ. Urban Syst. 2023, 106, 102031. [Google Scholar] [CrossRef] [Scilit]
- Hosseinzadeh, A.; Algomaiah, M.; Kluger, R.; Li, Z. Spatial analysis of shared e-scooter trips. J. Transp. Geogr. 2021, 92, 103016. [Google Scholar] [CrossRef] [Scilit]
- Nag, D.; Goswami, A.K.; Gupta, A.; Sen, J. Assessing urban sidewalk networks based on three constructs: A synthesis of pedestrian level of service literature. Transp. Rev. 2020, 40, 204–240. [Google Scholar] [CrossRef] [Scilit]
- Levine, K. “The bus is accessible, but how do you get to the bus”: First and last mile experiences of disabled transit riders. J. Public Transp. 2024, 26, 100086. [Google Scholar] [CrossRef] [Scilit]
- Krambeck, H.V. The Global Walkability Index. Master’s Thesis, Massachusetts Institute of Technology, Cambridge, MA, USA, 2006. [Google Scholar]

Disclaimer/Publisher’s Note: The statements, opinions and data contained in all publications are solely those of the individual author(s) and contributor(s) and not of MDPI and/or the editor(s). MDPI and/or the editor(s) disclaim responsibility for any injury to people or property resulting from any ideas, methods, instructions or products referred to in the content. |
© 2026 by the authors. Licensee MDPI, Basel, Switzerland. This article is an open access article distributed under the terms and conditions of the Creative Commons Attribution (CC BY) license.