1. Introduction
Walking is widely recognized as a fundamental component of vibrant, human-scale, and sustainable urban environments. Beyond its role as a mode of transportation, walking contributes to the social, spatial, and experiential quality of cities by supporting public life, social interactions, and active use of urban spaces. Pedestrian activity has long been associated with urban vitality, livability, and the quality of the public realm, particularly in dense urban environments where streets function not only as movement corridors but also as spaces of encounter and everyday urban experience [
1,
2,
3]. Streets characterized by active pedestrian presence are often linked to greater social interaction and urban attractiveness, and more vibrant public life.
Contemporary urban development patterns, however, have increasingly prioritized automobile-oriented infrastructure, often at the expense of pedestrian-oriented public spaces and human-scale urban environments. In response, growing attention has been paid to understanding how urban design and built environment characteristics influence pedestrian activity and the quality of urban experience. Previous studies have demonstrated that urban form characteristics such as density, land-use diversity, street connectivity, destination accessibility, and proximity to public transportation significantly influence walking and pedestrian movement patterns [
4,
5,
6,
7]. These macro-scale dimensions have been widely examined within walkability and urban planning research.
In addition to macro-scale urban form, recent studies increasingly emphasize the importance of micro-scale streetscape qualities that directly shape pedestrians’ spatial and sensory experiences. Features such as street trees, shading, sidewalk quality, façade conditions, street furniture, enclosure, lighting, cleanliness, and visual complexity influence pedestrians’ perceptions of comfort, safety, attractiveness, and spatial coherence [
8,
9,
10,
11,
12,
13]. Compared with macro-scale indicators, micro-scale streetscape characteristics provide a more immediate representation of the urban qualities experienced by pedestrians during everyday movement through city streets.
Most previous studies on walking and the built environment have focused primarily on individual-level walking behavior, often relying on self-reported travel patterns or physical activity measures [
14]. Although these studies have substantially advanced knowledge regarding walkability, they often lack spatial specificity regarding where pedestrian activity actually occurs. In contrast, population-level pedestrian activity measured through pedestrian counts offers a more direct representation of active urban spaces and street vitality at the street-segment scale. Pedestrian activity levels are closely associated with urban liveliness, social interaction, public-space use, and the overall quality of urban environments [
15].
These relationships are especially important in Latin American cities characterized by strong socioeconomic inequalities and spatial segregation. In Santiago, Chile, socioeconomic disparities are reflected in uneven distributions of urban greenery, pedestrian infrastructure, public-space quality, and perceptions of safety. Previous studies conducted in Santiago have identified sidewalk quality, greenery, traffic conditions, environmental maintenance, and perceived security as important components of pedestrian experience and walkability [
16,
17]. Evidence also suggests that socioeconomic conditions may influence the relationship between the built environment and walking, as wealthier neighborhoods often benefit from higher-quality public spaces and pedestrian-supportive urban environments [
18].
Considering the actual strong socioeconomic segregation in Santiago, focusing on neighborhoods with relatively similar socioeconomic conditions may help reduce the confounding influence of socioeconomic disparities when examining built environment–pedestrian activity relationships. Accordingly, this study focuses on middle-income neighborhoods to better limit the associations between micro-scale streetscape characteristics and pedestrian activity.
The main research question guiding this study is the following:
- -
Which street-level built environment characteristics are associated with population-level pedestrian activity in middle-income neighborhoods of Santiago, Chile?
Research Objectives
The primary objective of this study is to examine the relationship between street-level built environment characteristics and population-level pedestrian activity in middle-income neighborhoods of Santiago, Chile.
Specifically, the study aims to:
- -
Identify micro-scale streetscape characteristics associated with low, medium, and high levels of pedestrian activity at the street-segment scale.
- -
Examine the consistency of these associations across two seasonal observation periods (March–May and September–November 2025).
2. Literature Review
2.1. Street-Level Urban Design and Pedestrian Experience
Research on the relationships between urban environments and pedestrian activity has expanded considerably across urban design, planning, transportation, and environmental psychology. Ecological approaches to human behavior suggest that pedestrian activity is shaped not only by individual preferences, but also by the physical and spatial qualities of urban environments that influence comfort, accessibility, safety, and environmental attractiveness [
19].
At the macro-scale, numerous studies have identified significant associations between pedestrian activity and urban form characteristics such as density, land-use diversity, street connectivity, accessibility to destinations, and proximity to public transportation [
4,
5,
20]. Mixed-use environments and connected street networks generally support pedestrian movement by increasing accessibility and reducing travel distances between daily destinations [
7]. Access to commercial services, parks, transit facilities, and public amenities has similarly been associated with greater levels of walking and urban activity in different urban contexts [
21,
22].
Beyond macro-scale urban form, increasing attention has been directed toward micro-scale streetscape qualities that directly shape pedestrians’ everyday spatial experiences. Street-level characteristics such as sidewalk quality, street trees, greenery, façade conditions, shading, street furniture, enclosure, cleanliness, lighting, and visual complexity contribute to pedestrians’ perceptions of comfort, safety, coherence, and attractiveness [
8,
9,
10,
12,
13]. These micro-scale characteristics influence how urban environments are experienced at the human scale and may substantially contribute to the vibrancy and liveliness of public spaces.
Urban design theories have strongly emphasized the importance of pedestrian-oriented streets and active public spaces in creating vibrant urban environments. Jacobs [
2] highlighted the role of active streets, mixed uses, and natural surveillance in supporting urban vitality and social interaction. Similarly, Gehl [
1]) emphasized the importance of designing cities at the human scale, arguing that high-quality public spaces and pedestrian-friendly environments encourage social life and everyday urban activity. Montgomery [
3] further associated urban vitality with diversity, spatial quality, pedestrian accessibility, and active street life.
Spatial legibility and visual coherence also represent important dimensions of pedestrian-oriented urban environments. Ewing and Handy [
8] identified urban design qualities such as imageability, enclosure, transparency, complexity, and human scale as central components of walkable and attractive streetscapes. Legible urban environments characterized by recognizable landmarks, clear spatial organization and visually coherent streets may improve orientation, navigability, and pedestrian comfort while supporting increased pedestrian movement and street activity.
Population-level pedestrian activity indicators, including pedestrian counts and pedestrian density, have increasingly been used to examine urban vitality and street liveliness [
23,
24]. Active pedestrian environments are commonly associated with vibrant public life, stronger social interaction, and higher-quality urban spaces [
15]. Streets characterized by greater pedestrian presence are often perceived as safer, more attractive, and more socially engaging, whereas inactive urban environments may contribute to perceptions of neglect, insecurity, and declining public-space quality [
25,
26].
Within the Latin American context, studies examining street-level urban environments and pedestrian experience remain comparatively limited despite the region’s high levels of urban density and socioeconomic inequality. In Santiago, Chile, previous studies have identified greenery, sidewalk quality, mixed land use, and active street frontages as important contributors to positive walking experiences, while traffic intensity, environmental neglect, and unsafe pedestrian infrastructure negatively affect pedestrian perceptions and street use [
16,
17]. Other Chilean studies similarly emphasize the importance of pedestrian infrastructure quality, environmental aesthetics, accessibility, and urban greenery for supporting active and vibrant urban environments [
27].
Socioeconomic inequalities further influence the distribution and quality of pedestrian-oriented urban environments. Previous research has shown that higher-income neighborhoods generally possess better-quality public spaces, more greenery, and more pedestrian-supportive infrastructure, whereas lower-income areas often experience deficiencies in environmental quality and walkability-related infrastructure [
18,
28,
29]. In highly segregated cities such as Santiago, these spatial inequalities may substantially shape pedestrian experiences and patterns of urban activity.
2.2. Research Gap and Conceptual Positioning
Although numerous studies have examined the relationships between urban environments and walking behavior, several important limitations remain in the existing literature. First, most of the previous research has focused primarily on individual-level walking measures, including self-reported walking frequency, duration, or travel behavior. Comparatively, fewer studies have investigated population-level pedestrian activity using direct observations of pedestrian presence at the street-segment scale. Population-level indicators provide a more spatially precise understanding of where pedestrian activity occurs and how specific streetscape characteristics contribute to active and vibrant urban environments.
Second, a considerable proportion of existing research has concentrated on macro-scale urban form indicators, while comparatively less attention has been directed toward micro-scale streetscape qualities that directly shape everyday pedestrian experiences. Street-level environmental characteristics such as greenery, enclosure, visual coherence, environmental maintenance, façade quality, shading, and spatial legibility may substantially influence pedestrian activity and perceptions of urban quality; however, these dimensions remain relatively underexplored in many urban contexts.
Third, much of the empirical evidence regarding pedestrian activity and urban environments originates from North American, European, and East Asian cities. Comparatively limited research has examined these relationships within Latin American cities, despite their distinct urban characteristics, socioeconomic inequalities, and patterns of spatial segregation. Existing studies conducted in Santiago primarily focused on perceived walkability, older adults, or subjective environmental perceptions rather than broader population-level pedestrian activity patterns across street segments.
Finally, socioeconomic inequalities may strongly influence both pedestrian activity and the spatial quality of urban environments. However, relatively few studies have attempted to reduce the confounding effects of socioeconomic variation when examining relationships between streetscape characteristics and pedestrian activity. Focusing on middle-income neighborhoods offers an opportunity to better identify the associations between micro-scale urban design qualities and pedestrian activity while reducing the influence of extreme socioeconomic disparities.
Accordingly, this study investigates the relationships between population-level pedestrian activity and street-level built environment characteristics in middle-income neighborhoods of Santiago, Chile. The study contributes to the literature by focusing on pedestrian activity at the street-segment scale, emphasizing micro-scale streetscape qualities and urban design characteristics, and providing evidence from a socioeconomically segregated Latin American city.
3. Methodology
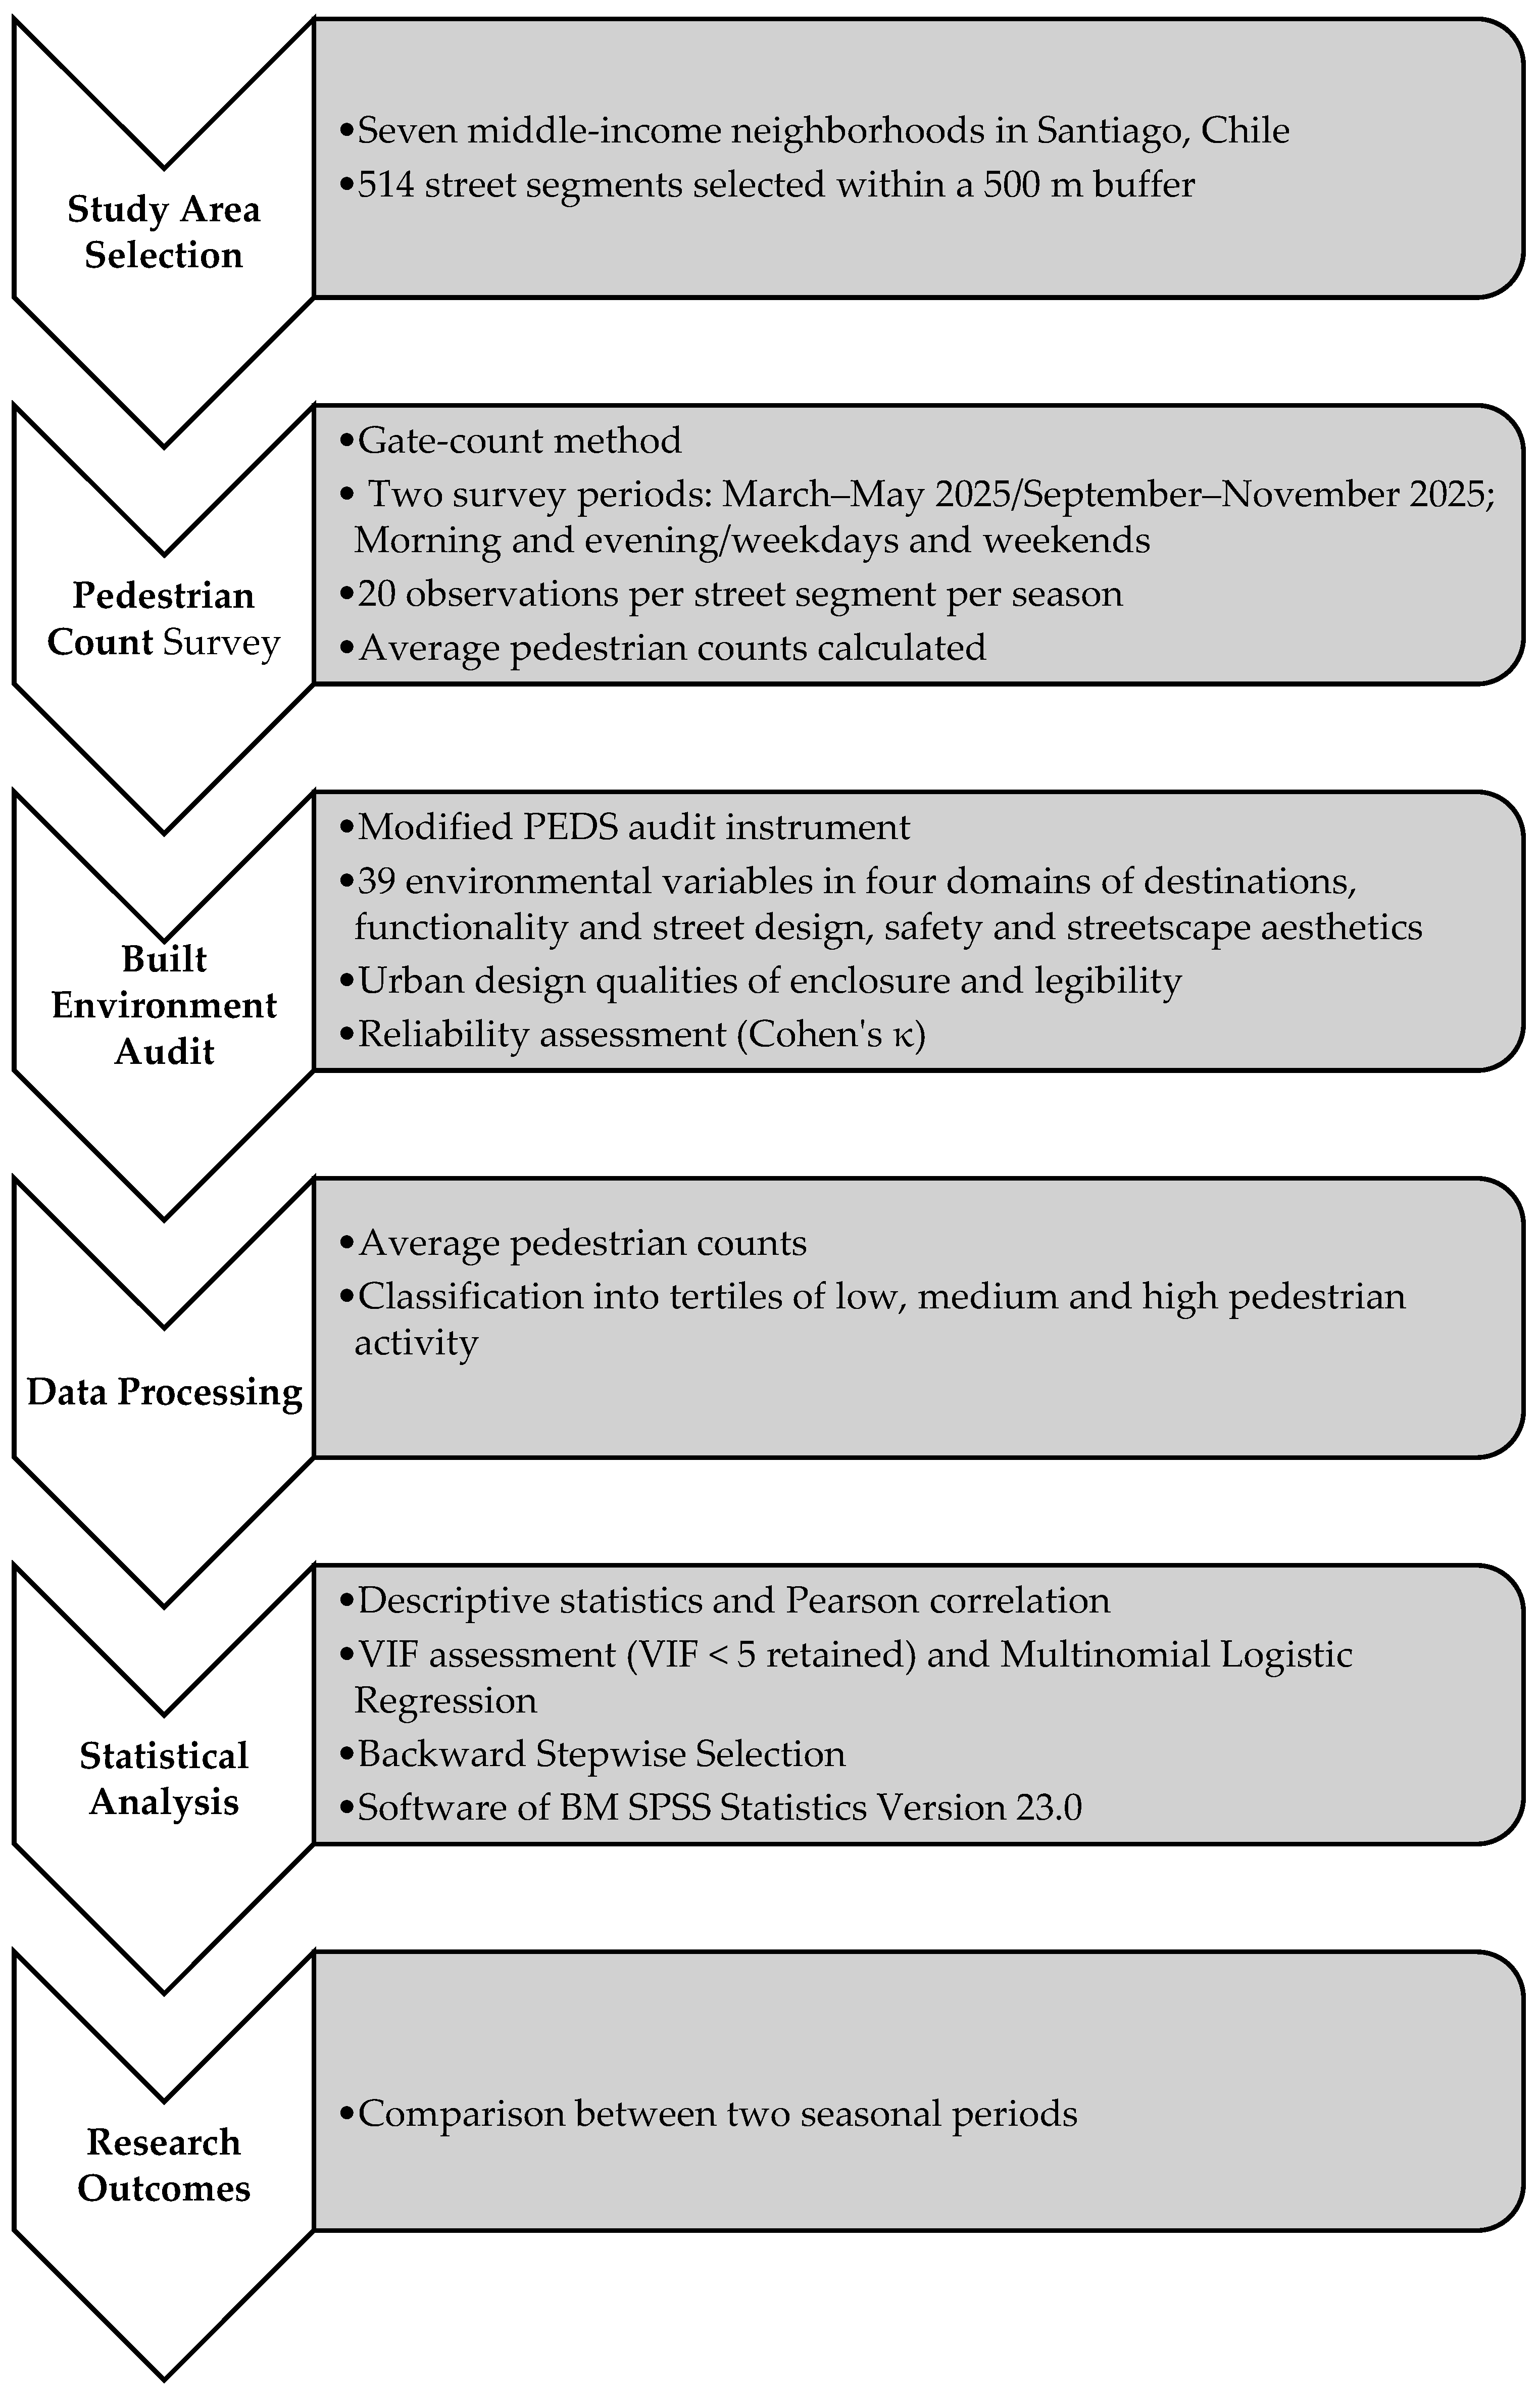
The research framework is presented in
Figure 1; it summarizes the sequential stages of the study, including study area selection, pedestrian count surveys, built environment audits, data processing, and statistical analyses.
3.1. Study Area
Santiago, the capital and largest metropolitan area of Chile, is home to approximately seven million inhabitants, representing nearly 40% of the country’s total population. Although Chile is considered one of the most economically developed countries in Latin America, Santiago exhibits high levels of socioeconomic inequality and spatial segregation, which are reflected in the distribution and quality of urban infrastructure, public spaces, and pedestrian environments.
To reduce the confounding influence of socioeconomic disparities on walking behavior, this study focused on neighborhoods with relatively similar middle-income characteristics. Seven middle-income neighborhoods were selected across Santiago: Barrio Universitario, Barrio Yungay, Barrio Ejército, Barrio Santa Isabel, Barrio Brasil, Barrio San Borja and Barrio Portales. Most selected neighborhoods are located within or adjacent to Santiago’s historic central area, characterized by mixed land use, relatively high pedestrian activity, and traditional grid street patterns.
The historic center of Santiago was originally established during the colonial period following the Spanish grid planning system, resulting in relatively compact urban blocks and interconnected street networks. Sidewalk widths in the selected neighborhoods generally range between 2.5 and 4 m, although some segments contain wider pedestrian areas and public spaces.
3.2. Street Segment Selection
Street segments within a 500 m radius of the geometric center of each selected neighborhood were included in the study. The 500 m buffer distance has frequently been used in walkability and pedestrian environment research as an acceptable walking distance for neighborhood-scale analysis (e.g., an approximately 5–10 min walk) [
30,
31].
Each street segment was defined as the section of roadway between two consecutive intersections. Both sides of each street segment were audited independently. In total, 514 street segments were examined.
3.3. Pedestrian Count Survey
Population-level walking behavior was measured using pedestrian counts collected through the gate-count method, a commonly used observational technique in studies of pedestrian activity and urban vitality [
1,
32]. In this method, an observer stands at a fixed location within a street segment and counts the number of pedestrians crossing an imaginary line perpendicular to the walking direction.
Pedestrian counts were conducted during two separate seasonal periods to evaluate the consistency of walking patterns and the stability of built environment associations across different climatic conditions. The first observation period was conducted from March to May 2025, while the second took place from September to November 2025. Conducting observations during two distinct periods allowed for a more reliable assessment of pedestrian activity and provided a stronger basis for policy-oriented interpretation of the findings.
3.4. Classification of Population-Level Walking Activity
For each observation, the researcher stood at the midpoint of the street segment and counted pedestrians moving in both directions using digital hand counters. Observations were conducted during both weekdays and weekends, covering the morning and evening periods on randomly selected days. Each street segment was observed 20 times during each seasonal period (40 observations in total across the two survey periods), with each observation lasting for two minutes. Thus, each street segment was observed for a total of 80 min over the study period. The average pedestrian count for each street segment was calculated separately in each of two seasonal periods, and was used in the subsequent analysis.
To facilitate interpretation of the pedestrian activity patterns and improve the applicability of the findings for urban planning and policy-making, street segments were classified into three levels of walking activity: low, medium, and high pedestrian activity. Another reason for using this classification was that preliminary analysis of pedestrian counts showed non-normal and over-dispersed distributions.
The average pedestrian count for each street segment was categorized into tertiles of low, medium, and high pedestrian activity. Tertile cut-off points were determined from the distribution of average pedestrian counts across all street segments, resulting in three groups of approximately equal size. The low pedestrian activity category was used as the reference category in the multinomial logistic regression analyses.
The classification was based on the average pedestrian counts observed on each street segment during the survey periods. Similar categorization approaches have been adopted in urban vitality and pedestrian environment studies to simplify the interpretation of pedestrian intensity and to identify spatial variations in urban activity levels [
1,
8].
The use of activity-level classifications is particularly useful in streetscape and urban design studies because it allows for a clearer comparison between different environmental conditions and facilitates the identification of built environment characteristics associated with varying levels of pedestrian activity.
3.5. Built Environment Audit
The built environment characteristics of each street segment were assessed using a modified version of the Pedestrian Environment Data Scan (PEDS) audit instrument developed by Clifton et al. [
33]. Several widely used environmental audit tools were initially reviewed, including the Irvine–Minnesota Inventory (IMI), SPACES, WSAF, and the Analytic Audit Tool. PEDS was selected because of its suitability for evaluating micro-scale pedestrian environments and its reliability in previous studies.
To better reflect the Santiago context, several additional variables were incorporated from the SPACES instrument and previous streetscape studies. This included building height, maintenance of green spaces, and natural surveillance from adjacent buildings. Furthermore, an additional variable representing visible signs of insecurity was added due to increasing concerns regarding urban safety in Santiago. This variable included both physical and social signs of disorder observed during field audits. In addition, the field audit also included the urban design qualities of enclosure and legibility, along with their associated features.
The final audit instrument included 39 environmental variables across four domains: destinations, functionality and street design, safety, and streetscape aesthetics. In addition, two urban design qualities were used: legibility and enclosure (
Table 1). Field audits followed pedestrian counts and were conducted during two data collection periods in 2025: the first from March to May, and the second from September to November.
To assess reliability, a subsample of street segments was independently re-audited by three field researchers. Inter-rater reliability analysis indicated moderate to high agreement for most variables (Cohen’s kappa > 0.40). Variables with low reliability were excluded from the final analysis.
Table 1 presents descriptive statistics for all audited variables across both measurement waves (Time 1 and Time 2). These two points correspond to the first and second audit periods in the field described above. Accordingly, the column headings “Mean (Time 1, All Zones) [SD]” and “Mean (Time 2, All Zones) [SD]” refer to the same street segments assessed at two different time periods in 2025.
It is important to note that
Table 1 includes the full set of variables measured through the audit instrument, whereas the regression analyses only have a subset of these variables included. Initially, all audited variables were considered as candidate predictors for the regression analyses. Prior to model estimation, multicollinearity diagnostics were conducted using variance inflation factor (VIF) statistics. Variables exhibiting high multicollinearity (VIF > 5) were excluded from the regression models to improve model stability and reduce redundancy among predictors. Therefore, the regression results do not necessarily include all variables reported in
Table 1.
3.6. Statistical Analysis
SPSS version 23.0 was used to analyze the data. Since pedestrian activity was classified into three categorical levels (low, medium, and high walking activity), multinomial logistic regression was selected as the primary analytical method.
Although the dependent variable categories possess an ordinal structure, multinomial logistic regression was preferred because it does not require the proportional odds assumption associated with ordinal logistic regression and provides greater flexibility in examining the relationships between built environment characteristics and different levels of pedestrian activity.
Separate regression models were estimated for the two seasonal observation periods (March–May and September–November) to compare the consistency of built environment associations across different climatic conditions and pedestrian activity patterns.
Prior to model estimation, descriptive statistics and Pearson correlation analyses were conducted for all variables. Multicollinearity among independent variables was examined using correlation matrices and variance inflation factor (VIF) statistics. Variables with VIF values greater than 5 were considered to exhibit high multicollinearity and were excluded from the regression analyses. Following this screening procedure, the remaining independent variables were entered simultaneously into each multinomial logistic regression model.
A backward stepwise procedure was subsequently applied to identify the significant environmental predictors associated with pedestrian activity levels in each seasonal model. The final models were evaluated using likelihood ratio tests, model fitting statistics, and pseudo-R2 indicators. The regression analyses included all 514 audited street segments, with complete data available for the variables retained in the final models.
5. Discussion
This study examined the relationships between population-level walking behavior and street-level built environment characteristics in middle-income neighborhoods of Santiago, Chile, using pedestrian activity observations collected during two separate observation periods. The findings indicate that several micro-scale streetscape characteristics were associated with pedestrian activity levels across both datasets, although some variables differed between the two observation periods. Overall, the results are consistent with previous studies that found street-level environmental qualities to play an important role in shaping walking behavior and urban vitality.
A key contribution of the study is its focus on population-level pedestrian activity measured directly at the street-segment scale through repeated pedestrian observations. Compared with self-reported walking measures frequently used in previous studies, direct pedestrian counts provide a more spatially specific representation of pedestrian activity and allow a more detailed examination of environmental characteristics associated with active urban spaces [
9,
15]. In the context of architecture and urban design, the findings contribute to ongoing discussions regarding how micro-scale urban form, streetscape design, and environmental legibility may influence everyday pedestrian experiences and the social use of public space.
5.1. Discussion of the First Observation Period
The results of the first observation period indicate that greenery-related variables, particularly the number of trees and maintenance of green areas, were associated with both medium and high pedestrian activity levels. Among the examined variables, the number of trees demonstrated one of the strongest positive associations with pedestrian activity. This finding is consistent with previous studies emphasizing the importance of urban greenery and street trees for pedestrian comfort, environmental attractiveness, and walking behavior [
9,
12,
34].
Street trees may contribute to walkability through multiple mechanisms. In addition to improving visual quality, trees can provide shading, moderate thermal discomfort, and create more comfortable and attractive pedestrian environments. In climates such as Santiago’s Mediterranean environment, these qualities may become particularly relevant due to seasonal heat conditions and high levels of solar exposure. Previous studies conducted in Santiago similarly identified greenery and streetscape vegetation as important contributors to positive walking experiences [
17].
Maintenance of green areas also demonstrated positive associations with pedestrian activity levels. Well-maintained environments may contribute to perceptions of comfort, care, and environmental quality while also improving the overall attractiveness of public spaces. This finding is in line with previous studies finding that maintenance and environmental aesthetics can influence public-space use and walking behavior [
35,
36].
The visibility of landmarks and street names was similarly associated with higher pedestrian activity levels. These findings may reflect the importance of environmental legibility and wayfinding within pedestrian environments. Urban design theories have long emphasized that recognizable urban elements can improve spatial orientation, navigability, and pedestrians’ sense of confidence within urban environments [
2,
8]. Streets that are easier to interpret visually may therefore support more active pedestrian movement.
Sidewalk width and curb cuts (sidewalk curb ramps) were also positively associated with pedestrian activity. Wider pedestrian environments may improve pedestrian comfort and circulation while reducing conflicts with motorized traffic. Previous studies have consistently identified pedestrian infrastructure quality as an important determinant of walking behavior [
9,
37]. Curb cuts may additionally improve accessibility and crossing convenience for different user groups.
General cleaning demonstrated positive associations with higher pedestrian activity as well. Cleaner and better-maintained public spaces may contribute to greater environmental attractiveness and reduced perceptions of neglect or insecurity. Similar relationships between environmental aesthetics and walking behavior have been identified in previous studies [
10,
38].
Overall, the findings from the first observation period show that environmental attractiveness, greenery, pedestrian infrastructure quality, and streetscape legibility may contribute to supporting pedestrian activity in middle-income neighborhoods of Santiago.
5.2. Discussion of the Second Observation Period
The second observation period similarly identified several built environment characteristics associated with pedestrian activity levels, although some additional variables emerged compared with the first dataset.
Consistent with the first observation period, the number of trees again demonstrated positive associations with both medium and high pedestrian activity levels. The consistency of this relationship across both observation periods reinforces the potential importance of urban greenery within walkable urban environments. The repeated significance of street trees demonstrates that greenery may represent one of the more stable micro-scale environmental characteristics associated with pedestrian activity in Santiago.
Sidewalk width also remained positively associated with pedestrian activity levels across both datasets. Wider pedestrian spaces may facilitate pedestrian movement, improve comfort, and create more inviting public environments. This finding is broadly consistent with previous studies emphasizing the importance of pedestrian-oriented infrastructure and adequate sidewalk dimensions for walking behavior [
39,
40,
41].
Landmark visibility and visibility of street names again demonstrated positive associations with pedestrian activity. The consistency of these findings across both observation periods suggests that urban legibility and navigational clarity may contribute to pedestrian movement patterns and perceptions of accessibility within urban environments [
42,
43,
44].
Segment monitoring also emerged as a positive predictor of pedestrian activity levels during the second observation period. This finding may reflect the importance of perceived surveillance and social visibility within public spaces. Streets characterized by greater natural surveillance may contribute to stronger perceptions of safety and social presence, which are frequently identified as important dimensions of walkable environments [
2,
45].
Additional variables identified during the second observation period included building height and enclosure. These findings may reflect the influence of spatial definition and urban form on pedestrian experiences. Previous studies in the urban design literature show that visually coherent and moderately enclosed street environments may support pedestrian engagement and urban vitality by creating stronger spatial definition and a sense of enclosure [
46,
47].
Bench availability was also positively associated with higher pedestrian activity levels. Public seating may encourage longer stays, social interaction, and more intensive public-space use, particularly among older adults and vulnerable populations. Previous studies have similarly highlighted the role of street furniture and resting opportunities in improving pedestrian comfort and walkability [
48,
49].
Conversely, on-street parking demonstrated a negative association with high pedestrian activity. This finding may indicate that environments dominated by vehicle-oriented infrastructure can reduce pedestrian comfort and walkability by affecting sidewalk continuity, visual quality, and perceptions of safety. Similar relationships have been identified in studies examining the impacts of automobile-oriented urban environments on walking behavior and active transportation [
4,
5].
However, this relationship should be interpreted with caution. Given the cross-sectional nature of the study, the direction of causality cannot be established. It is also plausible that the relationship is bidirectional: streets with higher pedestrian activity may discourage on-street parking due to higher pedestrian volumes, greater land-use intensity, or informal regulation of space.
Future research using longitudinal or quasi-experimental designs would be valuable to disentangle these potential mechanisms and better understand the causal direction between on-street parking provision and pedestrian activity.
5.3. Comparative Interpretation Across the Two Observation Periods
Comparing the findings across the two observation periods reveals several environmental characteristics that demonstrate relatively consistent associations with pedestrian activity levels. The use of repeated observations across two separate data collection periods increases the robustness of the findings and reduces the likelihood that the observed relationships were entirely influenced by temporary fluctuations in pedestrian activity.
In particular, the number of trees, sidewalk width, landmark visibility, and street-name visibility were positively associated with pedestrian activity across both observation periods. The consistency of these findings means that these environmental characteristics may represent comparatively reliable predictors of population-level walking behavior in middle-income neighborhoods of Santiago.
Among these variables, street trees and greenery appear especially important. Their repeated significance across both datasets reinforces previous international and Chilean evidence emphasizing the contribution of urban greenery to pedestrian comfort, environmental quality, and active mobility [
12,
34].
Similarly, sidewalk width and pedestrian infrastructure quality consistently supported higher pedestrian activity levels. This finding aligns with the broader walkability literature emphasizing the importance of pedestrian-oriented infrastructure in encouraging active transportation and supporting vibrant public spaces [
5,
9].
The repeated significance of landmark visibility and street-name visibility also highlights the potential importance of urban legibility and navigability within pedestrian environments [
44]. Streets that are visually understandable and easier to navigate may support both utilitarian and recreational walking while contributing to perceptions of accessibility and environmental comfort.
Taken together, the findings indicate that micro-scale streetscape characteristics may play an important role in shaping population-level walking behavior in Santiago. From the architectural and urban design perspective, the results underscore the relevance of environmental quality, spatial legibility, greenery, and pedestrian-oriented public-space design in supporting active urban life.
Overall, these results highlight the importance of micro-scale urban design in shaping walking behavior at the population level. It emphasizes the role of environmental quality, spatial legibility, greenery, and pedestrian-oriented public-space design in fostering more active and vibrant streets.
6. Conclusions
This study examined the relationships between street-level built environment characteristics and population-level walking behavior in middle-income neighborhoods of Santiago, Chile. Using multinomial logistic regression analyses based on repeated pedestrian observations collected during two separate observation periods, the study identified several micro-scale environmental characteristics associated with pedestrian activity levels.
The findings suggest that environmental characteristics related to greenery, pedestrian infrastructure, urban legibility, and streetscape quality were positively associated with pedestrian activity. In particular, the number of trees, sidewalk width, landmark visibility, and visibility of street names demonstrated relatively consistent positive associations across both observation periods, suggesting that these characteristics may represent potentially important components of walkable urban environments.
This study offers several contributions to the existing literature. First, it focuses on population-level pedestrian activity measured through direct observational pedestrian counts at the street-segment scale, complementing the large body of research that relies primarily on self-reported walking behavior. Second, it emphasizes micro-scale streetscape characteristics that directly shape pedestrian experiences within public space. Third, it provides empirical evidence from Santiago, Chile, a context where studies examining street-level environmental influences on pedestrian activity remain comparatively limited. Finally, by focusing on middle-income neighborhoods, the study helps to reduce the confounding effects associated with extreme socioeconomic disparities in highly segregated urban contexts.
From an architectural and urban design perspective, the findings highlight the potential relevance of relatively localized design interventions for supporting more walkable and active urban environments. Improvements related to urban greenery, pedestrian infrastructure, streetscape legibility, and environmental maintenance may contribute positively to pedestrian activity and the experiential quality of public space.
Several limitations should nevertheless be acknowledged. First, the study was based on cross-sectional observational data, limiting causal interpretation between built environment characteristics and pedestrian activity. Second, although pedestrian observations were repeated during two separate periods, pedestrian activity was not monitored continuously throughout the year. Third, the study focused exclusively on middle-income neighborhoods in Santiago, which may limit the generalizability of the findings to other socioeconomic or urban contexts. Future research should examine whether the identified relationships between micro-scale built environment characteristics and pedestrian activity hold in low- and high-income neighborhoods in Santiago, where markedly different urban forms, infrastructure quality, and safety conditions may influence walking behavior.
Fourth, although a broad range of micro-scale environmental characteristics was examined, additional factors such as traffic intensity, land-use diversity, weather conditions, crime perception, and broader socioeconomic dynamics may also influence pedestrian activity patterns. In particular, weather conditions (e.g., temperature and rainfall) were not systematically collected or controlled for during the two observation periods, which may have influenced pedestrian activity levels.
Future research could expand the temporal scope of pedestrian observations, incorporate longitudinal or continuous pedestrian monitoring approaches, examine multiple socioeconomic contexts, and combine objective environmental audits with pedestrians’ subjective perceptions and behavioral motivations. Additional studies using larger datasets and advanced spatial or multilevel analytical approaches could further strengthen understanding of how micro-scale built environment characteristics shape pedestrian activity and public-space use in Latin American cities.