


Abstract
Understanding how communities perceive and respond to plastic pollution is essential, as microplastics (MPs) represent a global environmental challenge with potential implications for ecosystems, human health, and food security; however, knowledge regarding local perceptions in watersheds characterized by intensive plastic use and poor waste management remains limited. The objective of this study was to assess knowledge, attitudes, and perceptions (KAP) among household heads in the Tecolutla River Basin, Mexico. A structured questionnaire was administered to 398 households spread across seven municipalities. The instrument included sociodemographic variables and items rated on a five-point Likert scale. Knowledge and attitude scores were higher than perception scores. Participants expressed stronger agreement that microplastic pollution is a serious global problem, while agreement regarding its toxicity and potential effects on human health was lower. They also reported willingness to learn more about microplastics and participate in community activities. This survey assessed household responses; it did not measure environmental microplastics or identify their sources in the watershed. These findings identify topics for environmental education and community engagement in the surveyed municipalities, particularly the potential health effects of microplastics and opportunities for voluntary participation.
1. Introduction
Global plastic production has experienced continuous growth over the past few decades, driven primarily by demand from sectors such as packaging, construction, and the automotive industry, among others. In 2025, global production reached approximately 420 million metric tons, with a projection of sustained growth through 2030 and an estimated market value of 651 billion U.S. dollars [1,2]. Asia-Pacific remains the leading region in plastics manufacturing, with China accounting for nearly 33% of global production, followed by the United States at 18% and Europe at 15%, while Latin America accounts for about 4% [3,4]. This increase in production and consumption generates higher volumes of plastic waste that can enter the environment because of improper management, low recycling rates, and deficiencies in final disposal processes.
In Mexico, the plastics industry is a strategic sector, with an annual production of approximately seven million metric tons, more than one million jobs, and nearly 5000 businesses that primarily serve the packaging, household consumption, manufacturing, and construction sectors [5,6]. However, the country faces significant challenges in waste management, as up to 90% of single-use plastics are not recycled and may end up accumulating in landfills, water bodies, and terrestrial ecosystems [7,8]. The persistence and degradation of this waste contribute to the generation of microplastics (MPs), generally defined as plastic particles smaller than 5 mm. These particles can be primary—when they are originally manufactured in small sizes, such as industrial pellets and cosmetic microspheres—or secondary—when they result from the fragmentation of larger plastic products [9,10].
MPs enter water systems through multiple pathways, including urban and industrial discharges, surface runoff, transport caused by intense hydrometeorological events, and the release of waste from productive activities [11,12]. Due to their persistence, small size, and transport capacity, these particles have been detected in rivers, lakes, oceans, agricultural soils, and aquatic organisms, as well as in food and water intended for human consumption. For these reasons, microplastics (MPs) are considered emerging pollutants of global concern [13,14,15,16].
Internationally, numerous studies have documented the sources, transport pathways, distribution, and potential ecological effects of microplastics. However, the social dimension of this issue has received comparatively less attention. Although a portion of the population recognizes MP as an environmental problem, there remain limitations in understanding their potential effects on human health, their generation pathways, and individual and collective responsibility for their mitigation [17]. Furthermore, factors such as educational level, income, gender, access to information, and sociocultural context can influence the public’s knowledge and their consumption and waste management practices [18,19].
A significant proportion of studies on social perceptions of microplastics have been conducted in urban settings in high-income countries with favorable conditions regarding access to education and environmental services, such as the United Kingdom and Germany [18,20]. In North America, social studies on microplastic pollution remain limited and have focused primarily on public knowledge, perceptions, and support for plastic reduction measures, without systematically integrating the productive and territorial conditions of the communities studied [21,22]. In Asia, much of the research on microplastics has focused on their presence, distribution, sources, and environmental effects [23]. In contrast, studies focused on the knowledge, attitudes, and practices of the population remain less common and, in general, do not comprehensively incorporate the territorial conditions, productive dynamics, and environmental infrastructure constraints of the communities studied [24].
In addition to this socio-environmental gap, there is limited application of KAP—Knowledge, Attitudes, and Perceptions—approaches to the specific study of microplastic pollution. These approaches have been used to analyze the public’s knowledge and response to various environmental issues, such as urban solid waste management [25,26,27], air quality [28,29], and pesticide use in agricultural contexts [30]. However, their application to microplastic pollution remains limited, especially in communities located within watersheds.
The scarcity of KAP studies focused specifically on microplastics, coupled with the limited integration of social and territorial approaches in watersheds, represents a significant gap in areas characterized by diverse productive activities and insufficient environmental infrastructure. Watersheds function as territorial units where human settlements, economic activities, drainage systems, and hydrological processes interact, potentially facilitating the transport of waste and pollutants from upstream areas to rivers and coastal zones. Nevertheless, studies on social perceptions of microplastics in these systems remain scarce, particularly in Mexico.
The Tecolutla River watershed is a relevant case for studying these conditions. It has a population of 1,241,419 inhabitants, distributed across 74 municipalities and 2262 localities in the states of Puebla, Veracruz, Tlaxcala, and Hidalgo [31]. Economic activities such as fishing, construction, agriculture, tourism, and the textile industry take place in this region, all of which involve the use of various plastic materials and products [32]. For example, textile washing may release synthetic microfibers into wastewater [33]; agricultural plastic mulch may fragment through use and weathering [34]; and worn fishing ropes may generate plastic fragments through abrasion [35]. Plastic waste associated with construction and tourism may also enter the environment if it is inadequately managed. Runoff and heavy rainfall could transport such materials through the watershed. These are potential pathways based on the activities present in the region, not sources identified or quantified by this survey.
This study examines household knowledge, attitudes, and perceptions of microplastic pollution in seven municipalities of the Tecolutla River Basin, providing a territorial context for describing differences among respondents. It was hypothesized that participants’ knowledge and attitudes may be related to their perception of microplastic pollution, and that these dimensions may vary according to their sociodemographic characteristics and municipality of residence.
Therefore, this study aimed to assess knowledge, attitudes, and perceptions of microplastic pollution among household heads in seven municipalities of the Tecolutla River Basin, Mexico; examine associations among these dimensions; and explore differences by sociodemographic characteristics, municipality, and upper, middle, and lower watershed area.
2. Materials and Methods
2.1. Study Area
The Tecolutla River basin is located in central-eastern Mexico and encompasses territories in the states of Tlaxcala, Hidalgo, Puebla, and Veracruz. Various economic activities associated with the use of polymeric materials take place in this basin, including agriculture, fishing, construction, the textile industry, and tourism. Furthermore, there are limitations in the infrastructure for solid waste management and wastewater treatment, conditions that may increase environmental vulnerability to microplastic pollution.
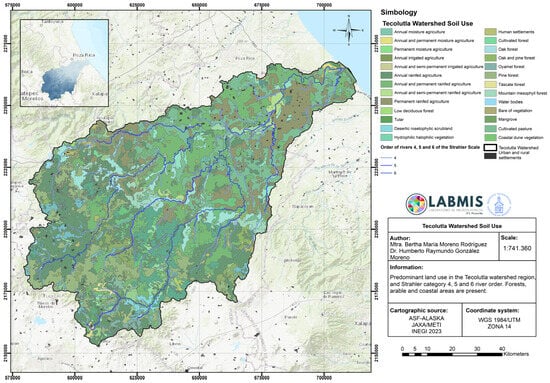
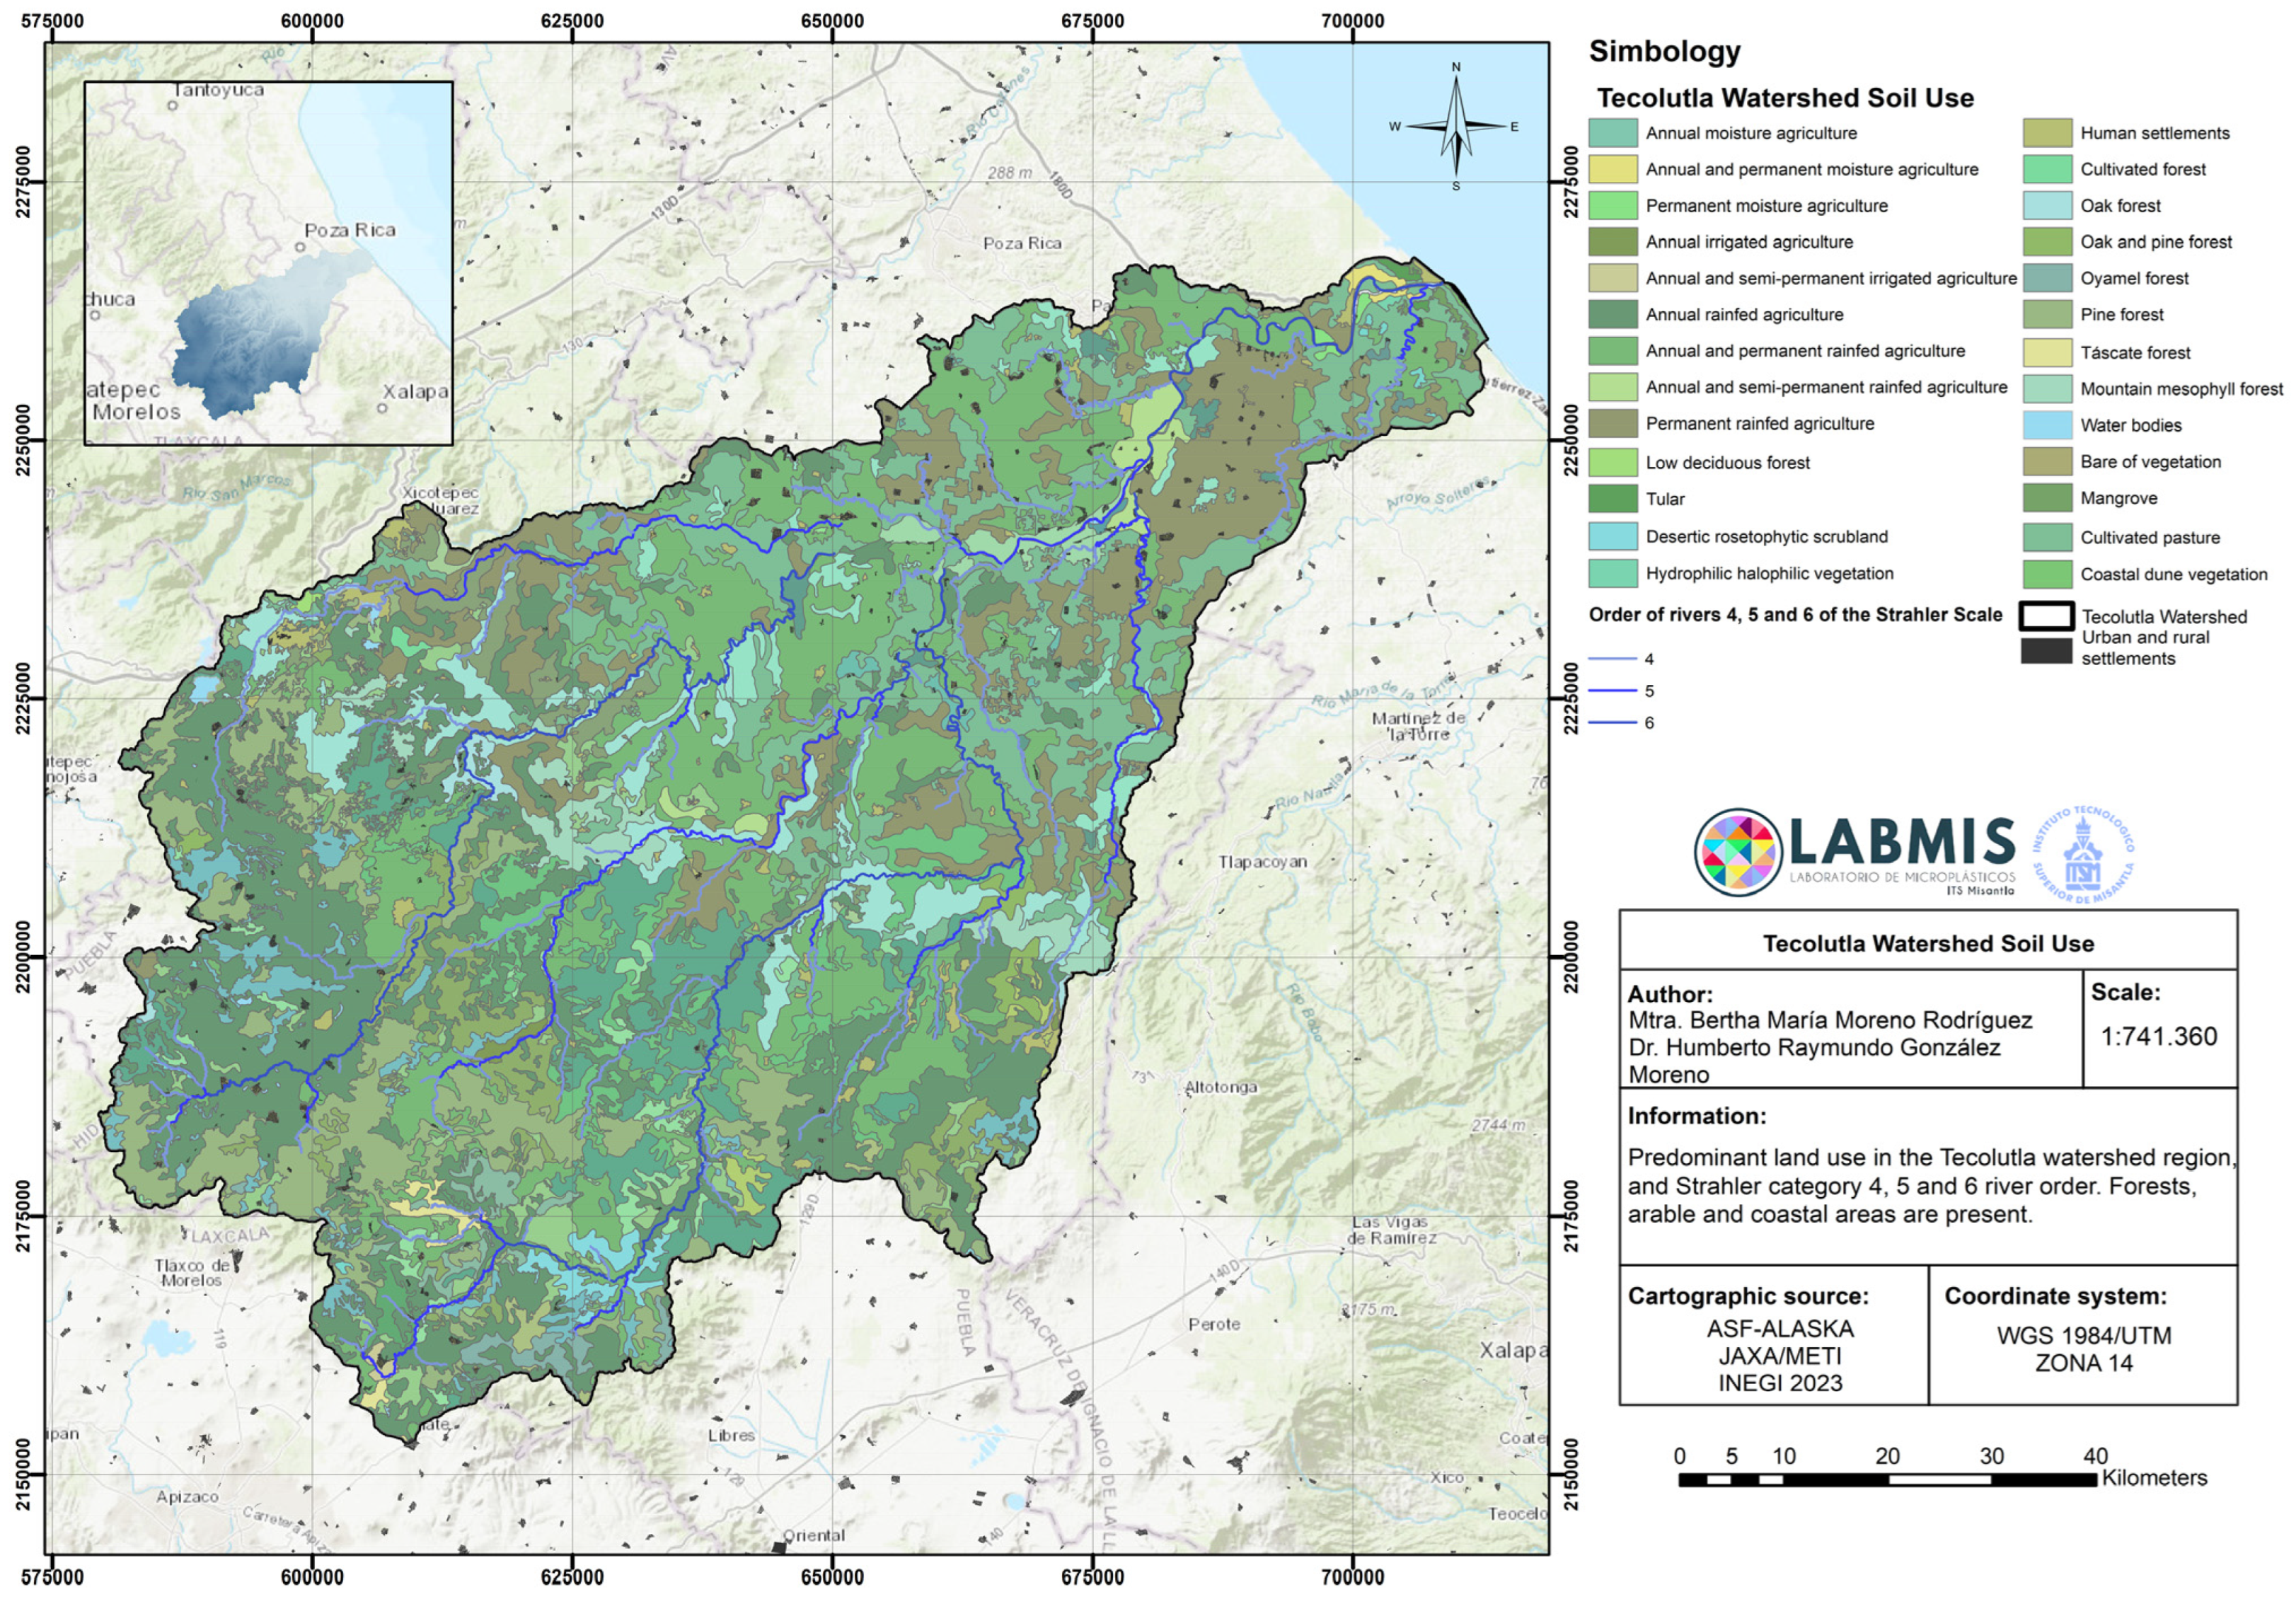
The study was conducted in seven municipalities selected to include the upper, middle, and lower areas of the Tecolutla River Basin. The upper area included Emiliano Zapata and Acaxochitlán; the middle area included Huauchinango and Xicotepec; and the lower area included Papantla, Gutiérrez Zamora, and Tecolutla. The specific municipalities were selected purposively based on the resources available and their accessibility for fieldwork. Consequently, they do not constitute a statistically representative sample of the basin’s 74 municipalities. Land use within the Tecolutla River Basin is shown in Figure 1.
Figure 1.
Land use in the Tecolutla River basin. Includes agricultural, forest, urban, and ecological areas. Source: LABMIS-ITS Misantla, based on INEGI [36] using a Quantum Geographic Information System (QGIS) 3.28 (WGS84/UTM Zone 14N).
2.2. Survey Design
A cross-sectional study was conducted using a structured questionnaire adapted from Omoyajowo et al. [37], with the aim of assessing knowledge, attitudes, and perceptions related to microplastic pollution.
The instrument consisted of four sections. The first collected sociodemographic information: age, gender, educational level, marital status, type of housing, municipality or locality of residence, and number of household members. The Section 2 assessed knowledge regarding the identification, generation, and potential effects of microplastics. The Section 3 examined attitudes related to environmental concern, willingness to learn, and participation in community actions. The Section 4 assessed the perception of environmental and health risks, as well as the responsibility attributed to authorities and institutions.
The dimensions of knowledge, attitude, and perception consisted of 18 statements assessed using a five-point Likert scale: 1 = strongly disagree, 2 = disagree, 3 = neither agree nor disagree, 4 = agree, and 5 = strongly agree. Scores for each dimension were calculated as the average of the corresponding items, such that higher scores indicated greater knowledge, more favorable attitudes, and a greater perception of the problem. The complete questionnaire is provided in Supplementary File S1.
2.3. Pilot Test and Reliability of the Instrument
Prior to its final administration, the questionnaire underwent a pilot test with 46 households in the Tecolutla River basin. This stage allowed for an evaluation of the clarity of the instructions and statements, the comprehensibility of the language used, cultural relevance, and the functionality of the electronic form. Based on the observations obtained, minor adjustments were made to the wording and presentation of the instrument.
Internal consistency was assessed using Cronbach’s alpha coefficient based on the full sample of 398 participants. The overall instrument had a Cronbach’s alpha of 0.752. By dimension, the values were 0.618 for knowledge, 0.631 for attitude, and 0.740 for perception.
2.4. Population and Sample
The reference population consisted of 67,978 occupied private dwellings with basic services (piped water, electricity, and sewerage) in seven municipalities within the watershed. Access to all three services was required for a household to participate. The presence of these services was verified before administering the questionnaire.
The sample size was calculated using Yamane’s formula [38] for finite populations,
where n is the calculated sample size, N is the reference population (67,978 households), and e is the assumed sampling error (0.05). Substituting these values yielded n = 67,978/[1 + 67,978 (0.05)2] = 397.66, which was rounded up to 398 households. Because households were selected by convenience, the 0.05 parameter does not represent an achieved margin of error.
n = N/(1 + Ne2)
The sample was distributed proportionally to the number of households in each municipality: Huauchinango (37%), Xicotepec (27.5%), Papantla (24%), Gutiérrez Zamora (6.2%), Tecolutla (2.1%), Emiliano Zapata (1.7%), and Acaxochitlán (1.5%).
The unit of analysis was the head of household. The study included individuals aged 18 years or older who were residents of the selected municipality and capable of answering the questionnaire. One questionnaire was administered per household.
2.5. Data Collection
Data collection took place between May 2024 and August 2025. The survey was conducted in stages, beginning in the municipalities located in the upper part of the watershed, in Tlaxcala and Hidalgo; it then continued in the middle part, corresponding to Puebla; and concluded in the lower part, in Veracruz.
Within each municipality, interviewers walked through streets starting in the town center and continuing through nearby areas. They approached households at their homes, verified the presence of piped water, electricity, and sewerage, and invited eligible heads of household to participate. Recruitment continued until the allocated number of completed questionnaires for that municipality was reached. Households were selected by convenience, without random selection or a fixed sampling interval.
The questionnaire was administered to household heads aged 18 years or older using electronic forms. Before completing the questionnaire, participants received information about the purpose of the study, the procedures involved, the voluntary nature of their participation, and the confidential treatment of their responses. Informed consent was obtained from all participants before beginning the survey. Participants were informed that they could decline to participate or discontinue the questionnaire at any time without penalty. No names or directly identifiable personal information were collected. The responses were subsequently integrated into a database for review and analysis.
A total of 430 eligible households were invited to participate. Of these, 18 declined, 14 provided incomplete questionnaires, and 398 completed the survey. Incomplete questionnaires were excluded from the analysis. The complete-response rate was 92.6% (398/430).
2.6. Study Variables
Sociodemographic variables and three dimensions related to microplastic pollution were analyzed.
The sociodemographic variables were age, gender, educational level, marital status, type of housing, municipality or locality of residence, and number of household members. These variables were treated as nominal or ordinal categorical variables, depending on their nature.
Knowledge was assessed using five items related to the identification of plastic waste, recycling, the formation of microplastics, and recognition of their potential environmental and health effects. Attitude was assessed using six items on environmental concern and willingness to share information, participate in community actions, and learn about microplastics. Perception was assessed using seven items regarding toxicity, local severity, potential health effects, sustainable development, community knowledge, the responsibility of authorities, and risks to marine ecosystems.
The knowledge dimension included agreement with general statements about microplastics and their potential effects, whereas the perception dimension focused on respondents’ subjective appraisal of toxicity, health risks, and local consequences. Because some items address related topics, the distinction between these dimensions should be interpreted with caution.
Scores for the three dimensions were calculated as the average of the items comprising them. An overall score was also obtained by averaging the 18 items in the questionnaire. The study variables and their measurement scales are summarized in Table 1.
Table 1.
Study variables.
2.7. Statistical Analysis
First, the integrity of the database and the distribution of responses were reviewed. Sociodemographic variables were summarized using absolute frequencies and percentages. Means, standard deviations, and medians were calculated for each item and dimension.
The internal consistency of the overall instrument and of each dimension was assessed using Cronbach’s alpha. Due to the ordinal nature of the data and the failure to meet the assumptions of normality in the scores analyzed, nonparametric tests were used.
Each household contributed one observation. Items within each dimension were weighted equally when calculating scores, and only complete questionnaires were analyzed. Given the nonprobability sampling approach, group comparisons were interpreted as exploratory.
For the watershed-area comparison, participants were grouped according to their municipality of residence: upper area (Emiliano Zapata and Acaxochitlán), middle area (Huauchinango and Xicotepec), and lower area (Papantla, Gutiérrez Zamora, and Tecolutla). Knowledge, attitude, and perception scores were compared across the three areas using the Kruskal–Wallis test.
Differences between two independent groups were assessed using the Mann–Whitney U test, while comparisons among three or more groups were performed using the Kruskal–Wallis test. When the Kruskal–Wallis test revealed statistically significant differences, post hoc comparisons were conducted using Dunn’s test with adjustment for multiple comparisons.
Associations between knowledge, attitude, perception, and overall scores were examined using Spearman’s correlation coefficient. A level of statistical significance of p < 0.05 was set.
Statistical analysis was performed using IBM SPSS Statistics, version 26. Microsoft Excel for Microsoft 365 (Microsoft Corporation; https://www.microsoft.com/microsoft-365/excel) was used for the initial integration of the database and the organization of tables.
2.8. Ethical Considerations
Participation in the study was voluntary. Before completing the questionnaire, each participant received information about the purpose of the research, the confidentiality of their responses, and their right to decline to participate or withdraw from the questionnaire without any consequences. Informed consent was obtained from each participant.
3. Results and Discussion
3.1. Sociodemographic Characteristics of the Participants
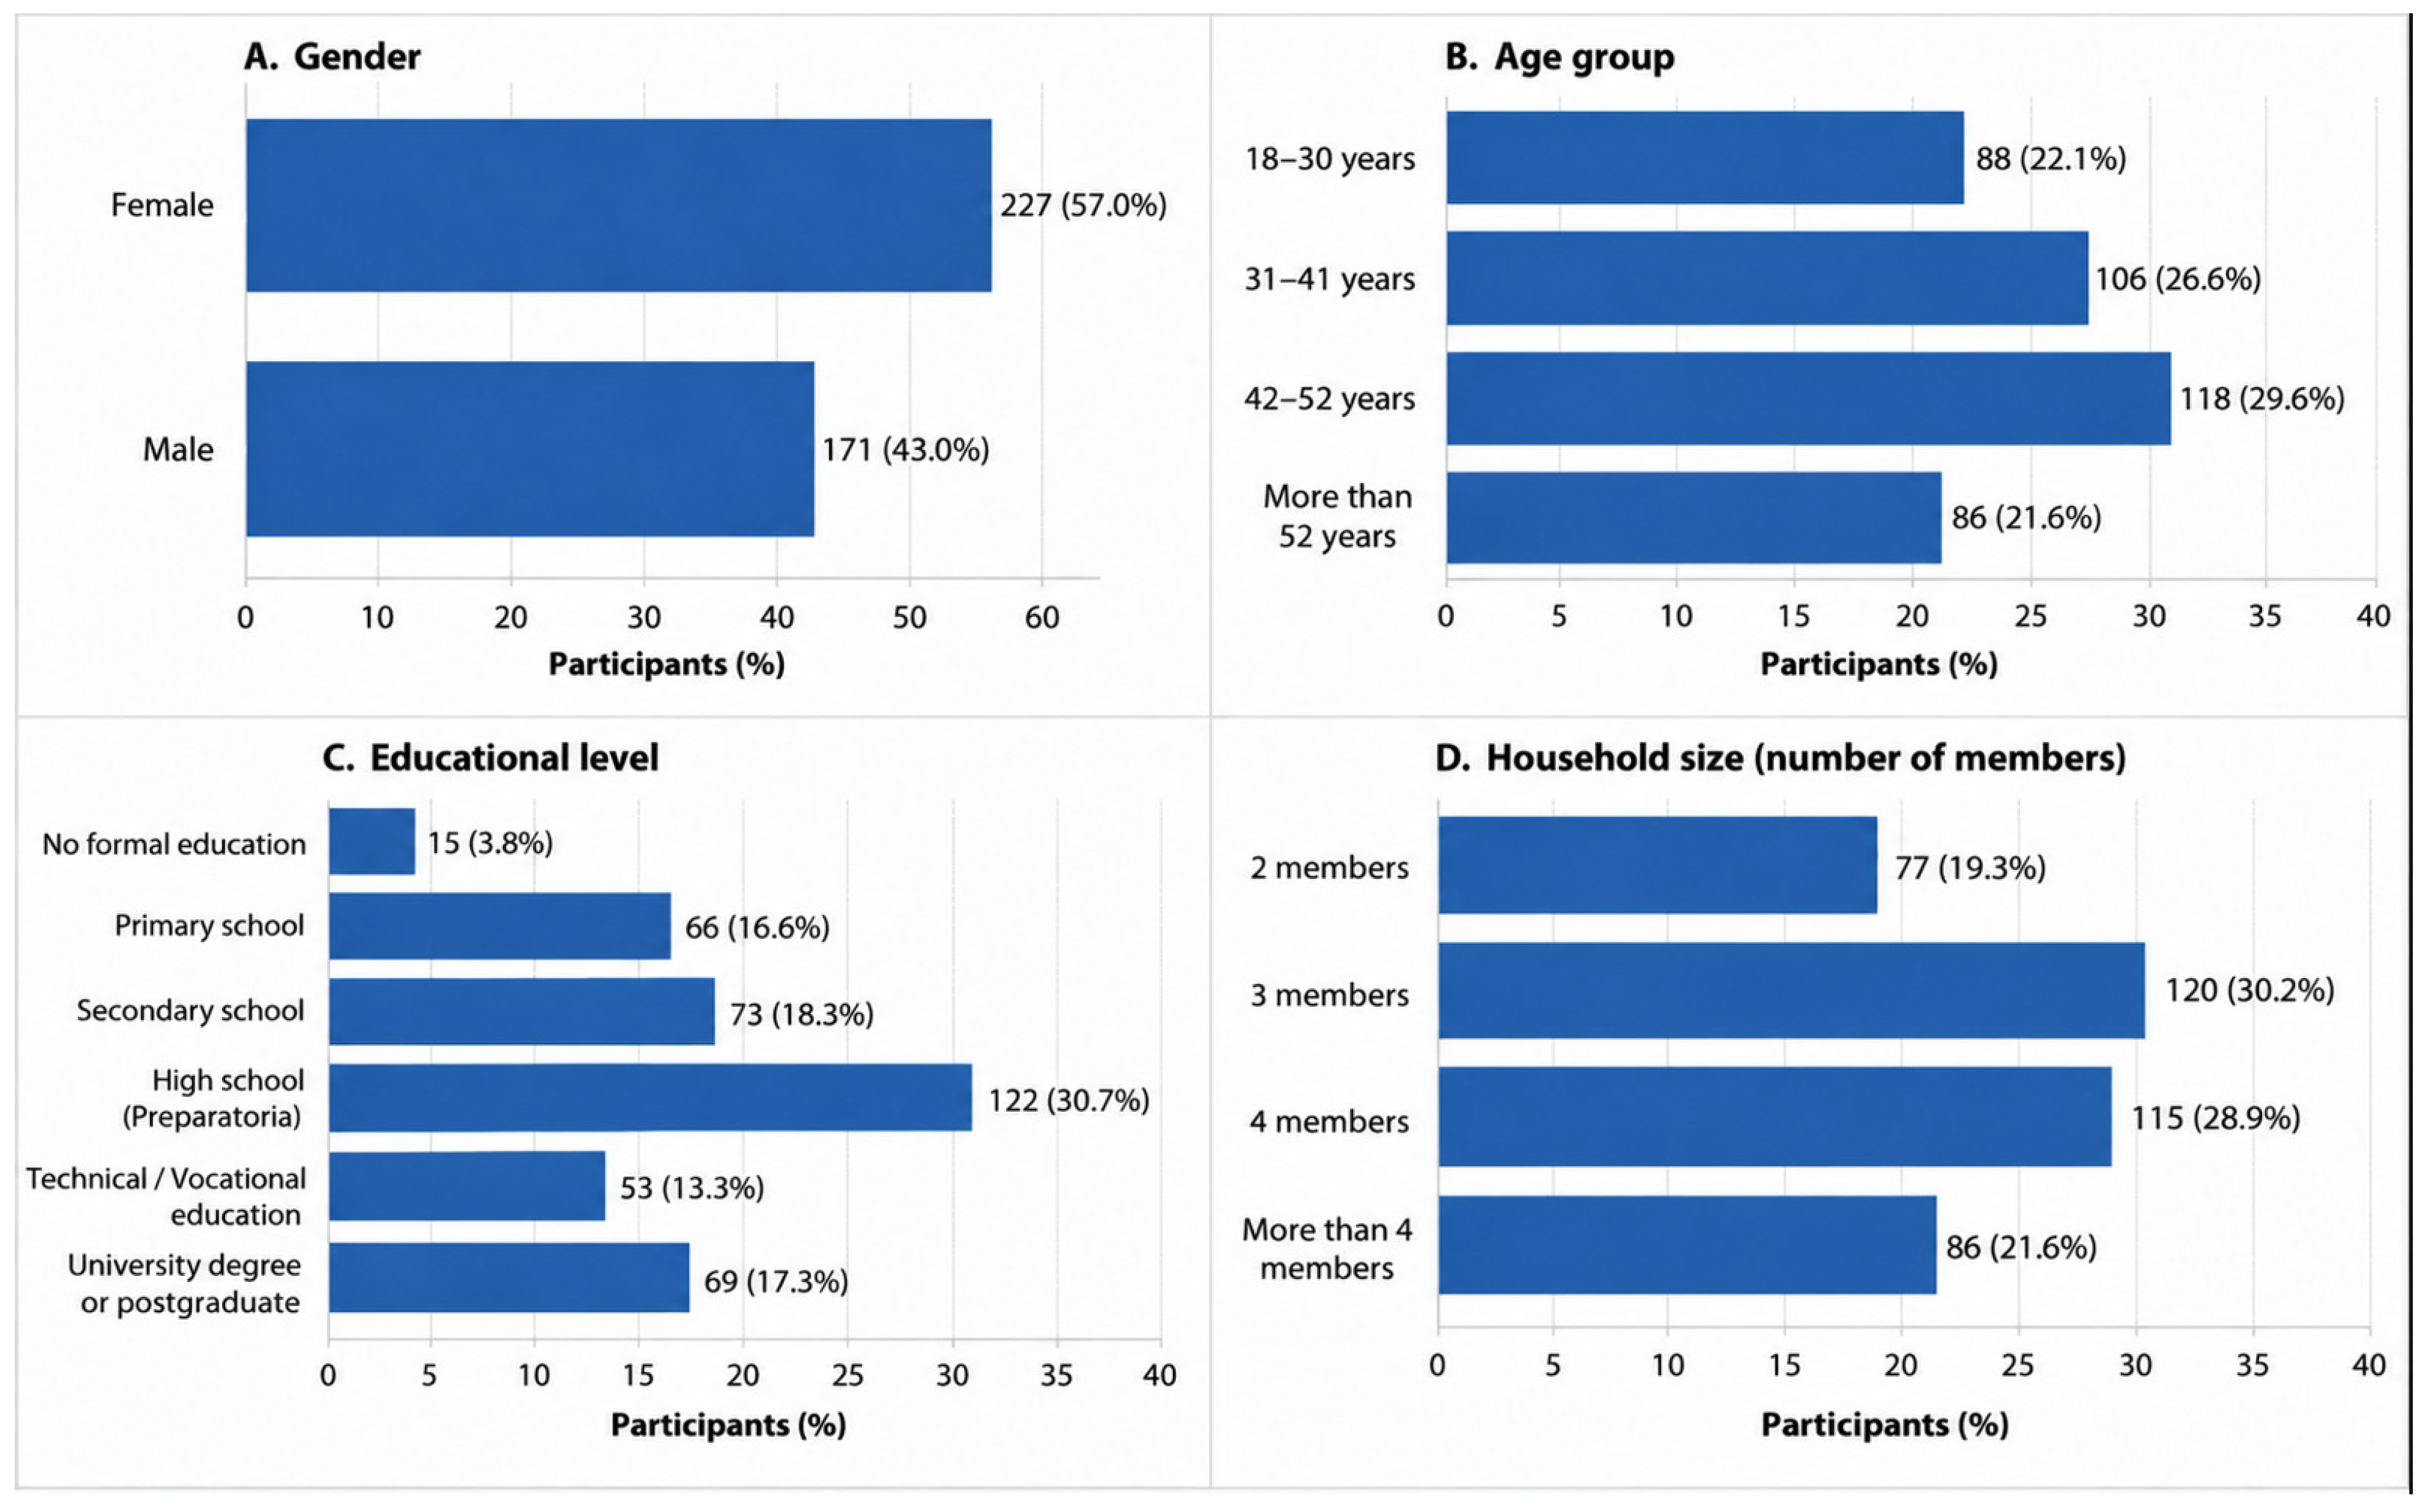
The sample consisted of 398 residents of the Tecolutla River basin in Mexico. In terms of gender, women predominated, with 227 participants (57.0%), while men accounted for 171 participants (43.0%). Regarding age, the most common age group was 42 to 52 years old, with 118 participants (29.6%), followed by the 31 to 41 age group, with 106 participants (26.6%). Participants aged 18 to 30 accounted for 88 cases (22.1%), and those over 52 years old accounted for 86 participants (21.6%).
Regarding educational level, the most common category was high school, with 122 participants (30.7%), followed by middle school, with 73 participants (18.3%); bachelor’s or graduate degree, with 69 participants (17.3%); elementary school, with 66 participants (16.6%); vocational training, with 53 participants (13.3%); and no formal education, with 15 participants (3.8%). Regarding marital status, the predominant category was “married,” with 202 participants (50.8%), followed by “single,” with 121 participants (30.4%). Marital status refers to the respondent, whereas household size refers to the number of people living in the household. Therefore, respondents classified as single did not necessarily live alone. The remaining categories were “cohabiting” (9.3%), “divorced” (6.8%), and “other” (2.8%).
By municipality, the largest proportion of participants came from Huauchinango, with 147 people (36.9%), followed by Xicotepec, with 110 participants (27.6%), and Papantla, with 95 participants (23.9%). A smaller proportion of participants came from Gutiérrez Zamora (6.3%), Tecolutla (2.0%), Emiliano Zapata (1.8%), and Acaxochitlán (1.5%).
Regarding housing type, single-family homes on their own lot were the most common, reported by 235 participants (59.0%), followed by homes sharing a lot with one or more other homes, with 94 participants (23.6%). The other categories were less common: housing in a row house or tenement (6.0%), duplexes (4.0%), apartments in a building (3.5%), a room or rooftop apartment in a building (3.5%), and premises not built for residential use (0.3%).
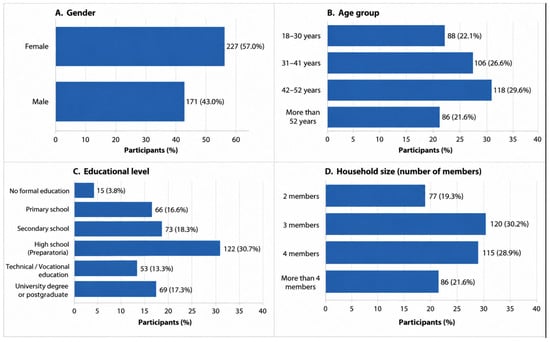
Regarding the number of household members, the most common category was households with three people, with 120 participants (30.2%), followed by households with four people, with 115 participants (28.9%). In addition, 86 participants (21.6%) reported living in households with more than four members, while 77 participants (19.3%) indicated living in households with two members. No responses were recorded in the single-member category in the analyzed dataset. The distributions of gender, age, educational level, and household size are shown in Figure 2.
Figure 2.
Sociodemographic characteristics of participants surveyed in the Tecolutla River Basin, Mexico: (A) gender, (B) age group, (C) educational level, and (D) household size. Bars represent the percentage distribution of participants; labels indicate frequencies and percentages.
3.2. Reliability of the Instrument
The internal consistency of the 18-item questionnaire was acceptable for the overall scale, with a Cronbach’s alpha coefficient of 0.752. Among the dimensions assessed, perception exhibited the highest internal consistency (α = 0.740), while knowledge (α = 0.618) and attitude (α = 0.631) showed modest internal consistency.
These results indicate that the instrument demonstrated acceptable internal consistency as a whole. However, the coefficients obtained for the knowledge and attitude dimensions suggest lower homogeneity among their items. Therefore, the results derived from these subscales should be interpreted with caution. In particular, comparisons and correlations involving knowledge and attitude scores should be regarded as exploratory. In future applications, consideration could be given to revising, reformulating, or incorporating new items in order to improve their internal consistency. The internal consistency of the questionnaire and its dimensions is presented in Table 2.
Table 2.
Internal consistency of the questionnaire and its dimensions.
3.3. Descriptive Statistics for the Questionnaire Dimensions
The descriptive results showed that the dimension with the highest mean score was knowledge, with a mean of 3.70 ± 0.67, followed by attitude, with a mean of 3.58 ± 0.64. The perception dimension had the lowest mean score, at 3.18 ± 0.75. The overall score for the questionnaire was 3.46 ± 0.49.
The medians were 3.80 for knowledge, 3.67 for attitude, and 3.14 for perception. Taken together, these results show that participants scored comparatively higher on knowledge and attitude than on perception.
3.4. Results by Item
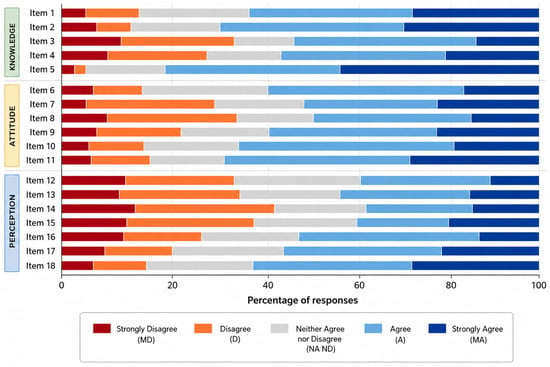
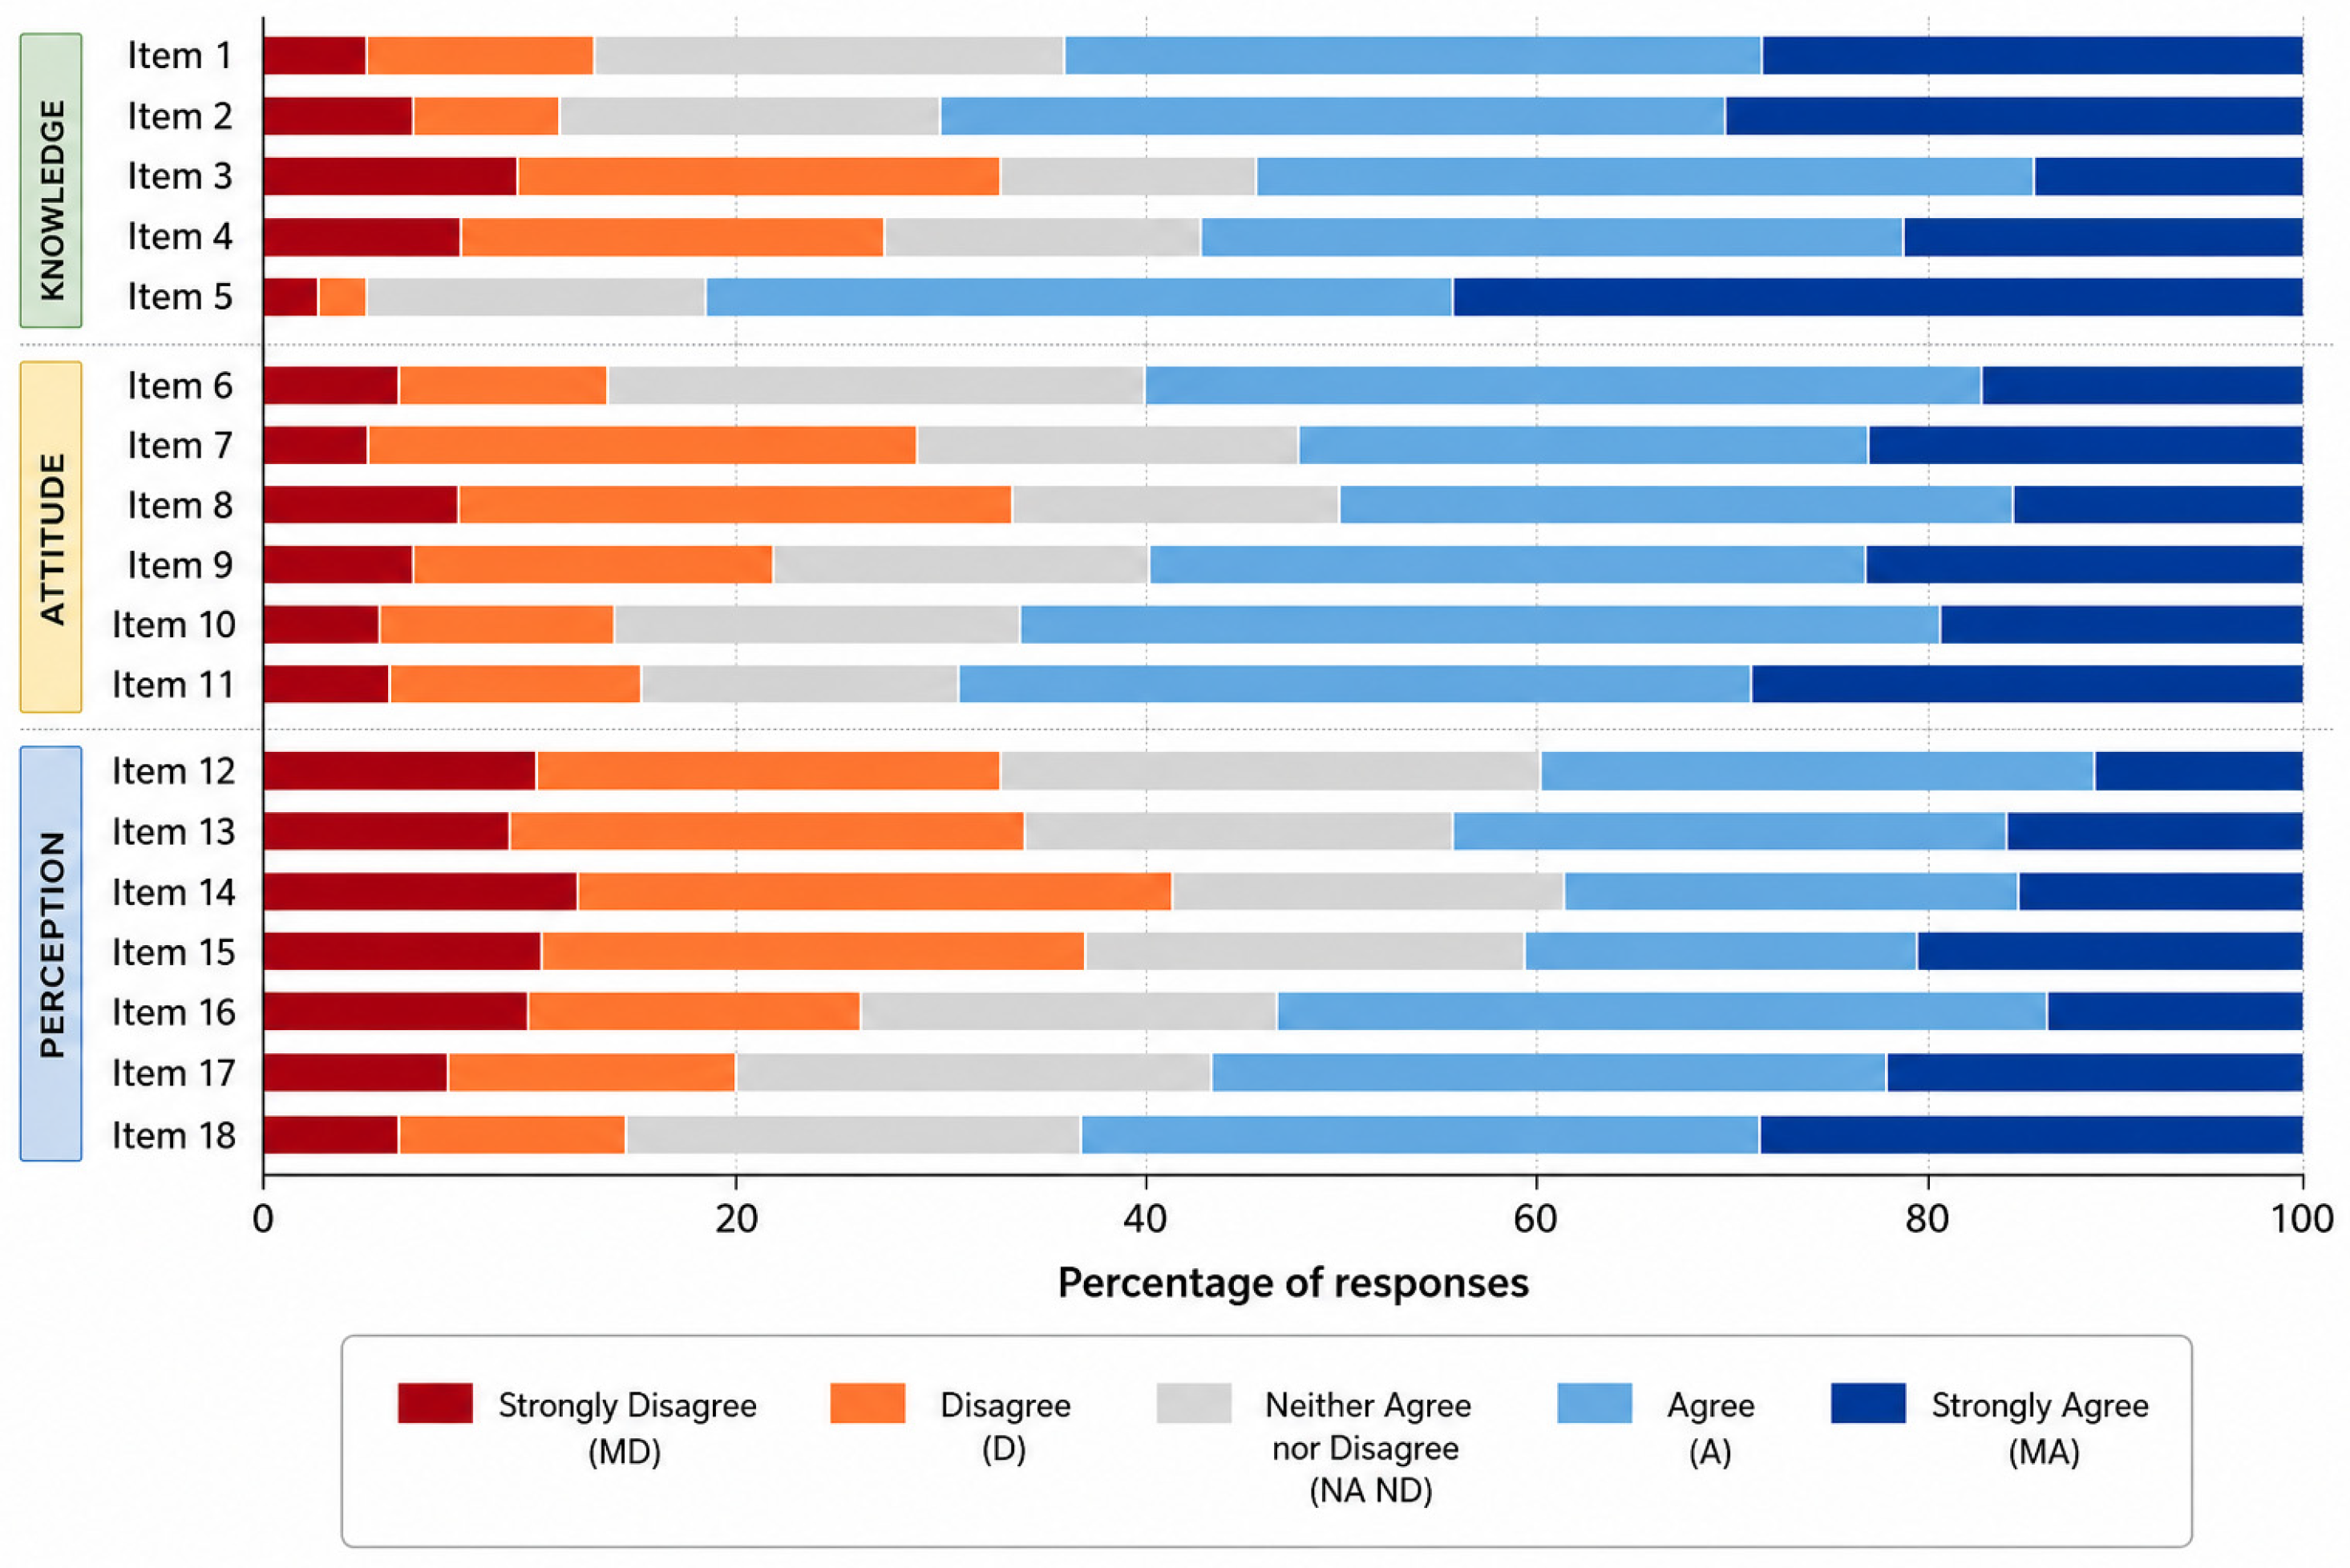
At the item level, the highest mean score corresponded to the statement “Microplastic pollution is a serious global problem” (item 4), with a mean of 4.24 ± 0.83. This result showed the highest degree of agreement among participants.
High scores were also observed for items related to the willingness to learn and participate in community activities. The statement “I want to learn more about microplastics and their effects” (item 10) had a mean of 3.93 ± 0.93. Similarly, “I am willing to participate in community initiatives to reduce microplastic pollution” (item 8) had a mean of 3.91 ± 0.99, while “I am willing to participate in cleanup activities related to microplastic pollution in my community” (item 9) had a mean of 3.82 ± 1.01.
In contrast, the lowest mean scores were observed for items related to toxicity and potential effects on human health. The statement “In my opinion, exposure to microplastics can affect human health” (item 14) had a mean of 2.87 ± 1.26, while “I perceive microplastics to be toxic” (item 12) had a mean of 2.90 ± 1.28. On the other hand, the item “I am willing to talk to my family and friends about the problem of microplastics in our area” (item 7) recorded a mean of 2.97 ± 1.25.
Table 3 summarizes the wording and scores of the four items with the highest means and the three with the lowest means.
Table 3.
Selected questionnaire items and their scores (n = 398).
Figure 3 shows the percentage distribution of responses for the 18 items on the questionnaire. In general, the highest percentages of “agree” and “strongly agree” responses were concentrated in the items related to the overall severity of the problem, interest in learning, and community participation. In contrast, the items on toxicity, potential effects on human health, and communication of the problem showed a more balanced distribution among the “agree,” “neutral,” and “disagree” categories.
Figure 3.
Percentage distribution of responses for the 18 questionnaire items related to knowledge, attitude, and perception of microplastic pollution. Response categories ranged from “strongly disagree” to “strongly agree” (n = 398).
This pattern can be considered alongside findings from other settings. In a survey around Lagos Lagoon, Omoyajowo et al. [37] reported that more than half of respondents had heard of microplastics, although their perception of the problem remained limited. Among U.S. respondents, Baechler et al. [22] found that concern about human health was less prominent than concern about environmental impacts. Similarly, respondents in the Tecolutla River Basin gave stronger ratings to microplastic pollution as a global problem than to its perceived toxicity and potential health effects. Their reported willingness to join community activities also resembles the interest in cleanup volunteering described by Omoyajowo et al. [37]. Unlike the settings of those surveys, the present study includes respondents from seven municipalities distributed across the upper, middle, and lower areas of a watershed with varied land uses, allowing the observed perceptions to be described within this territorial context. These parallels help place the survey findings in context, but differences in populations and questionnaires prevent direct comparison of numerical scores.
The contrast between recognition of microplastic pollution as a global problem and lower agreement with statements about toxicity and human health suggests that general environmental concern does not necessarily coincide with specific health-risk perceptions. Kramm et al. [18] found that environmental awareness and familiarity with media narratives were associated with microplastic risk perception, indicating that these perceptions involve social and informational factors beyond factual knowledge. In the present survey, lower health-related scores could reflect uncertainty or limited familiarity with potential exposure and effects rather than indifference. However, information sources and perceived uncertainty were not assessed, so these remain possible explanations rather than demonstrated causes.
Participants’ willingness to learn and participate in community activities should also be distinguished from actual behavior. The lower score for communicating the issue to family and friends suggests that willingness varied across the actions considered. The theory of planned behavior distinguishes behavioral intentions from behavior and identifies subjective norms and perceived behavioral control as relevant factors [39]. These factors were not measured here, and the survey therefore cannot explain whether reported willingness would translate into participation. Furthermore, the modest internal consistency of the knowledge and attitude subscales requires caution when interpreting differences among the dimension scores.
The complete distribution of responses, as well as the means, standard deviations, and medians for the 18 questionnaire items, are presented in Table S1 in the Supplementary Materials.
3.5. Comparisons by Sociodemographic Variables
Kruskal–Wallis tests revealed statistically significant differences in some dimensions of the questionnaire based on the participants’ sociodemographic and geographic characteristics. The comparisons by sociodemographic and territorial variables are summarized in Table 4.
Table 4.
Differences in questionnaire scores according to sociodemographic and territorial variables.
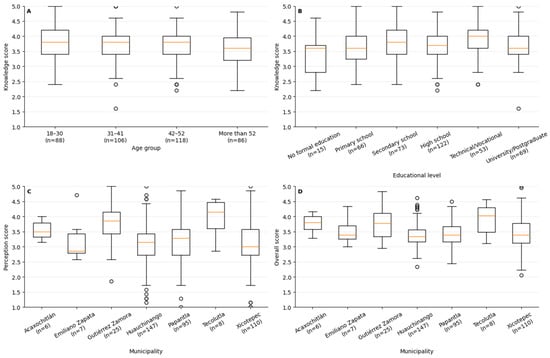
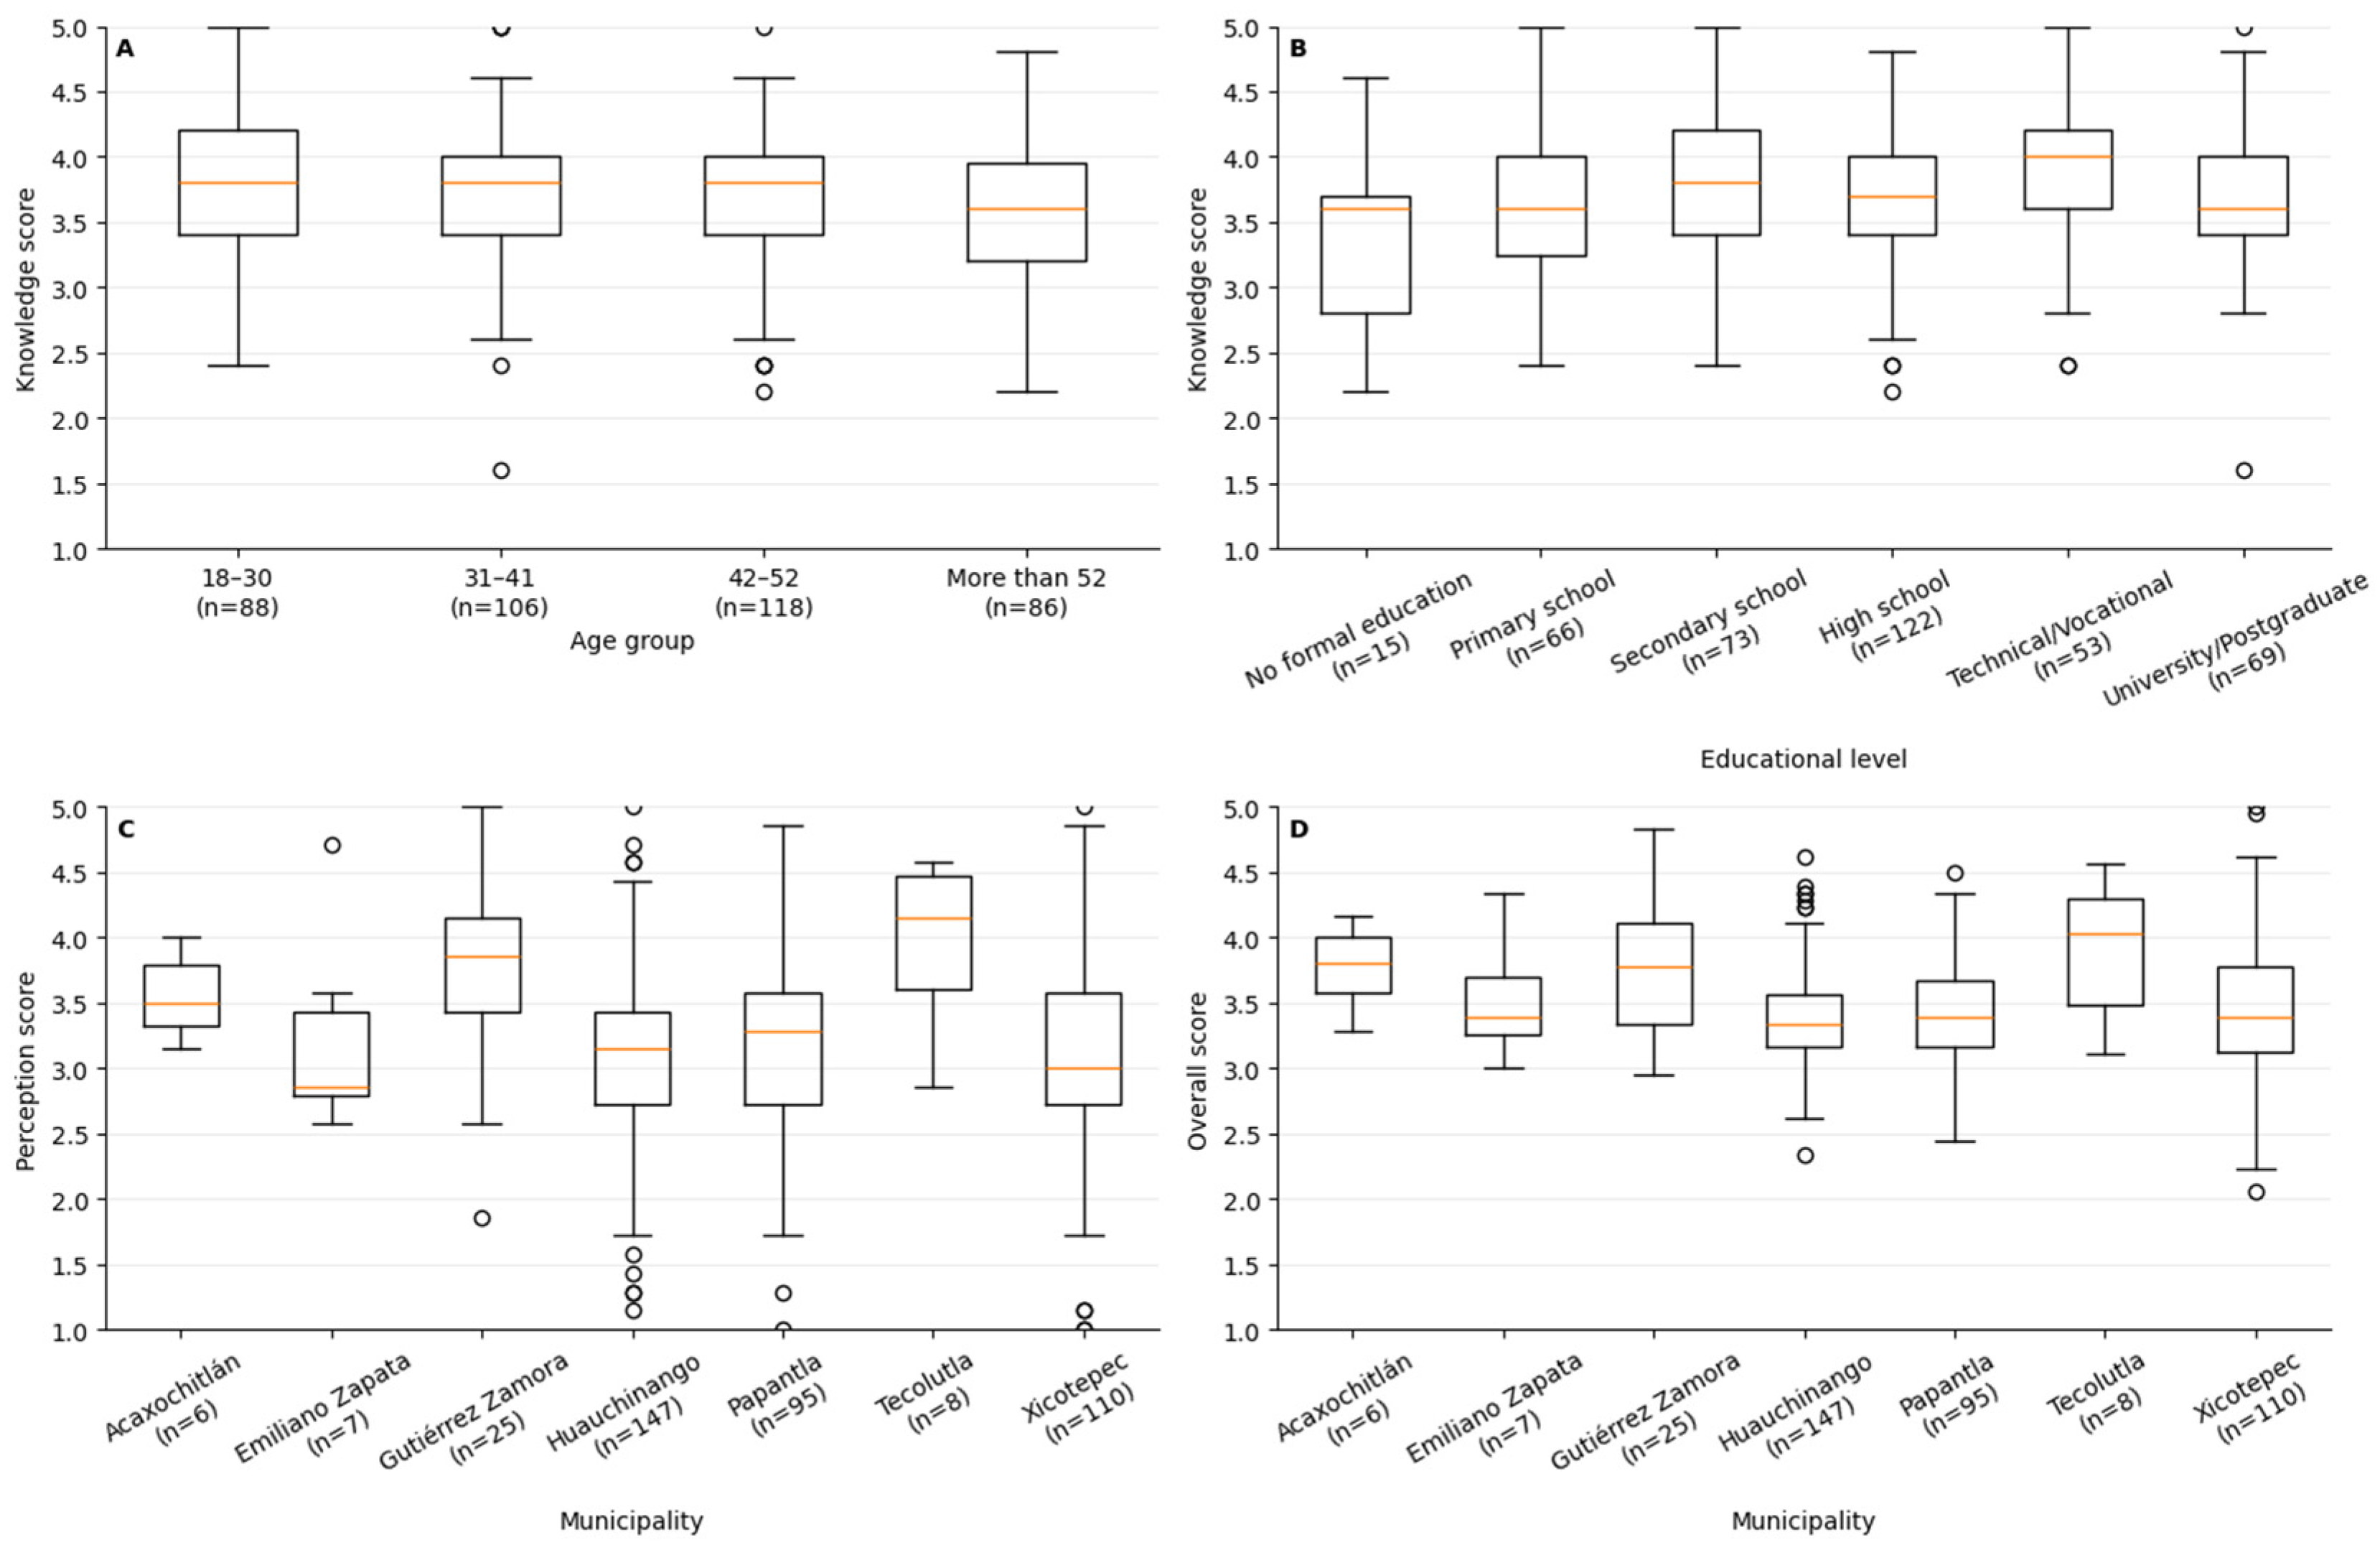
Perception scores differed by municipality of residence, H (6) = 26.744, p = 0.0002, with an effect size of ε2 = 0.053. Post hoc comparisons using Dunn’s test with Holm correction showed that Gutiérrez Zamora had significantly higher scores than Huauchinango (adjusted p = 0.0008), Papantla (adjusted p = 0.0153), and Xicotepec (adjusted p = 0.0035).
Differences were also observed in the overall questionnaire score by municipality, H (6) = 22.264, p = 0.0011, ε2 = 0.042. Post hoc analysis indicated significant differences between Gutiérrez Zamora and Huauchinango (adjusted p = 0.0075), as well as between Gutiérrez Zamora and Papantla (adjusted p = 0.0418).
Because Acaxochitlán (n = 6), Emiliano Zapata (n = 7), and Tecolutla (n = 8) had small sample sizes, municipality-level comparisons should be interpreted as exploratory. Mean scores by watershed area are presented in Table 5.
Table 5.
Knowledge, attitude, and perception scores by watershed area.
Knowledge and attitude scores did not differ significantly among the upper, middle, and lower watershed areas (knowledge: H (2) = 0.788, p = 0.674; attitude: H (2) = 1.950, p = 0.377). Perception scores differed across areas (H (2) = 9.242, p = 0.0098), although the effect size was small (ε2 = 0.018). Dunn’s post hoc test with Holm correction indicated higher perception scores in the lower area than in the middle area (adjusted p = 0.0117). These comparisons should be interpreted cautiously because only 13 participants were surveyed in the upper area.
The comparison by watershed area showed similar knowledge and attitude scores across the upper, middle, and lower areas. Perception scores were higher in the lower area than in the middle area, although the effect size was small. The lower area comprises municipalities with different settings, including the coastal municipality of Tecolutla; therefore, this result should not be interpreted as a coastal effect. The uneven distribution of respondents, particularly the small upper-area sample, also prevents attributing differences in scores to watershed position or land-use characteristics.
Knowledge scores differed by age group, H (3) = 11.642, p = 0.0087, ε2 = 0.022. Participants aged over 52 had significantly lower scores than those in the 18–30 age group (adjusted p = 0.0120), the 31–41 age group (adjusted p = 0.0331), and the 42–52 age group (adjusted p = 0.0355).
Likewise, differences in knowledge were found according to educational level, H (5) = 13.477, p = 0.0193, ε2 = 0.022. Post hoc comparisons showed a significant difference between participants with a primary school education and those with vocational technical training (adjusted p = 0.0378), with higher scores in the latter group. Figure 4 shows the distributions of scores across the sociodemographic and municipal groups compared.
Figure 4.
Distribution of knowledge scores by age group (A) and educational level (B), and distribution of perception (C) and overall questionnaire scores (D) by municipality. Boxes represent the interquartile range, horizontal lines indicate medians, whiskers extend to values within 1.5 times the interquartile range, and circles indicate potential outliers. Sample sizes are shown below each category.
3.6. Correlations Among Dimensions
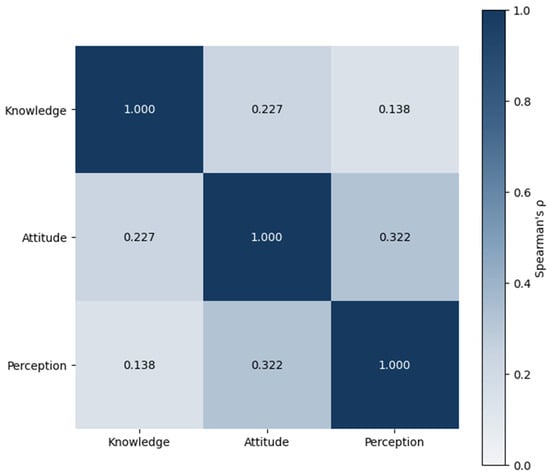
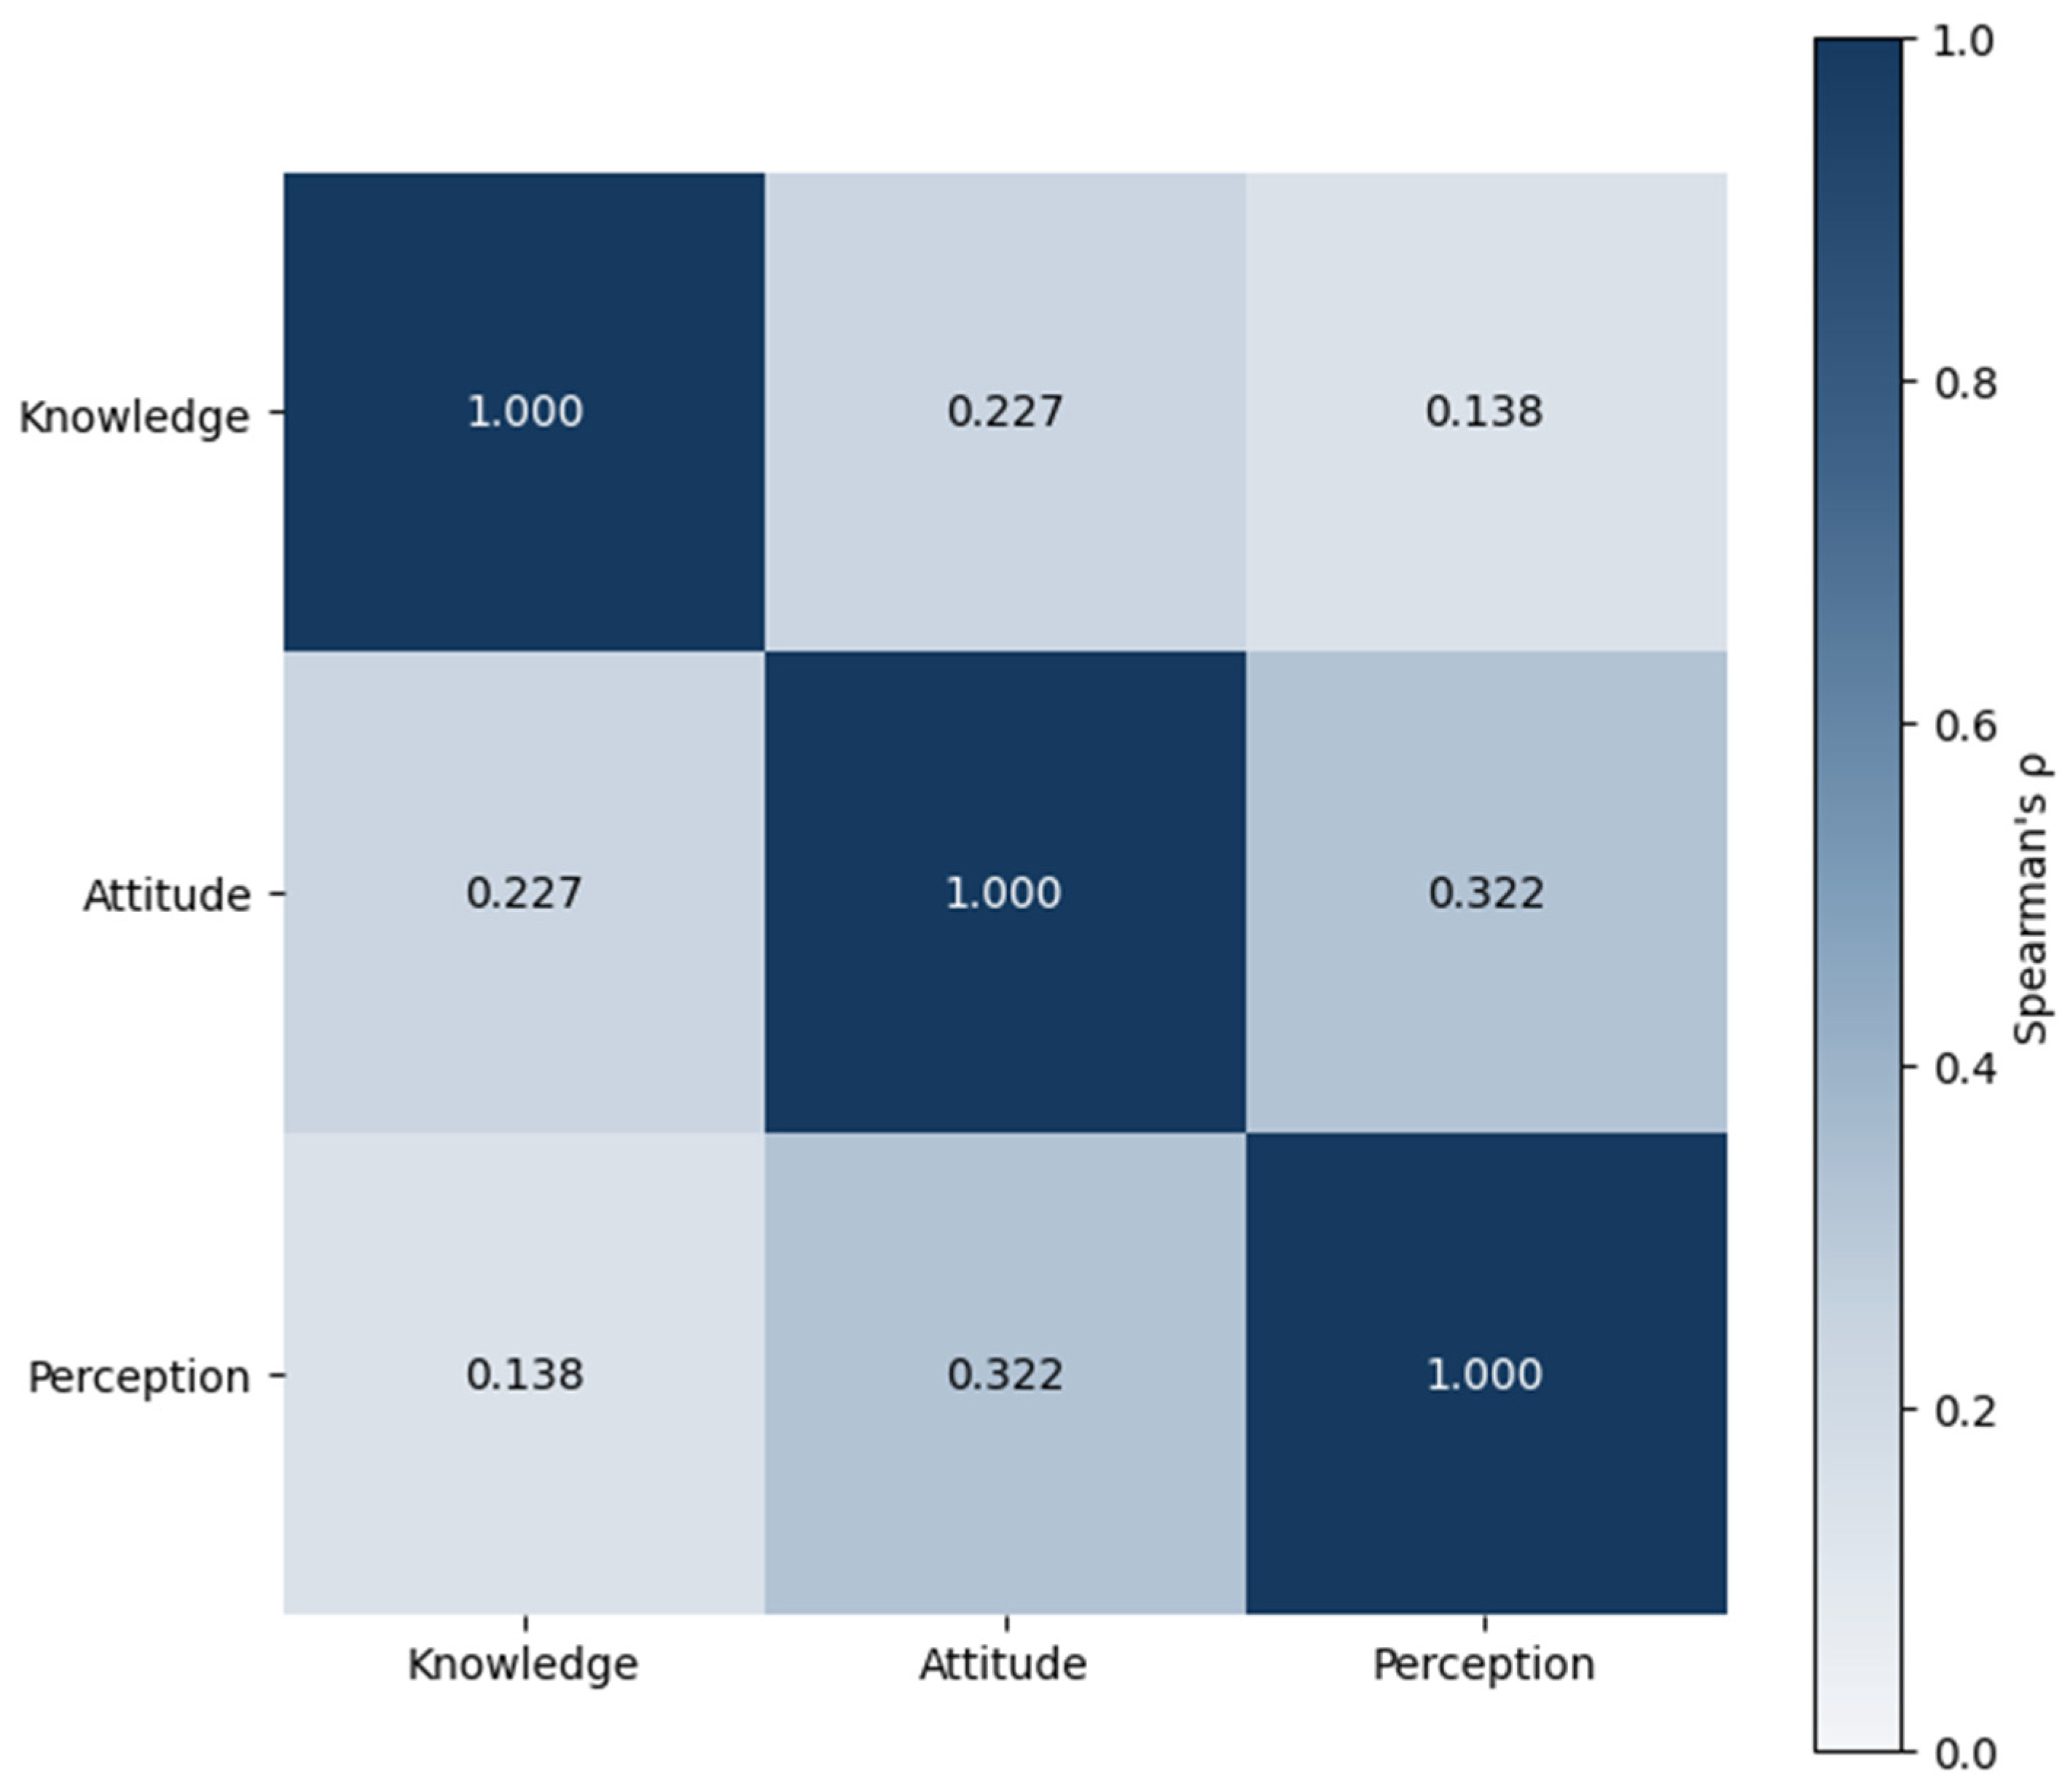
Spearman’s correlations revealed positive and statistically significant associations among the three dimensions of the questionnaire. The strongest correlation was observed between attitude and perception, with ρ = 0.322 and p < 0.001. The relationship between knowledge and attitude was weaker, with ρ = 0.227 and p < 0.001, while the association between knowledge and perception was the weakest, with ρ = 0.138 and p = 0.006.
Although all three correlations were statistically significant, their magnitudes were weak to modest (ρ = 0.138–0.322). These associations should therefore be interpreted as exploratory and do not establish that knowledge, attitude, or perception causes changes in another dimension.
Figure 5 presents the Spearman correlation matrix among knowledge, attitude, and perception.
Figure 5.
Spearman correlation matrix among knowledge, attitude, and perception scores. Values within the cells represent Spearman’s correlation coefficients. Higher values indicate stronger positive associations.
3.7. Land Use and Potential Microplastic Sources
Figure 1 shows a mosaic of agricultural land, forest cover, human settlements, and water bodies across the Tecolutla River Basin. Where agricultural plastic mulch is used, its fragmentation can produce microplastic fragments [34]. Textile washing can release synthetic microfibers into wastewater [33], while abrasion of fishing ropes can generate plastic fragments [35]. Runoff could transport released particles toward waterways. A separate mechanism reported for polyethylene and polypropylene involves residual stress from manufacturing, which can lead to the release of amorphous polymer micropollutants into water [40]. These are potential pathways described in the literature; this study did not collect environmental samples or determine whether these particles occur in the basin.
4. Study Limitations
The purposive selection of seven municipalities based on watershed coverage and fieldwork feasibility limits the generalizability of the findings to the other municipalities in the basin.
Excluding households without all three basic services may have introduced selection bias. Therefore, the findings should not be generalized to households without these services.
The overlap in topics addressed by some knowledge and perception items may limit the distinction between these two dimensions.
Household recruitment began in central streets and continued until the assigned quota was reached in each municipality. This convenience-based procedure may have underrepresented households farther from municipal centers. In addition, responses were self-reported and collected at a single time point, so they may be affected by reporting bias and cannot establish changes in KAP over time.
Additionally, no one-person households were reported in the 398 completed questionnaires. Therefore, the findings may not reflect the views of people living alone.
5. Conclusions
This study assessed knowledge, attitudes, and perceptions of microplastic pollution among household heads in seven municipalities of the Tecolutla River Basin. Mean scores were 3.70 for knowledge, 3.58 for attitude, and 3.18 for perception. Although participants generally recognized microplastic pollution as an environmental problem, their scores were lower for perceived toxicity and potential effects on human health. These findings identify the main gap across the three dimensions assessed.
The lower scores on perceived toxicity and potential health effects suggest that educational materials could address these topics explicitly. Participants’ reported willingness to learn and join community activities supports exploring information sessions and voluntary community activities in the surveyed municipalities. Because the survey did not assess factors influencing behavior or test educational or policy measures, the proposed actions require evaluation before their effectiveness can be established.
The study did not collect or analyze environmental samples. Consequently, the survey results cannot determine microplastic concentrations or identify pollution sources in the watershed.
Overall, this study provides empirical information on household responses to microplastic pollution in the surveyed municipalities of the Tecolutla River Basin. By identifying lower agreement with health-related statements alongside willingness to learn and participate, it highlights specific topics and opportunities for locally tailored environmental education and community engagement. These findings provide a starting point for designing and evaluating activities that address the concerns and interests expressed by participants.
Future studies could also examine factors that influence household behavior and evaluate whether educational and community activities lead to measurable changes in knowledge, attitudes, or practices.
Supplementary Materials
The following supporting information can be downloaded at https://www.mdpi.com/article/10.3390/microplastics5040208/s1. Supplementary File S1: Household Questionnaire on Knowledge, Attitudes, and Perceptions of Microplastic Pollution. Table S1: Distribution of responses and descriptive statistics for the knowledge, attitude, and perception items on microplastic pollution in the Tecolutla River Basin, Mexico.
Author Contributions
Conceptualization, B.M.-R. and H.R.G.-M.; methodology, B.M.-R. and C.P.-M.; software, B.M.-R.; validation, B.M.-R., H.R.G.-M. and L.A.P.-P.; formal analysis, B.M.-R. and Y.B.-P.; investigation, B.M.-R., C.P.-M. and Y.B.-P.; resources, H.R.G.-M. and G.M.-C.; data curation, B.M.-R. and L.A.P.-P.; writing—preparation of the original draft, B.M.-R.; writing—review and editing, H.R.G.-M., C.P.-M. and G.M.-C.; visualization, B.M.-R. and Y.B.-P.; supervision, H.R.G.-M. and G.M.-C.; project management, B.M.-R.; funding acquisition, H.R.G.-M. and G.M.-C. All authors have read and agreed to the published version of the manuscript.
Funding
This research did not receive external funding.
Institutional Review Board Statement
Ethical review and approval were not required for this study under the institutional guidelines applicable to anonymous, non-interventional, minimal-risk surveys involving adults. The study collected no clinical, sensitive, or directly identifiable personal information. Participation was voluntary, and informed consent was obtained from all participants before completing the questionnaire.
Informed Consent Statement
Informed consent was obtained from all participants before completing the questionnaire. Participants were informed about the purpose of the study, the voluntary nature of their participation, the anonymity and confidentiality of their responses, and their right to decline or withdraw without penalty.
Data Availability Statement
The authors will provide the data upon request.
Acknowledgments
To the Graduate Department of the Instituto Tecnológico Superior de Misantla, specifically the Doctorate in Engineering Sciences program, for the facilities, support, and academic guidance provided in the development of this study. While preparing this manuscript, the authors used artificial intelligence-based tools to enhance the visual presentation of some figures. The authors have reviewed and validated all the results generated and assume full responsibility for the content of this publication.
Conflicts of Interest
The authors declare no conflicts of interest.
References
- Precedence Research. Plastics Market Size and Forecast Report 2024–2032. Available online: https://www.precedenceresearch.com/commodity-plastics-market (accessed on 12 July 2024).
- Grand View Research. Plastics Market Size, Share & Trends Analysis Report, 2024–2030. Available online: https://www.grandviewresearch.com/industry-analysis/global-plastics-market (accessed on 26 July 2024).
- Fernandes, A.N.; Bertoldi, C.; Lara, L.Z.; Stival, J.; Alves, N.M.; Cabrera, P.M.; Grassi, M.T. Microplastics in Latin America Ecosystems: A Critical Review of the Current Stage and Research Needs. J. Braz. Chem. Soc. 2022, 33, 303–326. [Google Scholar] [CrossRef] [Scilit]
- OECD. Global Plastics Outlook: Economic Drivers, Environmental Impacts and Policy Options; OECD Publishing: Paris, France, 2022. [Google Scholar] [CrossRef] [Scilit]
- INEGI. Perfil de la Fabricación de Productos de Plástico; Instituto Nacional de Estadística y Geografía: Aguascalientes, Mexico, 2019; Available online: https://www.inegi.org.mx/app/biblioteca/ficha.html?upc=702825092894 (accessed on 18 September 2024).
- ANIPAC. Tercer Informe del Acuerdo Nacional para la Nueva Economía del Plástico en México; Asociación Nacional de Industrias del Plástico: Mexico City, Mexico, 2022; Available online: https://anipac.org.mx/wp-content/uploads/2023/01/TERCER-INFORME-ACUERDO-NACIONAL-1.pdf (accessed on 21 October 2024).
- United Nations Environment Programme. Single-Use Plastics: A Roadmap for Sustainability; UNEP: Nairobi, Kenya, 2018; Available online: https://www.unep.org/resources/report/single-use-plastics-roadmap-sustainability (accessed on 14 November 2024).
- Li, Y.; Chen, P.; Tang, Y.; Yang, Y.; Zhou, C.; Bu, J.; Zhong, S. Microplastics in Water: A Review of Characterization and Removal Methods. Sustainability 2024, 16, 4033. [Google Scholar] [CrossRef] [Scilit]
- Al-Sabagh, A.M.; Yehia, F.Z.; Eshaq, G.; Rabie, A.M.; ElMetwally, A.E. Greener Routes for Recycling of Polyethylene Terephthalate. Egypt. J. Pet. 2016, 25, 53–64. [Google Scholar] [CrossRef] [Scilit]
- Schulte, A.; Kampmann, B.; Galafton, C. Measuring the Circularity and Impact Reduction Potential of Post-Industrial and Post-Consumer Recycled Plastics. Sustainability 2023, 15, 12242. [Google Scholar] [CrossRef] [Scilit]
- Geyer, R.; Jambeck, J.R.; Law, K.L. Production, Use, and Fate of All Plastics Ever Made. Sci. Adv. 2017, 3, e1700782. [Google Scholar] [CrossRef] [Scilit] [PubMed]
- Gorman, D.; Moreira, F.T.; Turra, A.; Fontenelle, F.R.; Combi, T.; Bícego, M.C.; de Castro Martins, C. Organic Contamination of Beached Plastic Pellets in the South Atlantic: Risk Assessments Can Benefit by Considering Spatial Gradients. Chemosphere 2019, 223, 608–615. [Google Scholar] [CrossRef] [Scilit] [PubMed]
- Sobhani, Z.; Lei, Y.; Tang, Y.; Wu, L.; Zhang, X.; Naidu, R.; Megharaj, M.; Fang, C. Microplastics Generated When Opening Plastic Packaging. Sci. Rep. 2020, 10, 4841. [Google Scholar] [CrossRef] [Scilit] [PubMed]
- Yong, C.Q.Y.; Valiyaveettil, S.; Tang, B.L. Toxicity of Microplastics and Nanoplastics in Mammalian Systems. Int. J. Environ. Res. Public Health 2020, 17, 1509. [Google Scholar] [CrossRef] [Scilit] [PubMed]
- Prata, J.C.; da Costa, J.P.; Lopes, I.; Duarte, A.C.; Rocha-Santos, T. Environmental Exposure to Microplastics: An Overview on Possible Human Health Effects. Sci. Total Environ. 2020, 702, 134455. [Google Scholar] [CrossRef] [Scilit] [PubMed]
- González-Pleiter, M.; Tamayo-Belda, M.; Pulido-Reyes, G.; Amariei, G.; Leganés, F.; Rosal, R.; Fernández-Piñas, F. Secondary Nanoplastics Released from a Biodegradable Microplastic Severely Impact Freshwater Environments. Environ. Sci. Nano 2019, 6, 1382–1392. [Google Scholar] [CrossRef] [Scilit]
- Catarino, A.I.; Kramm, J.; Völker, C.; Henry, T.B.; Everaert, G. Risk Posed by Microplastics: Scientific Evidence and Public Perception. Curr. Opin. Green Sustain. Chem. 2021, 29, 100467. [Google Scholar] [CrossRef] [Scilit]
- Kramm, J.; Steinhoff, S.; Werschmöller, S.; Völker, B.; Völker, C. Explaining Risk Perception of Microplastics: Results from a Representative Survey in Germany. Glob. Environ. Change 2022, 73, 102485. [Google Scholar] [CrossRef] [Scilit]
- Pop, V.; Ozunu, A.; Petrescu, D.C.; Stan, A.D.; Petrescu-Mag, R.M. The Influence of Media Narratives on Microplastics Risk Perception. PeerJ 2023, 11, e16338. [Google Scholar] [CrossRef] [Scilit] [PubMed]
- Pahl, S.; Wyles, K.J. The Human Dimension: How Social and Behavioural Research Methods Can Help Address Microplastics in the Environment. Anal. Methods 2017, 9, 1404–1411. [Google Scholar] [CrossRef] [Scilit]
- Molloy, S.; Medeiros, A.S.; Walker, T.R.; Saunders, S.J. Public Perceptions of Legislative Action to Reduce Plastic Pollution: A Case Study of Atlantic Canada. Sustainability 2022, 14, 1852. [Google Scholar] [CrossRef] [Scilit]
- Baechler, B.R.; De Frond, H.; Dropkin, L.; Leonard, G.H.; Proano, L.; Mallos, N.J. Public Awareness and Perceptions of Ocean Plastic Pollution and Support for Solutions in the United States. Front. Mar. Sci. 2024, 10, 1323477. [Google Scholar] [CrossRef] [Scilit]
- Ali, A.A.M.; Khalid, A.A.; Anuar, S.T. A Review on the Presence of Microplastics in Environmental Matrices within Southeast Asia: Elucidating Risk Information through an Analysis of Microplastic Characteristics Such as Size, Shape, and Type. Water Emerg. Contam. Nanoplast. 2024, 3, 12. [Google Scholar] [CrossRef] [Scilit]
- Coco Chin, K.K.; Mahanta, J.; Nath, T.K. Knowledge, Attitude, and Practices toward Plastic Pollution among Malaysians: Implications for Minimizing Plastic Use and Pollution. Sustainability 2023, 15, 1164. [Google Scholar] [CrossRef] [Scilit]
- Owojori, O.M.; Mulaudzi, R.; Edokpayi, J.N. Student’s Knowledge, Attitude, and Perception (KAP) to Solid Waste Management: A Survey towards a More Circular Economy from a Rural-Based Tertiary Institution in South Africa. Sustainability 2022, 14, 1310. [Google Scholar] [CrossRef] [Scilit]
- Barloa, E.P.; Lapie, L.P.; de la Cruz, C.P.P. Knowledge, Attitudes, and Practices on Solid Waste Management among Undergraduate Students in a Philippine State University. J. Environ. Earth Sci. 2016, 6, 146–153. Available online: https://www.iiste.org/Journals/index.php/JEES/article/view/31197 (accessed on 11 March 2025).
- Eshete, H.; Desalegn, A.; Tigu, F. Knowledge, Attitudes and Practices on Household Solid Waste Management and Associated Factors in Gelemso Town, Ethiopia. PLoS ONE 2023, 18, e0278181. [Google Scholar] [CrossRef] [Scilit] [PubMed]
- Wang, R.; Yang, Y.; Chen, R.; Kan, H.; Wu, J.; Wang, K.; Maddock, J.E.; Lu, Y. Knowledge, Attitudes, and Practices (KAP) of the Relationship between Air Pollution and Children’s Respiratory Health in Shanghai, China. Int. J. Environ. Res. Public Health 2015, 12, 1834–1848. [Google Scholar] [CrossRef] [Scilit] [PubMed]
- Hashem, R.B.; Siddique, A.B.; Rasel, S.M.; Hossain, M.S. Assessment of Knowledge, Attitudes, and Practices Regarding Air Pollution among Traffic Polices in Dhaka City, Bangladesh: A Cross-Sectional Study. BMC Public Health 2024, 24, 3593. [Google Scholar] [CrossRef] [Scilit] [PubMed]
- Udayanga, S.; Bellanthudawa, B.K.A.; De Zoysa, H.L.S. Sustainable Agriculture and Responsible Use of Pesticides: Commercial Crop Cultivators’ Knowledge, Attitudes, and Practice Perspectives Regarding Pesticide Use. Front. Sustain. Food Syst. 2024, 8, 1490110. [Google Scholar] [CrossRef] [Scilit]
- INEGI. Censo de Población y Vivienda 2020; Instituto Nacional de Estadística y Geografía: Aguascalientes, Mexico, 2020; Available online: https://www.inegi.org.mx/programas/ccpv/2020/ (accessed on 6 May 2024).
- Moreno-Rodríguez, B.; Borroto-Penton, Y.; Peralta-Pelaez, L.A.; Martínez-Castellanos, G.; Peña-Montes, C.; González-Moreno, H.R. Characterization of Economic Activities in the Tecolutla River Basin, Mexico: A Focus on the Risk of Microplastics in the Production Chain. Microplastics 2026, 5, 69. [Google Scholar] [CrossRef] [Scilit]
- Napper, I.E.; Thompson, R.C. Release of synthetic microplastic plastic fibres from domestic washing machines: Effects of fabric type and washing conditions. Mar. Pollut. Bull. 2016, 112, 39–45. [Google Scholar] [CrossRef] [Scilit] [PubMed]
- Qi, R.; Tang, Y.; Jones, D.L.; He, W.; Yan, C. Occurrence and characteristics of microplastics in soils from greenhouse and open-field cultivation using plastic mulch film. Sci. Total Environ. 2023, 905, 166935. [Google Scholar] [CrossRef] [Scilit] [PubMed]
- Napper, I.E.; Wright, L.S.; Barrett, A.C.; Parker-Jurd, F.N.F.; Thompson, R.C. Potential microplastic release from the maritime industry: Abrasion of rope. Sci. Total Environ. 2022, 804, 150155. [Google Scholar] [CrossRef] [Scilit] [PubMed]
- INEGI. Marco Geoestadístico, December 2023; Instituto Nacional de Estadística y Geografía: Aguascalientes, Mexico, 2023; Available online: https://www.inegi.org.mx/temas/mg/ (accessed on 20 May 2024).
- Omoyajowo, K.; Raimi, M.; Waleola, T.; Odipe, O.; Ogunyebi, A. Public Awareness, Knowledge, Attitude, and Perception on Microplastics Pollution around Lagos Lagoon. Ecol. Saf. Balanc. Use Resour. 2021, 12, 35–46. [Google Scholar] [CrossRef] [Scilit]
- Yamane, T. Statistics: An Introductory Analysis, 2nd ed.; Harper & Row: New York, NY, USA, 1967; Available online: https://search.worldcat.org/title/299725866 (accessed on 15 May 2024).
- Ajzen, I. The theory of planned behavior. Organ. Behav. Hum. Decis. Process. 1991, 50, 179–211. [Google Scholar] [CrossRef] [Scilit]
- Li, D.; Li, P.; Shi, Y.; Sheerin, E.D.; Zhang, Z.; Yang, L.; Xiao, L.; Hill, C.; Gordon, C.; Ruether, M.; et al. Stress-induced phase separation in plastics drives the release of amorphous polymer micropollutants into water. Nat. Commun. 2025, 16, 3814. [Google Scholar] [CrossRef] [Scilit] [PubMed]

Disclaimer/Publisher’s Note: The statements, opinions and data contained in all publications are solely those of the individual author(s) and contributor(s) and not of MDPI and/or the editor(s). MDPI and/or the editor(s) disclaim responsibility for any injury to people or property resulting from any ideas, methods, instructions or products referred to in the content. |
© 2026 by the authors. Licensee MDPI, Basel, Switzerland. This article is an open access article distributed under the terms and conditions of the Creative Commons Attribution (CC BY) license.