


Abstract
Microplastic pollution has become a major concern for the environment in freshwater ecosystems due to its persistence, distribution, and impacts. However, research about microplastic pollution in the Illinois portion of the Mississippi River and its tributaries is still limited. This research examined the occurrence, geographical distribution, properties, and potential sources of microplastics in the Mississippi River and its major tributaries in Illinois. Surface water samples from 24 locations were collected and examined by stereomicroscopy to detect and quantify microplastics. The relationships between microplastic levels and physicochemical and land cover variables were examined using Spearman’s rank correlation. Microplastics were identified at every sampling site, with concentrations ranging from 4.5 to 76 particles per liter (average: 25.95 ± 18.15 particles/L), and fibers comprised over 71% of the total particles. Attenuated Total Reflectance-Fourier Transform Infrared (ATR-FTIR) analysis identified four types of polymers: nylon, polystyrene, polypropylene, and high-density polyethylene. Microplastic levels exhibited a negative correlation with dissolved oxygen (ρ = −0.617) and a direct correlation with pH (ρ = 0.500). The results include fundamental data about microplastic pollution at specific sites throughout the Illinois portion of the Mississippi River and emphasize possible correlations between microplastic levels, adjacent land cover, and water quality parameters.
1. Introduction
As plastic usage grows in modern civilization, the fragmentation of plastics into microplastics (MPs) has emerged as a major environmental issue [1]. Commercial plastic manufacturing commenced in the 1940s and has escalated significantly. Globally, plastic production increased from approximately 300 million metric tons in 2016 to about 400 million metric tons in 2022 and is projected to double by 2039 [2]. Numerous studies have demonstrated that plastic waste enters the marine environment annually in quantities ranging from 4.8 to 12.7 million tons, while freshwater systems get over 8 million tons worldwide [3,4]. The widespread availability of low-cost plastics since World War II has led to considerable environmental issues related to plastic pollution, especially with MPs in the marine environment [5,6]. Microplastics, as an emerging pollutant, have generated worldwide concern owing to their ubiquity and possible adverse effects on the ecosystem [7].
MPs, defined as plastic particles ranging from 1 µm to 5 mm, are present in diverse sizes [8]. The widespread occurrence of microplastics in the environment poses a substantial risk to global ecosystems, and scientific data suggests that their prevalence will persist in increasing in the next years [9]. The decomposition of plastics transpires at an exceedingly slow rate, making them a lasting environmental hazard once entering marine environments. Plastic entanglement and ingestion by marine birds, animals, fish, and reptiles result in injuries and fatalities [10]. Primary MPs, mostly sourced from industrial operations, form the fundamental elements of many plastic products. Instances of MPs, specifically within the micrometer size range, encompass polyethylene microbeads employed as exfoliants in skincare goods, plastic pellets used in industrial applications, and acrylic or polyester beads [1,11]. Secondary MPs originate from fibers or fragments produced by the degradation of larger plastic materials [12,13]. Fishing nets, line fibers, films, consumer goods, home items, industrial raw materials, and pellets or polymer fragments from biodegradable plastic that are intended to break apart in the environment are some of the sources of these fragments [14,15]. Subsequent actions to the release of studies identifying microbeads in personal care products encompassed global awareness initiatives, exemplified by the Beat the Bead Campaign from the Plastic Soup Foundation, scholarly articles [16], and legislative modifications, including bans on microbeads. Attenuated Total Reflectance–Fourier Transform Infrared (ATR-FTIR) spectroscopy has now become an important technique for chemical characterization and can be used to identify microplastic polymers and possible sources of these polymers. Common polymers include polypropylene (PP), polyethylene (PE), polystyrene (PS), polyamide (PA) and polyethylene terephthalate (PET), and have been observed frequently in freshwater environments, showing the broad occurrence and variable polymer composition of microplastics [4]. In 2018 and 2019, the United States (US), Canada, New Zealand, and the United Kingdom (UK) all banned the manufacturing, import, and sale of microbead-containing products. Many European countries, including Finland, France, Iceland, Ireland, Italy, Luxembourg, Norway, and Sweden, have implemented outright restrictions as of 2020 [17].
MPs were recognized at the 2016 Second Joint Environment Conference as a major global environmental concern and ranked second among key research priorities in ecology and environmental science [18]. Because MPs are becoming more common around the world, it is now very vital to study how they spread and act in freshwater river systems. Only in the last ten to fifteen years has research on the topic of microplastic pollution of freshwater been published [19]. For instance, Lambert and Wagner [20] reported that less than 4% of MPs research has concentrated on freshwater ecosystems. Regardless, most of the plastics that end up in the oceans come from rivers [21,22].
The Mississippi River is among the largest river systems in North America in terms of both length and drainage area. It is very essential for the United States’ regional hydrology, biodiversity, transportation, and economic growth. The river drains over 41% of the continental United States (US), traversing or bordering several states, thus sustaining varied aquatic ecosystems and providing water for industrial, agricultural, and municipal purposes. The Mississippi River is acknowledged as a significant source of MP contamination, with Di Mauro et al. [23] identifying elevated MP concentrations in the northern Gulf of Mexico, possibly attributable to the river. Due to the Mississippi River watershed’s vast urbanization, industrialization, navigation, and agricultural practices, it is under a lot of anthropogenic pressure and is therefore especially susceptible to contamination. Human-induced changes in land use, particularly for agricultural and urban development, often contribute to the decline in water quality [24]. Microplastic pollution has been increasingly reported in freshwater and riverine environments, with previous studies showing large spatial and temporal variation in microplastic concentration [19,20,25]. In addition, the studies on U.S. river systems indicated that the microplastic distribution may be affected by the wastewater inputs, watershed characteristics, hydrological conditions and river management [26,27,28]. Microplastics have also been detected in the Mississippi River system, with differences in occurrence and distribution under various environmental conditions [29]. But there is not a lot of information about the Illinois reach of the Mississippi River and its main tributaries. This is especially true when it comes to the connections between the amount of microplastic in the water, the land cover around it, the physicochemical quality of the water, and the effects of the tributaries. Addressing these factors collectively can provide useful starting points for figuring out where microplastics are found and where they might be coming from in this part of the river system. The features of land use and land cover have a crucial effect in defining where MPs in riverine environments originate as well as how they are dispersed geographically as well. Microplastic pollution in streams across the Midwestern United States is an increasing problem, but its connections to land use and possible ecological and human health consequences are little understood [25]. The integration of land use data with geospatial analysis provides an effective approach for pinpointing probable source sites and improving understanding of microplastic contributions associated with urban, agricultural, and industrial activities along vast river systems.
The primary objectives of this study are to: (1) determine the concentrations of microplastics in river water at 24 locations along the Mississippi River and its tributaries using filtration and microscopic identification techniques; (2) identify the principal sources of microplastics in the Mississippi River, including industrial, agricultural, and urban operations; (3) use Geographic Information Systems (GIS) to map the Mississippi River’s microplastics geographical distribution; (4) investigate differences in microplastic levels upstream, in tributaries, and downstream of specified tributary confluence; (5) evaluate the comparative microplastic pollution at various sampling sites by using the contamination factor (CF) and pollution load index (PLI).
In accordance with these aims, the subsequent hypotheses were evaluated: microplastic levels are significantly correlated with adjacent land-use features, with higher concentrations expected in areas with greater urban and industrial land cover. Microplastic levels are significantly correlated with physicochemical water-quality parameters, especially pH and dissolved oxygen.
2. Materials and Methods
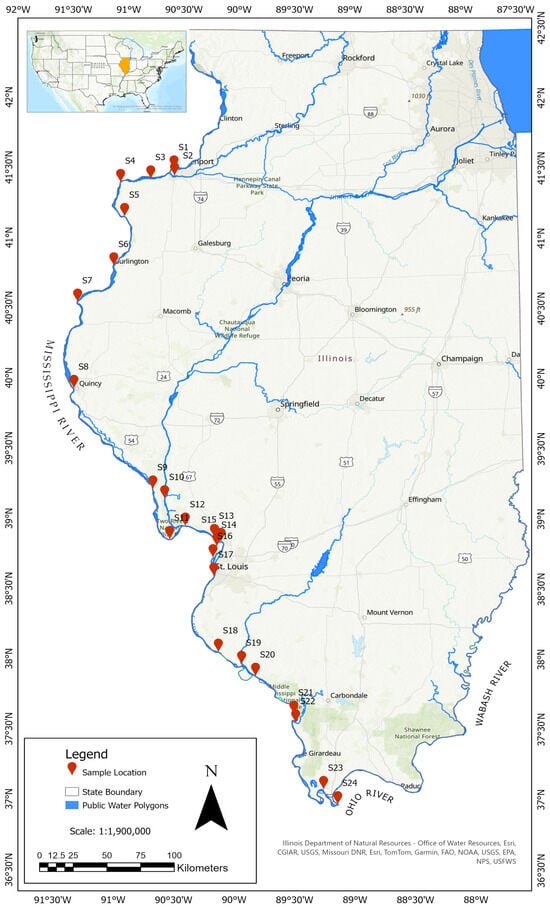
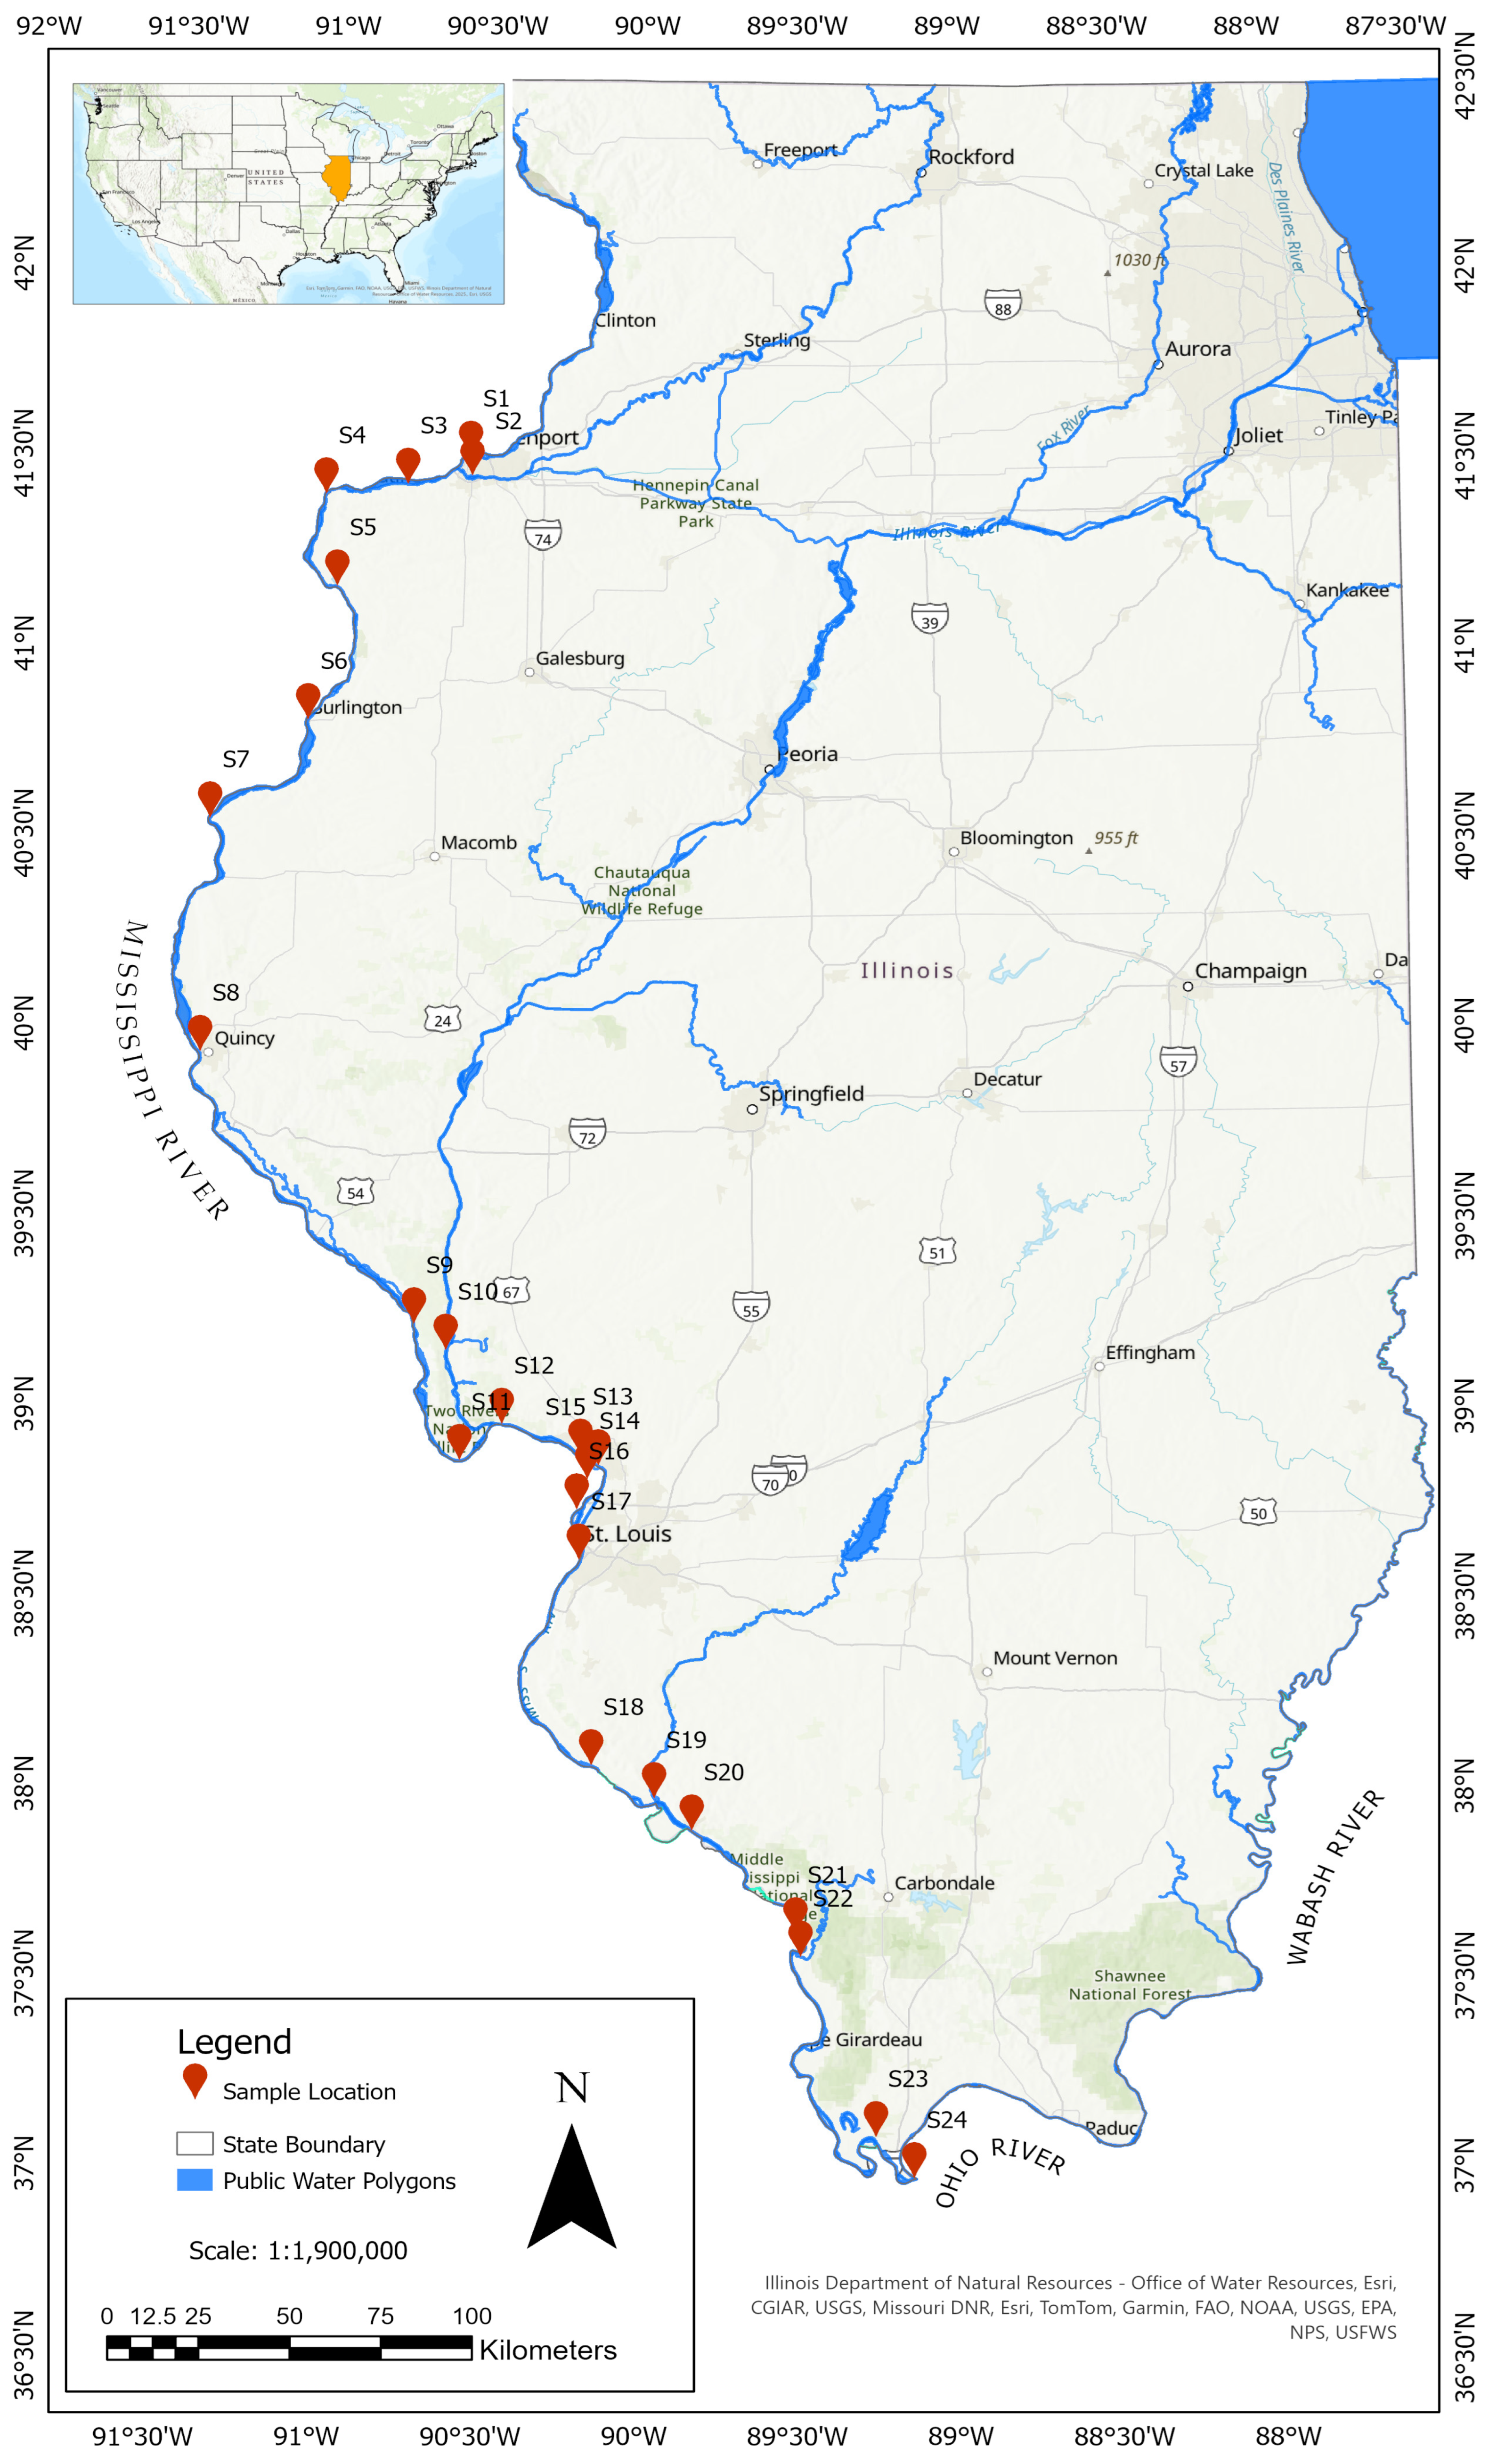
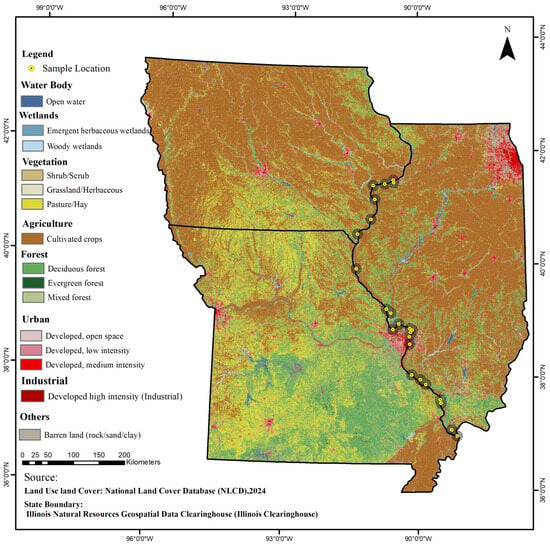
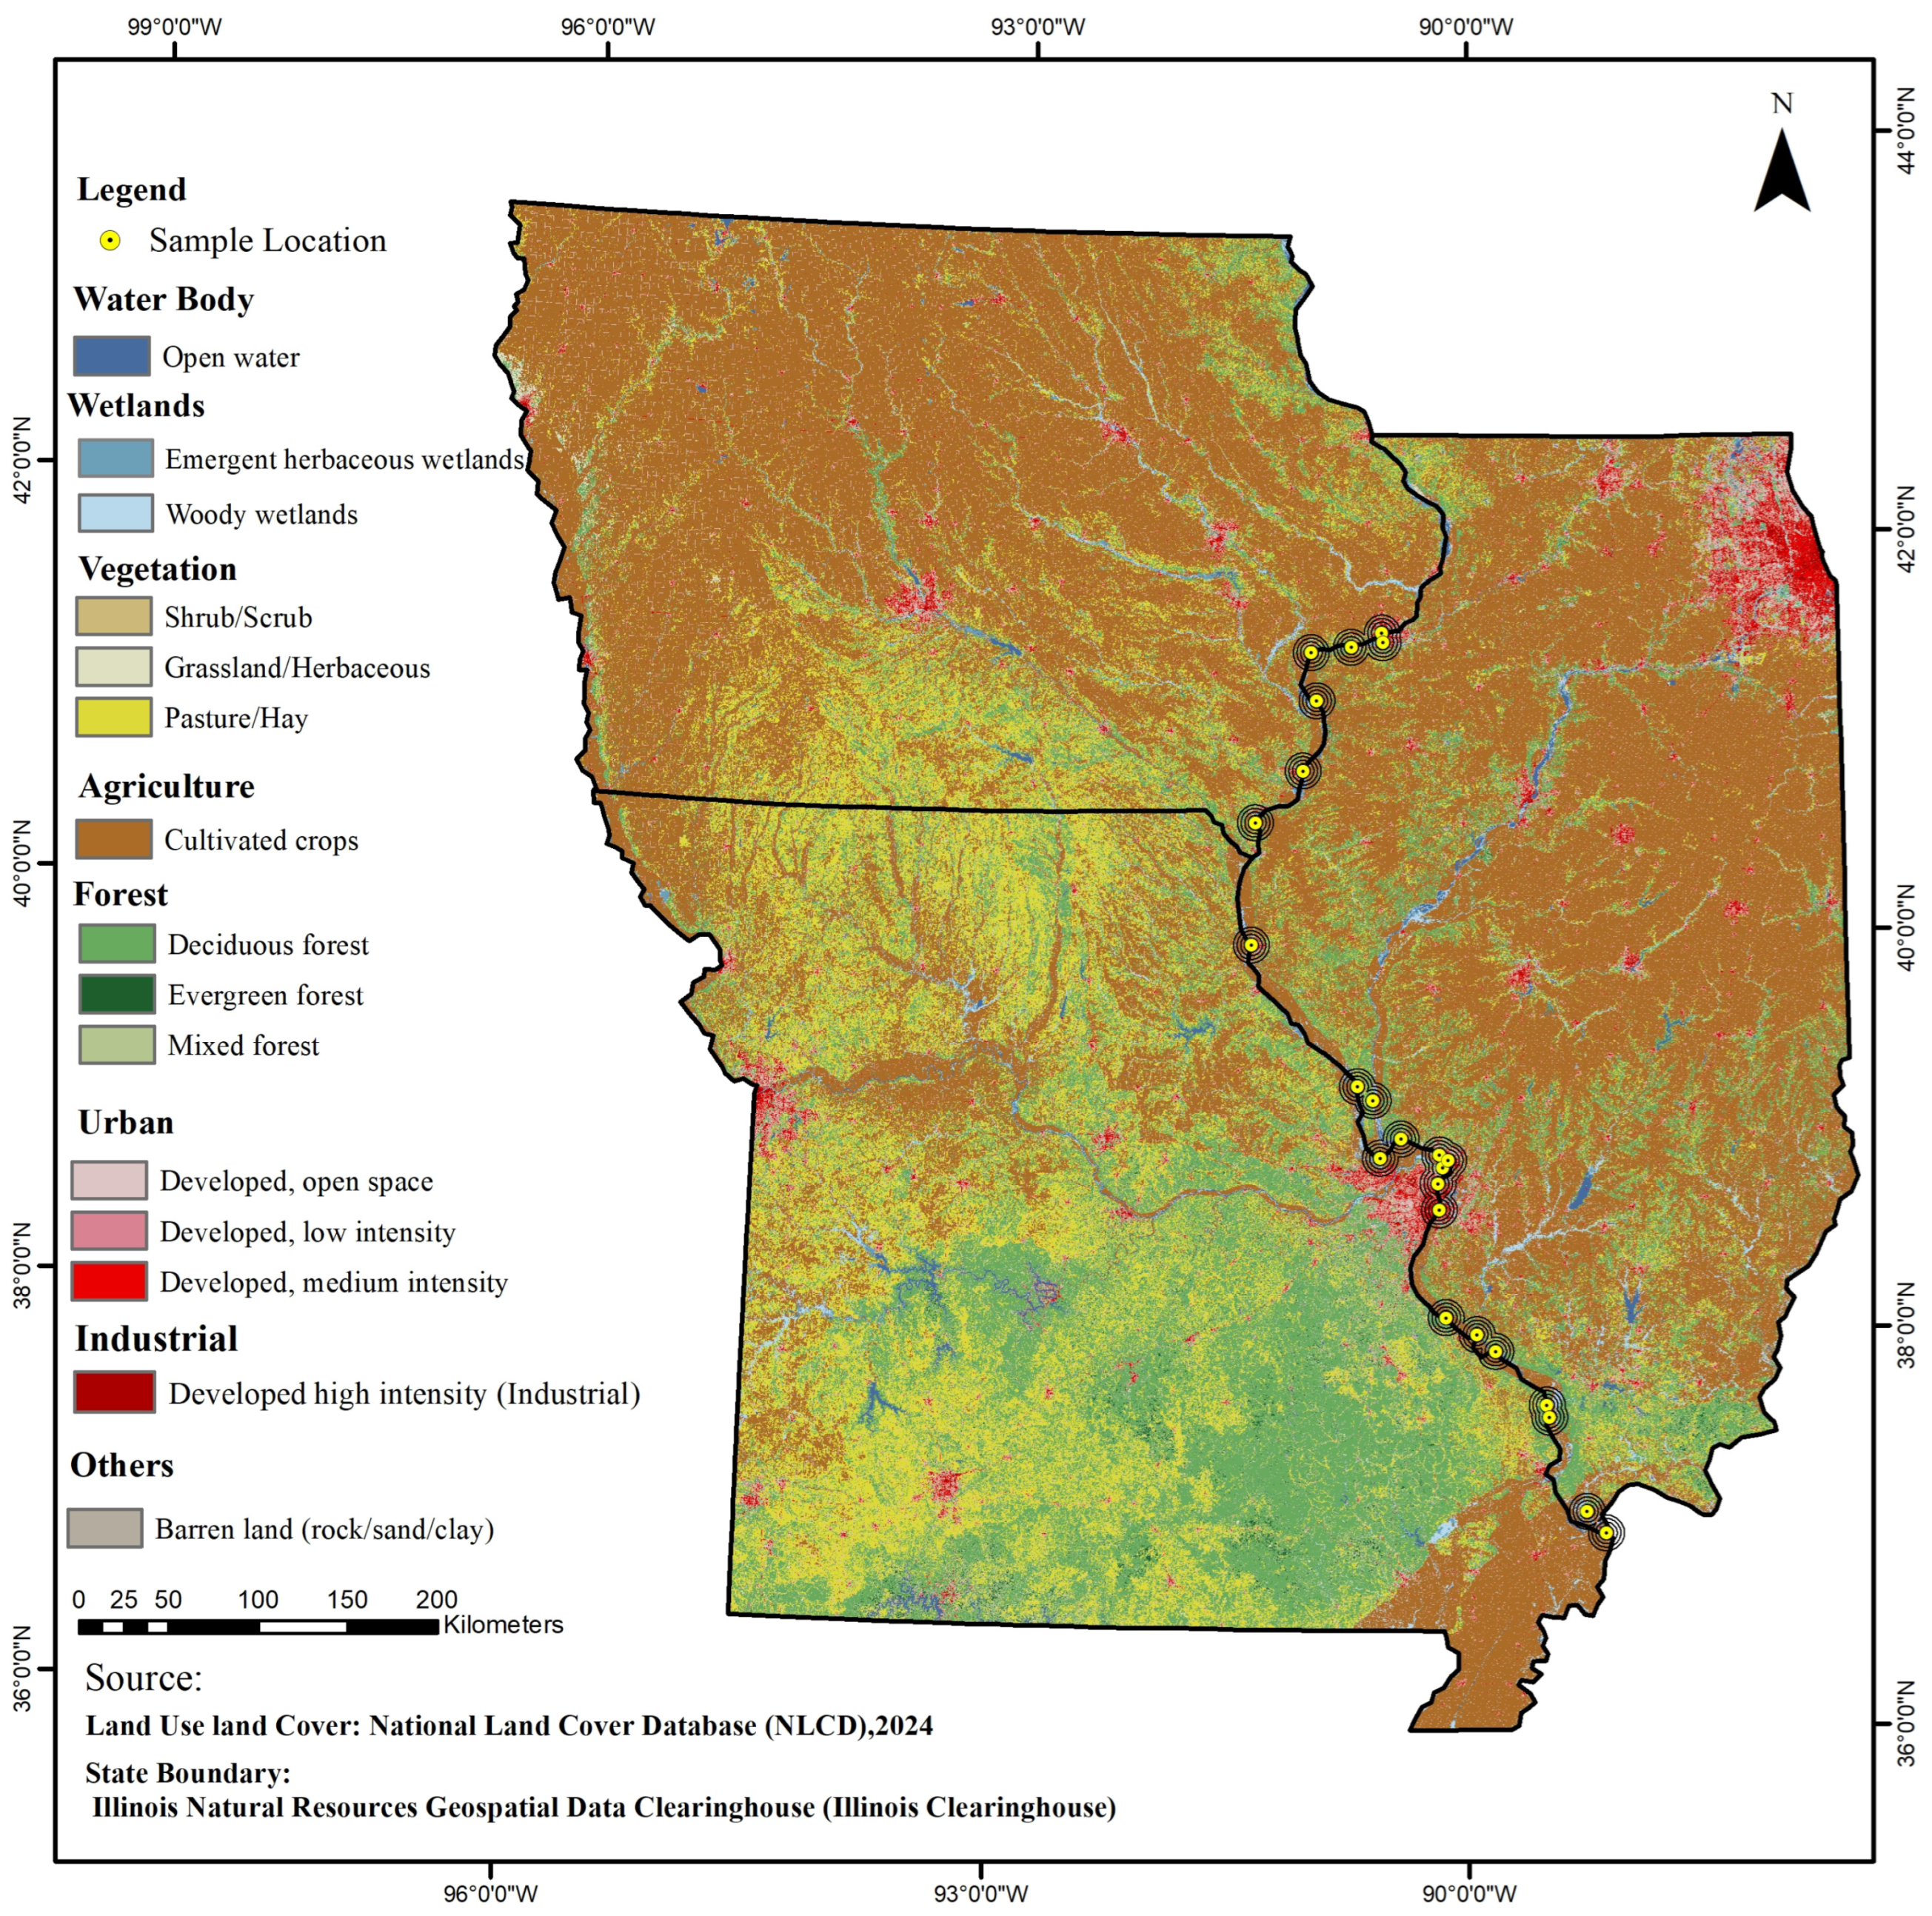
This study was conducted in Illinois, a Midwestern state in the United States, at 24 sampling sites selected along the Mississippi River and its tributaries (Figure 1). Geographic coordinates and site information were recorded using a Global Positioning System (GPS)-enabled mobile application (Google Maps ©2025 Google LLC, Version 26.29.01.946673643) (Supplementary Materials), and all sample-related data were stored in a cloud-based database (Google Drive). Of the 24 sites, six were located along major tributaries, including the Rock River, Illinois River, Missouri River, Kaskaskia River, Big Muddy River, and Cache River, while the remaining 18 sites were distributed along the main channel of the Mississippi River.
Figure 1.
Map of the study area showing the sampling locations within the Mississippi River system in Illinois, USA.
The 24 sampling locations were chosen to ensure spatial representation along the Illinois portion of the Mississippi River and to represent significant tributary connections with varying land-use patterns. Six locations were identified along significant tributaries, whereas the other 18 locations were chosen along the primary channel of the Mississippi River. The selection of the site also considered accessibility and reliable conditions for surface-water sampling. The locations were not predetermined as exclusively urban, industrial, agricultural, or reference sites; rather, variations in related land cover attributes were quantitatively assessed utilizing the land cover analysis outlined in Section 2.4.
2.1. Sample Collection
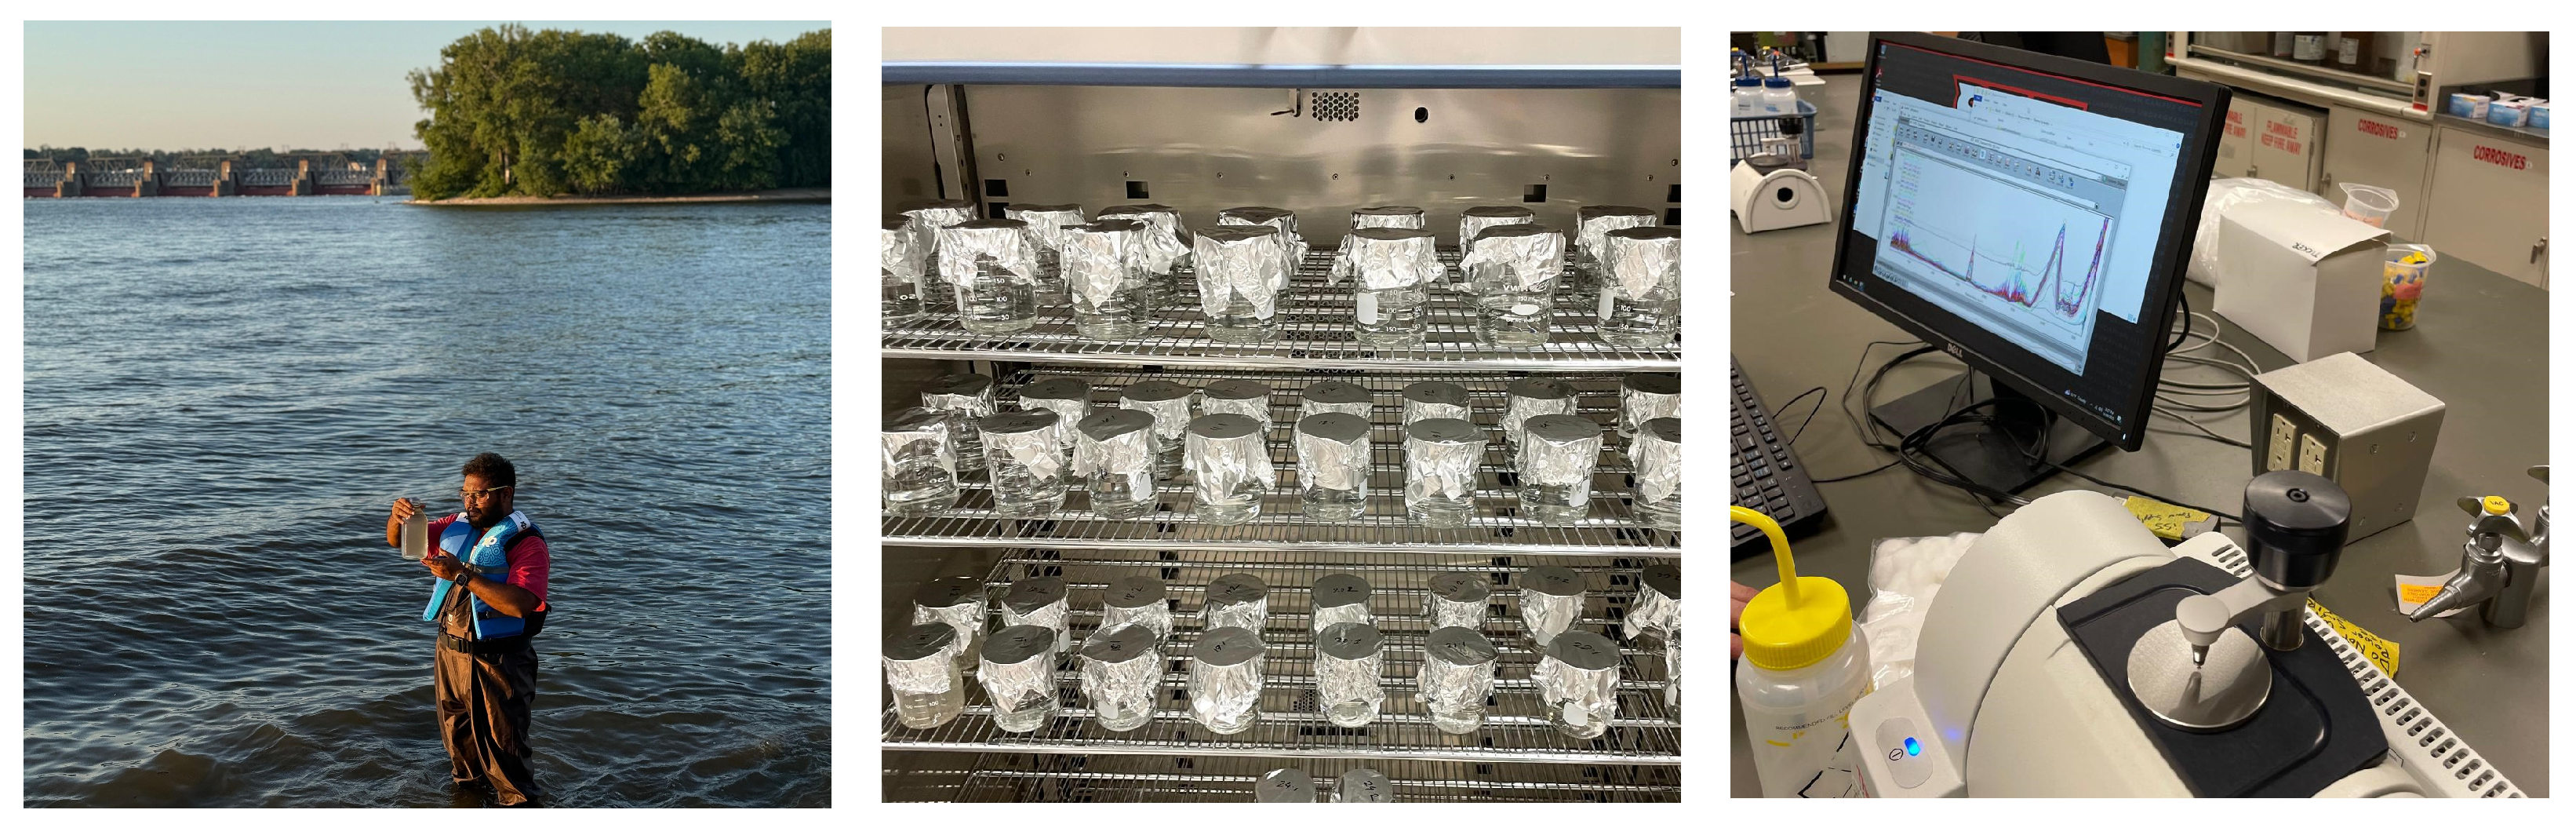
To evaluate microplastic pollution in the study area, surface water samples were collected from designated sites on three occasions: 4 July 2025 (S1–S8), 17 July 2025 (S9–S17), and 24 July 2025 (S18–S24). At each sampling site, two replicate 1 L [26] grab samples of surface water were collected at each chosen site using pre-cleaned glass bottles [30,31] at a depth of about 0.5–0.6 m [32] below the water surface (Figure 2). Sampling was conducted on three separate days in July 2025 to encompass all 24 locations. Due to the sampling of different locations on each day, it was impossible to identify temporal variation from spatial variation. Consequently, the findings illustrate spatial distributions observed during the July 2025 sampling period, and it is advisable to conduct repeated seasonal sampling in further studies.
Figure 2.
Photographs illustrating the procedures used for microplastic analysis: collecting samples from surface water (left), sample processing in the lab (middle), and polymer identification using Attenuated Total Reflectance–Fourier Transform Infrared (ATR–FTIR) spectroscopy (right).
Field sampling was conducted following the methodology outlined by the National Oceanic and Atmospheric Administration (NOAA) Marine Debris Program [33]. To minimize contamination during sampling, all equipment was thoroughly rinsed with distilled water prior to use, samples were immediately covered after collection, and the use of plastic sampling materials was minimized wherever possible. In addition, duplicate samples were collected at each site to ensure analytical reliability and reproducibility. At each sampling site, physicochemical parameters including dissolved oxygen (DO), pH, electrical conductivity (EC), and total dissolved solids (TDS) were measured in situ using calibrated portable multiparameter instruments. Dissolved oxygen (DO) was measured using an Accumet Basic AB40 (S/N: AB92343420; Fisher Scientific, Waltham, MA, USA), while pH, EC, and TDS were measured using an Accumet AB200 multiparameter meter (S/N: AB92343134; Fisher Scientific, Waltham, MA, USA).
2.2. Sample Processing, Filtration, and Microscopic Identification
To get rid of significant pieces of trash and large particles, the water samples were first put through a 5 mm stainless-steel sieve [29]. To keep the larger microplastic particles, the samples were next put through a 250 µm stainless-steel filter. The sieve was thoroughly rinsed with distilled water to ensure complete recovery of all retained particles.
Hydrogen peroxide (H2O2) digestion was employed to remove organic contaminants while preserving the integrity of plastic particles. Oxidative digestion is widely used in freshwater microplastic studies because it effectively degrades organic matter with minimal alteration to polymer structure [14]. This investigation involved treating samples with 30% H2O2 and incubating them at 60 °C for 24 h to achieve full decomposition of organic substance (Figure 2). The resulting solutions were then vacuum filtered through Omicron glass fiber filter membranes with a pore size of 0.45 µm to capture smaller microplastic particles [26].
Possible particles of microplastic were visually recognized and categorized based on morphological features with a stereomicroscope (Ken-A-Vision T-26021C, Ken-A-Vision Manufacturing Co., Kansas City, MO, USA). The device features 20× eyepieces with a zoom range of 0.7× to 4.5×, resulting in an overall magnification of around 10.5× to 67.5×. This facilitates comprehensive investigation of particle shape. Microplastic particles in the water samples were categorized into classes including films, fragments, fibers, foams, pellets, and other forms of plastic debris, using the NOAA approach [34]. Microplastics were quantified manually and documented as particles per liter (particles/L) in accordance with standardized reporting procedures.
2.3. Polymer Identification Using ATR-FTIR
Analyses were performed using a Thermo Scientific Nicolet iS5 FT-IR spectrometer equipped with an iD7 ATR accessory (Thermo Fisher Scientific, Waltham, MA, USA) (Figure 2). Spectra were collected over a wavenumber range of 4000–500 cm−1 at a spectral resolution of 4 cm−1.
A background scan was performed before each measurement to ensure spectral accuracy and minimize instrumental noise. To prevent cross-contamination, the ATR crystal surface was cleaned with 70% isopropanol between samples. The resulting FTIR spectra were processed, visualized, and interpreted using Origin 2026 software. ATR–FTIR analysis was conducted directly on the filtered samples generated from all 48 water samples, which included duplicate samples from the 24 sampling sites. Each filter underwent a singular analysis, and individual particles were not separately extracted for FTIR examination.
2.4. Land Cover (LC) Analysis
The spatial variation among sample locations was illustrated by generating spatial distribution maps of microplastic abundance using ArcGIS 10.8.2 (Esri, Redlands, CA, USA). The spatial distribution patterns were analyzed and the correlation between the sample locations and the surrounding land cover (LC) within the defined buffer zones was assessed using Geographic Information System (GIS) approaches. Land cover data were derived from the 2024 National Land Cover Database (NLCD) [35]. Land cover features (built land, agricultural land, forest and wetlands) around the sampling sites were evaluated using buffer zones of 1 km, 2 km and 10 km around each site (Figure 3). The experiments were aimed at characterizing the land-use mix around each location and examining its link with microplastic dispersion [25].
Figure 3.
Land cover classes spatial distribution within buffer zones of 1, 2, and 10 km around sampling sites.
The buffer distances of 1, 2, and 10 km were chosen to investigate the effects of land cover at varying spatial scales, indicating local, intermediate, and extensive bordering conditions, respectively. This multi-scale methodology facilitated the examination of how the correlations between land cover and microplastic prevalence varied with increasing distance from the sampling sites.
2.5. Statistical Analysis
An investigation was performed to assess the geographical distribution and correlations of microplastic pollution within the research area. Microsoft Excel was utilized for the preliminary categorization and display of microplastic abundance (particles/L). Descriptive statistics, including mean, standard deviation (SD), and coefficient of variation (CV%), were computed to delineate geographic diversity among sampling locations. R (version 4.4.2) was used in RStudio (version 2024.12.1+563) to perform a Spearman’s rank correlation analysis. Spearman’s rank correlation coefficient (ρ) was utilized to evaluate the connections between microplastic concentrations and physicochemical parameters, such as pH, dissolved oxygen (DO), electrical conductivity (EC), and total dissolved solids (TDS). This non-parametric technique was chosen for its appropriateness for environmental datasets that may not conform to normality assumptions [36], and it was employed to assess the direction and strength of monotonic correlations among variables. Statistical significance was established at a 95% confidence level (p < 0.05).
2.6. Microplastic Contamination Assessment
In order to offer thorough visualization and analysis of the ecological risks associated with microplastic contamination, researchers have created dependable and flexible risk assessment approaches [37]. Ecological risk indices function as diagnostic instruments for evaluating pollution levels and pinpointing water bodies or individual pollutants necessitating management intervention [38]. This study employed contamination factors (CF) and the pollution load index (PLI) to assess the degree of microplastic contamination. The integration of CF and PLI establishes a systematic framework for estimating pollution levels and evaluating related ecological concerns. While CF and PLI were initially designed for conventional pollutants, these measurements have since been modified for use in microplastic research to evaluate contamination comparatively. In this research, CF and PLI were utilized as preliminary indicators of comparative microplastic pollution across sampling sites instead of being recognized as validated assessments of ecological threat.
Contamination factor (CF) was determined utilizing the following formula.
where
- = Measured abundance of microplastics at a given sampling site (particles/L).
- = Background or baseline concentration of microplastics in the study area.
The lowest detected microplastic content (4.5 particles/L) was used as the baseline value () since there was no prior background data available for the research region [9]. Analogous methodologies have been used in microplastic risk evaluations in the absence of historical baseline data [39,40]. Since no recognized baseline concentration of microplastics was available in the study area, the minimum recorded concentration was used as the baseline. Therefore, CF and PLI values derived should be interpreted as relative indicators within the given dataset and not as standardized ecological-risk thresholds. The categorization of the contamination factor (CF) and its associated risk categories are detailed in Table 1.
Table 1.
Contamination factor (CF) index classification of water quality [9].
Pollution load index (PLI) was determined utilizing the following formulas [37,41].
where
PLI = (CF1 × CF2 × CF3 × … × CFn)1/n
PLIZone = (PLI1 × PLI2 × PLI3 × … × PLIn)1/n
- = Contamination factor for each sampling site.
- = Total number of sampling sites.
- PLIZone = PLI for the study area.
The PLI shows the total amount of microplastic pollution at each sample site and gives a complete picture of the contamination status [42,43].
The PLI was estimated in accordance with the contamination factor-based technique as stated in earlier pollution assessment studies [44]. The PLI values were classified to interpret microplastic contamination, in accordance with the risk classifications often used in microplastic studies [34]. The PLI risk categorization is shown in Table 2.
Table 2.
The pollution load index (PLI) classification of water quality [30].
2.7. Quality Assurance and Quality Control (QA/QC)
Quality assurance and quality control (QA and QC) procedures were implemented throughout field sampling, laboratory processing, polymer identification, and data analysis to minimize contamination and ensure data reliability. All experimental techniques conformed to the contamination prevention standards established by Masura et al. [33]. Laboratory blank samples using distilled water were prepared and analyzed following identical protocols as the environmental samples to evaluate possible contamination during sample preparation. The blank filters were examined under the stereomicroscope using the same visual identification standards as for the environmental samples. No suspected microplastic particles were detected in the control samples, indicating that no measurable laboratory contamination occurred during sample handling. Pre-cleaned glass containers were used, equipment was well cleaned with distilled water, and plastic materials were avoided throughout sample processing to reduce potential contamination. These QA and QC protocols were used throughout this study to reduce operational and environmental contamination and to assure the validity of the reported microplastic findings.
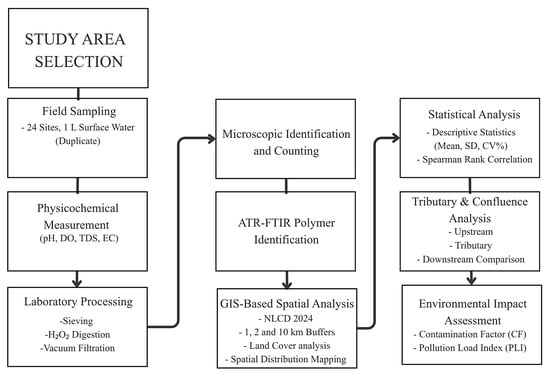
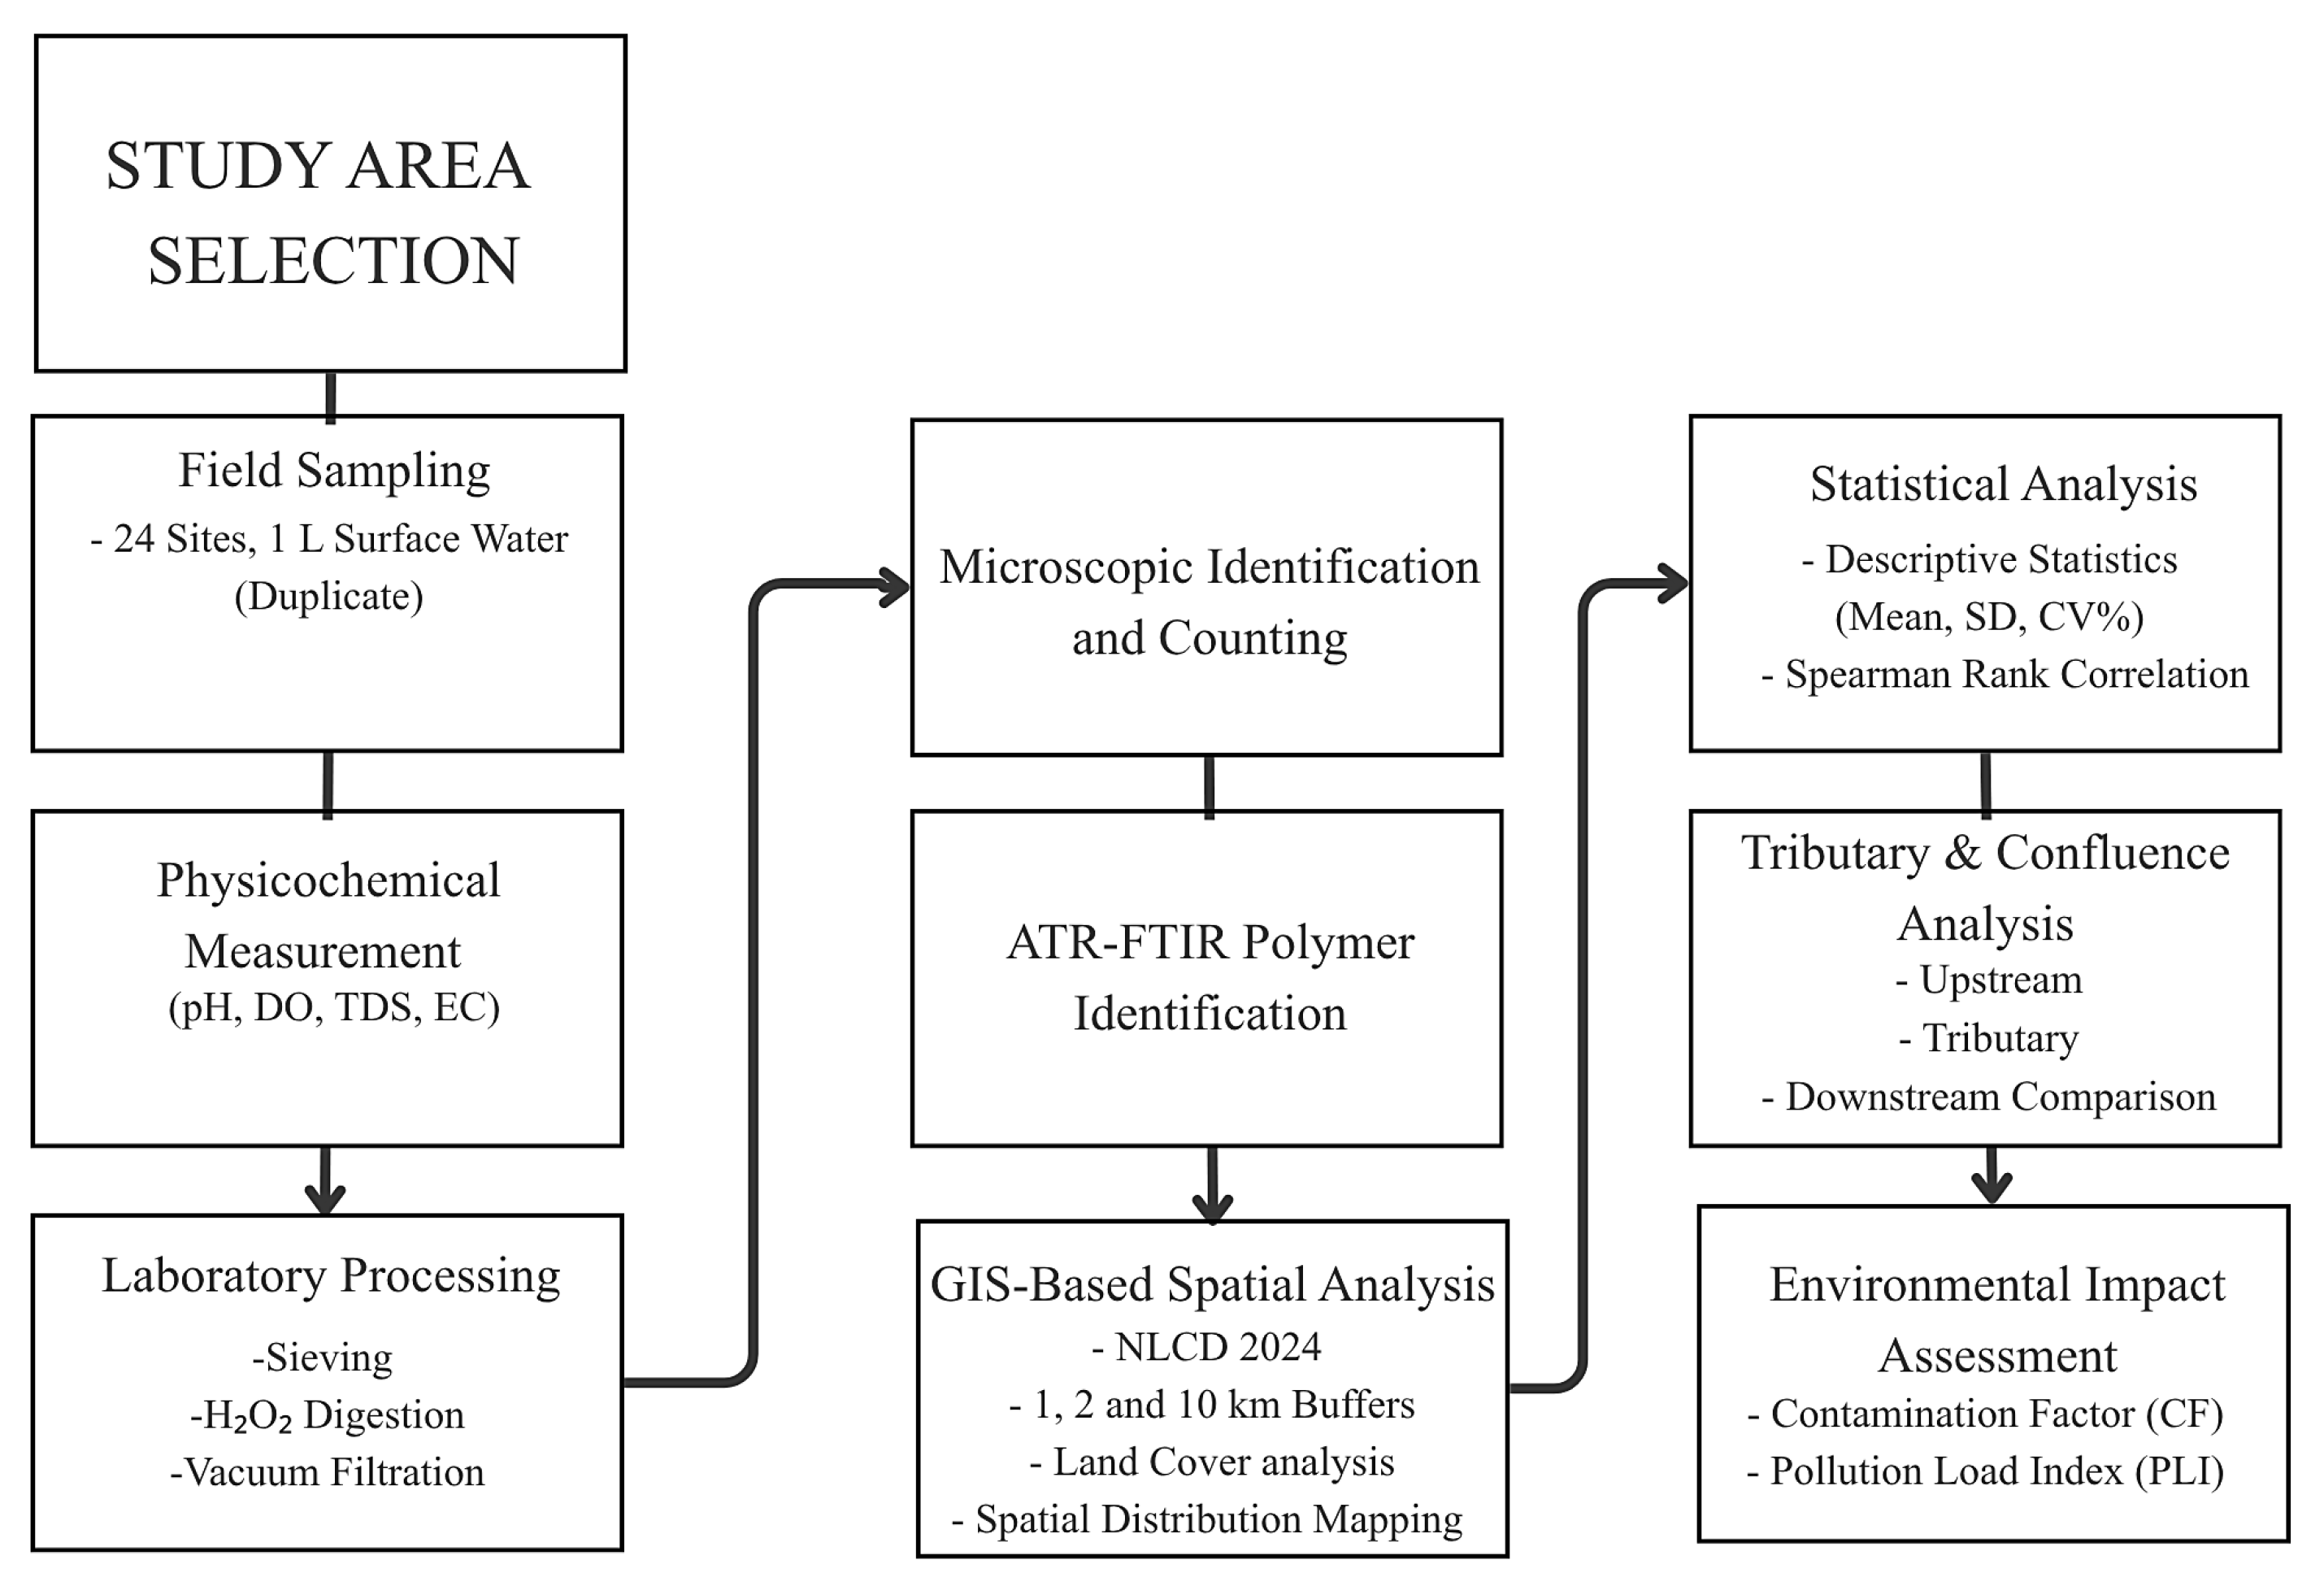
Figure 4 summarizes the overall methodological workflow used in this study, including field sampling, laboratory sample processing, microscopic identification of microplastics, polymer characterization using ATR–FTIR spectroscopy, GIS-based spatial analysis, statistical analysis, and environmental risk assessment.
Figure 4.
The overall methodological workflow of this study comprises field sampling, laboratory sample processing, microscopic identification of microplastics, polymer characterization using ATR–FTIR spectroscopy, GIS-based spatial analysis, statistical analysis, and environmental risk assessment.
3. Results
3.1. Spatial Distribution of Microplastics
The descriptive statistics of MPs and critical physicochemical parameters that were evaluated in the water samples from the study area are presented briefly in Table 3. Microplastic concentrations showed significant heterogeneity among the sample locations, with values spanning from 4.5 to 76 particles/L and an average concentration of 25.95 particles/L. The elevated standard deviation (18.15) and coefficient of variation (69.94%) signify substantial regional variability in microplastic dispersion, implying the impact of discrete sources or differing environmental circumstances.
Table 3.
Statistical properties of microplastics (MPs) and concentrations of physicochemical parameters in water samples.
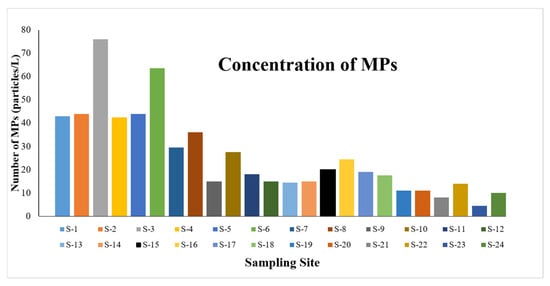
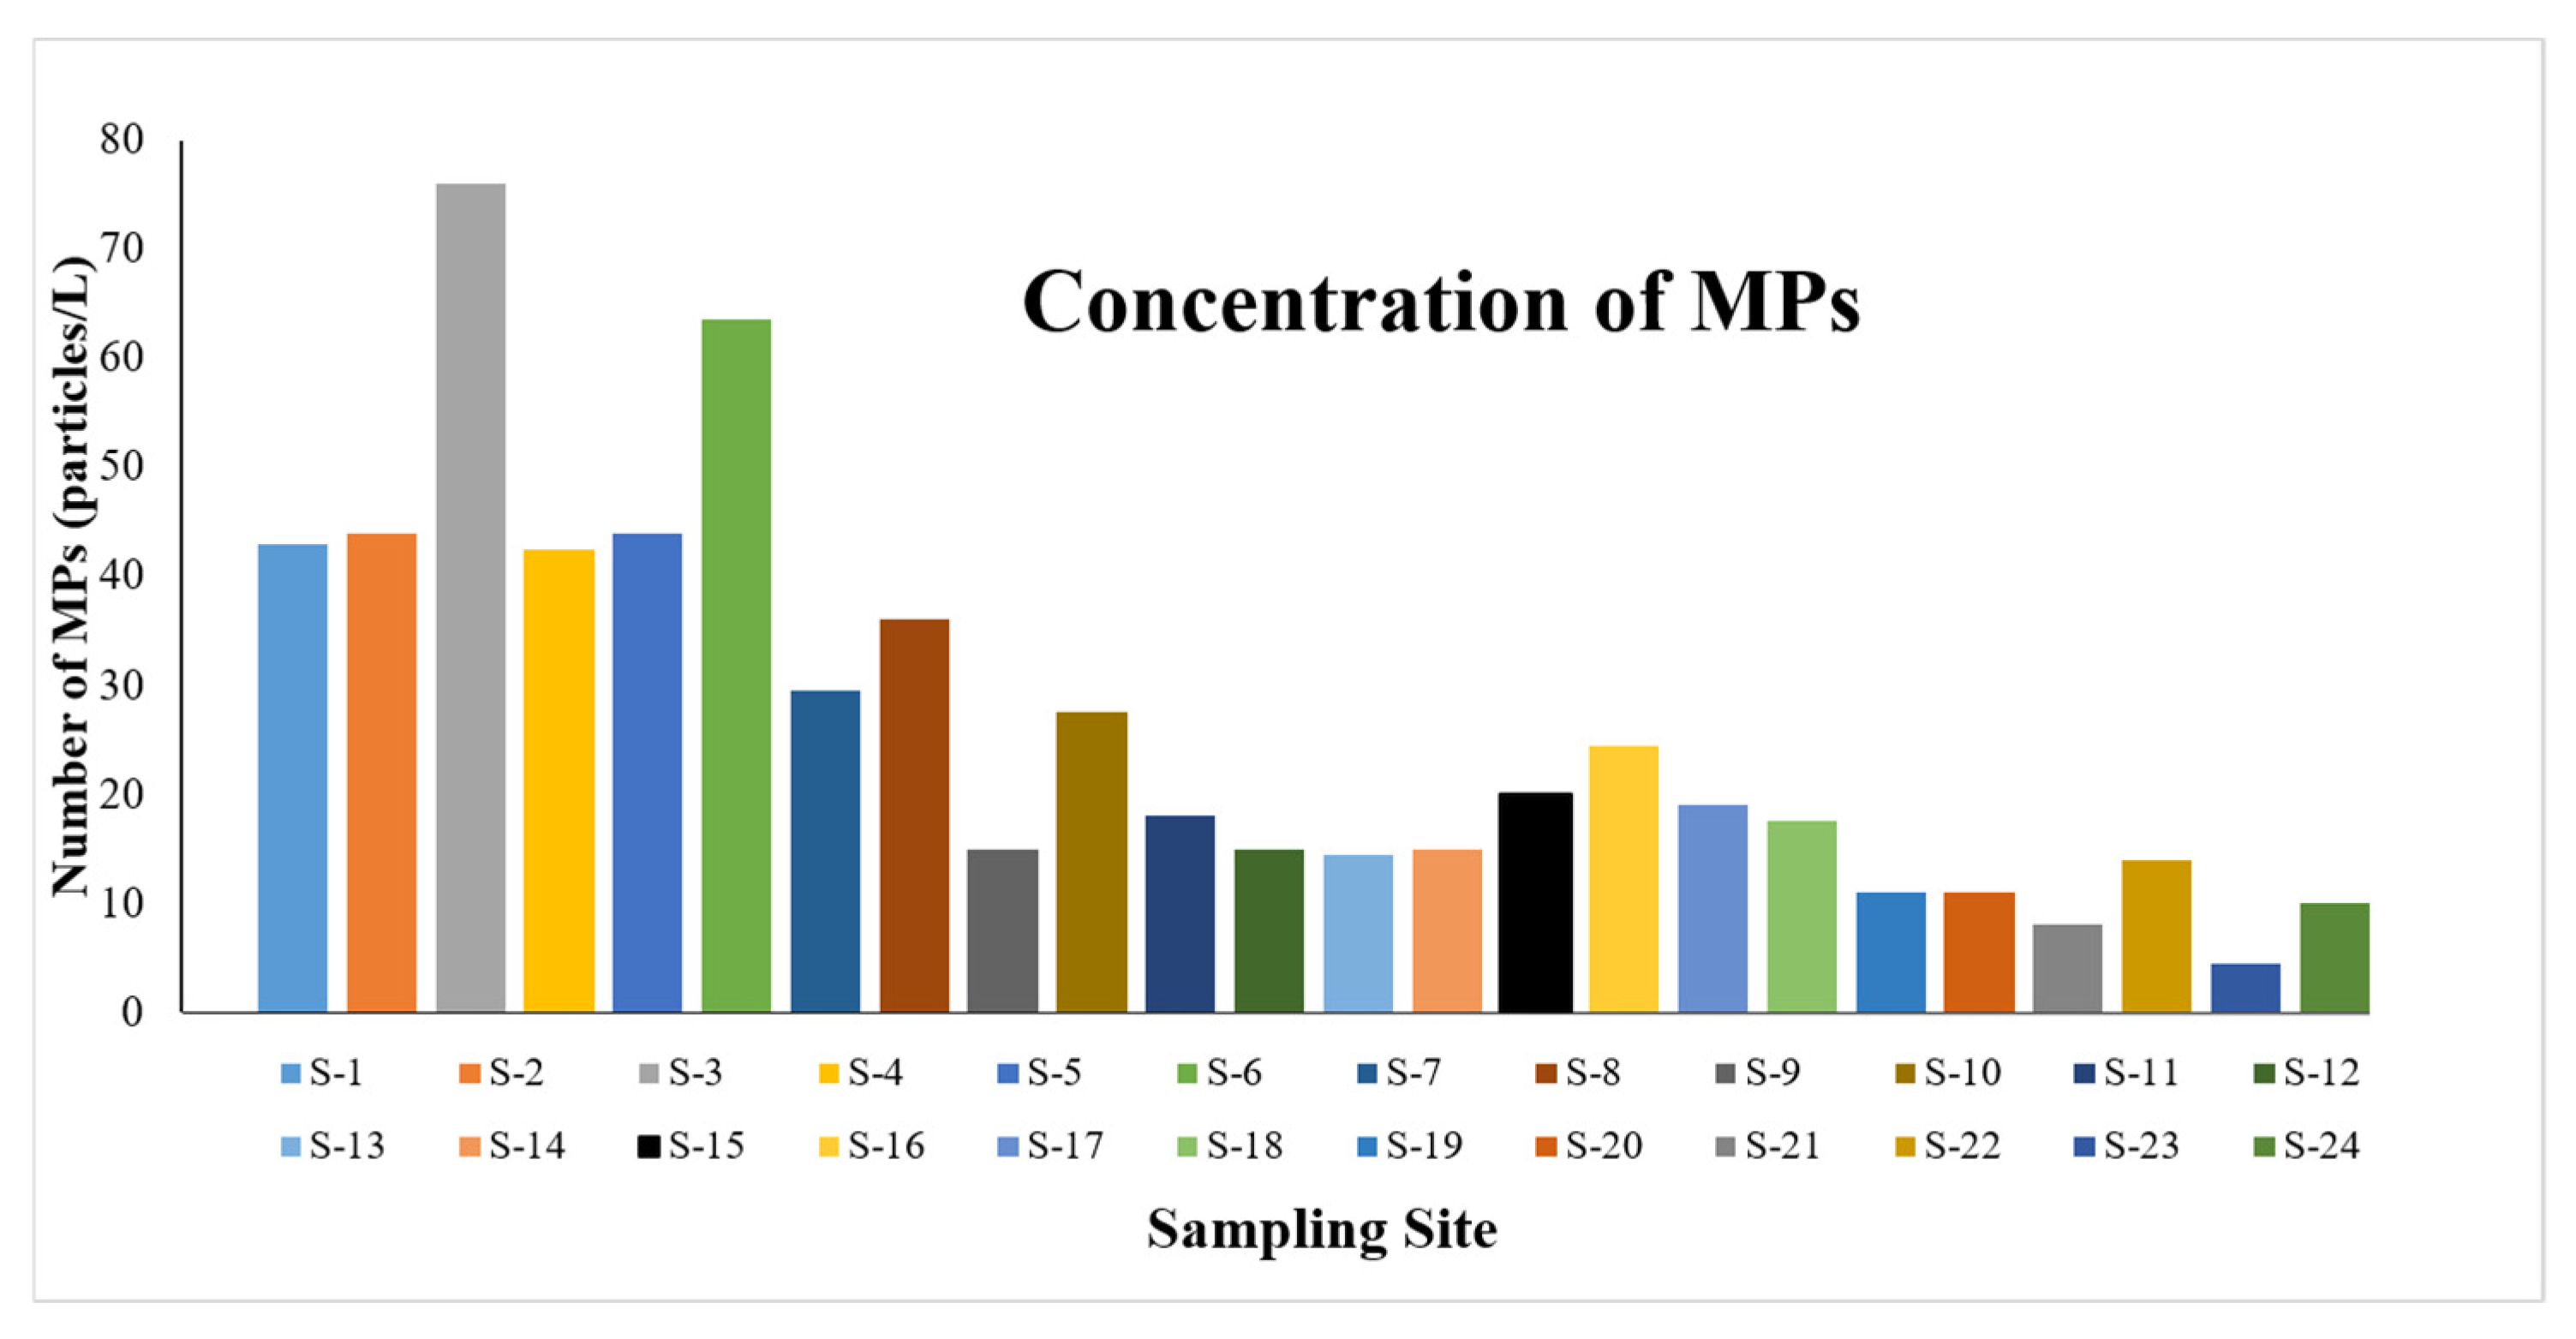
Figure 5 illustrates the occurrence of microplastics in water samples obtained from the Mississippi River and its confluences. Site S-3 exhibited the highest abundance, with 76 particles/L, followed by S-6 (63.5 particles/L). Relatively high concentrations were also observed at S-2 (44 particles/L), S-5 (44 particles/L), S-1 (43 particles/L), and S-4 (42.5 particles/L). Moderate concentrations were recorded at S-8 (36 particles/L), S-7 (29.5 particles/L), S-10 (27.5 particles/L), and S-16 (24.5 particles/L). Lower concentrations were observed at S-15 (20 particles/L), S-17 (19 particles/L), S-11 (18 particles/L), and S-18 (17.5 particles/L), while the lowest value was recorded at S-23 (4.5 particles/L). Urban runoff, industrial operations, and tributary inputs are the primary mechanisms by which microplastics enter river systems. These activities may contribute to elevated concentrations of microplastics in specific locations. Comprehensive recording of comparable geographical distributions indicates notable disparities in microplastic prevalence between regions, resulting from variations in land use, population density, and anthropogenic activities [27,45]. Increased concentrations have been seen in metropolitan areas, wastewater discharge sites, and river confluences, underscoring the significance of catchment-specific processes in regulating microplastic dispersion [28,46]. The significantly increased microplastic levels found in the upstream area, especially at S-3 and S-6, might indicate the cumulative impact of regional land-use practices and tributary contributions rather than a consistent upstream land cover configuration. The composition of land cover differed between sample locations and buffer distances (Figure 3), suggesting that the detected microplastic distribution cannot be related to a single land cover category. Urban runoff, industrial activities, and wastewater effluents may lead to localized microplastic contributions [27,28,45,46], while tributaries might furthermore affect the transfer of microplastics into the main channel [47,48,49]. The higher microplastic concentrations observed at the Rock River confluence indicate a possible influence from tributary contributions. Consequently, the higher microplastic concentrations observed in the upstream area may reflect the cumulative influence of multiple local factors rather than land cover alone.
Figure 5.
Concentration of microplastics in water samples.
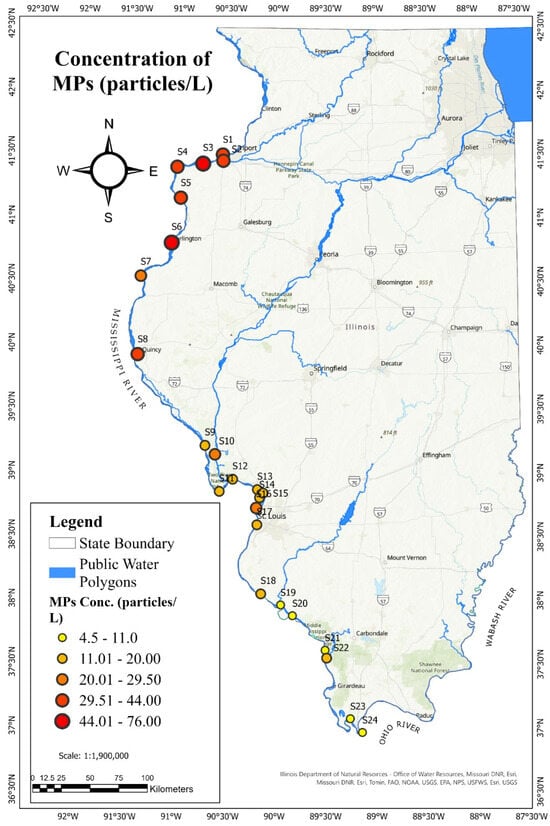
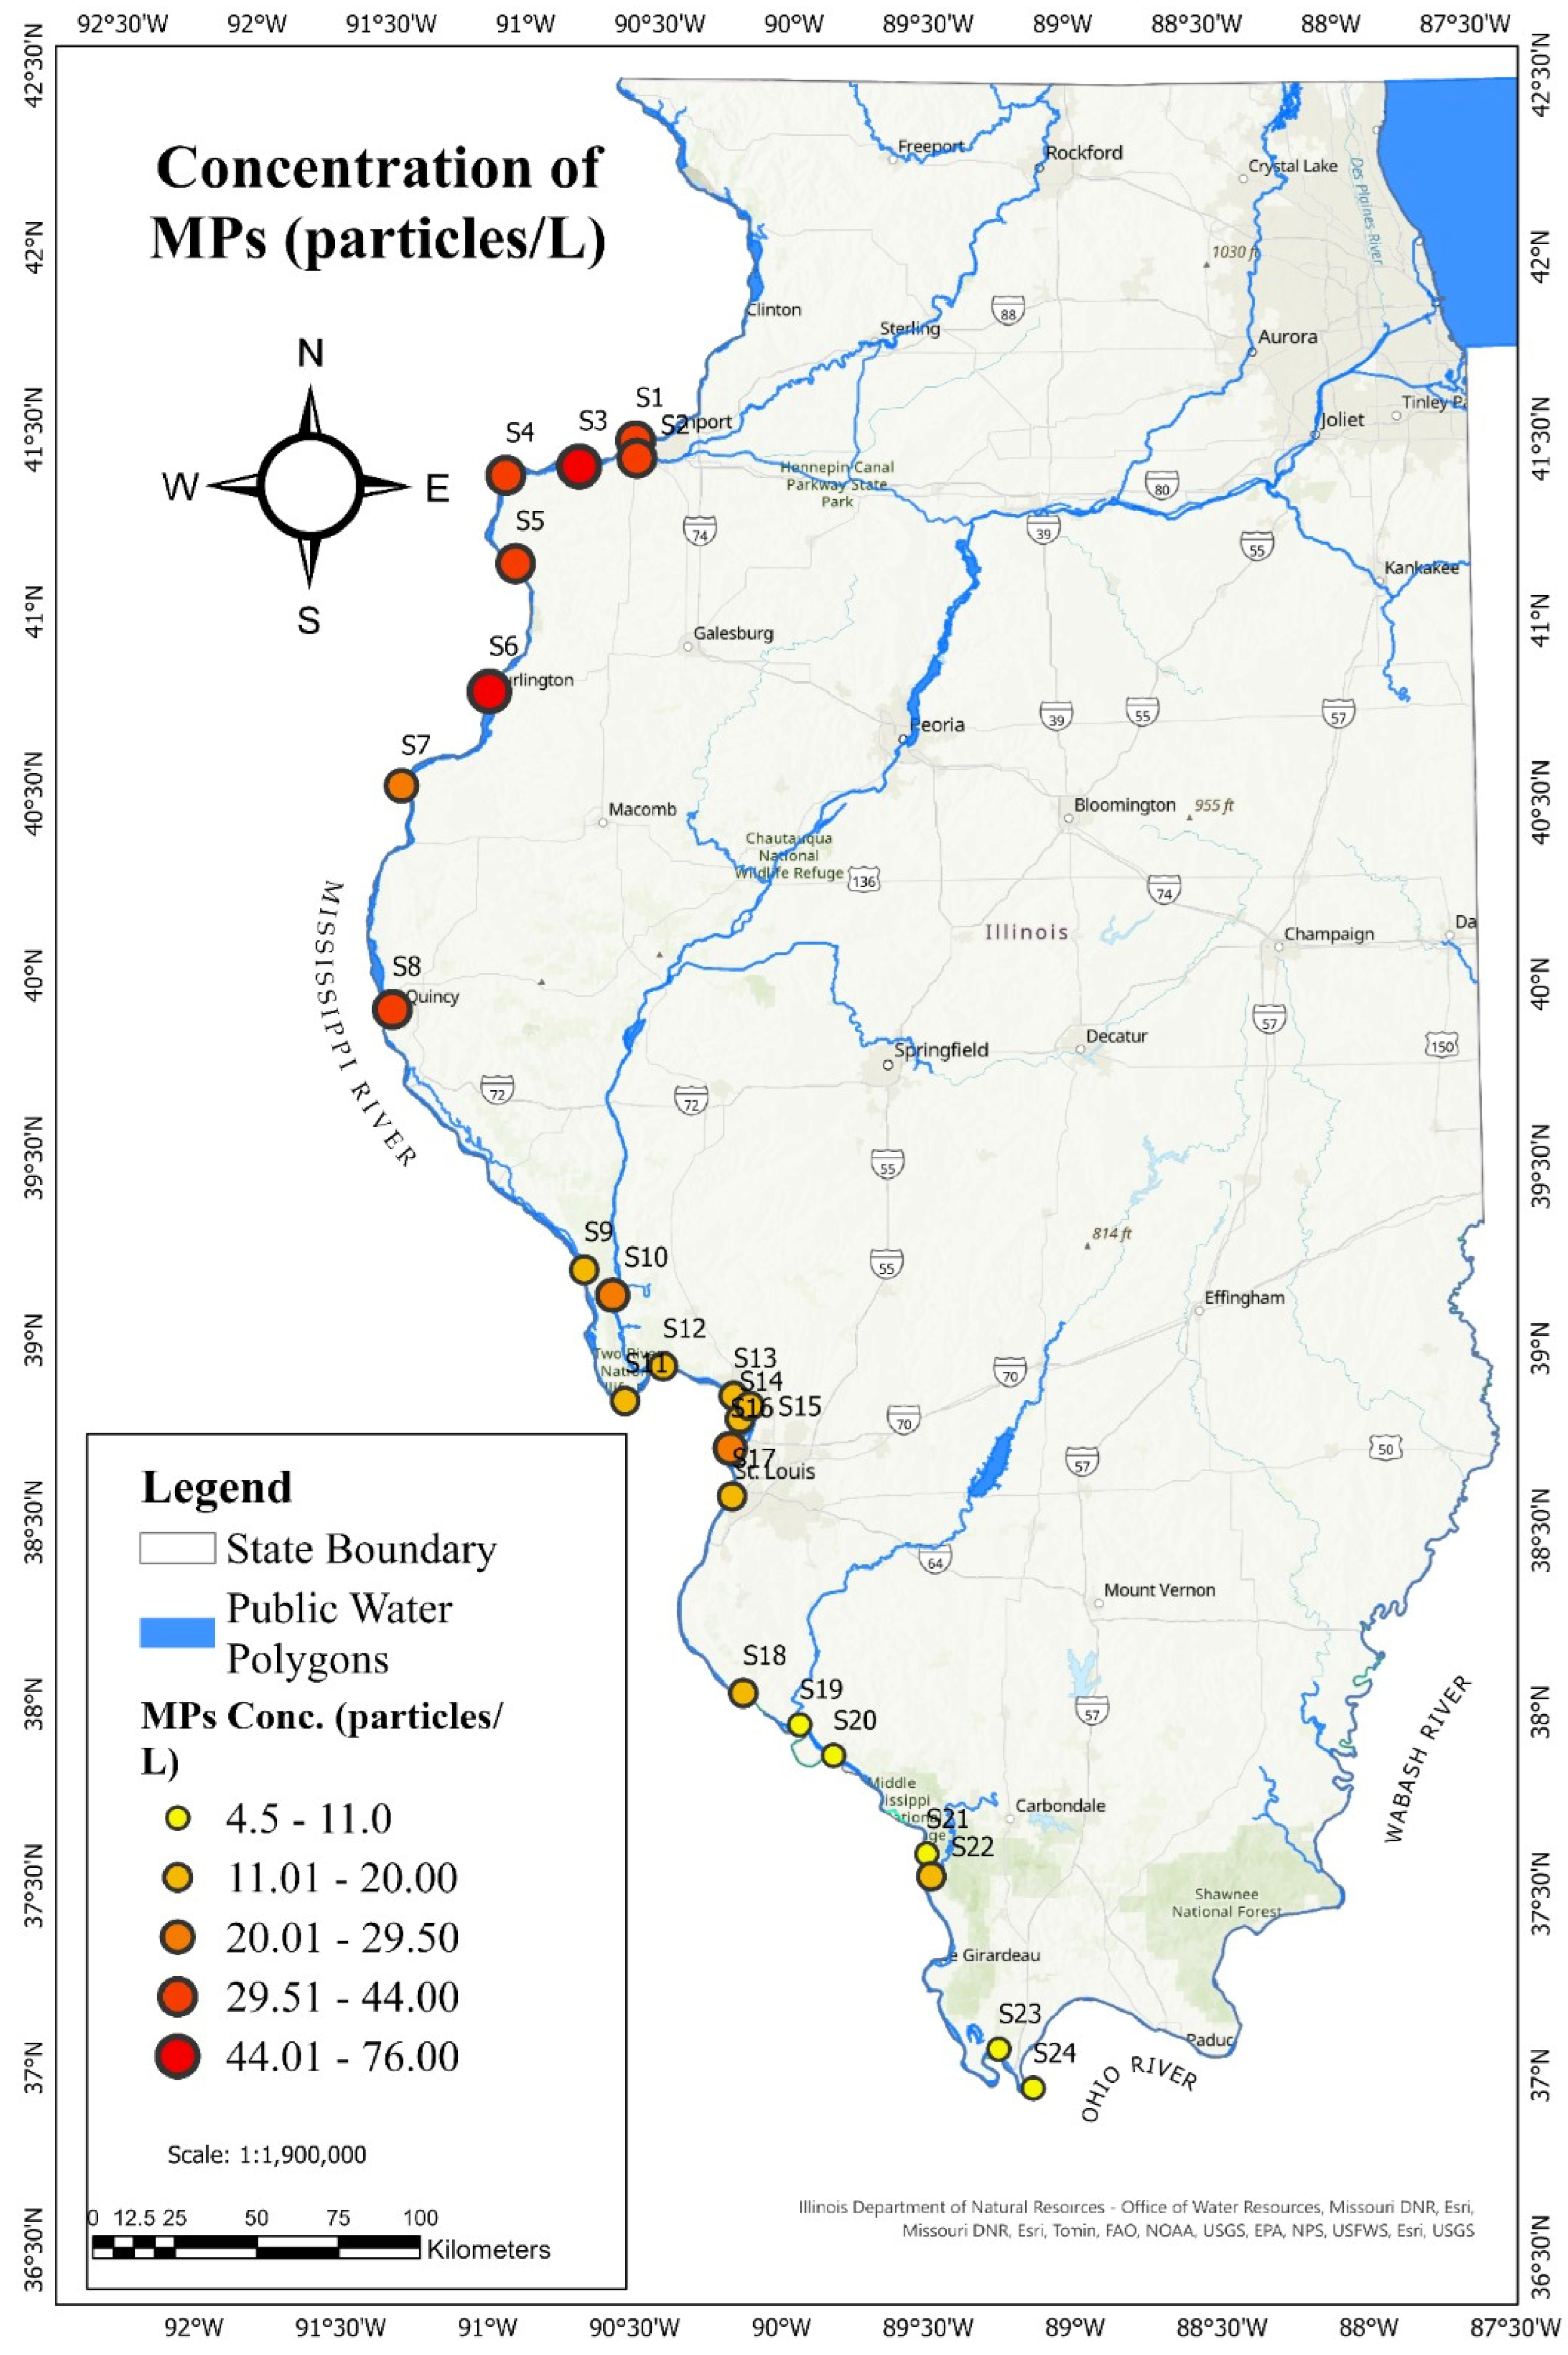
Figure 6 shows the regional distribution of microplastic concentrations at sample sites throughout the Mississippi River and its tributaries. The figure illustrates distinct variations in microplastic prevalence among the 24 sampling locations, suggesting that microplastics are irregularly dispersed across the river system. The geographical pattern indicates significant heterogeneity in pollution levels among places. The observed differences are likely affected by hydrological circumstances, since river flow dynamics, sediment transport, and mixing processes facilitate the redistribution and accumulation of microplastics throughout the system. Rivers serve as channels for transportation and temporary reservoirs for microplastics, with particles potentially trapped, resuspended, or redistributed based on existing hydrological conditions [7,28].
Figure 6.
Dispersion of microplastics (MPs) among sample locations.
3.2. Distribution and Polymer Identification of Microplastic Types
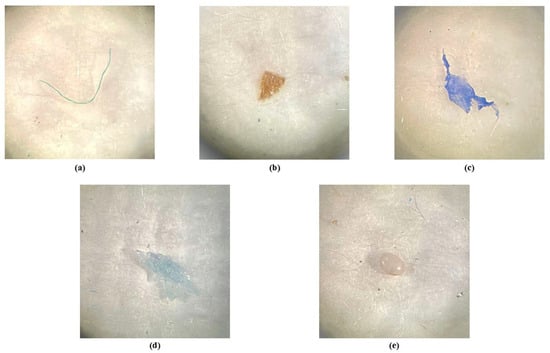
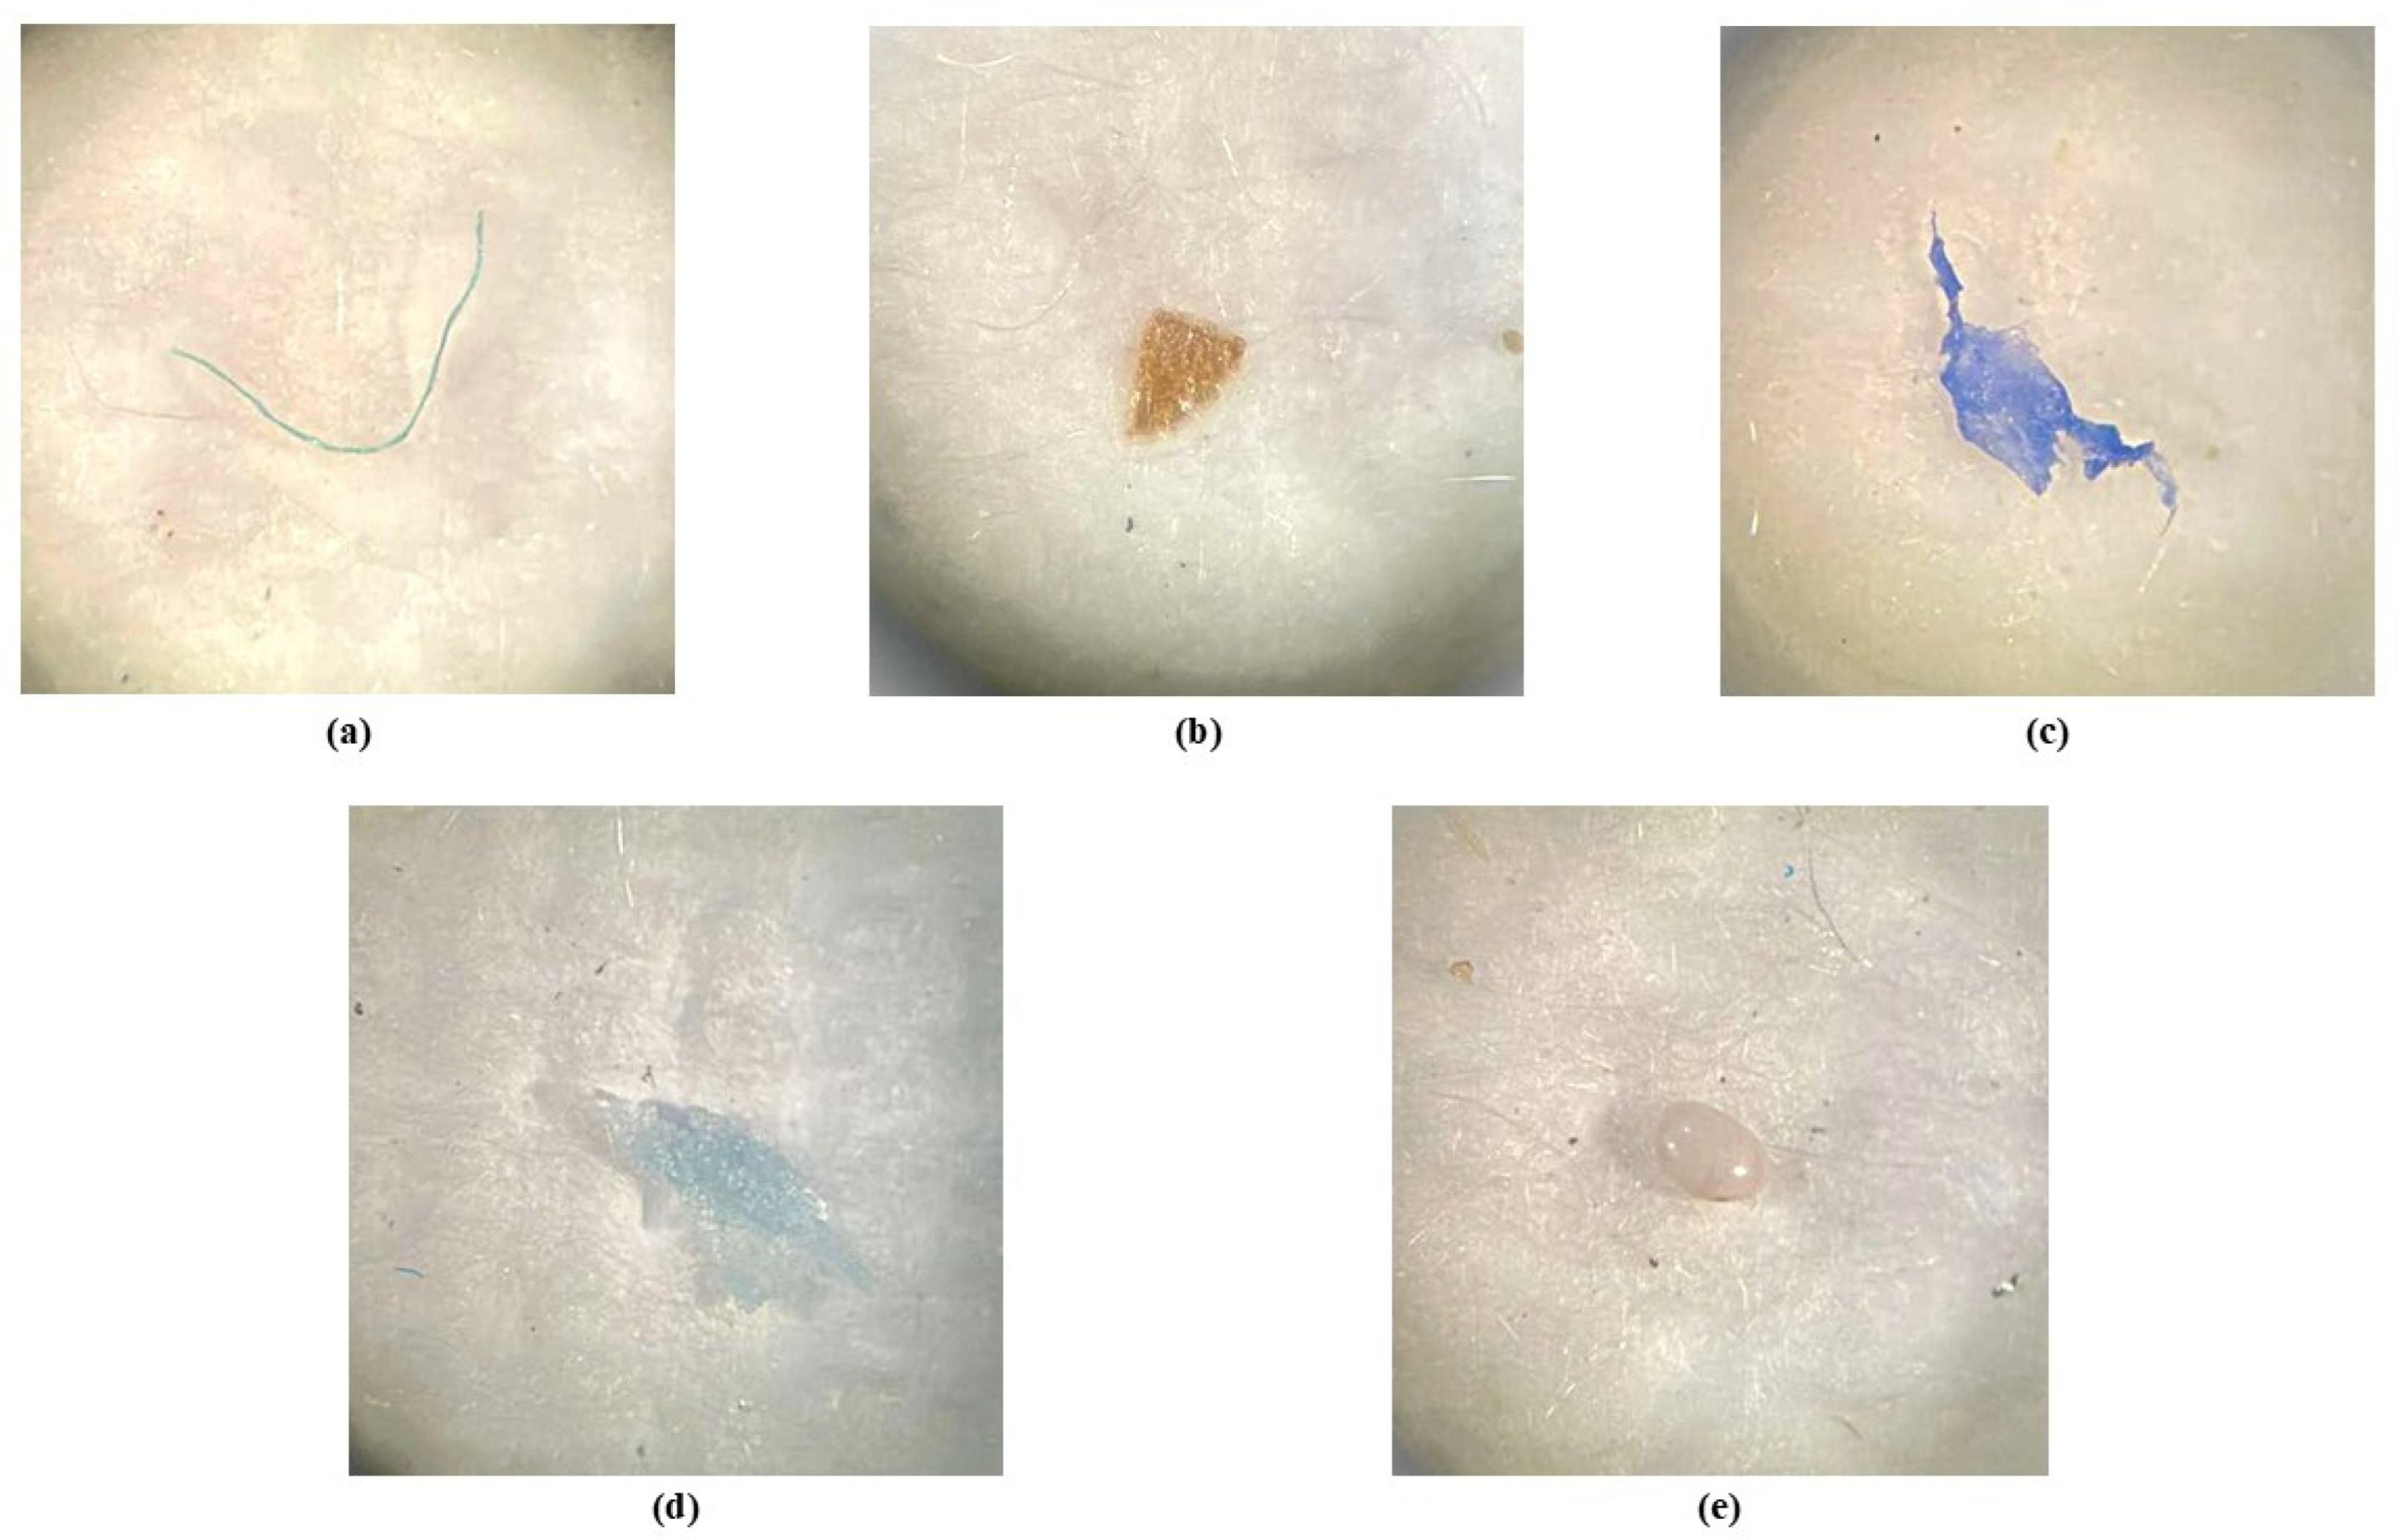
Microscopic analysis identified many forms of microplastic particles in the collected samples, including fibers, fragments, films, foams, and pellets. Fibers were the most common group, followed by fragments, and films. Figure 7 shows representative microscopic pictures of the various kinds of microplastic particles discovered in the samples.
Figure 7.
The stereomicroscope is used to identify MP particles visually: (a) fiber, (b) fragment, (c) film, (d) foam, and (e) pellet.
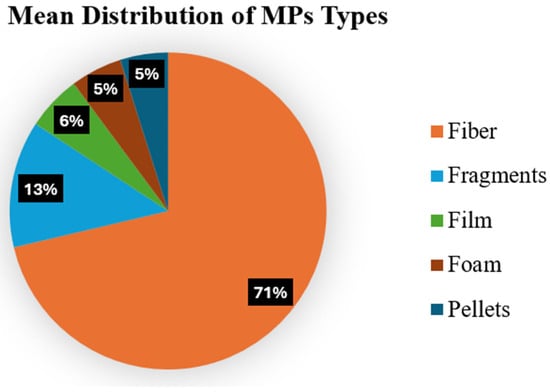
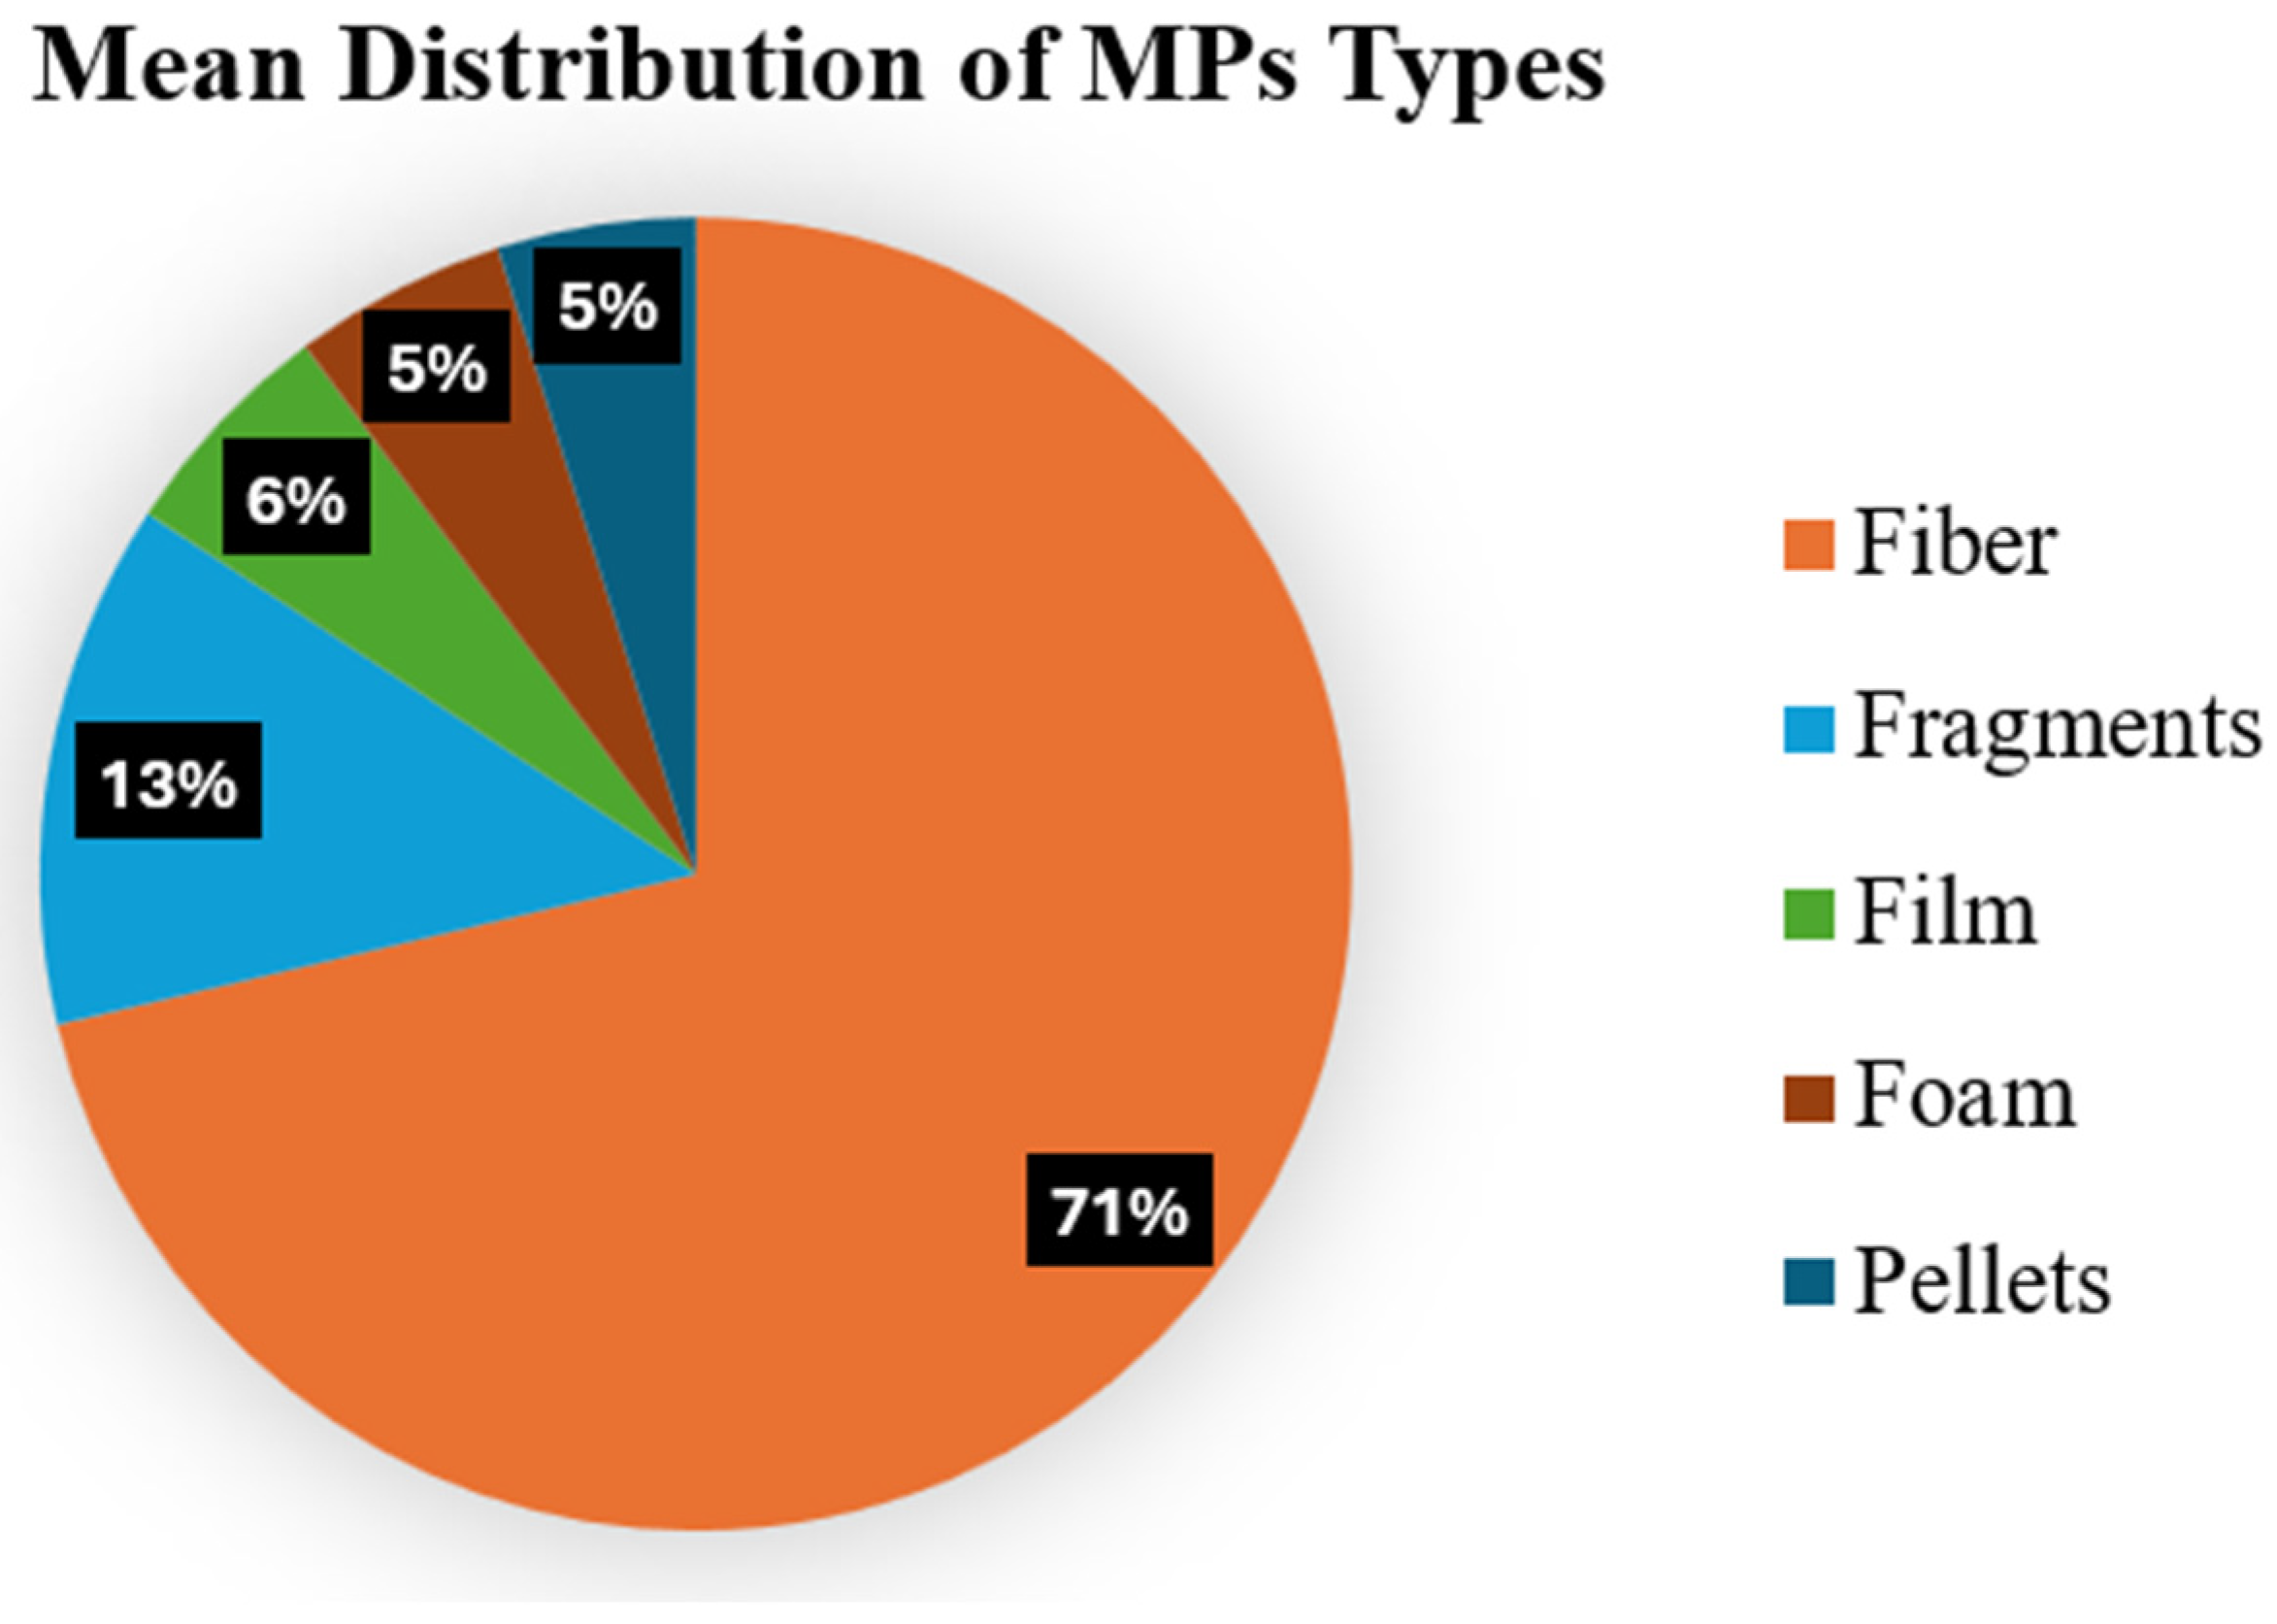
Figure 8 shows the percentage occurrence of microplastic particle categories across sample sites, including fibers, fragments, films, foams, and pellets. Fibers were the predominant category, accounting for roughly 71% of all discovered microplastics. Prior research has also shown that fibers often constitute a significant fraction of environmental microplastics, mostly owing to their release during the laundering of synthetic textiles and their persistence in wastewater discharges [12,50,51]. Fragments constituted around 13% of the total microplastics, making them the second most common category. Films accounted for around 6%, whilst foams and pellets each constituted about 5% of the total particles. Fibers were reliably identified at the majority of sample sites, whereas fragments, films, foams, and pellets were present in relatively lesser quantities. Nonetheless, the existence of these less prevalent kinds signifies many different sources of contamination. Films are often linked to plastic bags and packing materials, foams to expanded polystyrene goods, and pellets to industrial raw materials and personal care items, illustrating diverse routes of microplastic introduction into the river system [52,53].
Figure 8.
The percentage distribution of different types of microplastics.
ATR–FTIR analysis (Figure 2) identified the microplastic particles collected from the Mississippi River and its tributaries as high-density polyethylene (HDPE), polypropylene (PP), polystyrene (PS), and nylon (polyamide). HDPE and PP are widely used in packaging materials, plastic bags, bottles, containers, and other household products, whereas PS is commonly associated with disposable food packaging, foam products, and protective packaging materials. Nylon is extensively used in textiles, clothing, footwear, ropes, fishing gear, and bags, and its occurrence in aquatic environments is often linked to textile fibers and other human-related activities [54]. Since ATR–FTIR was conducted on filtered samples instead of on separately isolated particles, the comparative proportion of particles corresponding to each polymer type was not determined.
The distribution of these polymer types suggests that municipal wastewater discharges, improper plastic waste disposal, and other land-based human activities are likely major sources of microplastic contamination in the study area. Similar polymer compositions have been reported in freshwater ecosystems worldwide, with polyethylene, polypropylene, polystyrene, and polyamide among the most frequently detected polymers because of their widespread production, extensive use, and persistence in the environment [4]. However, polymer identification is not enough to identify particular microplastic sources. The probable source materials should therefore be evaluated with the adjacent land-use attributes when analyzing the geographical distribution of microplastics. Due to the absence of direct identification of particular pollution sources in this study, these relationships are regarded as probable source routes rather than confirmed sources.
3.3. Relationship Between Microplastics and the Physicochemical Properties of Water
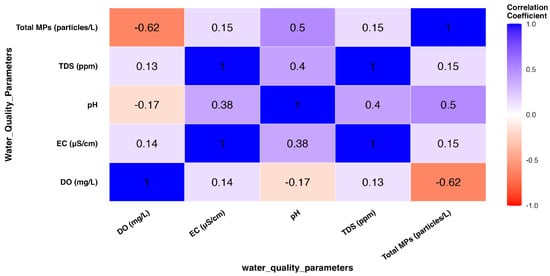
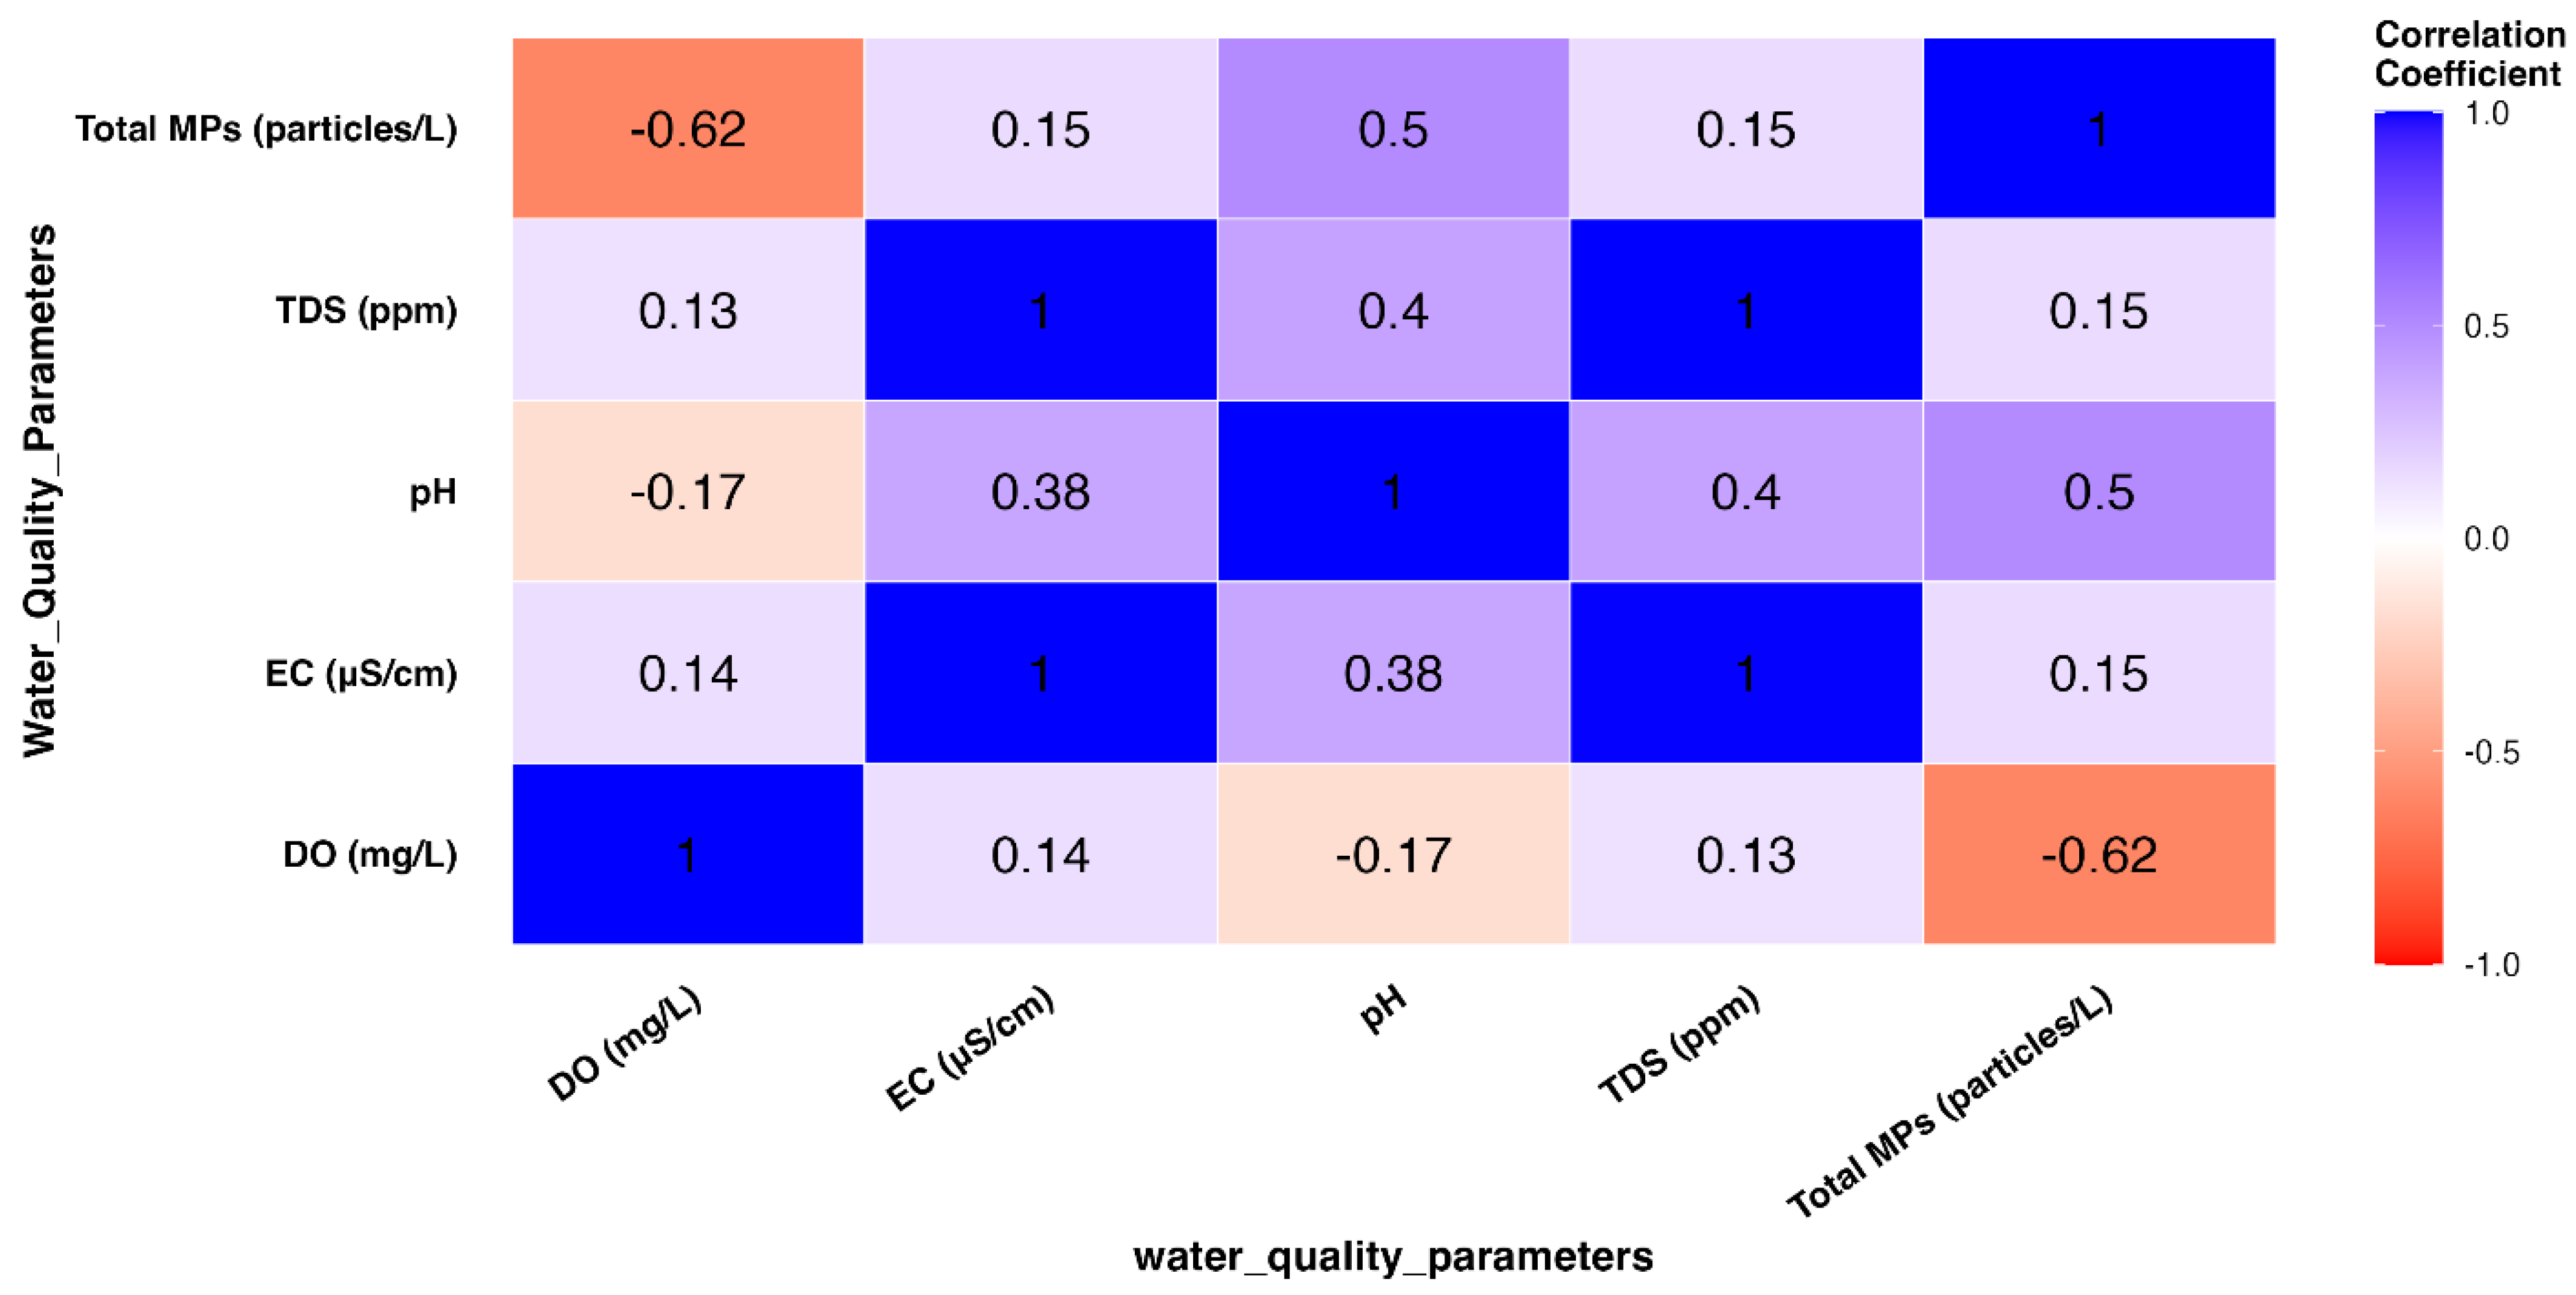
Spearman’s rank correlation coefficient (ρ) was used to examine the correlations between microplastic concentrations and certain physicochemical parameters, as seen in Figure 9. The strength of correlation was classified as follows: ρ = 0.00–0.19 (very weak), 0.20–0.39 (weak), 0.40–0.59 (moderate), 0.60–0.79 (strong), and 0.80–1.00 (very strong) [55]. The research demonstrated a moderate positive association between microplastic (MP) concentration and pH (ρ = 0.500, p = 0.013), suggesting that elevated pH levels correlate with greater microplastic abundance, with this connection being statistically significant at the 0.05 level. Conversely, microplastic concentration exhibited a significant negative connection with dissolved oxygen (DO) (ρ = −0.617, p = 0.001), indicating that elevated microplastic levels correspond to reduced oxygen availability. Weak and statistically insignificant positive associations were noted between MP concentration and electrical conductivity (EC) (ρ = 0.149, p = 0.487) as well as total dissolved solids (TDS) (ρ = 0.154, p = 0.472). These results align with prior research demonstrating that microplastic dispersion is affected by both physicochemical circumstances and localized human activities [45]. The robust association between TDS and EC (ρ = 0.998, p < 0.001) indicates collinearity between both variables and necessitates careful interpretation. The found correlations correspond with previous studies indicating that increased microplastic concentrations are often linked to lower water quality conditions [25,56]. However, these associations indicate statistical relationships and do not confirm causal connections between the abundance of microplastics and the physicochemical parameters of water quality.
Figure 9.
Spearman’s rank correlation heat map illustrating the connection between microplastic amount (particles/L) and certain physicochemical characteristics (pH, dissolved oxygen, total dissolved solids, and electrical conductivity). Color intensity indicates the strength of association, ranging from −1 to +1. Significant correlations (p < 0.05) are noted between pH and dissolved oxygen, but total dissolved solids (TDS) and conductivity exhibit a strong positive relationship.
3.4. Land Cover (LC) Analysis Around Sampling Locations
The findings show that agricultural land is the predominant land-use category in the majority of buffer zones, especially in the southern and central portions of the research area. The integrated land-use and microplastic evaluation at 24 sample locations along the Mississippi River in Illinois showed significant geographic diversity in land cover composition and microplastic particles. The quantity of microplastics exhibited significant variability, with relatively low concentrations at downstream locations and a high level of 76 particles per liter at site S-3. Fibers consistently represented the predominant microplastic type across all sites. Land-use research revealed significant heterogeneity across buffer sizes of 1 km, 2 km, and 10 km. At the 1 km scale, urban land ranged from 2.49% to 46.05%, industrial land from 0% to 40.45%, and agricultural land reached up to 74.71%. At the 2 km buffer, urban land was most prominent at S-2 (61.73%), while agricultural land remained dominant at several sites, notably S-22 (66.24%). At the 10 km buffer, agricultural land was the prevailing land-use class at most locations, although urban influence remained evident at certain sites, particularly S-17 (59.78%). Industrial land use generally remained low but increased locally, reaching 16.22% at S-17 (Supplementary Materials).
The observed patterns suggest that relationships between land use and microplastic distribution are more strongly reflected at the 2 km buffer scale, indicating that microplastic pollution is influenced more by cumulative watershed-scale processes than by immediate site-specific conditions. This supports the interpretation that microplastics are transported from surrounding urban and industrial areas via runoff and drainage networks, which are key pathways for contaminant transfer in freshwater systems [34,57]. Urban and industrial land uses contribute to microplastic pollution through stormwater runoff, wastewater effluent, industrial discharges, and inadequate waste management practices, all of which increase plastic inputs into aquatic environments [58,59]. Furthermore, higher proportions of urbanized land and population density are associated with increased microplastic accumulation due to reduced dilution capacity and continuous pollutant loading [50].
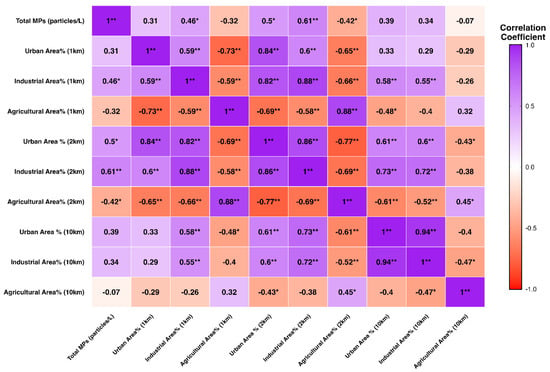
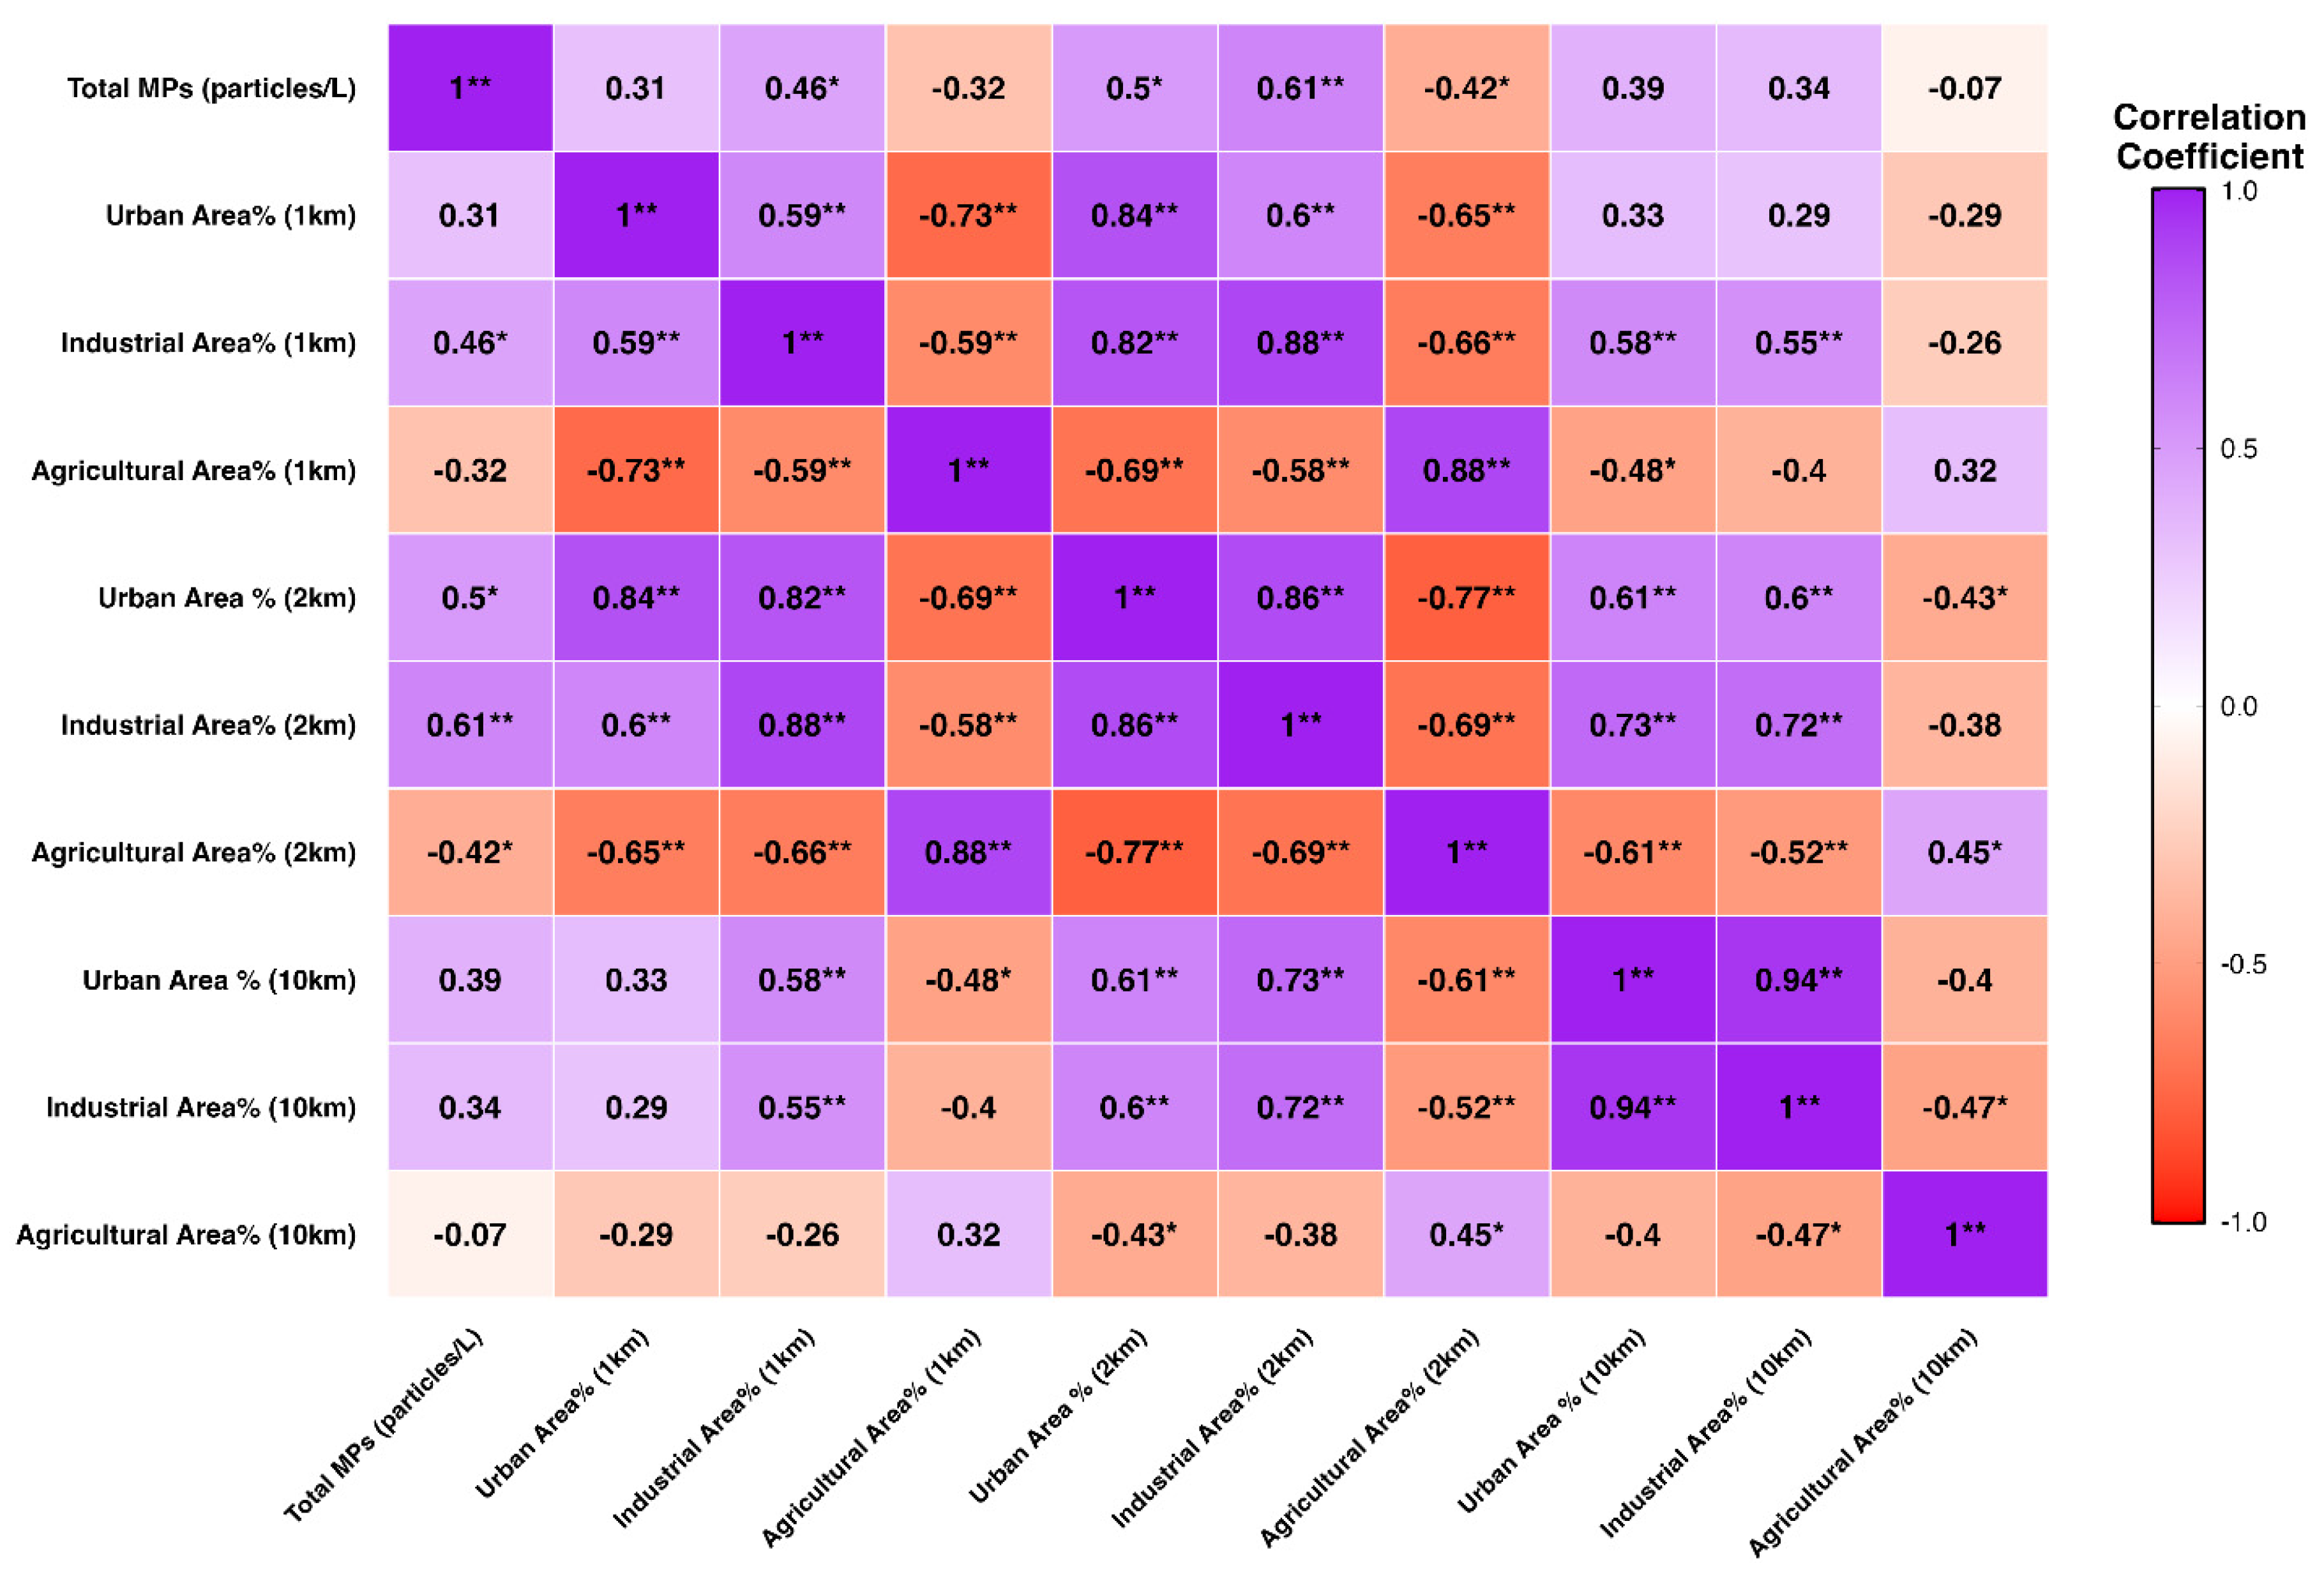
At distances of 2 km and 10 km, a slight positive correlation exists between total microplastics (MPs) and urban areas, attributed to urban land use. A notably strong positive relationship (ρ = 0.606) between industrial areas and MP pollution is observed at 2 km. Conversely, a negative correlation is found between total MPs and agricultural regions (ρ = −0.317 at 1 km and ρ = −0.424 at 2 km), suggesting lower MP concentrations in agricultural land. Additionally, strong relationships among land use categories indicate that agricultural areas tend to be less compatible with urban and industrial uses, while urban and industrial areas often align well (e.g., ρ = 0.841 at 2 km). In general, MP distribution is more strongly correlated with urban and industrial land uses than with agricultural ones. The heat map from Spearman’s rank correlation analysis (Figure 10) indicates a high association between total microplastics (MPs) concentrations and urban as well as industrial land cover, especially within the 2 km buffer zone. This correlation suggests that both urban and industrial land utilization might correlate with elevated microplastic concentrations; however, the specific sources of pollution cannot be established simply through correlation analysis. As a result, at reduced buffer distances, agricultural land cover often has a negative correlation with MPs, suggesting that these regions contribute less. Given the diminished correlations at the 10 km scale, it seems that local land cover components have a greater influence on MP dispersion than broader landscape patterns. Figure 10 clearly shows the Spearman’s rank correlation coefficients between the total microplastic abundance and the nine land cover characteristics in the 1 km, 2 km and 10 km buffer zones, which allows us to assess the strength and direction of these correlations in a more detailed way, at different spatial scales.
Figure 10.
Heat map of Spearman’s rank correlation coefficients (ρ) between total microplastic concentration and land cover percentages at 1 km, 2 km, and 10 km buffer zones. * Indicates significance at p < 0.05, whereas ** indicates strong significance at p < 0.01.
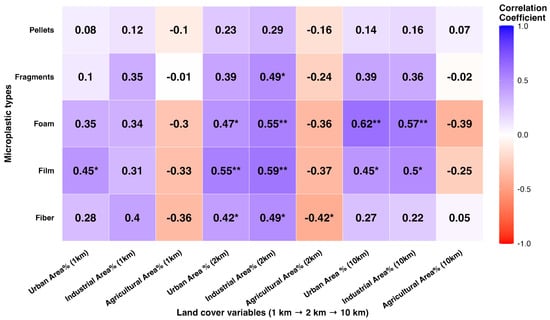
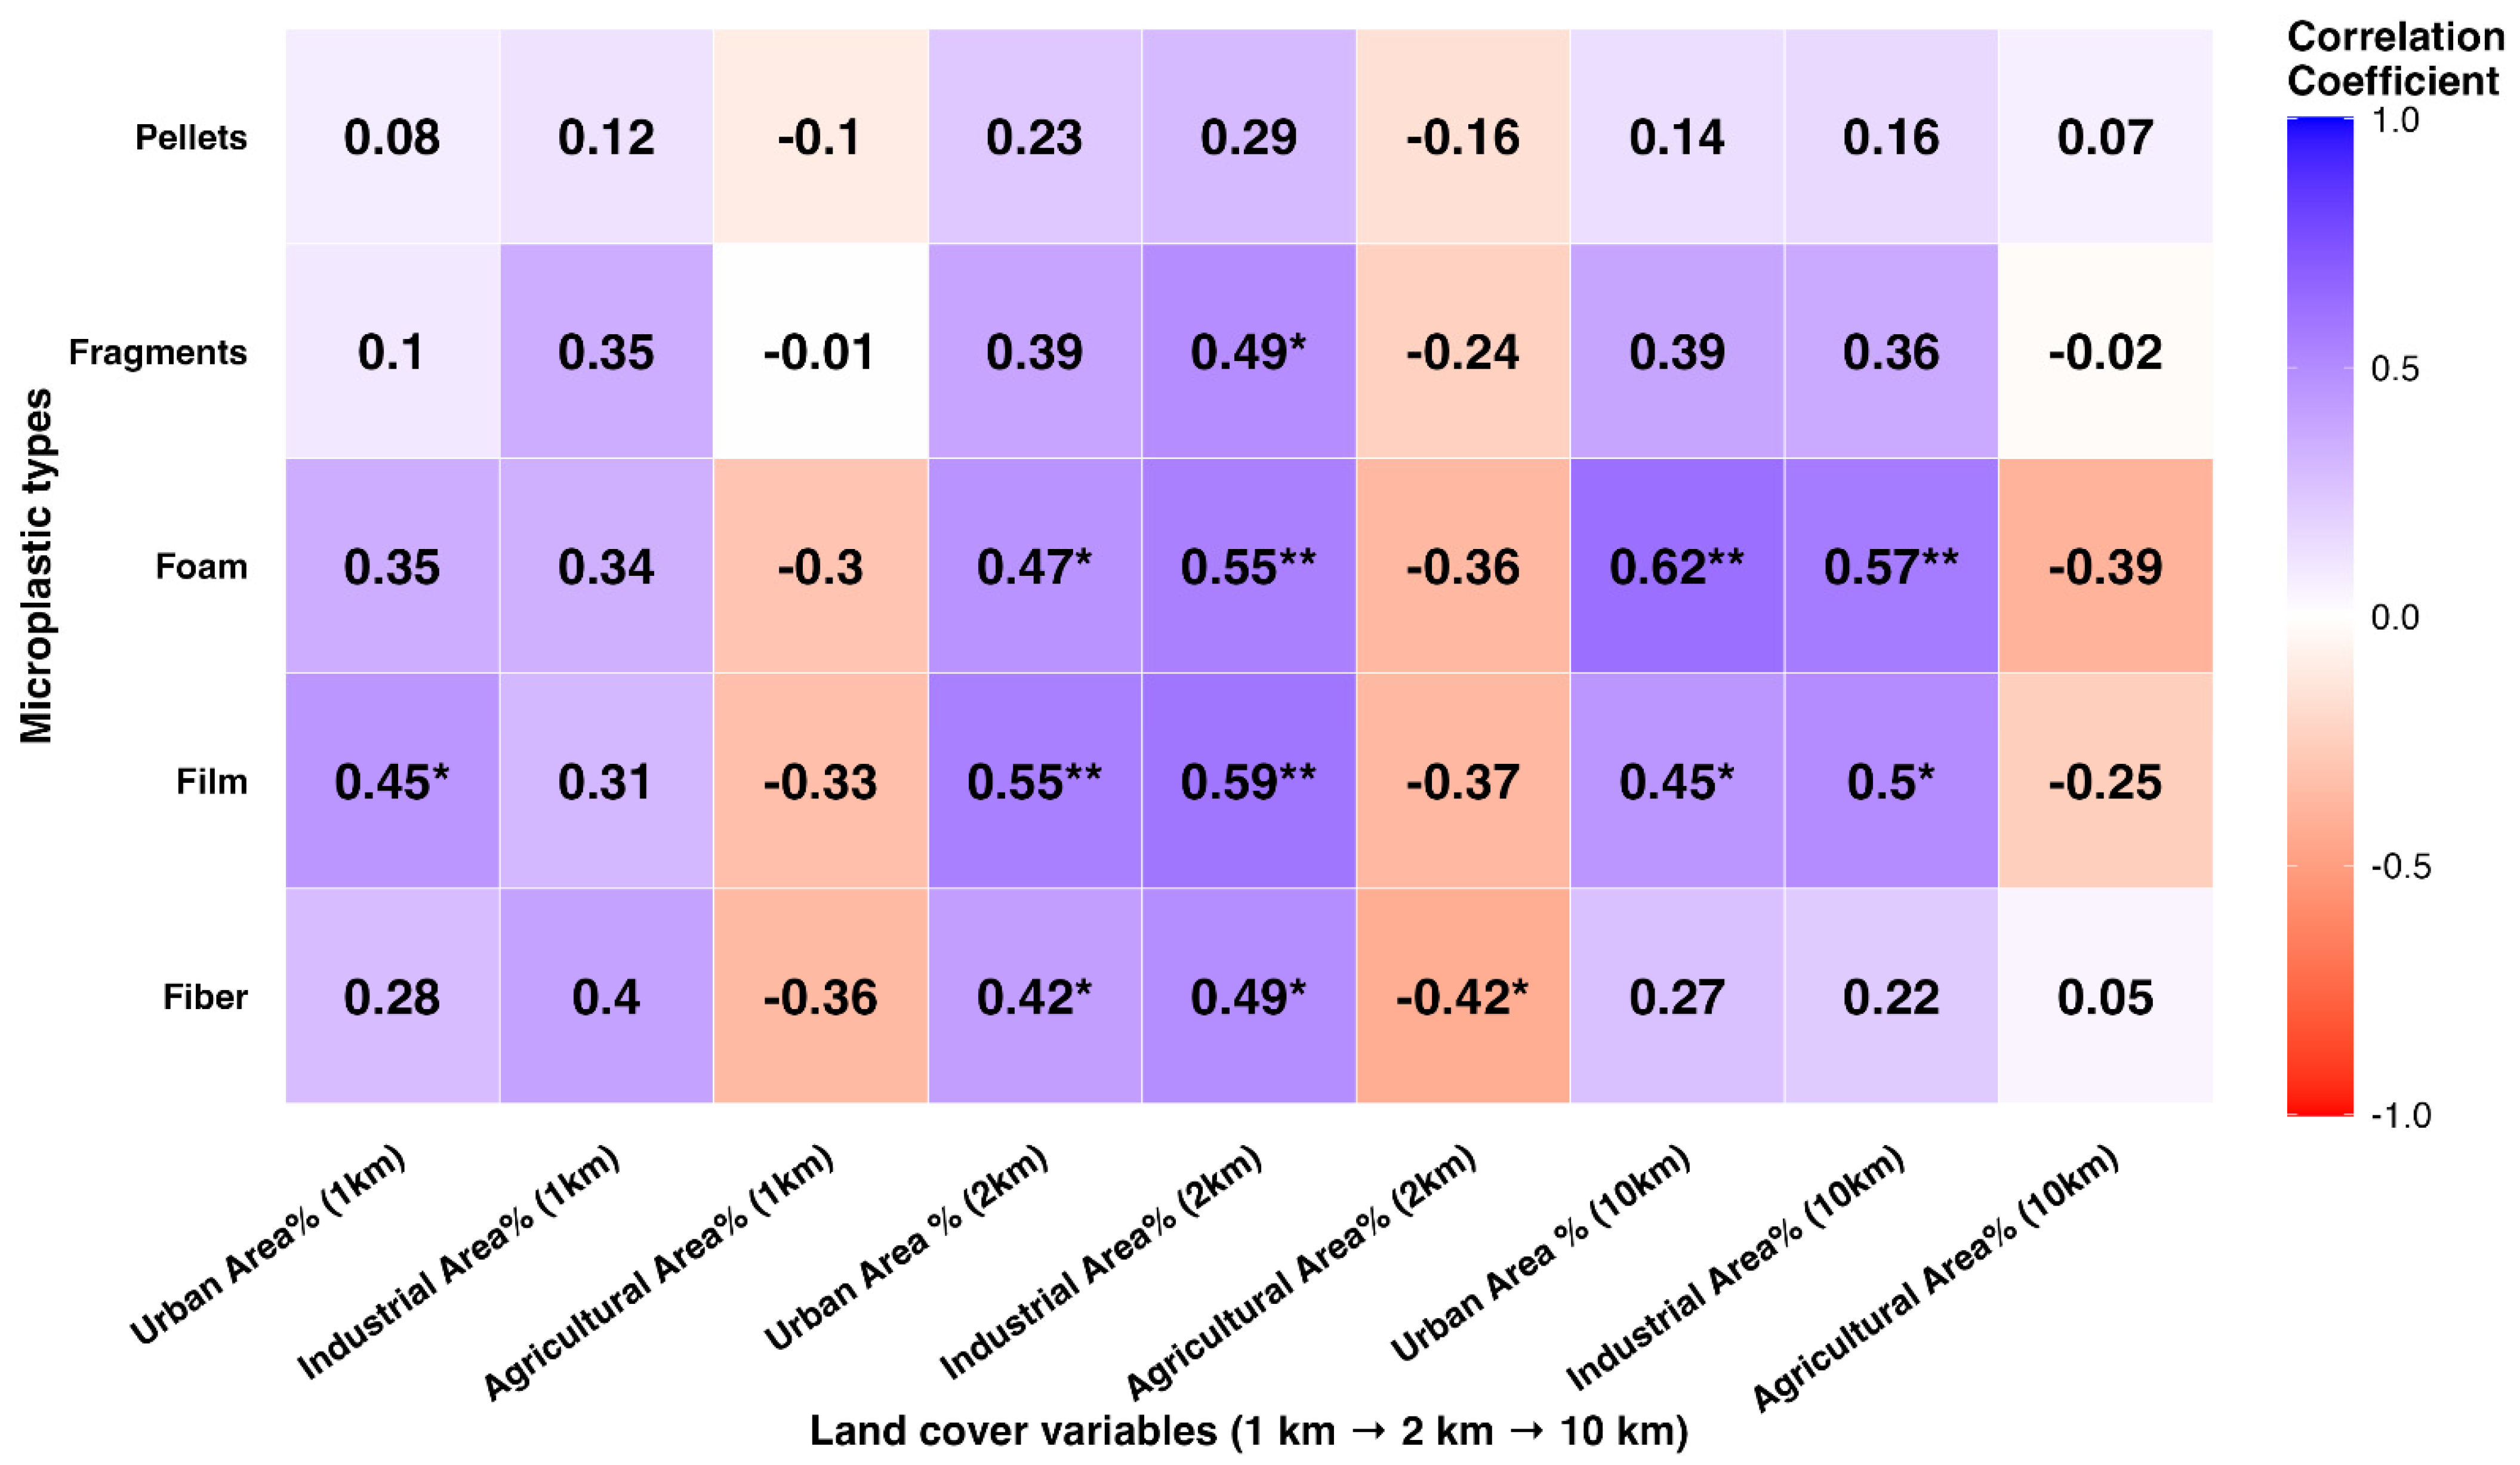
Figure 11 shows a heat map of Spearman’s rank correlation coefficient values, showing the connection between microplastic classifications and land cover categories at various geographical scales. Fragments, films, and fibers have strong positive associations with urban and industrial land cover, especially within the 2 km buffer zone, indicating a possible correlation between these land cover classifications and microplastic contributions. Agricultural land cover often has weak to negative relationships with the majority of microplastic forms at shorter buffer distances.
Figure 11.
Heat map illustrating Spearman’s rank correlation coefficients (ρ) among microplastic classifications and land cover percentages within 1 km, 2 km, and 10 km buffer zones. * denotes significance at p < 0.05, whereas ** signifies high significance at p < 0.01.
Foam particles have much greater correlations with urban land cover at larger buffer sizes, suggesting a wider regional impact and possibly downstream or watershed-scale transfer. The findings indicate that both the kind of microplastic and the geographical scale significantly influence distribution patterns and source attribution across the environment. These results align with prior research indicating substantial correlations between microplastic prevalence and watershed characteristics, such as urbanization and land-use level [60]. These patterns correlate with previously conducted studies indicating that terrestrial runoff and wastewater pathways could play a role in introducing microplastics into river systems [61]. Many possible origins, such as textile materials, wastewater contributions, and other human activities linked to related land-use activities, may account for the prevalence of fibers; nonetheless, the current findings do not provide sufficient evidence to validate these potential sources.
3.5. Influence of Tributaries
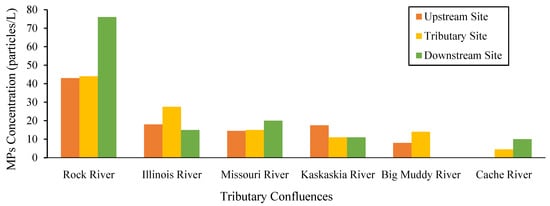
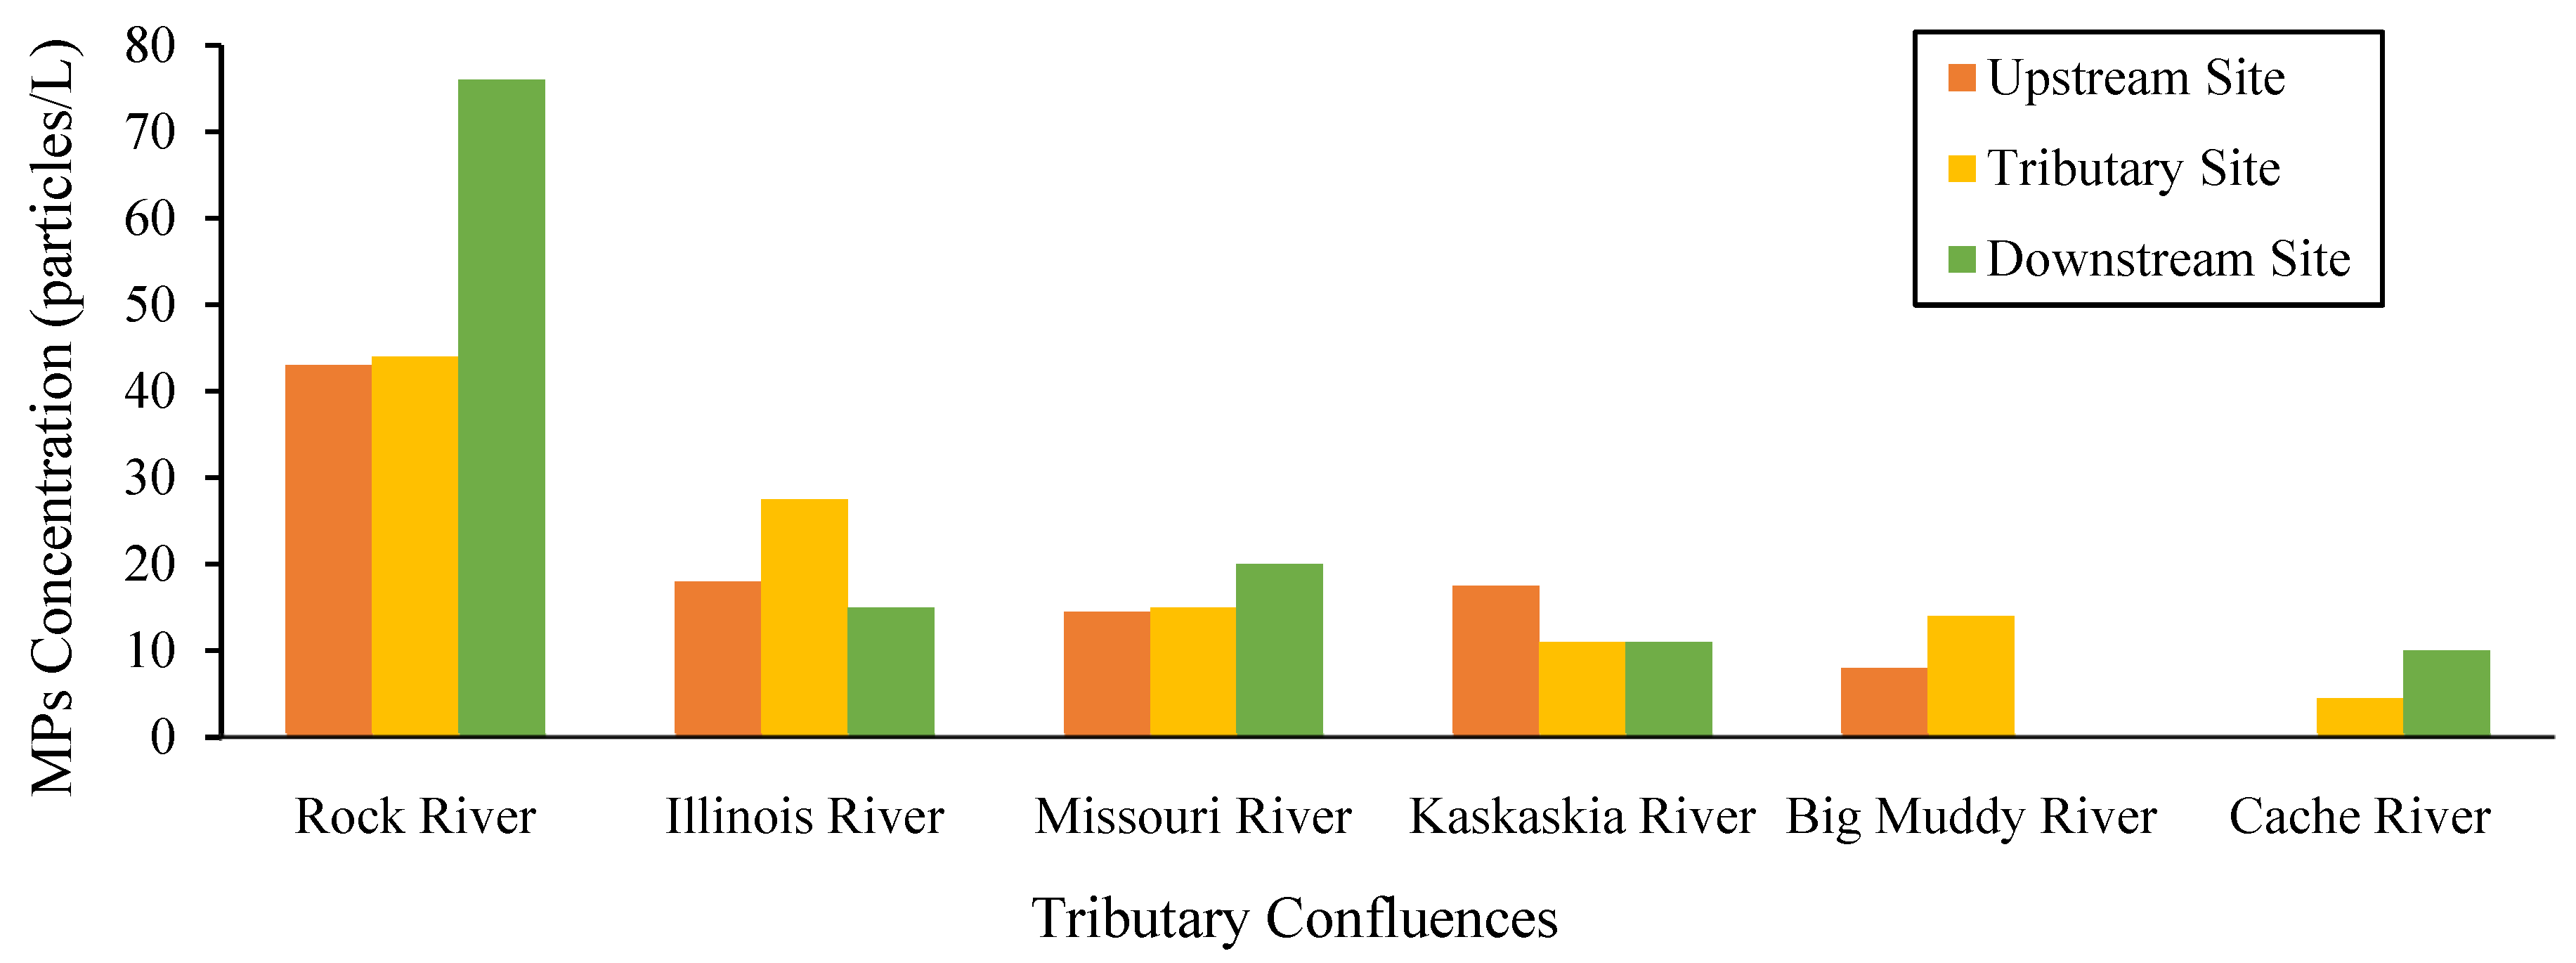
Figure 12 demonstrates the differential effects of tributaries on microplastic concentrations across the Mississippi River system. Tributaries substantially influenced the dispersion of microplastics throughout the Mississippi River system; however, their effects differed between confluence zones. Elevated concentrations downstream of the confluences of the Rock River and Missouri River indicate that these tributaries increased the microplastic loads in the main channel, while reductions observed downstream of the Illinois River and Kaskaskia River confluences reflect the effects of dilution and hydrodynamic mixing processes. Comparable confluence-related patterns have been documented in other river systems, wherein tributaries serve as significant conduits for microplastic transport, and confluence zones operate as regions of intensified mixing, deposition, and redistribution of particles [47,48,49]. The higher levels correlated to the Rock River and Missouri River corresponded with their increased urban and industrial land cover, verifying previous studies that urban runoff, industrial operations, and stormwater discharges are significant contributors to freshwater microplastics [28,29]. These data demonstrate that tributary inputs, watershed land use, and confluence hydrodynamics synergistically affect the geographical distribution of microplastics in the Mississippi River (Supplementary Materials).
Figure 12.
Microplastic quantities (particles/L) upstream, within tributaries, and downstream of significant tributary confluences along the Mississippi River. The investigation excludes the Big Muddy River and Cache River tributaries due to inaccessible sampling locations during field collection.
In addition to land-use factors, hydrodynamic mechanisms might play a role in the reported spatial variability of microplastics. Tributaries may serve as channels for the movement of microplastics, whereas confluence areas could affect the mixing, settling, and redistribution of particles [47,48,49]. Variations in local flow conditions may thus lead to variations in microplastic concentrations observed downstream of tributary confluence. Nonetheless, since hydrodynamic parameters were not directly assessed in this research, these processes are regarded as reasonable explanations rather than verified determinants of the observed spatial patterns. However, hydrological parameters specific to the location, including discharge and flow velocity, were not examined in this study. Accordingly, the identified regional patterns cannot be clearly linked to hydrological conditions, and these processes are classified as possible mechanisms rather than established determinants of microplastic distribution.
3.6. Environmental Implications
The contamination factor (CF) and pollution load index (PLI) were used to evaluate the extent of microplastic contamination at various sample locations in the Mississippi River. CF values varied from 1.00 to 16.89, with the maximum contamination detected at site S-3. Correspondingly, PLI values varied from 1.00 to 4.11, with S-3 also reporting the highest value, indicating substantial microplastic contamination at this site (Supplementary Data). The CF measurements indicated varying levels of pollution, although the PLI values remained within the low-risk range, with increased microplastic concentrations observed in regions that are associated with increased human activity and altered water quality conditions. Prior research has similarly associated increased microplastic pollution with urban runoff, industrial discharges, and wastewater effluents [1,56]. The PLI zone score of 4.62 is categorized as low risk, suggesting a comparatively low level of pollution concern according to the PLI classification, even though microplastics are prevalent throughout the river system. Microplastics may negatively impact aquatic creatures by causing physical and physiological stress, which includes gastrointestinal obstruction, diminished eating efficiency, stunted development, and altered reproductive functions [48]. These effects may disseminate via aquatic food webs, thereby altering ecosystem structure and function [58]. Furthermore, the existence of hazardous polymer varieties may exacerbate ecological danger, even when total concentrations seem comparatively modest [34].
4. Conclusions
Microplastic pollution in the Mississippi River and its tributaries in Illinois ranges from 4.5 to 76 particles/L, according to this research. The data show high geographical variation, with greater concentrations near populated regions such as sites S-3 and S-6, suggesting local human activity. Land-use research shows that urban and industrial regions are more associated with microplastic pollution than rural areas, showing the impact of watershed features in contamination patterns. Land cover inside the 2 km buffer zone had the highest correlations with microplastic dispersion, highlighting the impact of neighboring land-use changes in local pollution levels. Fragments followed fibers in microplastic composition, whereas films, foams, and pellets were smaller. This pattern supports textile and wastewater effluent inputs, whereas fragments imply greater plastic debris disintegration. ATR–FTIR analysis identified the polymer composition of the microplastic particles, revealing high-density polyethylene (HDPE), polypropylene (PP), polystyrene (PS), and nylon as the predominant polymer types. The presence of these diverse polymers indicates multiple anthropogenic sources contributing to microplastic contamination.
Higher amounts of microplastics were related to lower dissolved oxygen levels and higher pH values, indicating accumulation under more influenced environmental conditions. Environmental risk assessments revealed differing degrees of contamination according to CF values, which ranged from 1.00 to 16.89, while PLI values varied from 1.00 to 4.11. The PLI zone rating of 4.62 indicates a low-risk threat in this study area. Microplastic levels in the Mississippi River increased most downstream from tributary confluences, particularly the Rock River. Different streams show that local watershed and tributary factors greatly affect downstream microplastic concentrations. Microplastics move through the Mississippi River system via tributaries.
Overall, this investigation reveals the substantial influence of human activities, such as urbanization and industrial discharge, on the development of microplastic pollution and its potential hazards to human health and aquatic ecosystems. This study advances understanding of freshwater microplastic dynamics by integrating spatial, physicochemical, and land-use analyses. It also emphasizes the need for better waste management practices, improved wastewater treatment, and stronger environmental laws to mitigate microplastic contamination in freshwater bodies.
Supplementary Materials
The following supporting information can be downloaded at: https://www.mdpi.com/article/10.3390/microplastics5030177/s1, Figure S1: Sampling locations along the Mississippi River main stem and major tributaries; Table S1: Sampling locations within the Mississippi River system, including GPS coordinates, sampling dates, and location name; Table S2: Land cover percentages within 1 km, 2 km, and 10 km buffer zones and their association with microplastic abundance and type distribution at sampling sites along the Mississippi River, Illinois; Table S3: Microplastic concentrations (particles/L) upstream, within tributaries, and downstream of major tributary confluences along the Mississippi River; Table S4: Site-specific contamination factor (CF), pollution load index (PLI), contamination level, and pollution status of microplastic contamination in the Mississippi River study area, including the overall zone-level PLI classification.
Author Contributions
Conceptualization, M.H. and S.R.; methodology, M.H.; formal analysis, M.H.; investigation, M.H. and S.R.; data curation, M.H.; writing—original draft preparation, M.H.; writing—review and editing, M.H. and S.R.; visualization, M.H.; supervision, S.R. All authors have read and agreed to the published version of the manuscript.
Funding
The APC was funded by the Graduate School, Southern Illinois University Edwardsville.
Data Availability Statement
The original contributions presented in this study are included in the article/Supplementary Materials. Further inquiries can be directed to the corresponding author.
Acknowledgments
This research was partially supported by the Graduate School at Southern Illinois University Edwardsville (SIUE) through the Research Grants for Graduate Students (RGGS) program. The authors sincerely acknowledge the Department of Environmental Sciences for providing laboratory space and essential equipment for sample processing and analysis. The authors also gratefully acknowledge Edward Navarre of the Department of Chemistry for his valuable support and assistance with ATR-FTIR analysis.
Conflicts of Interest
The authors declare that they have no known competing financial interests or personal relationships that could have appeared to influence the work reported in this paper.
Abbreviations
The following abbreviations are used in this manuscript:
| MPs | Microplastics |
| DO | Dissolved Oxygen |
| EC | Electrical Conductivity |
| GPS | Global Positioning System |
| CF | Contamination Factor |
| NLCD | National Land Cover Database |
| NOAA | National Oceanic and Atmospheric Administration |
| PLI | Pollution Load Index |
| QA | Quality Assurance |
| QC | Quality Control |
| TDS | Total Dissolved Solids |
| GIS | Geographic Information System |
| SD | Standard Deviation |
| CV | Coefficient of Variation |
References
- Odora, A.T.; Aysha, S.; Sultan, M.B.; Bhuiyan, M.A.R. Evaluating the sources of microplastic contamination and quantifying its abundance in the Balu River, Dhaka, Bangladesh. Environ. Monit. Assess. 2024, 196, 867. [Google Scholar] [CrossRef] [Scilit]
- PlasticsEurope. Plastics—The Fast Facts. 2023. Available online: https://plasticseurope.org/knowledge-hub/plastics-the-fast-facts-2023/ (accessed on 11 June 2026).
- Sharma, S.; Bhardwaj, A.; Thakur, M.; Saini, A. Understanding microplastic pollution of marine ecosystem: A review. Environ. Sci. Pollut. Res. 2024, 31, 41402–41445. [Google Scholar] [CrossRef] [Scilit]
- Khan, M.B.; Urmy, S.Y.; Setu, S.; Kanta, A.H.; Gautam, S.; Eti, S.A.; Baten, M.A. Abundance, distribution and composition of microplastics in sediment and fish species from an Urban River of Bangladesh. Sci. Total Environ. 2023, 885, 163876. [Google Scholar] [CrossRef] [Scilit]
- Krause, S.; Baranov, V.; Nel, H.A.; Drummond, J.D.; Kukkola, A.; Hoellein, T.; Lynch, I. Gathering at the top? Environmental controls of microplastic uptake and biomagnification in freshwater food webs. Environ. Pollut. 2021, 268, 115750. [Google Scholar] [CrossRef] [Scilit]
- Kukkola, A.; Krause, S.; Lynch, I.; Smith, G.H.S.; Nel, H. Nano and microplastic interactions with freshwater biota–current knowledge, challenges and future solutions. Environ. Int. 2021, 152, 106504. [Google Scholar] [CrossRef] [Scilit]
- Fan, Y.; Zheng, J.; Deng, L.; Rao, W.; Zhang, Q.; Liu, T.; Qian, X. Spatiotemporal dynamics of microplastics in an urban river network area. Water Res. 2022, 212, 118116. [Google Scholar] [CrossRef] [Scilit]
- Frias, J.P.; Nash, R. Microplastics: Finding a consensus on the definition. Mar. Pollut. Bull. 2019, 138, 145–147. [Google Scholar] [CrossRef] [Scilit]
- Rakib, M.R.J.; Hossain, M.B.; Kumar, R.; Ullah, M.A.; Al Nahian, S.; Rima, N.N.; Sayed, M.M. Spatial distribution and risk assessments due to the microplastics pollution in sediments of Karnaphuli River Estuary, Bangladesh. Sci. Rep. 2022, 12, 8581. [Google Scholar] [CrossRef] [Scilit]
- Yu, X.; Ladewig, S.; Bao, S.; Toline, C.A.; Whitmire, S.; Chow, A.T. Occurrence and distribution of microplastics at selected coastal sites along the southeastern United States. Sci. Total Environ. 2018, 613, 298–305. [Google Scholar] [CrossRef] [Scilit]
- Zhang, F.; Wang, X.; Xu, J.; Zhu, L.; Peng, G.; Xu, P.; Li, D. Food-web transfer of microplastics between wild caught fish and crustaceans in East China Sea. Mar. Pollut. Bull. 2019, 146, 173–182. [Google Scholar] [CrossRef] [Scilit]
- Browne, M.A.; Crump, P.; Niven, S.J.; Teuten, E.; Tonkin, A.; Galloway, T.; Thompson, R. Accumulation of microplastic on shorelines worldwide: Sources and sinks. Environ. Sci. Technol. 2011, 45, 9175–9179. [Google Scholar] [CrossRef] [Scilit]
- Cole, M.; Lindeque, P.; Halsband, C.; Galloway, T.S. Microplastics as contaminants in the marine environment: A review. Mar. Pollut. Bull. 2011, 62, 2588–2597. [Google Scholar] [CrossRef] [Scilit]
- Hidalgo-Ruz, V.; Gutow, L.; Thompson, R.C.; Thiel, M. Microplastics in the marine environment: A review of the methods used for identification and quantification. Environ. Sci. Technol. 2012, 46, 3060–3075. [Google Scholar] [CrossRef] [Scilit]
- Free, C.M.; Jensen, O.P.; Mason, S.A.; Eriksen, M.; Williamson, N.J.; Boldgiv, B. High-levels of microplastic pollution in a large, remote, mountain lake. Mar. Pollut. Bull. 2014, 85, 156–163. [Google Scholar] [CrossRef] [Scilit]
- Rochman, C.M.; Kross, S.M.; Armstrong, J.B.; Bogan, M.T.; Darling, E.S.; Green, S.J.; Veríssimo, D. Scientific evidence supports a ban on microbeads. Environ. Sci. Technol. 2015, 49, 10759–10761. [Google Scholar] [CrossRef] [Scilit]
- Not, C.; Chan, K.; So, M.W.K.; Lau, W.; Tang, L.T.W.; Cheung, C.K.H. State of microbeads in facial scrubs: Persistence and the need for broader regulation. Environ. Sci. Pollut. Res. 2025, 32, 11063–11071. [Google Scholar] [CrossRef] [Scilit]
- Xia, B.; Du, Y.S.; Zhao, X.G.; Zhu, L.; Chen, B.J.; Sun, X.M.; Qu, K.M. Research progress on microplastics pollution in marine fishery water and their biological effects. Prog. Fish. Sci. 2019, 40, 178–190. [Google Scholar] [CrossRef]
- Talbot, R.; Granek, E.; Chang, H.; Wood, R.; Brander, S. Spatial and temporal variations of microplastic concentrations in Portland’s freshwater ecosystems. Sci. Total Environ. 2022, 833, 155143. [Google Scholar] [CrossRef] [Scilit]
- Lambert, S.; Wagner, M. Microplastics are contaminants of emerging concern in freshwater environments: An overview. In Freshwater Microplastics, 1st ed.; Wagner, M., Lambert, S., Eds.; Springer: Cham, Switzerland, 2018; pp. 1–23. [Google Scholar] [CrossRef] [Scilit]
- Meijer, L.J.; Van Emmerik, T.; Van Der Ent, R.; Schmidt, C.; Lebreton, L. More than 1000 rivers account for 80% of global riverine plastic emissions into the ocean. Sci. Adv. 2021, 7, eaaz5803. [Google Scholar] [CrossRef] [Scilit]
- Jambeck, J.R.; Geyer, R.; Wilcox, C.; Siegler, T.R.; Perryman, M.; Andrady, A.; Law, K.L. Plastic waste inputs from land into the ocean. Science 2015, 347, 768–771. [Google Scholar] [CrossRef] [Scilit]
- Di Mauro, R.; Kupchik, M.J.; Benfield, M.C. Abundant plankton-sized microplastic particles in shelf waters of the northern Gulf of Mexico. Environ. Pollut. 2017, 230, 798–809. [Google Scholar] [CrossRef] [Scilit]
- Yu, D.; Shi, P.; Liu, Y.; Xun, B. Detecting land use-water quality relationships from the viewpoint of ecological restoration in an urban area. Ecol. Eng. 2013, 53, 205–216. [Google Scholar] [CrossRef] [Scilit]
- Conard, W.M.; O’Reilly, K.E.; Hartlage, C.; Lamberti, G.A. Widespread microplastic pollution in Indiana, USA, rivers. River Res. Appl. 2023, 39, 2092–2101. [Google Scholar] [CrossRef] [Scilit]
- Hashmi, S.I.; Barrick, A.; Hoang, T.C. Discovery of microplastics in the Alabama River: Distributions, transport and loads, sources, and relative comparison with world rivers. J. Hazard. Mater. 2025, 495, 138813. [Google Scholar] [CrossRef] [Scilit]
- Haque, A.; Holsen, T.M.; Baki, A.B. Distribution and risk assessment of microplastic pollution in a rural river system near a wastewater treatment plant, hydro-dam, and river confluence. Sci. Rep. 2024, 14, 6006. [Google Scholar] [CrossRef] [Scilit]
- Kukkola, A.; Runkel, R.L.; Schneidewind, U.; Murphy, S.F.; Kelleher, L.; Smith, G.H.S.; Krause, S. Prevailing impacts of river management on microplastic transport in contrasting US streams: Rethinking global microplastic flux estimations. Water Res. 2023, 240, 120112. [Google Scholar] [CrossRef] [Scilit]
- Wontor, K.; Olubusoye, B.S.; Cizdziel, J.V. Microplastics in the Mississippi River system during flash drought conditions. Environments 2024, 11, 141. [Google Scholar] [CrossRef] [Scilit]
- Barrows, A.P.; Neumann, C.A.; Berger, M.L.; Shaw, S.D. Grab vs. neuston tow net: A microplastic sampling performance comparison and possible advances in the field. Anal. Methods 2017, 9, 1446–1453. [Google Scholar] [CrossRef] [Scilit]
- Green, D.S.; Kregting, L.; Boots, B.; Blockley, D.J.; Brickle, P.; Da Costa, M.; Crowley, Q. A comparison of sampling methods for seawater microplastics and a first report of the microplastic litter in coastal waters of Ascension and Falkland Islands. Mar. Pollut. Bull. 2018, 137, 695–701. [Google Scholar] [CrossRef] [Scilit]
- Eppehimer, D.E.; Hamdhani, H.; Hollien, K.D.; Nemec, Z.C.; Lee, L.N.; Quanrud, D.M.; Bogan, M.T. Impacts of baseflow and flooding on microplastic pollution in an effluent-dependent arid land river in the USA. Environ. Sci. Pollut. Res. 2021, 28, 45375–45389. [Google Scholar] [CrossRef] [Scilit]
- Masura, J.; Baker, J.E.; Foster, G.D.; Arthur, C.; Herring, C. Laboratory Methods for the Analysis of Microplastics in the Marine Environment: Recommendations for Quantifying Synthetic Particles in Waters and Sediments; NOAA Technical Memorandum NOS-OR&R-48; National Oceanic and Atmospheric Administration: Silver Spring, MD, USA, 2015. [CrossRef]
- Özpolat, H.B.; Bakan, G.; Kalıpci, E.; Temel, F.A.; Şimşek, A.; Dereli, M.A.; Ustaoğlu, F. Current status and comparative risk assessment of microplastic pollution in surface water and sediment from the Black Sea Coastline using geospatial analysis. J. Hazard. Mater. 2026, 502, 141046. [Google Scholar] [CrossRef] [Scilit]
- Dewitz, J. National Land Cover Database (NLCD) 2019 Products (Ver. 3.0, February 2024); US Geological Survey (USGS) Data Release; U.S. Geological Survey: Reston, VA, USA, 2021; p. 624. [CrossRef] [Scilit]
- Conover, W.J. Practical Nonparametric Statistics, 3rd ed.; John Wiley & Sons: New York, NY, USA, 1999. [Google Scholar]
- Xu, P.; Peng, G.; Su, L.; Gao, Y.; Gao, L.; Li, D. Microplastic risk assessment in surface waters: A case study in the Changjiang Estuary, China. Mar. Pollut. Bull. 2018, 133, 647–654. [Google Scholar] [CrossRef] [Scilit]
- Hakanson, L. An ecological risk index for aquatic pollution control. A sedimentological approach. Water Res. 1980, 14, 975–1001. [Google Scholar] [CrossRef] [Scilit]
- Ahmed, A.S.S.; Billah, M.M.; Ali, M.M.; Guo, L.; Akhtar, S.; Bhuiyan, M.K.A.; Islam, M.S. Microplastic characterization and factors influencing its abundance in coastal wetlands: Insights from the world’s largest mangrove ecosystem, Sundarbans. Environ. Sci. Pollut. Res. 2025, 32, 5435–5456. [Google Scholar] [CrossRef] [Scilit]
- Wang, J.; Chen, Z.; Wang, X.; Wang, Y.; Shi, H.; Huang, Y. Pollution level and distribution characteristics of heavy metals and microplastics in the soils from the Qionghai Lake Wetland, Southwest China. Gondwana Res. 2024, 136, 73–83. [Google Scholar] [CrossRef] [Scilit]
- Wang, G.; Lu, J.; Li, W.; Ning, J.; Zhou, L.; Tong, Y.; Xiayihazi, N. Seasonal variation and risk assessment of microplastics in surface water of the Manas River Basin, China. Ecotoxicol. Environ. Saf. 2021, 208, 111477. [Google Scholar] [CrossRef] [Scilit]
- Zhao, J.; Lan, R.; Wang, Z.; Su, W.; Song, D.; Xue, R.; Xing, B. Microplastic fragmentation by rotifers in aquatic ecosystems contributes to global nanoplastic pollution. Nat. Nanotechnol. 2024, 19, 406–414. [Google Scholar] [CrossRef] [Scilit]
- Yang, X.; Wan, Z.; Xiao, J.; Li, F.; Zhang, F.; Zhang, Z. Evaluation of niche, diversity, and risks of microplastics in farmland soils of different rocky desertification areas. J. Hazard. Mater. 2024, 466, 133603. [Google Scholar] [CrossRef] [Scilit]
- Sadhu, K.; Adhikari, K.; Gangopadhyay, A. Assessment of heavy metal contamination of soils in and around open cast mines of Raniganj area, India. Int. J. Environ. Eng. Res. 2012, 1, 77–85. [Google Scholar]
- Stovall, J.K.; Bratton, S.P. Microplastic pollution in surface waters of urban watersheds in central Texas, United States: A comparison of sites with and without treated wastewater effluent. Front. Anal. Sci. 2022, 2, 857694. [Google Scholar] [CrossRef] [Scilit]
- Zhou, X.; Xiao, S.; Ramirez, M.; Bracco, A. Modeling river and urban related microplastic pollution off the southern United States. npj Emerg. Contam. 2025, 1, 9. [Google Scholar] [CrossRef] [Scilit]
- da Costa, I.D.; Costa, L.L.; Zalmon, I.R. Microplastics in water from the confluence of tropical rivers: Overall review and a case study in Paraiba do Sul River basin. Chemosphere 2023, 338, 139493. [Google Scholar] [CrossRef] [Scilit]
- Laermanns, H.; Reifferscheid, G.; Kruse, J.; Földi, C.; Dierkes, G.; Schaefer, D.; Stock, F. Microplastic in water and sediments at the confluence of the Elbe and Mulde Rivers in Germany. Front. Environ. Sci. 2021, 9, 794895. [Google Scholar] [CrossRef] [Scilit]
- Christensen, N.D.; Wisinger, C.E.; Maynard, L.A.; Chauhan, N.; Schubert, J.T.; Czuba, J.A.; Barone, J.R. Transport and characterization of microplastics in inland waterways. J. Water Process Eng. 2020, 38, 101640. [Google Scholar] [CrossRef] [Scilit]
- Sutton, R.; Mason, S.A.; Stanek, S.K.; Willis-Norton, E.; Wren, I.F.; Box, C. Microplastic contamination in the San Francisco Bay, California, USA. Mar. Pollut. Bull. 2016, 109, 230–235. [Google Scholar] [CrossRef] [Scilit]
- Sreeparvathi, C.K.; Amal, R.; Remia, K.M.; Devipriya, S.P. Ecological assessment of microplastic contamination in surface water and commercially important edible fishes off Kadalundi estuary, Southwest coast of India. Environ. Monit. Assess. 2024, 196, 735. [Google Scholar] [CrossRef] [Scilit]
- Li, C.; Busquets, R.; Campos, L.C. Assessment of microplastics in freshwater systems: A review. Sci. Total Environ. 2020, 707, 135578. [Google Scholar] [CrossRef] [Scilit]
- Hoang, V.H.; Nguyen, M.K.; Hoang, T.D.; Ha, M.C.; Huyen, N.T.T.; Bui, V.K.H.; Nguyen, D.D. Sources, environmental fate, and impacts of microplastic contamination in agricultural soils: A comprehensive review. Sci. Total Environ. 2024, 950, 175276. [Google Scholar] [CrossRef] [Scilit]
- Jung, J.W.; Park, J.W.; Eo, S.; Choi, J.; Song, Y.K.; Cho, Y.; Hong, S.H.; Shim, W.J. Ecological risk assessment of microplastics in coastal, shelf, and deep sea waters with a consideration of environmentally relevant size and shape. Environ. Pollut. 2021, 270, 116217. [Google Scholar] [CrossRef] [Scilit]
- Schober, P.; Boer, C.; Schwarte, L.A. Correlation coefficients: Appropriate use and interpretation. Anesth. Analg. 2018, 126, 1763–1768. [Google Scholar] [CrossRef] [Scilit]
- Kataoka, T.; Nihei, Y.; Kudou, K.; Hinata, H. Assessment of the sources and inflow processes of microplastics in the river environments of Japan. Environ. Pollut. 2019, 244, 958–965. [Google Scholar] [CrossRef] [Scilit]
- Xiang, X.; Liu, Y.; Tang, L.; Xueying, L.; Xinrong, S.U. Microplastic pollution in Chinese Rivers: A detailed analysis of distribution, risk factors, and ecological impact. Mar. Pollut. Bull. 2026, 222, 118676. [Google Scholar] [CrossRef] [Scilit]
- Haque, M.R.; Ahmed, W.; Rahman, M.A.; Md Zulfiker Rahman, K.; Rahman, M.M. Aquatic insects as mediator for microplastics pollution in a river ecosystem of Bangladesh. Sci. Rep. 2025, 15, 15635. [Google Scholar] [CrossRef] [Scilit]
- Gray, A.D.; Wertz, H.; Leads, R.R.; Weinstein, J.E. Microplastic in two South Carolina Estuaries: Occurrence, distribution, and composition. Mar. Pollut. Bull. 2018, 128, 223–233. [Google Scholar] [CrossRef] [Scilit]
- Miller, J.; Barrett, N.; Love, J.; Gray, A.; Youker, R.; Hall, C.; Spafford, J. Temporal and Spatial Variations in Microplastic Concentrations in Small Headwater Basins in the Southern Blue Ridge Mountains, North Carolina, USA. Environments 2024, 11, 240. [Google Scholar] [CrossRef] [Scilit]
- Chaukura, N.; Kefeni, K.K.; Chikurunhe, I.; Nyambiya, I.; Gwenzi, W.; Moyo, W.; Abulude, F.O. Microplastics in the aquatic environment—The occurrence, sources, ecological impacts, fate, and remediation challenges. Pollutants 2021, 1, 95–118. [Google Scholar] [CrossRef] [Scilit]

Disclaimer/Publisher’s Note: The statements, opinions and data contained in all publications are solely those of the individual author(s) and contributor(s) and not of MDPI and/or the editor(s). MDPI and/or the editor(s) disclaim responsibility for any injury to people or property resulting from any ideas, methods, instructions or products referred to in the content. |
© 2026 by the authors. Licensee MDPI, Basel, Switzerland. This article is an open access article distributed under the terms and conditions of the Creative Commons Attribution (CC BY) license.