


Abstract
Growing concern over the presence of microplastics in food has led to the development of numerous methods for their extraction and analysis. However, many of these methods are time-consuming and limited to specific food types. In this study, we present a novel and quick approach involving microwave-assisted acid extraction of microplastics from food, followed by Raman microscopy analysis. The method’s performance was evaluated through determination of its digestion efficiency, particle mass and number recovery, limit of detection (LOD), and the digestion protocol’s effect on polymer physicochemical characteristics. The extraction protocol achieved 99.74–100.01% digestion of four different food matrices within 2 h, with 81.4–110.7% mass and 80–108% number recoveries of added polymer particles, both being within the 80–120% range. Importantly, DSC, TGA, DLS and Raman analyses of added particle polymers showed no significant change in PE, PP and PTFE polymer structure, while some structural changes were found for PET and PMMA. This method’s good analytical performance, high throughput and suitability for quick digestion of several different food matrices make it a promising step towards reliable monitoring of microplastics in food.
1. Introduction
The use of plastic materials has significantly contributed to the development of the modern world due to their numerous applications. As a result of the widespread use of plastics, over time and through various processes, plastic particles became present in the environment. By definition, plastic particles that are insoluble in water and of dimensions between 1 and 1000 μm are called microplastics, while those with dimensions up to 5 mm are called large microplastics [1]. Lately, public awareness of the presence of microplastics in the environment has increased, with microplastics being detected in freshwater and saltwater bodies, air and soil [2,3,4]. This awareness has only further increased with recent discoveries of the presence of microplastics in several different parts of the human organism, such as the respiratory tract, blood, stool, placenta, and breastmilk [5,6,7,8,9]. Entry of microplastic particles through ingestion, inhalation or dermal contact can lead to unwanted exposure to toxic additives, such as heavy metals, polychlorinated biphenyls (PCBs), bisphenol A, phthalates, brominated flame retardants, as well as pharmaceuticals and personal care products [10,11]. Some of these have been linked to adverse effects on human health, like endocrine disruption, carcinogenesis, birth abnormalities, aberrant sexual behavior and others [10]. With food being one of the major sources of microplastic particles in the human body, an accurate and consistent method of measuring the amount, size, and type of microplastic particles within food products is needed to assess the scope and origin of microplastic contamination.
According to Huang et al., microplastic detection methods can be divided into two comprehensive categories: physical and chemical characterization methods [12]. Physical methods are used to determine the physical properties of microplastic particles, such as their size, shape, color, and morphology, while chemical methods are used to identify the individual polymer type composition of microplastic particles, ensuring a comprehensive approach to microplastic research. Vibrational spectroscopic methods such as Fourier transform infrared (FT-IR) and Raman spectroscopy are counted as some of the more prominent members of this category. According to the meta-analysis and review on the topic of microplastic pollution and monitoring in seawater and harbor environments done by Belioka and Achilias, which processed data from 35 reviews spanning from 2000 to 2022, Raman microscopy, attenuated total reflectance (ATR) FT-IR microscopy and laser-directed infrared imaging (LDIR) accounted for 64% of all microplastic detection methods used [13].
With microspectroscopic methods, the end analysis usually takes place on the flat surface of a membrane filter used to filter the particle suspension, after which microplastic particles are commonly detected using automated software recognition and subsequent Raman/IR analysis of individual particles [14,15]. If too many non-plastic particles are present on the filter, the analyst is forced to resort to subsampling of particles on the filter surface using one of several proposed statistical models [15]. This can lead to results varying, depending on the size of the total analyzed area and lower particle size limit [14]. In addition to this, Raman spectroscopy is sensitive to fluorescence caused by the presence of inorganic, organic and biological impurities [14,15,16]. All of this means that the used sample preparation procedure should ensure that only microplastic particles are left remaining on the filter surface, which requires a near-complete removal of all organic and/or inorganic components present in the sample matrix. Furthermore, due to abundance of different food matrices, the procedure should be tested on several different food matrices to ensure its effectiveness.
In recent years, several reviews attempted to list the most common ways for extraction of microplastics from complex matrices and their subsequent detection [17,18,19,20]. Usually, procedures for microplastic extraction from food involve sample digestion and/or density separation, and more rarely, some other procedures such as ultrasound extraction, solid phase microextraction and magnetic extraction [20]. Microplastic extraction from biota or some other complex organic matrix such as food mostly boils down to organic matter removal, i.e., the digestion procedure, in which sample organic matter is chemically or enzymatically converted to a particle suspension and filtered through a membrane filter. Digestion procedures can roughly be divided into four different categories depending on the reagents used for the digestion procedure [19]. The first category is acidic digestion, where some type of acid solution such as HNO3, HCl, HClO4, H2SO4, or a combination thereof is used for the degradation of organic matter [21,22,23,24]. Second is alkaline digestion, using reagents such as NaOH, KOH, and others, such as tetramethylammonium hydroxide (TMAH), urea, or thiourea [25,26,27,28]. The third category is oxidative digestion, which uses either H2O2 or Fenton’s reagent [29,30,31,32], and the fourth category is enzymatic digestion, which uses various enzymes to break down proteins or carbohydrates selectively [25,33,34,35]. All listed digestion procedures vary in digestion effectiveness, as well as in their destructiveness towards different polymers [36]. In addition to digestion effectiveness and polymer susceptibility, duration also has to be taken into account. Some methods, in addition to or separately from digestion, use a density separation step, in which high-density (1.1–1.8 g/cm3) salt solutions such as NaCl, NaI, ZnCl2, etc., are used to separate polymer particles from more dense material (such as minerals) and float them to the surface, from where they can be more easily extracted [26,29,31,35]. In many of the used protocols for microplastic extraction, the sample preparation takes longer than one day, up to a whole week, which is challenging for their routine application for microplastic monitoring [37,38,39]. In addition to this, most of the described procedures are only tested on a single matrix type.
One of the newer, quicker, but less commonly used approaches to microplastic extraction is microwave-assisted digestion, which uses microwaves to heat up the mixture of a sample and an appropriate reagent. This approach has recently been utilized to successfully extract microplastics from sediments, marine organisms and food [23,24,40,41]. However, almost none of the published extraction procedures using this approach have directly combined microwave-assisted digestion with later detection and quantification using some microspectroscopic techniques but instead quantify microplastics either gravimetrically or visually. Furthermore, their use of concentrated acids or high temperatures (up to 200 °C) could limit their usefulness for extraction of a wide range of polymers. Combination of less concentrated acids with lower temperatures for this purpose has remained underexplored.
To summarize, an optimal protocol for microplastic extraction from food samples should be able to remove as much organic matter in as little time possible, all while being non-destructive to a sufficiently wide range of standard plastic polymers. In this work, we developed a simple, two-hour-long protocol for microplastic extraction from food, using closed vessel microwave-assisted acid digestion, which utilizes more moderate digestion temperatures (100–110 °C) and concentrations of HNO3 (8–10 M). This protocol is later coupled with particle detection and identification using Raman microscopy. We demonstrate the effectiveness of digestion on four different food matrices—bread, pepper, squid and tuna fish—which were selected as representatives for carbohydrates, fiber, protein and fat source foods. The effect on polymers in terms of added mass was evaluated by performing recovery experiments with five different common polymers (PE, PP, PET, PMMA and PTFE). Additionally, the digestion procedure’s effect on polymers’ physicochemical properties was studied in more detail by using DSC, TGA and dynamic light scattering (DLS).
2. Materials and Methods
2.1. Materials
During sample preparation, we used nitrile gloves, cotton lab coats, and pre-cleaned glass/metal tools. Sample preparation was done in a clean air cabinet to minimize airborne microplastic contamination. Four distinct food matrices were chosen: bread, pepper, tuna, and squid. All the listed ingredients were sourced from commercial food products, meaning the tuna and squid were obtained as meat. Squid meat was processed to ensure an accurate estimation of the method’s suitability for digesting squid consumable tissue. Processing of the squid consisted of: (i) rinsing squid tissue with filtered deionized water to remove surface contaminants; (ii) dissecting and removing the gastrointestinal tract; and (iii) rinsing the squid (muscle) tissue again with filtered deionized water.
These ingredients were then homogenized using a 6875 Freezer/Mill cryomill (SPEX SamplePrep, Metuchen, NJ, USA) and subsequently stored at −20 °C. Five different polymers were selected for use in experiments regarding digestion efficiency and mass recovery: high-density polyethylene (HDPE, powder, Sigma-Aldrich, Inc., St. Louis, MO, USA), polypropylene (PP, produced by cryomilling), polyethylene terephthalate (PET, produced by cryomilling), poly(methyl methacrylate) (PMMA, 250–300 µm particles, Cospheric LLC, Santa Barbara, CA, USA) and polytetrafluoroethylene (PTFE, produced by cryomilling). In experiments regarding recovery of added number of particles, high-density polyethylene (HDPE, produced by cryomilling) particles were used, along with above-described PP, PET, PMMA and PTFE particles.
The cryomilling procedures consisted of a 2 min precooling step in which either food matrix or plastic items, placed within grinding vials, were cooled to −196 °C using liquid nitrogen. After this, the samples were cryomilled for 4 min at a rate of 15 counts (impacts) per second (CPS).
In all experiments regarding the determination of either digestion efficiency or microplastic mass recovery, 250 mg of food matrix was weighed within the modified PTFE-TFM vessels for microwave digestion. In microplastic mass recovery experiments, 50 mg of one of the five listed polymer particles was weighed in the PTFE-TFM vessels along with the food matrix, bringing the total mass to 300 mg.
2.2. Microplastic Isolation
The microplastic isolation protocol used in this work is shown in Figure 1. Cryomilled samples were dried for 1 h at 100 °C, after which either 5.18 mL or 6.48 mL of 69% HNO3 (J.T. Baker, Avantor, Phillipsburg, NJ, USA), depending on the target concentration, was added to PTFE-TFM vessels containing the dried samples. The vessels were then placed in an ultrasonic bath (Sonorex, Bandelin electronic GmbH & Co. KG, Berlin, Germany) for 20 min at 35 kHz to prepare the sample for digestion. Next, either 4.82 mL or 3.52 mL of deionized water was added to the vessels, bringing the total volume of suspension to 10 mL and the concentration of HNO3 to either 8 M or 10 M, respectively. Afterward, the vessels were closed and subjected to the selected microwave digestion program using the ETHOS UP microwave digestion system (Milestone S.p.A., Sorisole (BG), Italy). The temperature program for the microwave digestion (Table 1) consisted of a temperature ramp to the selected temperature, a 100 min isothermal step at the selected temperature and a temperature ramp to room temperature. After the program ended, the vessel was taken out of the microwave system, and the remaining suspension was transferred into 50 mL glass centrifuge tubes and diluted to 50 mL using deionized water. Later, depending on the type of experiment, the suspension was filtered either through a Whatman Grade 4 filter paper (Cytiva, Marlborough, MA, USA) or a silicon membrane filter with 1 µm pores (SmartMembranes GmbH, Halle (Saale), Germany). There were 10 replicate experiments per sample type and results were presented as the average with standard deviations.
Figure 1.
Diagram showing all sample preparation steps used for microplastic isolation from food and its subsequent analysis using Raman microscopy.
Table 1.
Microwave digestion conditions.
2.3. Determination of Digestion Efficiency
To validate the microwave digestion protocol in terms of digestion efficiency, a series of experiments was performed, in which four listed food matrices were subjected to the described protocol for isolation of microplastics. The remaining suspension was filtered through a Whatman grade 4 filter paper. After the filtration, the filter paper was left to dry for 1 h at 100 °C. The filter paper was then left to cool to room temperature in a desiccator for 15 min, after which it was weighed.
The digestion efficiency was calculated using Equation (1):
where η represents the digestion efficiency, m2 represents the mass of a filter through which a digested sample solution was filtered, m1 represents the mass of the same filter before the filtration and msample represents the mass of the weighed sample of food.
2.4. Determination of Microplastic Recovery
Food matrices and polymers produced by cryomilling were subjected to two different types of recovery experiments. The first type involved the determination of microplastic mass recovery, while the second type involved the determination of recovery of added microplastic particles in terms of their number. Microplastic mass recovery was determined by performing a series of experiments in which five different plastic polymers (PE, PP, PET, PMMA and PTFE) were mixed with varying matrices of food and subjected to the described protocol for isolation of microplastics. The remaining suspension was in both cases filtered through a Whatman grade 4 filter paper. After filtration, the filter paper was left to dry for 1 h at 100 °C. The filter paper was then left to cool to room temperature in a desiccator for 15 min, after which it was weighed.
Microplastic mass recovery was calculated using Equation (2):
where Rm represents the mass recovery of added microplastics, m2 represents the mass of the filter through which a digested sample solution was filtered, corrected for the average residual mass of the sample matrix (obtained through digestion efficiency experiments). m1 represents the mass of the same filter before filtration and mpolymer represents the mass of the weighed polymer.
Recovery of microplastic particles in terms of their number was determined by manually adding 20 microplastic particles consisting of PE, PP, PET, and PTFE (five particles per polymer) of a 300–400 µm size range inside a QS-50 quartz insert (Milestone S.p.A., Sorisole (BG), Italy). Used particles were produced by cryomilling and sieving. To ensure the accurate count and identity of all manually added particles, before adding them to the quartz vessels, all particles were placed on a silicon filter, counted and identified before using the described analysis procedure (see Supplementary Materials, Figures S1–S10). After adding the particles, the quartz insert was filled with 10 mL of 10 M HNO3, capped, and placed inside a PTFE-TFM vessel containing 5 mL of deionized water. The vessel was then subjected to the described microwave digestion procedure, with the target temperature being 110 °C. The microwave digestion conditions, in terms of both HNO3 concentration and target temperature, were equal to those used on squid and tuna fish food matrices in digestion efficiency experiments (Table 1). The remaining suspension was filtered through a silicon membrane filter with 1 µm pores. Particles on the filter were counted and identified using the described analysis procedure. This experiment was performed in 10 replicates, with five replicates being prepared in the first, and the other five in the second batch. Recoveries of the added microplastic particles were calculated using Equation (3):
where RN represents the recovery of the added number of microplastic particles, N2 represents the number of successfully identified microplastic particles on a filter through which a digested sample solution was filtered, while N1 represents the number of successfully identified microplastic particles on the same filter before filtration. In addition to recovery, both repeatability and intermediary precision were calculated by following the International Council for Harmonization (ICH) guidelines [42].
2.5. Determination of the Method Limit of Detection (LOD)
To determine the lowest number of polymer particles detectable using the method consisting of sample preparation using microwave acid digestion with subsequent detection and quantification using Raman microscopy, the method limit of detection (LOD) needed to be determined. This was done by performing 10 Raman microscopy analyses of filters deriving from method procedural blank samples, which were subjected to the described procedure for isolation of microplastics. Two different types of LOD determination procedures were used based on the type of vessel used for microwave digestion. In the initial set of experiments, all reagents were added inside a PTFE-TFM vessel. In the later set of experiments, reagents were added inside a quartz insert which was then capped and placed inside a PTFE-TFM vessel containing 5 mL of deionized water. From this point, all sample preparation steps were the same as in all other experiments. The remaining suspension was filtered through a silicon membrane filter with 1 µm pores, and the particles on the filter were counted and identified using the described analysis procedure. LOD was calculated for each detected polymer type and each of the four different size ranges: 1–50 µm, 50–100 µm, 100–500 µm and >500 µm. Calculation of LOD was done using Equation (4), where represents the average number of particles found in 10 procedural blanks and represents the standard deviation of the 10 measurements:
2.6. Effect of the Digestion Protocol on the Physicochemical Properties of Polymers
The effect of the protocol used on selected polymers was investigated using Raman spectroscopy, differential scanning calorimetry (DSC), thermogravimetric analysis (TGA), dynamic light scattering (DLS) and optical microscopy.
Raman spectra of polymers before and after the digestion procedure were obtained using a DXR3xi Raman Imaging Microscope (Thermo Scientific, Waltham, MA, USA). The spectra were acquired using a 532 nm laser, filter and grating set, with a 25 µm pinhole. The laser power was 10 mW, the exposure time was 0.05 s, and the number of scans was 30.
The influence of the digestion protocol on polymer thermal properties was investigated using a Mettler Toledo DSC3 differential scanning calorimetric analyzer (Mettler-Toledo AG, Greifensee, Switzerland), calibrated using the melting temperature and enthalpy of indium, and a Mettler Toledo TGA/DSC3+ thermogravimetric analyzer (Mettler-Toledo AG, Greifensee, Switzerland). For DSC analysis, samples were heated in two heating runs: first from −60 to 160 °C and then from −60 °C to 260 °C/350 °C at a heating rate of 10 °C/min in a nitrogen atmosphere. Thermogravimetric analysis monitored the mass change with the temperature change at a heating rate of 10 °C/min in a nitrogen atmosphere to 650 °C and from 650 to 900 °C in an air atmosphere.
Preliminary analysis of polymer particle size and morphology before and after the digestion protocol was conducted using the Olympus BX53M optical microscope (Olympus Corporation, Tokyo, Japan) with 50 to 1000 times magnification ability. A more detailed particle number and size distribution analysis was done using the Malvern DLS instrument (Malvern Panalytical Ltd., Malvern, UK) with a measuring size range of 0.1 nm to 10 µm. Polymer particles were dispersed in PAO6 oil or glycerol, depending on the respective densities of used polymers.
2.7. Particle Analyses
Microplastic analyses for LOD determination experiments, microplastic recovery experiments, and food analyses were all performed in the same way, using the DXR3xi Raman Imaging Microscope (Thermo Scientific), with its corresponding software, OMNICxi (version 2.3.3.14, Thermo Fisher Scientific, Waltham, MA, USA). Instrument performance was verified in several different ways. The performance verification procedure was automatically performed by the OMNICxi software (Thermo Scientific), and it consisted of measuring characteristic polystyrene peak wavenumbers using a polystyrene reference standard (Thermo Fisher Scientific, Waltham, MA, USA). In addition, alignment and calibration were performed for the 532 nm laser, filter and grating set, which was used in all later analyses and measurements.
In all microplastic analyses, the silicon filter containing the microplastics was first fixed on the corresponding filter holder, which was then placed on a stage holder inside the microscope. All microplastic analyses were performed using an Olympus 20x apochromatic objective, dark-field mode of illumination, with the following laser conditions: laser power of 10 mW, exposure time of 0.05 s, and 30 scans. Particles were located on the filter surface using the software’s particle finding feature. Selected particles were then analyzed using the specified conditions, after which the results were reviewed. Library identification was made using a commercial OMNIC Raman spectral library (HR FT-Raman Polymer Library) containing Raman spectra of different polymers and using the following spectral range: 3400–1100 cm−1, 900–600 cm−1, and 450–50 cm−1. The acceptance criterion for positive identification was a similarity of particle spectrum to a spectrum in the Raman spectral library equal or higher than 80%. Spectra of particles with similarities lower than 80% could be added if, after spectral processing (smoothing and/or baseline correction), they showed a similarity value equal or higher than 80%.
In addition to all previously mentioned experiments, a set of microplastic analyses was performed on five real-world, commercially sourced food samples, each presenting a different type of food matrix. The analyses were done by following the described method for microplastic extraction and analysis, to demonstrate its effectiveness. The tested food samples were: ketchup, pate, chocolate, ice cream and croquettes. Results of all analyses are available in the Supplementary Materials (Table S2).
2.8. Contamination Control
Other than PTFE-TFM vessels for microwave digestion, all experiments were performed using glass and metal equipment. All equipment was cleaned by first washing it with detergent, followed by rinsing with particle-free deionized water, after which they were covered with aluminum foil. During all experiments, a cotton lab coat and nitrile gloves were worn. During drying, sonication and all transfer steps, the TFM vessels were covered using aluminum foil. The filtration step was performed inside a fume hood, inside which the surfaces were wiped down with ethanol. After filtration, silicon filters were stored in closed containers to avoid airborne particle contamination.
After mass recovery experiments, special care was taken to carefully clean the PTFE-TFM and later quartz vessels. After cleaning them with detergent and particle-free water, the vessels underwent a microwave-assisted cleaning procedure using a mixture of 2 mL of 30% H2O2 (Honeywell, Seelze, Germany) and 8 mL of 69% HNO3, followed by heating them to 200 °C for 35 min.
3. Results
3.1. Digestion Efficiency
A series of experiments using the digestion protocol described above was performed to test whether the described microwave digestion protocol is suitable for complete destruction of the food sample matrix, and whether it is applicable to a wide enough range of different food matrices. The results of the experiments are shown in Table 2. Average digestion efficiencies close to 100% were obtained for all tested food matrices.
Table 2.
Digestion efficiency of the microwave digestion protocol.
3.2. Determination of Microplastic Mass Recovery
To validate the microwave digestion protocol in terms of microplastic mass recovery, a series of experiments was performed, in which five different plastic polymers (PE, PP, PET, PMMA and PTFE) were mixed with one of four different food matrix types (bread, pepper, tuna, squid) and subjected to the described protocol of sample preparation, after which their final and initial weights were compared. Calculated average mass recoveries of added plastic polymers are listed for each matrix and polymer type in Figure 2. For bread, pepper, tuna and squid food matrices, the average mass recoveries for all five polymers ranged 96–111%, 81–103%, 88–106, and 85–108%, respectively.
Figure 2.
The results of the mass recovery experiments. Recovery percentages are expressed on the y-axis, while each food matrix is expressed on the x-axis.
3.3. Determination of Microplastic Number Recovery
A series of microplastic experiments was performed, in which microplastic particles of five different polymers (PE, PP, PET, PTFE, and PMMA) were subjected to the most destructive microwave digestion protocol, after which the particles were filtered and analyzed using Raman microscopy. The first set of experiments involved using PMMA particles, which had their number, shape and dimensions heavily affected by the microwave digestion. Since PMMA particle residue affected the software detection of the remaining polymer particles, the experiments were repeated using the remaining four polymers. Five particles per polymer were added in each experiment, bringing their total to 20 particles per experiment. Particle recovery, repeatability and intermediary precision were calculated using numbers of the identified individual polymer particles. Images of one of the filters containing polymer particles before and after being subjected to the digestion procedure are shown in Figure 3. The rest of the filter images are available in Supplementary Materials (Figures S1–S10). All results are shown in Table 3.
Figure 3.
PET (red), PTFE (green), PE (yellow) and PP (blue) particles before (upper row) and after (bottom row) the microwave-assisted digestion procedure.
Table 3.
Results of microplastic number recovery experiments.
Changes to particle length and width ranged from −53.3 to 0.9%, and from −34.3 to 3.4%, respectively. Using the described method, average recoveries of 80–108% were obtained, with intermediary precision values of 7–55%.
3.4. Determination of Method Limit of Detection (LOD)
To determine the lowest number of polymer particles detectable using the method consisting of sample preparation using microwave acid digestion with subsequent detection and quantification using Raman microscopy, the method LOD was determined from 10 analyses of microplastics on filters deriving from method procedural blank samples, which were subjected to all the same sample preparation steps. Two different sets of LOD determination experiments were performed. In the initial set of experiments, all reagents were added inside a PTFE-TFM vessel. Later, due to the observed high count of PE particles, the LOD determination experiments were repeated using quartz inserts. Example of a filter from initial blank experiments done using PTFE-TFM vessels is shown in Figure S11 in the Supplementary Materials.
Calculated LOD for this method is listed in Table 4, and consists of 2 PE particles, 10.7 PP particles, 15.3 PTFE particles and 5.5 PET particles. All identified particles belonged to the 1–50 µm, 50–100 µm, and 100–500 µm range.
Table 4.
Method limit of detection (LOD) with quartz vessels.
3.5. Effect of Digestion Protocol on Physicochemical Properties of Polymers
To assess the influence of the digestion protocol, the polymer particles were analyzed before and after digestion. Raman microscopy was used to determine the impact of the proposed digestion protocol on the chemical composition of polymers. Raman spectra of all used polymers before and after being subjected to extraction procedures from tuna are shown in Figure 4, while all other spectra, including the one from tuna, are shown in the Supplementary Materials (Figures S13–S33). Both characteristic and measured polymer Raman bands are shown in Table S1 in the Supplementary Materials.
Figure 4.
Raman measurements of polymers before (upper spectrum) and after extraction (bottom spectrum) from food (matrix tuna): (a) PE, (b) PET, (c) PMMA, (d) PP, (e) PTFE.
As shown in Figure 4, the Raman spectra of polymers before and after digestion show no significant differences. Characteristic Raman bands of all mentioned polymers were accounted for in all analyses and did not show any noticeable increase or decrease in intensity, nor widening (Table S1). After extracting from various food matrices, all polymers were successfully identified using the Raman spectral library search.
Optical microscopy was used to determine whether there were macroscopic changes in the morphology or size of the particles. Thermogravimetric analysis in conjunction with calorimetry results will show whether the process has altered the polymer’s thermal stability, suggesting that the polymer’s degradation has taken place. Finally, the dynamic light scattering results will indicate whether the particle size population from 1 nm to 10 μm has changed significantly. This range was focused on ensuring that the process does not degrade the microparticles present to nanoparticles or, if they are present that they are not further degraded to their monomer components.
From Figure 5a, we can see no difference in particle size and morphology on the microscopy images. The thermal analysis showed that the thermal curves of the TGA and DSC results are almost identical for samples before and after digestion (Figure 5c,d). Although the particles are commercially designated as a powder with a size of 34–50 µm, smaller particles (<6 μm) are also present, which, according to DLS, are divided into two populations of 20–40 nm and 660–2200 nm (Figure 5b). After digestion, similar populations (20–100 nm and 360–1900 nm) were detected.
Figure 5.
PE; (a) optical microscopy photograph before (vertical picture) and after (two horizontal pictures) digestion; (b) DLS results; (c) TGA results; (d) DSC results.
From Figure 6a, we can see no difference in particle size and morphology on the microscopy images. TG curve shows a change following digestion (Figure 6c). It shows a mass loss of about 10% up to 350 °C, which is not true for untreated PP. A decrease in melting temperature and melting enthalpy of PP after digestion was observed by the DSC (Figure 6d). Since this sample was prepared by cryogenic grinding, smaller particles (<6 μm) are present, divided into two populations of 30–50 nm and 660–1900 nm, according to the DLS. After digestion, negligible changes were observed in the populations (20–70 nm and 350–2500 nm).
Figure 6.
PP; (a) optical microscopy photograph before (vertical picture) and after (two horizontal pictures) digestion; (b) DLS results; (c) TGA results; (d) DSC results.
Optical microscopy, DLS, TGA and DSC experiments were performed on PTFE samples, and their results showed no difference was found between the untreated and post-digestion samples, as shown by the (Figure 7).
Figure 7.
PTFE; (a) optical microscopy photograph before (vertical picture) and after (two horizontal pictures) digestion; (b) DLS results; (c) TGA results; (d) DSC results.
For PMMA, morphological differences were observed between the micrographs of the sample before and after digestion (Figure 8a). The TGA results show a slight decrease in the thermal stability of PMMA after digestion (Figure 8b). To further investigate the influence of digestion on PMMA, gel permeation chromatography was conducted (Figure S33). For both samples, main mass distribution has an average Mw around 226 kg/mol. Sample before digestion has a small mass distribution around 5000 kg/mol which is not detected after the digestion. The DSC shows small changes in the cp value (Figure 8c). No particles smaller than 10 μm were detected in the DLS before or after digestion.
Figure 8.
PMMA; (a) optical microscopy photograph before (vertical picture) and after (two horizontal pictures) digestion; (b) TGA results; (c) DSC results.
Polyethylene terephthalate has shown a drastic change in morphology, with particles larger than 200 μm before digestion, while most are smaller than 100 or even 10 μm after digestion (Figure 9a). A significant change can also be seen in the TG curve, in which PET shows a two-stage degradation after digestion, with about 55% of the mass being lost in the first stage up to 400 °C (Figure 9c). The DSC curve of PET before and after digestion is similar up to 260 °C (Figure 9d), after which it drops steeply. The DLS results (Figure 9b) show a shift in the particle population to smaller sizes after digestion (from 30 to 110 nm and 500–3000 nm to populations of 25–50 nm and 380–2000 nm).
Figure 9.
PET; (a) optical microscopy photograph before (vertical picture) and after (two horizontal pictures) digestion; (b) DLS results; (c) TGA results; (d) DSC results.
4. Discussion
4.1. Method Digestion Efficiency
Results in Table 2 show that a complete digestion was reached, with average digestion efficiencies obtained with all food matrices being 100%. This high digestion efficiency was important to obtain because even a small amount of undigested matter retained on the silicon filter can present an issue for particle detection and cause unnecessary prolongation of microplastic analysis; this is often the case for the so-called particle-by-particle approach to microplastic analysis, where particles are first identified based on the visual contrast and then analyzed individually. The chemical imaging approach is less sensitive to this problem but usually takes much longer than particle-by-particle analyses.
4.2. Method Microplastic Mass Recovery
Results in Figure 2 show high recovery for all selected plastic polymers, mostly between 90 and 100%. The lowest recoveries were obtained for PET (81–103%), which was to be expected, given each respective polymer’s resistance to acids. It can be noted that there was a significant drop-off in mass recovery between bread and the rest of the food matrices, most likely due to the milder conditions used for microwave digestion of bread samples, as shown in Table 1. (8 M HNO3 and target temperature of 100 °C). The highest recovery was expected for PTFE particles since PTFE as a material has the highest chemical resistance. However, this was not the case, given that the recoveries for PTFE were slightly lower than for other polymers except PET. The likely explanation for this is the increased difficulty of transferring all the particles from the solution to the filter paper because of its smaller particle size, due to which more particles were more likely to remain stuck on the container walls, and the highest density of all used polymers, which made the particles sink quickly to the bottom. Recoveries higher than 100% have several possible explanations, one of which is insufficient drying of the particle powder and the other being adsorption of certain types of molecules to the particle surface, such as nitric oxides deriving from the used nitric acid or other molecules such as lipids deriving from the sample itself. For all polymers other than PMMA, the powder form of added polymers was retained after digestion, but PMMA particles quickly stuck together in one large mass.
4.3. Method Microplastic Number Recovery
A series of microplastic experiments was conducted in two separate extraction batches to determine method’s accuracy and precision, by calculating average recovery, repeatabilities for each batch, and intermediary precision. Alongside this, using particle length and width values before and after the extraction, changes in dimensions of added particles were determined. Average particle recoveries for all polymer types, shown in Table 3, ranged from 80 to 108%, indicating a good accuracy of the developed method. Given the nearly 100% mass recovery value for PE and PP, along with the relatively small change in particle dimensions, the lower than 100% recovery of PE and PP particles can probably be attributed to the imperfect transfer of particles to the filter during filtration. On the other hand, for PET, a particle recovery value higher than 100% and a sizable average reduction in dimensions are caused by the fragmentation of PET particles due to the more significant number of resulting, smaller particles. This is further demonstrated by a substantially larger intermediary precision value calculated for PET (55%) than the ones for PTFE, PE and PP (6, 24 and 27%, respectively).
4.4. Method Limit of Detection (LOD)
LOD for this method was calculated from the results shown in Table 4, using the formula recommended in a paper by Schymanski et al. [15] and has been commonly used in the literature [43,44,45]. Unexpectedly, the results of initial experiments done using PTFE-TFM vessels alone showed a high count of polyethylene particles in the 1–50 µm range, resulting in a high LOD (an example filter image is available in Supplementary Materials as Figure S11). To tackle this issue, LOD experiments were repeated with the use of quartz inserts for PTFE-TFM vessels, with the reasoning being that by using the mentioned inserts, outside contamination would be excluded. Results of these experiments are shown in Table 4, and they show a significant improvement upon the results of previous LOD experiments (an example filter image is available in Supplementary Materials as Figure S12).
The results from the first set of LOD experiments tell us a few different things. First, since the polyethylene contamination was eliminated in the second set of LOD experiments, this excludes the possibility of contamination originating from either of the sample preparation steps. Second, since the sample preparation protocol does not likely cause contamination, contamination was more likely caused by the residues of polyethylene particles from the polymer mass recovery experiments. This hypothesis was later confirmed after analyses of blank samples prepared using vessels cleaned by a more aggressive vessel-cleaning microwave protocol (2 mL of 30% H2O2 + 8 mL of 69% HNO3 for 35 min, with a maximum temperature of 200 °C), which were shown to have similar particle counts as the ones obtained by using quartz inserts. Polypropylene particles found in the blanks could possibly originate from the caps on the bottles used for storing deionized water and HNO3. PTFE particles likely originate from the PTFE-TFM vessels used to hold the quartz inserts. PET particles do not have a clear origin and could possibly be explained by airborne contamination during brief periods when the vessels were not covered. Conclusions from these experiments are that using quartz inserts to reduce the method LOD for this application is advantageous and that a good vessel cleaning procedure is necessary to prevent particle contamination.
4.5. Extraction Protocol Effect on Physicochemical Characteristics of Polymers
Spectra of polymers before and after their extraction from food contained all the corresponding characteristic Raman bands, without any noticeable increase or decrease in their intensity, nor widening (Table S1). Furthermore, all the polymers were successfully identified after their extraction from the food matrix. All of this indicates that any potential differences in the chemical composition of polymers caused by the digestion protocol do not influence their later identification in a routine microplastic analysis.
Optical microscopy images were obtained for PE particles before and after the digestion procedure (Figure 5a), which showed no difference in particle size and morphology, meaning no visual degradation occurred during the digestion. This is also confirmed by the thermal analysis, where the thermal curves of the TGA and DSC results are almost identical (Figure 5c,d). Furthermore, DLS experiments observed similarly sized particle populations before and after, meaning no degradation has occurred.
Optical microscopy images of PP particles shown in Figure 6a show no difference in particle size and morphology, meaning no visual degradation occurred during digestion. However, a change in the TG curve after digestion (Figure 6c) was observed, showing a mass loss of about 10% up to 350 °C, which is not true for untreated PP. This difference could be due to partial degradation or because part of the food matrix was adsorbed onto the polymer particles. The decrease in melting temperature and melting enthalpy of PP after digestion observed in the DSC (Figure 6d) could be due to the plasticization effect, suggesting that part of the food matrix was adsorbed onto the polymer particles. Negligible changes observed in the particle size populations after digestion indicate that no significant degradation has occurred.
The PTFE particles were shown to remain unchanged after the digestion, as shown by the optical microscopy, DLS, TGA and DSC results (Figure 7).
In the case of PMMA, morphological differences between the micrographs of the sample before and after digestion (Figure 8a) were observed. Before digestion, the particles are round spheres of uniform size; after digestion, these spheres are “melted” and bonded together. This effect is well known in the literature as polymer sintering and similar morphologies were observed during 35–65 min sintering of PMMA at 203 °C [46]. The TGA results show a slight decrease in the thermal stability of PMMA after digestion, indicating that some degradation may have taken place, but in minimal amounts (Figure 8b). Gel permeation chromatography experiments were conducted (Figure S33). For both samples, main mass distribution has an average Mw around 226 kg/mol. Absence of the small mass distribution around 5000 kg/mol, previously observed in the sample before digestion implies that the longest-chain PMMA polymers are prone to main-chain breakage. Because of polymer main-chain breakage, a higher number of shorter chain PMMA molecules is present in the sample after the digestion, and thus the main signal (Mw around 226 kg/mol) is of higher intensity. The DSC experiments showed only slight changes in the cp value (Figure 8c). Since no particles smaller than 10 μm were detected in the DLS before or after digestion, this indicates that the small amount of degradation did not produce smaller particles. Overall, the results suggest that PMMA tends to form larger particles during digestion, which means that the number of particles is not preserved, but the mass of the plastic is.
Polyethylene terephthalate has shown a drastic change in morphology, with particles larger than 200 μm before digestion, while most are smaller than 100 or even 10 μm after digestion (Figure 9a). A significant change can also be seen in the TG curve, in which PET shows a two-stage degradation after digestion, with about 55% of the mass being lost in the first stage up to 400 °C (Figure 9c). The DSC curve of PET before and after digestion is similar up to 260 °C, indicating that no food is adsorbed on the particles (Figure 9d). After 260 °C, the DSC curve drops steeply, which could be attributed to the presence of PET oligomers, which in turn confirms that digestion has taken place [47]. The DLS results (Figure 9b) showed a shift in the particle population to smaller sizes after digestion. These results are consistent with other methods, confirming that degradation (hydrolysis) of the PET particles occurs during digestion. PET hydrolyses kinetics at similar conditions were studied by Yoshioka et al., and they determined that at 100 °C and 7 M HNO3 there was around 10% mass loss while at 10 M there was around 30% mass loss after 4 h of exposure [48]. Our average mass recovery results for 10 M experiments follow a similar trend with mass loss between 12% and 19%.
4.6. Development of the Microwave Digestion Protocol
This work aimed to find a protocol suitable for routine microplastic analysis using microspectroscopic methods, with a specific focus on Raman microscopy. The use of microwave-assisted digestion in this work was inspired by the use of this kind of procedure in the works of Bitencourt et al., Lievens et al. and Hildebrandt et al. [23,24,49]. In the works of Bitencourt et al. and Lievens et al., the application of microwave-assisted digestion for gravimetric determination of microplastics was investigated and optimized, along with the effect of the applied protocols on a wide range of polymers [23,24]. Hildebrandt et al. described a multi-step sample preparation for the analysis of microplastics, including a microwave-assisted oxidative digestion step, leading to later detection and quantification of microplastic particles using laser-directed infrared imaging (LDIR) [49]. While microwave-assisted extraction of microplastics existed as a concept, it either used too-high temperatures (up to 200 °C) and/or acid concentrations to allow for quantification of microplastic particles using microspectroscopic methods, or it consisted of several time-consuming steps. Influenced by the mentioned papers, we wanted to see if it was possible to use lower temperatures and acid concentrations to develop a quick, single-step microwave-assisted digestion procedure for the extraction of microplastics, compatible with later identification and quantification using Raman microscopy.
4.7. Factors Influencing the Sample Preparation
As mentioned in the introductory section, when preparing samples for microplastic analysis, the analyst is faced with many factors influencing the analysis’s success, with most of them being related to the digestion efficiency of the sample. Low sample digestion efficiency results, at best, in an abundance of matrix-deriving particles, that increases the overall time of analysis and, at worst, results in filter clogging. To avoid both scenarios, we aimed to optimize sample weight, sample digestion procedure, reagent type and concentration, digestion temperature and duration, and the type of filters used for filtration and subsequent microplastic analysis.
Food matrices differ significantly in their content, examples being protein-rich matrices such as various types of meat, starch-rich matrices such as various types of baked bread, and cellulose-rich samples such as fruit and vegetables. Sample weight is likewise one of the deciding factors in the later digestion efficiency. Working with the constraints regarding HNO3 concentration, digestion temperature, and the digestion efficiency needed for subsequent microplastic detection on the silicon filter, an appropriate default sample weight needed to be chosen. With most of the tested food matrices proving too difficult to completely digest within 2 h above 0.25 g, a default sample weight of 0.25 g was chosen. With further improvement of the protocol in terms of reagent type and digestion program duration, and depending on the sample matrix, the sample weight can be further increased. Furthermore, with the described microwave digestion protocol, up to 15 parallel samples can be processed and later combined (pooled) in the same mixture, bringing the total sample weight up to 3.75 g. However, one needs to be mindful that this kind of decision could influence the method LOD, which means that the degree of influence of sample combining on the method LOD should be determined.
One of the significant challenges of microplastic analyses is the excess of organic matter on the filter, interfering with particle detection and identification. There are several possible types of digestion for microplastic extraction based on the choice of the reagent, namely oxidative digestion, acid digestion, alkaline digestion, enzymatic digestion, or some combination thereof. Of all listed approaches, acidic digestion using HNO3 is very effective in organic matter removal. However, its use is commonly discouraged due to its aggressiveness regarding some common polymer types, such as PET and nylon. However, the use of dilute solutions of HNO3 has somewhat been overlooked. To develop the digestion protocol described in this work, we used 8 M and 10 M (approximately 50% and 63% w/w) HNO3 to maximize digestion efficiency, while limiting its destructive effect. Despite this, when discussing the choice of reagents for microplastic extraction, certain types of polymers such as acrylonitrile butadiene styrene (ABS), polyamide (PA) and polyurethane (PU) are likely not compatible with HNO3 as a reagent, since some microplastic extraction protocols using acids have been shown to cause their degradation [50,51]. This would make the choice of HNO3 for this application a compromise.
The remaining factors related to the digestion process are the digestion temperature and duration. The temperature of the digestion solution is one of the most contributing factors to the digestion efficiency and the degradation of polymers. When discussing microplastic extraction, the most common requirement for an extraction protocol is to keep the digestion temperature below the melting point of all possible plastic polymers, typically below 70 °C. At first glance, use of temperatures as high as 110 °C, such as the one used in this work, may seem odd, since it may lead to partial melting, softening, or a change in shape of certain polymers, and this can affect number of particles. However, in this scenario, particle mass is still preserved, allowing determination of microplastic mass content. It is important to note that the use of high temperatures can potentially lead to the release of harmful fumes, and therefore should be conducted in a well-ventilated area. The duration of the digestion is closely linked to the chosen temperature, which means that decreasing the temperature increases the needed duration and vice versa. The idea of our method development was to present a sample preparation protocol, which could be used to extract and analyze microplastic particles within one day, which would greatly increase the throughput and therefore, the likelihood of it being applied for microplastic testing in a commercial laboratory setting. With this in mind, we kept the duration of dilute nitric acid digestion down to a few hours (2 h), which meant that the temperature needed to be increased to a certain point. The benefits of our method in a commercial laboratory setting include faster turnaround times for sample analysis, increased efficiency in sample processing, and the potential for cost savings due to reduced labor and equipment usage. With further development of this kind of microwave digestion, the duration could be increased, allowing for a further decrease in temperature.
When considering the selection of an appropriate filter type, there are a few things to keep in mind. First, the filter material must be compatible with the reagent solution used for the extraction of microplastic. Silicon as a material is chemically resistant, so there is no issue with filtering the final solution, as per the described sample preparation protocol. Next, the filter material needs to be suitable for the chosen technique for microplastic detection. In the case of Raman and FTIR microscopy, the appropriate materials are the ones with inorganic metal surfaces, such as silicon, aluminum oxide and gold or silver-coated polycarbonate filter membranes. The last things to consider are the filter surface and pore size. Increasing the filter surface allows for a less dense distribution of particles on the filter and easier filtration, but it can lead to some complications with later instrument analysis. Likewise, increasing the pore size helps the filtration process. Still, increasing pore size above 1 µm (roughly the lowest size of particles detectable by Raman microscopy) means that the lowest detectable size of microplastic particles increases as well. It should also be noted that the use of filters with pore size of 1 µm means that particles smaller than 1 µm are not retained, meaning that our method is limited to analyzing particles larger than 1 µm and as such is not suitable for nanoplastic analysis. However, even though the theoretical particle size limit of Raman microscopy is around 300 nm, some studies, such as the one by Barchiesi et al., set the size limit for automatic particle analysis using Raman microscopy at 5 µm [52,53]. This means that using filters with pore sizes smaller than 1 µm will not necessarily yield successful identifications of particles smaller than 1 µm.
Other factors that contribute to the success of digestion to a certain extent during the development of this method were cryomilling, drying and ultrasound bathing. The first step in our protocol is cryomilling, because during the protocol development it became evident that the sample state played a prominent role in the later digestion efficiency. Another significant step after sample weighing, which appears to have an influence on digestion efficiency, is the drying step. The reason behind this is unclear, but it could be related either to the water content reduction, or more likely to enhancement of the later short ultrasound bath step with concentrated nitric acid, due to increased reaction mixture temperature. The ultrasound bath step using concentrated nitric acid is relatively short (15 min), but it likely helps by dispersing the particles of organic matter, making them susceptible to attack by nitric acid.
4.8. Comparison with Other Protocols
To have an honest evaluation of the described method’s success, it needed to be compared with some of the existing protocols. Table 5 lists different sample preparation procedures, all of which have different digestion protocols, including the ones with protocols involving microwave-assisted digestion. The table includes only selected sample preparation protocols which deal with digestion of organic tissue.
Table 5.
Comparison of our approach with other currently available protocols.
A couple of conclusions can be drawn. First, protocols involving microwave-assisted digestion are inherently quicker than the ones involving usual digestion treatments, with total time for sample preparation being counted in hours rather than in days. Our developed protocol is not the quickest among the microwave-assisted digestion protocols, because it needed to be able to digest different types of organic materials, all with different susceptibilities to nitric acid attack. Despite this, 3–4 h needed for the entire sample preparation is significantly quicker than most of the existing protocols.
Second, very few of the listed protocols link the sample preparation with later detection and quantification of individual microplastic particles using some of the microspectroscopic approaches, which is crucial for developing routine methods for determining number, size and chemical type of polymer microparticles. This could be explained by the high digestion efficiency needed for the removal of all organic matter, so it does not end up on the filter and impede microplastic analysis. Our developed protocol achieves 100% digestion efficiency, leaving very little organic residue on the filter.
Third, almost none of the developed protocols are tested against more than one type of sample matrix, with most of them being applied to some type of marine organism. Our developed protocol has been tested against four different food matrices, with differing chemical compositions, proving that it is applicable to a wider range of different foods.
Fourth, very few of the listed papers describe full method validations, involving the determination of accuracy, precision, and LOD. Furthermore, analyses on five different real-world samples were successfully performed, and their results are available in Supplementary Materials (Table S2). Our method has been validated using several performance criteria, separate from the study of digestion effect on polymers.
It needs to be pointed out that our developed protocol is not optimized and needs further improvement to reach its full potential. First, the observed destructive effect of nitric acid solution on PET and PMMA could potentially hinder accurate quantification of these polymers. It is likely that the digestion temperature needs to be lowered, with or without reducing the acid concentration. This would likely lead to somewhat longer duration of the needed digestion process. Next, the sample weight could also be increased, with appropriate adjustments to the digestion conditions. However, there is likely a practical limit to the maximum sample weight with which an acceptable digestion can be achieved, defined by the maximum volume of the quartz vessels (50 mL). Next, the individual contributions of all sample preparation steps to the overall digestion efficiency need to be evaluated. It is also likely that the protocol would benefit from some type of enzyme pretreatment to help with later digestion, but this would imply adding another step, increasing the overall time needed for sample preparation. All listed points could appropriately be addressed by performing a detailed factorial analysis to formally optimize the protocol, similar to the ones performed in papers by Fraissinet et al. and Lievens et al. [24,41]. However, this type of analysis was not within the scope of this work and will be the subject of future research.
5. Conclusions
A novel method for quick microplastic extraction and detection was developed and validated. This method involves the extraction of microplastic particles from food samples using microwave-assisted acid digestion in only 2 h, and their later detection, identification and quantification using Raman microscopy. Its applicability to several different food matrices is demonstrated by the near-100% digestion efficiency determined for bread, pepper, tuna and squid food matrices. The method’s accuracy is reflected in the high average recoveries of added polymer particles (80–108%).
The method’s impact on the physicochemical properties of polymers was studied. Little to no destructive effect was observed for PE, PP, and PTFE, while evidence of morphological change and degradation was found for PMMA and PET. Importantly, all five polymers were successfully identified using Raman microscopy after their extraction from four different food matrices. Moreover, high values of mass recovery were observed for all studied polymers, with all values falling within the 81–110% range. These results demonstrate that, for PE, PP, and PTFE, the method preserves the polymers sufficiently, allowing for their accurate identification and quantification. For PMMA and PET, the method was shown to preserve the particles well enough to allow for good mass recovery and their accurate identification, but not well enough for their accurate quantification.
The results of this work have the potential to significantly advance the field of microplastic analysis in food matrices. The method’s efficiency and accuracy make it a promising candidate for routine use. Furthermore, the results can serve as a valuable resource for future efforts to optimize microplastic extraction methods.
Supplementary Materials
The following supporting information can be downloaded at: https://www.mdpi.com/article/10.3390/microplastics5010045/s1, Figures S1–S10: PET, PTFE, PE and PP particles before and after the microwave-assisted digestion procedure; Figure S11: Example of a filter from initial blank experiments done using TFM vessels; Figure S12: Example of a filter from initial blank experiments done using quartz vessels; Figures S13–S32: Raman measurements of microplastic particles before after extraction from food; Figure S33: Mass distribution of PMMA before and after digestion; Table S1: Characteristic and measured Raman bands of five different polymers, analyzed after digestion [53,54,55,56,57]. Table S2: Results of Raman analyses performed on five real-world samples.
Author Contributions
Conceptualization, M.Š. and F.F.; Methodology, M.Š. and F.F.; Validation, M.Š.; Formal analysis, M.Š. and I.P.; Investigation, M.Š. and I.P.; Resources, M.Š. and F.F.; Writing—Original draft preparation, M.Š. and I.P.; Visualization, M.Š., I.P. and D.V.; Writing—Review and Editing, F.F. and D.V.; Supervision, F.F., V.S. and D.V.; Project administration, F.F., V.S. and D.V.; Funding acquisition, D.V. All authors have read and agreed to the published version of the manuscript.
Funding
This research was financially supported through national funds by the European Union from the European Regional Development Fund, under the project titled “FoodForensics—Creating neural networks (artificial intelligence) and developing advanced analytical methods as a tool for forensic testing of food, food supplements and medicinal plants” reference code KK.01.2.1.02.0142. Part of this research was conducted as part of the project „Development and characterization of complex prolonged release drug delivery systems based on biodegradable polymers” (NPOO.C3.2.R3-I1.04.0126) funded by NextGenerationEU. Finally, this work was also supported by the project FarmInova (KK.01.1.1.02.0021) funded by the European Regional Development Fund.
Institutional Review Board Statement
Not applicable.
Informed Consent Statement
Not applicable.
Data Availability Statement
The original contributions presented in this study are included in the article/Supplementary Materials. Further inquiries can be directed to the corresponding author.
Acknowledgments
We are grateful to Hugh J. Byrne for his generous hosting at the FOCAS institute, TU Dublin, Ireland, as well as his contribution in mentoring MŠ on Raman microscopy. The authors have reviewed and edited the output and take full responsibility for the content of this publication.
Conflicts of Interest
Authors Martin Šteković and Vladimir Stankov were employed by the Sample Control d.o.o. Company. Vladimir Stankov is listed as one of the inventors on a patent application (number PCT/EP2023/073068) related to the subject area covered in this manuscript (microwave-assisted extraction of microplastics from food). The remaining authors declare that the research was conducted in the absence of any commercial or financial relationships that could be construed as a potential conflict of interest.
Abbreviations
The following abbreviations are used in this manuscript:
| ATR | attenuated total reflectance |
| DLS | dynamic light scattering |
| DSC | differential scanning calorimetry |
| FT-IR | Fourier transform infrared spectroscopy |
| HDPE | high-density polyethylene |
| LDIR | laser-directed infrared imaging |
| LOD | limit of detection |
| MALDI-TOF-MS | matrix assisted laser desorption ionization—time of flight—mass spectrometry |
| PC | polycarbonate |
| PE | polyethylene |
| PET | polyethylene terephthalate |
| PMMA | poly(methyl methacrylate) |
| PP | polypropylene |
| PTFE | polytetrafluoroethylene |
| PTFE-TFM | modified polytetrafluoroethylene |
| Pyr-GC-MS | pyrolysis—gas chromatography/mass spectrometry |
| SEM-EDS | scanning electron microscope with energy dispersive spectroscopy |
| TED-GC/MS | thermal extraction desorption—gas chromatography/mass spectrometry |
| TGA | thermogravimetric analysis |
| TMAH | tetramethylammonium hydroxide |
References
- ISO/TR 21960:2020; Plastics—Environmental Aspects—State of Knowledge and Methodologies. ISO: Geneva, Switzerland, 2020. Available online: https://www.iso.org/standard/72300.html (accessed on 10 December 2025).
- Kye, H.; Kim, J.; Ju, S.; Lee, J.; Lim, C.; Yoon, Y. Microplastics in Water Systems: A Review of Their Impacts on the Environment and Their Potential Hazards. Heliyon 2023, 9, e14359. [Google Scholar] [CrossRef] [Scilit]
- Torres-Agullo, A.; Karanasiou, A.; Moreno, T.; Lacorte, S. Overview on the Occurrence of Microplastics in Air and Implications from the Use of Face Masks during the COVID-19 Pandemic. Sci. Total Environ. 2021, 800, 149555. [Google Scholar] [CrossRef] [Scilit] [PubMed]
- Sajjad, M.; Huang, Q.; Khan, S.; Khan, M.A.; Liu, Y.; Wang, J.; Lian, F.; Wang, Q.; Guo, G. Microplastics in the Soil Environment: A Critical Review. Environ. Technol. Innov. 2022, 27, 102408. [Google Scholar] [CrossRef] [Scilit]
- Amato-Lourenço, L.F.; Carvalho-Oliveira, R.; Júnior, G.R.; dos Santos Galvão, L.; Ando, R.A.; Mauad, T. Presence of Airborne Microplastics in Human Lung Tissue. J. Hazard. Mater. 2021, 416, 126124. [Google Scholar] [CrossRef] [Scilit]
- Leslie, H.A.; van Velzen, M.J.M.; Brandsma, S.H.; Vethaak, A.D.; Garcia-Vallejo, J.J.; Lamoree, M.H. Discovery and Quantification of Plastic Particle Pollution in Human Blood. Environ. Int. 2022, 163, 107199. [Google Scholar] [CrossRef] [Scilit]
- Hartmann, C.; Lomako, I.; Schachner, C.; El Said, E.; Abert, J.; Satrapa, V.; Kaiser, A.-M.; Walch, H.; Köppel, S. Assessment of Microplastics in Human Stool: A Pilot Study Investigating the Potential Impact of Diet-Associated Scenarios on Oral Microplastics Exposure. Sci. Total Environ. 2024, 951, 175825. [Google Scholar] [CrossRef] [Scilit]
- Ragusa, A.; Svelato, A.; Santacroce, C.; Catalano, P.; Notarstefano, V.; Carnevali, O.; Papa, F.; Rongioletti, M.C.; Baiocco, F.; Draghi, S.; et al. Plasticenta: First Evidence of Microplastics in Human Placenta. Environ. Int. 2021, 146, 106274. [Google Scholar] [CrossRef] [Scilit]
- Ragusa, A.; Notarstefano, V.; Svelato, A.; Belloni, A.; Gioacchini, G.; Blondeel, C.; Zucchelli, E.; De Luca, C.; D’Avino, S.; Gulotta, A.; et al. Raman Microspectroscopy Detection and Characterisation of Microplastics in Human Breastmilk. Polymers 2022, 14, 2700. [Google Scholar] [CrossRef] [Scilit]
- Lalrinfela, P.; Vanlalsangi, R.; Lalrinzuali, K.; Babu, P.J. Microplastics: Their Effects on the Environment, Human Health, and Plant Ecosystems. Environ. Pollut. Manag. 2024, 1, 248–259. [Google Scholar] [CrossRef] [Scilit]
- Hashem, H.M.; El-Shaheny, R.; El-Maghrabey, M.H. Microplastics and Pollutants; Springer: Cham, Switzerland, 2024; pp. 265–297. [Google Scholar]
- Huang, Z.; Hu, B.; Wang, H. Analytical Methods for Microplastics in the Environment: A Review. Environ. Chem. Lett. 2022, 21, 383–401. [Google Scholar] [CrossRef] [Scilit] [PubMed]
- Belioka, M.-P.; Achilias, D.S. Microplastic Pollution and Monitoring in Seawater and Harbor Environments: A Meta-Analysis and Review. Sustainability 2023, 15, 9079. [Google Scholar] [CrossRef] [Scilit]
- Ivleva, N.P. Chemical Analysis of Microplastics and Nanoplastics: Challenges, Advanced Methods, and Perspectives. Chem. Rev. 2021, 121, 11886–11936. [Google Scholar] [CrossRef] [Scilit] [PubMed]
- Schymanski, D.; Oßmann, B.E.; Benismail, N.; Boukerma, K.; Dallmann, G.; von der Esch, E.; Fischer, D.; Fischer, F.; Gilliland, D.; Glas, K.; et al. Analysis of Microplastics in Drinking Water and Other Clean Water Samples with Micro-Raman and Micro-Infrared Spectroscopy: Minimum Requirements and Best Practice Guidelines. Anal. Bioanal. Chem. 2021, 413, 5969–5994. [Google Scholar] [CrossRef] [Scilit] [PubMed]
- Araujo, C.F.; Nolasco, M.M.; Ribeiro, A.M.P.; Ribeiro-Claro, P.J.A. Identification of Microplastics Using Raman Spectroscopy: Latest Developments and Future Prospects. Water Res. 2018, 142, 426–440. [Google Scholar] [CrossRef] [Scilit] [PubMed]
- Kwon, J.-H.; Kim, J.-W.; Pham, T.D.; Tarafdar, A.; Hong, S.; Chun, S.-H.; Lee, S.-H.; Kang, D.-Y.; Kim, J.-Y.; Kim, S.-B.; et al. Microplastics in Food: A Review on Analytical Methods and Challenges. Int. J. Environ. Res. Public Health 2020, 17, 6710. [Google Scholar] [CrossRef] [Scilit]
- Lusher, A.L.; Munno, K.; Hermabessiere, L.; Carr, S. Isolation and Extraction of Microplastics from Environmental Samples: An Evaluation of Practical Approaches and Recommendations for Further Harmonization. Appl. Spectrosc. 2020, 74, 1049–1065. [Google Scholar] [CrossRef] [Scilit]
- Rani, M.; Ducoli, S.; Depero, L.E.; Prica, M.; Tubić, A.; Ademovic, Z.; Morrison, L.; Federici, S. A Complete Guide to Extraction Methods of Microplastics from Complex Environmental Matrices. Molecules 2023, 28, 5710. [Google Scholar] [CrossRef] [Scilit]
- Sridhar, A.; Kannan, D.; Kapoor, A.; Prabhakar, S. Extraction and Detection Methods of Microplastics in Food and Marine Systems: A Critical Review. Chemosphere 2022, 286, 131653. [Google Scholar] [CrossRef] [Scilit]
- Naidoo, T.; Goordiyal, K.; Glassom, D. Are Nitric Acid (HNO3) Digestions Efficient in Isolating Microplastics from Juvenile Fish? Water Air Soil Pollut. 2017, 228, 470. [Google Scholar] [CrossRef] [Scilit]
- Enders, K.; Lenz, R.; Beer, S.; Stedmon, C.A. Extraction of Microplastic from Biota: Recommended Acidic Digestion Destroys Common Plastic Polymers. ICES J. Mar. Sci. 2016, 74, 326–331. [Google Scholar] [CrossRef] [Scilit]
- Bitencourt, G.R.; Mello, P.A.; Flores, E.M.M.; Pirola, C.; Carnaroglio, D.; Bizzi, C.A. Determination of Microplastic Content in Seafood: An Integrated Approach Combined with the Determination of Elemental Contaminants. Sci. Total Environ. 2020, 749, 142301. [Google Scholar] [CrossRef] [Scilit] [PubMed]
- Lievens, S.; Slegers, T.; Mees, M.A.; Thielemans, W.; Poma, G.; Covaci, A.; Van Der Borght, M. A Simple, Rapid and Accurate Method for the Sample Preparation and Quantification of Meso- and Microplastics in Food and Food Waste Streams. Environ. Pollut. 2022, 307, 119511. [Google Scholar] [CrossRef] [Scilit]
- Da Costa Filho, P.A.; Andrey, D.; Eriksen, B.; Peixoto, R.P.; Carreres, B.M.; Ambühl, M.E.; Descarrega, J.B.; Dubascoux, S.; Zbinden, P.; Panchaud, A.; et al. Detection and Characterization of Small-Sized Microplastics (≥5 Μm) in Milk Products. Sci. Rep. 2021, 11, 24046. [Google Scholar] [CrossRef] [Scilit]
- Karami, A.; Golieskardi, A.; Ho, Y.B.; Larat, V.; Salamatinia, B. Microplastics in Eviscerated Flesh and Excised Organs of Dried Fish. Sci. Rep. 2017, 7, 5473. [Google Scholar] [CrossRef] [Scilit]
- Bucol, L.A.; Romano, E.F.; Cabcaban, S.M.; Siplon, L.M.; Madrid, G.C.; Bucol, A.A.; Polidoro, B. Microplastics in Marine Sediments and Rabbitfish (Siganus fuscescens) from Selected Coastal Areas of Negros Oriental, Philippines. Mar. Pollut. Bull. 2020, 150, 110685. [Google Scholar] [CrossRef] [Scilit] [PubMed]
- Lopes, C.; Fernández-González, V.; Muniategui-Lorenzo, S.; Caetano, M.; Raimundo, J. Improved Methodology for Microplastic Extraction from Gastrointestinal Tracts of Fat Fish Species. Mar. Pollut. Bull. 2022, 181, 113911. [Google Scholar] [CrossRef] [Scilit]
- Avio, C.G.; Gorbi, S.; Regoli, F. Experimental Development of a New Protocol for Extraction and Characterization of Microplastics in Fish Tissues: First Observations in Commercial Species from Adriatic Sea. Mar. Environ. Res. 2015, 111, 18–26. [Google Scholar] [CrossRef] [Scilit] [PubMed]
- Li, J.; Green, C.; Reynolds, A.; Shi, H.; Rotchell, J.M. Microplastics in Mussels Sampled from Coastal Waters and Supermarkets in the United Kingdom. Environ. Pollut. 2018, 241, 35–44. [Google Scholar] [CrossRef] [Scilit]
- Inaudi, P.; Sicurella, G.M.; Rivoira, L.; Favilli, L.; Bracco, P.; Bertinetti, S.; Abollino, O.; Bruzzoniti, M.C.; Isaja, V.; Giacomino, A. Pollution Profiling in Italian Honeys: Elements and Microplastics as Comprehensive Indicators of Environmental Contamination and Food Safety. Sci. Total Environ. 2025, 993, 179981. [Google Scholar] [CrossRef] [Scilit]
- Capuozzo, F.; Quaglia, N.C.; Di Pinto, A.; De Rosa, M.; Ioanna, F.; Dambrosio, A. Evaluation of Digestion Methods in Microplastic Recovery from Mussels (Mytilus galloprovincialis) for a Standardised Microplastic Isolation Protocol. Foods 2025, 14, 3853. [Google Scholar] [CrossRef] [Scilit]
- Catarino, A.I.; Thompson, R.; Sanderson, W.; Henry, T.B. Development and Optimization of a Standard Method for Extraction of Microplastics in Mussels by Enzyme Digestion of Soft Tissues. Environ. Toxicol. Chem. 2016, 36, 947–951. [Google Scholar] [CrossRef] [Scilit]
- von Friesen, L.W.; Granberg, M.E.; Hassellöv, M.; Gabrielsen, G.W.; Magnusson, K. An Efficient and Gentle Enzymatic Digestion Protocol for the Extraction of Microplastics from Bivalve Tissue. Mar. Pollut. Bull. 2019, 142, 129–134. [Google Scholar] [CrossRef] [Scilit] [PubMed]
- Visentin, E.; Niero, G.; Benetti, F.; O’Donnell, C.; De Marchi, M. Assessing Microplastic Contamination in Milk and Dairy Products. NPJ Sci. Food 2025, 9, 135. [Google Scholar] [CrossRef] [Scilit]
- Pfeiffer, F.; Fischer, E.K. Various Digestion Protocols within Microplastic Sample Processing—Evaluating the Resistance of Different Synthetic Polymers and the Efficiency of Biogenic Organic Matter Destruction. Front. Environ. Sci. 2020, 8, 572424. [Google Scholar] [CrossRef] [Scilit]
- Liebezeit, G.; Liebezeit, E. Non-Pollen Particulates in Honey and Sugar. Food Addit. Contam. Part A 2013, 30, 2136–2140. [Google Scholar] [CrossRef] [Scilit]
- Karami, A.; Golieskardi, A.; Choo, C.K.; Larat, V.; Karbalaei, S.; Salamatinia, B. Microplastic and Mesoplastic Contamination in Canned Sardines and Sprats. Sci. Total Environ. 2018, 612, 1380–1386. [Google Scholar] [CrossRef] [Scilit] [PubMed]
- Graham, P.; Palazzo, L.; Andrea de Lucia, G.; Telfer, T.C.; Baroli, M.; Carboni, S. Microplastics Uptake and Egestion Dynamics in Pacific Oysters, Magallana Gigas (Thunberg, 1793), under Controlled Conditions. Environ. Pollut. 2019, 252, 742–748. [Google Scholar] [CrossRef] [Scilit]
- Perez, M.; Parra, S.; Ferrada, C.; Bravo, M.; Perez, P.A.; Quiroz, W. Development of a New Methodology for the Determination of PET Microplastics in Sediment, Based on Microwave-Assisted Acid Digestion. PLoS ONE 2024, 19, e0314520. [Google Scholar] [CrossRef] [Scilit]
- Fraissinet, S.; Pennetta, A.; Rossi, S.; De Benedetto, G.E.; Malitesta, C. Optimization of a New Multi-Reagent Procedure for Quantitative Mussel Digestion in Microplastic Analysis. Mar. Pollut. Bull. 2021, 173, 112931. [Google Scholar] [CrossRef] [Scilit]
- International Council for Harmonisation (ICH). Validation of Analytical Procedures: Q2(R2); ICH: Geneva, Switzerland, 2023. [Google Scholar]
- Weisser, J.; Beer, I.; Hufnagl, B.; Hofmann, T.; Lohninger, H.; Ivleva, N.P.; Glas, K. From the Well to the Bottle: Identifying Sources of Microplastics in Mineral Water. Water 2021, 13, 841. [Google Scholar] [CrossRef] [Scilit]
- Kim, M.; Kim, J.; Park, S.; Kim, D.; Jung, J.; Cho, D. Determination of Microplastics in Omega-3 Oil Supplements. Foods 2024, 13, 1434. [Google Scholar] [CrossRef] [Scilit]
- Putzu, M.; Barbaresi, M.; Fadda, M.; Sacco, A.; Piergiovanni, M.; Masino, M.; Bianchi, F.; Altmann, K.; Benismail, N.; Coïc, L.; et al. Accuracy Assessment of a Micro-Raman Spectroscopy Method for Small Microplastic Particles in Infant Milk Formula. Talanta Open 2025, 12, 100586. [Google Scholar] [CrossRef] [Scilit]
- Narkis, M. Sintering Behavior of Poly(Methyl Methacrylate) Particles. Polym. Eng. Sci. 1979, 19, 889–892. [Google Scholar] [CrossRef] [Scilit]
- Kratofil Krehula, L.; Hrnjak-Murgić, Z.; Jelenčić, J.; Andričić, B. Evaluation of Poly(Ethylene-Terephthalate) Products of Chemical Recycling by Differential Scanning Calorimetry. J. Polym. Environ. 2009, 17, 20–27. [Google Scholar] [CrossRef] [Scilit]
- Yoshioka, T.; Okayama, N.; Okuwaki, A. Kinetics of Hydrolysis of Pet Powder in Nitric Acid by a Modified Shrinking-Core Model. Ind. Eng. Chem. Res. 1998, 37, 336–340. [Google Scholar] [CrossRef] [Scilit]
- Hildebrandt, L.; El Gareb, F.; Zimmermann, T.; Klein, O.; Kerstan, A.; Emeis, K.-C.; Pröfrock, D. Spatial Distribution of Microplastics in the Tropical Indian Ocean Based on Laser Direct Infrared Imaging and Microwave-Assisted Matrix Digestion. Environ. Pollut. 2022, 307, 119547. [Google Scholar] [CrossRef] [Scilit]
- Schrank, I.; Möller, J.N.; Imhof, H.K.; Hauenstein, O.; Zielke, F.; Agarwal, S.; Löder, M.G.J.; Greiner, A.; Laforsch, C. Microplastic Sample Purification Methods—Assessing Detrimental Effects of Purification Procedures on Specific Plastic Types. Sci. Total Environ. 2022, 833, 154824. [Google Scholar] [CrossRef] [Scilit]
- Anger, P.M.; von der Esch, E.; Baumann, T.; Elsner, M.; Niessner, R.; Ivleva, N.P. Raman Microspectroscopy as a Tool for Microplastic Particle Analysis. TrAC Trends Anal. Chem. 2018, 109, 214–226. [Google Scholar] [CrossRef] [Scilit]
- Barchiesi, M.; Di Marcantonio, C.; Frugis, A.; Lazzazzara, M.; Gioia, V.; Castellani, M.; Boni, M.R.; Chiavola, A. A Critical Analysis on the Limits and Possibilities of the μ-Raman as a Routine Method for Microplastics Determination in Drinking Water. J. Water Process Eng. 2024, 65, 105771. [Google Scholar] [CrossRef] [Scilit]
- Nishikida, K.; Coates, J. Handbook of Plastics Analysis; CRC Press: Boca Raton, FL, USA, 2003; pp. 186–317. [Google Scholar]
- Ferchichi, S.; Sheibat-Othman, N.; Boyron, O.; Bonnin, C.; Norsic, S.; Rey-Bayle, M.; Monteil, V. In Situ Dissolved Polypropylene Prediction by Raman and ATR-IR Spectroscopy for Its Recycling. Anal. Methods 2024, 16, 3109–3117. [Google Scholar] [CrossRef] [Scilit] [PubMed]
- Boerio, F.J.; Bahl, S.K.; McGraw, G.E. Vibrational Analysis of Polyethylene Terephthalate and Its Deuterated Derivatives. J. Polym. Sci. Polym. Phys. Ed. 1976, 14, 1029–1046. [Google Scholar] [CrossRef] [Scilit]
- Everall, N.; Tayler, P.; Chalmers, J.M.; MacKerron, D.; Ferwerda, R.; van der Maas, J.H. Study of Density and Orientation in Poly(Ethylene Terephthalate) Using Fourier Transform Raman Spectroscopy and Multivariate Data Analysis. Polymer 1994, 35, 3184–3192. [Google Scholar] [CrossRef] [Scilit]
- Chakraborty, I.; Banik, S.; Biswas, R.; Yamamoto, T.; Noothalapati, H.; Mazumder, N. Raman Spectroscopy for Microplastic Detection in Water Sources: A Systematic Review. Int. J. Environ. Sci. Technol. 2022, 20, 10435–10448. [Google Scholar] [CrossRef] [Scilit]
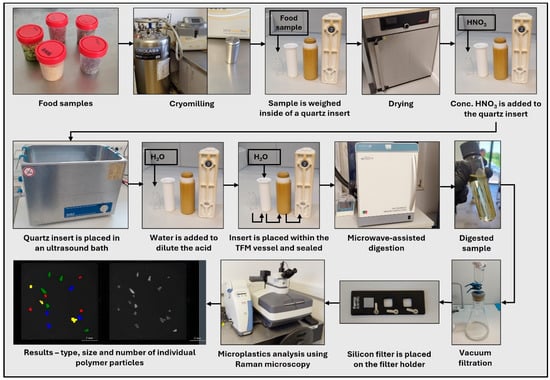
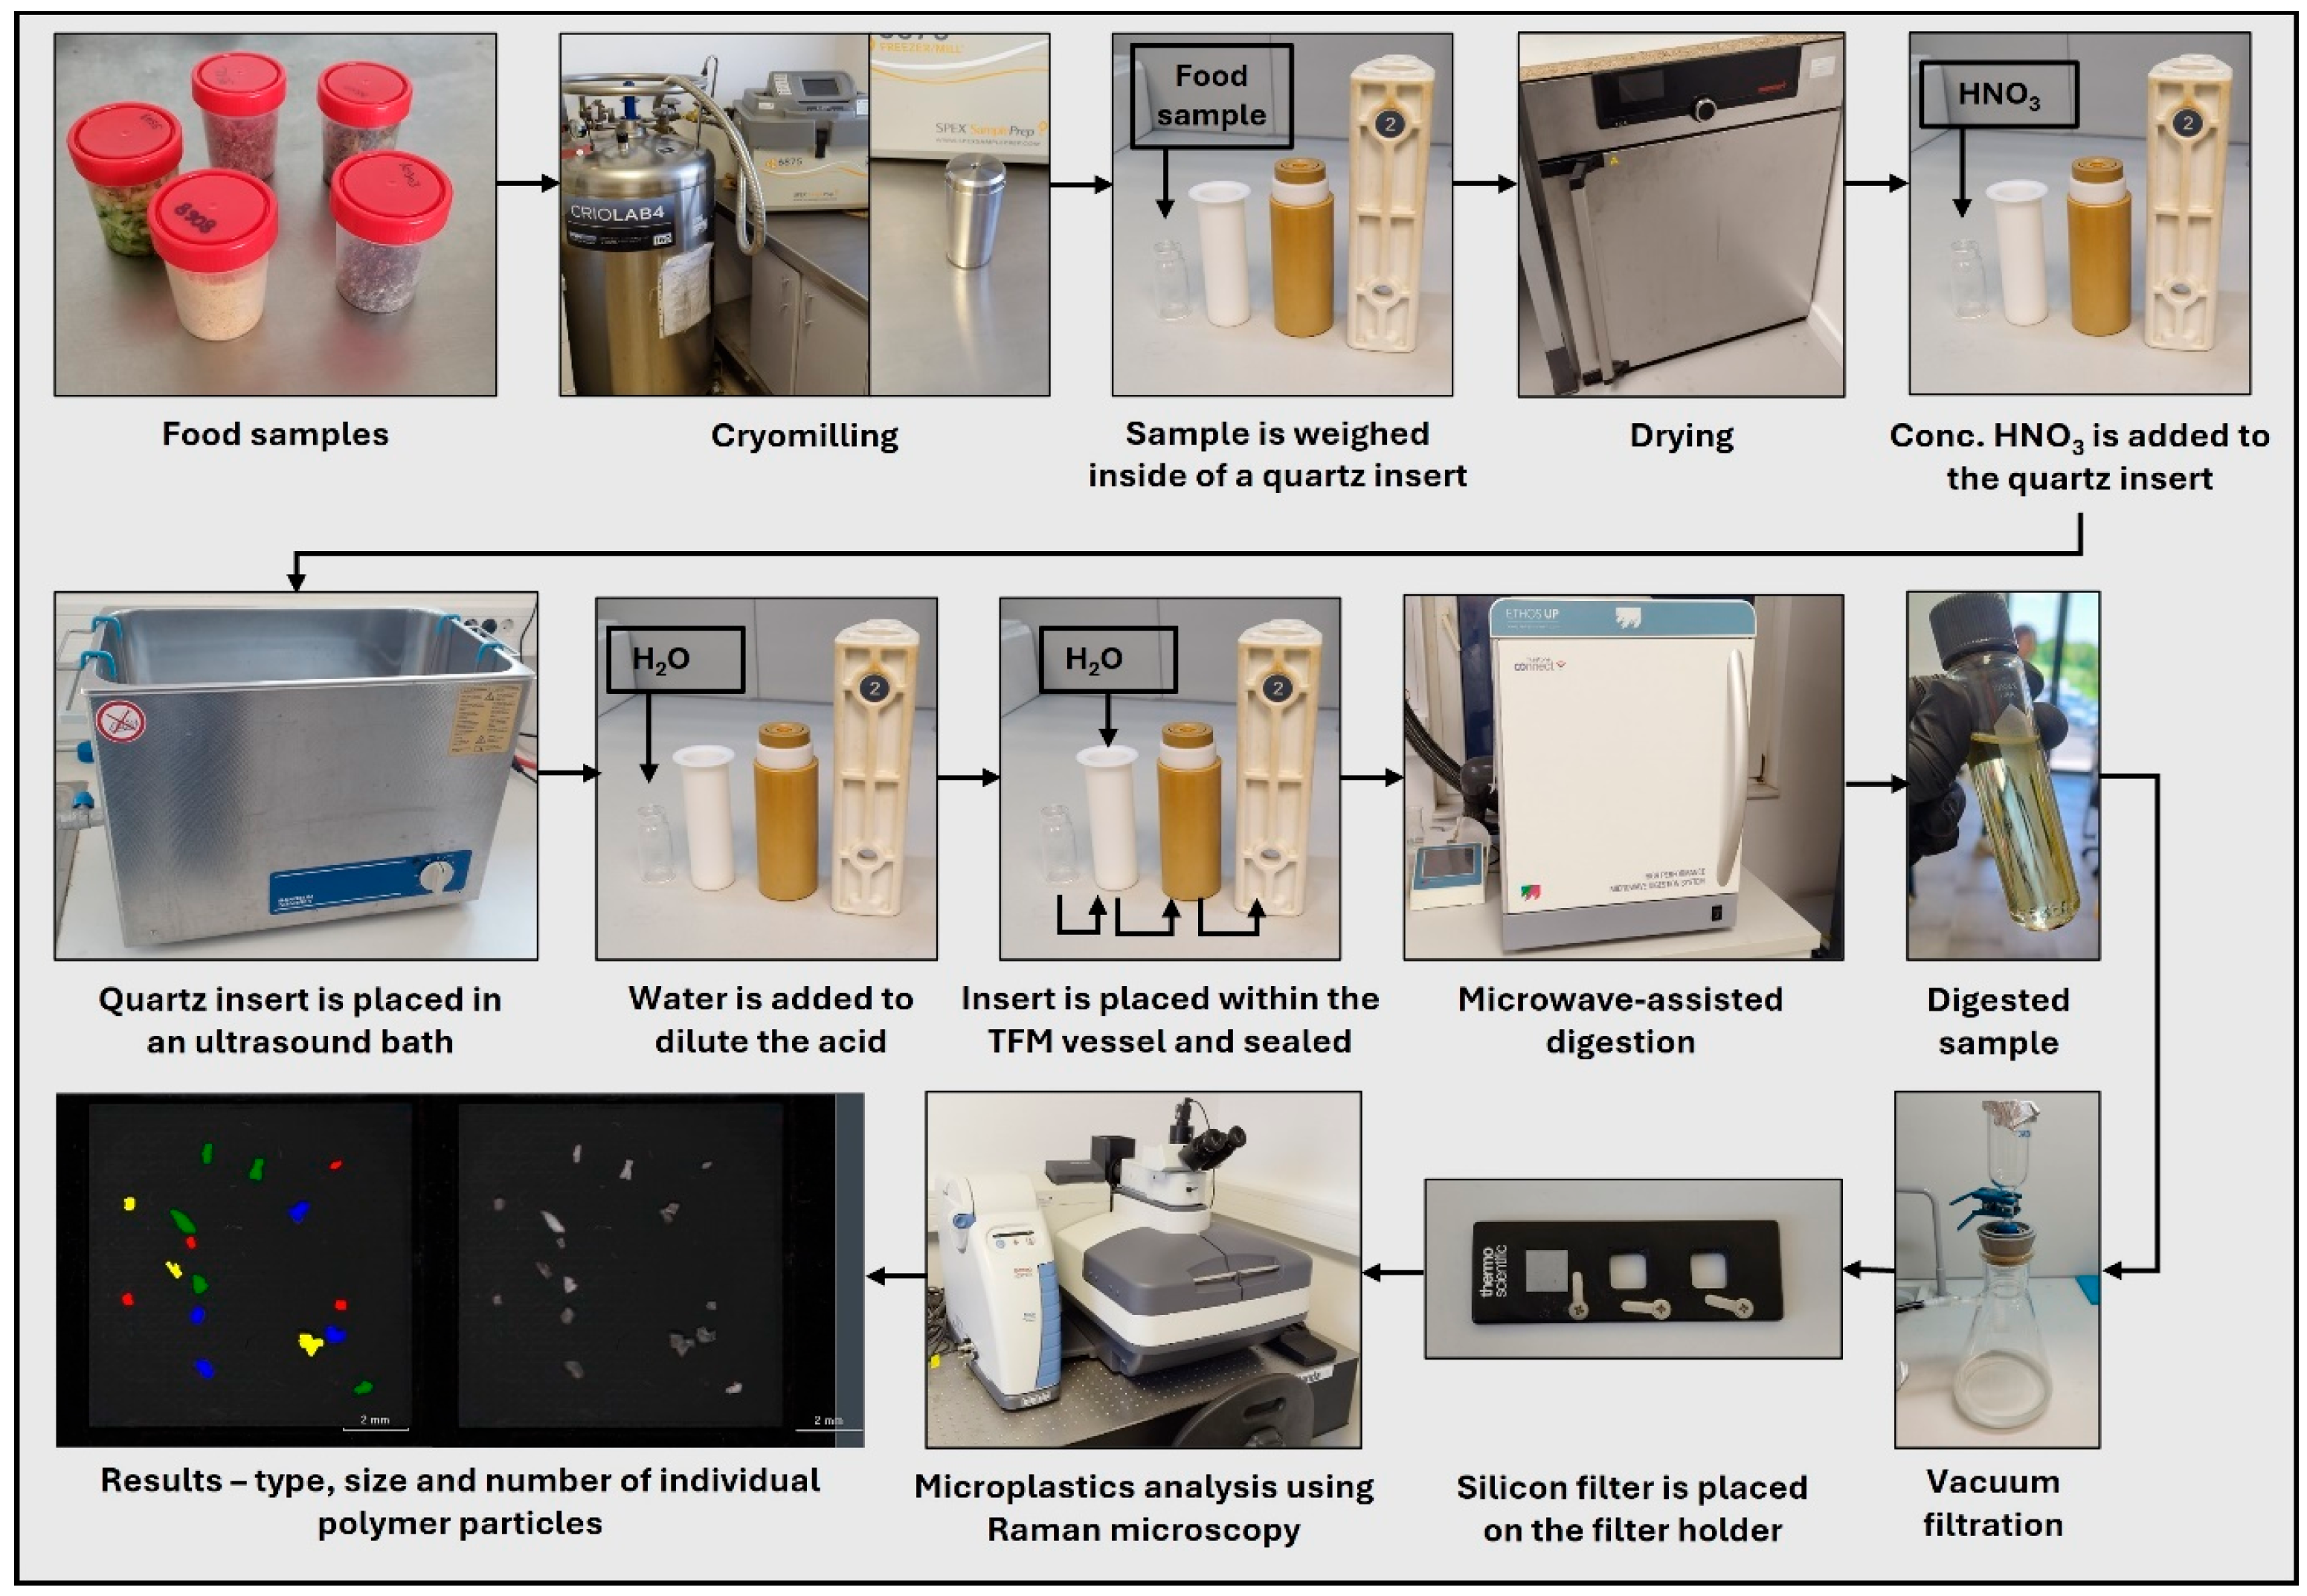
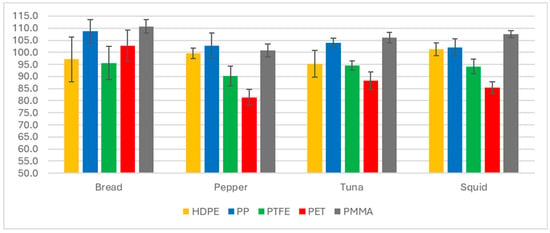
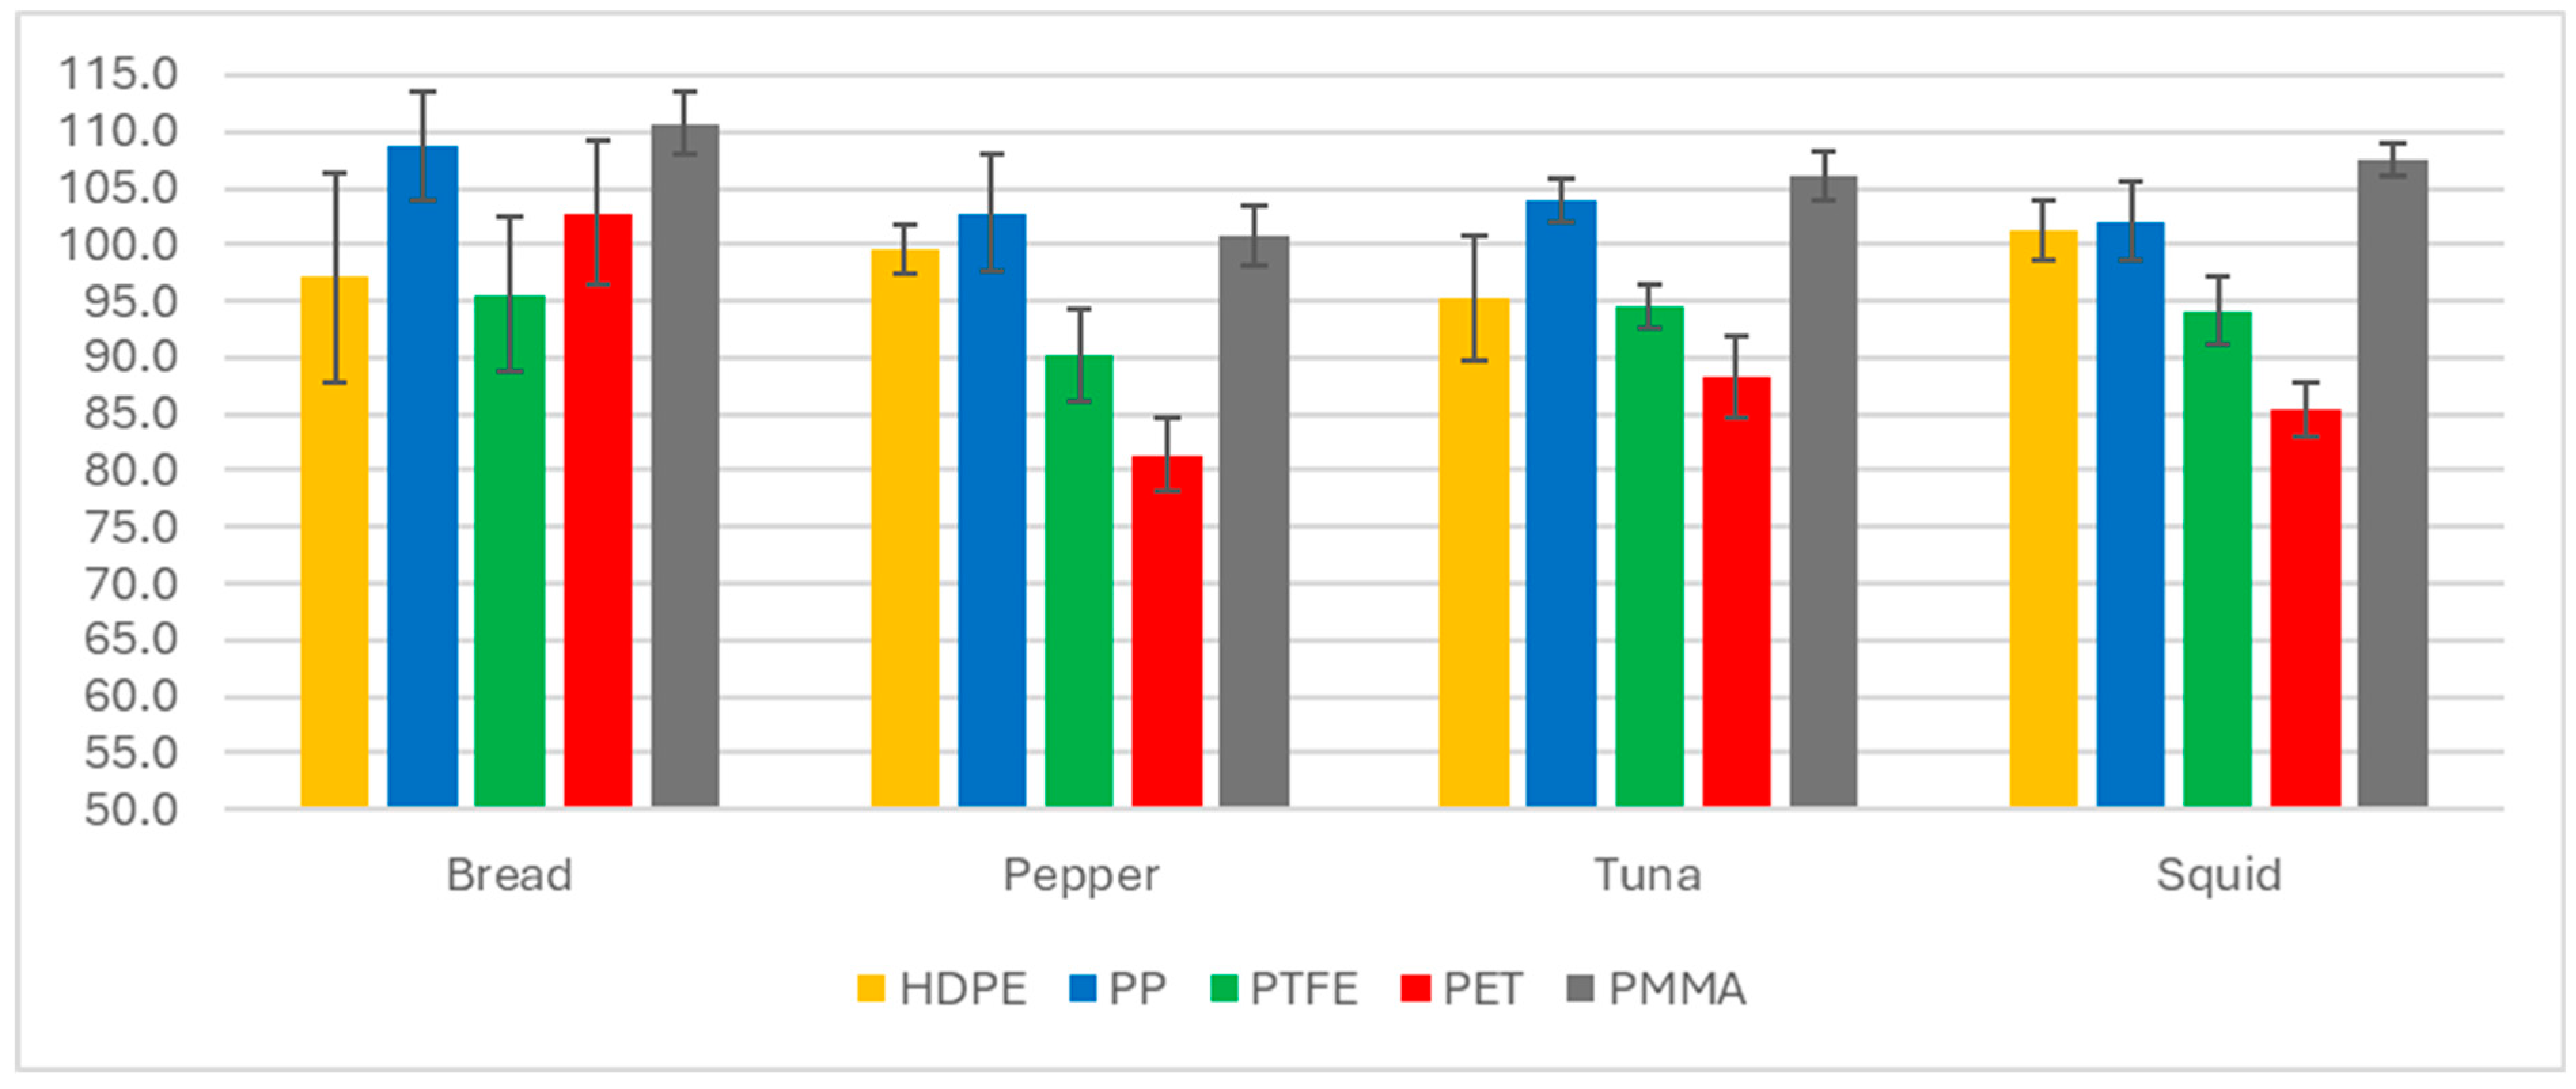
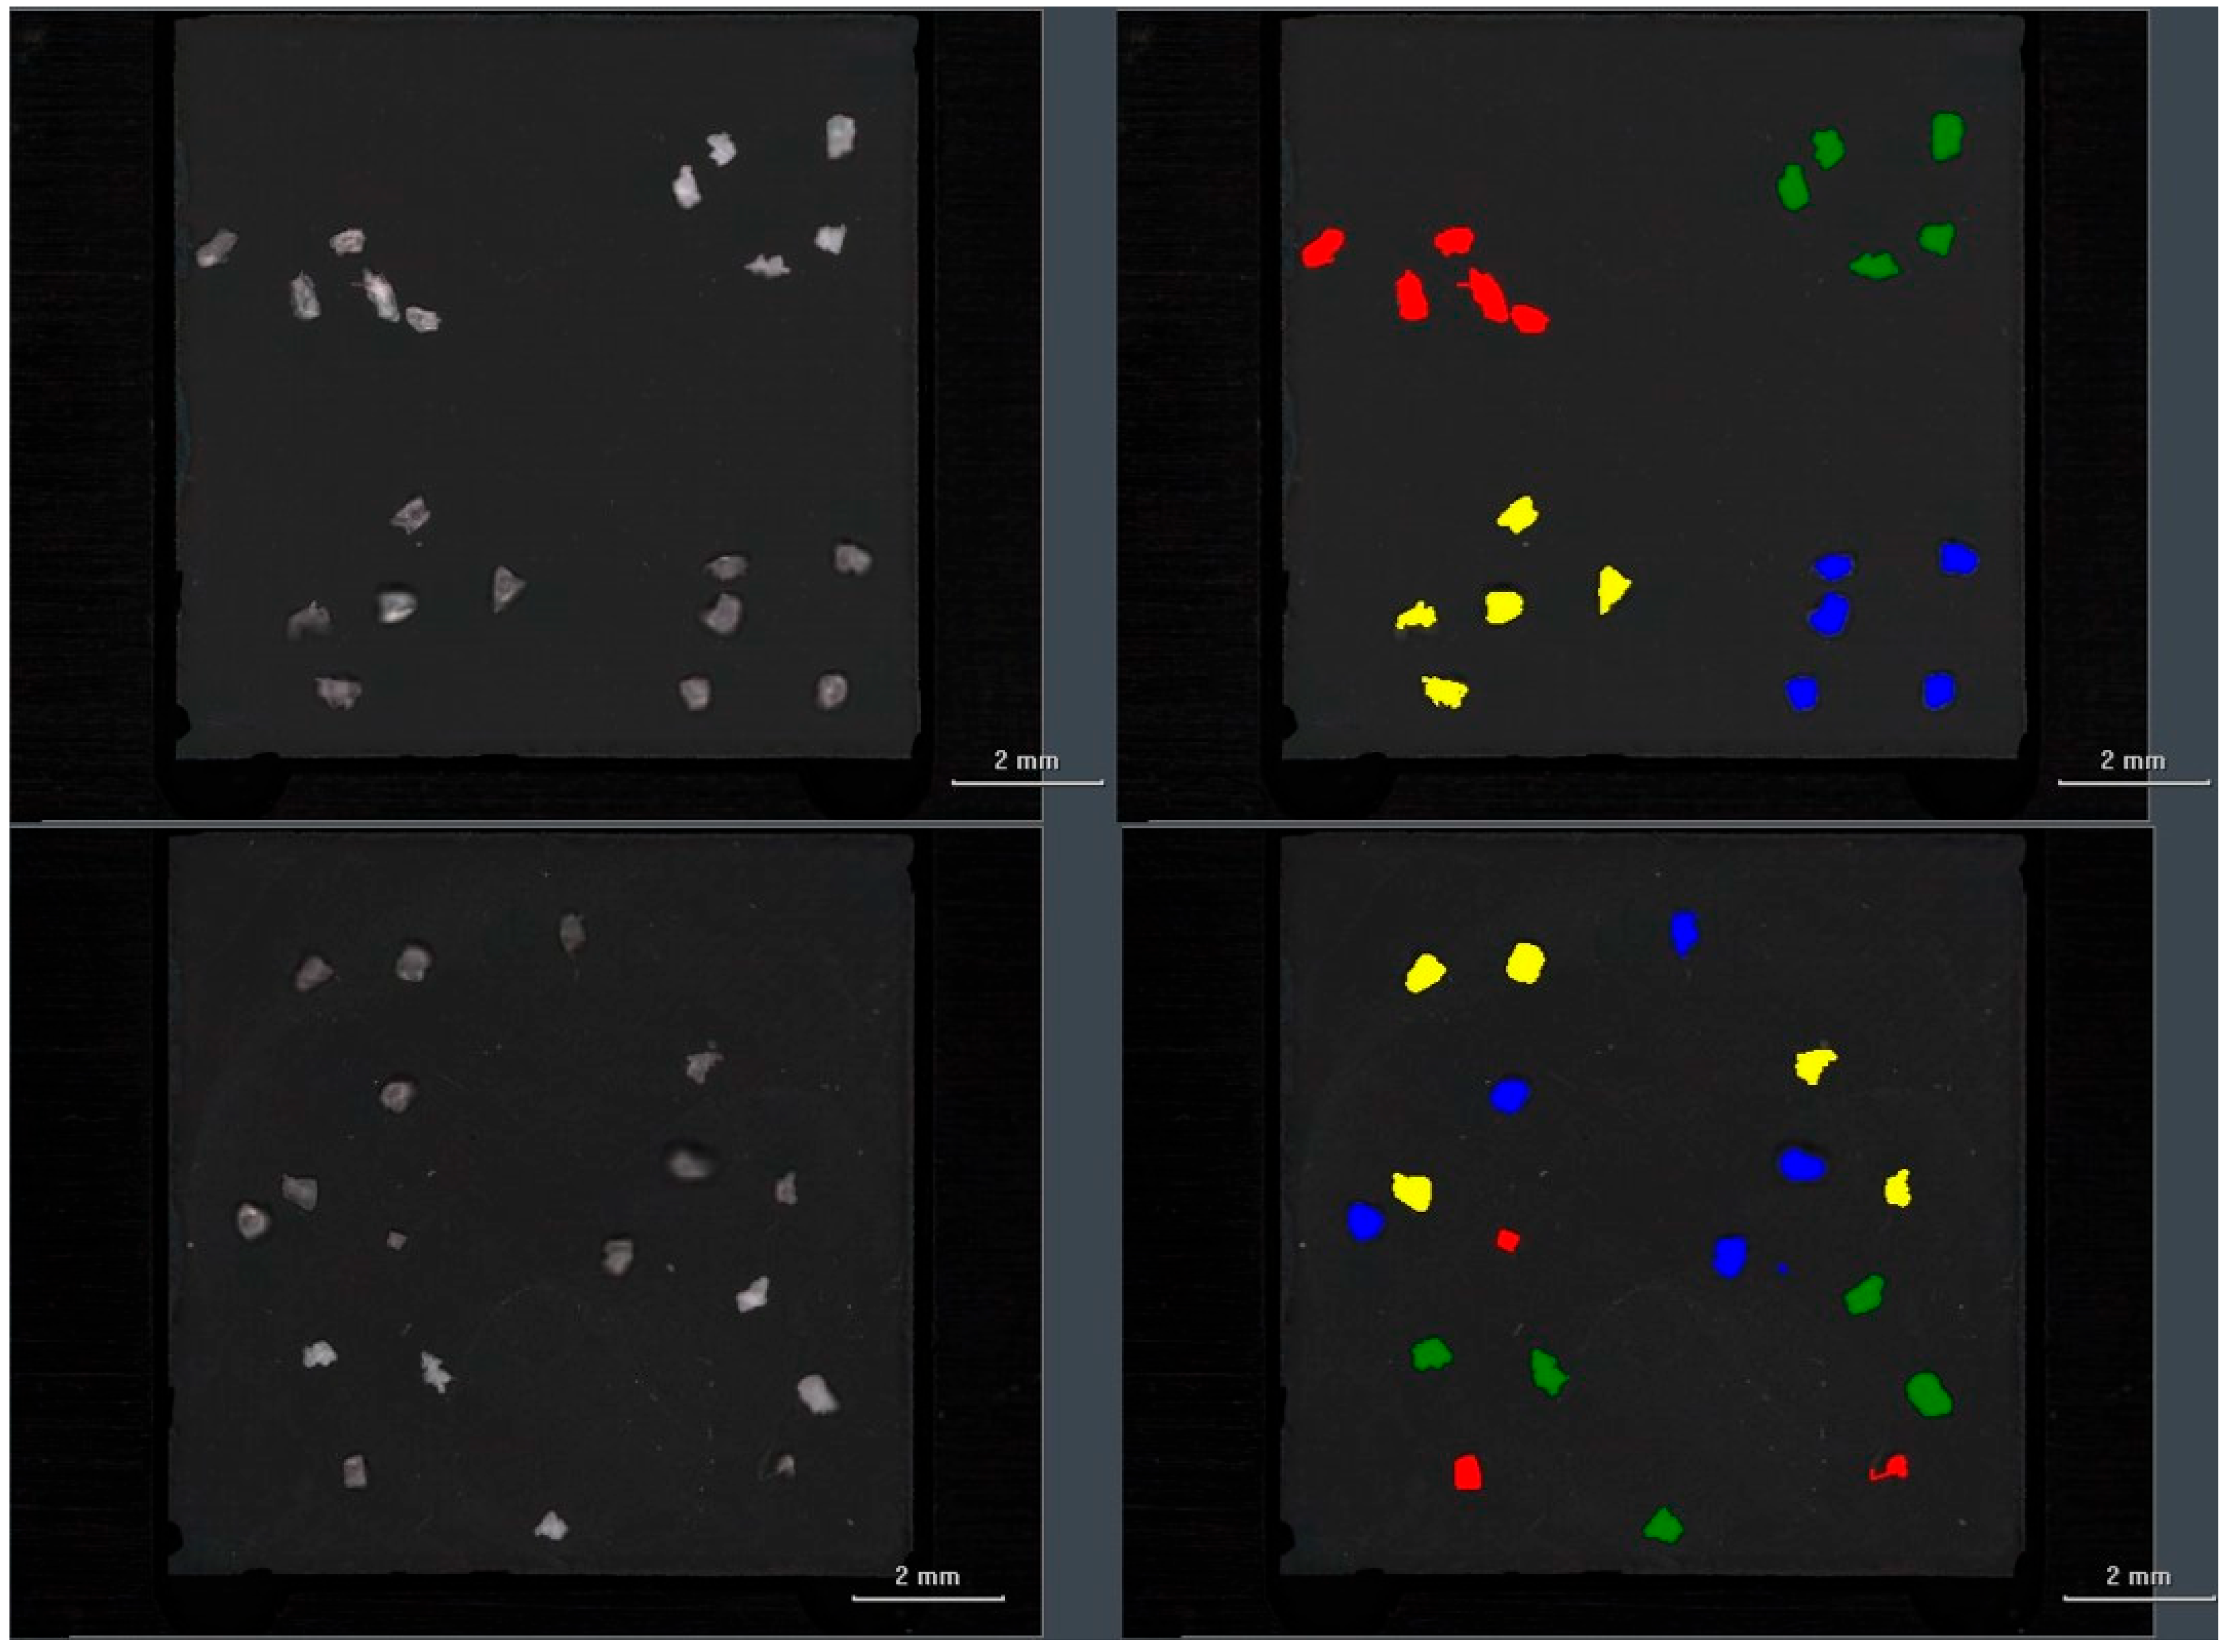
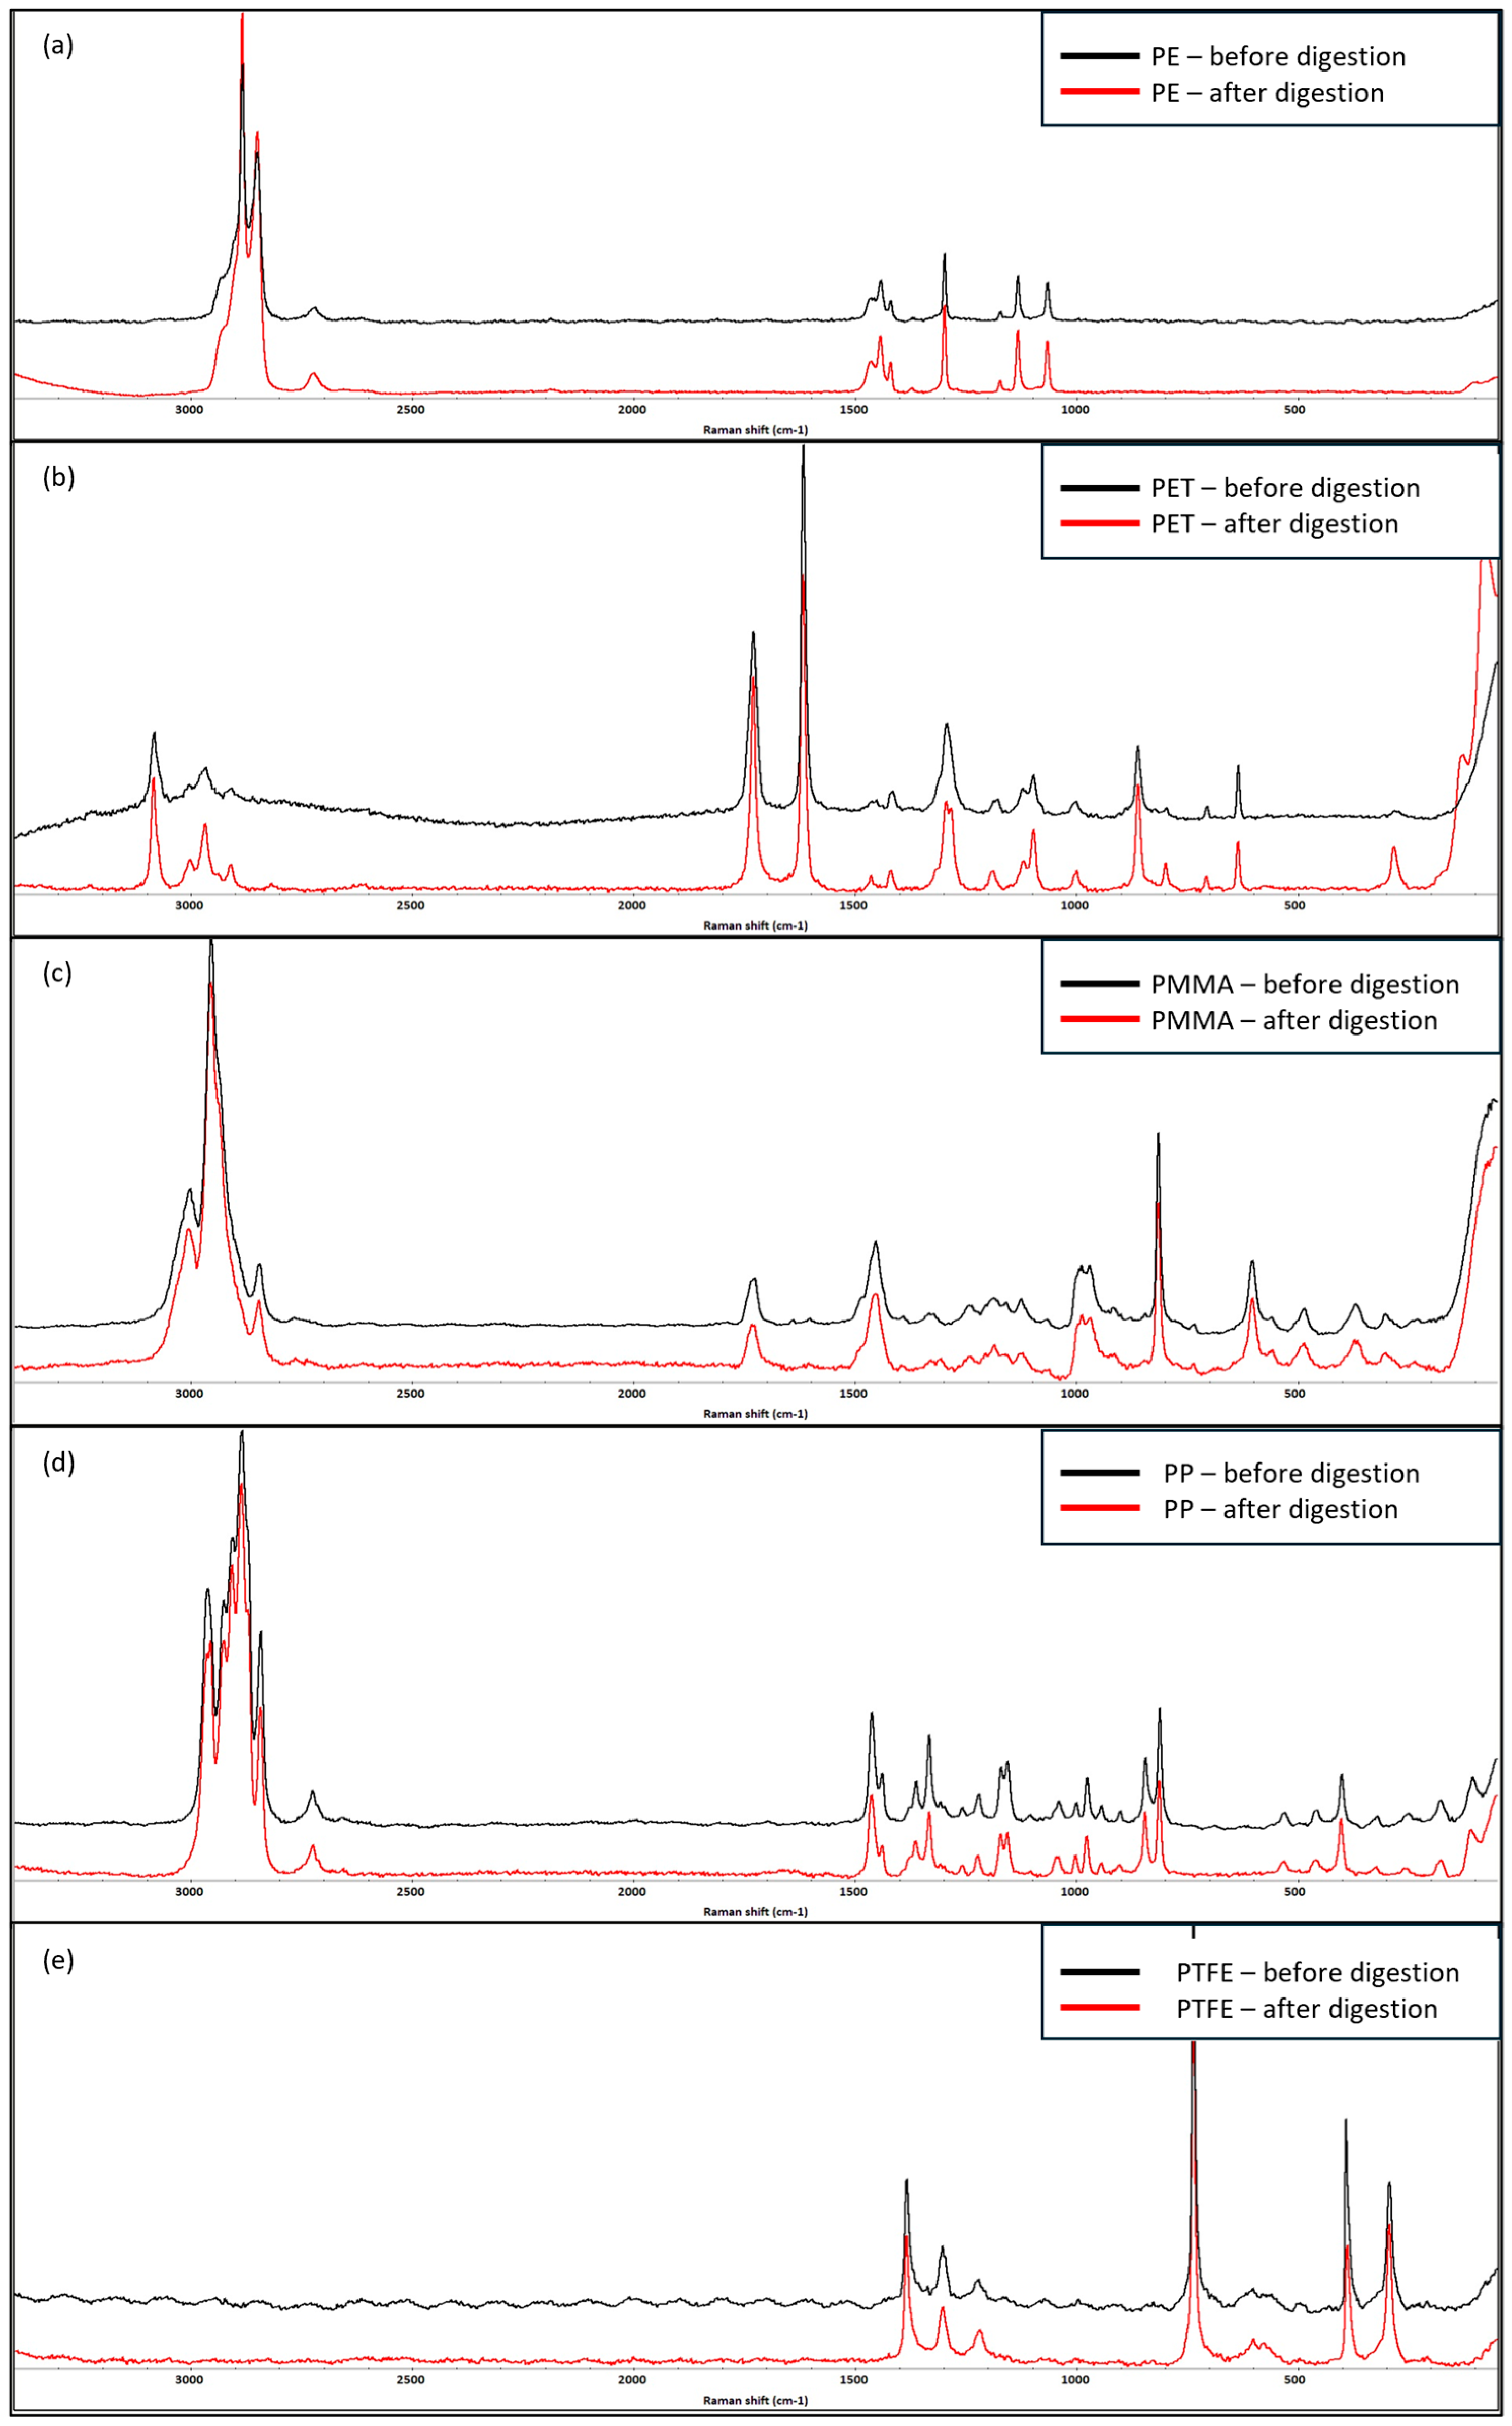
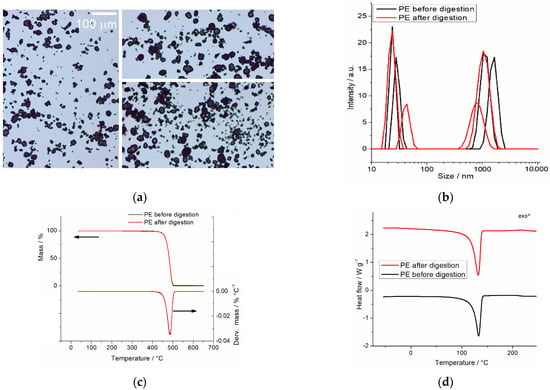
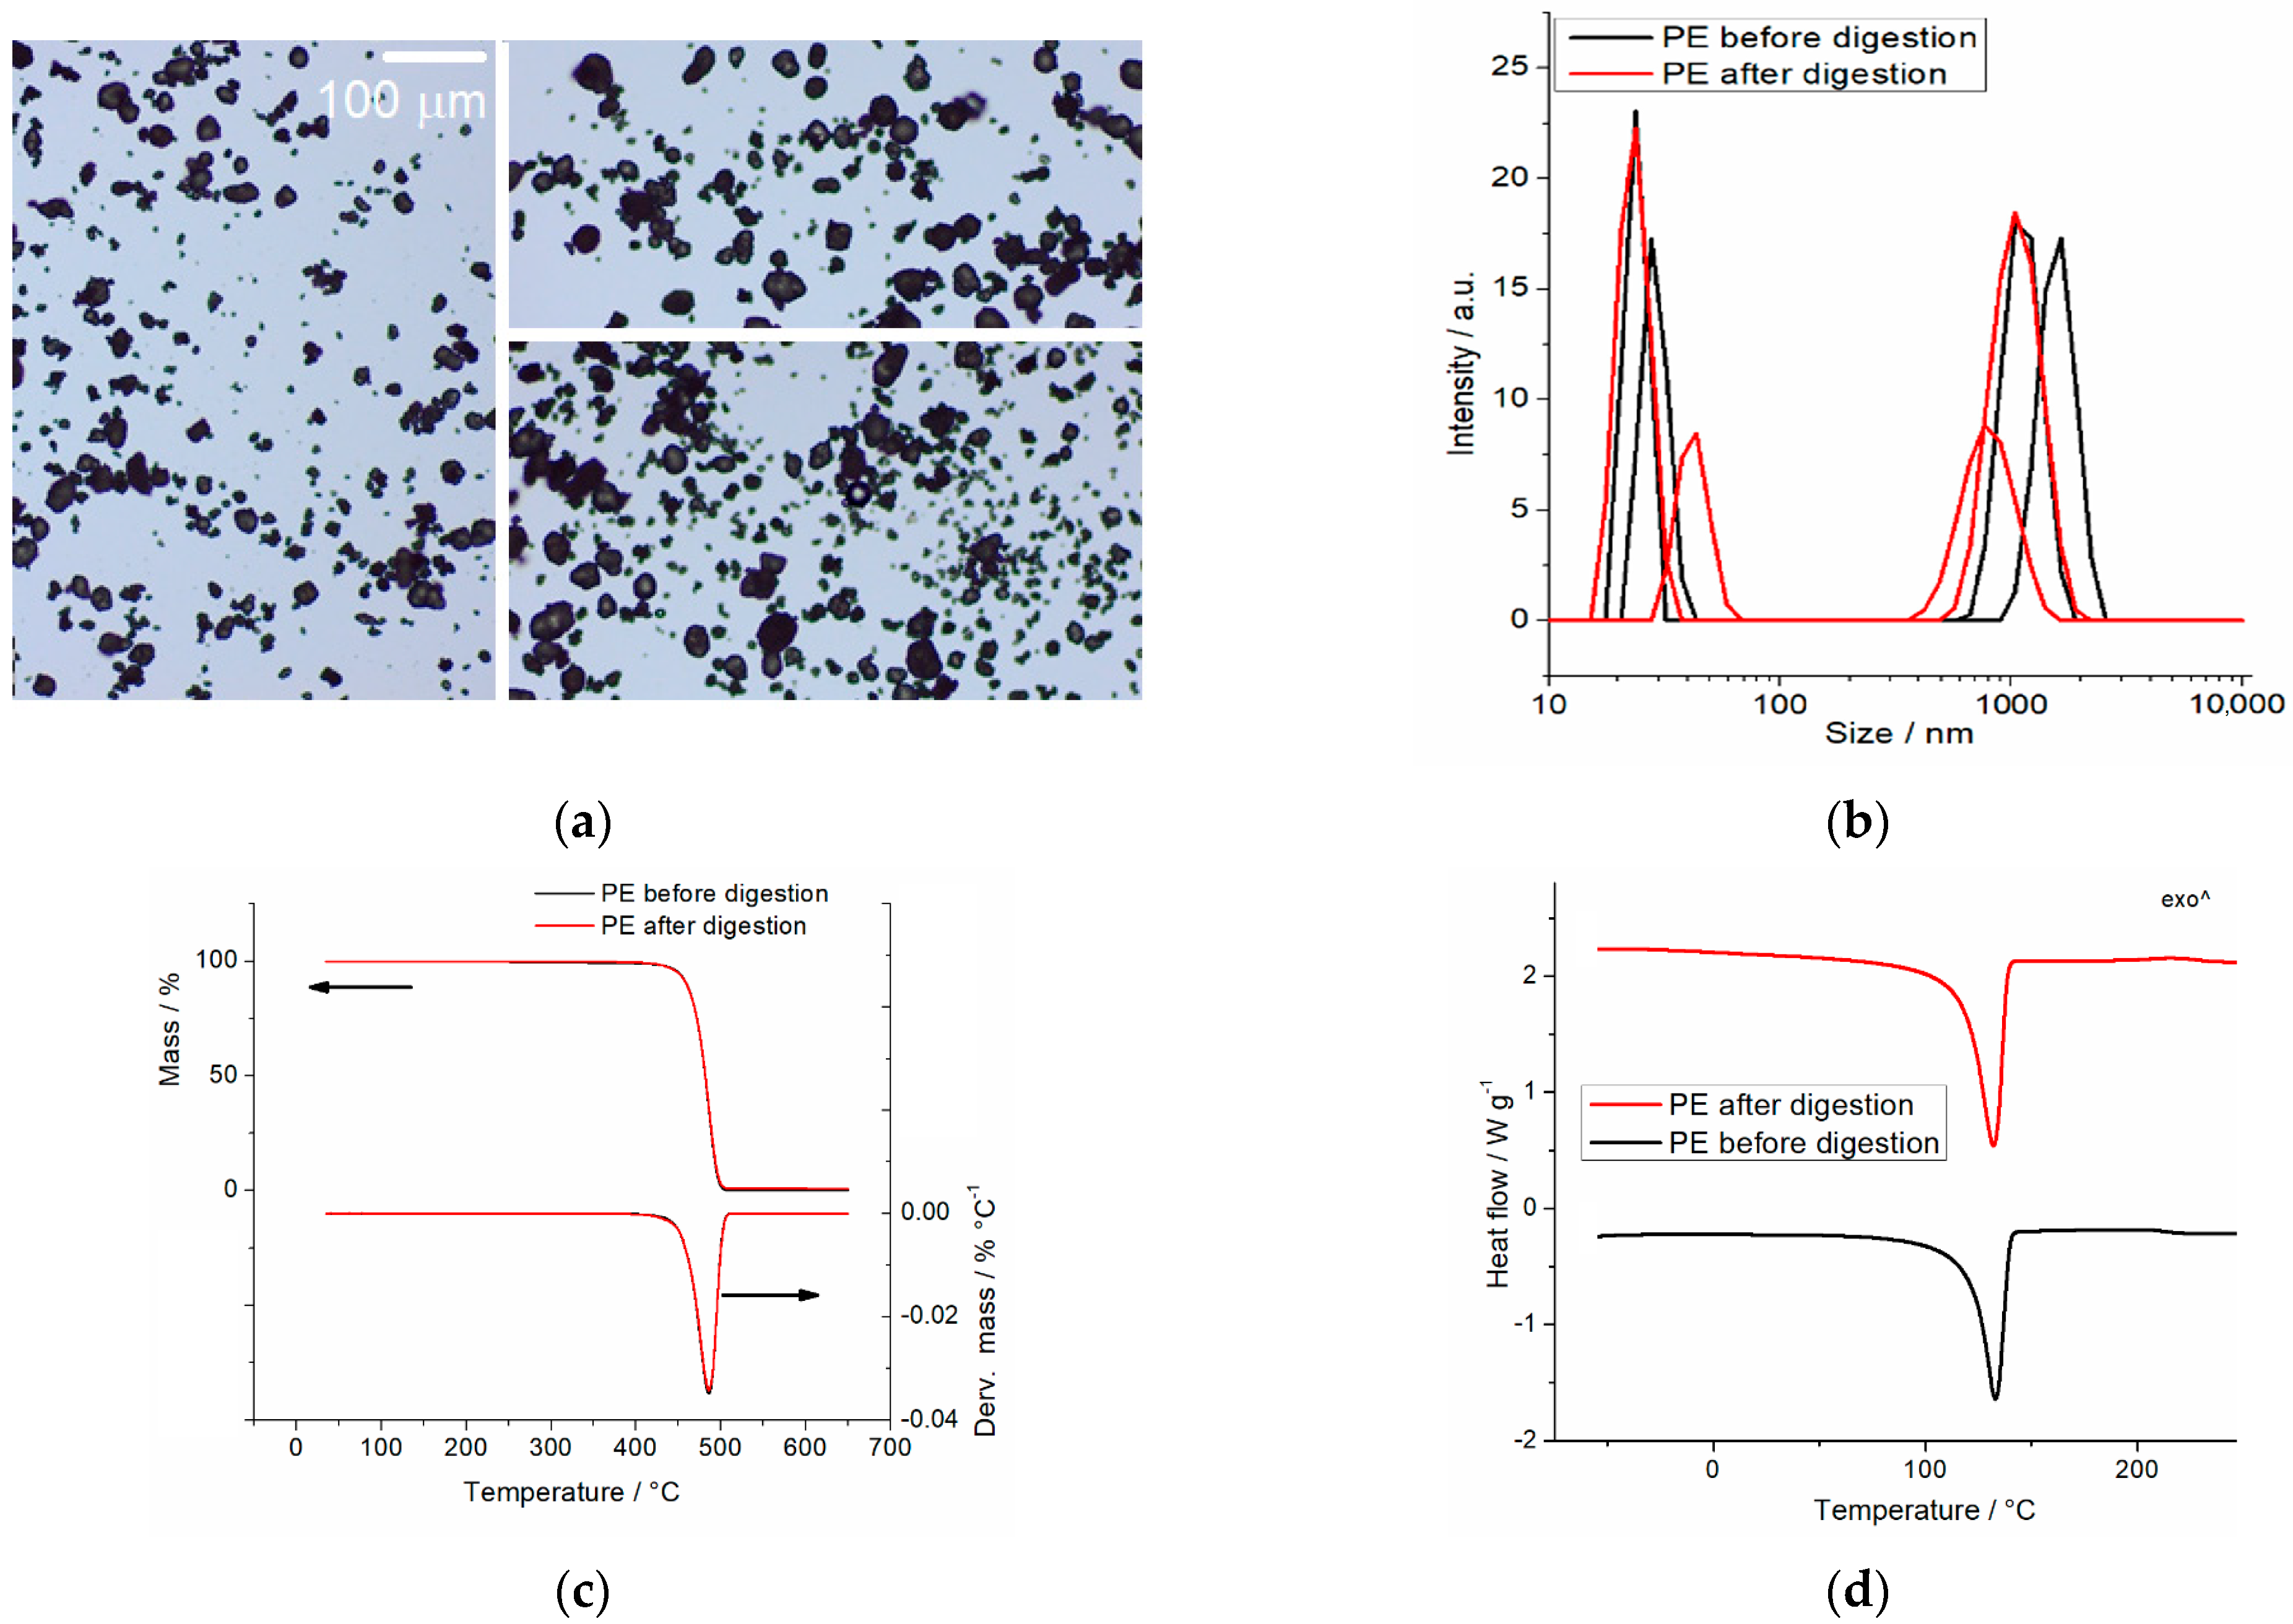
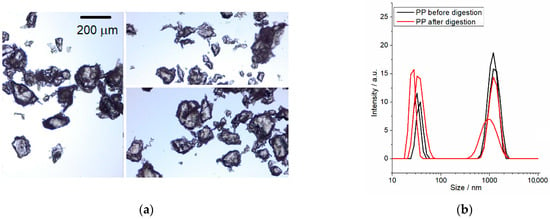
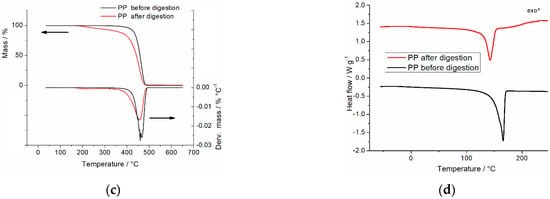
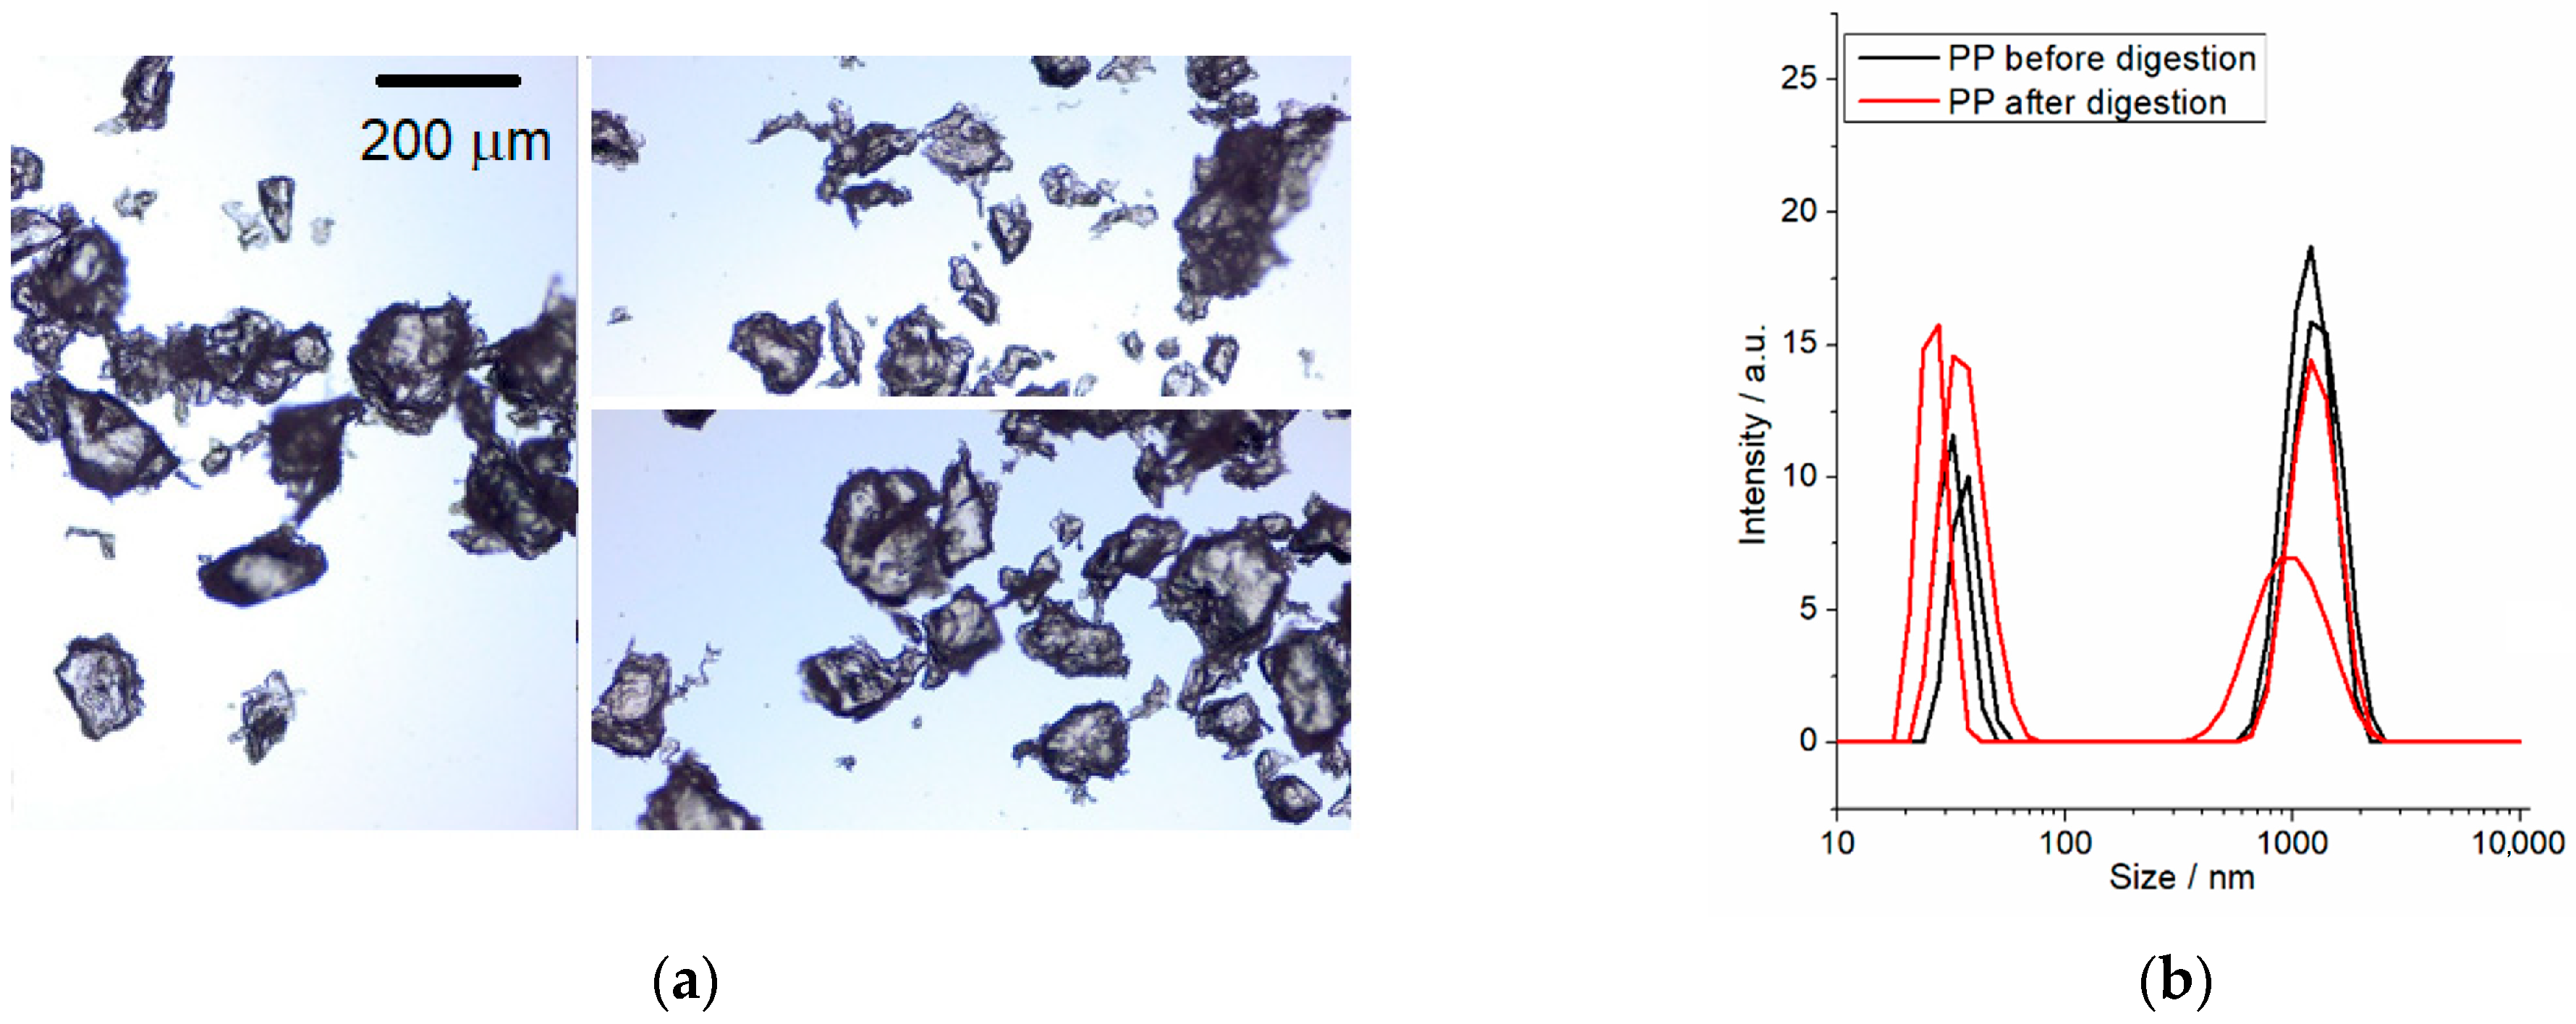
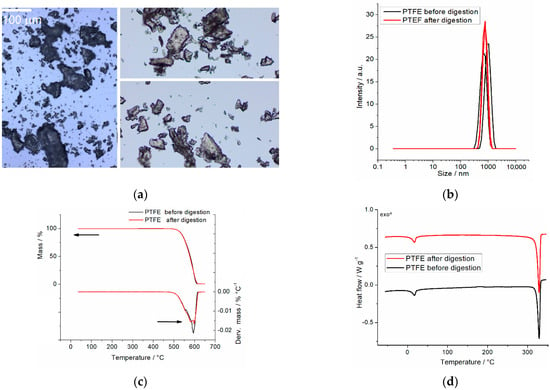
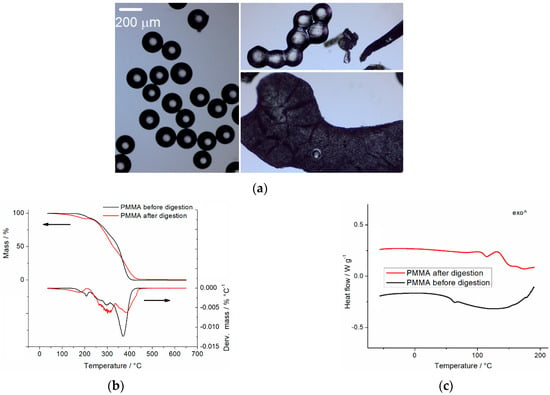
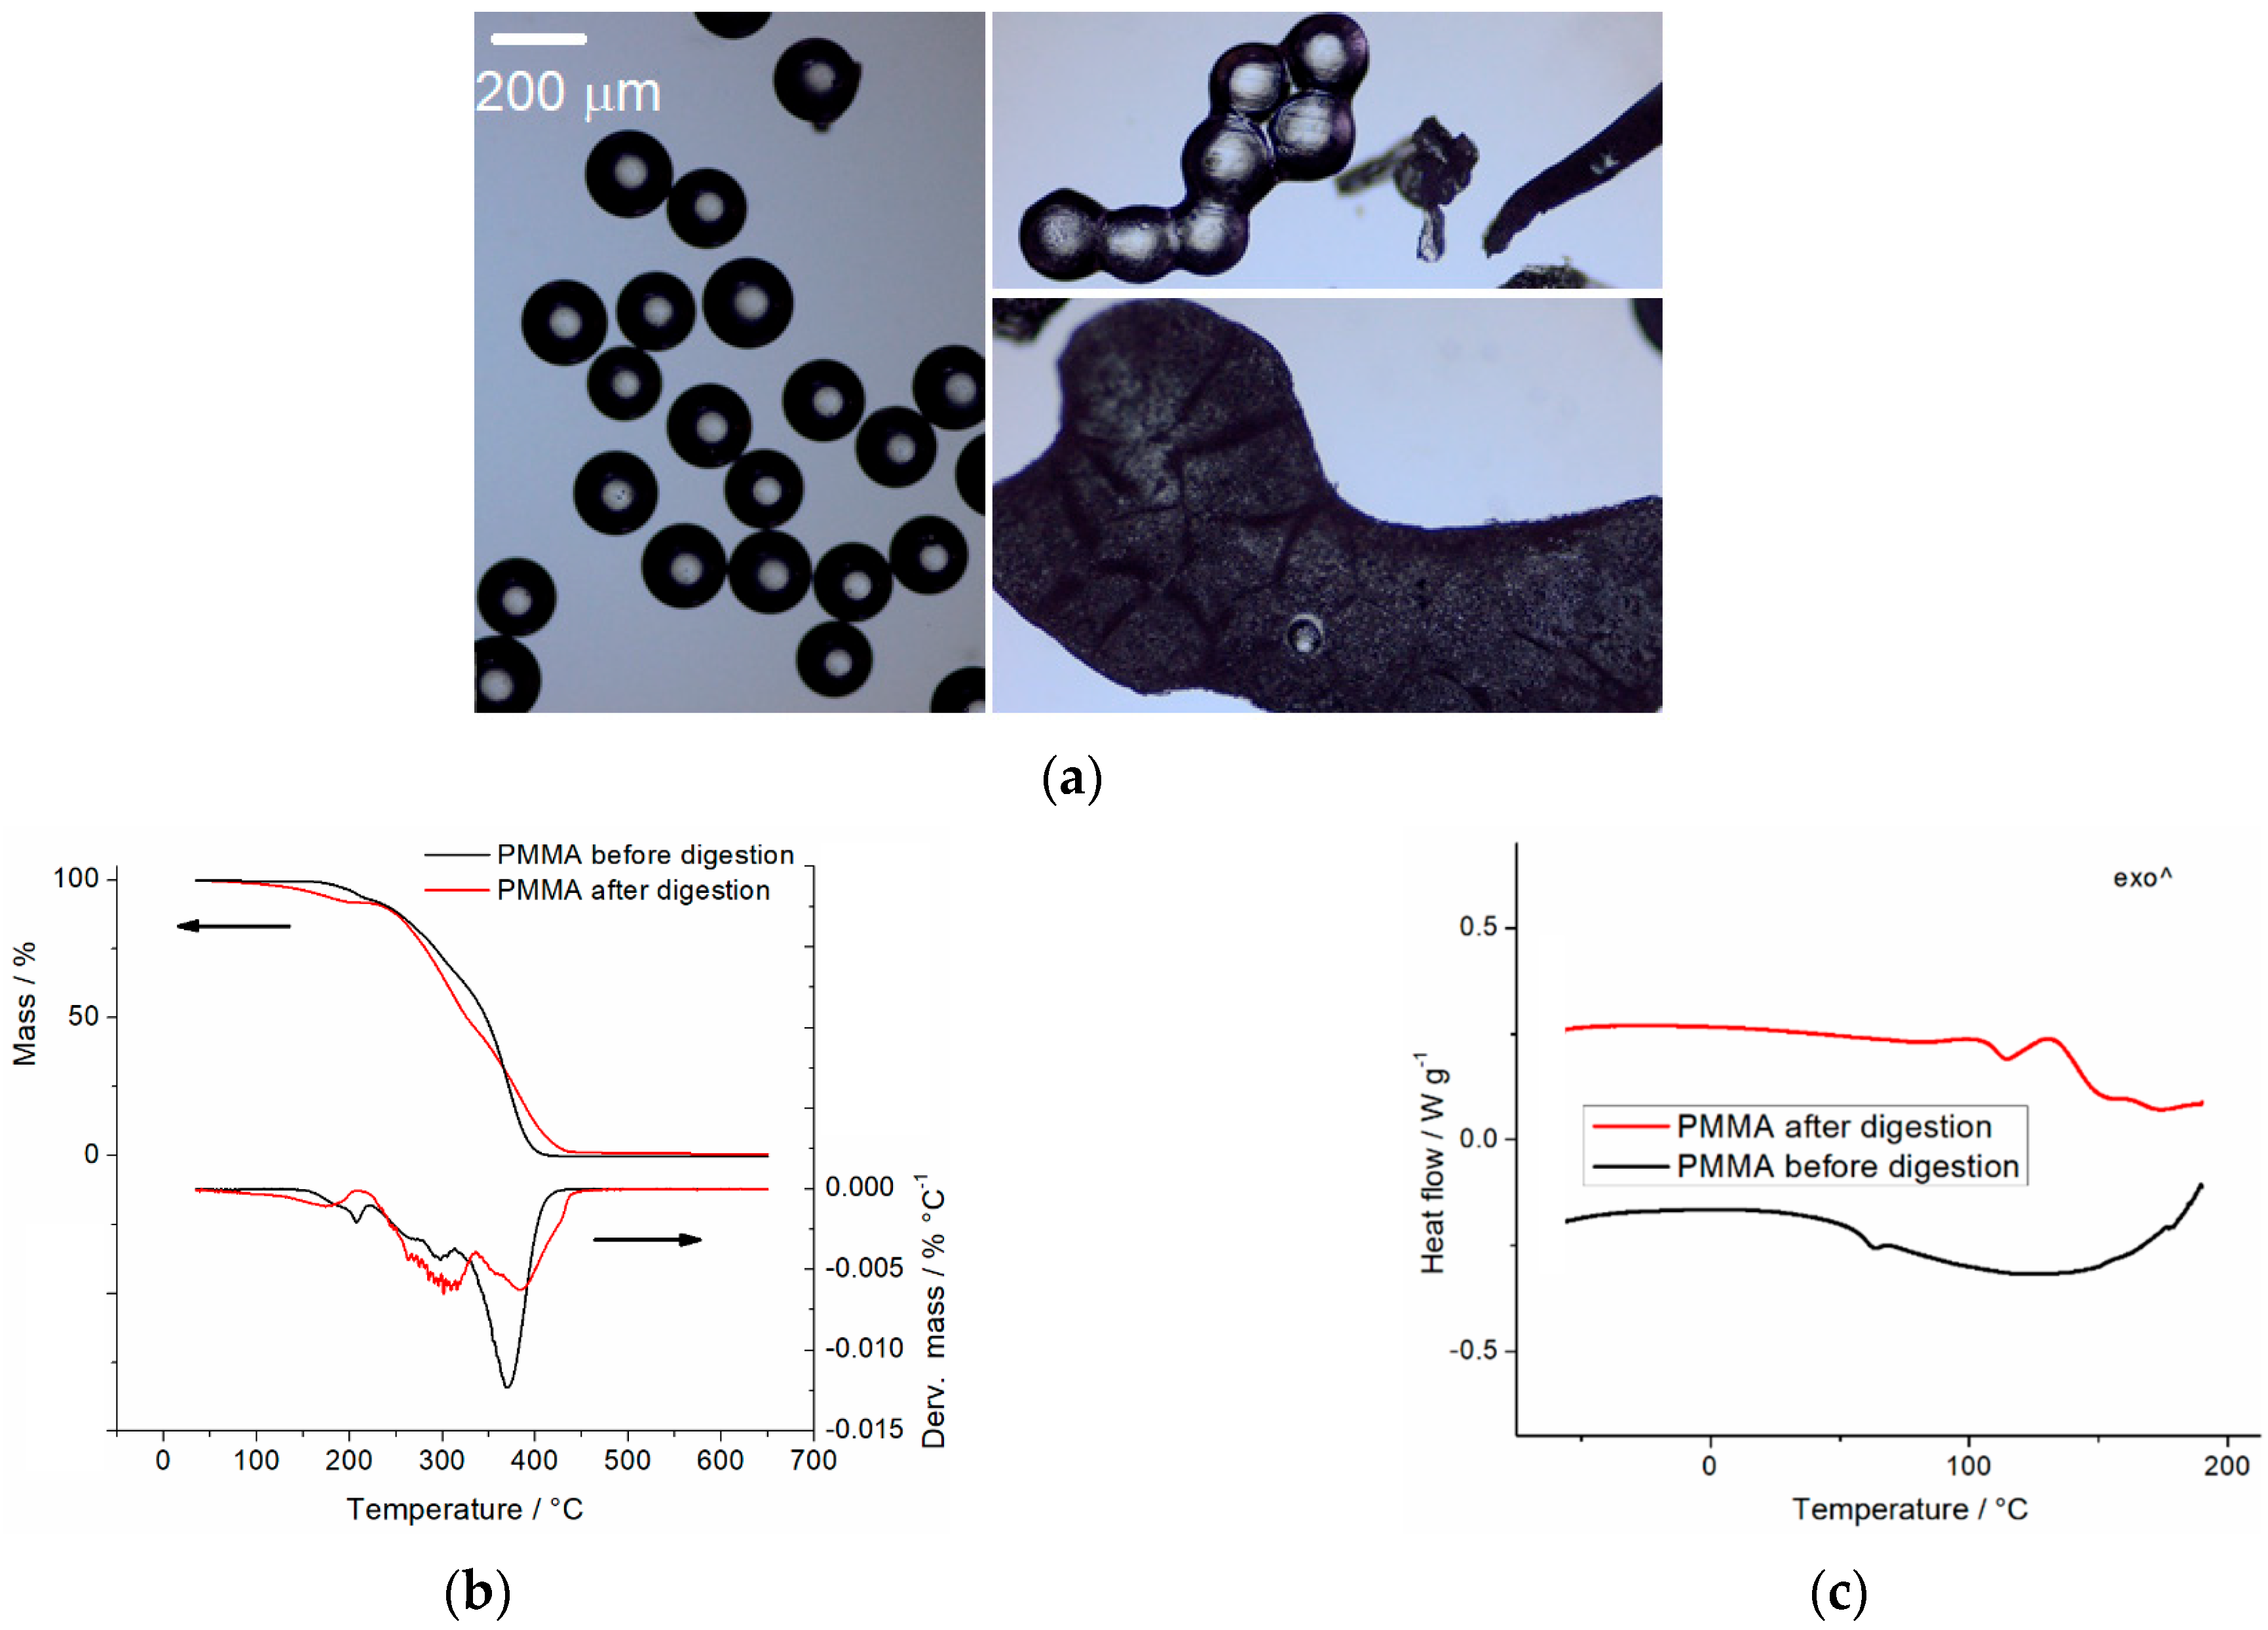
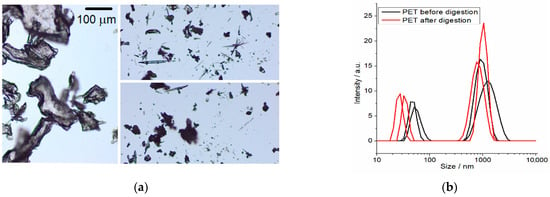
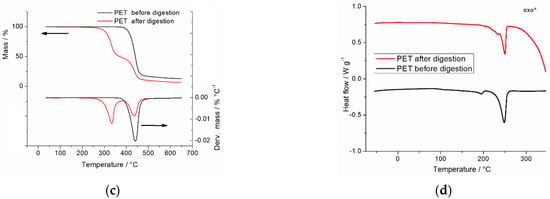
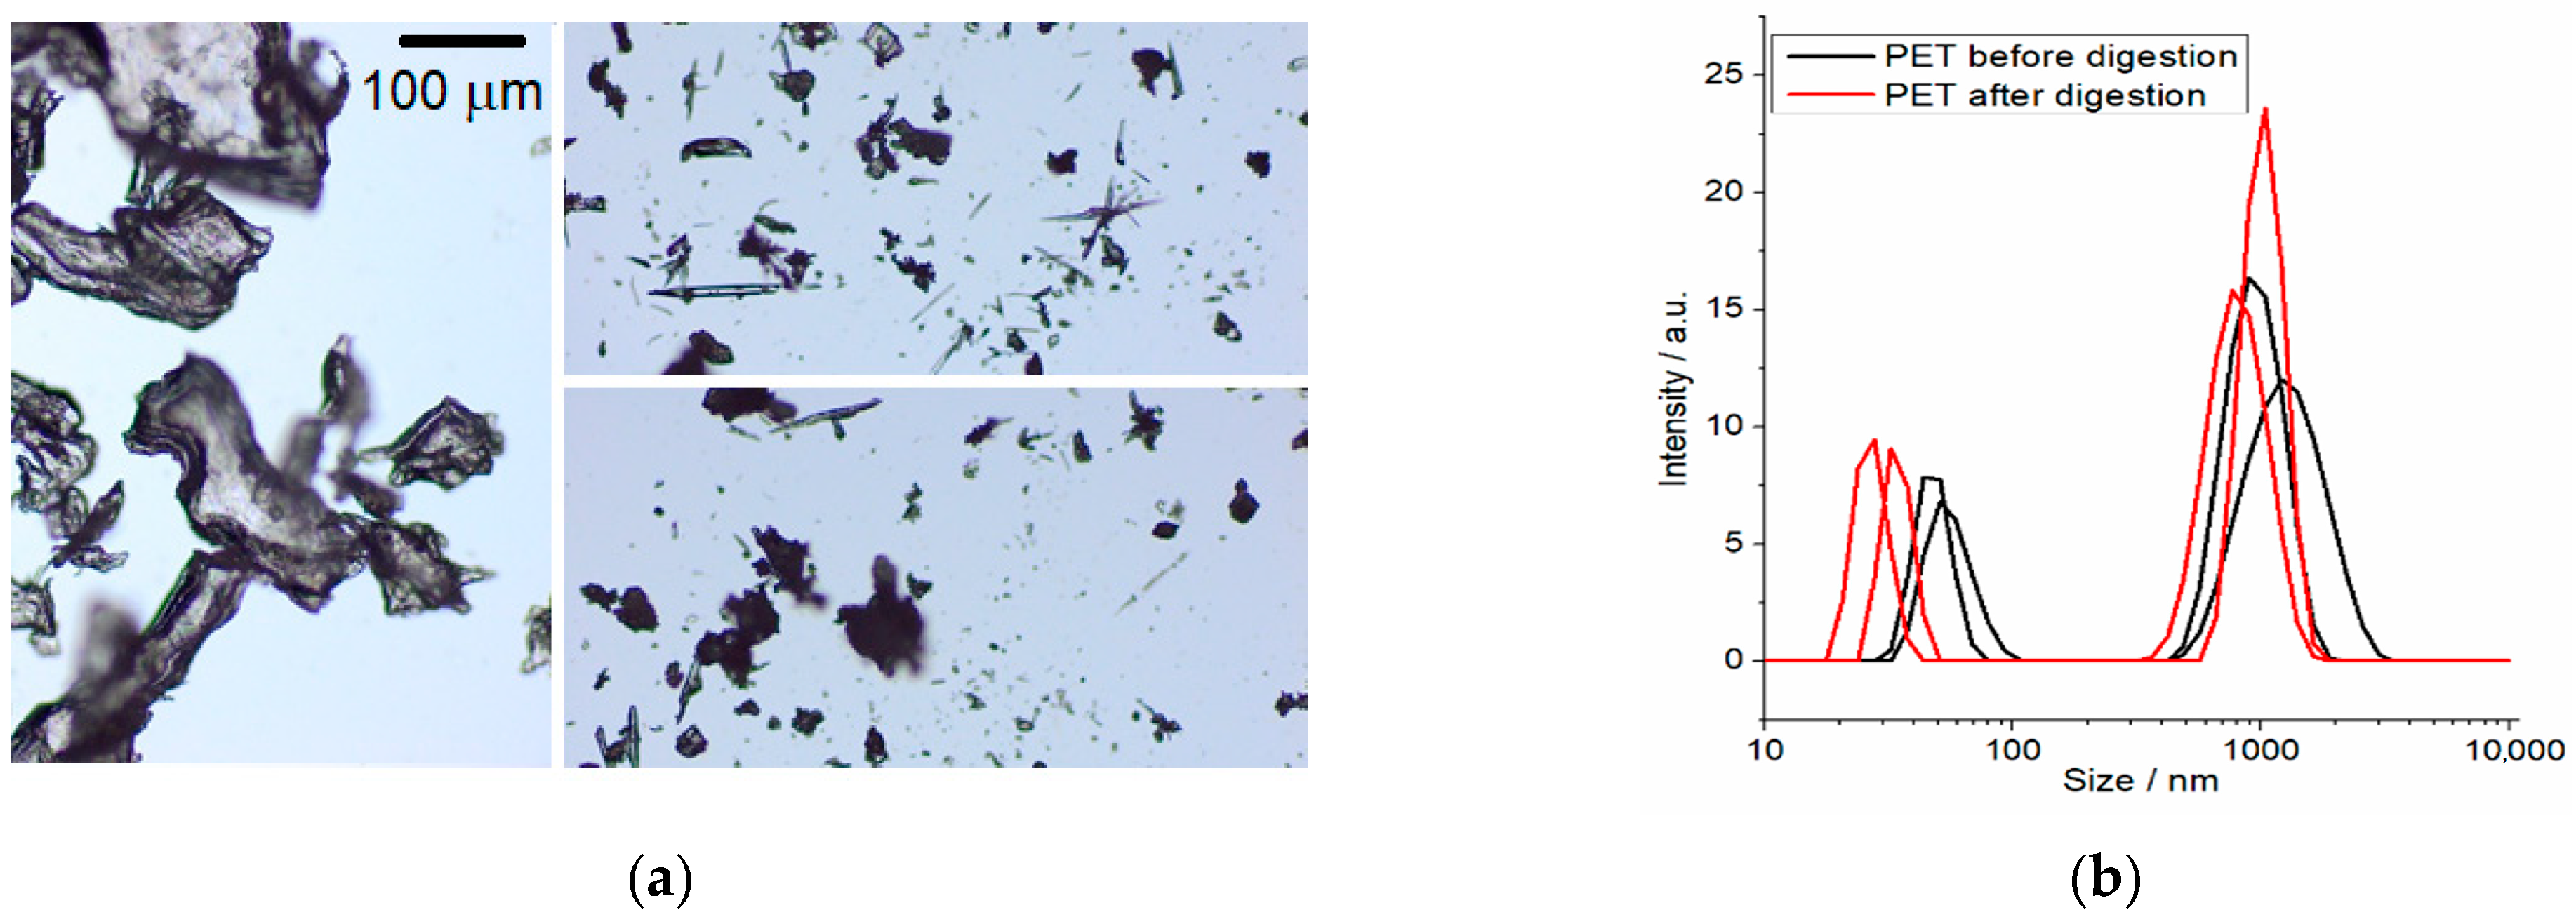
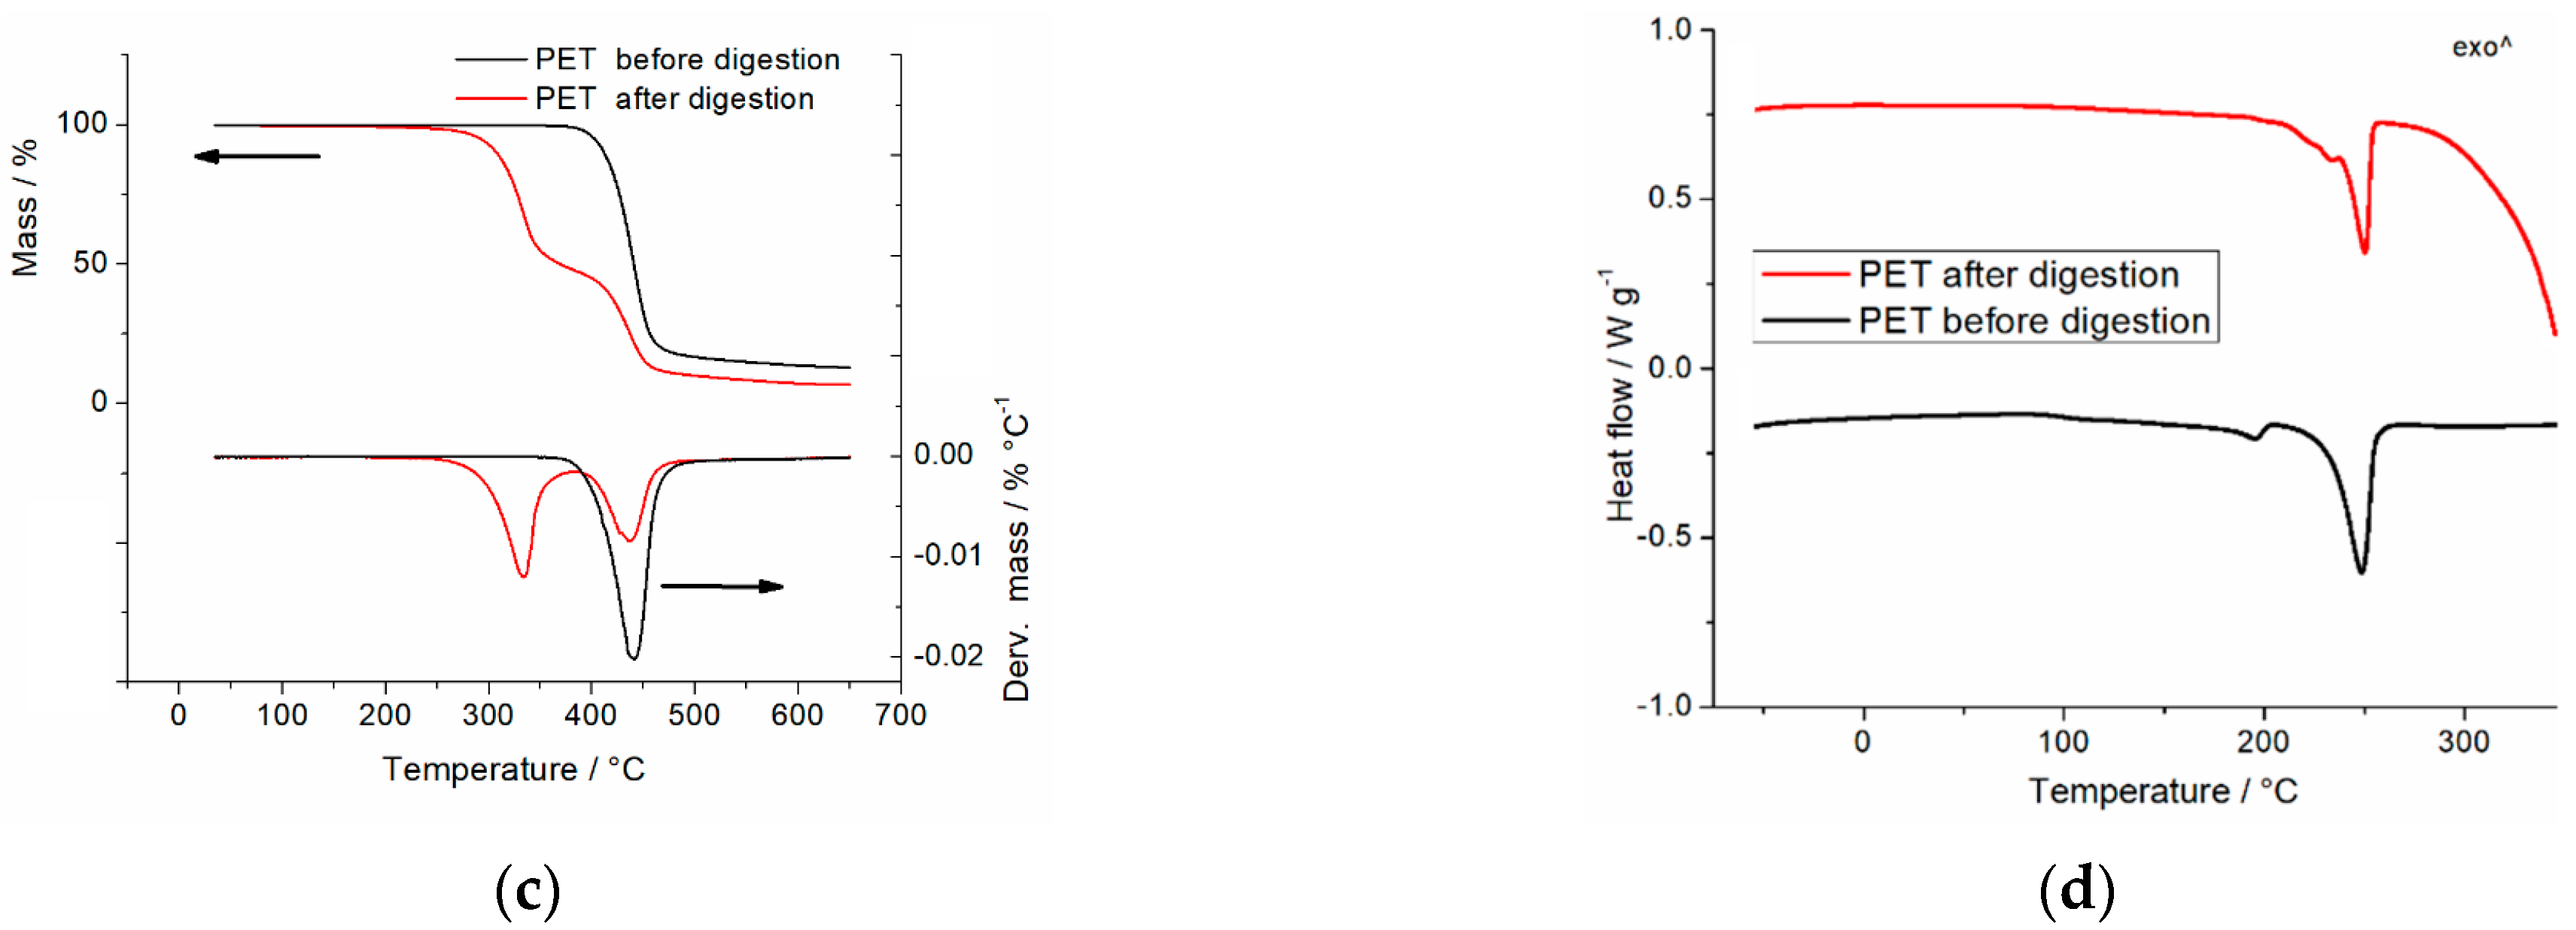

Disclaimer/Publisher’s Note: The statements, opinions and data contained in all publications are solely those of the individual author(s) and contributor(s) and not of MDPI and/or the editor(s). MDPI and/or the editor(s) disclaim responsibility for any injury to people or property resulting from any ideas, methods, instructions or products referred to in the content. |
© 2026 by the authors. Licensee MDPI, Basel, Switzerland. This article is an open access article distributed under the terms and conditions of the Creative Commons Attribution (CC BY) license.