


Abstract
Anaerobic digestion (AD) of lignocellulosic biomass is often constrained by biomass recalcitrance, limiting methane recovery. This study investigated whether low-temperature dilute-acid hydrothermal pretreatment could enhance methane production from pine nut shells (PNSs), a lignin-rich and underutilized agro-industrial residue, and whether derivative-based kinetic landmarks could provide a more systematic characterization of batch AD performance. Methane production was significantly improved by dilute sulfuric acid and hydrothermal pretreatments. The highest methane yield (201.8 mL CH4 g−1 VS) was achieved under the combined 100 °C hydrothermal and 2.5% H2SO4 condition, representing approximately 1.8-fold and 3.3-fold increases compared with hydrothermal-only and untreated PNSs, respectively. Enhanced performance was attributed to hemicellulose solubilization, lignin disruption, and improved substrate accessibility. In contrast, excessive acid severity resulted in process instability, associated with total volatile fatty acid accumulation and pH reduction. The Modified Logistic Model (MLM) was further used to derive five kinetic landmarks (PAA, PAM, PI, PDM, and PDA) describing phase-specific features of cumulative methane production curves. While these landmarks provide a model-based framework for comparing batch AD kinetics, their nearly constant normalized yields primarily reflect the geometry of the fitted logistic function rather than independent biological invariants. Overall, the results identify 100 °C hydrothermal pretreatment with 2.5% H2SO4 as an effective moderate-severity strategy for enhancing methane recovery from PNSs and demonstrate the utility of MLM-derived landmarks as comparative descriptors of phase-resolved methane production.
1. Introduction
The transition toward a circular bioeconomy necessitates the efficient valorization of lignocellulosic biomass, an abundant renewable resource for bioenergy production. However, the anaerobic digestion (AD) of these residues is fundamentally constrained by the recalcitrance of the lignocellulosic matrix [1]. This robust composite—comprising crystalline cellulose sheathed in hemicelluloses and lignin—severely restricts enzymatic accessibility and hydrolysis, thereby limiting methane yields and compromising process economics [2]. Consequently, the development of effective, energy-efficient pretreatment strategies is indispensable for deconstructing this complex architecture.
Among various pretreatment methodologies, acid–hydrothermal (HT) processing has emerged as a promising approach due to its efficacy in solubilizing hemicelluloses and disrupting lignin–carbohydrate complexes. While conventional high-temperature HT processes (>120 °C) are effective, they are energy-intensive and prone to generating fermentation inhibitors such as furfurals and phenolic compounds, which can suppress methanogenic activity. Recent evidence suggests that milder HT conditions (≤100 °C), when coupled with dilute-acid catalysis, can enhance biodegradability while mitigating inhibitor formation and reducing energy penalties [3,4]. Despite this potential, systematic studies optimizing low-temperature acid–HT synergy are scarce, particularly for underexplored, lignin-rich agro-industrial residues. Pine nut shells (PNSs; pine-nut processing residues), a significant by-product of the global nut industry, exemplify such an undervalued resource [5,6]. Currently relegated to low-grade fuel or waste, PNSs have relevant energy potential; recent fuel-property studies identify PNSs as lignocellulosic residues with appreciably higher heating value suitable for energy-oriented valorization [5], but they present a significant challenge for biological conversion due to their dense structural integrity [7]. To the author’s knowledge, no published study has investigated the efficacy of low-temperature acid–HT pretreatment to unlock the methane potential of PNSs.
Accurate kinetic analysis is equally critical for interpreting the effects of such pretreatments on digestion dynamics. The Modified Gompertz Model (MGM) has long been a widely used empirical approach for describing cumulative methane yields (CMYs) and providing aggregate parameters such as ultimate yield (A), maximum rate (Rₘ or μₘ), and lag phase (λ) [8,9,10,11]. However, a fundamental limitation persists: these sigmoidal models are primarily descriptive rather than diagnostic. They offer limited insight into the time-resolved process transitions—such as microbial acclimation, metabolic shifts, and inhibition-associated slowdowns—that govern the digestion trajectory. Furthermore, standard model parameters often exhibit high correlation and sensitivity to data scatter, limiting mechanistic interpretation [12]. Consequently, there remains a need for a kinetic framework that bridges the gap between empirical curve-fitting and mechanistically meaningful, phase-aware analysis.
This study addresses these dual challenges by integrating experimental optimization with a derivative-based kinetic framework. Beyond cumulative curve analysis, higher-order derivatives of the Modified Logistic Model (MLM) were examined to analytically identify five fitted-curve landmarks (PAA, PAM, PI, PDM and PDA). Under the parameterization used here, the asymmetric MGM does not provide equivalent fourth-derivative landmarks for early- and late-stage boundaries; the MLM enables a reproducible partitioning of the fitted CMY trajectory into curvature-defined regions [13]. Importantly, the normalized positions of these landmarks are treated here as model-implied geometric descriptors rather than as independent biological invariants.
Therefore, the aims of this study are: (i) to develop and evaluate a low-temperature acid–HT pretreatment strategy to enhance methane recovery from PNSs; (ii) to assess the structural and process-stability responses of PNSs during AD; and (iii) to use derivative-based MLM landmarks as comparative descriptors of phase-resolved CMY kinetics. The working hypothesis is that moderate acid–HT pretreatment can improve methane recovery by disrupting PNS recalcitrance, whereas excessive acid severity may cause process instability through total volatile fatty acid (TVFA) accumulation and, where present, inhibitory by-products that were not quantified here.
2. Materials and Methods
2.1. Substrate and Inoculum Preparation
PNSs were obtained from an agricultural facility in Aydın, Türkiye, immediately following the harvest season. To ensure substrate homogeneity and increase exposed surface area for hydrolysis, the raw biomass was mechanically milled and sieved to a particle size fraction of 1–2 mm, in accordance with previously described protocols [13,14]. The anaerobic inoculum was sourced from the effluent of a full-scale mesophilic anaerobic digester located in Trabzon, Türkiye. This parent digester is operated continuously under mesophilic conditions (≈35–37 °C); the physicochemical characteristics of the collected inoculum are summarized in Table 1. Prior to the biochemical methane potential (BMP) assays, the inoculum underwent a degassing period of 7 days at 37 °C to deplete residual endogenous substrates and ensure a stable methanogenic baseline. Both the substrate and inoculum were stored at 4 °C to preserve their initial biochemical characteristics [14]. All chemical reagents utilized in this study were of analytical grade, and solutions were prepared using deionized water.
Table 1.
Physicochemical characteristics of raw pine nut shells and the inoculum.
2.2. Pretreatment Strategies and Experimental Setup
The pretreatment experiments were designed to evaluate independent and synergistic effects of chemical and thermal disintegration. Acid pretreatment was conducted using sulfuric acid (H2SO4) at four distinct concentrations (0.5, 1.5, 2.5, and 3.5% w/w), following acid-pretreatment protocols reported for lignocellulosic biomass and shell residues [14,15,16,17,18,19]. To investigate thermo-chemical synergy, a combined acid–HT pretreatment was performed using 2.5% H2SO4 at 100 °C for 1 h [14,17]. Additionally, an HT control (HT-only) was set up under identical thermal conditions (at 100 °C for 1 h) without acidification to isolate the effects of thermal hydrolysis [15]. Untreated controls (distilled water) were prepared in parallel for baseline comparison. For each experimental run, 10 g of PNSs (TS basis) was suspended in 100 mL of the respective reagent solution within 500 mL Erlenmeyer flasks. The acid-only and control mixtures were agitated continuously at 150 rpm at ambient temperature (25 °C ± 2 °C) for a contact time of 24 h. All pretreatment conditions were executed in quadruplicate; three replicates were used for BMP assays, and the remaining replicate was retained for compositional/analytical measurements. Following the reaction phase, the slurries were cooled to room temperature, and the pH was neutralized to 7.0 ± 0.1 using 0.5 M NaOH to prevent inhibition during the subsequent digestion stage.
2.3. Biochemical Methane Potential (BMP) Assays
Batch BMP assays were conducted to quantify the enhancement in anaerobic biodegradability resulting from the applied pretreatments. The experimental design comprised eight distinct sets: a blank (inoculum only) to correct for background methane production, an untreated control, four acid-pretreated sets, one HT-only set, and one combined acid–HT set. The assays were performed in 1000 mL glass reactors with a working volume of 800 mL. An inoculum-to-substrate ratio (ISR) of 2.0 on a VS basis was maintained across all conditions to reduce the risk of acidification and support methanogenic activity [20]. Accordingly, each reactor was loaded with approximately 9.0 g VS of substrate and 353 mL of inoculum (approximately 18 g VS), with the remaining volume supplemented with distilled water to reach the target working level. This corresponded to an initial substrate loading of 11.25 g VS L−1 and an inoculum loading of 22.50 g VS L−1 in the BMP reactors. To establish strict anaerobic conditions, the reactor headspace was purged with nitrogen gas (N2) for 3 min [17]. Reactors were sealed, connected to gas collection bags, and incubated under mesophilic conditions (37 ± 1.5 °C) with manual agitation performed twice daily to reduce mass-transfer limitations. The digestion period was terminated when the daily methane yield (DMY) dropped below 1% of the cumulative production for three consecutive days [18,19]. The experimental validation criteria, including blank activity and coefficients of variation, adhered to the guidelines proposed by Holliger et al. [20]. All assays were conducted in triplicate, and methane yields were normalized to standard temperature and pressure conditions and reported as mL CH4 per gram of VS added (mL CH4 g−1 VS). Net methane production was calculated by subtracting the yield of the inoculum-only blanks from the gross yield of the substrate reactors. The ISR was used as a loading-control criterion and was not interpreted as a direct measurement of buffering capacity [21].
2.4. Analytical Methods
2.4.1. Physicochemical Characterization
Total solids (TS), volatile solids (VS), total chemical oxygen demand (TCOD), and soluble chemical oxygen demand (SCOD) were determined in accordance with the Standard Methods for the Examination of Water and Wastewater [22]. The pH was monitored using a precision pH meter (FE28-S, METTLER-TOLED Co., Shanghai,, China). The lignocellulosic composition (cellulose, hemicelluloses, and acid-insoluble lignin) of both raw and pretreated PNSs was quantified using a fiber analyzer (ANKOM Technology Co., Macedon, NY, USA) utilizing the Van Soest method [23]. To evaluate the efficiency of the pretreatment, the component removal rate was calculated based on mass balance using Equation (1) [24,25]:
where and represent the concentration (%) of the specific component (e.g., lignin) in pretreated and raw biomass, respectively, while and denote the dry mass (g) of the solids.
TS recovery was calculated to quantify the dry mass loss during pretreatment, as described in Equation (2):
The efficiency of organic matter degradation during AD was assessed by calculating the VS reduction via Equation (3):
where and represent the mass of volatile solids loaded into the reactor and the mass remaining in the digestate, respectively.
2.4.2. Microstructural Analysis
Morphological changes in the biomass surface structure induced by pretreatment were examined using Scanning Electron Microscopy (SEM). Prior to imaging, dried samples were sputter-coated with gold to enhance conductivity. Micrographs were acquired using an SU–1510 SEM (Hitachi, Tokyo, Japan) at magnifications of 1000× and 3000× under high-vacuum conditions.
2.4.3. Chromatographic Analysis
Biogas production volume was measured daily using the water displacement method, corrected to standard temperature and pressure. The CH4 content was quantified using a PerkinElmer Clarus 500 Gas Chromatograph (GC) (Shimadzu Corporation, Kyoto, Japan) equipped with a Flame Ionization Detector (FID) and a Mol-Sieve 5A PLOT column. The operating temperatures for the detector, oven, and injector were maintained at 250 °C, 100 °C, and 230 °C, respectively. Helium was used as the carrier gas at a flow rate of 14 mL/min [24].
TVFAs—specifically acetic, propionic, butyric, and valeric acids—were analyzed to monitor process stability. Liquid samples were filtered through 0.45 µm membrane filters prior to injection into a Shimadzu GC-2010 equipped with a ZB-Wax Plus column (27.6 m × 0.25 mm × 0.25 µm) and an FID. Helium served as the carrier gas at a flow rate of 82 mL/min. The injector and detector temperatures were set to 250 °C. The oven temperature program was initiated at 40 °C (held for 2 min), ramped at 20 °C/min to 160 °C, then ramped at 40 °C/min to 220 °C, and held for 2 min [25].
2.5. Modeling Framework
2.5.1. Mathematical Derivation of Critical Points in the Modified Logistic Model
The CMY profiles were modeled using the MLM, as defined in Equation (4):
where y is the methane yield at time t (mL CH4 g−1 VS), t is time (days), and A is the maximum methane yield.
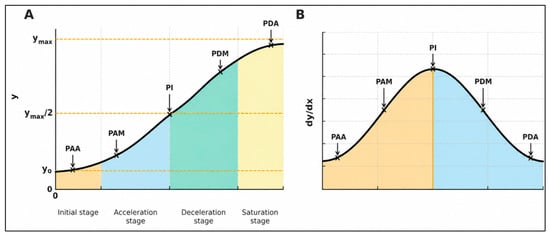
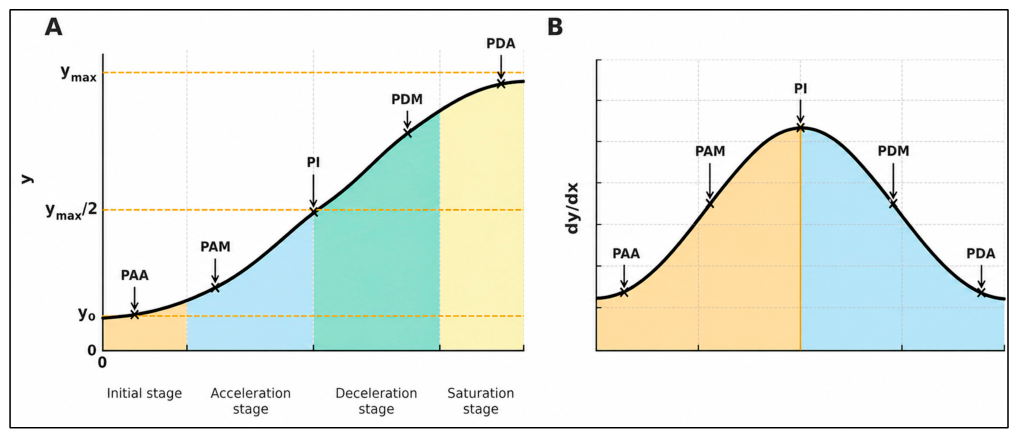
The analytical differentiation of Equation (4) allows the identification of model-derived kinetic landmarks. Higher-order derivatives were computed, and the roots of these derivatives were determined to identify five curvature-based points [12] (Figure 1A):
Figure 1.
Modified logistic model (MLM) and derivative-based kinetic landmarks. (A) Normalized cumulative methane yield curve showing PAA, PAM, PI, PDM, and PDA. (B) First-derivative curve showing the methane production rate profile.
- PAA: Onset of early acceleration (Point of asymptotic acceleration);
- PAM: Maximum acceleration (Point of acceleration maximum);
- PI: Inflection point (maximum production rate);
- PDM: Maximum deceleration (Point of deceleration maximum);
- PDA: Onset of terminal deceleration (Point of asymptotic deceleration).
These points partition the fitted methane-production curve into distinct mathematical regions that may be compared with biological process indicators such as pH and TVFA trends, but they should not be interpreted as direct microbial phase boundaries without independent biochemical validation.
First Derivative: The first derivative represents the rate of methane production (Figure 1B):
Since the numerator of the logistic function’s derivative is strictly positive for all finite t, y′(t) reaches zero only in the limit:
y′ (t) → 0 as t → ∞
This corresponds to the terminal saturation regime where the methane production rate approaches zero.
Second Derivative (Inflection Point): The second derivative, y″ (t), describes the change in the production rate (acceleration). Setting this derivative to zero identifies the inflection point (PI), where the velocity is maximum:
Solving Equation (6) yields the time at the inflection point, as shown in Equation (7):
Third Derivative (Maximum acceleration and deceleration): The third derivative, y‴(t), identifies the points where the change in acceleration is zero (extremes of acceleration).
Setting the numerator of the third derivative to zero yields two real roots, corresponding to the Point of Maximum Deceleration (PDM) and the Point of Maximum Acceleration (PAM):
Fourth Derivative (Onset and Termination): The fourth derivative, (t), identifies the “knees” of the curve, representing the asymptotic onset (PAA) and termination (PDA) of the active phase.
where is given by Equation (12):
The solution involves finding the roots of the auxiliary polynomial Equation (12), where u is the exponential term. The real roots of this equation yield the time points for PAA (Equation (13)) and PDA (Equation (14)):
2.5.2. Mathematical Derivation of Critical Points in the Modified Gompertz Model
To account for the potentially asymmetric nature of microbial growth dynamics often observed in biogas systems, the CMY profiles were also evaluated using the MGM. The general form of the model is expressed in Equation (15):
where y(t) is the CMY (mL CH4 g−1 VS) at time t, A is the maximum methane production potential, μₘ is the maximum methane production rate (mL CH4 g−1 VS d−1), and λ is the lag phase duration (d).
This equation allows for the analytical derivation of the first three derivatives, which yield model-derived critical points with potential process-level interpretation: PI, PAM, and PDM. Unlike the MLM, the MGM is inherently asymmetric. Consequently, higher-order derivatives (specifically the fourth derivative) did not yield additional real-valued roots under the fitted parameter ranges examined here; therefore, points analogous to PAA and PDA were not defined within this framework.
First Derivative (methane production rate): Differentiating Equation (15) with respect to time yields the instantaneous methane production rate, as shown in Equation (16):
This expression defines a rate curve that increases monotonically during the lag and early exponential phases before reaching a maximum at the inflection point.
Second Derivative (Inflection Point): The second derivative describes the acceleration of gas production. Setting Equation (17) to zero identifies the Inflection Point (PI):
Solving for the root of the bracketed term yields the coordinates for PI (Equation (18)):
Third Derivative (Maximum Acceleration/Deceleration): The third derivative identifies the points of maximum acceleration (PAM) and deceleration (PDM).
Setting the third derivative to zero yields two real solutions corresponding to PAM and PDM (Equations (20) and (21)):
Fourth Derivative (limitation): The analytically derived fourth derivative of the MGM (Equation (22)) leads to a complex polynomial expression involving exponential terms:
In this implementation, analysis of this equation indicated that it did not produce additional real-valued roots within the fitted AD parameter ranges. This mathematical behavior reflects the inherent left-skewed asymmetry of the MGM curve, indicating that higher-order curvature transitions (such as PAA and PDA) have no directly comparable closed-form definition in the MGM context. Thus, only PI, PAM, and PDM were retained as kinetic descriptors for this model.
2.5.3. Statistical Analysis
To determine statistical significance (p < 0.05), a one-way analysis of variance (ANOVA) was conducted using IBM SPSS Statistics 26.0 while Microsoft Excel was used for preliminary data handling and visualization. Model performance was evaluated using standard statistical criteria, including the sum of squared errors (SSE) (Equation (23)), root mean squared error (RMSE) (Equation (24)), and coefficient of determination (R2) (Equation (25)).
The error statistics were computed as follows:
where is the predicted value, is the experimental value, is the mean of the experimental data, and N is the number of observations.
3. Results and Discussion
3.1. Physicochemical Characterization of Raw Pine Nut Shells and Inoculum
The main physicochemical characteristics of the raw PNSs and the anaerobic inoculum used in this study are presented in Table 1. The raw PNSs had a high solids content, with TS and VS values of 93.1% and 90.5%, respectively. The high VS/TS ratio indicates that the material contains a substantial organic fraction and therefore has theoretical potential for bioenergy production [24,26]. However, the practical conversion of this organic matter into methane largely depends on the structural composition and biodegradability of the biomass.
The lignocellulosic composition showed that PNSs are a highly resistant substrate, with cellulose, hemicelluloses, and lignin accounting together for 88.7% of the biomass. In particular, the lignin content was 45.1%, while cellulose and hemicellulose contents were 23.3% and 20.4%, respectively. This relatively high-lignin fraction is consistent with previous studies describing PNSs as a dense lignocellulosic by-product with appreciably higher heating value [5]. These values are broadly consistent with the lignin-rich composition reported for PNSs by Şen et al. [5], who documented a comparable cellulose fraction (approximately 22.3%) together with a higher lignin content (approximately 53.0%) and a slightly lower hemicellulose fraction (≈18.9%); the modest differences likely reflect variations in cultivar, geographical origin, and the compositional assay method. Consistent with this composition, PNSs have been reported to exhibit a high calorific value of approximately 20.6–20.7 MJ kg−1, supporting their suitability for energy-oriented valorization [5]. From an AD perspective, however, lignin can limit biodegradability by forming a protective matrix around cellulose and hemicelluloses, thereby reducing the accessibility of hydrolytic enzymes to fermentable carbohydrates.
This pronounced structural complexity provides the rationale for the pretreatment strategies used in this study. The application of acid and combined acid–HT pretreatments is specifically intended to disrupt this rigid lignocellulosic matrix, solubilize the hemicellulose fraction, and alter lignin morphology, thereby enhancing the bioaccessibility of the substrate for subsequent methane production [18,19].
3.2. Effects of Pretreatment on Lignocellulosic Structure, Solubilization, and Surface Morphology
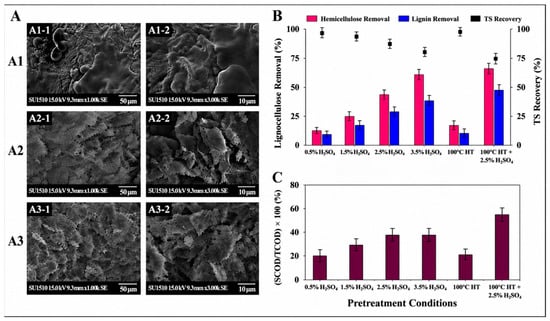
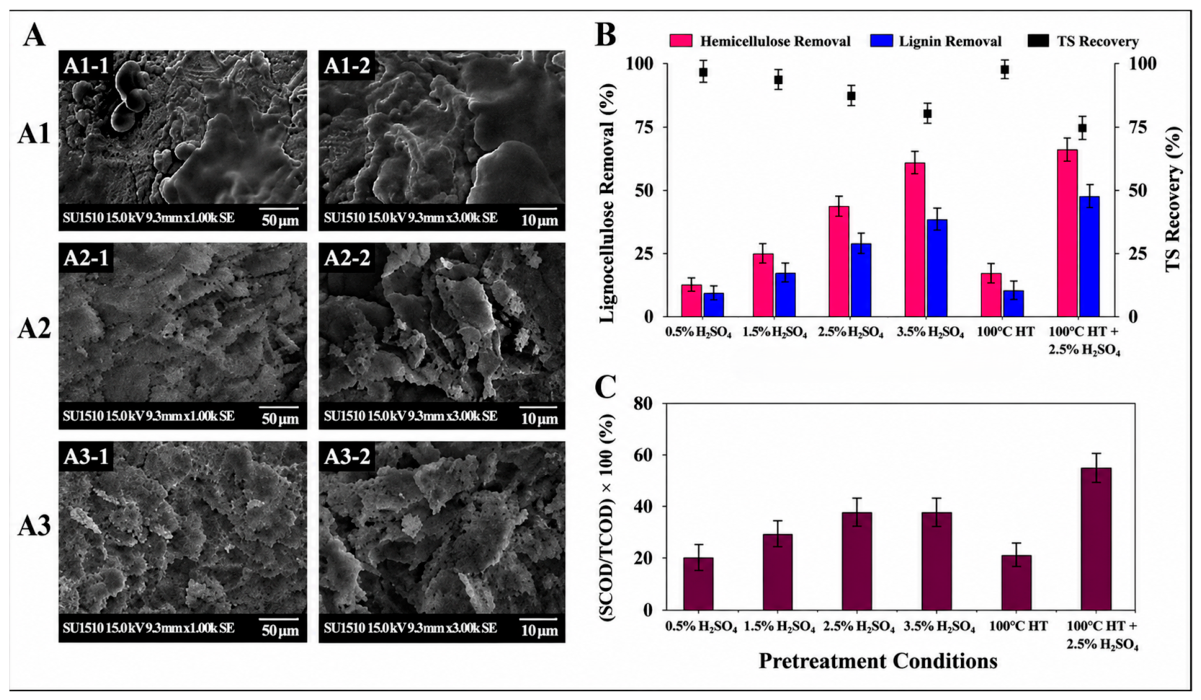
The microstructural alterations induced by dilute acid and HT pretreatments were visualized using SEM and are presented in Figure 2A. The untreated PNSs (A1) exhibited a smooth, compact, and highly ordered surface morphology, characteristic of native lignocellulosic biomass, where lignin and hemicelluloses form a rigid, recalcitrant matrix encapsulating cellulose microfibrils [26,27]. This intact architecture creates a physical barrier to microbial colonization and enzymatic attack. Following pretreatment with 2.5% H2SO4 (A2), clear signs of morphological deterioration were observed, including surface roughening, fibrillar exposure, and the formation of micro-fissures. These features are consistent with the partial solubilization of the hemicellulose fraction and the redistribution of lignin, indicating early-stage matrix disintegration. The most pronounced visible alteration was observed under the combined acid–HT pretreatment (100 °C + 2.5% H2SO4) (A3), where the PNS surface showed marked roughening, fragmentation, and disruption of the fiber network [24]. Because specific surface area was not directly measured, this interpretation is restricted to qualitative SEM evidence and compositional changes rather than presented as a quantitative surface-area increase [25].
Figure 2.
Structural and compositional changes in PNSs after pretreatment. (A) SEM images of selected PNS samples: A1, untreated control; A2, hydrothermally pretreated PNSs at 100 °C; and A3, acid–hydrothermally pretreated PNSs at 100 °C with 2.5% H2SO4. Images A1-1, A2-1, and A3-1 show the surface morphology of the corresponding samples at 1000× magnification, whereas A1-2, A2-2, and A3-2 show the same samples at 3000× magnification. (B) Hemicellulose and lignin removal with TS recovery. (C) SCOD/TCOD solubilization efficiency. Bars represent mean ± SD (n = 3).
Such visible alterations may facilitate microbial attachment and enzymatic hydrolysis during AD [28,29]. These qualitative morphological observations were supported by compositional analysis (Figure 2B). Removal of hemicelluloses exhibited a strong positive relationship with acid severity, increasing from 11.9% at 0.5% H2SO4 to 66.7% at 3.5% H2SO4. This supports the high susceptibility of the amorphous hemicellulosic backbone to dilute-acid hydrolysis [30]. Lignin removal, although inherently more difficult, also increased from 10.4% to 40.1% across the same range, suggesting secondary acid-induced solubilization via the cleavage of acid-labile ether linkages [31]. Together, these compositional changes likely increased cellulose accessibility during AD.
The combined acid–HT pretreatment achieved the highest overall delignification efficiency (approximately 48%). This indicates a synergistic effect in which HT conditions may promote lignin redistribution and fiber swelling, while the acid catalyst accelerates hydrolysis of the hemicellulosic matrix that anchors lignin–carbohydrate complexes [17,18]. The solubilization performance, expressed as the ratio of SCOD to TCOD (%SCOD/TCOD), followed a similar trend (Figure 2C). This trend was consistent with the visible fiber disruption observed in SEM micrographs.
However, a critical trade-off was identified regarding mass recovery. The improvement in solubilization was accompanied by a decrease in TS recovery, particularly at 3.5% H2SO4 and under combined pretreatment conditions. This may reflect biomass mass loss through solubilization and, at high severities, possible degradation of released sugars into inhibitory compounds [16]; however, these inhibitors were not directly quantified in this study. In this context, the combined pretreatment at moderate severity (100 °C + 2.5% H2SO4) emerged as the optimal strategy. It achieved a favorable balance, delivering strong structural deconstruction (≈48% delignification and visible surface disruption) while maintaining acceptable mass retention, thereby providing the most suitable substrate for enhancing methane production.
3.3. Effects of Pretreatments on Methane Yields and TVFA/pH Dynamics
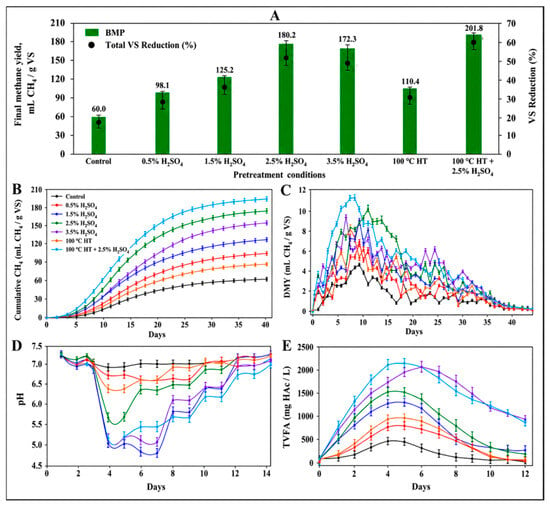
The AD performance was evaluated using CMY, DMY, pH, and TVFA dynamics, as summarized in Figure 3. These indicators collectively show how pretreatment severity affected both substrate solubilization and the balance between acidogenic and methanogenic pathways.
Figure 3.
Anaerobic digestion performance of PNSs under different pretreatment conditions. (A) Final BMP and VS reduction, (B) CMY profiles, (C) DMY rates, (D) pH, and (E) TVFA dynamics. Bars and symbols represent mean ± SD (n = 3).
Moderate dilute-acid pretreatments (≤2.5% H2SO4) enhanced methane yield and hydrolysis rates by disrupting hemicellulosic fractions and increasing the availability of fermentable organic matter. This was reflected in sharper DMY peaks (8–10 mL CH4 g−1 VS day−1) (Figure 3C) and rapid TVFA turnover. The simultaneous rise and subsequent decline in TVFAs (peaking at approximately 1700–2000 mg/L) indicate that acidogenesis and methanogenesis remained comparatively well coupled under moderate pretreatment severity (Figure 3E) [6,30].
The highest performance was observed with the combined HT–acid pretreatment (100 °C HT + 2.5% H2SO4), indicating that this condition provided a favorable balance between structural disruption and process stability. This outcome is consistent with HT-induced fiber swelling/autohydrolysis and acid-catalyzed hydrolysis of the hemicellulosic fraction [16,25], as supported by SEM and compositional evidence (Figure 2A,B). Accordingly, this group exhibited the most pronounced early methane-production rates, with DMY peaks of approximately 10–12 mL CH4 g−1 VS day−1, together with relatively rapid pH stabilization despite elevated initial TVFA formation.
In contrast, the higher-acid-dose condition (3.5% H2SO4) was associated with lower methane production, consistent with excessive solubilization, TVFA accumulation, prolonged pH depression, and the possible formation of unquantified inhibitory by-products [16,25]. Although the inoculum had an initial alkalinity of 1980 ± 122 mg CaCO3 L−1, the 3.5% H2SO4 reactors generated the highest TVFA peak, approximately 2200–2400 mg HAc L−1, corresponding to a high estimated peak TVFA-to-initial alkalinity ratio. This indicates that the acid load may have temporarily exceeded the effective buffering capacity of the batch system. The delayed consumption of TVFAs indicates functional process instability, while the prolonged pH decrease to approximately 5.0–5.5 is consistent with the accumulation of undissociated acids, which can impair microbial energetics and methanogenic activity [16,25]. However, because HPLC or GC-MS analysis of the post-pretreatment liquid fraction was not performed, the contribution of specific inhibitory compounds such as furfural, 5-HMF, and soluble phenolics cannot be isolated in the present study. Therefore, the reduced methane production under 3.5% H2SO4 should be interpreted as a process-level inhibition response associated with excessive solubilization, TVFA accumulation, pH depression, and possible unquantified inhibitory by-products, rather than as direct evidence of a specific inhibitor class.
These methane-production trends suggest a shift in the dominant rate-limiting step of the AD process. Under untreated and mildly pretreated conditions, hydrolysis remained the main bottleneck, as reflected by low and delayed DMY peaks of approximately 2–3 mL CH4 g−1 VS day−1. As pretreatment severity increased to the optimal range, particularly under the combined HT–acid condition, this hydrolytic limitation was alleviated, and soluble intermediates were more effectively converted into methane. At the higher acid dose, however, increased solubilization was accompanied by acid accumulation, pH instability, and delayed TVFA conversion rather than further kinetic benefit [25].
Comparison with Previous Studies and Experimental Contribution
To contextualize these findings, the methane production of acid–HT-pretreated PNSs was compared with that obtained with previously reported lignocellulosic substrates. The peak methane yield obtained here (201.8 mL CH4 g−1 VS under 100 °C HT + 2.5% H2SO4, a 3.3-fold increase over the untreated control) falls within or above the range reported for other highly recalcitrant nut-shell residues subjected to chemical or thermochemical pretreatment, including chestnut [25,30], hazelnut [12,24,31], and peanut shells [17], as well as mixed nut residues [6]. Although direct quantitative comparisons among studies should be interpreted cautiously due to differences in substrate composition, pretreatment severity, and digestion conditions, the present results support the effectiveness of the proposed strategy for enhancing methane recovery from lignin-rich residues.
Compared with conventional high-temperature HT processing (>120 °C) and concentrated-acid routes, the present low-temperature acid/HT pretreatment achieved substantial removal of hemicelluloses (up to 66.7%) together with lignin solubilization, reaching ≈48% under the combined 100 °C HT + 2.5% H2SO4 condition, with acceptable mass recovery, consistent with the milder operating windows advocated for energy-efficient pretreatment [4,29]. Relative to alkaline and organosolv routes applied to comparable feedstocks [25,30,32], the dilute-H2SO4 approach offers a simpler and lower-cost reagent system, although it requires pH neutralization prior to digestion; comparable gains reported for the thermal pretreatment of recalcitrant lignocellulose in the co-digestion of wheat straw further support this approach [15].
The principal experimental contribution is twofold. First, to the best of the author’s knowledge, it provides the first demonstration that low-temperature acid–HT pretreatment can unlock the methane potential of PNSs, an abundant but previously underexploited lignin-rich residue. Second, it identifies a moderate-severity combined condition (100 °C + 2.5% H2SO4) that optimally balances structural deconstruction against over-solubilization and inhibition.
3.4. Kinetic Analysis Results
3.4.1. Critical Point Analysis Outcomes for the Modified Logistic Model
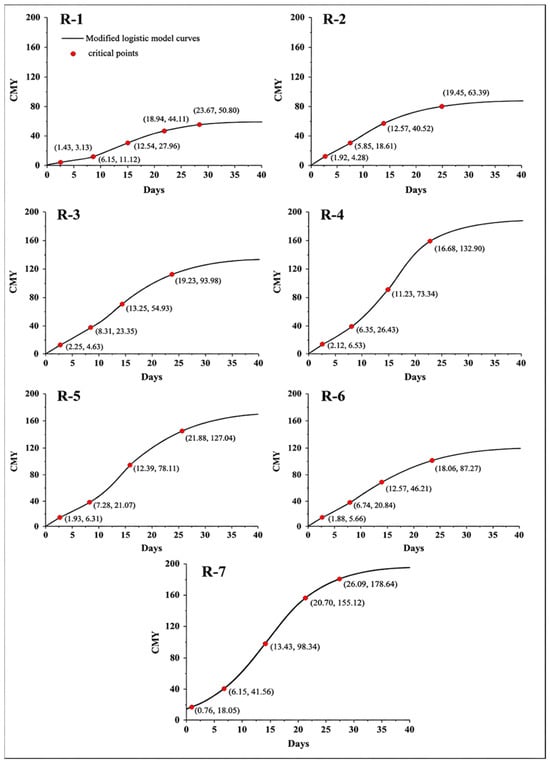
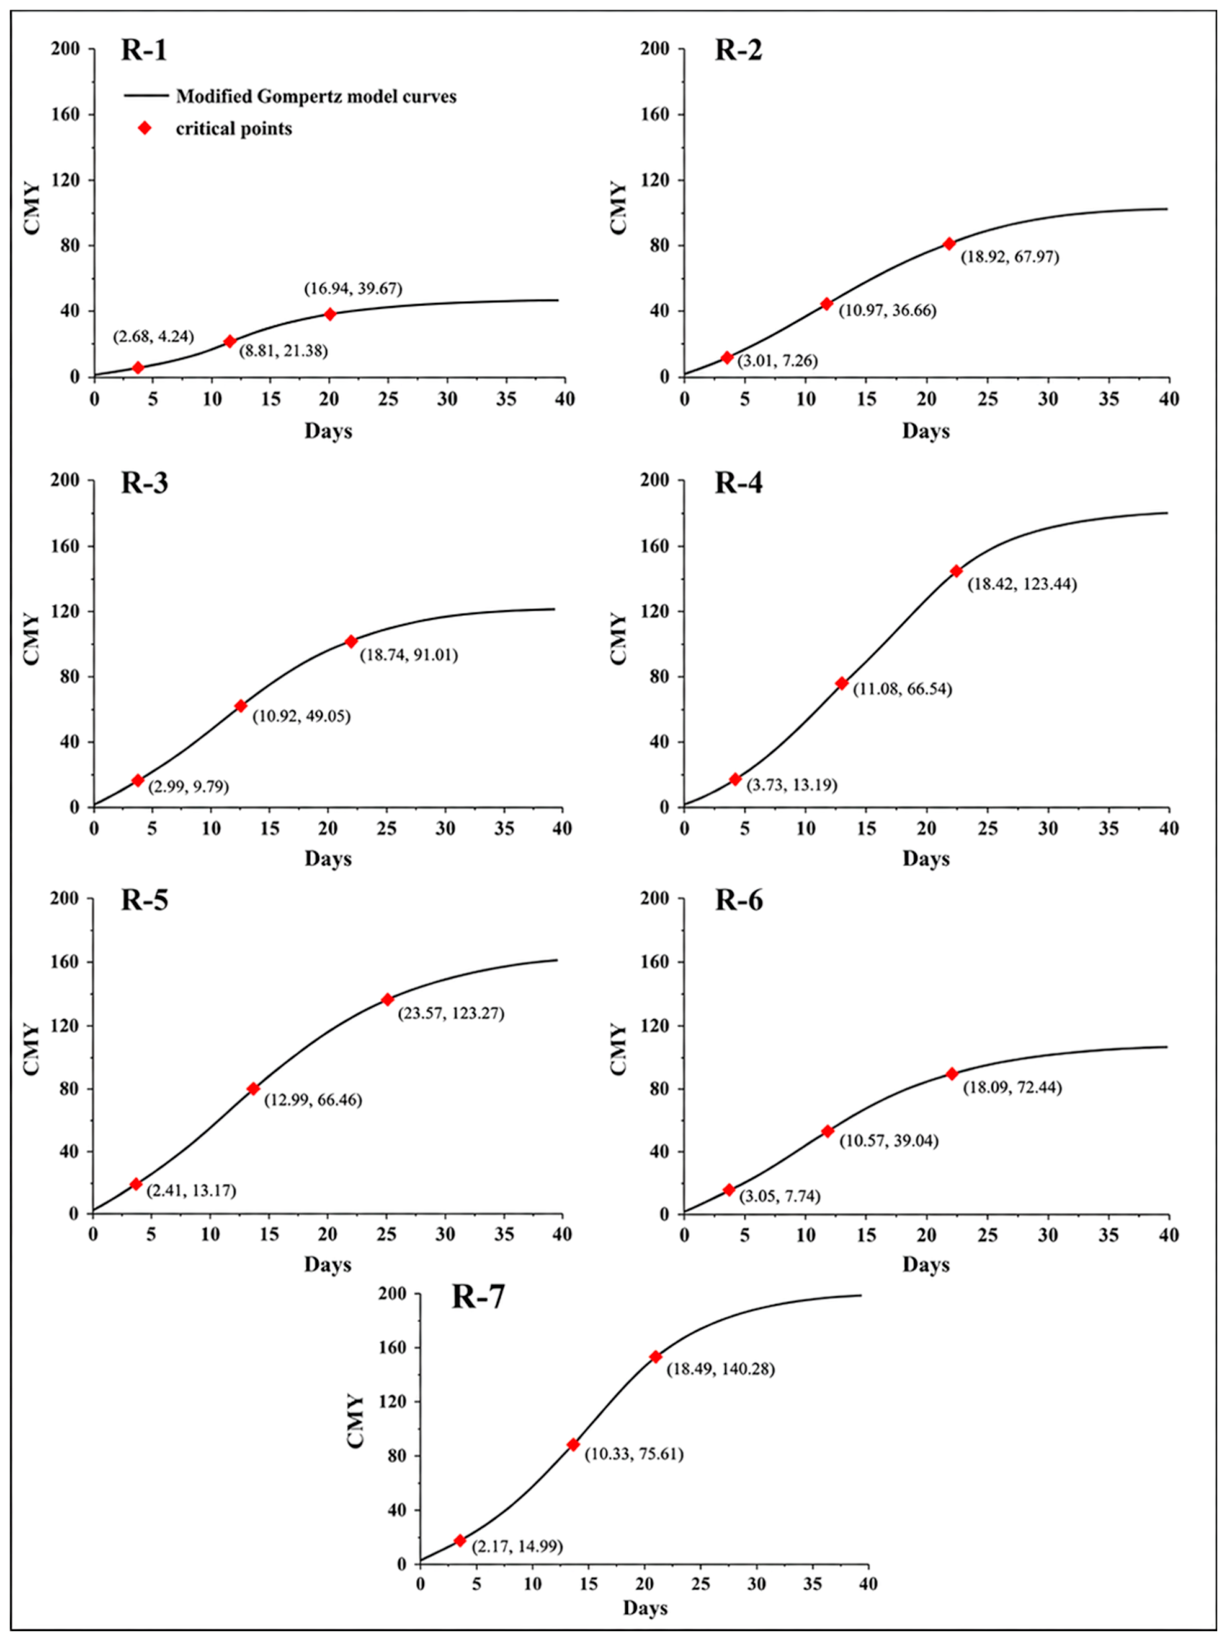
While CMY kinetics are traditionally described by global parameters (A, μₘ, λ) [12,33], such descriptors can overlook the dynamic, phase-resolved structure of digestion. To achieve a higher-resolution analysis, this study integrates these classical parameters with five mathematically derived kinetic landmarks from the MLM: PAA, PAM, PI, PDM, and PDA. This framework adds temporally resolved curve-region descriptors to empirical fitting. The resulting parameters and critical points are presented in Figure 4 and Table 2.
Figure 4.
MLM-derived kinetic landmarks of CMY profiles. R-1 = Control; R-2 = 0.5% H2SO4; R-3 = 1.5% H2SO4; R-4 = 2.5% H2SO4; R-5 = 3.5% H2SO4; R-6 = 100 °C HT; R-7 = 100 °C HT + 2.5% H2SO4. Paired labels indicate landmark coordinates as time and CMY values.
Table 2.
Goodness-of-fit metrics and kinetic parameters of the Modified Logistic Model (MLM) under different pretreatment conditions.
The MLM-derived critical points complement λ, μₘ, and A by identifying acceleration and deceleration regions along the fitted CMY trajectory. As a result, lag-related, acceleration, maximum-rate, deceleration, and asymptotic regions can be consistently compared across experimental conditions without treating them as substrate-independent biological thresholds.
The MLM showed high explanatory performance across all reactors, with R2 values ranging from 0.975 to 0.992 (Table 2; Figure 4). Among the tested conditions, the 2.5% H2SO4 pretreatment yielded the highest coefficient of determination (R2 = 0.992), together with elevated methane potential (A = 173.200 mL g−1 VS) and maximum methane production rate (μₘ = 8.920 mL g−1 VS day−1).
A direct comparison between HT-only and combined HT–acid pretreatment showed that 100 °C HT + 2.5% H2SO4 nearly doubled the fitted methane potential compared with 100 °C HT alone, increasing A from 101.900 to 196.700 mL g−1 VS. The same combined treatment also increased μₘ from 5.030 to 8.880 mL g−1 VS day−1, while shortening λ from 3.320 to 2.380 d, indicating faster and more extensive methane production. In experimental terms, this corresponds to a near-doubling of the cumulative methane yield, from ≈101 mL CH4 g−1 VS for the HT-only treatment to 201.8 mL CH4 g−1 VS for the combined condition (an increase of approximately 100%), accompanied by a ~77% higher μₘ and a ~28% shorter λ. This side-by-side comparison directly isolates the contribution of the dilute-acid catalyst, confirming that acidification of the hydrothermal step—rather than the thermal treatment alone—was responsible for most of the additional methane recovery from this recalcitrant shell.
The MLM-derived critical points are illustrated in Figure 4. PAA provides an early model-derived reference point on the fitted CMY curve. As methane production prior to PAA remained negligible in all reactors, this point provides a model-based indicator of the effective onset of digestion. Early-phase kinetics were therefore examined through the relationship between λ and the early critical points PAA and PAM.
Under control conditions, the PAA time was 1.42 days, whereas it decreased to 0.76 days under the combined pretreatment. This shift coincided with reduced λ, while CMY values at PAA increased from 5.13 to 18.05 mL g−1 VS, reflecting an increase in methane production during the early stage. PAM timing remained relatively consistent (approximately 6–7 days), whereas methane yield at PAM increased by up to threefold, indicating that early-phase intensity changed more than its temporal structure.
TVFA profiles were evaluated alongside CMY-based critical points to examine biochemical consistency. The temporal alignment of PAA with the initial sharp rise in TVFA concentrations is consistent with the onset of hydrolysis and acidogenesis [30]. Similarly, the proximity of PAM to TVFA maxima suggests that methane-production acceleration coincides with periods of elevated TVFA availability. In several reactors, PAM occurred at methane yields exceeding those observed at the TVFA peak, suggesting rapid consumption of accumulated TVFA during the transition toward methanogenesis.
The PI represents the inflection point of the CMY curve and corresponds to the structural center of the mid-phase. Under control conditions, methane production at PI was 27.97 mL g−1 VS, increasing to 98.34 mL g−1 VS under the 100 °C HT + 2.5% H2SO4 condition. These changes followed trends observed in the methane potential parameter A.
Across all reactors, PI time closely followed the relationship: = λ + A/(2μₘ). This relationship indicates that PI timing is governed by both methane potential and production rate rather than μₘ alone. For example, under the 3.5% H2SO4 condition, A remained relatively high, whereas μₘ was comparatively lower, resulting in a delayed PI at 16.4 days. In contrast, under the 100 °C HT + 2.5% H2SO4 condition, lower λ values combined with higher μₘ and A resulted in an earlier and higher PI. Although μₘ represents the maximum instantaneous methane production rate, it does not specify the time or cumulative yield at which this rate is achieved. The PI, defined as the point where the first derivative reaches its maximum, therefore provides complementary temporal information regarding peak system activity.
Equivalent phase durations were calculated by normalizing critical-point yields by μₘ (Table 3). Lower PI/μₘ and PDM/μₘ values were observed particularly under control, 1.5% H2SO4, and 2.5% H2SO4 conditions, indicating more efficient utilization of rate capacity in these reactors. In contrast, the 3.5% H2SO4 condition exhibited prolonged equivalent phase durations. Although this condition initially showed a high SCOD/TCOD ratio (Figure 2C), higher acid severity can promote the formation of inhibitory compounds, which can delay metabolic transitions [16,25].
Table 3.
Equivalent phase durations for the Modified Logistic Model (critical-point yield/μₘ, expressed in days).
PDM represents the maximum deceleration region, while PDA represents the terminal region where methane production approaches completion. Methane production at PDM increased from 44.1 mL g−1 VS in the control to 155.1 mL g−1 VS under combined pretreatment, indicating stronger late-phase activity in high-capacity systems. PDA values closely aligned with the methane potential A across reactors (50.8–178.6 mL g−1 VS), reflecting the vertical constraint imposed by the logistic model. Under the 3.5% H2SO4 condition, delayed PDA occurrence was observed, consistent with suppressed late-phase kinetics under inhibitory conditions.
Across all reactors, the CMY values corresponding to critical points were expressed as consistent fractions of the methane potential A:
- PAA ≈ 0.09 A;
- PAM ≈ 0.21 A;
- PI ≈ 0.50 A;
- PDM ≈ 0.79 A;
- PDA ≈ 0.91 A.
The near-constant ratios primarily reflect the geometry of the fitted logistic function. Therefore, they are interpreted as reproducible curve-geometry landmarks for comparing CMY curves rather than as evidence that the microbial community preserves a fixed underlying ratio.
These ratios show that pretreatment mainly rescaled the fitted logistic curve along the time and yield axes, providing a consistent descriptive basis for comparing treatment responses.
In summary, this derivative-based analysis moves beyond traditional kinetics by adding phase-resolved, model-derived landmarks to conventional parameters. The normalized yield ratios and dimensionless time indices should be used as comparative descriptors for batch AD kinetics, not as standalone proof of universal biological scaling.
3.4.2. Critical Point Analysis of the Modified Gompertz Model
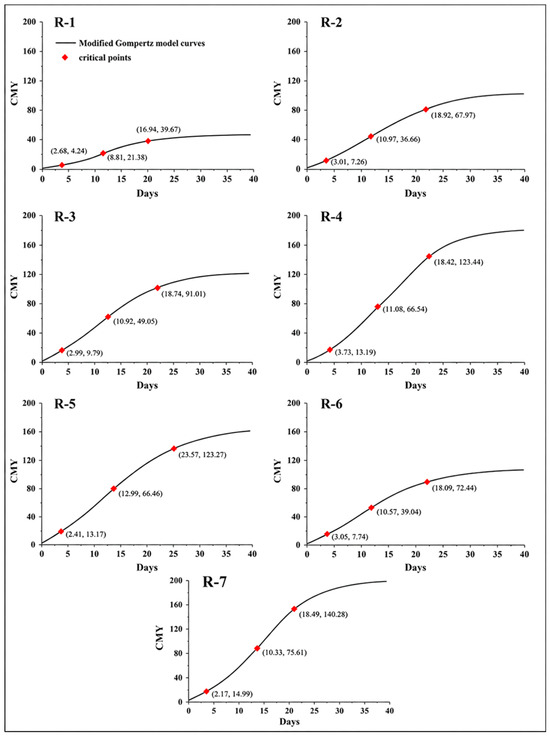
The MGM provided a concise three-phase empirical framework for analyzing AD kinetics. Its mathematical structure yields three derivative-based landmarks—PAM, PI, and PDM—offering a parsimonious view of the fitted production trajectory. The model parameters (A, μₘ, λ) and the coordinates of these derivative-derived points were calculated for all pretreatment conditions (Figure 5). The corresponding goodness-of-fit statistics and parameters are reported in Table 4 [8,9,10,11,12,13,34,35].
Figure 5.
MGM-derived kinetic landmarks of CMY profiles. R-1 = Control; R-2 = 0.5% H2SO4; R-3 = 1.5% H2SO4; R-4 = 2.5% H2SO4; R-5 = 3.5% H2SO4; R-6 = 100 °C HT; R-7 = 100 °C HT + 2.5% H2SO4. Paired labels indicate landmark coordinates as time and CMY values.
Table 4.
Kinetic parameters and goodness-of-fit metrics of the Modified Gompertz Model (MGM) under different pretreatment conditions.
The MGM demonstrated excellent descriptive capability across the entire experimental matrix, with coefficients of determination (R2) exceeding 0.988 (Table 4). This supports its utility as an empirical tool for sigmoidal growth curves in anaerobic systems. However, under the most severe pretreatment conditions (3.5% H2SO4 and the combined 100 °C HT + 2.5% H2SO4), the SSE and RMSE increased markedly. This is consistent with the reduced flexibility of fixed-shape parametric models under high-intensity conditions [12].
The derived kinetic parameters summarize the kinetic effect of pretreatment. The A and μₘ increased substantially with pretreatment severity, from 58.1 to 205.5 mL CH4 g−1 VS and 2.88 to 8.89 mL/g VS·day, respectively. This is consistent with enhanced substrate bioavailability. In contrast, the λ remained within a relatively narrow range (1.86–3.44 days), suggesting that the microbial acclimation period was less affected than the subsequent metabolic activity. The primary effect of pretreatment was therefore to amplify the intensity and rate of digestion rather than to substantially shorten the initial adaptive phase.
Analysis of the MGM landmarks (PAM, PI, and PDM) showed that their vertical magnitudes increased with pretreatment intensity (Figure 5). For instance, the methane yield at the inflection point (PI) increased from 21.4 mL g−1 VS in the control to 75.6 mL g−1 VS under 100 °C HT + 2.5% H2SO4. Because the normalized landmark yields are partly constrained by the mathematical form of the Gompertz function, these ratios reflect the Gompertz functional form rather than evidence of an intrinsic biological constant.
The temporal organization of the process was assessed using μₘ-normalized landmark yields (Table 5). The ratios /μₘ and /μₘ, which express the landmark yield relative to the maximum production rate and therefore carry units of days, remained clustered within defined intervals (7.4–11.0 and 13.8–20.5 days, respectively) despite large variations in absolute μₘ. This consistency suggests that the MGM describes a process where the timing of metabolic transitions is intrinsically linked to the maximum production rate. Notably, the most prolonged normalized durations occurred under the 3.5% H2SO4 condition, aligning with observations from other models and supporting an inhibitory effect that delays kinetic progression.
Table 5.
Normalized phase durations for the Modified Gompertz Model (critical-point yield/μₘ, expressed in days).
In summary, the MGM analysis indicates that acid–HT pretreatment primarily increased the fitted yield (A) and maximum rate (μₘ), while the fixed asymmetric structure of the model constrained the relative positions of its derivative-based landmarks. The model is useful for describing general sigmoidal trends but shows larger residual errors under accelerated, high-capacity regimes.
3.4.3. Comparative Interpretation of Kinetic Landmark Outputs
A comparative assessment of the MLM and MGM shows that both models captured the pretreatment-driven increase in methane-production capacity but differed in the number and position of derivative-based landmarks that can be extracted from the fitted curves. These differences arise primarily from the mathematical structures of the functions and should therefore be interpreted as model-dependent descriptors rather than as direct proof of distinct biological phase boundaries.
A key structural distinction concerns the location of the inflection point. The symmetric logistic function places PI at A/2, whereas the asymmetric Gompertz function places PI at A/e (approximately 36.8% of A) [34,35]. This mathematical difference shifts the apparent timing and yield position of the maximum-rate region. Consequently, the MLM provides a wider set of curvature-defined descriptors for comparing intermediate and late digestion stages, while the MGM remains useful as a compact empirical representation of asymmetric methane-production curves.
The temporal differences between the two models should be interpreted cautiously. The earlier PI and PDM estimates obtained with the MGM reflect its left-skewed shape, whereas the MLM distributes the fitted trajectory more symmetrically. Therefore, agreement between model landmarks and TVFA/pH trends is best viewed as supporting biochemical consistency, not as definitive validation of discrete microbial phase transitions.
The main analytical advantage of the MLM is that its differentiable structure allows five landmarks (PAA, PAM, PI, PDM, and PDA) to be calculated in closed form and related to the classical kinetic parameters. The MGM, in contrast, provides only PAM, PI, and PDM under the same derivative-based framework. This makes the MLM more detailed for within-study comparison, although not necessarily universally superior across all substrates or reactor configurations.
Comparison with pH and TVFA trends suggests that the MLM-derived landmarks are compatible with observed process dynamics; for example, early acceleration coincided with the period of TVFA formation and subsequent consumption, whereas late deceleration corresponded to the approach toward the methane-yield plateau. These associations remain indirect because microbial-community structure, inhibitor concentrations, alkalinity, and replicate-level uncertainty were not fully quantified.
In summary, the MLM offered a more detailed model-based partitioning of the CMY trajectory than the MGM, whereas the MGM provided a simpler empirical description of asymmetric growth-like behavior. The preferred model should therefore depend on the purpose of analysis: detailed landmark comparison favors the MLM, while concise empirical fitting may justify the MGM.
3.5. Practical Implications and Boundaries of Process-Control Interpretation
The critical points derived from the MLM—PAA, PAM, PI, PDM, and PDA—can provide offline diagnostic descriptors for comparing batch AD trajectories. Unlike aggregate parameters such as A, μₘ, and λ, these landmarks divide the fitted curve into curvature-defined regions. However, they should not yet be used as direct operational setpoints without independent validation using online process data, alkalinity measurements, inhibitor quantification, and reactor-scale testing [36,37,38].
From an operational perspective, the PAA-PAM interval may help identify the period when hydrolysis and acidogenesis intensify and TVFA accumulation risk increases. In future online monitoring studies, deviations in the TVFA/alkalinity ratio, pH, or gas-production rate within this interval could be tested as early-warning indicators. Here, this remains a diagnostic interpretation rather than a demonstrated control strategy [36,37,38].
Similarly, PI may indicate the maximum-rate region of the fitted methane-production trajectory. Because PI is derived from the curve geometry, its use for real-time intervention would require validation against direct microbial, chemical, and operational measurements. Thus, the present data support retrospective treatment comparison rather than immediate predictive control.
PDA may help estimate the approach toward the terminal methane-production region in batch assays. Aligning digestion time with PDA could, in principle, help reduce unproductive retention time, but this requires techno-economic analysis and confirmation under larger-scale continuous or semi-continuous operating conditions [37,38].
Overall, the landmark framework converts fitted CMY curves into a structured set of comparative descriptors. Its practical value lies in clarifying treatment-dependent kinetic patterns, while its use for automation, predictive control, or process optimization requires future validation.
3.6. Recommendations, Limitations, and Future Perspectives
This study demonstrates that derivative-based MLM landmarks can complement conventional kinetic parameters when comparing batch AD trajectories. The five calculated landmarks—PAA, PAM, PI, PDM, and PDA—provide a reproducible way to describe the fitted curve, but their biological interpretation must remain model-aware and supported by independent process indicators.
Several limitations should be considered. The positions of the landmarks are intrinsically governed by the mathematical geometry of the selected model. Alternative sigmoidal functions, including Richards, Stannard, Hill, and other flexible models, may shift these coordinates. Future work should therefore compare these functions quantitatively using replicate-level time-series data, AIC/AICc, BIC, RMSE, R2, and parameter confidence intervals [34,35,39]. The derivative-based extraction method is also sensitive to data resolution and signal-to-noise ratio. Confidence intervals or SD bounds for tPAA and tPDA were not calculated here because raw daily replicate CMY series suitable for bootstrap refitting were not available in the present revision. Future studies should combine replicate-based refitting, noise-reduction procedures such as Savitzky–Golay filtering, and independent biochemical validation to improve the robustness of landmark estimation [36,38,40].
Finally, extension of the PAA-PDA framework beyond batch BMP assays should be tested rather than assumed. Continuous-flow reactors, different feedstocks, and non-AD bioprocesses may display different noise structures, transport limitations, and asymmetric behavior. The present results therefore support a comparative batch-kinetic framework, while broader transferability requires further validation.
4. Conclusions
This study integrated dilute-acid–HT pretreatment with sigmoidal kinetic evaluation to improve methane production from PNSs. The combined 100 °C HT + 2.5% H2SO4 pretreatment was the most effective condition, increasing methane production to 201.8 mL CH4 g−1 VS, approximately 3.3-fold higher than that obtained from untreated biomass. This improvement was associated with solubilization of hemicelluloses and lignin disruption, indicating that moderate structural deconstruction can improve the AD performance of this recalcitrant shell residue.
The derivative-based MLM framework provides additional phase-resolved descriptors beyond conventional parameters (A, μₘ and λ). PAA, PAM, PI, PDM and PDA are best interpreted as model-derived kinetic landmarks that enable consistent comparison of fitted CMY trajectories; they should not be over-interpreted as fixed biological boundaries.
The comparison between MLM and MGM showed that the MLM provides additional curvature-defined landmarks, whereas the MGM remains useful for empirical fitting of asymmetric methane-production curves. A future quantitative comparison with flexible four-parameter models such as Richards or Stannard functions would help test whether variable asymmetry improves fit quality. The transferability of the approach to real-time monitoring, predictive control, and continuous reactors remains to be validated.
In conclusion, the main contribution of this work is twofold: (i) experimental demonstration that moderate acid–HT pretreatment can valorize PNSs for methane production and (ii) introduction of a derivative-based, model-aware kinetic landmark framework for comparing batch AD trajectories. From a practical standpoint, the low-temperature (≤100 °C) acid–HT route demonstrated here offers an energy-efficient and reagent-economical pathway for valorizing lignin-rich nut-shell residues, while the derivative-based landmark framework provides a transferable, model-aware tool for comparing and diagnosing batch AD kinetics across feedstocks and pretreatment intensities. The principal limitations are the absence of direct HPLC/GC-MS inhibitor quantification, missing dynamic alkalinity/TVFA-buffering data, and the need for flexible-model and uncertainty analyses using raw replicate CMY time series.
Funding
This research received no external funding.
Institutional Review Board Statement
Not applicable.
Informed Consent Statement
Not applicable, as this study did not involve humans, patients, or identifiable personal data.
Data Availability Statement
The data supporting the findings of this study are included in the article. Additional details can be made available from the corresponding author upon reasonable request.
Acknowledgments
The author gratefully acknowledges the assistance of Mustafa Kemal Özdemir from Giresun University.
Conflicts of Interest
The author declares no conflicts of interest.
Abbreviations
The following abbreviations are used in this manuscript:
| AD | Anaerobic digestion |
| ANOVA | One-way analysis of variance |
| BMP | Biochemical methane potential |
| CMY | Cumulative methane yield |
| DMY | Daily methane yield |
| FID | Flame ionization detector |
| GC | Gas chromatograph |
| H2SO4 | Sulfuric acid |
| HT | Hydrothermal pretreatment |
| MGM | Modified Gompertz model |
| MLM | Modified logistic model |
| N2 | Nitrogen gas |
| PAA | Point of asymptotic acceleration |
| PAM | Point of maximum acceleration |
| PDA | Point of asymptotic deceleration |
| PDM | Point of maximum deceleration |
| PI | Inflection point |
| PNSs | Pine nut shells |
| R2 | Coefficient of determination |
| RMSE | Root mean squared error |
| SCOD | Soluble chemical oxygen demand |
| SEM | Scanning electron microscopy |
| SSE | Sum of squared errors |
| TCOD | Total chemical oxygen demand |
| TS | Total solids |
| TVFA | Total volatile fatty acids |
| VS | Volatile solids |
References
- Kamperidou, V.; Terzopoulou, P. Anaerobic digestion of lignocellulosic waste materials. Sustainability 2021, 13, 12810. [Google Scholar] [CrossRef] [Scilit]
- Mankar, A.R.; Pandey, A.; Modak, A.; Pant, K. Pretreatment of lignocellulosic biomass: A review on recent advances. Bioresour. Technol. 2021, 334, 125235. [Google Scholar] [CrossRef] [Scilit] [PubMed]
- Zhang, B.; Biswal, B.K.; Zhang, J.; Balasubramanian, R. Hydrothermal treatment of biomass feedstocks for sustainable production of chemicals, fuels, and materials: Progress and perspectives. Chem. Rev. 2023, 123, 7193–7294. [Google Scholar] [CrossRef] [Scilit] [PubMed]
- Wang, M.; Wang, J.; Li, Y.; Li, Q.; Li, P.; Luo, L.; Zhen, F.; Zheng, G.; Sun, Y. Low-temperature pretreatment of biomass for enhancing biogas production: A review. Fermentation 2022, 8, 562. [Google Scholar] [CrossRef] [Scilit]
- Şen, A.U.; Correia, R.; Longo, A.; Nobre, C.; Alves, O.; Santos, M.; Gonçalves, M.; Miranda, I.; Pereira, H. Chemical composition, morphology, antioxidant, and fuel properties of pine nut shells within a biorefinery perspective. Biomass Convers. Biorefinery 2024, 14, 14505–14517. [Google Scholar] [CrossRef] [Scilit]
- Shen, J.; Yan, H.; Zhang, R.; Liu, G.; Chen, C. Characterization and methane production of different nut residue wastes in anaerobic digestion. Renew. Energy 2018, 116, 835–841. [Google Scholar] [CrossRef] [Scilit]
- Demirbaş, A. Relationships between heating value and lignin, fixed carbon, and volatile material contents of shells from biomass products. Energy Sources 2003, 25, 629–635. [Google Scholar] [CrossRef]
- Emebu, S.; Pecha, J.; Janáčová, D. Review on anaerobic digestion models: Model classification and elaboration of process phenomena. Renew. Sustain. Energy Rev. 2022, 160, 112288. [Google Scholar] [CrossRef] [Scilit]
- Appels, L.; Baeyens, J.; Degrève, J.; Dewil, R. Principles and potential of the anaerobic digestion of waste-activated sludge. Prog. Energy Combust. Sci. 2008, 34, 755–781. [Google Scholar] [CrossRef] [Scilit]
- Kunatsa, T.; Xia, X. A review on anaerobic digestion with focus on the role of biomass co-digestion, modeling and optimisation on biogas production and enhancement. Bioresour. Technol. 2022, 344, 126311. [Google Scholar] [CrossRef] [Scilit] [PubMed]
- Cruz, I.A.; Chuenchart, W.; Long, F.; Surendra, K.; Andrade, L.R.S.; Bilal, M.; Liu, H.; Figueiredo, R.T.; Khanal, S.K.; Ferreira, L.F.R. Application of machine learning in anaerobic digestion: Perspectives and challenges. Bioresour. Technol. 2022, 345, 126433. [Google Scholar] [CrossRef] [Scilit] [PubMed]
- Şenol, H. Anaerobic digestion of hazelnut (Corylus colurna) husks after alkaline pretreatment and determination of new important points in Logistic model curves. Bioresour. Technol. 2020, 300, 122660. [Google Scholar] [CrossRef] [Scilit] [PubMed]
- Passos, J.R.S.; Pinho, S.Z.; Carvalho, L.R.; Mischan, M.M. Critical points in logistic growth curves and treatment comparisons. Sci. Agric. 2012, 69, 308–312. [Google Scholar] [CrossRef] [Scilit]
- Ghimire, N.; Bakke, R.; Bergland, W.H. Liquefaction of lignocellulosic biomass for methane production: A review. Bioresour. Technol. 2021, 332, 125068. [Google Scholar] [CrossRef] [Scilit] [PubMed]
- Rajput, A.A.; Hassan, M. Enhancing biogas production through co-digestion and thermal pretreatment of wheat straw and sunflower meal. Renew. Energy 2021, 168, 1–10. [Google Scholar] [CrossRef] [Scilit]
- Rintala, K.; Kinnunen, V.; Berg, A.; Rintala, J.; Kokko, M. Biogas production from piloted wood-based bioethanol process using high-rate anaerobic treatment: Focusing for inhibition and improving biodegradability. Renew. Energy 2024, 237, 121594. [Google Scholar] [CrossRef] [Scilit]
- Oliva, A.; Papirio, S.; Esposito, G.; Lens, P.N. Impact of chemical and physical pretreatment on methane potential of peanut shells. Energies 2023, 16, 4698. [Google Scholar] [CrossRef] [Scilit]
- Liu, B.; Liu, L.; Deng, B.; Huang, C.; Zhu, J.; Liang, L.; He, X.; Wei, Y.; Qin, C.; Liang, C. Application and prospect of organic acid pretreatment in lignocellulosic biomass separation: A review. Int. J. Biol. Macromol. 2022, 222, 1400–1413. [Google Scholar] [CrossRef] [Scilit] [PubMed]
- Ranjan, A.; Welz, P.; Mthethwa, T. Investigation of an effective acid pre-treatment method for the valorisation of canola fines. Biomass Convers. Biorefinery 2024, 14, 12013–12026. [Google Scholar] [CrossRef] [Scilit]
- Holliger, C.; Alves, M.; Andrade, D.; Angelidaki, I.; Astals, S.; Baier, U.; Bougrier, C.; Buffière, P.; Carballa, M.; De Wilde, V.; et al. Towards a standardization of biomethane potential tests. Water Sci. Technol. 2016, 74, 2515–2522. [Google Scholar] [CrossRef] [Scilit] [PubMed]
- Moset, V.; Al-zohairi, N.; Møller, H.B. The impact of inoculum source, inoculum to substrate ratio and sample preservation on methane potential from different substrates. Biomass Bioenergy 2015, 83, 474–482. [Google Scholar] [CrossRef] [Scilit]
- APHA. Standard Methods for the Examination of Water and Wastewater; American Public Health Association: Washington, DC, USA, 1985. [Google Scholar]
- Van Soest, P.J.; Robertson, J.B.; Lewis, B.A. Methods for dietary fiber, neutral detergent fiber, and nonstarch polysaccharides in relation to animal nutrition. J. Dairy Sci. 1991, 74, 3583–3597. [Google Scholar] [CrossRef] [Scilit] [PubMed]
- Bianco, F.; Şenol, H.; Papirio, S.; Zenk, H.; Kara, A.; Atasoy, S. Combined ultrasonic-hydrothermal pretreatment to improve the biomethane potential of hazelnut shell. Biomass Bioenergy 2022, 165, 106554. [Google Scholar] [CrossRef] [Scilit]
- Bianco, F.; Şenol, H.; Papirio, S. Enhanced lignocellulosic component removal and biomethane potential from chestnut shell by a combined hydrothermal-alkaline pretreatment. Sci. Total Environ. 2021, 762, 144178. [Google Scholar] [CrossRef] [Scilit] [PubMed]
- Kaur, N.; Singh, G.; Khatri, M.; Arya, S.K. Review on neoteric biorefinery systems from detritus lignocellulosic biomass: A profitable approach. J. Clean. Prod. 2020, 256, 120607. [Google Scholar] [CrossRef] [Scilit]
- Santo, M.E.; Rezende, C.A.; Bernardinelli, O.D.; Pereira, N., Jr.; Curvelo, A.A.; de Azevedo, E.R.; Guimarães, F.E.; Polikarpov, I. Structural and compositional changes in sugarcane bagasse subjected to hydrothermal and organosolv pretreatments and their impacts on enzymatic hydrolysis. Ind. Crops Prod. 2018, 113, 64–74. [Google Scholar] [CrossRef] [Scilit]
- Menzel, T.; Neubauer, P.; Junne, S. Role of microbial hydrolysis in anaerobic digestion. Energies 2020, 13, 5555. [Google Scholar] [CrossRef] [Scilit]
- Ahmed, B.; Aboudi, K.; Tyagi, V.K.; Álvarez-Gallego, C.J.; Fernández-Güelfo, L.A.; Romero-García, L.I.; Kazmi, A. Improvement of anaerobic digestion of lignocellulosic biomass by hydrothermal pretreatment. Appl. Sci. 2019, 9, 3853. [Google Scholar] [CrossRef] [Scilit]
- Şenol, H. Alkaline-thermal and mild ultrasonic pretreatments for improving biomethane yields: Impact on structural properties of chestnut shells. Fuel 2023, 354, 129373. [Google Scholar] [CrossRef] [Scilit]
- Şenol, H. Improvement of methane yield from hazelnut shells by potassium ferrate and mild ultrasonic pretreatment: Kinetics study. Fuel 2026, 403, 135989. [Google Scholar] [CrossRef] [Scilit]
- Mancini, G.; Papirio, S.; Lens, P.N.; Esposito, G. Anaerobic digestion of lignocellulosic materials using ethanol-organosolv pretreatment. Environ. Eng. Sci. 2018, 35, 953–960. [Google Scholar] [CrossRef] [Scilit]
- Kim, D.; Kim, J. Predicting biogas production from organic waste through anaerobic co-digestion. J. Clean. Prod. 2025, 496, 145122. [Google Scholar] [CrossRef] [Scilit]
- Tsoularis, A.; Wallace, J. Analysis of logistic growth models. Math. Biosci. 2002, 179, 21–55. [Google Scholar] [CrossRef] [Scilit] [PubMed]
- Tjørve, K.M.; Tjørve, E. The use of Gompertz models in growth analyses, and new Gompertz-model approach: An addition to the Unified-Richards family. PLoS ONE 2017, 12, e0178691. [Google Scholar] [CrossRef] [Scilit] [PubMed]
- Batstone, D.J.; Keller, J.; Angelidaki, I.; Kalyuzhnyi, S.V.; Pavlostathis, S.G.; Rozzi, A.; Sanders, W.T.M.; Siegrist, H.; Vavilin, V.A. The IWA Anaerobic Digestion Model No 1 (ADM1). Water Sci. Technol. 2002, 45, 65–73. [Google Scholar] [CrossRef] [Scilit]
- Ward, A.J.; Hobbs, P.J.; Holliman, P.J.; Jones, D.L. Optimisation of the anaerobic digestion of agricultural resources. Bioresour. Technol. 2008, 99, 7928–7940. [Google Scholar] [CrossRef] [Scilit] [PubMed]
- Jimenez, J.; Latrille, E.; Harmand, J.; Robles, A.; Ferrer, J.; Gaida, D.; Wolf, C.; Mairet, F.; Bernard, O.; Alcaraz-Gonzalez, V.; et al. Instrumentation and control of anaerobic digestion processes: A review and some research challenges. Rev. Environ. Sci. Bio/Technology 2015, 14, 615–648. [Google Scholar] [CrossRef] [Scilit]
- Richards, F.J. A flexible growth function for empirical use. J. Exp. Bot. 1959, 10, 290–301. [Google Scholar] [CrossRef] [Scilit]
- Savitzky, A.; Golay, M.J.E. Smoothing and differentiation of data by simplified least squares procedures. Anal. Chem. 1964, 36, 1627–1639. [Google Scholar] [CrossRef] [Scilit]

Disclaimer/Publisher’s Note: The statements, opinions and data contained in all publications are solely those of the individual author(s) and contributor(s) and not of MDPI and/or the editor(s). MDPI and/or the editor(s) disclaim responsibility for any injury to people or property resulting from any ideas, methods, instructions or products referred to in the content. |
© 2026 by the author. Licensee MDPI, Basel, Switzerland. This article is an open access article distributed under the terms and conditions of the Creative Commons Attribution (CC BY) license.