


Abstract
This study presents a low-cost Internet of Things (IoT)-based antenna-measurement system that integrates automated dual-axis positioning, mobile data visualization, antenna-related calculations, and data export within a unified platform. The system employs a NodeMCU ESP8266, Arduino Uno R3, servo-driven θ- and ϕ-axis positioning mechanism, NETPIE IoT communication, and a mobile application, while a FieldFox vector network analyzer is used for RF measurements. Positioning performance was evaluated at angular steps of 4°, 5°, 6°, and 10° under unloaded and antenna-loaded conditions. Across all 16 test conditions, the maximum positioning error did not exceed 0.3°, remaining below the predefined ±1° requirement. The far-field distance and antenna-gain calculation functions were also validated against independently calculated theoretical reference values, with gain differences arising only from two-decimal-place display rounding. Radiation-pattern measurements at 2.4 GHz using dipole and Yagi–Uda antennas demonstrated the expected approximately omnidirectional H-plane response of the dipole and the more directional response of the Yagi–Uda antenna. Comparison with CST simulations and ME1300 reference measurements showed agreement in the principal radiation characteristics, including main-lobe direction and overall pattern behavior. The developed system provides an accessible platform for antenna radiation-pattern measurement, with future development focused on automated RF data acquisition.
1. Introduction
The widespread adoption of wireless communication technologies and the rapid growth of Internet of Things (IoT) applications have increased the demand for reliable antenna systems. Antennas are key components in wireless networks because their performance directly affects communication range, signal quality, coverage, and link reliability. As IoT technologies continue to be deployed in applications such as smart cities, industrial automation, environmental monitoring, and intelligent transportation systems, accurate evaluation of antenna characteristics becomes increasingly important [1]. Among the various antenna parameters, radiation pattern and gain are widely used to assess antenna performance and characterize its suitability for a given wireless communication application [2].
Antenna characterization is commonly performed using specialized measurement facilities, including vector network analyzers (VNAs), anechoic chambers, and precision positioning systems. These facilities provide highly accurate and repeatable measurements; however, they often require expensive equipment, dedicated laboratory environments, and complex experimental setups [3]. These requirements can limit accessibility, particularly in educational institutions and small research laboratories, and current antenna-measurement research continues to emphasize reductions in measurement cost and acquisition time [4]. In conventional laboratory measurements, antenna orientation and measurement recording may also require repeated manual intervention at successive observation angles. This can increase measurement time and introduce variability associated with positioning and data handling [5].
To reduce these limitations, a number of low-cost and automated antenna-measurement systems have been proposed in recent years [6,7]. For example, microcontroller-based antenna rotators have been developed to automate antenna positioning and improve measurement repeatability [8]. Other studies have incorporated software-defined radio (SDR) platforms and embedded systems to lower implementation costs while maintaining acceptable measurement performance [9]. Recent low-cost platforms have also combined Arduino- or Raspberry Pi-based motor control with automated angular scanning and software-assisted radiation-pattern acquisition [10,11]. More recent work has also explored robotic antenna-measurement systems that combine flexible positioning with optimized sampling strategies to improve measurement efficiency [12]. Collectively, these studies demonstrate the feasibility of reducing manual intervention through lower-cost hardware and automated positioning. However, many reported implementations place greater emphasis on the measurement hardware and positioning mechanism than on integrating positioning control, measurement-data handling, visualization, and antenna-related calculations within a single user interface.
Mobile computing and IoT connectivity provide opportunities to extend measurement platforms beyond hardware automation alone. Smartphone-based instrumentation has been used to support wireless control and measurement interaction in low-cost embedded systems [13], while other studies have integrated mobile interfaces with data visualization and remote measurement management [14]. In addition, IoT-enabled laboratory platforms have demonstrated remote access to experimental hardware and measurement functions through network-connected interfaces [15]. More recent IoT-based measurement systems have integrated embedded controllers, Android-based interfaces, wireless communication, cloud connectivity, data processing, and visualization within a unified measurement-and-control architecture [16]. Smartphone-based laboratory test beds have also demonstrated the use of mobile devices for sensing, control, and data handling within an integrated experimental workflow [17]. However, these approaches have mainly been demonstrated in general instrumentation and remote laboratory systems, whereas the integration of IoT-based dual-axis positioning with mobile-assisted antenna radiation-pattern measurement remains comparatively limited.
Motivated by this need, this paper presents a low-cost IoT-based antenna-measurement system with automated dual-axis positioning and mobile data visualization. The proposed system integrates a microcontroller-based control unit, wireless communication, a dual-axis antenna positioning mechanism, and a mobile application to support radiation-pattern measurements through a structured workflow. The receiving-antenna platform enables automated angular positioning along two rotational axes, reducing the need for manual antenna adjustment. The RF measurement process remains independent of the IoT control path, and the RF transmission response measured by the VNA is manually entered into the mobile application at each observation angle. The application provides an integrated interface for positioning control, measurement-data entry, radiation-pattern visualization, far-field distance estimation, antenna-gain calculation, and data export. Rather than replacing conventional antenna-measurement instruments, the proposed system is intended to complement existing laboratory facilities by integrating positioning control and measurement-support functions around a VNA-based measurement procedure. The contributions of this work are threefold: (i) a low-cost IoT-based antenna-measurement system with automated dual-axis positioning is developed to reduce manual positioning effort and provide repeatable antenna orientation during radiation-pattern measurements; (ii) a mobile application is implemented to integrate positioning control, measurement-data management, radiation-pattern visualization, far-field and antenna-gain calculations, and data export within a unified interface; and (iii) the proposed system is experimentally evaluated in terms of dual-axis positioning performance, calculation-function validation, and radiation-pattern measurement capability using 2.4 GHz dipole and Yagi–Uda antennas, with additional quantitative validation against CST-simulated patterns and measurements obtained using the ME1300 reference measurement system. Experimental results indicate that the developed system provides consistent dual-axis positioning under the adopted external-reference procedure and practical radiation-pattern measurement capability while supporting convenient visualization and export of measurement results for laboratory-scale antenna characterization. The comparative validation further enables quantitative assessment of key radiation-pattern characteristics and strengthens the evaluation of the proposed low-cost measurement architecture.
2. System Architecture and Design
2.1. Overall System Architecture
The proposed system was designed as a low-cost IoT-based platform for antenna radiation-pattern measurement with automated dual-axis positioning and mobile data visualization. As shown in Figure 1, the system consists of five principal components: (i) a mobile application, (ii) the NETPIE 2020 IoT cloud platform (National Electronics and Computer Technology Center (NECTEC), Pathum Thani, Thailand), (iii) a NodeMCU ESP8266 wireless communication module, (iv) an Arduino Uno R3 motor controller (Arduino S.r.l., Monza, Italy), and (v) a dual-axis antenna positioning mechanism integrated with the antenna-measurement setup. Together, these components support remote antenna positioning, measurement-data entry and management, radiation-pattern visualization, far-field distance estimation, antenna-gain calculation, and data export through a unified mobile interface.
Figure 1.
Overall architecture and operational workflow of the proposed low-cost IoT-based antenna-measurement system with automated dual-axis positioning and mobile data visualization.
The mobile application serves as the primary user interface for setting the measurement parameters and controlling the antenna positioner. Positioning commands generated by the user are transmitted via Wi-Fi to the NETPIE IoT cloud platform and then forwarded to the NodeMCU ESP8266. The NodeMCU acts as the wireless gateway between the cloud platform and the local motor controller. After receiving a positioning command, it forwards the command to the Arduino Uno R3 through UART serial communication. The Arduino Uno interprets the received command and generates the corresponding control signals for the two servo motors. The positioning structure employs an RDS3115 servo motor for the θ-axis, providing an angular range from 0° to 180°, and an SG5010 servo motor for the ϕ-axis, providing an angular range from 0° to 360°. The two axes can be controlled independently, allowing the receiving antenna to be oriented systematically during the measurement procedure.
The antenna-measurement setup consists of a transmitting antenna, a receiving antenna mounted on the automated positioner, and a vector network analyzer (VNA) used to measure the transmission response, S21, at each observation angle. During operation, the user first specifies the required measurement parameters through the mobile application. The receiving antenna is then moved to the commanded angular position through the IoT-based control path. After the receiving antenna reaches the specified position, the measured S21 data is read from the VNA and manually entered into the mobile application. The application associates the measured value with the corresponding angular position, stores the data, and updates the polar radiation-pattern display as the angular sweep proceeds. The selected angular step determines the sequence of observation angles, while the numerical measurement data and the resulting radiation-pattern plot can subsequently be exported for further analysis and documentation. Overall, the architecture separates the mobile user interface, IoT-based positioning control, and RF measurement functions while integrating them within a unified measurement workflow. A detailed description of the VNA calibration procedure, RF reference planes, and the relationship between S21, transmitted power, and received power is provided in Section 4.1.
2.2. Dual-Axis Antenna Positioning Mechanism
The antenna positioning subsystem was designed to provide controlled and repeatable angular positioning of the receiving antenna during radiation-pattern measurements. As shown in Figure 2, the subsystem comprises the transmitting-antenna stand, the receiving-antenna stand equipped with the dual-axis positioning mechanism, the associated control circuit, and the fabricated control unit. The transmitting-antenna stand, shown in Figure 2a, provides an adjustable antenna height of approximately 40–70 cm and incorporates an SMA connector and coaxial cable for connection to the vector network analyzer (VNA). The receiving-antenna stand, shown in Figure 2b, has an overall height of approximately 65 cm and incorporates two servo motors mounted in orthogonal rotational axes to provide independent control of the θ- and ϕ-axis orientations. The corresponding spherical-coordinate convention defines θ from 0° to 180° and ϕ from 0° to 360°.
Figure 2.
Hardware implementation of the antenna positioning subsystem: (a) transmitting-antenna stand, (b) receiving-antenna stand with the dual-axis positioning mechanism, enlarged antenna-mounting detail, and spherical-coordinate convention defining the θ- and ϕ-axis rotations, (c) control circuit of the dual-axis positioning system, and (d) fabricated control unit.
The θ-axis is driven by an RDS3115 servo motor (Dongguan City Dsservo Technology Co., Ltd., Dongguan, Guangdong, China) with an angular range of 0–180°, whereas the ϕ-axis is driven by an SG5010 servo motor (TowerPro, China) capable of 0–360° rotation. The two servo motors are mechanically coupled at the upper section of the receiving-antenna stand, enabling independent adjustment of antenna orientation about the two rotational axes. The enlarged view in Figure 2b illustrates the antenna-mounting arrangement and the mechanical integration of the two-axis positioner. The enlarged mounting detail and the corresponding spherical-coordinate diagram clarify the relationship between the physical antenna orientation and the commanded θ and ϕ rotations. This configuration allows the receiving antenna to be positioned at prescribed angular coordinates throughout the measurement sequence, thereby reducing the need for direct manual adjustment during radiation-pattern acquisition.
The electrical control architecture of the positioning mechanism is illustrated in Figure 2c. The system is controlled by an Arduino Uno R3, which generates the control signals required to drive the two servo motors. A NodeMCU ESP8266 provides the wireless communication interface and forwards the received positioning commands to the Arduino Uno through serial communication. Two DC–DC step-down regulators are used to provide separate supply voltages for the control electronics and the servo-motor subsystem. The 5 V regulator supplies the Arduino Uno R3, NodeMCU ESP8266, and photoelectric encoder, whereas the 7 V regulator supplies the two servo motors. A photoelectric slot-type rotational encoder with a 1024-count-per-revolution (CPR) codewheel is incorporated into the positioning mechanism to provide external rotational feedback. The encoder signals are processed by the Arduino Uno R3 using 2× quadrature decoding, providing 2048 effective counts per revolution and an angular increment of approximately 0.176° per count. (360°/2048 = 0.176°). Accordingly, a 180° rotation corresponds to approximately 1024 effective counts, whereas a complete 360° rotation corresponds to 2048 counts. The angular displacement can therefore be determined from the accumulated encoder count relative to a complete revolution. The encoder is used as part of the angular-position monitoring subsystem and is not used as the external angular reference for calculating the positioning-error metrics reported in this study. Therefore, the encoder increment represents the detectable angular increment of the monitoring subsystem rather than the absolute positioning accuracy of the servo mechanism. The fabricated control unit, shown in Figure 2d, integrates the NodeMCU ESP8266, the Arduino Uno R3, the 5 V and 7 V DC–DC step-down regulators, and associated wiring within a compact enclosure.
During operation, the target θ- and ϕ-axis positions specified through the mobile application are translated into independent motor-control commands for the corresponding servo axes. The Arduino Uno drives the selected servo motor to the commanded position, while the mechanical arrangement maintains independent control of the two rotational directions. The photoelectric encoder provides external rotational feedback for angular-position monitoring during operation, whereas the positioning-error evaluation described in Section 4.3 employs an independent external angular reference. Repeating this process at predefined angular increments enables systematic sampling of the antenna response across the required observation range. This coordinated electromechanical configuration provides the angular positioning required for subsequent radiation-pattern measurements while minimizing manual repositioning of the receiving antenna.
2.3. Embedded Control and IoT Communication
The embedded control subsystem was designed to coordinate wireless communication and local motor actuation for the dual-axis antenna positioner. As illustrated in Figure 2c, the control architecture integrates a NodeMCU ESP8266, an Arduino Uno R3, two DC–DC step-down regulators, and the servo-motor interfaces. The fabricated control unit is shown in Figure 2d. The NodeMCU ESP8266 provides Wi-Fi connectivity and serves as the communication interface between the NETPIE IoT platform and the local Arduino-based motor controller. Positioning commands generated through the mobile application are transmitted to the NETPIE platform and received by the NodeMCU ESP8266. The NodeMCU then forwards the command to the Arduino Uno R3 through UART serial communication. This division of functions allows the NodeMCU to handle network communication, while the Arduino Uno R3 performs the local motor-control operations required to position the receiving antenna.
The Arduino Uno R3 processes the received angular-position commands and generates the corresponding control signals for the dual-axis positioning mechanism. Separate control channels are assigned to the θ- and ϕ-axis servo motors, enabling independent angular adjustment of the receiving antenna. The motor-control program distinguishes the two rotational axes using separate command identifiers, allowing each servo motor to be addressed independently. The commanded angular position is converted into the corresponding servo-control pulse, and the motor is driven progressively toward the target position. The DC–DC step-down regulators supply the voltage levels required by the control electronics and servo-motor subsystem. The photoelectric rotary encoder is used for supplementary angular-position monitoring and operates with 2× quadrature decoding, as described in Section 2.2. The NodeMCU firmware also manages the Wi-Fi and NETPIE connections and maintains communication with the cloud platform during system operation. When a valid positioning command is received, it is relayed to the Arduino controller through the local serial link. If the NETPIE connection is interrupted, the communication routine attempts to re-establish the connection, thereby supporting continued remote operation of the positioning subsystem.
The embedded control architecture was designed so that the IoT communication function remains independent of RF signal acquisition. In the proposed implementation, the IoT link is used specifically for positioning control, whereas the VNA operates separately as the RF measurement instrument. Accordingly, the RF transmission response measured by the VNA is not transferred automatically through the IoT communication link; instead, the measured S21 data is read from the VNA and entered manually into the mobile application. This separation simplifies the hardware interface and enables remote positioning control without requiring direct digital communication between the VNA and the embedded controller.
2.4. Mobile Application and Data Visualization
The mobile application was developed as the primary user interface for operating the proposed antenna-measurement system and guiding the user through the main measurement functions. The application interface was initially designed and prototyped using Adobe XD, following a UI/UX-oriented prototyping approach commonly employed in mobile application development [18,19], while the functional application was subsequently implemented in Python. As shown in Figure 3, the application integrates measurement initialization, far-field distance calculation, dual-axis antenna positioning, S21 data entry, radiation-pattern visualization, angular-step configuration, antenna-gain calculation, and application information within a single mobile interface. The main application screen shown in Figure 3a provides access to the measurement procedure through the START function, while the ABOUT function provides general information about the application and its principal capabilities.
Figure 3.
Main interfaces of the developed mobile application: (a) main application interface, (b) far-field distance calculation, (c) dual-axis positioning, S21 data entry, and radiation-pattern visualization, (d) angular-step setting, (e) antenna-gain calculation option, (f) gain calculation with unknown Tx antenna gain, (g) gain calculation with known Tx antenna gain, and (h) application information interface.
Before performing a radiation-pattern measurement, the required separation between the transmitting and receiving antennas can be determined using the far-field calculation interface shown in Figure 3b. The user enters the maximum dimension of the antenna and the operating frequency, with selectable units for both parameters. The application then calculates the minimum far-field distance based on the entered values. The calculated result is displayed automatically in an appropriate unit according to its magnitude, thereby assisting the user in establishing a suitable antenna separation before proceeding with the measurement procedure. The primary measurement and control interface is shown in Figure 3c. This interface displays the operating frequency and angular step and provides input fields for the θ-axis angle, ϕ-axis angle, and measured S21 data. The θ- and ϕ-axis controls are used to command the dual-axis positioning mechanism through the IoT communication architecture described in Section 2.3. At each observation angle, the S21 data measured by the VNA is read by the user and entered manually into the application, where it is associated with the corresponding angular position. The entered values are stored sequentially and normalized relative to the maximum measured response for polar-plot visualization. The radiation pattern is then updated within the same interface, allowing the user to inspect the directional response of the antenna as the angular sweep progresses. A pink reference line at −3 dB is included in the polar-plot display to indicate the half-power level, facilitating identification of the half-power points and estimation of the half-power beamwidth (HPBW). The angular increment used during the measurement can be configured through the setting interface shown in Figure 3d. The user specifies the desired angular step according to the required angular sampling interval, after which the selected value is applied to the positioning sequence. The angular step determines both the spacing between successive observation angles and the number of measurement points over the complete sweep. This provides flexibility in defining the angular sampling interval used for radiation-pattern acquisition.
In addition to positioning and radiation-pattern visualization, the application provides an antenna-gain calculation function. As shown in Figure 3e, the application first determines whether the gain of the transmitting antenna is known. When the transmitting-antenna gain is not specified, the calculation interface shown in Figure 3f supports the identical-antenna calculation mode, in which the antenna separation is entered as the principal geometric input. When the transmitting-antenna gain is known, the interface shown in Figure 3g additionally accepts the Tx antenna gain together with the antenna separation distance. The operating frequency and maximum S21 data are transferred from the preceding measurement interface and used in the gain calculation. The calculated gain is then displayed directly through the mobile interface. These two calculation modes allow the application to support both identical-antenna and known-transmitting-gain calculation conditions.
The application also provides functions for managing the acquired measurement data. When the export function is selected, the measured angular-position and S21 data are saved in CSV format, while the displayed polar radiation pattern is saved as a PNG image. The exported CSV file preserves the relationship between angle and measured S21 for subsequent numerical analysis, whereas the PNG output provides a direct graphical record of the measured pattern including the −3 dB reference line used for beamwidth assessment. Figure 3h presents the ABOUT interface, which summarizes the major functions of the developed application and identifies the development affiliation. Overall, the mobile application combines positioning control, measurement-data entry, far-field and gain calculations, radiation-pattern visualization, configurable angular sampling, and data export within a single measurement environment. This integrated workflow consolidates the principal measurement-support functions within a consistent mobile interface for system operation and measurement-data handling.
3. Antenna-Measurement Methodology
This section describes the measurement methodology implemented in the proposed antenna-measurement system. The methodology covers the principal procedures required for antenna characterization, including radiation-pattern measurement, far-field distance estimation, and antenna-gain calculation. These procedures are integrated with the automated dual-axis positioning mechanism and mobile application described in Section 2, providing a structured workflow for antenna positioning, measurement-data acquisition, calculation, and visualization. The corresponding theoretical relationships and measurement procedures are presented in the following subsections.
3.1. Radiation-Pattern Measurement
The radiation pattern represents the variation in the measured transmission response as a function of antenna orientation and is used to characterize the directional behavior of the antenna [20,21]. In the proposed system, the radiation pattern is obtained by measuring the S21 response at a sequence of angular positions while maintaining a fixed separation between the transmitting and receiving antennas. The receiving antenna is mounted on the automated dual-axis positioning mechanism, while the S21 response is measured using a vector network analyzer (VNA).
For a two-port transmission measurement, the relationship between the measured transmission coefficient and the transmitted and received power levels can be expressed as
where Pt is the source power delivered from VNA Port 1 and Pr is the received power level at Port 2. In this study, the VNA source power was set to Pt = 0 dBm. Accordingly, the numerical value of S21 in dB corresponds to the received power level in dBm under the adopted measurement setting.
S21(dB) = Pr(dBm) − Pt(dBm),
During the measurement process, the receiving antenna is rotated to a predefined observation angle according to the selected angular step. At each angular position, the S21 data is read from the VNA and manually entered into the mobile application. The application associates the measured value with the corresponding angular position and stores the data sequentially until the required angular sweep is completed. The resulting angle–S21 dataset is then used to construct the radiation pattern. To facilitate comparison of the antenna response over different observation angles, the measured S21 data are normalized with respect to the maximum measured response. The normalized power at an observation angle α can be expressed as
where S21(α) is the measured transmission response at angle α and S21,max is the maximum S21 data obtained over the complete angular sweep. After normalization, the maximum response is represented by 0 dB, while the remaining values indicate the relative reduction in received power with respect to the peak direction.
S21,norm(α) = S21(α) − S21,max,
After completion of the angular sweep, the stored data are processed and displayed by the mobile application as a polar radiation-pattern plot. The application preserves the association between each angular position and its corresponding S21 data, allowing the measured directional response to be visualized directly on the mobile interface. For experimental evaluation, the proposed system was applied to dipole and Yagi–Uda antennas at 2.4 GHz, allowing the measurement procedure to be assessed using antennas with different radiation characteristics.
3.2. Far-Field Distance Estimation
To obtain a representative antenna radiation pattern, the transmitting and receiving antennas should be separated by a sufficient distance so that the receiving antenna is located in the far-field region of the transmitting antenna. In the proposed system, the minimum far-field distance is estimated from the maximum physical dimension of the antenna and the operating wavelength [22]. The conventional far-field criterion is expressed as
where R is the minimum separation distance between the transmitting and receiving antennas, Dmax is the maximum dimension of the antenna, and λ is the wavelength corresponding to the operating frequency. The wavelength is calculated from λ = c/f, where c is the speed of light in free space and f is the operating frequency.
In the developed mobile application, the user enters the maximum antenna dimension and the operating frequency through the far-field calculation interface. The application then calculates the wavelength and the corresponding minimum far-field distance and displays the result directly on the mobile interface. This calculation is performed before the radiation-pattern measurement to assist in selecting an appropriate separation distance between the transmitting and receiving antennas. The estimated far-field distance is used as a reference for arranging the experimental setup. A separation distance equal to or greater than the calculated R is adopted to support far-field measurement conditions and to reduce the influence of near-field effects on the measured radiation pattern.
3.3. Antenna-Gain Calculation
The antenna gain is estimated using the Friis transmission relationship, which relates the transmitted power, received power, antenna gains, operating frequency, and separation distance between the transmitting and receiving antennas [23]. In the proposed system, two gain-calculation cases are considered depending on whether the gain of the transmitting antenna is known. Under free-space propagation conditions, the received power in decibel form is expressed as
where Pr is the received power, Pt is the transmitted power, Gt and Gr are the gains of the transmitting and receiving antennas, respectively, c is the speed of light in free space, R is the separation distance between the antennas, and f is the operating frequency. This relationship forms the basis of the two gain-calculation modes implemented in the mobile application. Using the relationship S21= Pr − Pt defined in Equation (1), the measured S21 data can be incorporated directly into the gain calculations described below.
In the first case, the gain of the transmitting antenna is unknown. The transmitting and receiving antennas are therefore assumed to be identical in type, geometry, and operating characteristics. Under this condition, their gains are taken to be equal, such that Gt = Gr = G. Substituting this condition into Equation (4) gives
This approach allows the gain of identical transmitting and receiving antennas to be estimated without requiring a reference antenna with a known gain. The validity of this calculation depends on the assumption that the two antennas exhibit approximately equal gain under the same measurement conditions.
In the second case, the gain of the transmitting antenna Gt is known. The gain of the receiving antenna can then be calculated directly from the Friis transmission relationship as
In this case, the known transmitting-antenna gain is entered into the mobile application together with the antenna separation distance, while the operating frequency and measured S21 data required for the calculation are obtained from the preceding measurement procedure. The application then calculates the receiving-antenna gain and displays the result to two decimal places on the mobile interface. Accordingly, the two calculation modes support (i) an identical-antenna method when the transmitting-antenna gain is unknown and (ii) a reference-antenna method when the transmitting-antenna gain is known. This provides flexibility for antenna-gain estimation according to the antennas and measurement information available in the laboratory.
4. Experimental Setup and Evaluation Methods
4.1. Experimental Environment and Instrumentation
The experimental measurements were conducted inside an RF anechoic chamber to provide a controlled environment for antenna radiation-pattern characterization. As shown in Figure 4a, the measurement setup consisted of a transmitting (Tx) antenna, a receiving (Rx) antenna mounted on the developed dual-axis positioning mechanism, a FieldFox vector network analyzer (N9912A, Keysight Technologies, Santa Rosa, CA, USA), and the associated control unit. The Tx and Rx antennas were positioned facing each other and separated by a distance R = 1.0 m, the maximum antenna dimensions were approximately 86.0 mm for the dipole antenna and 169.7 mm for the Yagi–Uda antenna, resulting in calculated minimum far-field distances of approximately 0.12 m and 0.46 m, respectively, at 2.4 GHz. Therefore, the 1.0 m Tx–Rx separation exceeded the minimum far-field requirement for both antenna types. The same separation distance was maintained for both the proposed system and the ME1300 reference measurements to provide comparable measurement conditions.
Figure 4.
Experimental setup and antenna configurations used for radiation-pattern measurements at 2.4 GHz: (a) overview of the proposed measurement system inside the RF anechoic chamber using the FieldFox vector network analyzer (N9912A) and control unit, (b) dipole-to-dipole measurement configuration, (c) dipole-to-Yagi–Uda measurement configuration, (d) overview of the ME1300 reference measurement setup using the FieldFox N9912A and RadPat software, and (e) CST-based electromagnetic simulation model used for comparison with the measured radiation patterns.
VNA Port 1 was connected to the transmitting antenna, whereas Port 2 was connected to the receiving antenna to measure the forward transmission coefficient, S21, at each observation angle. The VNA source power at Port 1 was set to 0 dBm throughout the measurements. According to Equation (1), S21= Pr − Pt; therefore, under the adopted source-power setting, the numerical value of S21 in dB corresponds to the received power level Pr in dBm.
Before the measurements, a two-port short-open-load-through (SOLT) calibration was performed at the ends of the coaxial cables connected to VNA Ports 1 and 2. This established the measurement reference planes at the cable ends and compensated for transmission losses and systematic errors associated with the coaxial measurement paths up to these reference planes. The coaxial connections between the VNA and antennas were maintained throughout the measurement procedure, while the receiving antenna was rotated by the automated positioning mechanism. During the actual radiation-pattern measurements, the Tx and Rx antenna assemblies were positioned farther inside the RF anechoic chamber, away from the chamber entrance, while maintaining the specified 1.0 m separation. The arrangements shown in Figure 4a,d were staged closer to the accessible area of the chamber specifically to provide a clear overview of the complete experimental system and its interconnections. These photographs therefore illustrate the overall system configuration rather than the exact physical locations of the antennas during data acquisition.
The dual-axis positioning system was installed on the receiving side to provide controlled antenna orientation during the angular sweep. The embedded control unit described in Section 2.3 was connected to the positioning mechanism and used to actuate the θ and ϕ axis servo motors. During measurement, the required angular position was specified through the mobile application, and the positioning command was transmitted to the embedded controller through the IoT communication link. After the receiving antenna reached the target position, the corresponding S21 data was read from the VNA and manually entered into the mobile application for storage and radiation-pattern visualization. The measurements were performed at an operating frequency of 2.4 GHz using the antenna configurations shown in Figure 4. Figure 4b illustrates the dipole-to-dipole configuration, whereas Figure 4c shows the dipole-to-Yagi–Uda configuration. For reference validation, Figure 4d presents the measurement arrangement based on the ME1300 Antenna and Propagation Training Kit, incorporating the FieldFox N9912A and RadPat (Version 4.07) software for radiation-pattern acquisition. In the ME1300 reference setup, the FieldFox VNA is connected to a PC through a LAN interface, allowing the measured S21 data to be transferred automatically from the VNA to the RadPat software during the angular sweep. This differs from the proposed system, in which the measured S21 value is read from the VNA and entered manually into the mobile application at each observation angle. Figure 4e presents the corresponding CST-based electromagnetic simulation model used to obtain simulated radiation-pattern characteristics for comparison with the experimental measurements. In both cases, the transmitting antenna remained fixed while the receiving antenna was rotated through successive observation angles by the automated positioning mechanism. The reference measurement and simulation arrangements were included to provide independent comparison of the measured radiation-pattern characteristics obtained using the proposed system.
4.2. Antennas Under Test
Two standard antennas from the ME1300 Antenna and Propagation Training Kit (ME1300, Acehub Vista Sdn. Bhd., Malaysia), operating at 2.4 GHz were employed to evaluate the radiation-pattern measurement capability of the proposed system [24]. As shown in Figure 4b,c, a 2.4 GHz dipole antenna was used as the transmitting antenna for all measurements, while the receiving antenna was selected according to the antenna under test. The measurements were performed under four antenna-orientation conditions: H-plane co-polarization, H-plane cross-polarization, E-plane co-polarization, and E-plane cross-polarization. For each condition, the receiving antenna was swept along the ϕ-axis from 0° to 360° using the predefined angular step, and the corresponding S21 response was recorded as a function of observation angle for radiation-pattern generation.
In the first configuration, shown in Figure 4b, identical 2.4 GHz dipole antennas were used at both the transmitting and receiving sides. The transmitting dipole remained fixed, whereas the receiving dipole was mounted on the automated dual-axis positioner. For the co-polarized measurements, the transmitting and receiving antennas were aligned with the same polarization orientation, whereas for the cross-polarized measurements, the receiving antenna was oriented orthogonally with respect to the transmitting antenna. This configuration was used to examine the characteristic response of the dipole antenna in both the H-plane and E-plane under co- and cross-polarization conditions.
In the second configuration, shown in Figure 4c, the transmitting antenna remained the same 2.4 GHz dipole antenna, while the receiving antenna was replaced by a 2.4 GHz Yagi–Uda antenna. The same four H-plane and E-plane co- and cross-polarization configurations were applied to evaluate the directional response of the Yagi–Uda antenna under different polarization orientations. At each observation angle, the measured S21 data was associated with the corresponding angular position and used to construct the radiation pattern for the selected measurement condition. This second configuration was included to assess the system using a receiving antenna with a more directional radiation characteristic than that of the dipole antenna.
In addition to the experimental measurements, electromagnetic simulations were performed in CST Studio Suite (Version 2025) to provide an additional reference for comparison. Although the ME1300 documentation [24] identifies the antenna types and operating frequency, it does not report quantitative antenna-performance characteristics such as antenna gain, radiation patterns, or other parameters required for direct comparison with the present measurements. Therefore, 2.4 GHz dipole and Yagi–Uda antenna models were simulated in CST to provide comparative radiation-pattern and gain characteristics. The simulated results were subsequently used together with the ME1300 reference measurements to evaluate the results obtained from the proposed system.
4.3. Dual-Axis Positioning-Performance Test
The positioning performance of the developed dual-axis mechanism was evaluated independently for the θ and ϕ axes under different angular-step and mechanical-loading conditions. As shown in Figure 5, external protractors were aligned with the corresponding rotation axes and used as angular references for comparing the commanded and measured positions. The protractors had physical graduations of 1°, and the angular positions were estimated by visual interpolation between adjacent graduation marks and recorded to one decimal place. The evaluation was designed to determine whether positioning performance was affected by angular-step size or by the additional mechanical load introduced when the antenna was mounted on the positioner. Although the positioning mechanism incorporates a photoelectric encoder for external rotational feedback, the independent protractors were used as the external references for calculating the positioning-error metrics reported in this study.
Figure 5.
Experimental arrangement for dual-axis positioning-performance evaluation: (a) θ-axis measurement using the RDS3115 servo motor over 0–180°, and (b) ϕ-axis measurement using the SG5010 servo motor over 0–360°. The angular labels indicate the reference conventions used for each axis.
For the θ-axis, shown in Figure 5a, the RDS3115 servo motor was evaluated over its operating range of 0–180°. The center of the protractor was aligned with the θ-axis rotation center, and the actual angular position was estimated from the external reference scale for each commanded position. The angular labels shown in Figure 5a indicate the reference directions used for the θ-axis and are not intended to represent the individual test positions. For the ϕ-axis, shown in Figure 5b, the SG5010 servo motor was evaluated over the full 0–360° rotational range. A circular protractor was aligned with the ϕ-axis rotation center and used as the external angular reference. Similarly, the angular labels in Figure 5b indicate the ϕ-axis reference directions, while the actual test positions were determined by the selected angular-step settings.
Four angular-step settings were investigated: 4°, 5°, 6°, and 10°. For each step size, the positioning test was conducted under two mechanical-loading conditions: without an antenna and with the antenna mounted on the receiving-antenna fixture. The complete angular sweep was performed independently for both axes, allowing the influence of step size and antenna loading to be assessed separately. During operation, the photoelectric encoder provided rotational feedback with 2048 effective counts per revolution, corresponding to an angular increment of approximately 0.176° per count, as described in Section 2.2. For each test point, the absolute angular error was calculated from the difference between the commanded and measured angular positions as
where αc,i is the commanded angle, αm,i is the measured angle, and ei is the absolute positioning error at the i th measurement point. The positioning performance was then summarized using the mean absolute error (MAE) and root-mean-square error (RMSE), which provide complementary measures of the magnitude and distribution of the positioning errors [25]. The MAE was calculated as
and the RMSE was determined by
where N is the total number of angular measurement points. In addition to MAE and RMSE, the maximum absolute error and the standard deviation of the absolute error were calculated to characterize the worst-case deviation and the variability of the positioning error under each test condition. The resulting error metrics are interpreted as positioning-performance estimates obtained under the adopted external-reference procedure.
ei = |αm,i − αc,i|,
4.4. Radiation-Pattern Measurement Procedure
The radiation-pattern measurements were performed using the experimental arrangement described in Section 4.1 and the antenna configurations defined in Section 4.2. For each test case, the receiving antenna was first oriented according to one of four measurement conditions: H-plane co-polarization, H-plane cross-polarization, E-plane co-polarization, and E-plane cross-polarization. For each condition, the receiving antenna was swept along the ϕ-axis from 0° to 360° using a fixed angular step of 5°. The angular step was selected to provide sufficiently dense sampling while limiting the number of measurement points, consistent with the general trade-off between angular sampling density and measurement efficiency reported in antenna-measurement studies [26]. Because 5° evenly divides the full 360° sweep, it also provides uniformly spaced observation angles throughout the measurement range.
At each commanded angle, the receiving antenna was allowed to reach the target position before the corresponding S21 data was read from the FieldFox VNA and manually entered into the mobile application. The application associated each measured value with its corresponding angular position and stored the angle–S21 data sequentially throughout the sweep. After completion of the 0–360° scan, the measured S21 data were normalized with respect to the maximum measured response according to Equation (2). The normalized data were then used to generate the corresponding polar radiation pattern. The same measurement sequence was repeated for all four polarization/plane conditions and for both the dipole and Yagi–Uda receiving antennas.
5. Results and Discussion
5.1. Dual-Axis Positioning Performance
The positioning performance of the developed dual-axis antenna positioner was evaluated at angular step sizes of 4°, 5°, 6°, and 10° under both unloaded and antenna-loaded conditions. The results for the θ- and ϕ-axes are summarized in Table 1. For the θ-axis, the MAE under the unloaded condition ranged from 0.12° to 0.13°, with RMSE values between 0.15° and 0.17°. When the antenna was installed, the MAE increased slightly to 0.14–0.15°, while the RMSE ranged from 0.16° to 0.17°. Averaged across the four angular-step settings, the MAE increased from approximately 0.12° without the antenna to 0.15° with the antenna, indicating a small increase under the antenna-loaded condition. The maximum absolute positioning error remained at 0.3° for all θ-axis test conditions. These results indicate that the θ-axis maintained a relatively consistent level of positioning performance across the investigated angular steps, even when the antenna load was applied.
Table 1.
Positioning performance of the dual-axis antenna positioner under different angular-step and loading conditions.
For the ϕ-axis, the unloaded condition resulted in MAE values ranging from 0.08° to 0.09°, with corresponding RMSE values of 0.11–0.13°. Under the antenna-loaded condition, the MAE ranged from 0.10° to 0.11°, while the RMSE ranged from 0.13° to 0.14°. The average MAE increased from approximately 0.09° without the antenna to 0.11° with the antenna, again indicating a small increase associated with antenna loading. The maximum absolute error was 0.2° for the 4°, 6°, and 10° step settings and 0.3° for the 5° step setting. Across the investigated angular steps, the MAE values for both axes remained relatively stable and did not exhibit a systematic relationship with step size. Within the range investigated, changing the angular step from 4° to 10° did not produce a consistent increase or decrease in MAE for either axis. This suggests that the selected angular increment had only a limited influence on positioning performance under the tested conditions.
The antenna-loaded condition generally produced slightly higher MAE values than the unloaded condition for both rotational axes. The small increase may be associated with the additional mechanical load introduced by the antenna and its mounting structure; however, the present measurements were not intended to isolate the individual mechanical factors responsible for this change. Nevertheless, the magnitude of the increase was small, and the standard deviation of the absolute error remained below approximately 0.12° for all experimental conditions. The ϕ-axis also exhibited lower average MAE values than the θ-axis under both loading conditions, indicating slightly smaller angular deviations for the ϕ-axis within the tested operating range. Most importantly, the maximum positioning error observed across all 16 experimental conditions did not exceed 0.3°, which is substantially lower than the predefined positioning-error requirement of ±1°. Considering the external-reference procedure described in Section 4.3, the reported MAE and RMSE values are interpreted as positioning-performance estimates obtained under the adopted measurement procedure rather than as traceable sub-degree calibration accuracy. The sub-degree positioning performance obtained in the present system is therefore consistent with the broader objective of automated antenna-measurement platforms to provide controlled and reproducible antenna orientation while reducing manual positioning [8,27]. These results demonstrate that the developed dual-axis positioning mechanism provides consistently low angular deviations across the tested step sizes and loading conditions, supporting its use for the intended antenna radiation-pattern measurement procedure.
5.2. Far-Field and Antenna-Gain Calculation Validation
The calculation functions implemented in the mobile application were validated by comparing the application-calculated results with independently obtained theoretical calculation results. The validation covered the far-field distance estimation and the two antenna-gain calculation modes implemented in the proposed system. To evaluate the numerical implementation independently of experimental measurement uncertainty, the input values used in this validation were predefined specifically for calculation verification and were not obtained from actual antenna measurements. The selected values were chosen to cover different input magnitudes, unit selections, and gain-calculation modes supported by the application. The theoretical calculation results were obtained using the relationships previously defined in Equations (3), (5) and (6), and the comparison results are summarized in Table 2. For the far-field distance function, four antenna-dimension values were evaluated at an operating frequency of 2.4 GHz. The selected maximum antenna dimensions were 10 cm, 1 cm, 1 mm, and 100 cm, providing test cases across different input scales and unit selections. Based on Equation (3), the corresponding theoretical calculation results for the far-field distance were 0.16 m, 0.0016 m, 0.000016 m, and 16.00 m, respectively. The mobile application produced the same numerical results for all four cases. Consequently, the display difference between the theoretical calculation result and the application-calculated result was 0.00 m for each test case. These results confirm that the application correctly performs the far-field distance calculation across the investigated input ranges and unit settings.
Table 2.
Validation of the far-field distance and antenna-gain calculations implemented in the mobile application.
The antenna-gain calculation was subsequently validated for the two operating modes described in Section 3.3. As with the far-field validation, the gain-calculation inputs were predefined solely to verify the numerical implementation of the application against the theoretical equations. For both cases, the test parameters were Pt = 0 dBm, Pr = −4.24 dBm, an antenna separation of 0.5 m, and an operating frequency of 2.4 GHz. Under the identical-antenna condition, the theoretical calculation result obtained using Equation (5) was 14.892 dB, whereas the mobile application displayed 14.89 dB. The resulting display difference of 0.002 dB was caused solely by rounding the calculated value to two decimal places in the application interface. For the known transmitting-antenna gain condition, a transmitting-antenna gain of 5 dB was specified. Using Equation (6), the theoretical calculation result for the receiving-antenna gain was 24.785 dB, while the application displayed 24.79 dB. The corresponding display difference of 0.005 dB likewise resulted solely from rounding to two decimal places. Thus, the underlying numerical results of both gain-calculation modes are consistent with their theoretical calculation results. Overall, the results in Table 2 demonstrate numerical consistency between the implemented calculation functions and the corresponding theoretical relationships. The far-field distance calculations matched the theoretical calculation results within the displayed precision, while the small differences in the antenna-gain results were attributable exclusively to two-decimal-place rounding in the application display. Because the validation inputs were intentionally predefined rather than experimentally measured, these results should be interpreted as verification of the application’s numerical calculation functions, rather than as validation of measured antenna performance.
5.3. Radiation-Pattern Measurement Results
The radiation-pattern measurement capability of the proposed system was evaluated at an operating frequency of 2.4 GHz using the dipole and Yagi–Uda antenna configurations described in Section 4.2. For each test case, the receiving antenna was swept along the ϕ-axis from 0° to 360° using an angular step of 5°, and the S21 data at each angular position was obtained from the FieldFox VNA and entered into the mobile application. The measured data were subsequently normalized with respect to the maximum measured S21 response according to Equation (2) and used to generate the corresponding polar radiation patterns. The measured radiation patterns are presented in Figure 6. Figure 6a,b show the H-plane and E-plane patterns, respectively, for the dipole antenna configuration, whereas Figure 6d,e present the corresponding H-plane and E-plane patterns for the Yagi–Uda antenna. These individual patterns were generated by the mobile application and exported directly as PNG images. The combined plots in Figure 6c,f were generated from the corresponding angle–S21 datasets exported in CSV format and plotted on a common polar coordinate system. This representation allows the co- and cross-polarization responses in the H- and E-planes to be compared using the same angular reference and radial scale.
Figure 6.
Measured radiation patterns at 2.4 GHz: (a) dipole H-plane, (b) dipole E-plane, (c) combined dipole patterns, (d) Yagi–Uda H-plane, (e) Yagi–Uda E-plane, and (f) combined Yagi–Uda patterns under co- and cross-polarization conditions.
For the dipole antenna, the measured patterns in Figure 6a–c exhibit the expected radiation characteristics of the standard dipole antenna included in the ME1300 Antenna and Propagation Training Kit. In particular, the H-plane pattern shown in Figure 6a demonstrates an approximately omnidirectional radiation pattern, with the measured response remaining relatively uniform over the full angular sweep. In contrast, the E-plane pattern in Figure 6b exhibits the characteristic bidirectional response, with two dominant lobes and reduced response near the null directions. Similar H-plane omnidirectional and E-plane dipole-like radiation characteristics at 2.4 GHz have also been reported in previous antenna measurements [28]. This contrast between the H-plane and E-plane responses is consistent with the expected directional behavior of a dipole antenna. The combined results in Figure 6c further show that the co-polarized responses are generally stronger than the corresponding cross-polarized components over most observation angles. At 0°, the combined patterns indicate the cross-polarization discrimination (XPD) of approximately 27 dB for the H-plane and 30 dB for the E-plane. At 180°, the corresponding XPD values are approximately 28 dB and 30 dB, respectively. These results indicate substantial suppression of the cross-polarized components in both principal radiation directions.
The Yagi–Uda results in Figure 6d–f exhibit a more directional radiation response than the dipole results. A dominant main lobe is observed around the principal radiation direction, while the measured response decreases away from the main-beam region. This behavior is consistent with the directional radiation characteristics generally associated with Yagi–Uda arrays [29]. Directional radiation behavior at 2.4 GHz has likewise been demonstrated in measured Yagi-based antenna configurations reported in the literature [30]. Compared with the broader response of the dipole antenna, the Yagi–Uda patterns show a more concentrated angular distribution of the measured response, reflecting the directional nature of this antenna type. The combined plot in Figure 6f further illustrates the differences between the H-plane and E-plane responses and between the co- and cross-polarization conditions. The co-polarized responses remain dominant around the principal radiation direction, whereas the cross-polarized components are lower. At the principal radiation direction of 0°, the XPD estimated from the plotted responses is approximately 35 dB for the H-plane and 40 dB for the E-plane, indicating substantial suppression of the cross-polarized components in the main-beam direction. Overall, the measured patterns demonstrate that the developed system can distinguish between the characteristic radiation behaviors of antennas with different directional properties. The approximately omnidirectional H-plane response and bidirectional E-plane response of the dipole antenna can be clearly identified, while the Yagi–Uda antenna exhibits a more pronounced directional main lobe. These results support the capability of the proposed system to acquire and visualize representative radiation-pattern characteristics over a complete angular sweep.
5.4. Radiation-Pattern Validation and Comparative Analysis
To further validate the radiation-pattern measurements obtained from the proposed system, the measured results were compared with electromagnetic simulations performed in CST Studio Suite and independent measurements obtained using the ME1300 reference measurement system. The CST results were used as the numerical reference, whereas the ME1300 measurements provided an independent experimental reference under comparable measurement conditions. All radiation-pattern datasets were normalized to their respective maximum responses to provide a common 0 dB reference for comparison. Figure 7 presents the normalized H- and E-plane patterns for the dipole and Yagi–Uda antennas, while the corresponding quantitative characteristics are summarized in Table 3.
Figure 7.
Comparison of normalized radiation patterns obtained from CST simulation, ME1300 reference measurements, and the proposed system at 2.4 GHz: (a) dipole H-plane, (b) dipole E-plane, (c) Yagi–Uda H-plane, and (d) Yagi–Uda E-plane.
Table 3.
Quantitative comparison of antenna gain and radiation-pattern characteristics obtained from CST simulation, ME1300 reference measurements, and the proposed system at 2.4 GHz.
For the dipole antenna, Figure 7a shows that the CST simulation, ME1300 measurement, and proposed system all exhibit the expected approximately omnidirectional H-plane response. The CST result shows the most uniform angular response, whereas the two measured patterns exhibit moderate variations over portions of the angular sweep. Nevertheless, the overall H-plane behavior remains consistent among the three approaches. In the E-plane comparison shown in Figure 7b, all three datasets exhibit the characteristic bidirectional figure-eight pattern, with principal radiation directions at approximately 0° and 180° and null regions near 90° and 270°. As summarized in Table 3, the two E-plane HPBWs obtained from CST were 79.8° and 83.2°, compared with 66.1° and 74.8° for the ME1300 measurements and 57.5° and 72.3° for the proposed system. Although differences in beamwidth are observed, particularly for the lobe centered near 0°, the proposed system preserves the principal lobe directions and overall bidirectional radiation characteristics. The estimated dipole gain was 1.64 dB for both the ME1300 and proposed systems, compared with a simulated value of 1.79 dBi.
The Yagi–Uda comparisons in Figure 7c,d show closer agreement in the principal directional characteristics. For both the H- and E-planes, all three approaches identify the main-lobe direction at 0°. The H-plane HPBW was 49.8° in the CST simulation, 44.4° in the ME1300 measurement, and 42.5° in the proposed system, whereas the corresponding E-plane values were 47.0°, 38.3°, and 36.7°, respectively. The proposed-system beamwidths therefore differ from the ME1300 measurements by only 1.9° in the H-plane and 1.6° in the E-plane, indicating close agreement between the two experimental measurement approaches. The gain obtained using the proposed system was 10.9 dB, equal to that obtained from the ME1300 measurement and lower than the CST-simulated value of 11.7 dBi. Further agreement is observed in the front-to-back ratio (FBR) and sidelobe level (SLL). For the Yagi–Uda H-plane, the FBR values were 18.85, 18.26, and 18.03 dB for CST, ME1300, and the proposed system, respectively. The corresponding SLL values were −18.85, −17.85, and −17.93 dB. The difference between the proposed system and the ME1300 reference measurement was therefore only 0.23 dB for FBR and 0.08 dB for SLL in the H-plane. In the E-plane, the FBR values were 18.57, 23.17, and 21.55 dB, while the SLL values were −17.81, −17.10, and −17.40 dB for CST, ME1300, and the proposed system, respectively. Although greater variation is observed in the E-plane FBR, the three datasets consistently indicate a strongly directional radiation pattern with a dominant forward beam and suppressed backward and sidelobe responses.
The remaining differences among the three datasets are primarily observed in the beamwidth, null, sidelobe, and backward-radiation regions. Such regions are particularly sensitive to differences between idealized numerical models and experimental measurement conditions, as well as to antenna alignment, mechanical positioning, and the surrounding measurement environment. Despite these differences, the proposed system consistently reproduces the principal radiation characteristics identified by both the CST numerical reference and the ME1300 experimental reference, including the expected pattern type, main-lobe direction, gain characteristics, HPBW, FBR, and SLL. The combined qualitative comparison in Figure 7 and quantitative results in Table 3 therefore provide additional validation of the proposed system for laboratory-scale radiation-pattern characterization at 2.4 GHz.
5.5. Mobile Data Visualization and Export
The mobile application provides an integrated interface for viewing, storing, and exporting antenna-measurement results. As shown in Figure 8, the measured radiation pattern can be inspected directly through the mobile interface, while the corresponding measurement results can be saved for subsequent use. This allows the user to review the measured response immediately after data entry without relying on separate visualization software during the measurement session. The exported numerical data preserve the relationship between the observation angle and the corresponding measured S21 response, enabling individual measurement points to be examined independently after completion of the angular sweep. The use of CSV-based data export is consistent with mobile measurement and data-acquisition applications in which recorded data are retained in a portable tabular format for subsequent inspection, analysis, and transfer to external software [31,32]. In the example shown in Figure 8, the exported dataset can be opened in spreadsheet software and inspected numerically, allowing features such as the angular position associated with the maximum S21 response to be identified directly from the recorded data.
Figure 8.
Export and post-processing of radiation-pattern measurement data from the developed mobile application. The measured radiation pattern can be saved directly as a PNG image, whereas the corresponding angular-position and S21 data can be exported in CSV format for further inspection and analysis.
The export function also provides a clear separation between measurement acquisition and subsequent data analysis. The mobile application is used primarily for positioning control, measurement-data entry, and immediate visualization, whereas the exported dataset can be used for additional processing, comparative analysis, or preparation of publication-quality plots using external software. Because the original angle–S21 pairs are retained in the exported data, subsequent analyses can be performed without altering the measurements recorded during the experiment. This preserves the original measurement records while enabling flexible post-processing in external analysis environments. Overall, the visualization and export functions provide a practical data-management capability for the proposed measurement system. The mobile interface supports immediate inspection of the measured radiation pattern, while the exported numerical data provide a traceable basis for post-processing and further analysis. Together, these functions support both immediate result inspection and subsequent quantitative analysis beyond the initial measurement session.
5.6. Cost and Performance Comparison
The proposed system was developed as a low-cost positioning and measurement-support platform for educational and laboratory-scale antenna characterization. The developed subsystem includes the Arduino Uno R3, NodeMCU ESP8266, RDS3115 and SG5010 servo motors, photoelectric encoder, DC–DC regulators, dual-axis positioning structure, control enclosure, and associated wiring. The mobile application was developed in-house; therefore, no external software-development cost was incurred. Existing laboratory equipment, including the FieldFox VNA, RF anechoic chamber, antennas, RF cables, and smartphone or computer, was excluded from the implementation cost. The estimated hardware implementation cost of the developed positioning and control subsystem was approximately THB 6000 (approximately USD 185, based on the exchange rate at the time of manuscript preparation).
Table 4 summarizes the principal differences between the proposed system and the ME1300 reference platform. The proposed system provides independent dual-axis positioning over θ = 0–180° and ϕ = 0–360°, whereas the ME1300 platform provides a single rotational sweep with θ = 0° and ϕ = 0–360°. The additional degree of freedom is useful for polarization-oriented measurements, while expanded receiving-positioning capability in the ME1300 platform requires an upgrade to the ME1310 system [33]. The ME1300 provides automatic S21 transfer from the FieldFox VNA to RadPat via LAN, whereas the proposed system currently uses manual S21 entry. In contrast, the proposed mobile application integrates far-field and antenna-gain calculations and exports numerical and graphical results in CSV and PNG formats, respectively. The developed positioning mechanism exhibited a maximum observed angular deviation of 0.3° under the investigated conditions, and the measured radiation patterns showed agreement with CST simulations and ME1300 reference measurements in the principal radiation characteristics. The proposed system therefore provides a practical balance between implementation cost and measurement functionality, particularly for laboratories requiring low-cost dual-axis positioning, mobile control, and polarization-oriented antenna measurements.
Table 4.
Cost and functional comparison between the proposed system and the ME1300 reference platform.
6. Limitations and Future Work
Although the proposed system demonstrated reliable dual-axis positioning and practical radiation-pattern measurement capability, several limitations remain. First, the RF measurement process is not fully automated. The measured S21 data must be read from the VNA and manually entered into the mobile application at each observation angle. Although this approach simplifies the hardware interface and allows the positioning subsystem to operate independently of the RF instrument, manual data entry increases measurement time and may introduce transcription errors during extended angular sweeps. Second, the experimental evaluation was conducted at 2.4 GHz using dipole and Yagi–Uda antennas under controlled conditions in an RF anechoic chamber. These measurements demonstrate the ability of the system to distinguish between approximately omnidirectional and directional radiation characteristics; however, the present evaluation was limited to these antenna types and operating conditions. Additional experiments using antennas with different geometries, operating frequencies, and radiation characteristics would provide a broader assessment of the measurement capability of the system.
The present work also focused primarily on positioning performance, calculation validation, radiation-pattern measurement, and mobile data handling. Although the IoT communication architecture successfully supported remote positioning control during the experiments, communication-related performance metrics such as command latency, packet delivery reliability, and recovery time following network interruption were not quantitatively evaluated. Latency and communication reliability are important performance indicators for network-connected control systems, particularly when remote actuation or time-sensitive operations are involved [35]. These parameters may become more important when the system is deployed over less stable wireless networks or used in measurement procedures requiring faster automated positioning. In addition, the positioning-error evaluation was based on external protractors with 1° physical graduations and visual interpolation between adjacent marks; therefore, the reported error metrics should be interpreted as positioning-performance estimates under the adopted external-reference procedure rather than as traceable sub-degree calibration accuracy.
Future development will therefore focus on direct digital integration between the VNA and the mobile or embedded control system, enabling S21 data to be acquired automatically and synchronized with the corresponding angular positions. Automated antenna-measurement platforms have demonstrated the advantages of integrating mechanical positioning, RF data acquisition, and software control within a coordinated measurement workflow [36]. Such integration would reduce manual intervention and support a more fully automated measurement workflow. Further improvements may include automated identification of measurement planes, expanded support for different antenna types and operating frequencies, and enhanced post-processing functions for quantitative radiation-pattern analysis. Future work should also investigate positioning repeatability, mechanical backlash, settling behavior, and validation using a higher-resolution calibrated angular reference. In addition, future work should include a more comprehensive evaluation of the IoT communication layer, including communication latency, reliability, and reconnection behavior under different network conditions. Extending the experimental validation to additional antenna configurations and measurement frequencies would also help establish the general applicability of the proposed platform beyond the 2.4 GHz laboratory demonstrations presented in this study.
7. Conclusions
This study presented a low-cost IoT-based antenna-measurement system integrating automated dual-axis positioning, wireless communication, mobile data visualization, antenna-related calculations, and measurement-data export within a unified platform. The developed system combines a NodeMCU ESP8266, Arduino Uno R3, servo-driven dual-axis positioning mechanism, NETPIE IoT communication, and a mobile application to support antenna radiation-pattern measurements while retaining the VNA as the independent RF measurement instrument. Experimental evaluation demonstrated that the dual-axis positioning mechanism provided consistently low angular errors over step sizes of 4°, 5°, 6°, and 10° under both unloaded and antenna-loaded conditions. Across all 16 test conditions, the maximum positioning error did not exceed 0.300°, which was well below the predefined requirement of ±1°. The average MAE increased only slightly when the antenna was installed, from approximately 0.12° to 0.15° for the θ-axis and from 0.09° to 0.11° for the ϕ-axis, indicating that the additional antenna load had only a limited effect on positioning performance.
The far-field distance and antenna-gain calculation functions were also verified against independently calculated theoretical reference values. The far-field calculations matched the reference values within the displayed precision, while the small differences observed in the gain results were attributable solely to rounding the application output to two decimal places. These results confirmed the numerical correctness of the calculation functions implemented in the mobile application. Radiation-pattern measurements performed at 2.4 GHz using dipole and Yagi–Uda antennas further demonstrated the practical capability of the system. The measured dipole patterns exhibited an approximately omnidirectional response in the H-plane and the expected bidirectional characteristic in the E-plane, whereas the Yagi–Uda antenna exhibited a more directional response with a pronounced main lobe. The mobile application supported direct visualization of the measured patterns and enabled the corresponding results to be exported in both PNG and CSV formats for documentation and further analysis. Overall, the proposed system provides a practical and accessible platform for antenna radiation-pattern measurement by combining automated dual-axis positioning, IoT-based control, mobile visualization, calculation support, and flexible data export. Although the measured S21 data are currently entered manually from the VNA, the developed architecture provides a suitable foundation for future integration of automated RF data acquisition and more advanced measurement and post-processing functions.
Author Contributions
Conceptualization, S.P., S.R., T.K., A.J., P.K. (Peerasan Khamsalee) and P.K. (Piyaporn Krachodnok); methodology, S.P., T.K., A.J., P.K. (Peerasan Khamsalee) and P.K. (Piyaporn Krachodnok); software, S.R., P.M., T.K. and A.J.; validation, S.P., P.M., P.K. (Peerasan Khamsalee) and P.K. (Piyaporn Krachodnok); formal analysis, S.P., T.K., A.J., P.K. (Peerasan Khamsalee) and P.K. (Piyaporn Krachodnok); investigation, S.P., T.K., A.J., P.K. (Peerasan Khamsalee) and P.K. (Piyaporn Krachodnok); resources, S.P., S.R. and T.K.; data curation, S.P., S.R., P.M. and T.K.; writing—original draft preparation, S.P., S.R., T.K. and A.J.; writing—review and editing, P.M., P.K. (Peerasan Khamsalee) and P.K. (Piyaporn Krachodnok); visualization, S.P. and P.M.; supervision, S.P., P.K. (Peerasan Khamsalee) and P.K. (Piyaporn Krachodnok); project administration, S.P.; funding acquisition, P.K. (Piyaporn Krachodnok). All authors have read and agreed to the published version of the manuscript.
Funding
This work was supported by the Suranaree University of Technology (SUT) Research and Development Fund under Grant IRD7-709-68-12-18.
Data Availability Statement
The data presented in this study are contained within the article.
Acknowledgments
The authors gratefully acknowledge Suranaree University of Technology (SUT) for providing access to laboratory equipment, measurement tools, simulation software, and technical facilities, which were essential for conducting experiments and analyzing the data. The constructive environment and continuous encouragement from the university significantly contributed to the successful completion of this study.
Conflicts of Interest
The authors declare no conflicts of interest.
References
- Khan, S.; Mazhar, T.; Shahzad, T.; Bibi, A.; Ahmad, W.; Khan, M.A.; Saeed, M.M.; Hamam, H. Antenna systems for IoT applications: A review. Discov. Sustain. 2024, 5, 412. [Google Scholar] [CrossRef] [Scilit]
- Mietzner, J.; Schober, R.; Lampe, L.; Gerstacker, W.; Hoeher, P. Multiple-antenna techniques for wireless communications—A comprehensive literature survey. IEEE Commun. Surv. Tutor. 2009, 11, 87–105. [Google Scholar] [CrossRef] [Scilit]
- Karim, M.R.; Yang, X.; Shafique, M.F. On Chip Antenna Measurement: A Survey of Challenges and Recent Trends. IEEE Access 2018, 6, 20320–20333. [Google Scholar] [CrossRef] [Scilit]
- Breinbjerg, O.; Castañer, M.S.; Gregson, S.; Eibert, T. Antenna Measurement Challenges and Opportunities. Rev. Electromagn. 2023, 2, 1–49. [Google Scholar] [CrossRef] [Scilit]
- Exposito, I.; Sanchez, M.G.; Cuinas, I. Uncertainty Assessment of a Small Rectangular Anechoic Chamber: From Design to Operation. IEEE Trans. Antennas Propag. 2020, 68, 4871–4880. [Google Scholar] [CrossRef] [Scilit]
- Wagih, M.; Moody, T. Open-Source Low-Cost Antenna Measurement Setup for Rapid Echoic Measurements. In Proceedings of the 2021 IEEE Conference on Antenna Measurements and Applications, CAMA, Antibes Juan-les-Pins, France, 15–17 November 2021; pp. 98–101. [Google Scholar] [CrossRef] [Scilit]
- Brown, B.C.; Goora, F.G.; Rouse, C.D. The design of an economical antenna-gain and radiation-pattern measurement system. IEEE Antennas Propag. Mag. 2011, 53, 188–200. [Google Scholar] [CrossRef] [Scilit][Green Version]
- Junfithrana, A.P.; Rahardjo, E.T.; Zulkifli, F.Y.; Basari. Development of automated antenna radiation pattern measurement using rotator application model to increase accuracy. In Proceedings of the 2017 International Conference on Computing, Engineering, and Design (ICCED), Kuala Lumpur, Malaysia, 23–25 November 2017; Volume 2018, pp. 1–5. [Google Scholar] [CrossRef] [Scilit]
- Kana-Chuctaya, A.; Hilario-Tacuri, A. Development of a prototype antenna radiation pattern measurement system using Software-Defined Radio. HardwareX 2025, 24, e00695. [Google Scholar] [CrossRef] [Scilit] [PubMed]
- Mejri, F.; Mejri, F.; Fezai, N.; Delleji, T. Low-Cost Automated Antenna Radiation Pattern Measurement System Based on Arduino and Raspberry Pi. In Proceedings of the 12th 2026 International Conference on Control, Decision and Information Technologies, CoDIT, Bari, Italy, 13–16 July 2026; pp. 563–568. [Google Scholar] [CrossRef] [Scilit]
- Magri, V.P.R.; de Matos, L.J.; Castellanos, P.V.G.; Mota, V.L.G.; Bilobran, R.A. Automatized Measurement Setup to Determine 5G and 6G Radiation Pattern for Miniaturized Arrays Antennas. In Advanced Wireless Communications and Mobile Networks-Current Status and Future Directions; IntechOpen: London, UK, 2025. [Google Scholar] [CrossRef] [Scilit]
- Romero, C.F.; Arboleya, A.; Varela, F.R.; Castañer, M.S. Enhancing Robotic Antenna Measurements with Composite-Plane Range Extension and Localized Sparse Sampling. Sensors 2025, 25, 7200. [Google Scholar] [CrossRef] [Scilit] [PubMed]
- Anshori, I.; Mufiddin, G.F.; Ramadhan, I.F.; Ariasena, E.; Harimurti, S.; Yunkins, H.; Kurniawan, C. Design of smartphone-controlled low-cost potentiostat for cyclic voltammetry analysis based on ESP32 microcontroller. Sens. Bio-Sens. Res. 2022, 36, 100490. [Google Scholar] [CrossRef] [Scilit]
- Vidotto, L.H.B.; Junior, D.W.; Kubota, L.T. A simple and low-cost portable potentiostat with real-time data sharing for wireless electrochemical analyses. J. Electroanal. Chem. 2023, 937, 117414. [Google Scholar] [CrossRef] [Scilit]
- Bonavolontà, F.; Carnì, D.L.; de Pandi, F.; Lamonaca, F.; Liccardo, A. Reconfigurable measurement setup for laboratory activities in augmented reality. Meas. Sens. 2025, 38, 101321. [Google Scholar] [CrossRef] [Scilit]
- Yu, K.; Chen, R.; Liu, C.; Chun, S.; Yu, D.; Liu, Z. Development of an NB-IoT-Based Measurement and Control System for Frequency Division Multiplexing Electrical Resistivity Tomography (FDM-ERT) Instruments. Appl. Sci. 2026, 16, 2774. [Google Scholar] [CrossRef] [Scilit]
- Frank, J.A.; Brill, A.; Kapila, V. Mounted Smartphones as Measurement and Control Platforms for Motor-Based Laboratory Test-Beds. Sensors 2016, 16, 1331. [Google Scholar] [CrossRef] [Scilit] [PubMed]
- Haqiqi, M.D.; Ardiansyah, T. Comparative Analysis of Usability and Efficiency of Interface Design Process in Figma and Adobe XD. Inovtek Polbeng-Seri Inform. 2026, 11, 236–245. [Google Scholar] [CrossRef] [Scilit]
- Sandesara, M.; Bodkhe, U.; Tanwar, S.; Alshehri, M.D.; Sharma, R.; Neagu, B.-C.; Grigoras, G.; Raboaca, M.S. Design and Experience of Mobile Applications: A Pilot Survey. Mathematics 2022, 10, 2380. [Google Scholar] [CrossRef] [Scilit]
- IEEE 149-2021; IEEE Recommended Practice for Antenna Measurements. IEEE: Piscataway, NJ, USA, 2021. [CrossRef] [Scilit]
- Salas-Natera, M.A.; Rodríguez-Osorio, R.M.; De Haro, L. characterization, and calibration of active antenna arrays. IEEE Trans. Instrum. Meas. 2013, 62, 377–391. [Google Scholar] [CrossRef] [Scilit]
- Balanis, C.A. Antenna Theory Analysis and Design, 4th ed.; Wiley: Hoboken, NJ, USA, 2016. [Google Scholar]
- Friis, H.T. A Note on a Simple Transmission Formula. Proc. IRE 1946, 34, 254–256. [Google Scholar] [CrossRef] [Scilit]
- DreamCatcher. ME1300 Antenna and Propagation Courseware. 2017. Available online: https://www.avantec2.cl/imagenes/pdf/Catalogo_ME1300.pdf (accessed on 14 September 2026).
- Chai, T.; Draxler, R.R. Root mean square error (RMSE) or mean absolute error (MAE)?-Arguments against avoiding RMSE in the literature. Geosci. Model Dev. 2014, 7, 1247–1250. [Google Scholar] [CrossRef] [Scilit]
- Guo, G.; Yang, X.; Ma, N.; Wei, R.; Zhou, Y.; Xiong, Y.; Xu, X.; Zhang, P. A Novel Statistical Analysis Algorithm for Angular Sampling for Measurement of the TRP of Spurious Emissions. Electronics 2023, 12, 4290. [Google Scholar] [CrossRef] [Scilit]
- Novotny, D.R.; Gordon, J.A. Practical Considerations When Using Commercial Robotic Arms for Antenna Metrology. In ISAP 2018—2018 International Symposium on Antennas and Propagation; Busan, Republic of Korea, 23–26 October 2018. Available online: https://ieeexplore.ieee.org/document/8627521 (accessed on 14 September 2026).
- Raza, M.U.; Ren, H.; Yan, S. Dual-Band Monopole MIMO Antenna Array for UAV Communication Systems. Sensors 2024, 24, 5913. [Google Scholar] [CrossRef] [Scilit] [PubMed]
- Constantinescu, C.; Pacurar, C.; Giurgiuman, A.; Munteanu, C.; Andreica, S.; Gliga, M. High Gain Improved Planar Yagi Uda Antenna for 2.4 GHz Applications and Its Influence on Human Tissues. Appl. Sci. 2023, 13, 6678. [Google Scholar] [CrossRef] [Scilit]
- Liu, S.; Raad, R.; Theoharis, P.I.; Tubbal, F.E. A Printed Yagi Antenna for CubeSat with Multi-Frequency Tilt Operation. Electronics 2020, 9, 986. [Google Scholar] [CrossRef] [Scilit]
- Jenkins, D.M.; Kurasaki, R. ABE-VIEW: Android Interface for Wireless Data Acquisition and Control. Sensors 2018, 18, 2647. [Google Scholar] [CrossRef] [Scilit] [PubMed]
- Wolniewicz, P. SedMob: A mobile application for creating sedimentary logs in the field. Comput. Geosci. 2014, 66, 211–218. [Google Scholar] [CrossRef] [Scilit]
- ME1310 Antenna and Propagation (3D)|DreamCatcher|University Courseware. Available online: https://www.dreamcatcher.asia/cw/products/1310 (accessed on 5 October 2026).
- Dream Catcher ME1300 Antenna Training Kit RX & TX Units Part#ME1300 NEW|eBay. Available online: https://www.ebay.it/itm/157519200010 (accessed on 5 October 2026).
- Barón, M.; Diez, L.; Zverev, M.; Juárez, J.R.; Agüero, R. On the performance of Zenoh in Industrial IoT Scenarios. Ad. Hoc Netw. 2025, 170, 103784. [Google Scholar] [CrossRef] [Scilit]
- Ashraf, M.A.; Abdel-Rahman, M.R.; Haraz, O.A.; Alshawi, T.; Sethi, W.T.; Alshebeili, S.A. Multi-feature radiation pattern measurement apparatus operative up to 67-GHz band. Measurement 2020, 153, 107405. [Google Scholar] [CrossRef] [Scilit]
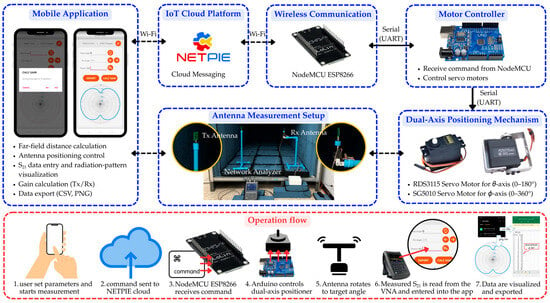
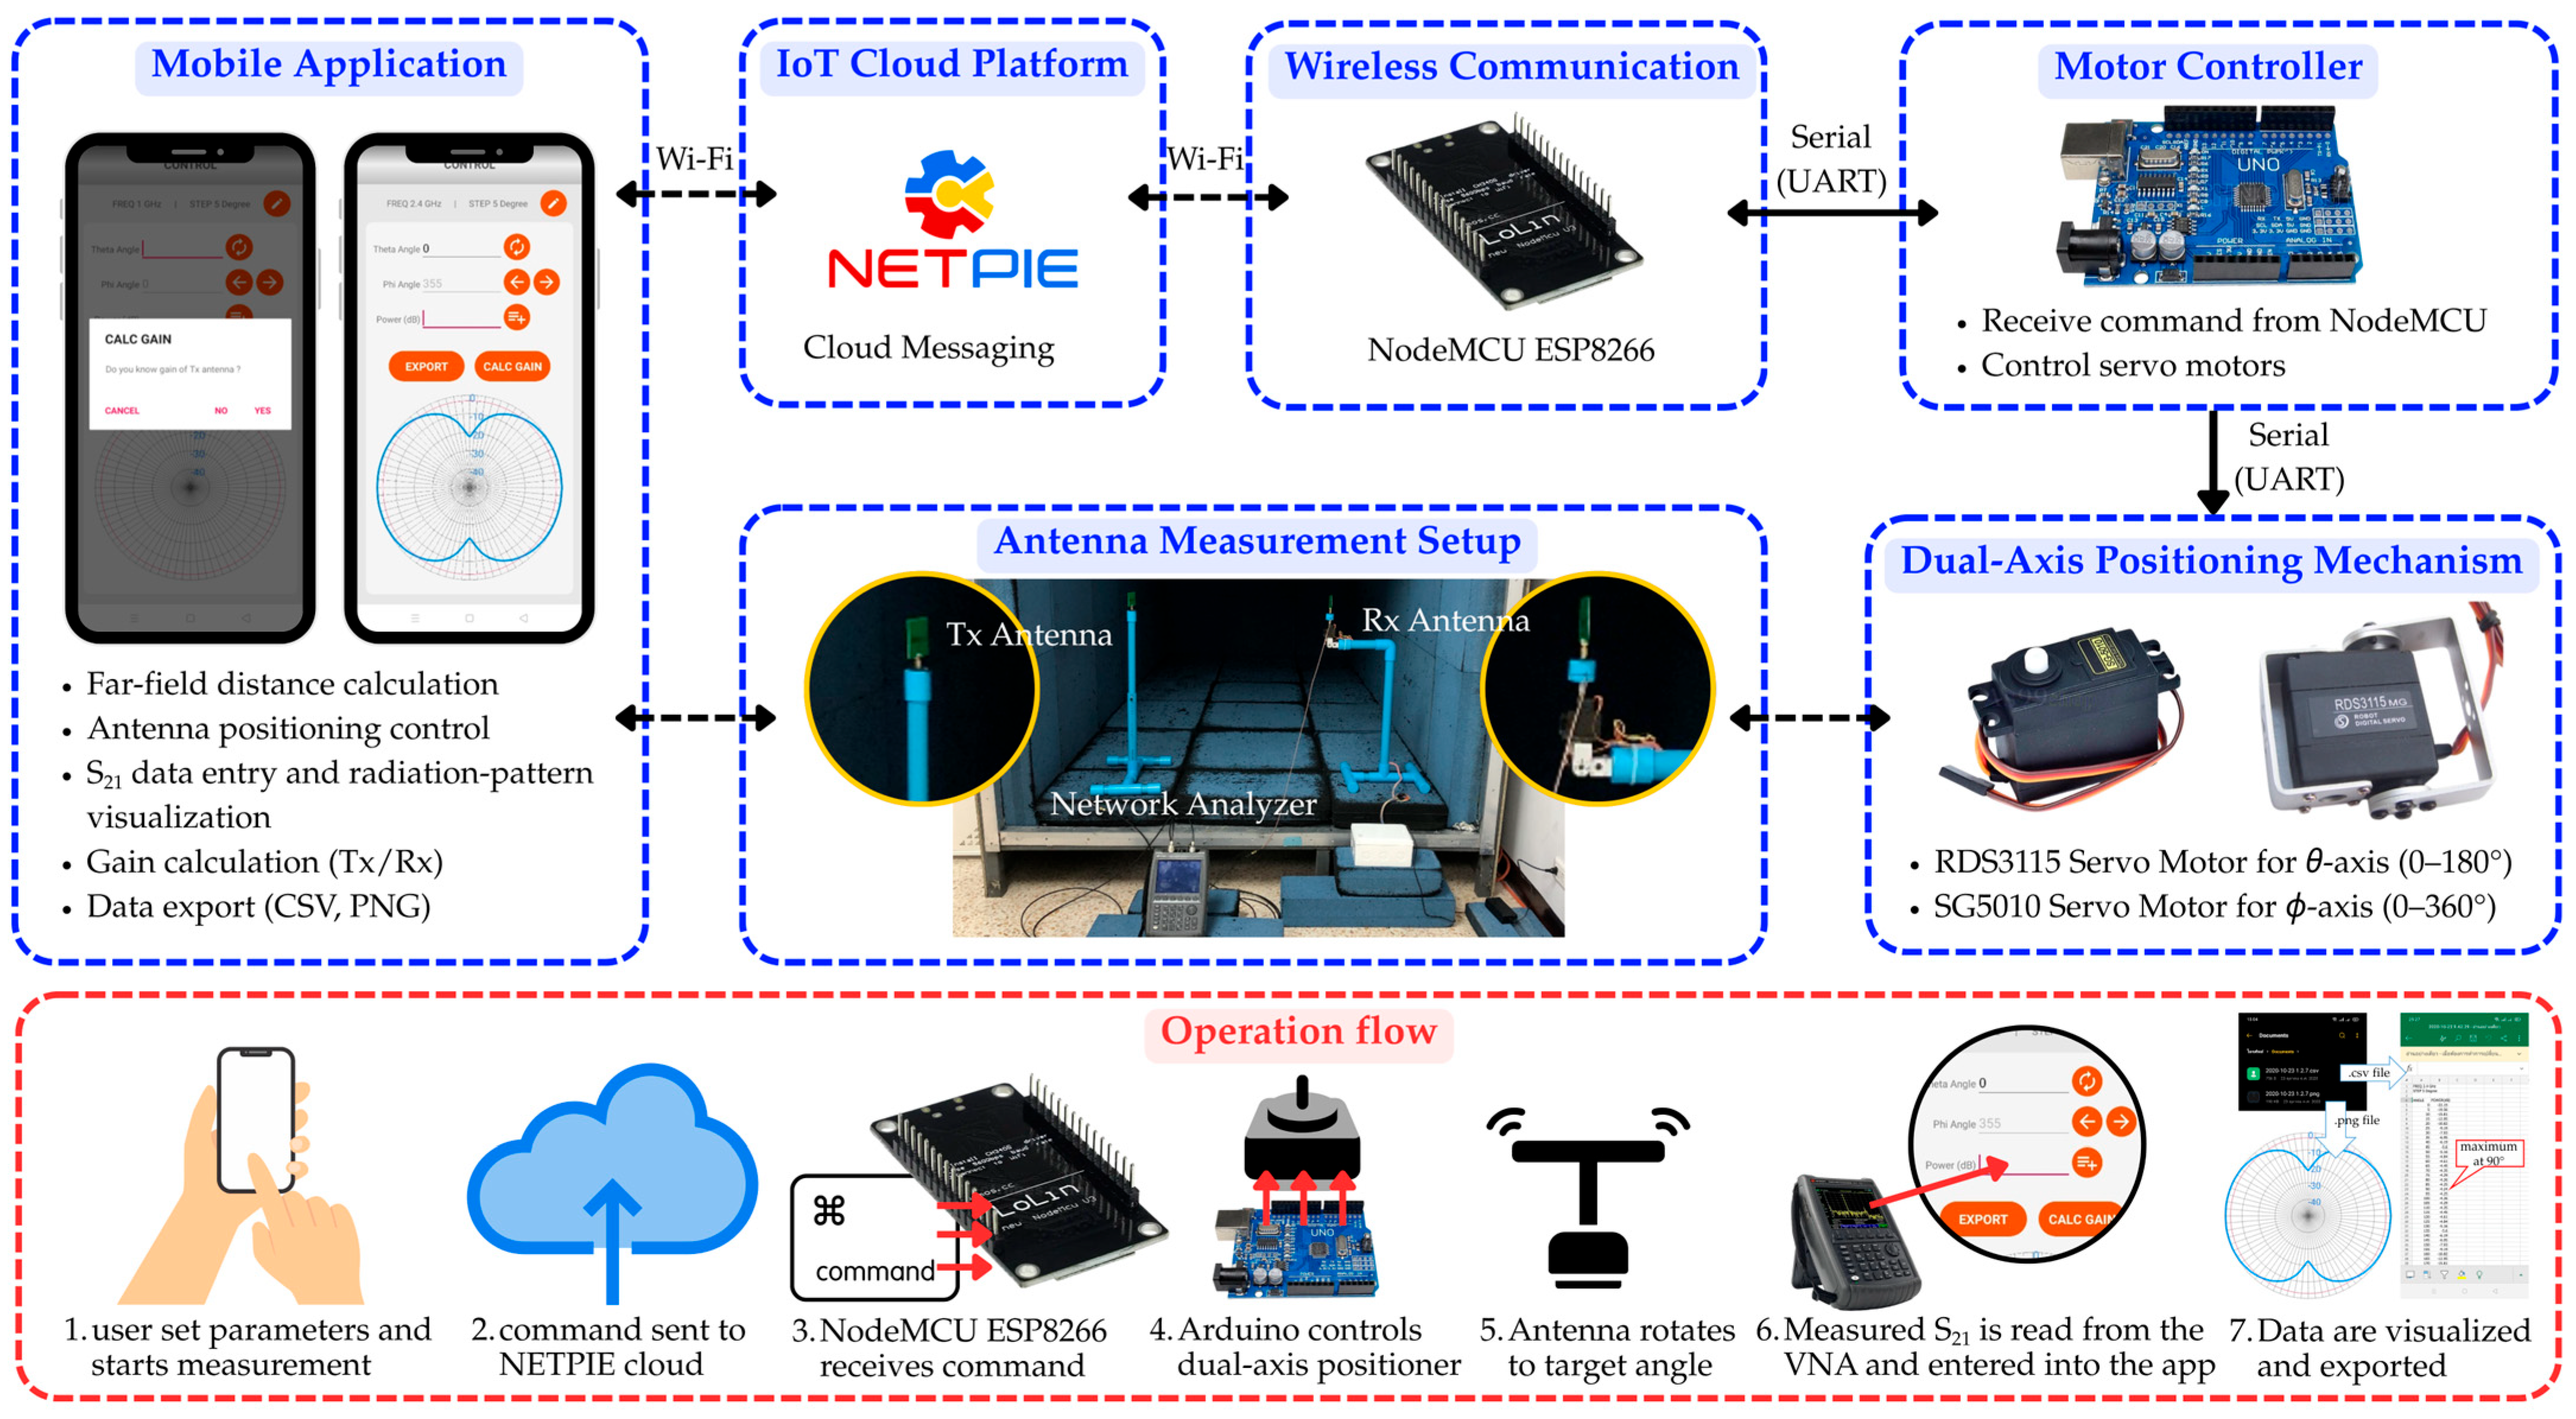
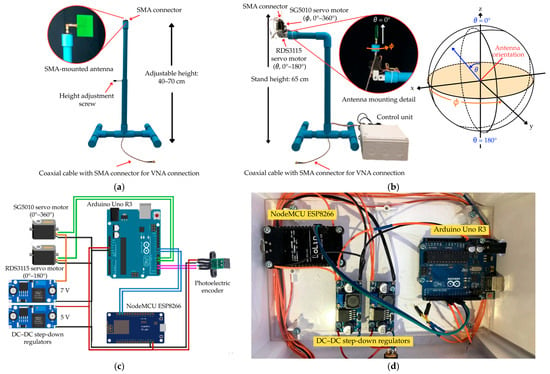
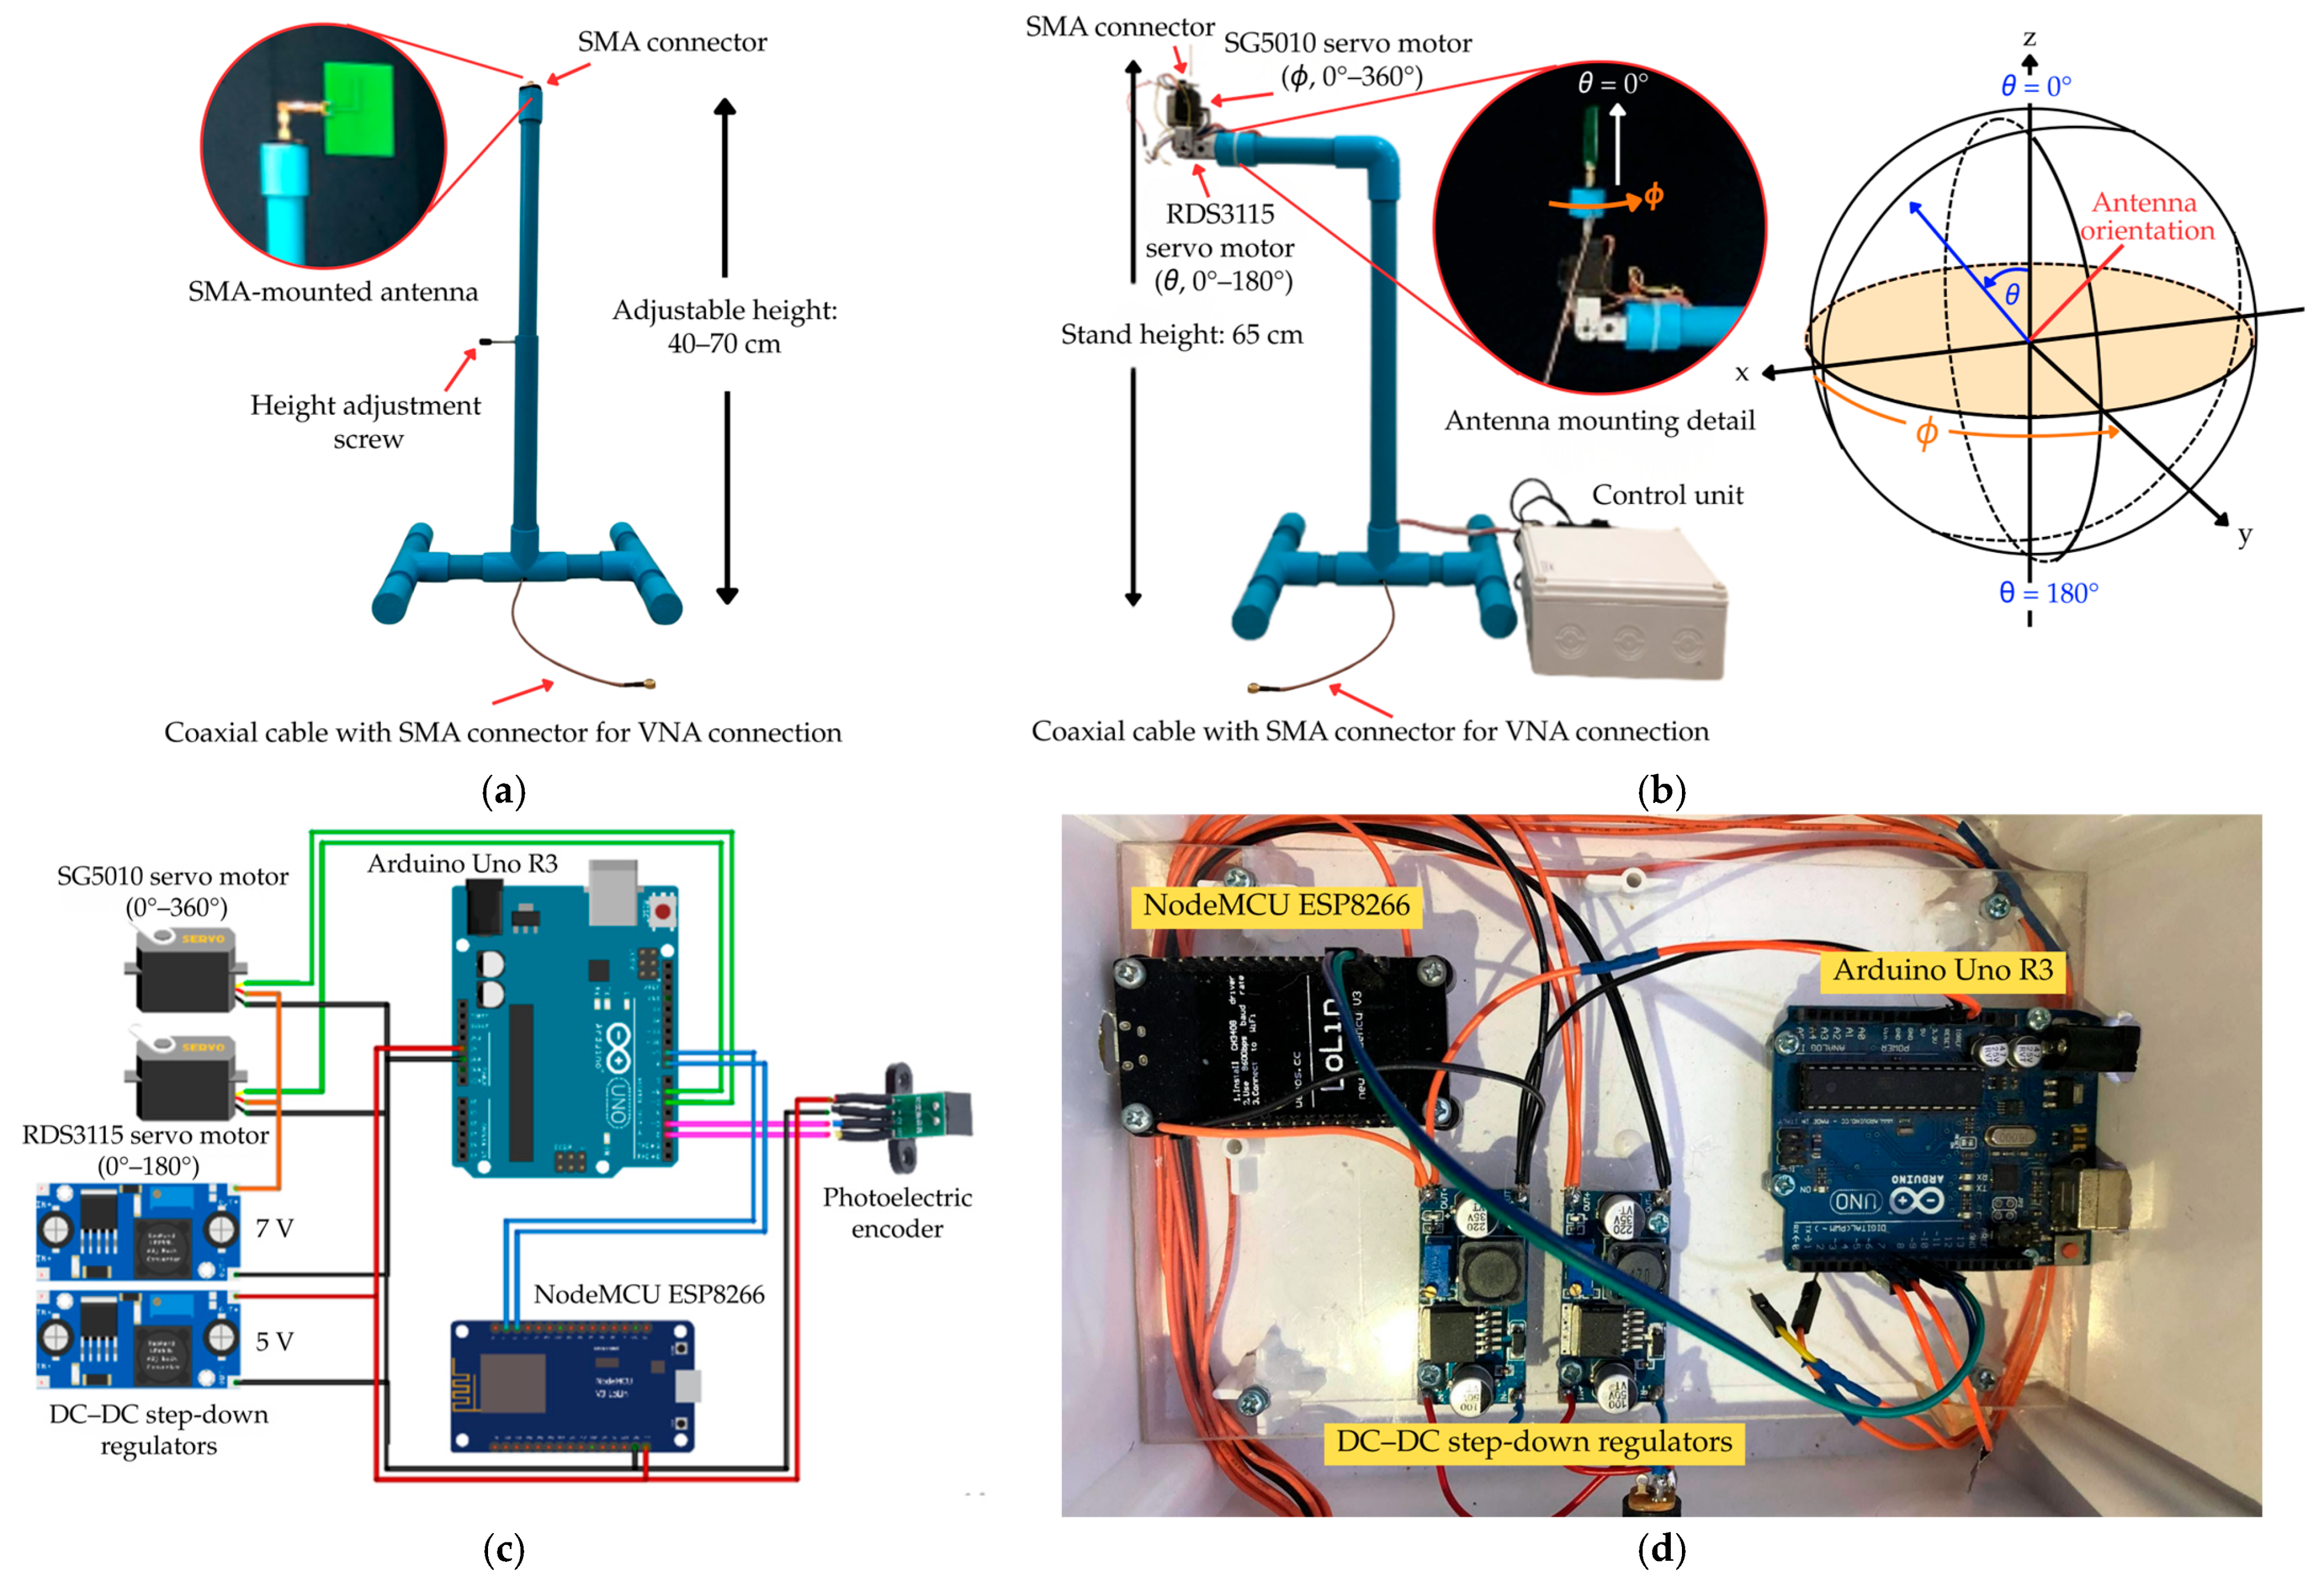
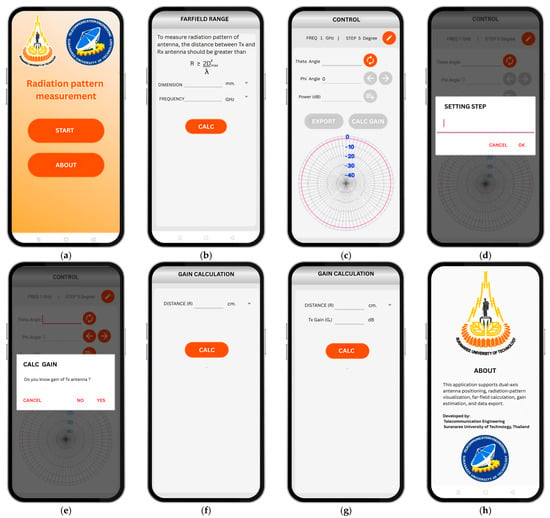
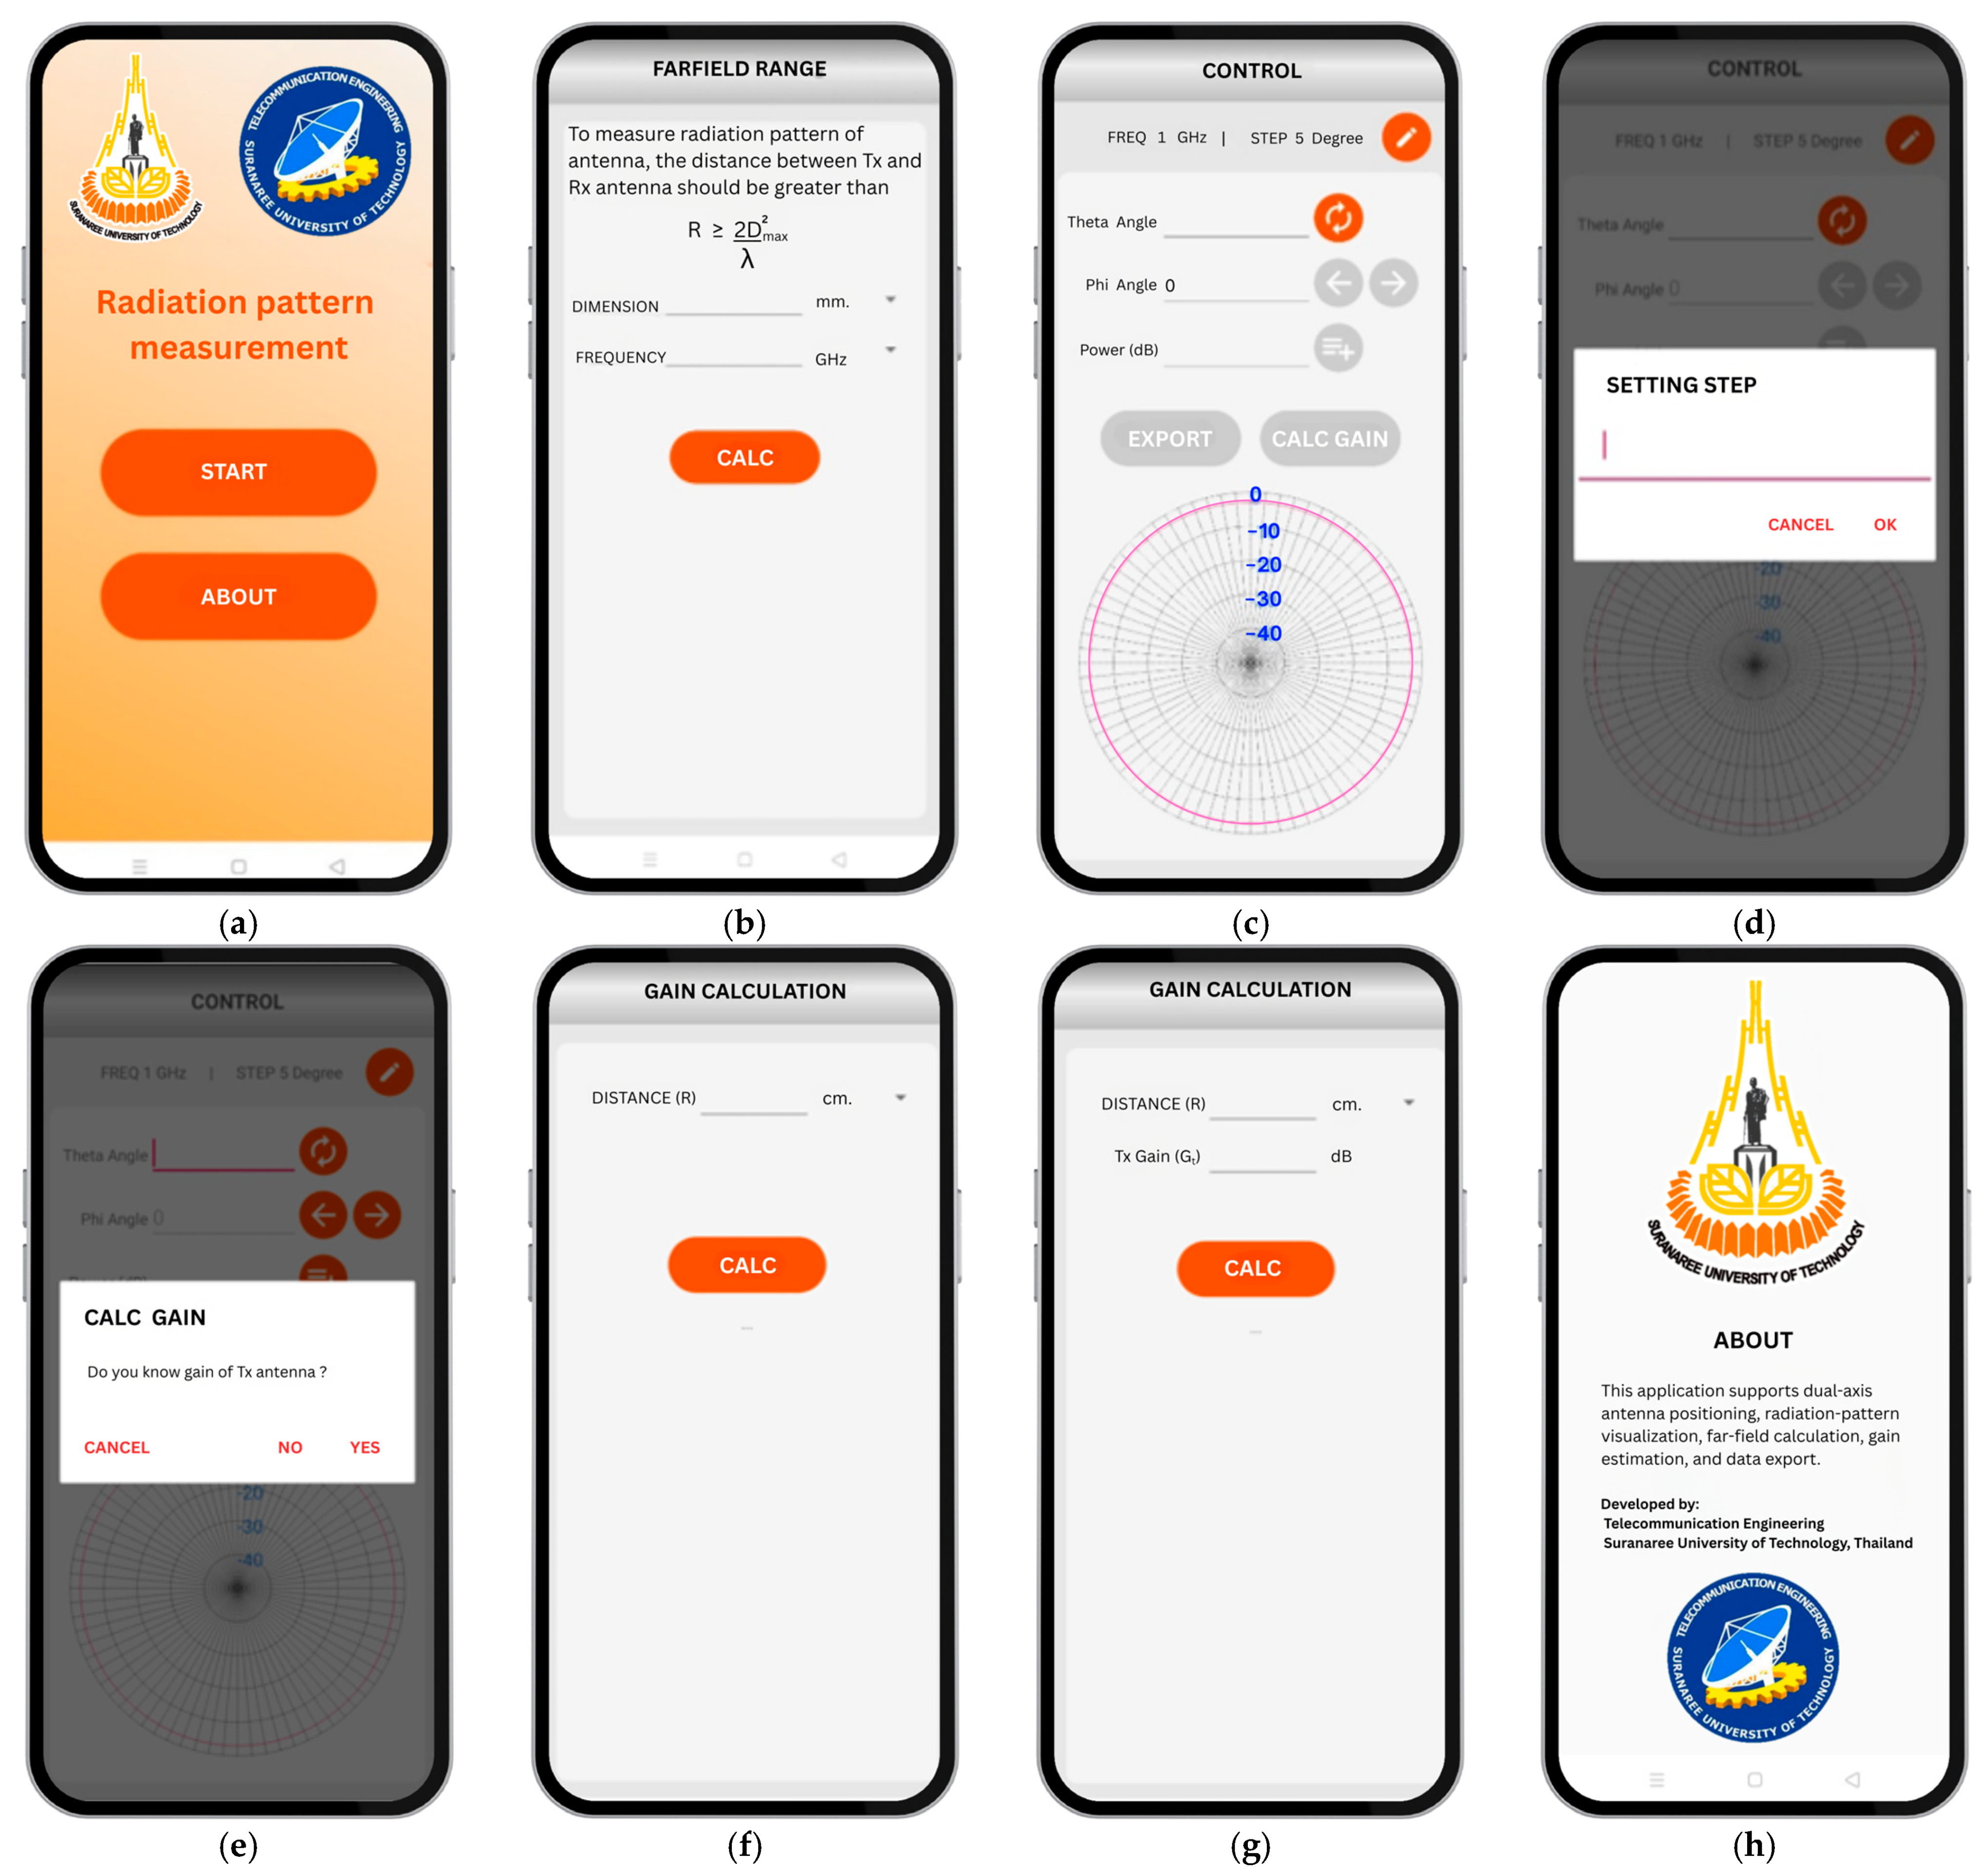
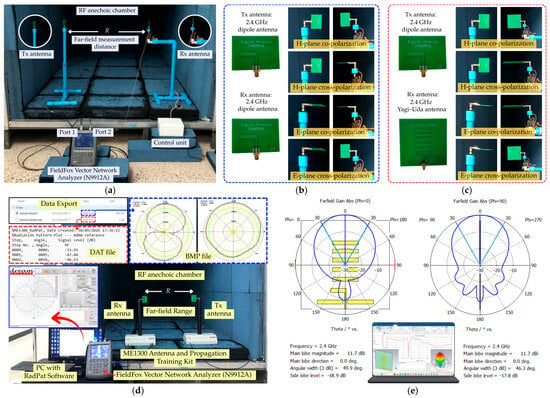
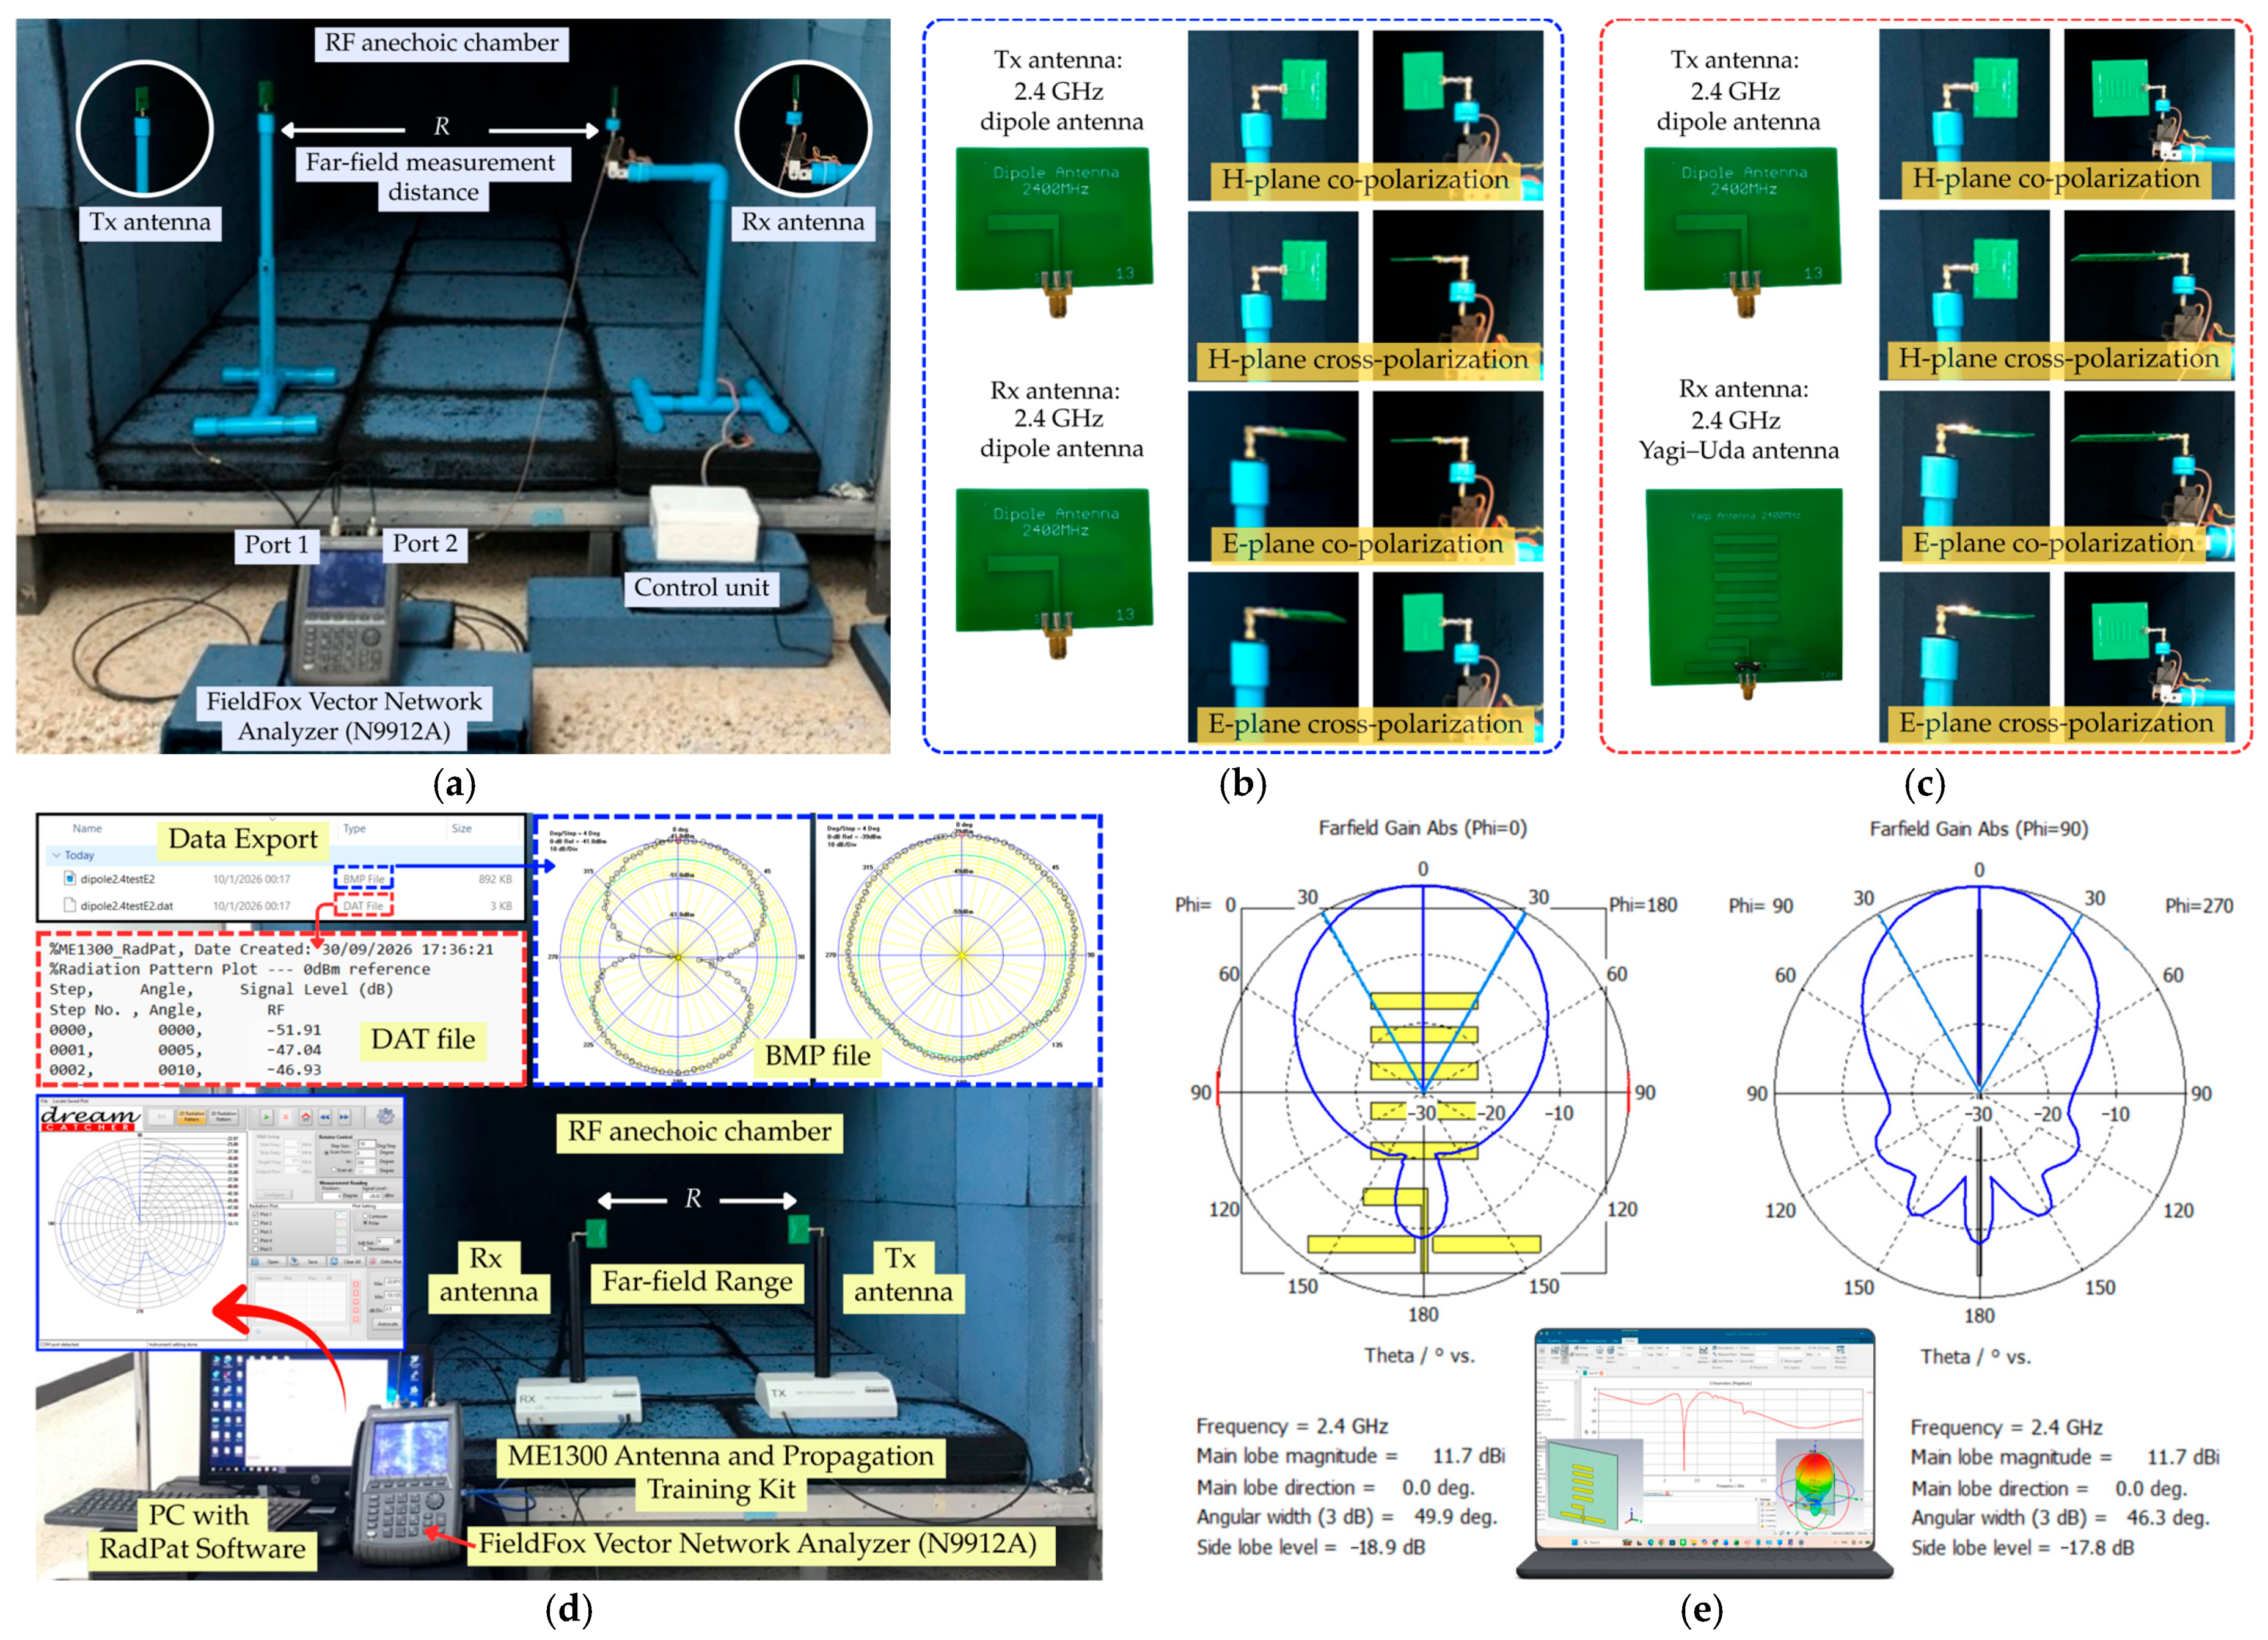
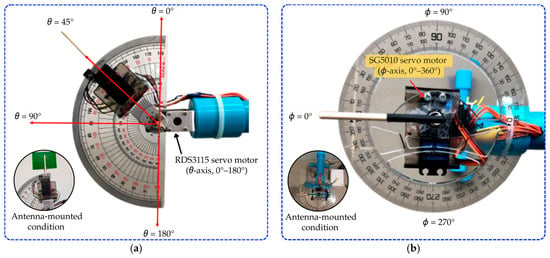
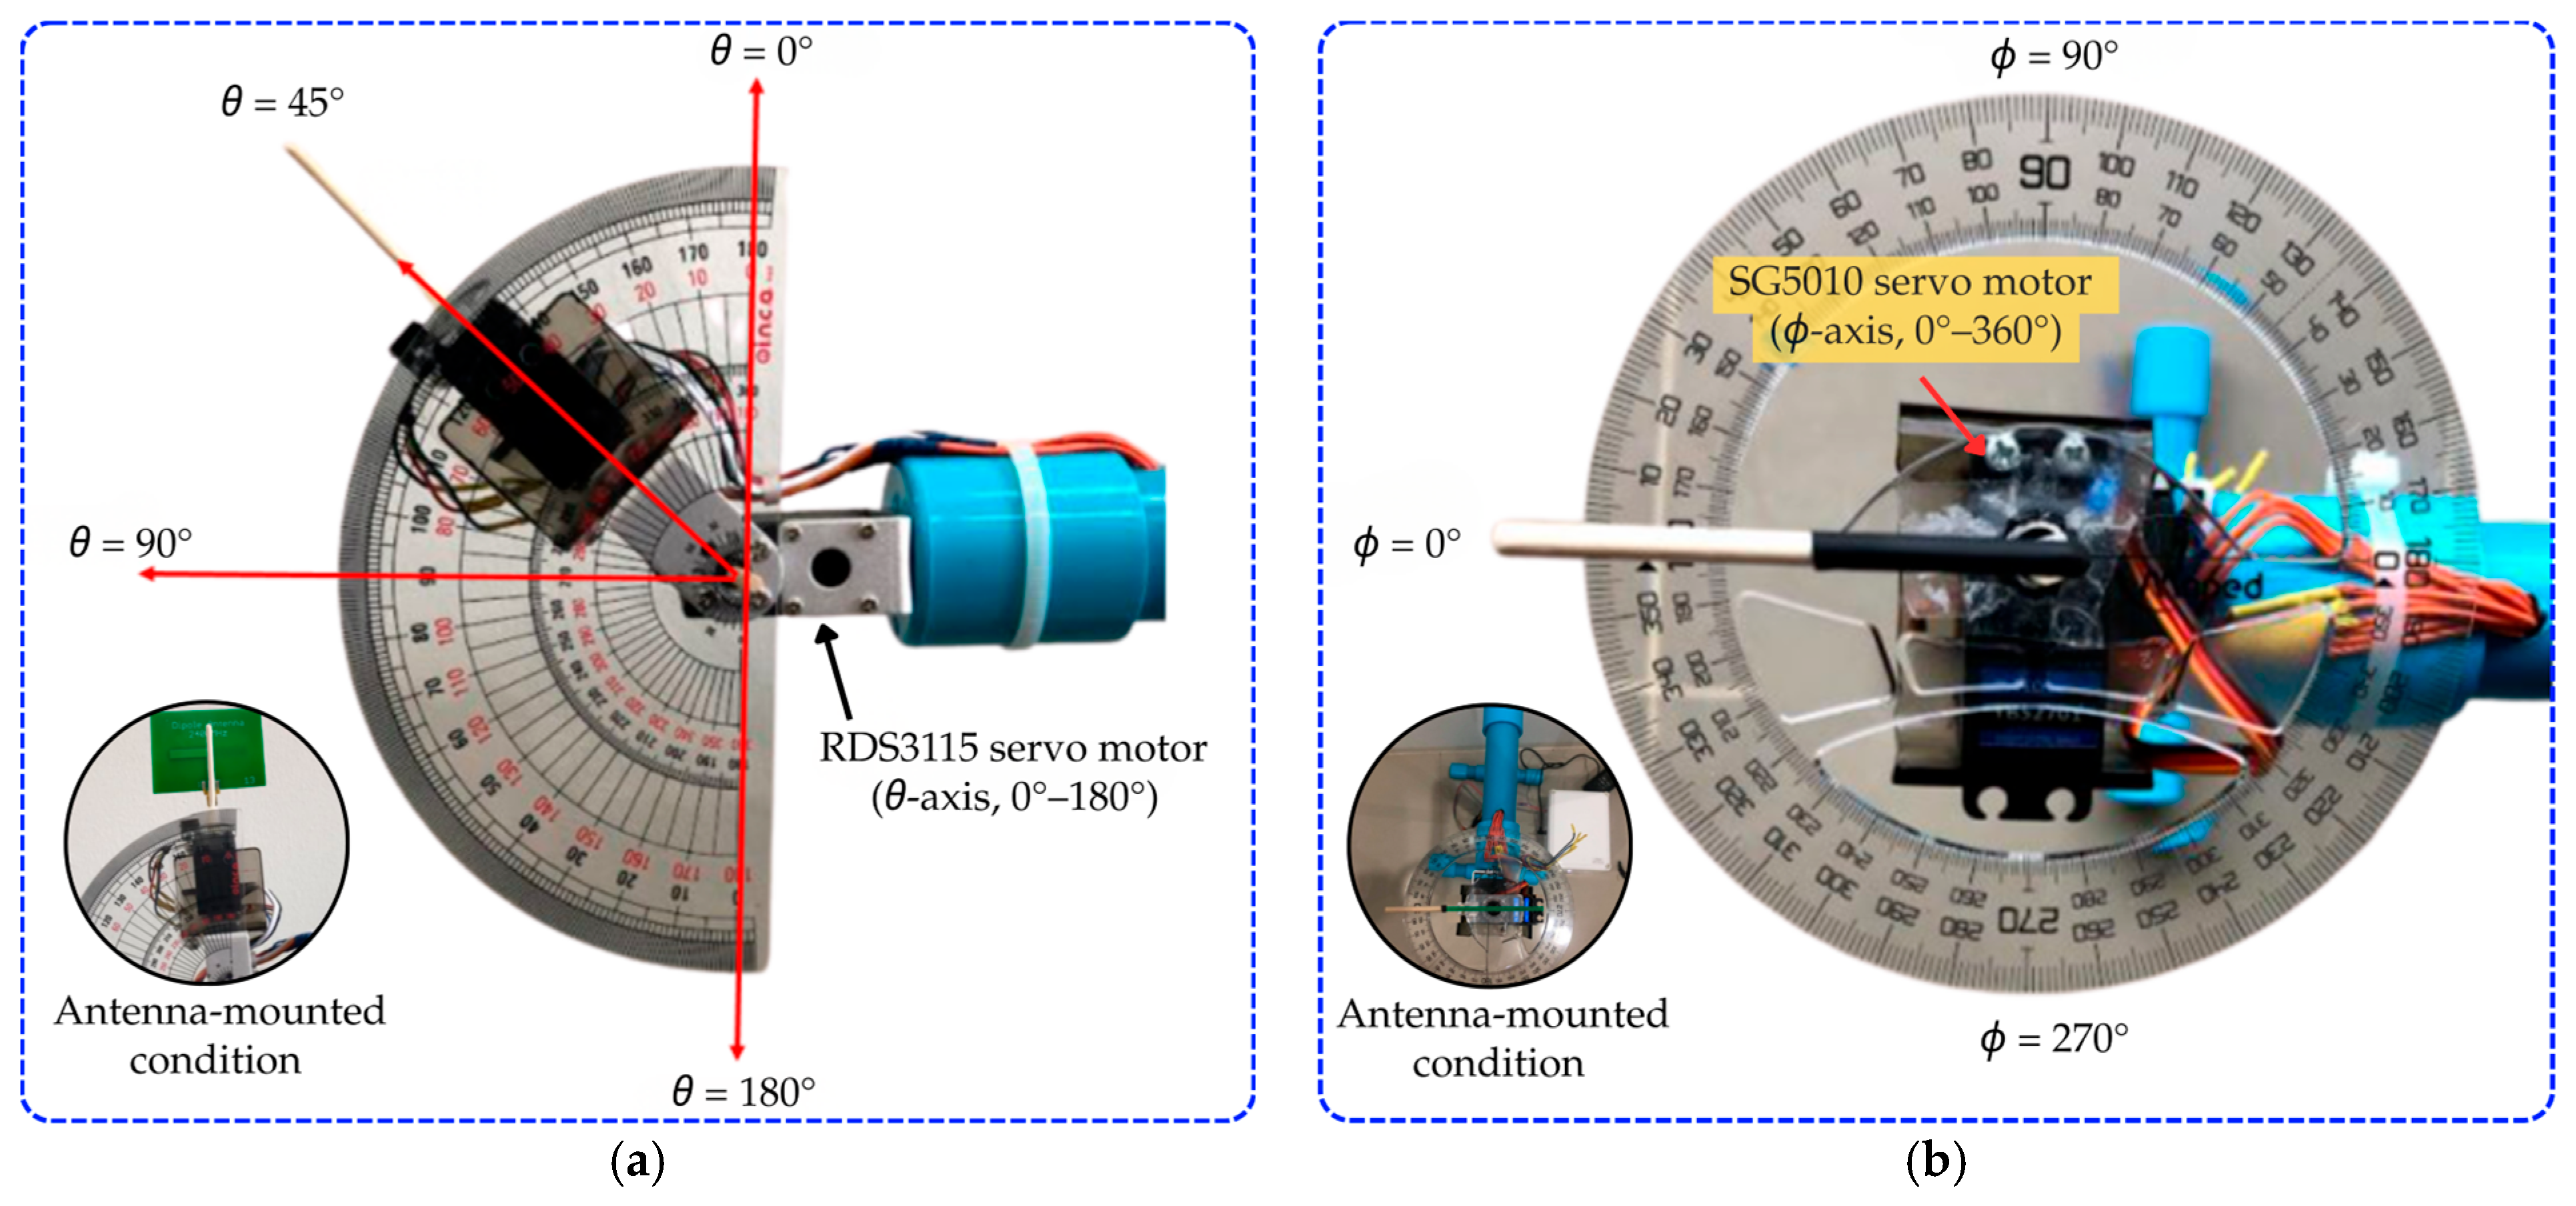
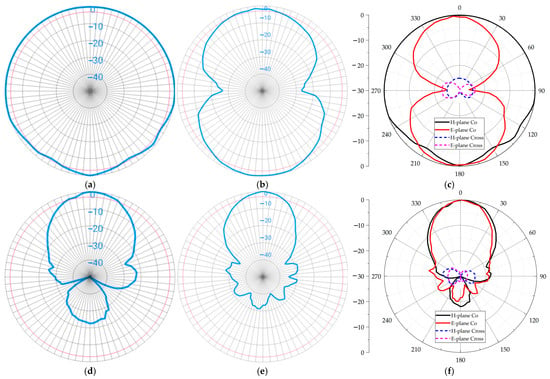
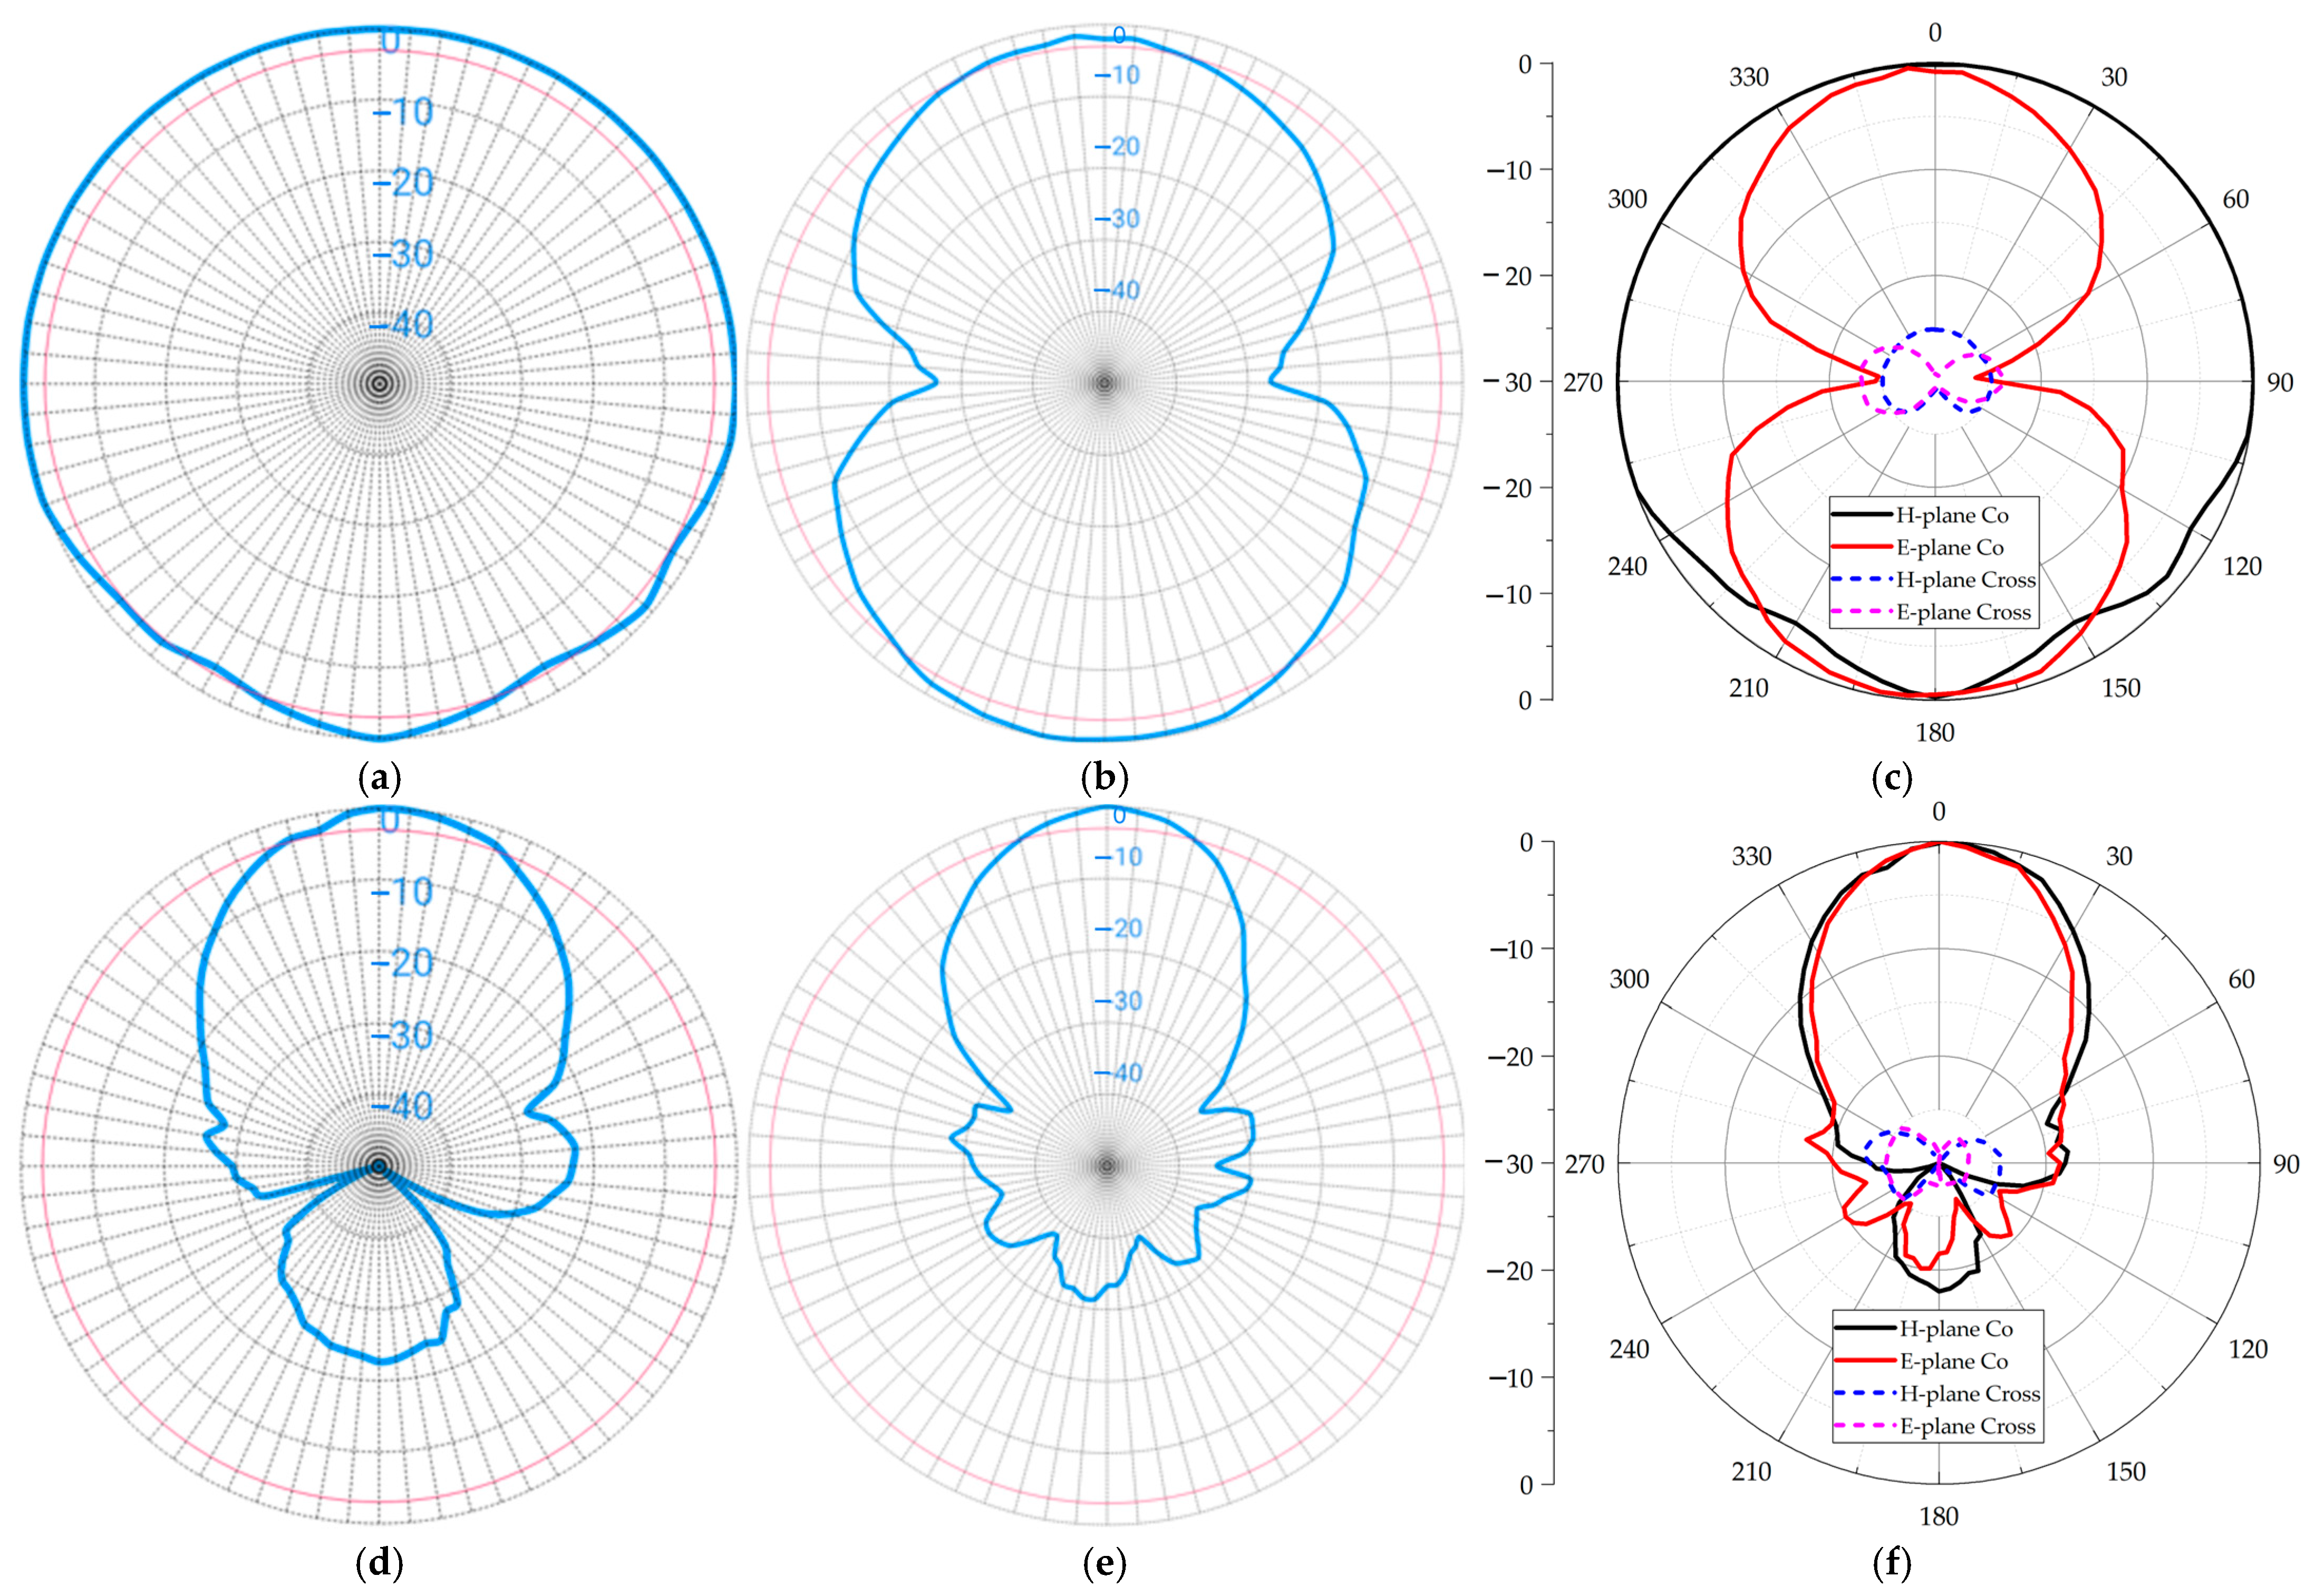
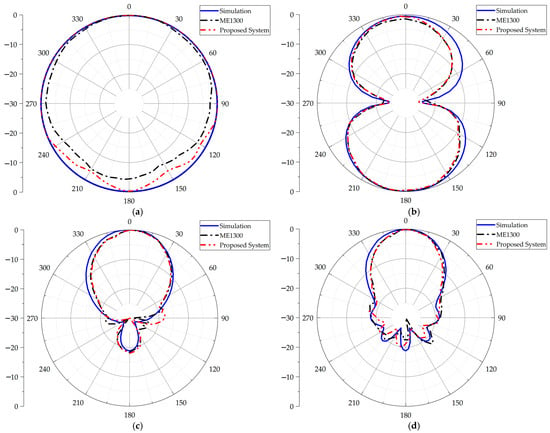
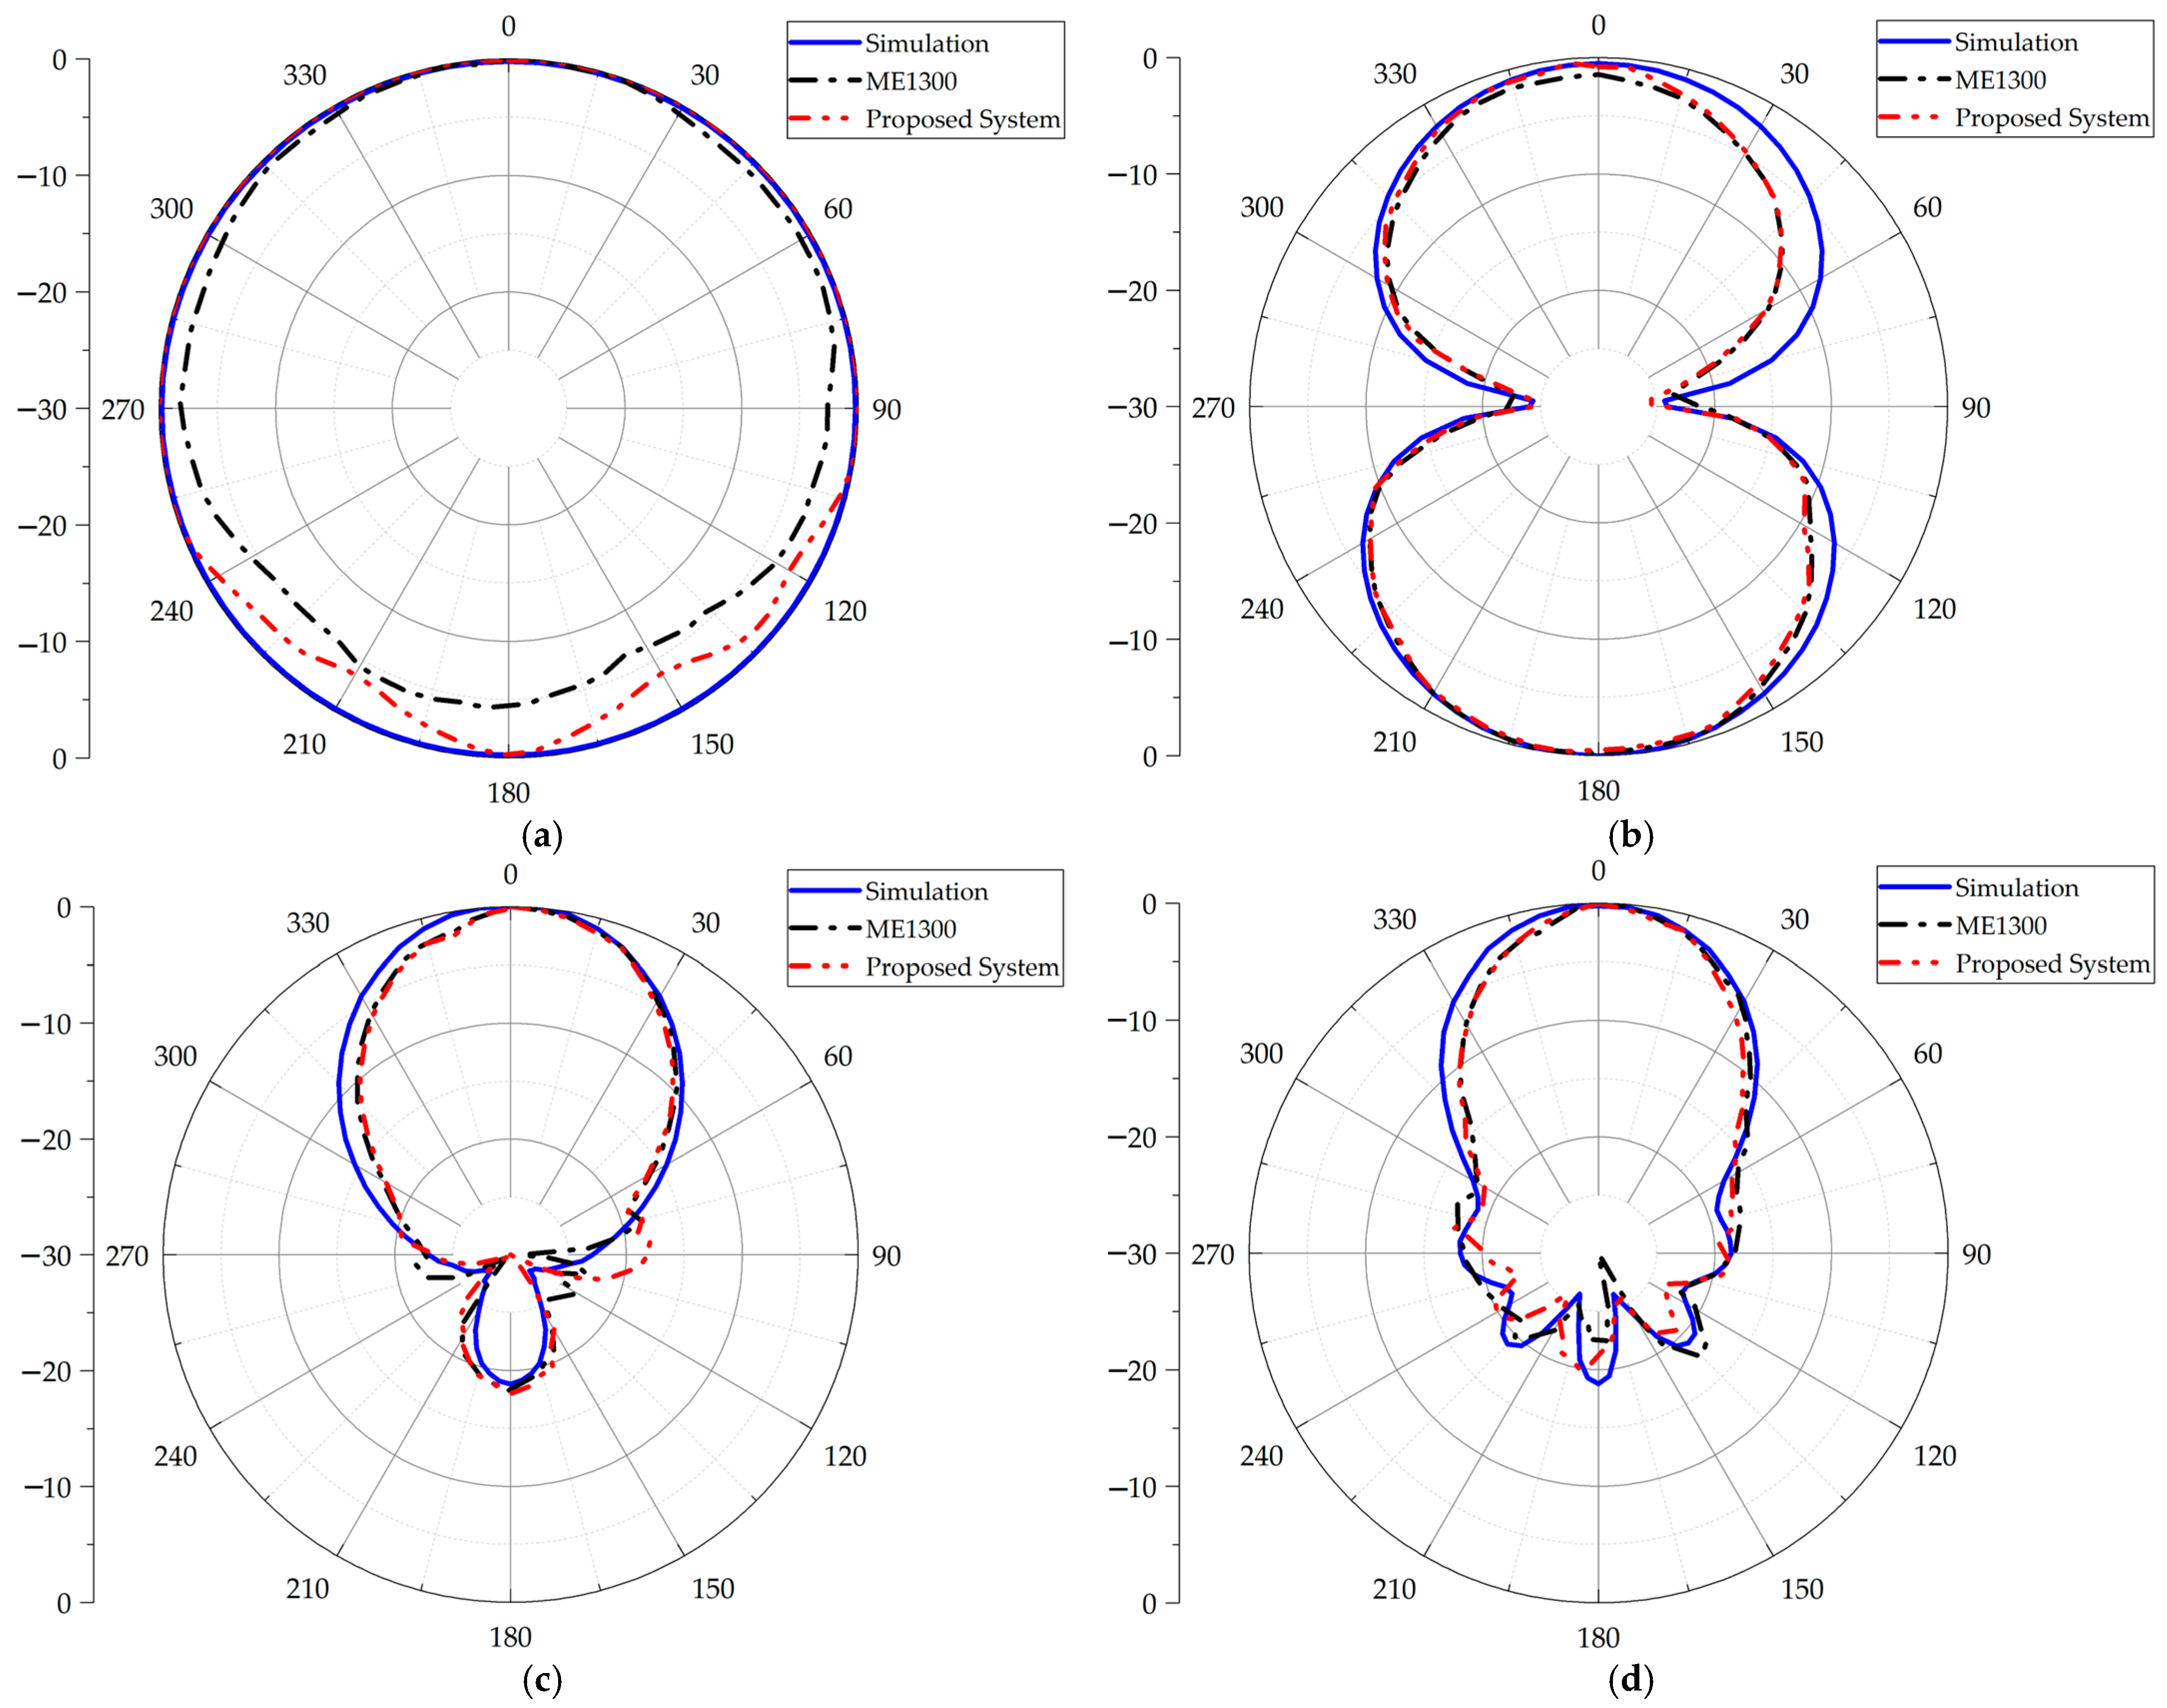
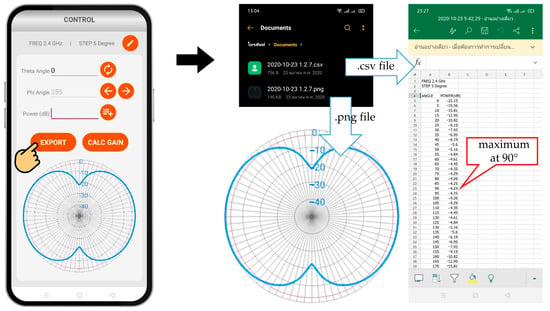
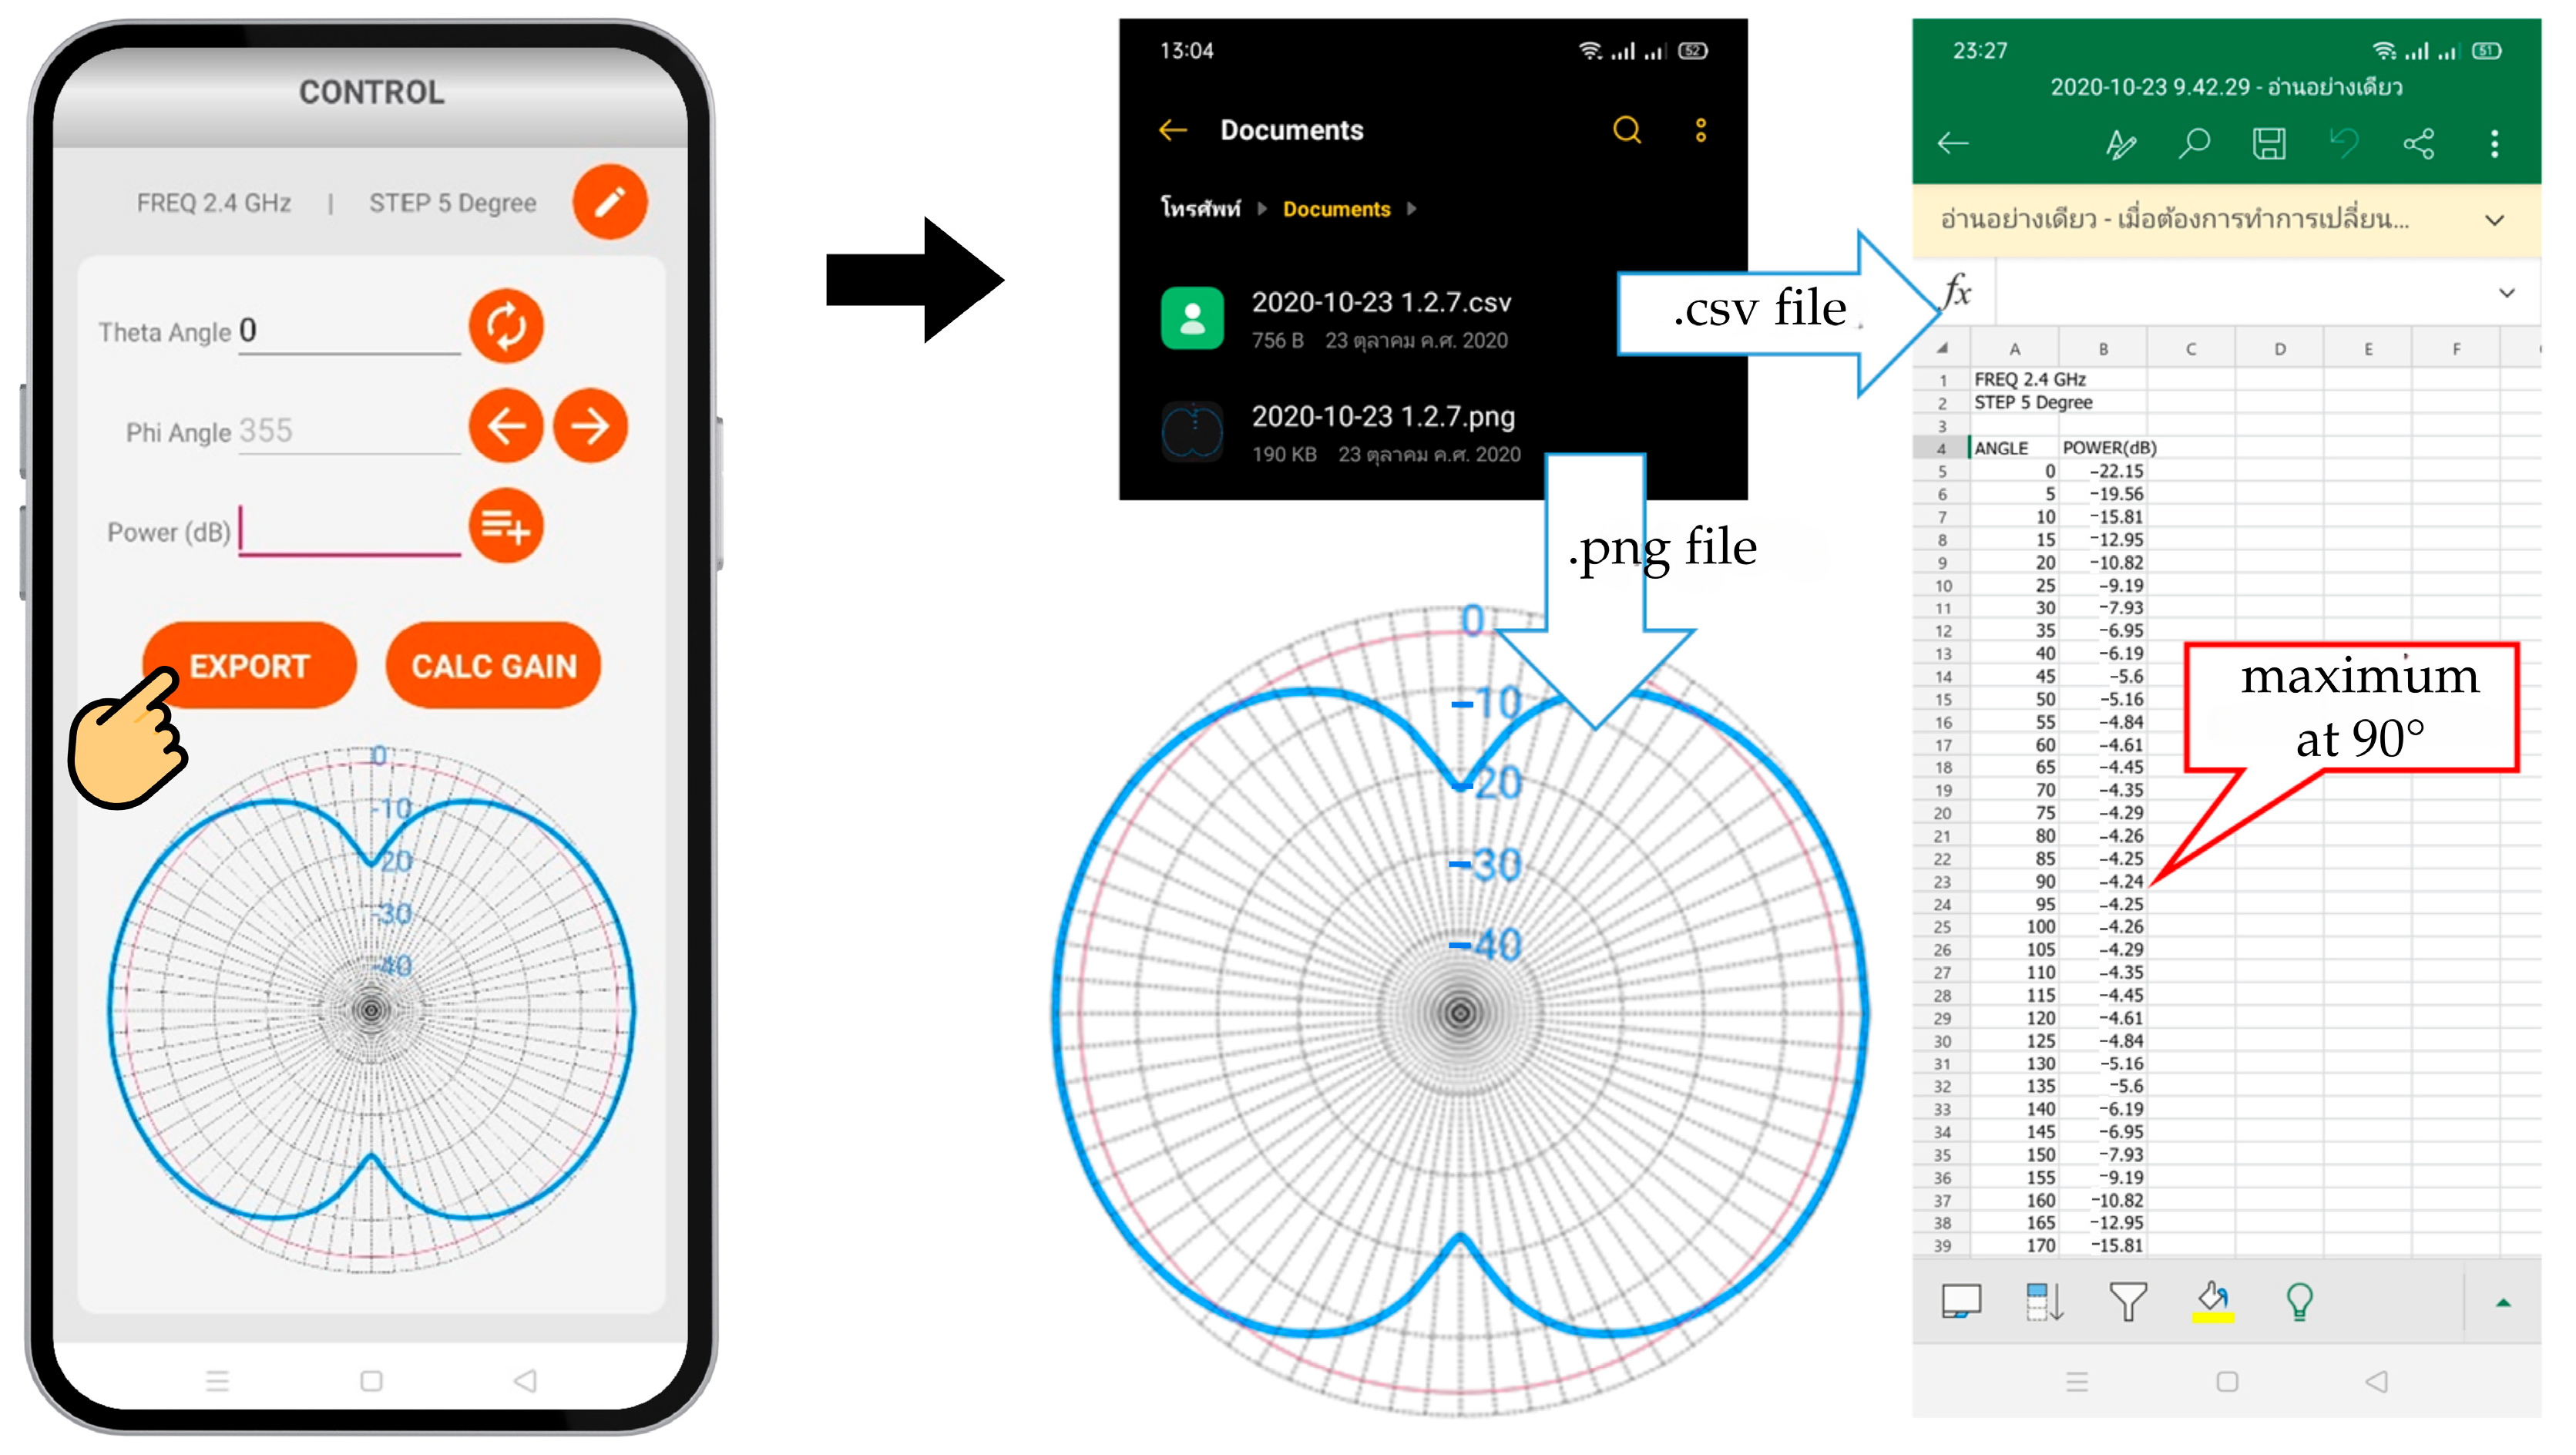

Disclaimer/Publisher’s Note: The statements, opinions and data contained in all publications are solely those of the individual author(s) and contributor(s) and not of MDPI and/or the editor(s). MDPI and/or the editor(s) disclaim responsibility for any injury to people or property resulting from any ideas, methods, instructions or products referred to in the content. |
© 2026 by the authors. Licensee MDPI, Basel, Switzerland. This article is an open access article distributed under the terms and conditions of the Creative Commons Attribution (CC BY) license.