


Abstract
Cyber-physical smart infrastructures integrate sensing devices, communication networks, control components, and service platforms, which makes them vulnerable to malicious activities that may evolve gradually through several attack stages. The objective of this study is to develop and evaluate a simulation-based cybersecurity framework capable of detecting a proposed novel multi-stage cyber attack and identifying its internal progression within a realistic smart infrastructure environment. To achieve this objective, a NetSim-based cyber-physical smart infrastructure was modeled to generate both normal operational traffic and staged malicious traffic. The generated traffic was captured, processed, labeled, and transformed into a stage-aware cybersecurity dataset. An artificial neural network (ANN) model was then trained and evaluated for two detection tasks: binary classification of normal versus attack traffic and multi-class classification of compromise, coordination, and execution attack stages. Twenty experimental configurations were designed to examine the model under progressively broader infrastructure contexts, including sensing, service, gateway, control, backbone, and full-span operational scenarios. The best binary testing performance was achieved in the eighteenth experimental configuration, representing a broad full-span infrastructure scenario, with 97.96% accuracy, 97.80% precision, 97.65% recall, 97.72% F1-score, and 1.06% false positive rate. For stage-aware multi-class detection, the ANN model achieved 96.97% accuracy, 96.36% macro-averaged precision, 96.20% macro-averaged recall, 96.28% macro-averaged F1-score, and 96.55% weighted F1-score. Macro-averaged metrics report the unweighted average performance across classes, while weighted F1-score accounts for class support. These results show that the proposed simulation-based framework can generate realistic attack-aware traffic data and support reliable ANN-based detection of both attack presence and attack-stage progression.
1. Introduction
Cyber-physical smart infrastructure environments have become a fundamental component of modern intelligent systems because they integrate sensing devices, communication networks, control mechanisms, and digital service platforms into a unified operational ecosystem [1]. Such environments are widely adopted in smart campuses, industrial facilities, healthcare systems, transportation infrastructures, and public safety networks due to their ability to support real-time monitoring, automated decision-making, rapid service coordination, and efficient resource utilization [2]. By enabling continuous data exchange among heterogeneous devices and services, these infrastructures improve operational awareness, enhance response efficiency, reduce manual intervention, and support more adaptive management of complex physical processes [3]. This high degree of interconnectivity, service integration, and distributed intelligence also expands the cyber exposure of the infrastructure and increases the number of potential entry points that can be exploited by malicious actors [4].
Despite their operational advantages, cyber-physical smart infrastructures remain highly vulnerable to sophisticated malicious activities, particularly when the hostile behavior is not instantaneous but unfolds in multiple stages [5]. In such environments, malicious actions may begin with subtle compromise attempts, then evolve through coordination and preparation phases, and finally reach disruptive execution stages that affect services, control traffic, and infrastructure stability [6]. The main problem is that these malicious behaviors often blend with legitimate traffic generated by sensors, gateways, servers, user endpoints, and management services, making early discrimination extremely difficult [7]. As the infrastructure becomes broader and more heterogeneous, the overlap between normal operational patterns and malicious traffic further increases, which weakens the effectiveness of simplistic detection mechanisms [8]. Accordingly, there is a pressing need for intelligent detection frameworks capable of recognizing both the overall presence of the proposed novel multi-stage cyber attack and the internal progression of its malicious stages within realistic smart infrastructure conditions [9].
Traditional cybersecurity mechanisms, including signature-based intrusion detection, rule-driven filtering, threshold monitoring, and shallow statistical anomaly detection, have provided useful protection in conventional environments, but they suffer from important limitations when applied to cyber-physical smart infrastructures [10]. Signature- and rule-based methods depend heavily on prior knowledge of known malicious patterns and are therefore less effective against newly designed or evolving hostile scenarios [11]. Likewise, fixed-threshold monitoring often struggles with highly dynamic environments in which legitimate traffic fluctuations may resemble suspicious activity, while basic machine learning or handcrafted statistical approaches may fail to capture the nonlinear and stage-dependent relationships embedded in heterogeneous infrastructure traffic [12]. These limitations become more severe when the detection problem requires not only binary discrimination between benign and malicious traffic, but also stage-aware recognition of the internal progression of the proposed novel multi-stage cyber attack [13]. As a result, traditional methods may exhibit reduced sensitivity, higher false-alarm rates, and weaker generalization under complex operational conditions [14].
To address these challenges, this work adopts a simulation-driven artificial neural network (ANN)-based detection framework that is capable of learning complex traffic representations from a controlled yet realistic cyber-physical smart infrastructure environment. The proposed direction is suitable because ANN models can capture nonlinear feature interactions, adapt to multidimensional traffic behavior, and provide robust discrimination under diverse operational scenarios. By combining infrastructure-aware simulation, structured benign and malicious traffic generation, feature engineering, and ANN-based learning, the proposed framework creates a reproducible foundation for detecting the proposed novel multi-stage cyber attack in both binary and stage-aware multi-class settings. More broadly, this methodological domain offers a practical pathway for intelligent cybersecurity analysis in smart infrastructures, since it supports robust evaluation under progressively broader scenario configurations while preserving the flexibility needed for future extensions toward real-time monitoring, adaptive defense, and cross-environment deployment.
The main contributions of this work are summarized as follows:
- We propose a simulation-driven framework for modeling a multi-stage attack scenario in cyber-physical smart infrastructure and detecting its staged traffic behavior, where the simulated adversarial process evolves through compromise, coordination, and execution stages.
- We generate a simulation-based, stage-aware cybersecurity dataset from benign and scenario-driven malicious traffic traces, supporting both binary attack detection and multi-class attack-stage recognition.
- We design twenty progressively broader infrastructure configurations to evaluate the proposed dataset and detection framework across sensing, service, gateway, control, backbone, and full-span operational contexts.
- We evaluate the generated dataset using an ANN model and baseline classifiers, demonstrating strong binary and stage-aware detection performance, low false-positive behavior, and stable generalization.
The remainder of this paper is organized as follows. Section 2 reviews related work on simulation-based cybersecurity, intrusion detection, IoT security, and multi-stage attack detection. Section 3 presents the proposed methodology, including the NetSim-based cyber-physical smart infrastructure 14.1, normal traffic modeling, proposed multi-stage attack design, dataset generation, preprocessing, ANN architecture, and evaluation procedure. Section 4 reports and discusses the experimental results for binary and stage-aware multi-class detection across the twenty infrastructure configurations. Finally, Section 5 concludes the paper and outlines potential future research directions.
2. Literature Review
Hashmi and Tiwari (2026) [15] proposed a Digital Twin-integrated framework for detecting both insider and external cyber threats in critical infrastructure environments through synchronized virtual monitoring and hybrid anomaly analysis. The study is related to our work because it focuses on intelligent cyber threat detection in infrastructure-oriented environments. Their experimental results reported detection accuracies of 95.2% for insider threats and 97.1% for external threats, while the false positive rate remained below 2%, indicating strong detection reliability. However, the work mainly emphasizes Digital Twin-based dual-threat monitoring and does not address simulation-driven ANN-based modeling of a novel multi-stage attack or stage-aware dataset construction. In contrast, our work focuses on simulation-driven traffic generation, explicit compromise, coordination, and execution attack stages, and ANN-based binary and multi-class detection in cyber-physical smart infrastructure.
Panda and Muthuraman (2026) [16] proposed a multiclass machine learning framework for detecting routing attacks in RPL-based IoT networks using a novel simulation-driven dataset generated in the Cooja environment. The study is related to our work because it relies on simulation-based dataset construction and intelligent attack detection in IoT environments. Their framework considered five traffic classes, namely normal traffic, Blackhole, Lowered Rank, Version Number manipulation, and Flooding, and used fifteen classifiers with several ensemble methods for evaluation. The reported dataset contained 30,240 labeled samples with perfect class balance at 6048 samples per class, and the authors concluded that ensemble models achieved the best generalization and prediction performance. However, the work focuses specifically on RPL routing attacks in low-power IoT networks and does not address cyber-physical smart infrastructure, explicit multi-stage attack progression, or ANN-based binary and stage-aware detection. In contrast, our work emphasizes simulation-driven traffic generation, compromise, coordination, and execution-stage modeling, and ANN-based detection of the proposed novel multi-stage cyber attack.
Logeswari et al. (2025) [17] proposed a comprehensive intrusion detection framework for IoT environments using hybrid feature selection and multi-stage classification techniques to improve attack discrimination across complex traffic patterns. The framework integrates Quantum-Inspired Particle Swarm Optimization with Enhanced Recurrent Neural Networks, Adaptive Neuro-Fuzzy Inference System, and Capsule Networks to strengthen feature quality and classification performance. Experimental results on the TON_IoT dataset achieved 98.83% accuracy, 98.56% precision, and 98.65% F-measure, while on the BoT-IoT dataset the framework achieved 98.6% accuracy, 98.5% precision, and 98.94% F-measure. However, the work focuses on IoT intrusion detection using benchmark datasets and does not develop a simulation-driven ANN-based framework for detecting a proposed novel multi-stage cyber attack within cyber-physical smart infrastructure. In contrast, our work emphasizes realistic traffic generation, stage-specific attack progression, and ANN-based binary and multi-class detection in a simulation-driven smart infrastructure setting.
Abou Elasaad et al. (2025) [18] proposed AegisGuard, a multi-stage hybrid intrusion detection system for Industrial IoT security that combines optimized feature selection with an ensemble of Random Forest, Extra Trees, LightGBM, XGBoost, and CatBoost to improve attack detection robustness. The framework is strongly related to our work because it explicitly adopts a multi-stage intrusion detection design in an IoT-oriented environment and emphasizes intelligent classification of complex attack behavior. Experimental results showed an average accuracy of 99.71%, closely aligned precision, recall, and F1-score values, a very low false positive rate of 0.0078, and an AUC-ROC of 0.9998, indicating highly reliable intrusion detection performance. However, the work focuses on Industrial IoT security using an optimized hybrid ensemble model and does not develop a simulation-driven ANN-based framework for cyber-physical smart infrastructure with explicit compromise, coordination, and execution-stage modeling. In contrast, our work emphasizes realistic traffic generation, stage-specific attack progression, and ANN-based binary and multi-class detection of the proposed novel multi-stage cyber attack.
Injadat et al. (2020) [19] proposed a multi-stage optimized machine learning framework for network intrusion detection that integrates data balancing, feature selection, training sample reduction, and hyperparameter optimization to improve detection efficiency and accuracy. The study is strongly related to our work because it adopts a staged intrusion detection design and focuses on improving intelligent attack detection under complex network traffic conditions. Experimental results on the CICIDS2017 and UNSW NB15 datasets showed detection accuracies above 99%, while the framework reduced the required training sample size by up to 74% and the feature set size by up to 50%, with reported improvements of about 1% to 2% in accuracy and a lower false alarm rate compared with recent literature. However, the work focuses on optimized machine learning for general network intrusion detection and does not develop a simulation-driven ANN-based framework for cyber-physical smart infrastructure with explicit compromise, coordination, and execution-stage modeling. In contrast, our work emphasizes realistic traffic generation, stage-specific attack progression, and ANN-based binary and multi-class detection of the proposed novel multi-stage cyber attack.
Christy et al. (2025) [20] proposed a machine-learning-based multi-stage intrusion detection system for cloud-assisted vehicular ad hoc networks that combines feature selection with an ensemble Random Forest-based security framework to improve real-time attack recognition. The study is strongly related to our work because it explicitly adopts a multi-stage intrusion detection strategy and focuses on intelligent classification of complex attack behavior in connected networked environments. Their results showed that the proposed MLIDS-RFA framework achieved high detection performance, reduced false positives, lowered processing overhead, and improved response time through the selection of the most informative features before classification. However, the work focuses on cloud-assisted vehicular ad hoc networks and Random Forest-based ensemble learning, and does not develop a simulation-driven ANN-based framework for cyber-physical smart infrastructure with explicit compromise, coordination, and execution-stage modeling. In contrast, our work emphasizes realistic traffic generation, stage-specific attack progression, and ANN-based binary and multi-class detection of the proposed novel multi-stage cyber attack.
3. Methodology
This section presents the methodology of the proposed simulation-based cybersecurity framework for detecting novel multi-stage attacks in cyber-physical smart infrastructure environments. In this study, the term simulation-based framework refers to a complete experimental environment in which NetSim is used to model the cyber-physical smart infrastructure, generate normal and malicious traffic, embed the proposed multi-stage cyber attack, extract traffic features, construct labeled datasets, and evaluate the ANN-based cybersecurity detection model under controlled conditions. The methodological design is structured as an end-to-end workflow that begins with modeling the infrastructure environment and defining the attack scenario within a controlled simulation platform, followed by traffic generation, attack embedding, traffic capture, dataset construction, preprocessing, ANN-based learning, and performance evaluation. Rather than treating cyber attacks as isolated events, the proposed methodology models malicious behavior as a progressive and temporally evolving process, enabling the generation of realistic traffic patterns that capture both benign operation and successive attack stages. This design supports a rigorous experimental setting in which the relationship between infrastructure behavior, adversarial activity, and learning-based detection can be systematically analyzed. In addition, the methodology is developed to ensure methodological transparency, reproducibility, and consistency across all experimental phases, thereby providing a reliable basis for evaluating the effectiveness of the proposed ANN-based detection framework.
Figure 1 illustrates the overall architecture of the proposed CP-NetEmul cyber-physical smart infrastructure testbed, showing how the simulation environment, attack execution logic, data acquisition process, and ANN-based cybersecurity analytics are integrated into one reproducible workflow. The architecture is organized into several functional planes and zones. The management and control plane contains the scenario controller, traffic generator driver, and virtualized network orchestrator, which coordinate the transition from the normal state to the successive attack states , , and . This plane controls when benign traffic is generated, when the attacker is activated, and when each attack stage is executed. The virtualized infrastructure and execution plane contains the main simulated operational zones, including staff and office devices, student services and devices, central services and servers, the SDN core, and the adversarial entity. These zones emulate realistic smart-infrastructure activity such as HTTP requests, mail traffic, database queries, wireless access, video transmission, and service communication. The virtualized SDN core, including virtual routers, virtual switches, and emulated wireless access points, acts as the central communication backbone through which normal and malicious flows are routed. The cyber-physical IoT integration zone includes emulated smoke sensors, temperature sensors, and CCTV cameras connected through the IoT gateway emulator, allowing the testbed to represent cyber-physical sensing and monitoring behavior rather than a conventional computer network only. The adversarial zone contains the attacker node and control interface, from which the proposed multi-stage attack is launched. In this design, represents the initial compromise path, represents traffic coordination among affected components, and represents the execution-stage attack traffic, such as DPass, application-layer, video, and DNS-related malicious traffic. The post-emulation cybersecurity analytics engine receives raw emulation traces and packet logs, performs data preprocessing and feature engineering, constructs the structured labeled dataset, and supports ANN training and detection. Figure 1 demonstrates that the proposed framework is not only a network topology, but a complete simulation-based cybersecurity pipeline linking cyber-physical infrastructure modeling, staged attack emulation, traffic capture, dataset construction, and intelligent detection.
Figure 1.
Architecture of the proposed CP-NetEmul cyber-physical smart infrastructure emulation testbed.
3.1. Cyber-Physical Smart Infrastructure Simulation Environment
To establish a realistic and analytically meaningful testbed for cybersecurity experimentation, the proposed study develops a simulation-driven cyber-physical smart infrastructure environment in NetSim that integrates heterogeneous networked entities, IoT sensing devices, user endpoints, service platforms, and core communication components within a unified operational architecture. The simulated environment was designed to emulate a distributed smart infrastructure ecosystem in which multiple functional zones are interconnected through a hierarchical networking backbone, thereby allowing the generation of both benign and malicious traffic under dynamic and realistic communication conditions. In the NetSim topology, the smart infrastructure is organized into five operational zones, namely the Engineering Zone (ENG_ZONE), Services Zone (SER_ZONE), Library Zone (LIB_ZONE), Science Zone (SCI_ZONE), and Network Operations Center Zone (NOC-ZONE). These zones are interconnected through the campus communication backbone, which includes CORE_SW, CORE_RTR, GATEWAY, and INTERNET_EDGE. Unlike a generic communication topology, the proposed environment represents a cyber-physical smart infrastructure in which physical sensing devices, CCTV surveillance nodes, VoIP nodes, wireless/IoT links, local databases, machine nodes, service servers, and network-control components interact continuously to produce heterogeneous operational traffic. This design enables the proposed framework to move beyond abstract intrusion modeling by embedding cyber threats within a representative infrastructure setting that reflects practical device diversity, service heterogeneity, and interdependent communication patterns.
The constructed simulation topology consists of multiple infrastructure segments that collectively represent a connected smart environment, including administrative and operational units, monitoring and sensing nodes, local service stations, wireless/IoT communication points, and centralized server-side resources. At the network core, routers, switches, and gateway devices are used to coordinate traffic forwarding and inter-segment connectivity, while at the endpoint layer, the environment incorporates workstations, laptops, mobile nodes, VoIP nodes, surveillance cameras, smoke sensors, temperature sensors, access points, IoT nodes, machine nodes, and local database servers. The Engineering Zone includes components such as ENG_DB, ENG_CCTV, ENG_VOIP, ENG_IOT, ENG_SMOKE, ENG_TEMP, engineering workstations, and machine nodes. The Services Zone includes SER_DB, SER_AP, SER_CCTV, SER_VOIP, SER_TEMP, SER_SMOKE, service workstations, mobile nodes, and IoT devices. The Library Zone includes LIB_DB, LIB_AP, LIB_CCTV, LIB_VOIP, LIB_TEMP, LIB_SMOKE, library workstations, laptops, and mobile nodes. The Science Zone includes SCI_DB, SCI_CCTV, SCI_VOIP, SCI_IOT, SCI_SMOKE, science workstations, faculty workstation, and several machine nodes. The NOC-ZONE includes NOC_DB, NOC_MAIL, NOC_WEB, NOC_NVR, NOC_SYS, NOC_ADMIN, NOC_VOIP, NOC_CCTV, NOC_SMOKE, and NOC_TEMP. Critical service platforms such as web servers, mail servers, database servers, network operation resources, and video-recording servers are integrated to emulate realistic service-oriented communication across the infrastructure. Such heterogeneity is essential for constructing a representative dataset in which normal traffic emerges from diverse application behaviors rather than from a simplified or homogeneous traffic model. In the NetSim implementation, benign traffic is generated from sensing updates, CCTV streams, VoIP communication, user–service requests, database queries, e-mail exchange, web access, wireless communication through access points, and server-side interactions in the NOC-ZONE. This makes the normal traffic baseline sufficiently diverse and suitable for evaluating whether the detection model can distinguish staged malicious activity from realistic cyber-physical infrastructure behavior.
To make the adversarial component explicit in the simulation, the topology includes a clearly labeled INTERNAL_ATTACKER node rather than an external attacker. This choice reflects an insider or already-present adversarial entity located within the smart infrastructure environment, which is realistic for cyber-physical smart infrastructures where malicious activity may originate from a compromised internal endpoint, unauthorized internal access, or a hostile node connected to the operational network. Malicious traffic is generated inside NetSim by activating the INTERNAL_ATTACKER and allowing the attack to progress through three stages: initial compromise, coordination and preparation, and execution and disruption. During the first stage, the attacker targets selected exposed or reachable nodes such as wireless/IoT access points, workstations, mobile nodes, or service-connected devices. During the second stage, compromised internal nodes exchange abnormal coordination traffic with other cyber-physical components such as IoT nodes, CCTV nodes, access points, or workstations. During the third stage, compromised nodes generate abnormal traffic toward critical infrastructure resources such as NOC_DB, NOC_WEB, NOC_MAIL, NOC_NVR, local databases, or other service and monitoring nodes. Therefore, the malicious data used in this study are obtained directly from staged attack execution inside the NetSim topology rather than being manually inserted or taken from an external benchmark dataset.
From a structural perspective, the simulated infrastructure is formally represented by a communication graph , where V denotes the set of all simulated nodes and E denotes the communication links among them. The node set includes sensing devices, user devices, networking equipment, centralized service nodes, local databases, machine nodes, and adversarial entities, while the edge set captures both wired and wireless/IoT communication relationships established during the simulation. Let , where represents IoT sensing and surveillance nodes, denotes user, staff, workstation, mobile, and VoIP devices, corresponds to networking components such as routers, switches, gateways, access points, and the Ad hoc Link, represents centralized computational, database, service, and NOC resources, represents machine and cyber-physical operational nodes distributed across the Engineering and Science zones, and denotes the internal adversarial entity and the compromised nodes involved in the proposed multi-stage attack scenario. This abstraction provides a mathematically consistent foundation for describing traffic exchange patterns, attack propagation behavior, and dataset generation mechanisms in the subsequent stages of the methodology.
The simulation environment is intentionally configured to support both periodic and event-driven communication processes. Periodic communication is generated by monitoring and sensing devices that continuously transmit environmental or operational updates, whereas event-driven exchanges arise from user requests, service access, surveillance data transmission, wireless access, VoIP communication, authentication, database interaction, machine-node communication, and administrative communication tasks. The blue dashed links in the topology represent wireless, IoT, sensing, surveillance, or ad hoc communication paths, while the gray solid links represent normal wired communication among buildings, databases, servers, routers, switches, and endpoint devices. This visual distinction helps clarify the coexistence of cyber-physical traffic and conventional network traffic within the same NetSim environment. This combination of communication modes is important because it allows the generated dataset to capture a broader range of temporal and behavioral variations, thereby improving the realism of the traffic profile and increasing the difficulty of distinguishing malicious behavior from legitimate network activity. At the same time, malicious communication is generated through the staged activation of the INTERNAL_ATTACKER and is captured alongside normal traffic using NetSim traffic logs and monitoring outputs. Each captured record is later associated with its corresponding operational state, namely normal operation, compromise, coordination, or execution, which enables both binary attack detection and stage-aware multi-class classification.
As a result, the simulation environment serves as the foundational experimental layer upon which the proposed multi-stage cyber attack is embedded and analyzed. This cyber-physical smart infrastructure simulation environment is not merely a background network model, but a core methodological component of the study. It provides the structural realism required to emulate attack execution, the communication diversity needed for dataset generation, and the contextual complexity necessary for evaluating intelligent detection models under realistic operational conditions. By explicitly representing smart infrastructure zones, benign traffic sources, the INTERNAL_ATTACKER node, compromised internal-node behavior, malicious traffic paths, wireless/IoT communication, local databases, NOC services, and cyber-physical operational devices, the NetSim environment clarifies how both normal and malicious data are produced and how the final stage-aware cybersecurity dataset is constructed. Accordingly, the proposed simulation testbed constitutes the basis for normal traffic generation, staged attack execution, malicious traffic capture, dataset labeling, and the subsequent development of the ANN-based cybersecurity detection framework.
Figure 2 presents the complete NetSim-based cyber-physical smart infrastructure used in this study, highlighting a heterogeneous and operationally realistic environment in which sensing devices, surveillance nodes, user endpoints, networking components, centralized service servers, zone-level databases, machine nodes, and adversarial entities are interconnected to emulate real-world cyber-physical infrastructure behavior. The topology is organized into five operational smart-infrastructure zones: ENG_ZONE, SER_ZONE, LIB_ZONE, SCI_ZONE, and NOC-ZONE. These zones are interconnected through CORE_SW, CORE_RTR, GATEWAY, and INTERNET_EDGE, while Ad hoc Link 1 supports wireless, IoT, sensing, and surveillance communication paths across the environment. The topology integrates IoT and cyber-physical devices such as smoke and temperature sensors, CCTV cameras, workstations, laptops, mobile nodes, VoIP nodes, access points, local databases, web and mail servers, NVR services, machine nodes, and core routing/switching elements, thereby enabling the simultaneous generation of diverse benign traffic patterns, including sensing updates, video streams, database transactions, VoIP communication, wireless access, machine-node communication, and user–service interactions. In addition to normal traffic sources, the figure explicitly includes the INTERNAL_ATTACKER node and selected internal nodes that may become compromised during the proposed multi-stage cyber attack. The malicious traffic is represented as staged abnormal communication generated from inside the infrastructure, which reflects an insider or internally compromised attack scenario rather than an external-only threat model. This rich connectivity is essential for constructing a credible experimental testbed because it allows the proposed multi-stage attack to be embedded within normal background activity rather than in an isolated or simplified setting, which in turn improves the realism of the generated dataset and strengthens the validity of the subsequent ANN-based detection experiments. The malicious data are obtained by activating the INTERNAL_ATTACKER within the NetSim scenario, allowing the attack to progress through selected reachable nodes and compromised internal components, and capturing the resulting abnormal packets, flows, and communication statistics together with the benign traffic traces. The figure demonstrates that the proposed framework is built upon a complex and functionally layered simulation environment capable of supporting benign traffic generation, staged attack emulation, traffic capture, dataset generation, stage-aware labeling, and intelligent cybersecurity analysis within a unified pipeline.
Figure 2.
NetSim-based cyber-physical smart infrastructure topology showing five operational zones, namely Engineering, Services, Library, Science, and NOC, interconnected through the core switch, core router, gateway, and Internet edge. The topology includes IoT devices, smoke and temperature sensors, CCTV cameras, VoIP nodes, local databases, machine nodes, user workstations, service servers, wireless/IoT links, and an explicit internal attacker node used to generate staged malicious traffic within realistic smart-infrastructure communication.
Table 1 summarizes the principal entities that constitute the NetSim-based cyber-physical smart infrastructure simulation environment and clarifies their functional roles within the experimental workflow. The listed components collectively represent a heterogeneous operational ecosystem in which IoT sensing devices generate continuous monitoring traffic, surveillance devices produce video-streaming traffic, user and endpoint devices emulate legitimate access and service interactions, machine and IoT nodes represent cyber-physical operational behavior, network infrastructure supports end-to-end communication and traffic coordination, and centralized as well as local service platforms provide storage, processing, monitoring, and application-level functionality. The table also clarifies the adversarial and dataset-generation elements of the simulation. The INTERNAL_ATTACKER initiates the proposed multi-stage attack from within the smart infrastructure, selected internal nodes become compromised during the attack lifecycle, and the resulting malicious traffic is generated through compromise, coordination, and execution behaviors inside NetSim. The generated benign and malicious traces are captured from NetSim traffic logs, packet/flow records, source–destination statistics, and link-level outputs, then used to construct the final labeled dataset for binary and stage-aware ANN-based detection. The simulation environment therefore reflects not only infrastructure diversity, but also the complete process through which normal traffic, malicious traffic, compromised-node behavior, and attack-aware dataset records are produced.
Table 1.
Main components of the NetSim-based cyber-physical smart infrastructure simulation environment, including smart zones, benign traffic sources, the internal attacker, compromised nodes, and dataset-generation components.
3.2. Packet-Level Traffic Animation and Multi-Application Flow Visualization
The proposed study uses NetSim packet animation to visualize the dynamic traffic behavior of the cyber-physical smart infrastructure during simulation execution. Unlike the static topology view, this packet-level animation view shows how different traffic types move across the infrastructure zones, how normal and malicious flows coexist, and how the generated packet records are later exported for dataset construction. The environment integrates heterogeneous devices, communication layers, and service platforms to reflect real-world interactions between sensing, computation, network communication, and cyber-physical monitoring components. The primary objective of this packet-animation view is to provide a controlled yet realistic setting for observing both normal operational traffic and complex multi-stage cyber attack behavior. As shown in the NetSim animation interface, the simulation includes several labeled operational zones, such as ENG_ZONE, SER_ZONE, LIB_ZONE, SCI_ZONE, and NOC-ZONE, which are interconnected through CORE_SW, CORE_RTR, GATEWAY, and INTERNET_EDGE. These zones generate simultaneous traffic associated with database access, HTTP communication, e-mail services, video streams, voice communication, sensor updates, and malicious attack traffic.
The architecture of the simulated environment is structured in a hierarchical manner, consisting of edge, access, core, and service layers. The edge layer includes distributed IoT and cyber-physical sensing devices such as temperature sensors, smoke detectors, CCTV cameras, IoT nodes, machine nodes, and mobile devices, which continuously generate monitoring and operational data. The access layer incorporates wireless access points, ad hoc communication links, and local zone switches responsible for aggregating device-level communications. The core layer is composed of CORE_SW, CORE_RTR, GATEWAY, and INTERNET_EDGE, which facilitate inter-zone routing and centralized traffic management. Finally, the service layer hosts critical infrastructure components, including NOC_WEB, NOC_MAIL, NOC_DB, NOC_NVR, NOC_SYS, and NOC_ADMIN, which support application services, database exchange, video recording, administration, and monitoring. This layered organization allows the simulation to represent a real cyber-physical smart infrastructure rather than a conventional computer network, since the packet animation captures both physical monitoring traffic and digital service traffic within the same operational scenario.
In addition to IoT devices, the environment includes a diverse set of user and operational endpoints such as workstations, laptops, mobile nodes, VoIP nodes, access points, and machine nodes distributed across the Engineering, Services, Library, Science, and NOC zones. This heterogeneous composition enables the generation of realistic and multi-source traffic patterns that closely resemble actual smart infrastructure deployments. The coexistence of sensing devices, user-driven applications, machine communication, surveillance streams, VoIP calls, local databases, and centralized services introduces complex communication dynamics that are essential for evaluating cybersecurity mechanisms. The normal operational traffic within the environment is modeled using a combination of periodic and event-driven communication patterns. Sensor nodes generate low-rate periodic data streams for environmental monitoring, while user and service devices initiate application-level traffic such as HTTP requests, e-mail exchanges, database access, voice communication, and video streaming sessions. In the packet animation view, these flows are visually distinguished through labeled and colored application paths, such as DATABASE, Campus_HTTP_Traffic, App31_EMAIL, App3_VIDEO, VOICE, Temperature_Data, SMOKE_SENSOR, and CCTV-related streams. This visualization clarifies how benign cyber-physical traffic is produced and how it travels across the simulated infrastructure.
The animation figure also makes the malicious component more explicit by showing the INTERNAL_ATTACKER node inside the simulated infrastructure and the malicious application path labeled as DDoS_Attack. This internal attacker represents an insider or compromised internal adversarial entity that generates abnormal traffic within the same communication environment used by legitimate devices. The attack traffic propagates through the operational infrastructure while normal database, HTTP, e-mail, video, voice, and sensor traffic continue to operate. This design is important because it demonstrates that the malicious data are not manually inserted or artificially separated from normal traffic; instead, they are generated dynamically during NetSim execution and captured together with legitimate packet flows.
As illustrated in Figure 3, the simulated topology captures the spatial and functional distribution of devices across different infrastructure zones and shows the real-time packet movement generated during the NetSim execution. The figure highlights the interaction between sensing devices, user endpoints, machine nodes, access points, centralized services, databases, and NOC components through various communication protocols and application flows. Unlike a static topology-only figure, this packet-animation view provides evidence of how traffic is produced and captured during the simulation. The lower packet table records packet-level information such as packet ID, segment ID, packet type, control packet type, source ID, destination ID, transmitter ID, receiver ID, and layer-level arrival times. These recorded packet traces provide the raw basis for constructing the dataset used in the proposed ANN-based detection framework.
Figure 3.
NetSim packet-animation view of the cyber-physical smart infrastructure simulation, showing multi-application benign traffic, sensor and surveillance flows, service communication, database exchange, the INTERNAL_ATTACKER node, and the DDoS_Attack path used to generate malicious traffic records during simulation execution.
The figure also visualizes the coexistence of normal traffic streams and malicious activity. Normal traffic includes database communication, HTTP traffic, e-mail exchange, video streaming, voice communication, temperature data, smoke-sensor messages, and CCTV-related flows, whereas malicious traffic is represented by the DDoS_Attack path generated from the INTERNAL_ATTACKER. The overlap between benign and malicious flows creates a challenging detection environment because attack traffic propagates through the same infrastructure used by legitimate cyber-physical services. This makes the generated malicious data more realistic and supports the construction of a stage-aware cybersecurity dataset. The developed simulation environment therefore serves as the foundational platform for subsequent stages of this work, including multi-stage attack modeling, dataset generation, feature extraction, and ANN-based detection. By ensuring a high degree of realism and heterogeneity, the environment enables the generation of representative data that accurately reflects the dynamics of cyber-physical smart infrastructures under both normal and adversarial conditions.
3.3. Normal Operational Traffic Modeling
Following the construction of the cyber-physical smart infrastructure simulation environment, the next stage of the methodology focuses on modeling the normal operational traffic that characterizes the routine behavior of the deployed infrastructure components. These steps are essential because the credibility of the generated cybersecurity dataset depends not only on the realism of an attack scenario, but also on the representativeness of the benign communication baseline against which malicious behavior is observed. In the proposed framework, normal traffic was designed to emulate heterogeneous and temporally varying communication patterns typically found in smart infrastructure ecosystems, where sensing devices, surveillance systems, user terminals, and service platforms continuously exchanges data through a mixture of periodic, event-driven, and service-oriented interactions.
The modeled benign traffic includes several categories of operational communication. First, IoT sensing devices such as smoke sensors and temperature sensors generate lightweight periodic traffic in the form of status updates, environmental measurements, and monitoring messages transmitted at predefined sampling intervals. Second, surveillance components such as CCTV cameras produce heavier streaming or burst-based traffic associated with continuous monitoring, video transmission, and event-triggered data forwarding toward recording or management servers. Third, user endpoints, including laptops, smartphones, and staff terminals, generate interactive traffic patterns related to web access, e-mail communication, local application usage, authentication requests, and service consumption. In addition, centralized and local service platforms exchanges operational data with distributed devices to support database queries, application hosting, network coordination, and administrative control functions. The coexistence of these traffic classes enable the simulated environment to exhibit realistic variability in packet sizes, flow durations, transmission frequencies, and protocol utilization.
From a mathematical perspective, the aggregate normal traffic generated within a simulation can be expressed as
where N denotes the total number of active benign nodes, represents the traffic generation rate of node i at time t, and denotes the effective communication duration or activity factor associated with that node. This formulation reflects the fact that benign traffic in the simulated environment is not constant, but varies according to device role, application type, operational timing, and user interaction intensity. To further characterize temporal spacing between benign transmissions, the inter-arrival behavior of selected traffic flows can be described by
where and denote two consecutive transmission instants associated with node i. Such temporal variation is important for generating realistic background traffic against which the staged malicious activities can later be contrasted.
The operational traffic model is intentionally designed to combine periodic and event-driven communication modes. Periodic traffic is mainly associated with sensing, monitoring, polling, and scheduled status reporting, whereas event-driven traffic emerges when users access services, surveillance events is triggered, administrative commands are issued, or local infrastructure components exchange responsive control messages. These dual-mode communication designs improve the realism of the simulated environment by ensuring that the benign traffic baseline is neither overly regular nor unrealistically random. Instead, it reflects the mixed communication dynamics typically encountered in cyber-physical infrastructure settings, where deterministic sensing processes coexist with bursty user-driven and service-oriented traffic.
The normal operational traffic modeling stage provides the behavioral foundation for the subsequent attack-emulation and dataset-generation processes as shown in Figure 4. By constructing a benign traffic profile that captures infrastructure heterogeneity, temporal variation, application diversity, and realistic service interactions, the proposed framework ensures that the resulting dataset is suitable for robust cybersecurity analysis. This is particularly important for ANN-based detection, since the learning model must distinguishes the proposed multi-stage attack from a rich background of legitimate activity rather than from simplified or artificially isolated traffic conditions.
Figure 4.
Conceptual representation of normal operational traffic within the proposed cyber-physical smart infrastructure environment, showing periodic sensing traffic, surveillance transmission, user–service interaction, and platform-level communication across heterogeneous infrastructure components.
3.4. Novel Multi-Stage Attack Scenario Design
After establishing the normal operational traffic profile of the simulated cyber-physical smart infrastructure, the next stage of the methodology focuses on designing the proposed novel multi-stage cyber attack scenario. The novelty of this attack scenario lies in simulating a staged adversarial process inside the NetSim-based cyber-physical smart infrastructure rather than relying on an existing benchmark dataset or representing malicious behavior as a single fixed attack pattern. The attack model was developed to emulate a realistic adversarial process in which malicious behavior does not emerge as a single isolated event, but instead evolves progressively through multiple coordinated phases. Such a staged design is important because advanced cyber threats in heterogeneous IoT-enabled infrastructures often begin with stealthy compromise actions, then transition to internal coordination or propagation, and finally culminate in an execution phase intended to disrupt services, exhaust resources, or degrade the operational stability of the target environment. Accordingly, the proposed attack is formulated as a temporal and behavioral sequence that reflects the dynamics of sophisticated infrastructure-oriented cyber threats.
In this study, the proposed attack is treated as the central simulation object used to create a novel stage-aware cybersecurity dataset. The adversarial process begins from the INTERNAL_ATTACKER node located within the simulated infrastructure, which represents an insider or internally compromised adversarial entity. Therefore, the contribution is not limited to applying an ANN classifier; rather, it begins with the construction of a new attack lifecycle whose traffic behavior can be generated, observed, captured, labeled, and later used for binary and multi-class detection. The proposed attack scenario is organized into three principal stages. The first stage corresponds to the initial compromise phase, in which the internal attacker attempts to gain access to selected reachable nodes within the simulated environment through vulnerable access points, exposed services, weakly protected endpoints, IoT nodes, surveillance nodes, or service-connected devices. At this stage, the malicious traffic volume is typically limited, and the behavioral objective is to establish a foothold while minimizing the probability of immediate detection. The second stage represents the coordination and malicious preparation phase, during which compromised nodes begin to exchange abnormal control or signaling patterns associated with bot formation, command dissemination, lateral interaction, or distributed preparation for the final operation. In this phase, the attack remains partially covert, but its communication structure becomes more organized and increasingly distinguishable from benign traffic as coordination intensifies. The third stage is the attack execution phase, in which the malicious infrastructure is activated to perform the final disruptive objective, such as coordinated flooding, DDoS-oriented overload, service degradation, communication congestion, or targeted interference with database, surveillance, and cyber-physical operational components.
To represent the temporal evolution of the attack formally, the system attack state at time t is defined as
where denotes the normal operational state, denotes the initial compromise phase, denotes the coordination and preparation phase, and denotes the final attack execution phase. Based on this staged formulation, the aggregate malicious traffic generated by the proposed adversarial process can be expressed as
where , , and represent the traffic contributions associated with compromise, coordination, and execution, respectively. This mathematical abstraction provides a clear basis for distinguishing stage-dependent malicious behavior in the generated dataset and later supports both binary and multi-class ANN-based attack detection. In the NetSim execution, these traffic components coexist with normal application flows such as database communication, HTTP traffic, e-mail exchange, video streaming, VoIP communication, temperature data, smoke-sensor messages, and CCTV-related traffic. This coexistence ensures that malicious records are generated under realistic background communication rather than under isolated laboratory conditions.
A key contribution of the proposed methodology lies in the fact that the attack is not modeled solely as a volumetric anomaly, but as a structured multi-stage adversarial lifecycle embedded within a realistic infrastructure context. This design allows the generated dataset to capture both low-intensity stealth behavior and high-impact disruptive behavior within a single unified simulation scenario. As a result, the attack model introduces meaningful behavioral diversity into the dataset and creates a more challenging detection problem compared with conventional single-stage or fixed-pattern attack simulations. Furthermore, by explicitly separating the compromise, coordination, and execution stages, the proposed attack design enables fine-grained analysis of how attack progression manifests across different traffic features, node interactions, and infrastructure roles.
This staged attack design directly supports the construction of a novel dataset because each traffic record can be associated with a specific operational state or attack phase. Consequently, the generated data can be used not only to determine whether malicious behavior exists, but also to identify the internal progression of the attack. This makes the dataset suitable for two complementary learning tasks: binary detection of normal versus attack traffic and stage-aware multi-class recognition of compromise, coordination, and execution behavior. The novel multi-stage attack scenario serves as the central adversarial component of the proposed framework. It transforms the simulated environment from a passive communication topology into an active cybersecurity testbed capable of generating realistic malicious traffic traces, labeled stage-dependent attack instances, and infrastructure-aware intrusion patterns. By originating from the INTERNAL_ATTACKER and propagating through reachable cyber-physical components, the attack scenario reflects a realistic internal threat model in which malicious traffic is generated, captured, and labeled inside the same operational environment used by legitimate services. These capabilities strengthen the scientific contribution of the study by coupling realistic simulation-based attack emulation with intelligent ANN-based detection under complex cyber-physical operating conditions.
Table 2 summarizes the lifecycle of the proposed novel multi-stage cyber attack by decomposing it into three sequential phases, each characterized by a distinct operational objective, observable traffic behavior, and anticipated impact on the simulated infrastructure. The first stage focuses on establishing an initial foothold through low-intensity suspicious interactions from the INTERNAL_ATTACKER, the second stage reflects coordination and preparation activities among compromised internal entities, and the third stage represents the final disruptive execution phase through coordinated malicious traffic. This staged formulation demonstrates that the proposed threat is not treated as a single isolated event, but as an evolving attack process whose traffic characteristics and infrastructure effects change over time. This design provides the foundation for generating a novel stage-aware dataset and evaluating ANN-based cyber attack detection at both binary and multi-class levels.
Table 2.
Stage-wise structure of the proposed internally generated multi-stage cyber attack scenario and its dataset-labeling role.
3.5. Attack Embedding and Simulation Execution Logic
Following the design of the proposed multi-stage cyber attack scenario, the next step of the methodology is to embed the adversarial model into the cyber-physical smart infrastructure simulation and define the execution logic through which benign and malicious activities coexist during the experimental runs. This stage is essential because the scientific value of the generated dataset depends not only on the conceptual design of the attack, but also on the realism and consistency with which the attack is introduced into the operational environment. Accordingly, the attack is not injected as an isolated anomaly; instead, it is temporally integrated into the simulation lifecycle such that the infrastructure initially operates under normal traffic conditions, after which the adversarial process is activated progressively according to the defined stage sequence. This design makes the source of malicious data explicit: malicious samples are generated inside the NetSim environment by activating the INTERNAL_ATTACKER node, allowing selected internal nodes to become compromised, and recording the abnormal traffic produced during the compromise, coordination, and execution intervals.
The execution logic begins by initializing the simulated infrastructure and allowing all legitimate devices, users, sensors, machines, access points, databases, and service platforms to establish baseline communication behavior. During this initial phase, only benign traffic is generated, thereby creating a normal operational reference profile for the infrastructure. After the baseline period is established, the INTERNAL_ATTACKER node is activated and the compromise stage is launched against selected target nodes within the environment. These target nodes are chosen according to their exposure, service role, communication centrality, wireless accessibility, or vulnerability relevance in the infrastructure topology. For example, reachable access points, user endpoints, IoT nodes, surveillance nodes, machine nodes, or service-connected devices may be selected as initial targets because they provide realistic internal entry points into the cyber-physical infrastructure. Once access is established, the simulation transitions to the coordination and preparation phase, in which compromised devices begin exchanging abnormal signaling and control-oriented communication while still operating within a broader context of legitimate infrastructure traffic. Finally, the execution phase is triggered, during which the coordinated malicious activity is fully activated to produce measurable disruption, overload, or anomalous communication behavior in the simulated environment. Thus, the generated malicious data reflect stage-dependent behavior rather than a single artificial attack label, which enables the resulting dataset to support both binary detection and stage-aware multi-class classification.
To formalize the simulation schedule, let the total simulation duration be denoted by , which is partitioned into four temporal segments corresponding to the normal state and the three attack stages:
where denotes the benign baseline interval, denotes the initial compromise interval, denotes the coordination interval, and denotes the final execution interval. For each simulated node , the state-dependent behavior during the simulation can be expressed as
where denotes the set of initially targeted nodes and denotes the set of compromised nodes participating in the later malicious phases. This formulation makes it possible to align captured traffic records with stage-aware labels during dataset generation. In this way, every captured record can be traced back to its simulation interval and node state, allowing normal traffic, compromise traffic, coordination traffic, and execution traffic to be separated during dataset construction.
From an implementation perspective, the simulation is executed repeatedly under controlled parameter settings in order to generate sufficient traffic diversity and reduce dependence on a single scenario instance. Key execution parameters include the number of active nodes, simulation duration, attack start time, stage-transition timing, number of compromised devices, traffic intensity during each malicious phase, and the communication services involved in the adversarial process. By varying these parameters across simulation runs, the proposed framework captures a wider range of malicious manifestations and improves the generalizability of the resulting dataset. Moreover, all traffic exchanges, packet traces, and communication statistics are logged continuously throughout the simulation, thereby ensuring that both benign and malicious behaviors are recorded with temporal continuity and infrastructure context. The logging process captures source and destination nodes, protocol behavior, packet and flow statistics, communication timing, link-level activity, packet type, transmitter and receiver identifiers, and stage-related traffic changes. These recorded traces are then converted into feature vectors and assigned binary and stage-aware labels according to the corresponding simulation interval and compromised-node state. The attack embedding and simulation execution logic provides the operational mechanism through which the proposed adversarial scenario is transformed into a reproducible and measurable simulation process. This stage ensures that the novel attack is not merely described conceptually, but is executed systematically within the infrastructure environment under realistic communication dynamics. As a result, the generated traffic traces preserve the temporal evolution, structural context, and behavioral variability of the attack lifecycle, thereby supporting robust dataset construction and subsequent ANN-based intrusion detection.
Algorithm 1 formalizes the complete procedure used to embed the proposed multi-stage cyber attack into the simulated cyber-physical smart infrastructure and to transform the resulting traffic traces into a labeled learning dataset. The algorithm begins by initializing the infrastructure graph, benign traffic model, internal attacker entity, target node set, monitoring outputs, and the temporal intervals associated with normal operation and the successive attack phases. It first generates benign traffic during the baseline interval to establish a realistic reference profile before activating the INTERNAL_ATTACKER node. After attacker activation, malicious data are generated directly inside NetSim through three controlled stages: compromise traffic from the INTERNAL_ATTACKER toward target nodes, coordination traffic among compromised nodes, and execution-stage traffic from compromised nodes toward critical service, database, surveillance, and cyber-physical operational components. Throughout these intervals, benign traffic continues to coexist with malicious activity, which creates a more realistic detection environment. After simulation completion, each log entry is processed through feature extraction and assigned a class label according to its recorded temporal stage, producing a structured dataset that distinguishes normal behavior from the different phases of the attack lifecycle. This procedure clarifies how malicious traffic is obtained, how compromised nodes are represented, and how the final dataset supports both binary and stage-aware ANN-based detection.
Table 3 lists the key parameters that control the temporal and structural behavior of the attack embedding process and the overall simulation execution workflow. These parameters define the full simulation horizon, the intervals associated with benign operation and successive attack phases, the internal attacker node, the sets of targeted and compromised nodes, the attack initiation point, the malicious traffic intensity, and the number of repeated runs used to improve dataset diversity and experimental robustness. The table also clarifies how malicious data are obtained: the INTERNAL_ATTACKER is activated after the baseline interval, compromised nodes are formed during the attack lifecycle, and malicious traffic is recorded through the logging process together with normal traffic. Each captured record is then assigned a dataset label according to whether it belongs to normal operation, compromise, coordination, or execution. These parameters provide a clear and systematic configuration framework that ensures the proposed multi-stage attack is executed in a controlled, reproducible, and analytically consistent manner within the simulated cyber-physical smart infrastructure environment.
| Algorithm 1: Attack Embedding, Malicious Traffic Generation, and Dataset Labeling Procedure |
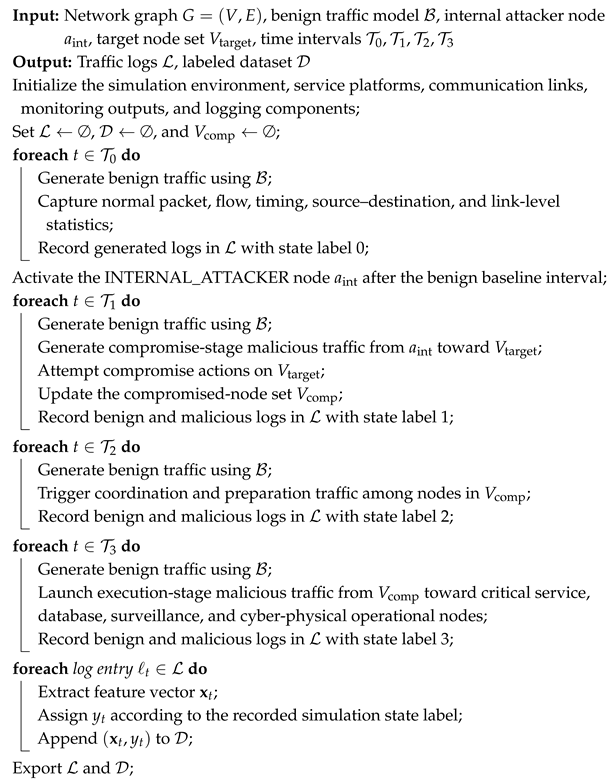 |
Table 3.
Key parameters used to execute the proposed multi-stage attack, identify compromised nodes, generate malicious traffic, and construct the stage-aware dataset.
3.6. Dataset Generation and Labeling Strategy
Following the execution of the benign and adversarial simulation scenarios, the generated traffic traces are transformed into a structured cybersecurity dataset suitable for intelligent attack analysis and ANN-based detection. The dataset is generated directly from NetSim simulation outputs rather than from an external benchmark dataset or from the ANN model itself. The ANN is used only as the detection model after the dataset has been constructed, labeled, and preprocessed. This stage is methodologically important because the scientific contribution of the study is not limited to simulating the cyber-physical infrastructure, but also includes constructing a stage-aware dataset that captures the behavioral progression of the proposed multi-stage cyber attack within a realistic smart infrastructure environment. Accordingly, the raw simulation outputs, including packet traces, communication logs, TCP-level statistics, link-level statistics, and flow-related records, are systematically collected and converted into a unified data representation in which each sample reflects a measurable communication instance associated with either normal operation or one of the malicious attack stages.
The dataset generation process begins by extracting network observations from the NetSim traffic logs and organizing them into structured records according to packet-level, flow-level, TCP-level, and link-level aggregation rules. For each communication instance, a feature vector is formed to capture the most relevant traffic characteristics, including packet count, byte count, flow duration, source–destination interaction frequency, protocol usage, inter-arrival behavior, acknowledgment activity, transmission intensity, error behavior, and link-level collision indicators. The packet-animation outputs provide packet-level fields such as packet ID, segment ID, packet type, control packet type, source ID, destination ID, transmitter ID, receiver ID, and layer-level arrival times. These fields help preserve the temporal and structural context of both benign and malicious traffic during dataset construction. Additional contextual attributes are derived to reflect infrastructure-aware properties such as communicating node role, service type, traffic direction, operational zone, and temporal stage association. Let the resulting feature vector for the i-th sample be denoted by
where m denotes the total number of extracted traffic features. The complete generated dataset can then be expressed as
where N denotes the total number of dataset instances and denotes the class label assigned to the i-th sample. To support reproducibility despite the simulation-generated nature of the dataset, the final dataset description includes the total number of samples, class distribution, feature dimensionality, data-partitioning strategy, random-seed control, and learning settings used for both the proposed ANN model and the baseline classifiers. After preprocessing, categorical encoding, normalization, duplicate removal, and feature refinement, the final analytical feature vector contained features. The complete dataset contained N = 48,000 records, including 12,000 normal samples, 12,000 compromise-stage samples, 12,000 coordination-stage samples, and 12,000 execution-stage samples. For binary detection, all compromise, coordination, and execution samples were grouped into one attack class, resulting in 12,000 normal samples and 36,000 attack samples, while the stage-aware setting retained the four-class labeling structure. The processed dataset was divided into training, validation, and testing subsets using a fixed 70:30 stratified split to preserve the class distribution across all partitions. The random seeds were fixed at 42, 123, and 2026 for data partitioning, model initialization, and repeated experimental trials. All ANN and baseline models were trained and evaluated using the same processed feature set, identical train/validation/test partitions, and the same performance metrics to ensure fair comparison.
The labeling strategy is designed to support both conventional intrusion detection and stage-aware attack analysis. In the binary setting, each instance is labeled as either normal or attack, depending on whether the corresponding traffic record was generated during benign infrastructure operation or during any malicious stage of the proposed adversarial lifecycle. This binary label can be expressed as
where 0 denotes normal traffic and 1 denotes attack traffic. In the more detailed multi-class setting, labels are assigned according to the specific stage of the attack from which the sample originates. Accordingly, the stage-aware class label is defined as
where 0 denotes normal traffic, 1 denotes traffic associated with the initial compromise stage, 2 denotes traffic associated with the coordination and preparation stage, and 3 denotes traffic associated with the final execution and disruption stage. This dual-labeling design allows the same generated dataset to support two complementary learning tasks: binary detection of benign versus malicious traffic and multi-class recognition of the internal progression of the proposed attack.
To ensure labeling consistency, the assignment of labels is synchronized directly with the simulation execution schedule and the stage-dependent node states defined in the previous subsection. Thus, traffic records generated during the baseline interval are labeled as benign, while records generated during , , and are mapped to their corresponding attack-stage labels. For example, traffic generated after activating the INTERNAL_ATTACKER and during the initial compromise interval is labeled as compromise traffic, traffic exchanged among compromised nodes during the preparation interval is labeled as coordination traffic, and overload-oriented or disruptive traffic generated during the final interval is labeled as execution traffic. Furthermore, communication traces are filtered, aggregated, and de-duplicated before final dataset export in order to remove non-informative redundancy and improve structural consistency across records. The resulting dataset therefore contains discriminative traffic features as well as stage-aware labels aligned with the adversarial timeline of the simulation.
The dataset generation and labeling strategy constitutes one of the core contributions of the proposed study. By transforming realistic cyber-physical infrastructure traffic traces into a structured and stage-aware cybersecurity dataset, this stage bridges the gap between simulation-based attack emulation and data-driven intelligent detection. The novelty of the dataset lies in the fact that both benign and malicious samples are produced within the same NetSim-based smart infrastructure environment, where sensing, CCTV, VoIP, database, web, e-mail, wireless, machine, and service traffic coexist with the staged malicious activity generated by the INTERNAL_ATTACKER. The generated dataset provides the empirical foundation upon which preprocessing, feature engineering, ANN training, binary detection, stage-aware classification, and cybersecurity performance analysis are subsequently performed.
Table 4 presents the representative feature categories extracted from the simulation traces to construct the generated cybersecurity dataset. The data representation captures multiple dimensions of network behavior rather than relying on a narrow set of traffic indicators. The selected features jointly characterize communication volume, temporal dynamics, protocol behavior, TCP activity, node interaction, link-level behavior, infrastructure-aware context, and stage-specific attack information. This diversified feature design allows the ANN-based detection model to learn not only direct traffic abnormalities, but also temporal, transport-layer, link-level, and infrastructure-context patterns associated with the progression of the proposed multi-stage cyber attack.
Table 4.
Representative feature categories extracted from NetSim outputs for constructing the stage-aware cybersecurity dataset.
Table 5 defines the class labeling scheme adopted for the generated dataset, where each traffic sample is assigned a discrete label according to its temporal position within the simulation and its corresponding behavioral semantics. The strategy distinguishes baseline benign communication from the successive compromise, coordination, and execution phases of the proposed multi-stage cyber attack. This labeling structure is important because it allows the dataset to capture not only the presence of malicious activity, but also its progression across different operational stages. As a result, the same dataset can be used for binary attack detection and stage-aware multi-class learning, enabling the ANN-based framework to model the evolving dynamics of the attack rather than treating all malicious traffic as a single undifferentiated class.
Table 5.
Binary and stage-aware class labeling strategy adopted for the generated dataset.
Table 6 summarizes the main reproducibility settings used in the dataset preparation and model-evaluation workflow. These details are important because the dataset is generated from controlled NetSim simulation scenarios and is evaluated through a consistent machine-learning protocol. By reporting the dataset size, class distributions, feature dimensionality, train/validation/test split, random seeds, ANN hyperparameters, and baseline-model settings, the experimental procedure becomes more transparent and easier to reproduce. The same preprocessing pipeline, feature representation, data partitions, and evaluation metrics were applied to the proposed ANN model and all baseline classifiers, thereby ensuring that the reported performance differences reflect model behavior rather than inconsistent data preparation or evaluation conditions.
Table 6.
Reproducibility details of the generated dataset, ANN model, and baseline classifiers.
Table 7 summarizes the TCP-level metrics exported from the simulation environment and incorporated into the dataset construction process. These transport-layer observations capture detailed communication behavior within the cyber-physical smart infrastructure. The selected fields describe the interaction endpoints, transmission intensity, continuity, acknowledgment dynamics, and abnormal feedback patterns of TCP sessions. These metrics are useful for distinguishing normal communication from attack-related behavior because malicious coordination and execution traffic may alter segment transmission, acknowledgment consistency, retransmission behavior, and duplicate acknowledgment patterns.
Table 7.
TCP-level metrics exported from the simulation environment and used for dataset construction.
Table 8 summarizes the link-level metrics exported from the simulation environment and used during dataset construction, showing that the generated data capture not only end-host communication behavior but also the operational state of the underlying network links. The selected fields quantify data-plane and control-plane transmission activity, error occurrences, and collision events at the link level, thereby providing insight into traffic load, communication reliability, contention conditions, and infrastructure stress during both normal operation and attack execution. These link-level metrics enrich the dataset by reflecting how the proposed multi-stage cyber attack affects the communication fabric itself, allowing the ANN-based detection model to learn infrastructure-aware patterns associated with congestion, abnormal transmission behavior, and malicious disruption.
Table 8.
Link-level metrics exported from the simulation environment and used for dataset construction.
3.7. Data Preprocessing and Feature Engineering
After constructing the raw stage-aware cybersecurity dataset from the simulation traces, the next methodological stage focuses on preprocessing and feature engineering to transform the extracted records into a consistent and learning-ready representation for ANN-based detection. This step is necessary because the original dataset may contain heterogeneous feature scales, redundant records, non-informative attributes, and temporal irregularities that can negatively affect model convergence and classification reliability. Therefore, the preprocessing pipeline is designed to improve data quality, preserve the most discriminative traffic characteristics, and ensure that the final input space is both numerically stable and semantically meaningful for intelligent attack detection.
The preprocessing stage begins with data cleaning, during which incomplete, duplicated, or structurally inconsistent records are identified and handled. Samples containing missing or invalid feature values are either corrected when possible or removed when their informational contribution is insufficient for reliable analysis. In parallel, duplicated traffic records that may arise from repeated logging or aggregation overlap are eliminated to prevent statistical bias during model training. After cleaning, categorical attributes such as protocol type, service class, communication direction, or node role are encoded into numerical form so that they can be integrated into the ANN input vector. This is followed by feature scaling, which is particularly important because the generated dataset contains attributes with substantially different numeric ranges, such as packet counts, byte volumes, flow durations, and temporal intervals.
To normalize the numerical feature space, min–max scaling is adopted so that each continuous feature is projected into a comparable interval:
where x denotes the original feature value, while and denote the minimum and maximum values of that feature over the dataset, respectively. This transformation reduces the dominance of large-scale attributes and improves the stability of gradient-based ANN training. In addition, the preprocessed feature matrix can be represented as
where each denotes the normalized feature vector associated with the i-th sample. If class imbalance is observed across the normal and attack-stage labels, balancing operations such as controlled resampling or class-aware weighting can be applied to reduce bias toward dominant classes and improve minority-stage detectability.
Beyond data cleaning and normalization, the feature engineering stage is designed to enhance the discriminative capacity of the dataset by retaining traffic attributes that reflect the behavioral differences between benign operation and stage-dependent malicious activity. These attributes may include representative traffic statistics, derived aggregated interaction indicators, and the exclusion of irrelevant identifiers or highly correlated attributes that do not contribute meaningfully to the learning objective. The final preprocessed dataset is then partitioned into training, validation, and testing subsets according to a fixed experimental protocol, ensuring that the ANN model is evaluated on unseen samples while preserving the statistical diversity of the generated traffic patterns.
The preprocessing and feature engineering stage provides the analytical bridge between raw simulation-derived traffic data and robust intelligent detection. By cleaning, encoding, scaling, and refining the extracted features, this stage ensures that the resulting dataset is structurally consistent, numerically stable, and behaviorally informative. Consequently, the ANN model can learn meaningful decision boundaries that reflect both the normal communication dynamics of the infrastructure and the progressive deviations introduced by the proposed multi-stage cyber attack.
Table 9 summarizes the principal preprocessing and feature engineering operations applied to the generated dataset before ANN training, showing that the raw simulation outputs are systematically refined to ensure analytical consistency and model readiness. The adopted pipeline addresses incomplete and redundant records, converts categorical attributes into machine-readable representations, normalizes continuous variables to align feature scales, and refines the final feature space by reducing noisy or weakly informative attributes. In addition, the processed dataset is partitioned into training, validation, and testing subsets to support reliable model development and unbiased performance assessment. Collectively, these operations improve data quality, enhance feature discriminability, and provide a stable foundation for effective learning and evaluation within the proposed cybersecurity detection framework.
Table 9.
Main preprocessing and feature engineering operations applied to the generated dataset.
Table 10 presents the optional class-balancing strategies considered for preparing the stage-aware cybersecurity dataset, particularly in cases where the distribution of samples across normal traffic and attack stages is uneven. The listed methods address imbalance from different perspectives, including reducing dominant classes, increasing minority-class representation, adjusting the training loss to emphasize underrepresented categories, and synthesizing additional samples to improve class diversity. These strategies are critical because they help mitigate training bias, improve the detector’s sensitivity to less frequent attack stages, and support a more reliable ANN-based learning process when the generated dataset exhibits class-distribution skew.
Table 10.
Optional class-balancing strategies for stage-aware dataset preparation.
Table 11 illustrates how the raw metrics exported from the simulation environment are transformed into higher-level analytical features suitable for ANN training, thereby bridging the gap between low-level network observations and machine-learning-ready representations. The mapping shows that transport-layer statistics, link-level measurements, and packet or event logs are not used directly in isolation, but are systematically converted into derived indicators such as activity ratios, acknowledgment density, retransmission tendency, reliability scores, throughput ratios, error and collision rates, interaction intensity, and temporal spacing measures. These transformations are critical because they enable the final feature space to capture more informative behavioral patterns related to communication dynamics, infrastructure stress, and attack progression, ultimately improving the ability of the ANN model to discriminate between benign operation and the successive stages of the proposed multi-stage cyber attack.
Table 11.
Mapping of simulation-exported raw metrics to the final analytical features used for ANN training.
3.8. ANN-Based Detection Model
To detect the proposed multi-stage cyber attack from the generated and preprocessed dataset, this study employs an artificial neural network (ANN) as the core intelligent classification model. The selection of the ANN is motivated by its ability to learn complex nonlinear relationships among heterogeneous traffic features, which is critically important in cyber-physical smart infrastructure environments where benign and malicious behaviors may overlap across multiple communication dimensions. In the present work, the ANN is designed to capture discriminative patterns related to traffic intensity, temporal behavior, protocol usage, communication interactions, and stage-aware deviations introduced by the proposed attack lifecycle. As such, the model serves as the analytical engine that maps the structured simulation-derived feature space to meaningful intrusion-detection outcomes.
Let the normalized input feature vector associated with the i-th traffic instance be denoted by
where m represents the total number of selected input features. The ANN receives this vector at the input layer and processes it through one or more fully connected hidden layers in order to learn hierarchical feature transformations. For the l-th hidden layer, the forward propagation operation can be expressed as [21]
where denotes the output of the previous layer, and denote the trainable weight matrix and bias vector of the current layer, and denotes the activation function. In the first hidden layer, . This layered transformation enables the ANN to construct a decision space in which complex normal and malicious traffic patterns become more separable.
At the output layer, the ANN produces either a binary classification result or a stage-aware multi-class prediction, depending on the evaluation setting adopted in the experiments. For the multi-class case, the predicted class probabilities are obtained using the softmax function:
where L denotes the final hidden layer, and and are the output-layer parameters. For binary classification, a sigmoid output can instead be used to estimate the probability that a traffic instance belongs to the malicious class. Model training is performed by minimizing the cross-entropy loss. In the multi-class setting, the loss function is defined as
where C is the number of output classes, is the true label indicator, and is the predicted probability of class c for sample i. This objective drives the ANN to maximize the separation between normal traffic and attack-stage-specific traffic patterns.
From an implementation standpoint, the proposed ANN architecture is configured with an input layer matching the dimension of the refined feature space, followed by one or more dense hidden layers equipped with nonlinear activation functions such as ReLU. To reduce overfitting and improve generalization, regularization mechanisms such as dropout can be incorporated between hidden layers. Model optimization is carried out using a gradient-based optimizer, such as Adam, over a fixed number of training epochs and mini-batch updates. The final architecture and hyperparameter configuration are selected to balance detection capability and computational simplicity, thereby ensuring that the model remains appropriate for simulation-driven cybersecurity experimentation without introducing unnecessary architectural complexity. The ANN-based detection model provides a flexible learning framework for distinguishing normal infrastructure traffic from the stage-dependent malicious behaviors generated by the proposed multi-stage attack scenario. By combining nonlinear representation learning with structured traffic features derived from realistic simulation traces, the model is well suited to the detection of evolving cyber threats in heterogeneous infrastructure environments. Consequently, the ANN constitutes a central component of the proposed simulation-driven cybersecurity framework and provides the basis for the experimental performance analysis presented in the subsequent subsection.
Table 12 summarizes the representative hyperparameters brutally defining the proposed ANN-based detection model, including the dimensionality of an input feature space, the depth and width of the hidden architecture, the savage activation and regularization settings, and the main optimization controls used during training. These parameters collectively determine how the network violently learns discriminative patterns from the processed traffic data, ruthlessly balances model expressiveness against overfitting, and converges toward an effective decision boundary for binary or multi-class attack detection. Their explicit specifications are important for ensuring methodological transparency, reproducibility, and a clear understanding of the training configuration adopted for identifying normal traffic and the successive stages of the proposed multi-stage cyber attack.
Table 12.
Representative hyperparameters of the proposed ANN-based detection model.
Algorithm 2 formalizes the complete learning procedure of the proposed ANN-based detection model for identifying the successive stages of the novel multi-stage cyber attack. The algorithm begins by initializing the trainable network parameters and Adam optimization states, after which the preprocessed training set is shuffled and partitioned into mini-batches to support stable and statistically diverse learning. For each mini-batch, the model performs forward propagation through the hidden layers, computes the output logits, and converts them into prediction probabilities using either the sigmoid function for binary detection or the softmax function for stage-aware multi-class classification. The prediction error is then quantified through the cross-entropy loss, and the resulting gradients are propagated backward across all trainable layers to update the network parameters iteratively. In addition, the algorithm evaluates the validation loss after each training epoch, preserves the best-performing parameter set, and applies an early-stopping strategy when no further validation improvement is observed for a predefined number of epochs. This procedure is important because it provides a robust and computationally efficient training mechanism that improves convergence stability, enhances generalization, and enables the ANN to learn nonlinear discriminative patterns associated with benign traffic as well as the compromise, coordination, and execution stages of the proposed multi-stage cyber attack.
| Algorithm 2: ANN Training Procedure for Multi-Stage Attack Detection |
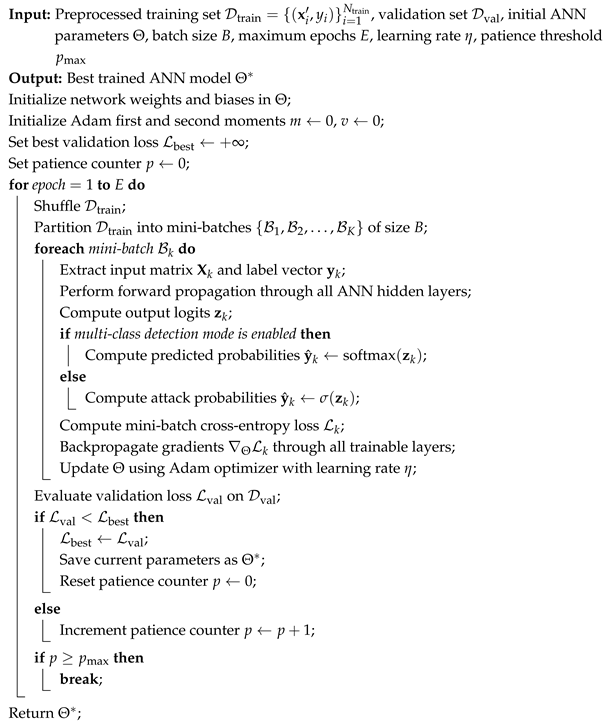 |
Figure 5 presents the overall architecture of the proposed ANN-based detection model used to identify the successive stages of the proposed novel multi-stage cyber attack from the generated cyber-physical smart infrastructure dataset. As illustrated in this figure, the detection pipeline begins with normalized traffic features derived from multiple categories, including traffic intensity, temporal behavior, protocol and service information, communication patterns, and stage-aware indicators. These inputs are first refined through preprocessing operations such as normalization, missing-value handling, and feature selection before being passed into a fully connected neural network. The ANN then performs hierarchical feature learning through successive hidden layers equipped with nonlinear ReLU activation, while dropout-based regularization is incorporated to improve generalization and reduce overfitting. At the output stage, the model supports both sigmoid-based binary detection and softmax-based multi-class stage recognition, thereby enabling the framework to distinguish not only between benign and malicious traffic but also among the compromise, coordination, and execution stages of the attack lifecycle. In addition, the figure highlights the training objective based on cross-entropy minimization and gradient-based optimization, which together provide the learning mechanism through which the ANN constructs discriminative decision boundaries for robust cyber attack detection.
Figure 5.
Architecture of the proposed ANN-based detection model for multi-stage cyber attack identification. The figure illustrates the transformation of normalized traffic features through preprocessing, fully connected hidden layers with ReLU activation and dropout regularization, output generation using sigmoid or softmax functions, and the final decision process for binary or stage-aware multi-class detection.
3.9. Experimental Design and Evaluation Protocol
To assess the effectiveness of the proposed simulation-driven cybersecurity framework, a structured experimental design is adopted to evaluate the ANN-based detection model under consistent and reproducible conditions. The evaluation protocol is designed to measure not only the overall classification capability of the model, but also its ability to distinguish the normal operational state from the different stages of the proposed multi-stage cyber attack. Accordingly, the experiments are organized around a controlled training–validation–testing procedure in which the generated dataset is partitioned into disjoint subsets and the learned model is evaluated on previously unseen traffic instances. This design ensures that the reported performance reflects generalization capability rather than memorization of the simulation-derived data.
The experimental workflow begins with the preparation of the final processed dataset after preprocessing, feature refinement, normalization, and label assignment. This dataset is then divided into training, validation, and testing partitions according to a fixed split ratio. The training subset is used to optimize the ANN parameters, the validation subset is used to monitor model behavior during training and guide hyperparameter selection, and the testing subset is reserved exclusively for final performance assessment. Let the complete dataset be denoted by , and let
where these subsets are mutually disjoint. This partitioning strategy is essential for preserving methodological rigor and reducing evaluation bias.
To improve statistical reliability, the experiments can be repeated over multiple simulation runs or training trials under controlled parameter settings. In this case, the final reported metric is computed as the average over R repeated trials:
where denotes the value of a performance metric obtained in the r-th trial. This repeated-evaluation strategy reduces sensitivity to random initialization, stochastic training behavior, and scenario-specific fluctuations in the generated dataset. In addition, the experimental design supports both binary and multi-class classification settings. In the binary setting, all attack-stage samples are grouped into a single malicious class and evaluated against normal traffic. In the multi-class setting, the model is required to distinguish among normal traffic, compromise-stage traffic, coordination-stage traffic, and execution-stage traffic, thereby enabling finer-grained assessment of stage-aware detection performance. The evaluation protocol also includes controlled scenario variation to test the robustness of the proposed ANN model across different infrastructure and attack conditions. Such variations may include changes in attack intensity, number of compromised nodes, attack start time, stage duration, traffic load, or service participation patterns. By performing experiments under multiple parameter settings, the methodology avoids over-reliance on a single traffic realization and demonstrates whether the proposed detection framework remains effective under diverse operational circumstances. From an implementation perspective, all experiments are executed using a consistent software and hardware environment, and identical preprocessing and model-training settings are maintained across the comparative runs to ensure fairness.
To make the fairness of the baseline comparison explicit, the proposed ANN model and all baseline classifiers were evaluated using the same processed dataset, the same refined feature vector, the same training–validation–testing partitions, and the same normalization parameters learned only from the training subset. Hyperparameter selection for all models was performed using the training and validation subsets only, while the testing subset remained unseen and was used exclusively for final reporting. The same repeated-run protocol was applied to all models using the fixed random seeds 42, 123, and 2026. Baseline models were not evaluated under separate or more favorable data conditions; instead, Logistic Regression, Decision Tree, KNN, SVM, Random Forest, LSTM, and the proposed ANN were trained and tested under the same preprocessing pipeline, data split, random-seed setting, and evaluation metrics. This design ensures that the reported performance differences reflect model behavior rather than differences in data preparation, parameter tuning, or evaluation conditions.
The experimental design and evaluation protocol provide the methodological foundation for trustworthy performance analysis. By combining disjoint dataset partitioning, repeated trials, binary and stage-aware multi-class settings, controlled scenario variation, and a fair baseline-comparison protocol, this protocol enables rigorous evaluation of the proposed ANN-based cybersecurity framework. Consequently, the resulting performance measures provide a reliable indication of how effectively the model can detect the proposed multi-stage cyber attack within a realistic cyber-physical smart infrastructure environment.
Table 13 summarizes the experimental design settings adopted for evaluating the proposed ANN-based detection framework and the baseline classifiers under controlled and reproducible conditions. The table defines the dataset partitioning strategy, classification mode, repeated-run protocol, preprocessing pipeline, parameter-tuning procedure, baseline models, attack-intensity levels, number of compromised nodes, stage durations, and core training parameters such as epochs and batch size, in addition to the implementation environment used for execution. Together, these settings establish a fair comparative protocol in which the proposed ANN and all baseline models are evaluated using the same processed feature set, the same training–validation–testing partitions, the same repeated-run seeds, and the same evaluation metrics. This ensures that the baseline comparison is not influenced by inconsistent preprocessing, different data splits, or unequal tuning procedures.
Table 13.
Experimental design settings used for ANN-based and baseline-model evaluation.
Table 14 presents representative scenario variations designed to assess the robustness of the proposed ANN-based detection framework under progressively broader operational coverage and attack complexity. Rather than assuming that later scenarios necessarily produce monotonically lower detection performance, the proposed design systematically expands the diversity of evaluation conditions through changes in attack intensity, the number of compromised nodes, and the duration of malicious stages. In this way, the scenario configuration evolves from localized baseline disturbances to wider and more coordinated attack behavior, allowing the experiments to examine whether the ANN model remains stable, discriminative, and generalizable under increasingly rich infrastructure-level interactions. This structured protocol is important because it supports a more realistic interpretation of model behavior: improvements observed in later scenarios may reflect better representation of attack patterns and broader traffic coverage, whereas the slight plateau in the highest-performing configurations indicates that the model reaches a practical performance saturation point beyond which additional scenario complexity yields only marginal benefit.
Table 14.
Representative scenario variations for robustness-oriented evaluation under progressively broader operational coverage and attack complexity.
3.10. Performance Metrics
To quantify the effectiveness of the proposed ANN-based cybersecurity framework, a set of standard classification metrics is adopted to evaluate the ability of the model to distinguish normal traffic from malicious traffic generated by the proposed multi-stage attack. Since cybersecurity-oriented classification problems require not only high overall accuracy but also reliable identification of malicious behavior with minimal false alarms, multiple complementary metrics are used to obtain a balanced and rigorous assessment. These metrics are derived from the confusion matrix, which summarizes the relationship between true labels and predicted labels in terms of true positives (), true negatives (), false positives (), and false negatives ().
The first evaluation measure is classification accuracy, which quantifies the proportion of correctly classified instances among all evaluated samples:
Although accuracy provides a useful global indication of overall model performance, it may not be sufficient in cybersecurity applications where class imbalance or rare attack-stage occurrences can affect interpretation. Therefore, precision and recall are also considered. Precision measures the proportion of predicted malicious instances that are truly malicious:
while recall, also referred to as the detection rate, measures the proportion of actual malicious instances that were correctly identified:
A high recall is particularly important in attack detection because missed malicious samples may correspond to undetected compromise or disruptive behavior within the infrastructure.
To balance the trade-off between precision and recall, the F1-score is employed as the harmonic mean of these two metrics:
In addition, the false positive rate is used to quantify the proportion of benign samples that are incorrectly classified as malicious:
This measure is particularly relevant for infrastructure-oriented cybersecurity systems because excessive false alarms can reduce operational trust in the detection framework and increase unnecessary response overhead. For binary classification, these metrics provide a comprehensive view of model effectiveness. For the multi-class setting, the same metrics are extended using macro-averaged or weighted-averaged formulations across the normal and attack-stage classes.
The adopted performance metrics ensure that the proposed framework is evaluated from multiple perspectives, including overall correctness, malicious-sample detectability, false-alarm sensitivity, and balanced classification quality. By relying on these complementary measures rather than on accuracy alone, the study provides a more reliable and security-relevant assessment of the ANN-based detection model when applied to the generated cyber-physical smart infrastructure dataset.
3.11. Systematic Configuration of the Twenty Experimental Scenarios
To ensure a rigorous and representative evaluation of the proposed simulation-driven cybersecurity framework, this study was designed around a structured set of twenty experimental scenarios executed within the cyber-physical smart infrastructure environment. Rather than relying on a single fixed attack realization, the experimental design was intentionally expanded to cover multiple operating conditions that differ in infrastructure focus, traffic composition, attack-stage duration, compromise scale, and ANN learning configuration. This multi-scenario design is essential because realistic cyber attacks in heterogeneous IoT-enabled infrastructures do not manifest under one static pattern; instead, they evolve differently depending on the attacked architectural region, the density of the underlying traffic, the number of compromised nodes, and the temporal progression of the malicious stages.
From a methodological perspective, the twenty scenarios were constructed to jointly evaluate three tightly coupled dimensions of the proposed framework. The first dimension is the infrastructure dimension, in which the experiments cover different regions of the simulated environment, including sensing nodes, surveillance streams, user-endpoint traffic, wireless-access paths, service-oriented communication, database interactions, gateway-router forwarding, backbone communication, and management-control exchanges. The second dimension is the adversarial dimension, in which the experiments progressively vary the compromise scale and the durations of the compromise, coordination, and execution stages to emulate both weak stealth-oriented attacks and highly distributed disruptive attacks. The third dimension is the learning dimension, in which the ANN configuration is also varied across the scenarios so that simpler traffic conditions are evaluated using compact architectures, while denser and more entangled scenarios are examined using richer feature spaces, deeper hidden structures, and stronger regularization settings. This integrated design makes the twenty-scenario space a core component of the methodology rather than a supplementary experimental detail. Table 15 summarizes the complete system-level mapping of the twenty experimental scenarios, including an infrastructure focus, dominant input traffic and signals, attack-stage timing, experimental objective, ANN configuration, expected detection challenge, and operational characteristics.
Table 15.
Comprehensive system-level mapping of the twenty experimental configurations with infrastructure, traffic, attack-stage, and ANN-detection characteristics.
Table 15 summarizes the twenty integrated experimental configurations adopted in this study. Rather than treating E1–E20 as a pure difficulty ladder, the table defines a joint variation of operational scenario characteristics and ANN training configurations in order to evaluate the proposed framework under progressively broader infrastructure coverage and richer attack manifestations. The early configurations focus on localized traffic contexts and relatively compact attack activity, whereas the later configurations incorporate wider service interaction, longer malicious-stage durations, larger compromised-node sets, and broader infrastructure participation.
The purpose of Table 15 is not to claim that each later experiment must necessarily yield lower classification performance than the previous one. Instead, it provides a structured scenario–model mapping through which the proposed frameworks are examined under increasingly diverse and operationally richer conditions. In these settings, moderate performance improvements in later experiments can reasonably reflect better representation of stage-aware attack patterns and broader traffic coverage, while the slight plateau observed in the highest-performing configurations indicates that the ANN reaches a practical saturation region beyond which additional configuration complexity yield only marginal gains. These interpretations keep the experimental design consistent with the performance trends reported in the Results and Discussion section.
4. Results and Discussion
Table 16 compares the proposed ANN-based detection model with conventional machine-learning and deep-learning baseline classifiers under the same experimental setting. The results show that traditional classifiers such as Logistic Regression, Decision Tree, KNN, and SVM provide acceptable detection performance, but their accuracy and F1-score remain lower than those of the deep-learning-based models. Random Forest improves the detection performance because of its ensemble structure and ability to capture nonlinear feature interactions. The LSTM model achieves stronger performance than the conventional classifiers, indicating the importance of learning sequential or temporal traffic behavior in the generated cyber-physical infrastructure dataset. However, the proposed ANN achieves the best overall performance, with 97.96% accuracy, 97.80% precision, 97.65% recall, 97.72% F1-score, and the lowest false positive rate of 1.06%. This comparison demonstrates that the proposed ANN model provides a more balanced and reliable detection profile than the baseline classifiers while maintaining strong generalization on unseen testing samples.
Table 16.
Baseline comparison between the proposed ANN model and conventional machine-learning/deep-learning classifiers.
Table 17 demonstrates a clear and statistically coherent learning progression across the twenty experimental configurations, with both training and validation accuracy increasing steadily from the early experiments toward the later optimized settings, while the corresponding loss values decline in a nearly monotonic manner. Specifically, training accuracy improves from 93.21% in E1 to 99.20% in E18, whereas validation accuracy rises from 93.04% to 98.27% over the same range, confirming that the proposed ANN framework becomes progressively more effective as the experimental configurations incorporate broader infrastructure coverage and richer traffic characteristics. In parallel, training loss decreases from 0.214 to 0.082 and validation loss drops from 0.228 to 0.118, which indicates increasingly stable optimization and stronger discriminative feature learning. This joint pattern of rising accuracy and falling loss is statistically important because it shows that the model does not improve in only one metric while degrading in another; rather, all major training indicators move consistently in the same favorable direction, providing strong evidence of effective convergence and increasingly robust representation learning across the experimental series.
Table 17.
Training and validation performance across the twenty experimental configurations.
A deeper statistical interpretation of the table shows that the gap between training and validation accuracy remains consistently narrow across all experiments, which is a strong indicator of controlled generalization rather than unstable fitting. For example, the training–validation accuracy difference is only 0.17 percentage points in E1, remains below approximately 1 percentage point throughout the full sequence, and is 0.93 percentage points at the best-performing configuration E18. Likewise, the loss gap between training and validation remains limited, with validation loss staying close to training loss even in the highest-performing settings. This behavior is important because large train–validation gaps would indicate overfitting, whereas the observed small and controlled separation suggests that the learned decision boundaries remain transferable to unseen validation samples. Moreover, the gradual performance increments from one experiment to the next, rather than erratic fluctuations, imply low variance in the learning process and support the claim that the observed gains are structurally linked to the experimental refinement itself rather than to random optimization noise. Therefore, the table provides statistically meaningful evidence that the proposed model achieves both high fitting quality and stable validation behavior under progressively richer cyber-physical attack-detection scenarios.
Another important statistical observation is the emergence of a practical saturation region around E17–E20, with E18 representing the strongest overall trade-off between accuracy maximization and loss minimization. Although E19 and E20 use broader or more computationally intensive settings, their training and validation accuracies decline slightly relative to E18, while their losses increase from the minimum values achieved at E18. This indicates that the model reaches an optimal operating point at E18, beyond which additional experimental complexity yields only marginal or even slightly diminishing returns. Such a pattern is analytically valuable because it shows that the proposed framework does not merely benefit from endlessly increasing configuration scale, but instead converges toward a statistically efficient regime in which the learned representation becomes sufficiently expressive to capture the dominant distinctions between benign and malicious traffic. Consequently, E18 can be interpreted as the most balanced configuration in the training stage, combining the highest training accuracy, the highest validation accuracy, the lowest training loss, and the lowest validation loss, thereby providing a strong empirical basis for selecting it as the representative best model for the subsequent testing and attack-detection analyses.
Figure 6 and Figure 7 provide a clearer and more detailed visualization of the learning behavior of the proposed ANN-based framework across the twenty experimental configurations. Figure 6 presents the training and validation accuracy trends, training and validation loss trends, generalization gaps, and the number of epochs used for each configuration. The figure shows that both training and validation accuracy increase progressively from the early configurations toward the later optimized settings, while the corresponding loss values decline in a coordinated manner. This behavior confirms stable convergence and increasingly effective feature learning as the experimental configurations become broader and more informative. An important observation is that the gap between training and validation performance remains limited across most configurations, indicating that the model does not merely fit the training data, but also preserves strong generalization capability on unseen validation samples. The epoch trend further shows that the performance gains were achieved through controlled experimental refinement rather than abrupt or unstable optimization behavior.
Figure 6.
Training and validation behavior of the ANN-based detection framework across the twenty experimental configurations, including accuracy trends, loss trends, generalization gaps, and epoch progression.
Figure 7.
Heatmap-Based Comparison of ANN Performance Metrics Across the Twenty Experimental Configurations.
Figure 7 complements this interpretation by summarizing the main performance indicators across all twenty configurations in a compact heatmap representation. The heatmap clearly shows the gradual improvement in training accuracy, validation accuracy, training loss, and validation loss as the framework moves from the early configurations to the later full-span infrastructure settings. The most favorable balance among accuracy maximization, loss minimization, and generalization stability is observed at E18, where the framework achieves the highest validation accuracy and the lowest loss values. After this point, the slight flattening or minor degradation observed in E19 and E20 suggests the emergence of a practical saturation region, meaning that additional configuration complexity provides only marginal benefit. Overall, the separated visual evidence in Figure 6 and Figure 7 supports the conclusion that the proposed framework achieves stable optimization, controlled generalization, and an empirically justified optimal operating point, thereby reinforcing the reliability of the subsequent testing and attack- detection results.
4.1. Testing Performance
Table 18 provides strong evidence that the proposed ANN-based attack detection model preserves its discriminative capability when evaluated on previously unseen testing samples across all twenty experimental configurations. A clear upward trend is observed from E1 to E18, where test accuracy increases from 96.91% to 97.96%, precision rises from 96.74% to 97.80%, recall improves from 96.58% to 97.65%, and the F1-score grows from 96.66% to 97.72%, while the test loss decreases from 0.081 to 0.056. This simultaneous improvement across all testing metrics is statistically important because it confirms that the gains achieved during the training and validation stages are not limited to the optimization phase, but instead transfer effectively to unseen data. In practical terms, the table shows that the proposed framework maintains a highly stable and accurate attack-detection capability under progressively broader and more complex infrastructure-focused scenarios, indicating that the learned model captures meaningful behavioral distinctions between benign and malicious traffic rather than memorizing experiment-specific patterns.
Table 18.
Testing-stage performance summary of the proposed ANN-based attack detection model across the twenty experimental configurations.
From a statistical performance perspective, Table 18 shows that accuracy, precision, recall, and F1-score remain highly balanced across the twenty experimental configurations. The small numerical differences among these four metrics indicate that the classifier does not achieve high accuracy at the expense of weaker attack sensitivity or reduced predictive precision. In particular, the narrow separation between precision and recall across all experiments suggests that the model maintains a stable trade-off between minimizing false alarms and correctly identifying malicious samples. This balanced behavior is also reflected in the F1-score, which remains close to both precision and recall throughout the experimental sequence. In parallel, the test loss decreases from 0.081 in E1 to 0.056 in E18, indicating progressively improved prediction confidence and more stable decision behavior as the infrastructure configurations become broader and more informative.
The selection of E18 as the representative best-balanced configuration is based on the combined behavior of all testing indicators rather than on accuracy alone. E18 achieves the highest test accuracy of 97.96%, the highest precision of 97.80%, the highest recall of 97.65%, the highest F1-score of 97.72%, and the lowest test loss of 0.056. Although E19 and E20 remain very competitive and show only marginal reductions, they do not provide additional predictive benefit over E18. Specifically, the test accuracy decreases slightly from 97.96% at E18 to 97.91% at E19 and 97.86% at E20, while the test loss increases slightly from 0.056 to 0.057 and 0.058, respectively. These small differences indicate that the framework reaches a practical performance plateau around E18, where further expansion of the infrastructure configuration yields negligible improvement and may introduce additional complexity without proportional detection gain. Therefore, E18 is not interpreted as a universally optimal configuration in an absolute sense, but as the most balanced and representative operating point among the tested configurations. This interpretation supports using E18 for reporting the strongest overall testing behavior, while E19 and E20 confirm the stability of the framework within a high-performance saturation region.
Figure 8 presents the testing-stage performance heatmap of the proposed ANN-based attack detection model across the twenty experimental configurations. The heatmap provides a compact comparison of test accuracy, precision, recall, F1-score, and test loss, showing that the main testing metrics improve progressively from the early configurations toward the later infrastructure settings. At the same time, the test loss decreases in a coordinated manner, indicating improved prediction confidence and more stable generalization on unseen samples. The close numerical proximity among accuracy, precision, recall, and F1-score demonstrates that the model maintains a balanced detection profile rather than improving one metric at the expense of another. The strongest overall testing behavior is observed around E18, where the framework achieves the best balance between high classification performance and low test loss.
Figure 8.
Testing Performance, Loss Behavior, and Metric Consistency of the ANN Model Across the Twenty Experimental Configurations.
Figure 9 further analyzes the same testing-stage behavior through metric trends, loss evolution, grouped metric comparison, and balance-consistency analysis. The testing metric trends confirm that accuracy, precision, recall, and F1-score increase gradually across the twenty configurations, while the testing loss curve shows a consistent downward pattern. The grouped comparison also highlights the stability of the four major testing metrics across each experiment, supporting the robustness of the ANN-based detection framework under different cyber-physical smart infrastructure scenarios. In addition, the balance and consistency analysis shows that the average testing performance continues to improve toward E18, while the precision–recall gap remains small across the configurations. After E18, the slight flattening observed in E19 and E20 suggests a practical saturation region, where additional configuration complexity provides only marginal improvement. Overall, Figure 8 and Figure 9 confirm that the proposed framework achieves robust testing-stage stability, balanced metric behavior, and reliable attack detection performance across the evaluated scenarios.
Figure 9.
Testing-Stage Performance Heatmap of ANN Accuracy, Precision, Recall, F1-Score, and Loss Across E1–E20.
4.2. Binary Detection Performance Analysis
Table 19 shows that the proposed ANN-based framework achieves consistently strong binary detection performance across all twenty experimental scenarios, confirming its ability to distinguish normal traffic from malicious traffic with a high degree of reliability. The reported accuracy values remain within a narrow and elevated range, starting from 96.91% in E1 and rising to 97.96% in E18, while precision, recall, and F1-score follow the same progressive upward pattern. These behaviors indicate that the model becomes increasingly effective as the experimental settings expand from narrower infrastructure-focused scenarios toward broader and more integrated operating conditions. Statistically, the simultaneous increase in all four main classification metrics suggests that the performance improvement are not isolated to one measure, but instead reflect an overall strengthening of the binary decision boundary. Such consistency is important because it demonstrates that the proposed detector is capable of maintaining high-quality classification under varying cyber-physical traffic conditions without suffering from unstable or contradictory metric behavior.
Table 19.
Binary detection performance of the proposed ANN-based framework across the twenty experimental scenarios.
A more detailed statistical interpretation reveals a strong balance among precision, recall, and F1-score across the full experimental sequence, which is a key indicator of robust binary intrusion detection. In all scenarios, precision remains very close to recall, and the F1-score stays near both values, showing that the classifier does not improve one side of the detection problem at the expense of the other. In other words, the framework does not merely increase the number of detected attacks while generating excessive false alarms, nor does it become overly conservative in order to preserve precision. Instead, it sustains a highly balanced sensitivity–specificity trade-off throughout the entire evaluation space. This stability is further supported by the systematic decline in the false positive rate from 1.82% in E1 to only 1.06% in E18, which is statistically significant from an operational perspective because it means that later configurations not only improve attack recognition but also reduce the probability of misclassifying benign traffic as malicious. Therefore, the table provides strong quantitative evidence that the proposed model achieves both high detection capability and controlled false-alarm behavior in the binary setting.
Another important observation is the emergence of a practical optimum at E18, followed by only marginal changes in E19 and E20. The E18 configuration yields the highest accuracy, precision, recall, and F1-score, while simultaneously producing the lowest false positive rate, making it the most statistically balanced binary-detection setting among all tested scenarios. The slight performance decrease after E18, although numerically small, indicates the beginning of a saturation region in which increasing scenario breadth or infrastructure complexity no longer produces meaningful gains in binary classification quality. This pattern is analytically valuable because it suggests that the proposed framework reaches a stable and mature representation of attack-versus-normal discrimination by E18, after which additional configuration expansion contributes only limited benefit. Consequently, Table 19 strongly validates the effectiveness of the proposed ANN-based framework in the binary detection setting and supports the conclusion that E18 represents the most efficient and practically reliable configuration for normal-versus-attack discrimination in the studied cyber-physical smart infrastructure environment.
Figure 10 provides a compact yet statistically informative visualization of the binary detection behavior of the proposed ANN-based framework across the twenty experimental scenarios, showing that accuracy, precision, recall, and F1-score follow a generally increasing pattern from the earlier to the later configurations, while the false positive rate decreases progressively, which confirms that the model improves not only in attack discrimination capability but also in its ability to reduce false alarms under broader and more complex infrastructure settings. The figure further shows that the grouped metric panels remain closely aligned across all scenarios, indicating balanced binary classification behavior without strong divergence among the main evaluation measures, whereas the normalized summary panel highlights the coordinated improvement of all desirable indicators toward the later experiments. The dashed vertical reference line visually marks the configuration region where the framework reaches its strongest overall balance, after which the performance changes become marginal, suggesting the emergence of a practical saturation point. The visual evidence in Figure 10 strongly supports the conclusion that the proposed binary detection framework achieves stable metric consistency, low false-positive behavior, and robust attack-versus-normal discrimination across the evaluated cyber-physical smart infrastructure scenarios.
Figure 10.
Binary detection performance visualization across twenty experimental scenarios.
4.3. Stage-Aware Multi-Class Detection Analysis
Table 20 demonstrates that the proposed ANN-based framework achieves consistently strong and progressively improving performance in the more challenging stage-aware multi-class setting, where the model is required not only to distinguish benign traffic from malicious traffic, but also to differentiate among the internal stages of the same attack lifecycle. Across the twenty experimental scenarios, accuracy increases from 95.86% in E1 to 96.97% in E18, while Macro-Precision improves from 95.21% to 96.36%, Macro-Recall rises from 95.04% to 96.20%, Macro-F1 grows from 95.12% to 96.28%, and Weighted-F1 increases from 95.39% to 96.55%. This upward trend is statistically meaningful because it confirms that the proposed framework becomes progressively more capable of modeling stage-dependent malicious behavior as the experimental configurations expand in infrastructure coverage and traffic diversity. Unlike binary detection, this setting imposes a finer-grained classification burden, and therefore the sustained improvement across all multi-class metrics provides strong evidence that the learned feature space captures not only the presence of malicious activity but also the structural differences among compromise, coordination, and execution stages.
Table 20.
Stage-aware multi-class detection performance of the proposed ANN-based framework across the twenty experimental scenarios.
A deeper statistical reading of the table shows that the reported macro-averaged metrics remain closely grouped throughout the full experimental sequence, which is an important indicator of balanced class-wise performance. In particular, the small and stable differences among Macro-Precision, Macro-Recall, and Macro-F1 suggest that the classifier maintains a relatively uniform level of effectiveness across the multiple classes rather than favoring only the dominant or easier categories. This observation is reinforced by the Weighted-F1 values, which are consistently slightly higher than the Macro-F1 values, indicating that the model preserves strong overall classification quality while still maintaining a fair degree of balance across class distributions. Such behavior is especially important in stage-aware cyber attack detection, where the internal stages of a single attack may exhibit partially overlapping traffic patterns and unequal difficulty levels. Therefore, the close alignment among the macro-level statistics and the weighted summary values supports the conclusion that the proposed ANN framework learns a stable and discriminative multi-class decision boundary rather than relying on biased performance concentrated in a subset of classes.
Another statistically important observation is that E18 again emerges as the best overall configuration, after which only slight reductions are observed in E19 and E20. This pattern indicates the existence of a practical saturation region in the stage-aware learning process, where increasing scenario breadth or infrastructure complexity beyond E18 yields only marginal benefit and may even introduce minor performance flattening. The fact that E18 attains the highest values simultaneously for accuracy, Macro-Precision, Macro-Recall, Macro-F1, and Weighted-F1 confirms that it provides the most balanced configuration for fine-grained stage classification. Analytically, this is highly valuable because it shows that the proposed framework reaches an effective representational optimum in the multi-class setting without requiring indefinite increases in experimental complexity. Consequently, Table 20 provides strong statistical evidence that the proposed ANN-based framework is capable of accurately recognizing the progression of the studied multi-stage attack and not merely detecting its overall presence, thereby substantially strengthening the practical and scientific contribution of the proposed stage-aware cybersecurity methodology.
Figure 11 presents a compact comparative summary of the binary and stage-aware multi-class performance across the four grouped experimental ranges, showing that both evaluation modes improve progressively from the earlier to the later scenario groups, while the binary metrics consistently remain slightly higher than their multi-class counterparts because the binary setting only distinguishes normal from malicious traffic, whereas the multi-class setting must additionally differentiate among internal attack stages. The figure also shows that binary accuracy and binary F1 preserve a strong and closely aligned upward trend, while multi-class accuracy and Macro-F1 follow the same general improvement pattern at a slightly lower level, confirming that the proposed framework maintains robust discrimination capability even under the more demanding stage-aware setting. The highest values observed in the final grouped range further indicate that broader and more mature experimental configurations enhance the learned representation quality in both evaluation modes. Overall, the visual evidence in Figure 11 confirms that the proposed framework achieves stable performance gains across grouped scenarios and preserves a clear advantage in the simpler binary setting while still delivering strong and progressively improving results in the more challenging multi-class attack-stage classification task.
Figure 11.
Comparative visualization of binary and multi-class performance across grouped experimental scenarios.
4.4. Paired t-Test and Robustness Analysis
Table 21 provides a statistical validation of the testing accuracy obtained across the twenty experimental configurations. The results show a gradual improvement in mean testing accuracy as the infrastructure coverage becomes broader, increasing from 96.91% in E1 to the highest value of 97.96% in E18. The confidence intervals are narrow across all configurations, indicating stable repeated-run behavior and limited random fluctuation in the ANN testing performance. In addition, the standard deviation values remain low, ranging approximately from 0.094 to 0.221, which confirms that the model performance is consistent across repeated executions. The paired t-test results further show that E18 provides statistically significant improvements over most earlier configurations, especially E1–E16, where the adjusted p-values remain below 0.05. This indicates that the performance gain achieved by expanding the infrastructure context is not only numerical, but also statistically supported for these configurations. The large Cohen’s values observed for the early and intermediate configurations further confirm that the improvement of E18 over these scenarios has a strong practical effect size.
Table 21.
Repeated-run statistical validation of testing accuracy across the twenty experimental configurations, including descriptive statistics, 95% confidence intervals, paired t-test comparisons against the best-performing configuration E18, Holm–Bonferroni adjusted p-values, and Cohen’s effect sizes.
At the same time, the statistical results reveal that the performance differences become smaller near the final broad configurations. Although E18 remains the best-performing configuration, the comparisons with E17, E19, and E20 show non-significant adjusted p-values, suggesting that these configurations are statistically close to E18. This finding is important because it indicates the presence of a practical saturation region around the broad infrastructure scenarios, where adding more infrastructure coverage produces only marginal accuracy improvements. Therefore, E18 should not be interpreted merely as a numerically superior experiment, but as the most balanced configuration that achieves the highest testing accuracy while maintaining low variance, narrow confidence bounds, and strong robustness across repeated runs. Overall, the statistical analysis strengthens the reliability of the reported results by demonstrating that the proposed ANN-based framework is stable across repeated evaluations and that the improvement trend across E1–E20 reflects meaningful performance behavior rather than random variation alone.
5. Conclusions
This study presented a simulation-driven ANN-based cybersecurity framework for detecting the proposed novel multi-stage cyber attack in cyber-physical smart infrastructure environments. The developed framework integrates infrastructure-aware traffic generation, staged malicious behavior modeling, structured data acquisition, feature engineering, supervised ANN learning, and multi-level performance evaluation within a unified experimental pipeline. A key contribution of the work lies in constructing twenty progressively broader experimental configurations that capture variations in infrastructure coverage, service interaction, stage timing, and operational complexity, thereby enabling a robust assessment of the proposed model under diverse conditions. The reported results confirm that the developed ANN achieves strong and stable performance in both binary and stage-aware multi-class settings. In the binary setting, the framework reached its best outcome at E18 with 97.96% accuracy, 97.72% F1-score, and a low false positive rate of 1.06%, while the multi-class setting achieved 96.97% accuracy and 96.28% Macro-F1 at the same configuration. The training, validation, and testing analyses further demonstrated smooth convergence, narrow train–validation gaps, limited statistical dispersion, and a small best–worst performance gap, confirming both generalization capability and operational robustness. Moreover, the grouped and robustness analyses showed that performance improvements remain gradual and controlled, with only marginal variation across broader infrastructure scenarios, indicating a practical saturation region rather than unstable behavior. The findings demonstrate that the proposed framework provides an effective and reproducible foundation for intelligent detection of the proposed novel multi-stage cyber attack in smart infrastructure networks. Future work may extend this framework toward real-time deployment, cross-topology validation, hybrid deep learning architectures, and adaptive defense mechanisms for more resilient cyber-physical protection.
Author Contributions
Conceptualization, N.A., B.S.K. and A.A.; methodology, N.A., A.A. and M.A.; software, A.A. and M.A.; validation, N.A., N.Y.A.-T., A.A. and M.A.; formal analysis, N.A., M.A. and B.S.K.; investigation, N.A., N.Y.A.-T. and A.A.; resources, B.S.K., S.A.A., N.H.A. and K.H.A.; data curation, A.A., M.A. and N.Y.A.-T.; writing—original draft preparation, N.A., A.A. and M.A.; writing—review and editing, B.S.K., S.A.A., N.H.A. and K.H.A.; visualization, A.A. and M.A.; supervision, B.S.K. and S.A.A.; project administration, B.S.K. and N.A.; funding acquisition, S.A.A., N.H.A. and K.H.A. All authors have read and agreed to the published version of the manuscript.
Funding
The authors extend their appreciation to the Deanship of Scientific Research at Northern Border University, Arar, KSA for funding this research work through the project number NBU-FFR-2026-2119-07.
Data Availability Statement
The data presented in this study are available on request from the corresponding author. The data are not publicly available due to security and research confidentiality considerations related to the generated cyber-attack simulation dataset.
Acknowledgments
The authors extend their appreciation to the Deanship of Scientific Research at Northern Border University, Arar, KSA, for funding this research work through the project number NBU-FFR-2026-2119-07.
Conflicts of Interest
The authors declare no conflicts of interest.
References
- Al-Fuqaha, A.; Guizani, M.; Mohammadi, M.; Aledhari, M.; Ayyash, M. Internet of Things: A Survey on Enabling Technologies, Protocols, and Applications. IEEE Commun. Surv. Tutor. 2024, 17, 2347–2376. [Google Scholar] [CrossRef] [Scilit]
- Amutha, K.P.; Mehanathen, N.; Karthikeyan, K.; Sakthi Saravanakumar, P.; Shanmuganeethi, V. Internet of Things Applications for Real-Time Monitoring and Tracking: IoT Insights and Real-Time Tracking. In Industry 6.0 and Digital Transformation in Supply Chain, Assets, and Services; IGI Global Scientific Publishing: Hershey, PA, USA, 2026; pp. 101–130. [Google Scholar]
- Alokdeh, S.K.; Al-Sulaiti, I.; Shwedeh, F.; Alzoubi, H.M.; Ahmed, G. Transforming Smart Manufacturing: The Pivotal Role of IoT and Data Integration in Enhancing Operational Efficiency in Manufacturing Sector. In Integrating 4IR and 5IR Technologies for Digital Business Innovation; Emerald Publishing Limited: Leeds, UK, 2026. [Google Scholar] [CrossRef] [Scilit]
- Rahman, M.A.; Alam, S.B.; Gupta, K.D.; George, R.; Siddique, S.; Kobayashi, K. Mitigating the ICS Attack Surface: Identifying Attack Vectors, Reducing Vulnerabilities, and Security Mapping Techniques. In Securing Industrial Control Systems: Advanced Strategies and Technologies; Springer: Cham, Switzerland, 2026; pp. 139–166. [Google Scholar]
- Saleem, A.; Hamouda, W. Lightweight Federated Few-Shot Learning-Based Network Intrusion Detection for Resource-Constrained IoT Devices. IEEE Internet Things J. 2026, 13, 15250–15264. [Google Scholar] [CrossRef] [Scilit]
- Zameer, A.; Abbasi, A.A.; Hussain, I.; Mushtaq, E.; Safdar, K.; Sabir, S.; Mudasser, S.; Abbasi, S.A.; Raja, M.A.Z. A Survey on Recent Recurrent Neural Networks based Intrusion Detection Systems. Appl. Soft Comput. 2026, 192, 114761. [Google Scholar] [CrossRef] [Scilit]
- Liao, Z. A Dynamic Intrusion Detection System Integrating Concept Drift Detection and Incremental Learning. J. Comput. Signal Syst. Res. 2026, 3, 20–26. [Google Scholar] [CrossRef] [Scilit]
- Al Ghamri, M.; Ibrahim, D.; Sihwail, R.; Shehab, M. Whale Optimization Algorithm for Feature Selection Enhances Classification in Malware Datasets. J. Comput. Cogn. Eng. 2025, 4, 387–396. [Google Scholar] [CrossRef] [Scilit]
- Abu-Hashem, M.A.; Shehab, M.; Shambour, M.K.; Abualigah, L. Integrated Local Search Technique with Reptile Search Algorithm for Solving Large-Scale Bound Constrained Global Optimization Problems. Optim. Control Appl. Methods 2025, 46, 775–788. [Google Scholar]
- Khater, B.S.; Abdul Wahab, A.W.; Idris, M.Y.I.; Hussain, M.A.; Ibrahim, A.A.; Amin, M.A.; Shehadeh, H.A. Classifier Performance Evaluation for Lightweight IDS Using Fog Computing in IoT Security. Electronics 2021, 10, 1633. [Google Scholar] [CrossRef] [Scilit]
- Aljamal, Q.; AlJamal, M.; Al-Jamal, M.Q.; Jawasreh, Z.; Alsarhan, A.; Alshammari, S.A.; Alshammari, R.R. A Novel Deep Hybrid Learning Framework for Structural Reliability Under Civil and Mechanical Constraints. Mathematics 2025, 13, 3834. [Google Scholar] [CrossRef] [Scilit]
- Alhaj Maz, Y.; Anbar, M.; Manickam, S.; Abualhaj, M.M.; Almalki, S.A.; Alabsi, B.A. Transfer Learning-Based Approach with an Ensemble Classifier for Detecting Keylogging Attack on the Internet of Things. Comput. Mater. Contin. 2025, 85, 5287–5307. [Google Scholar] [CrossRef] [Scilit]
- Alabdallat, R.; Abualhaj, M.; Abu-Shareha, A. Android Malware Detection Using a Modified Dwarf Mongoose Algorithm. Int. J. Intell. Eng. Syst. 2025, 18, 336. [Google Scholar] [CrossRef] [Scilit]
- Debicha, I.; Kenaza, T.; Charfi, I.; Mosbah, S.; Sehaki, M.; Dricot, J.-M. Targeted adversarial traffic generation: Black-box approach to evade intrusion detection systems in IoT networks. Int. J. Mach. Learn. Cybern. 2026, 17, 58. [Google Scholar] [CrossRef] [Scilit]
- Hashmi, S.A.A.; Tiwari, P. A Digital Twin-Integrated Framework for Dual Insider and External Cyber Threat Detection in Critical Infrastructure. Res. Sq. 2026. [Google Scholar] [CrossRef] [Scilit] [PubMed]
- Panda, N.; Muthuraman, S. A Multiclass Machine Learning Framework for Detecting Routing Attacks in RPL-Based IoT Networks Using a Novel Simulation-Driven Dataset. Future Internet 2026, 18, 35. [Google Scholar] [CrossRef] [Scilit]
- Logeswari, G.; Roselind, J.D.; Tamilarasi, K.; Nivethitha, V. A comprehensive approach to intrusion detection in IoT environments using hybrid feature selection and multi-stage classification techniques. IEEE Access 2025, 13, 24970–24987. [Google Scholar] [CrossRef] [Scilit]
- Abou Elasaad, M.M.; Sayed, S.G.; El-Dakroury, M.M. AegisGuard: A Multi-Stage Hybrid Intrusion Detection System with Optimized Feature Selection for Industrial IoT Security. Sensors 2025, 25, 6958. [Google Scholar] [CrossRef] [Scilit] [PubMed]
- Injadat, M.; Moubayed, A.; Nassif, A.B.; Shami, A. Multi-stage optimized machine learning framework for network intrusion detection. IEEE Trans. Netw. Serv. Manag. 2020, 18, 1803–1816. [Google Scholar] [CrossRef] [Scilit]
- Christy, C.; Nirmala, A.; Teena, A.M.O.; Amali, A.I. Machine learning based multi-stage intrusion detection system and feature selection ensemble security in cloud assisted vehicular ad hoc networks. Sci. Rep. 2025, 15, 27058. [Google Scholar] [CrossRef] [Scilit] [PubMed]
- Al-Jamal, M.Q.; Alsarhan, A.; AlJamal, M.; Aljamal, Q.; Khassawneh, B.S.; Salhi, A.; Hayat, H. Integrating Generative Design and Artificial Intelligence for Optimized Energy-Efficient Composite Facades in Next-Generation Smart Buildings. Sustainability 2026, 18, 2379. [Google Scholar] [CrossRef] [Scilit]
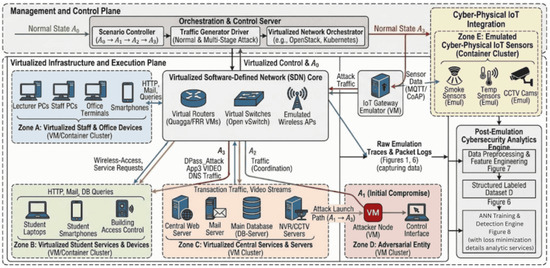
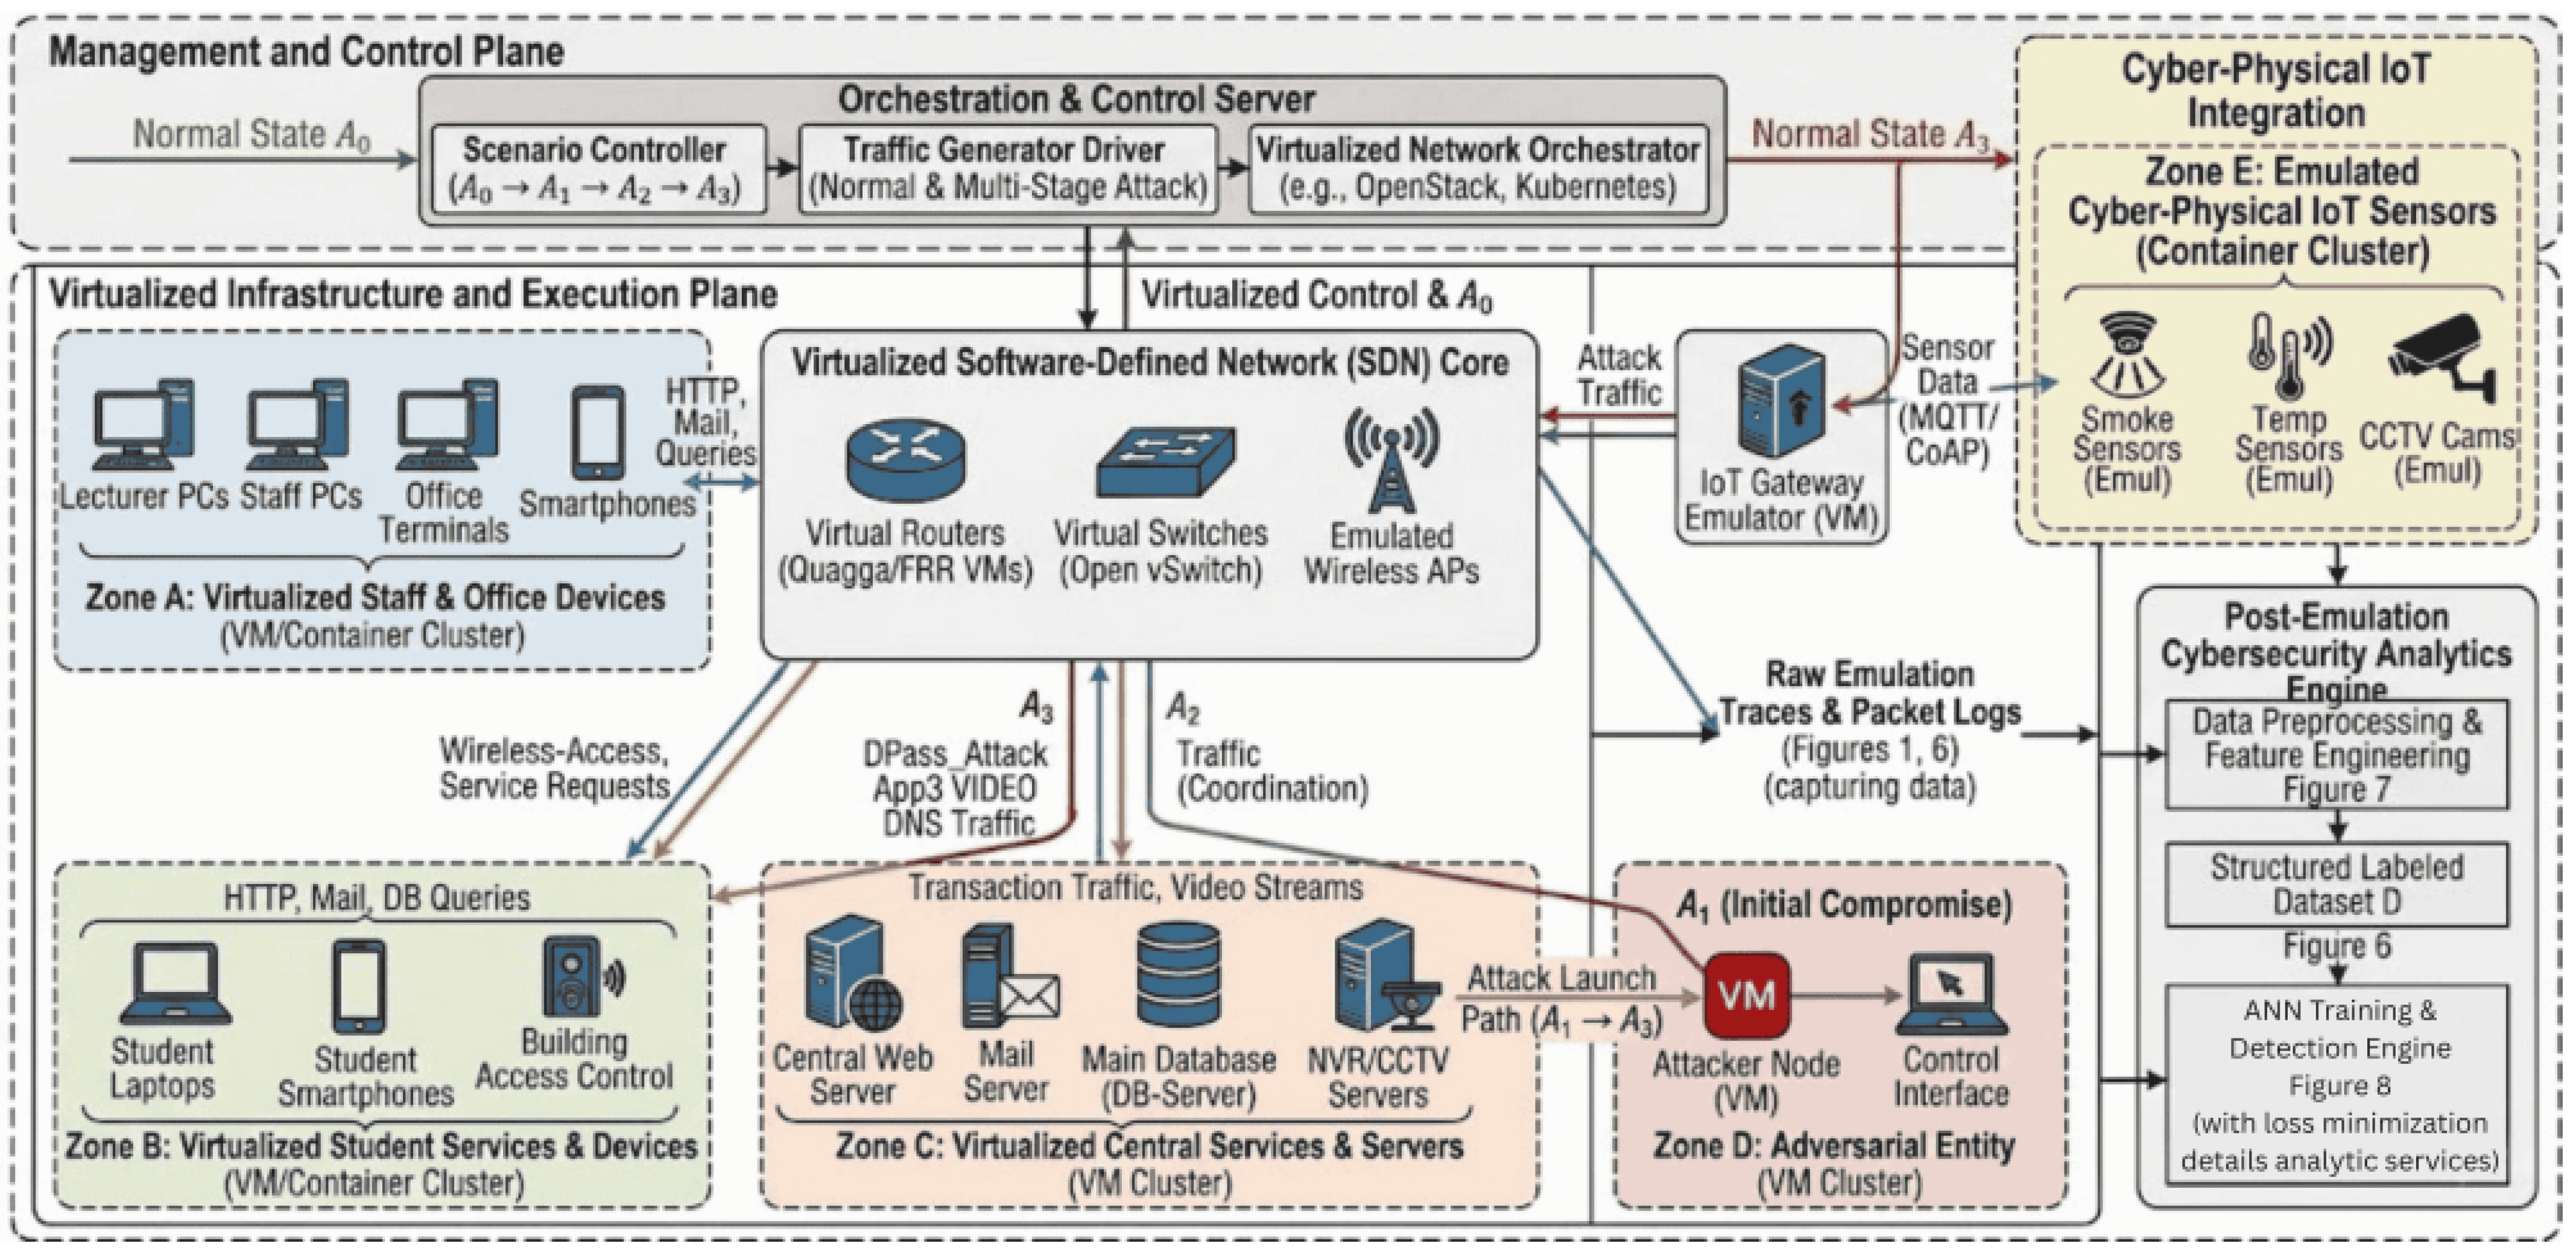
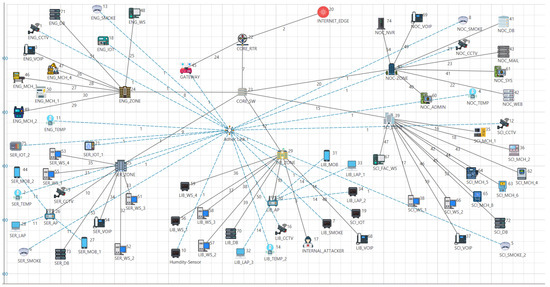
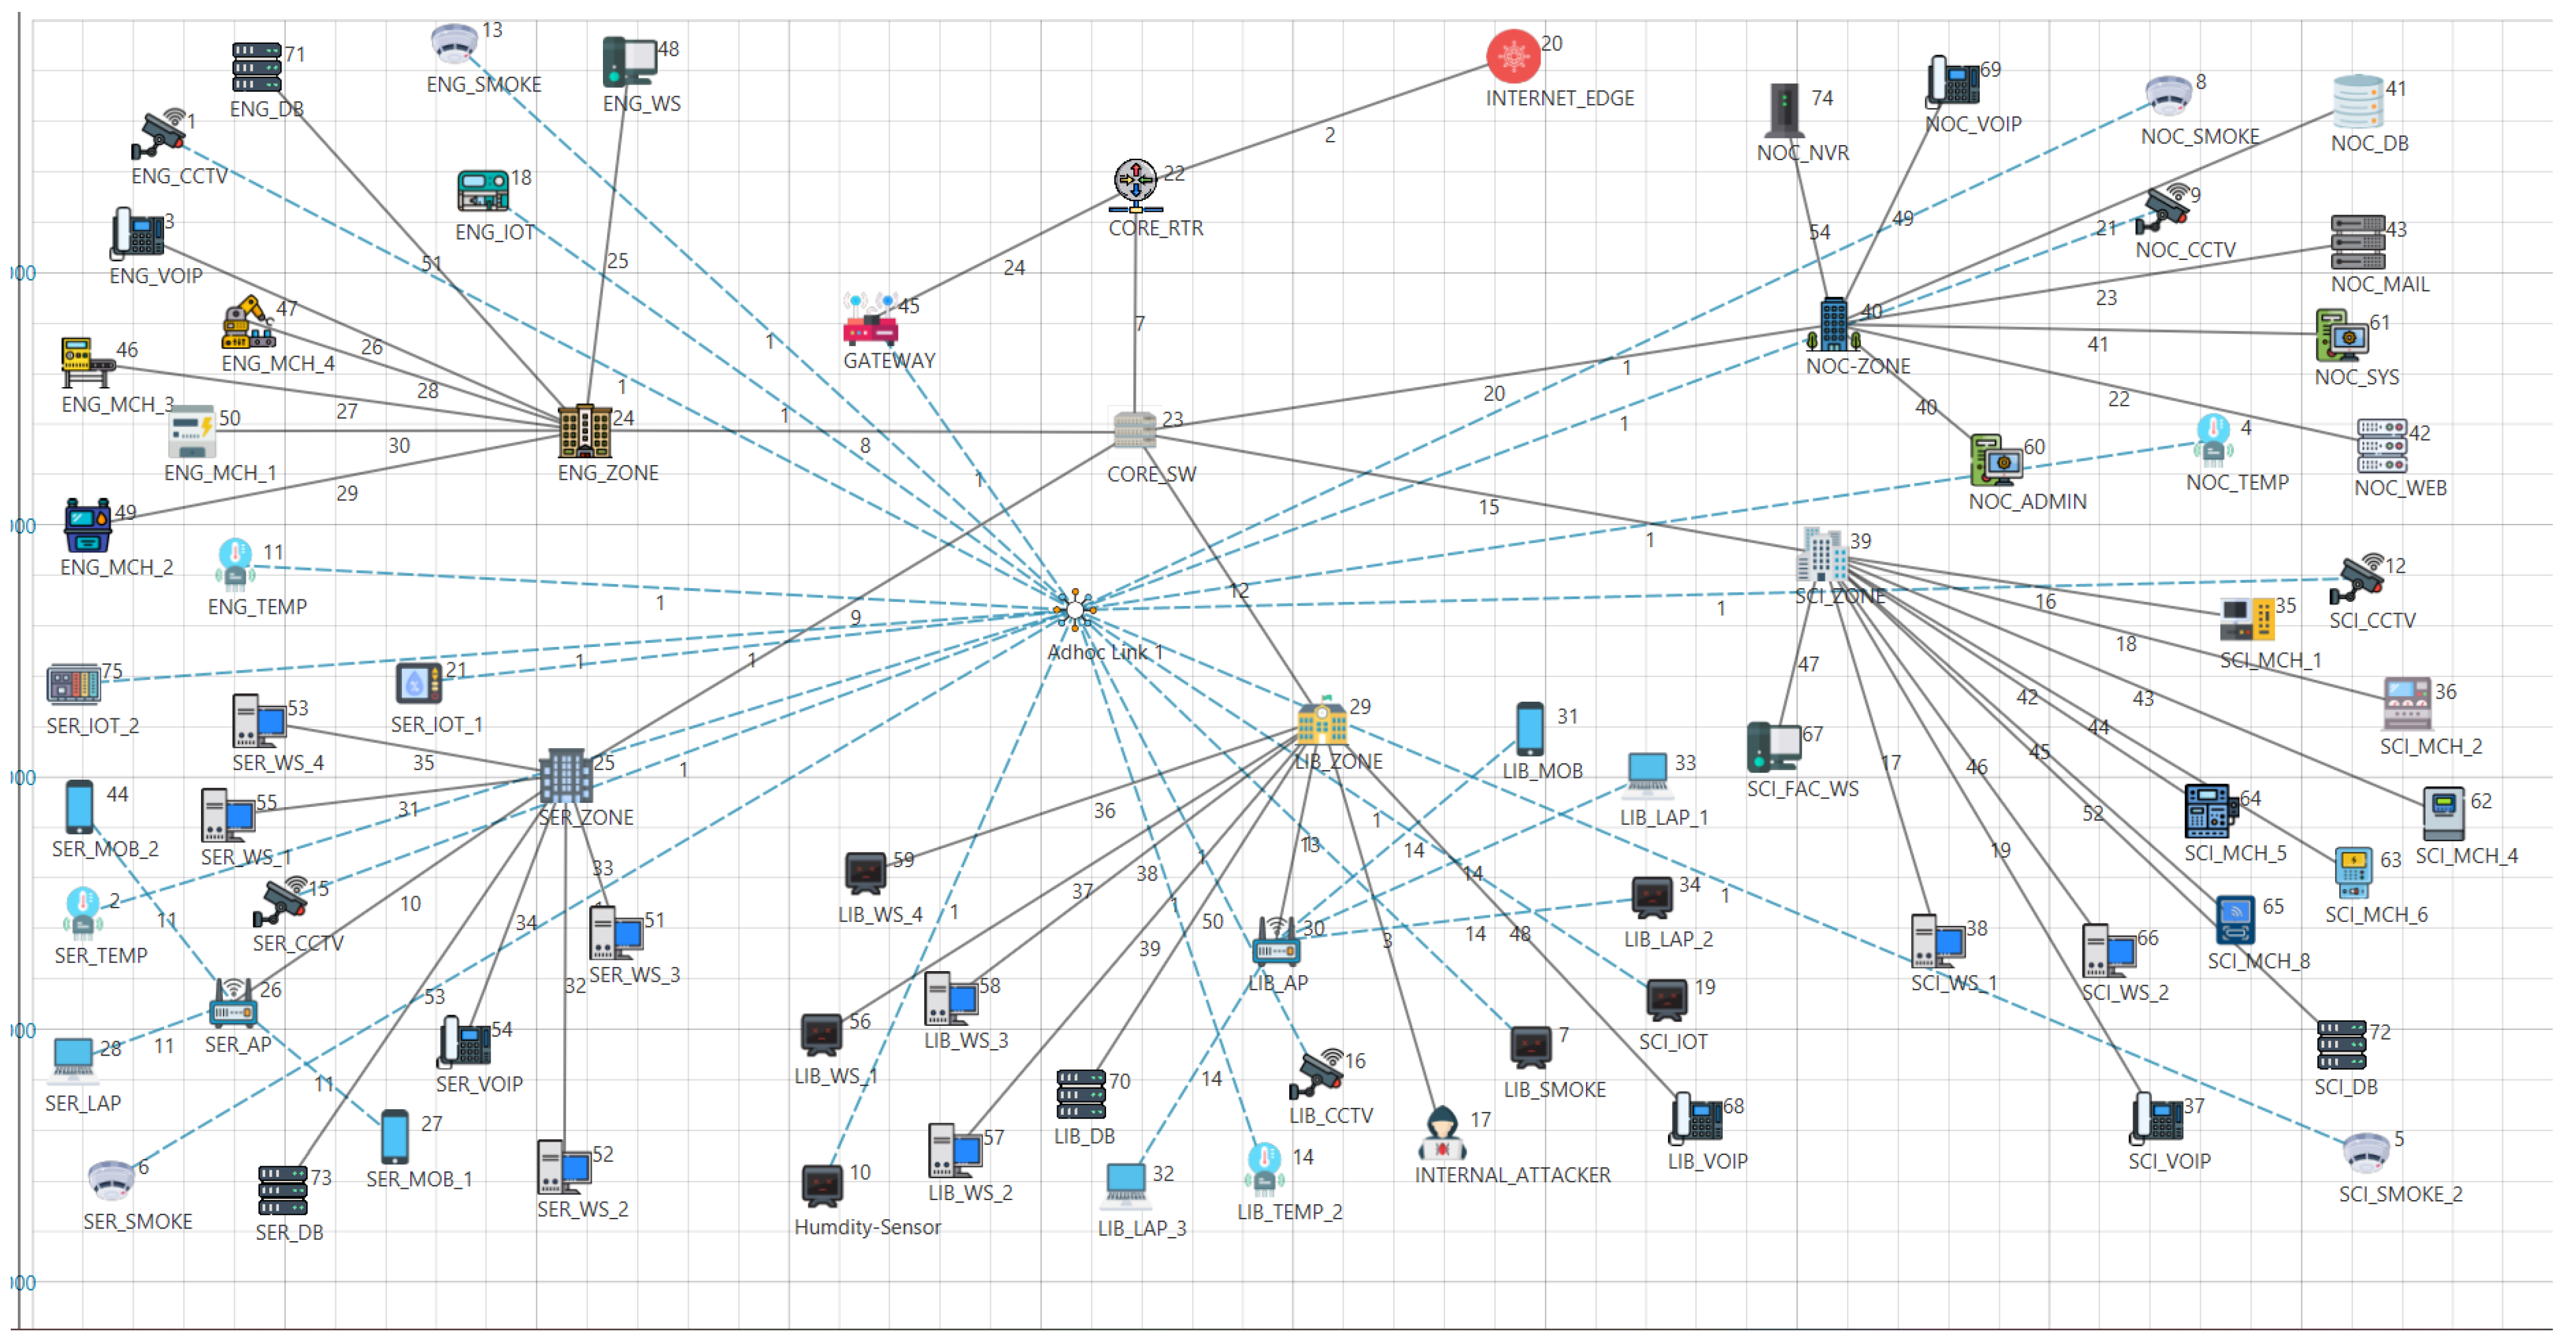
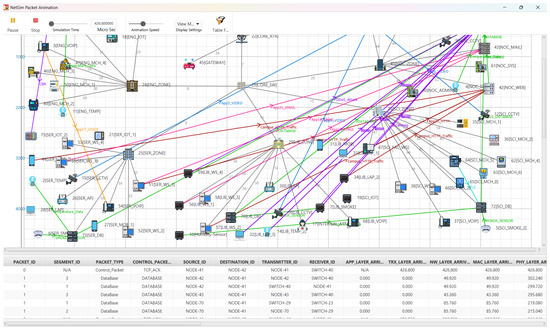
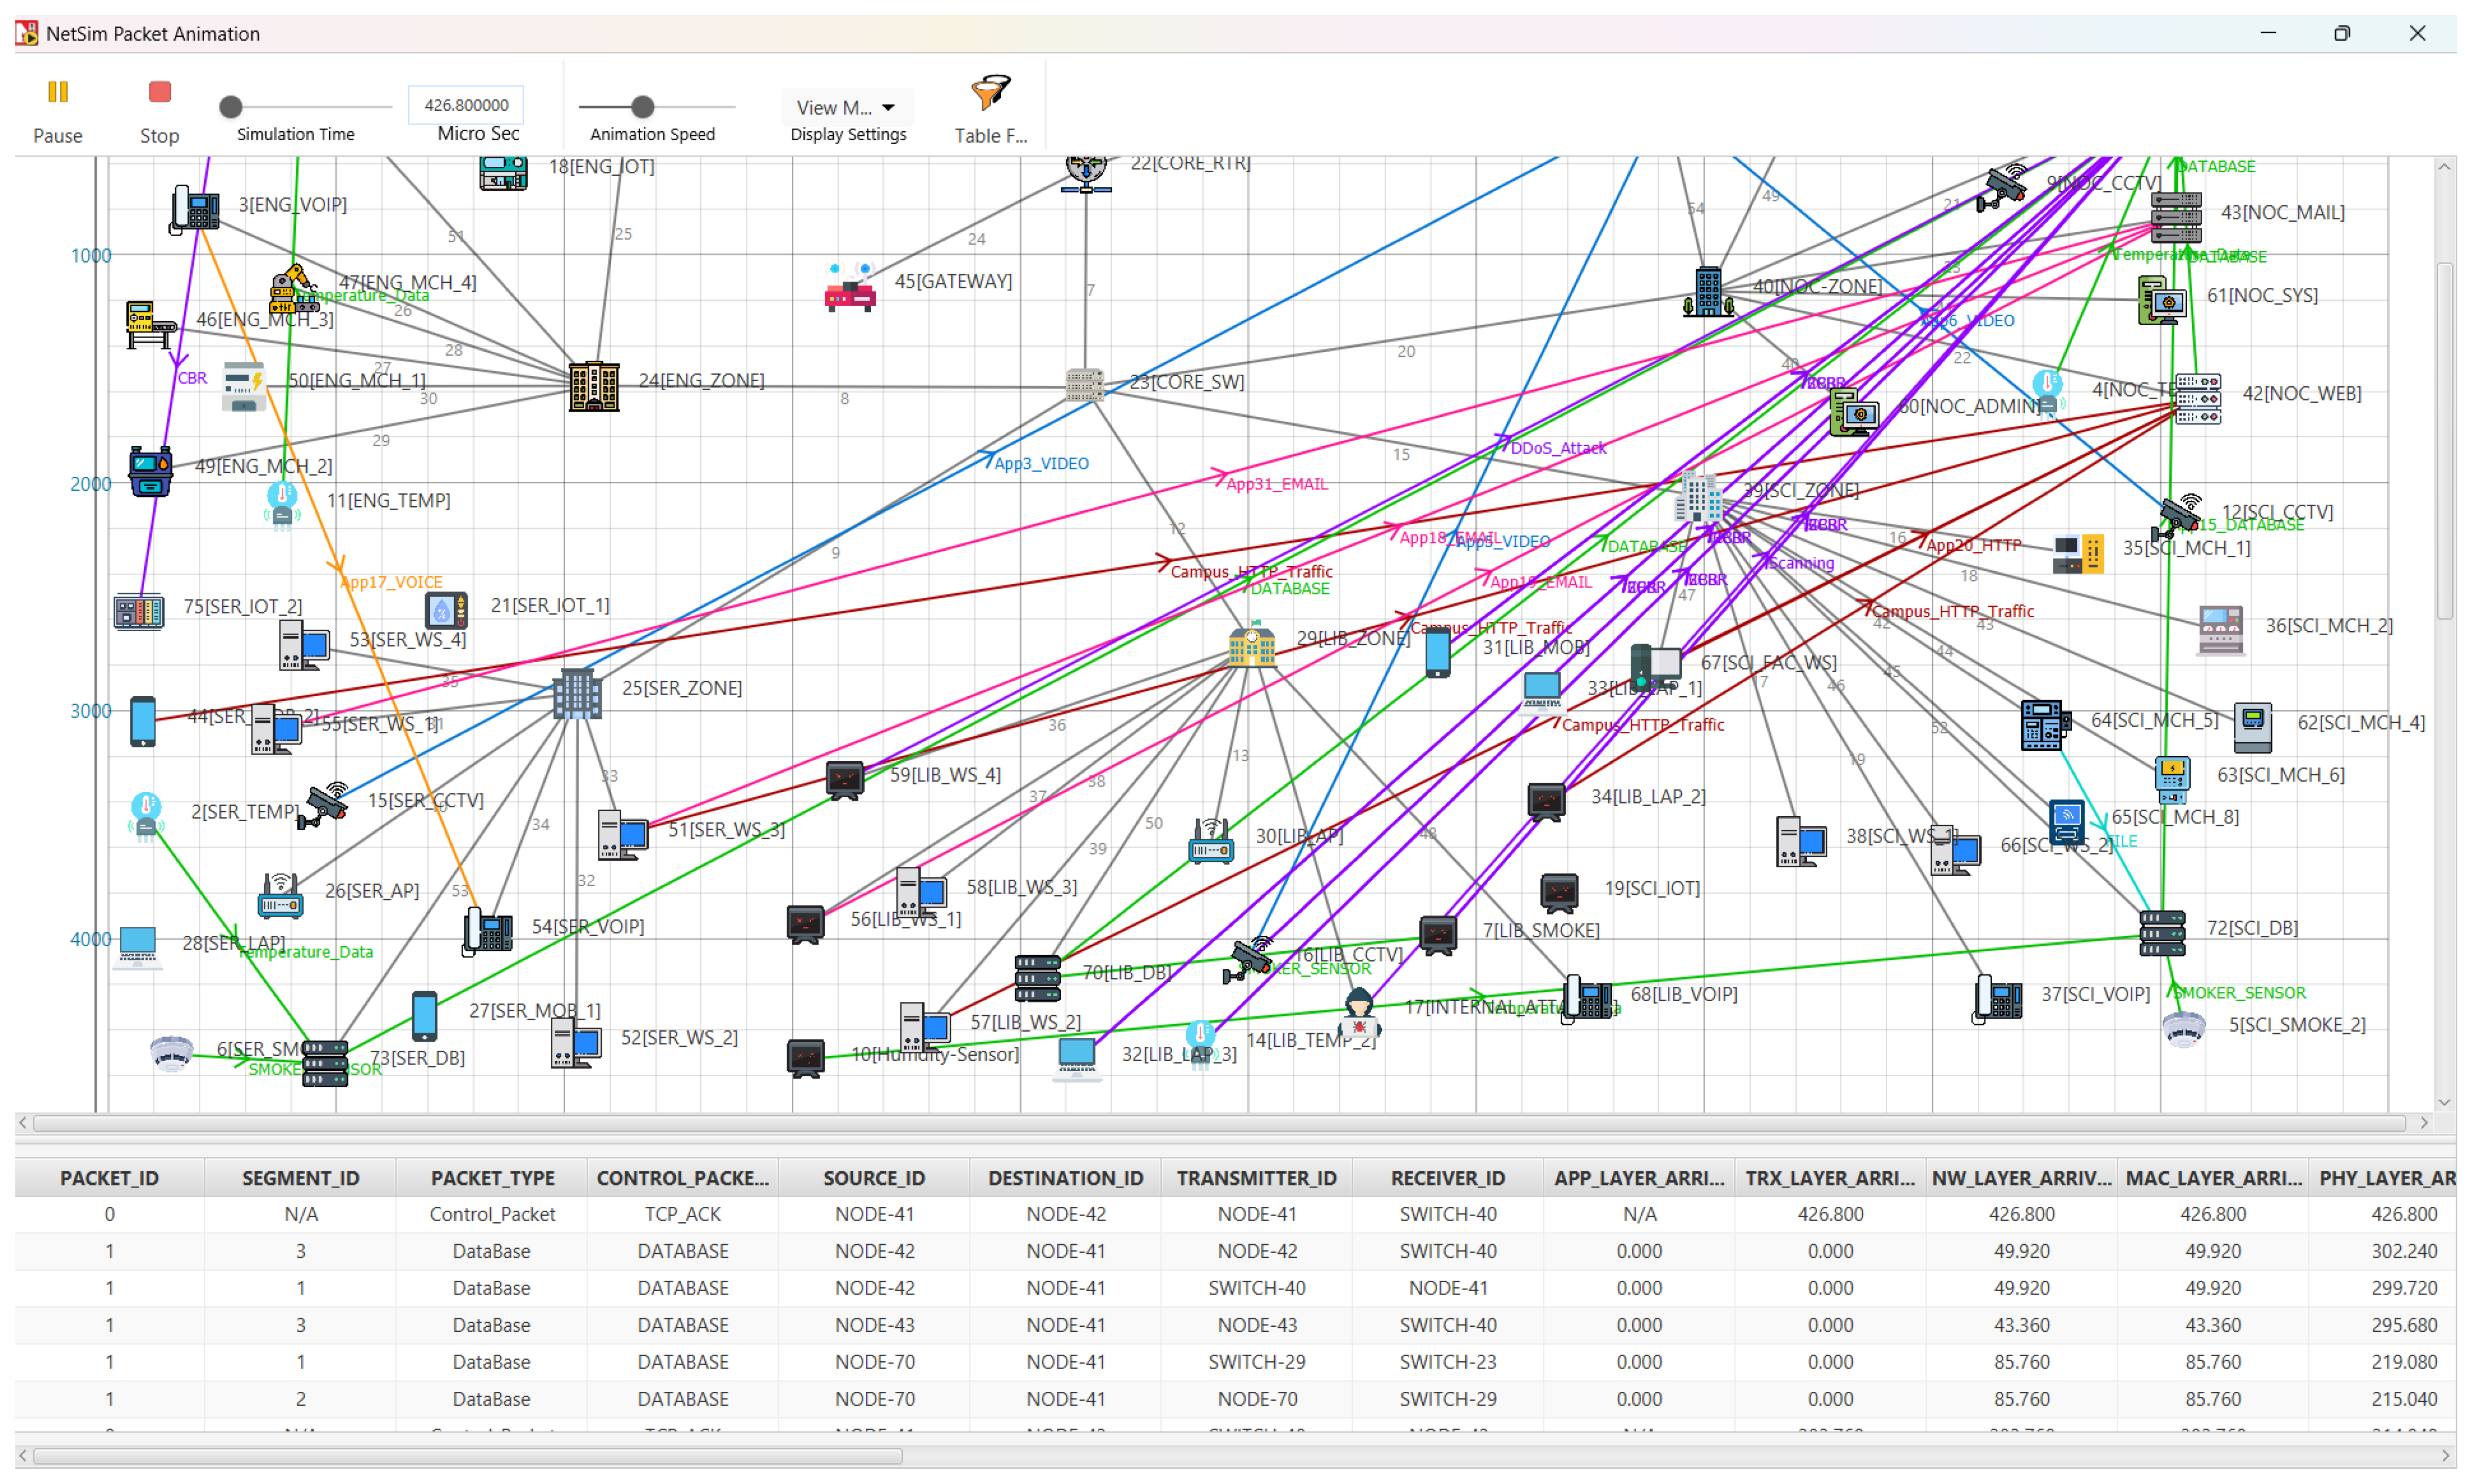
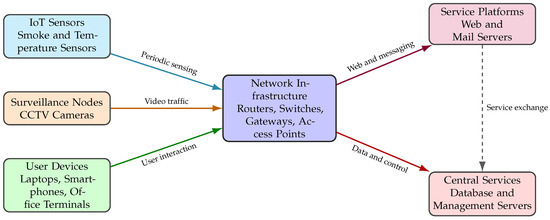
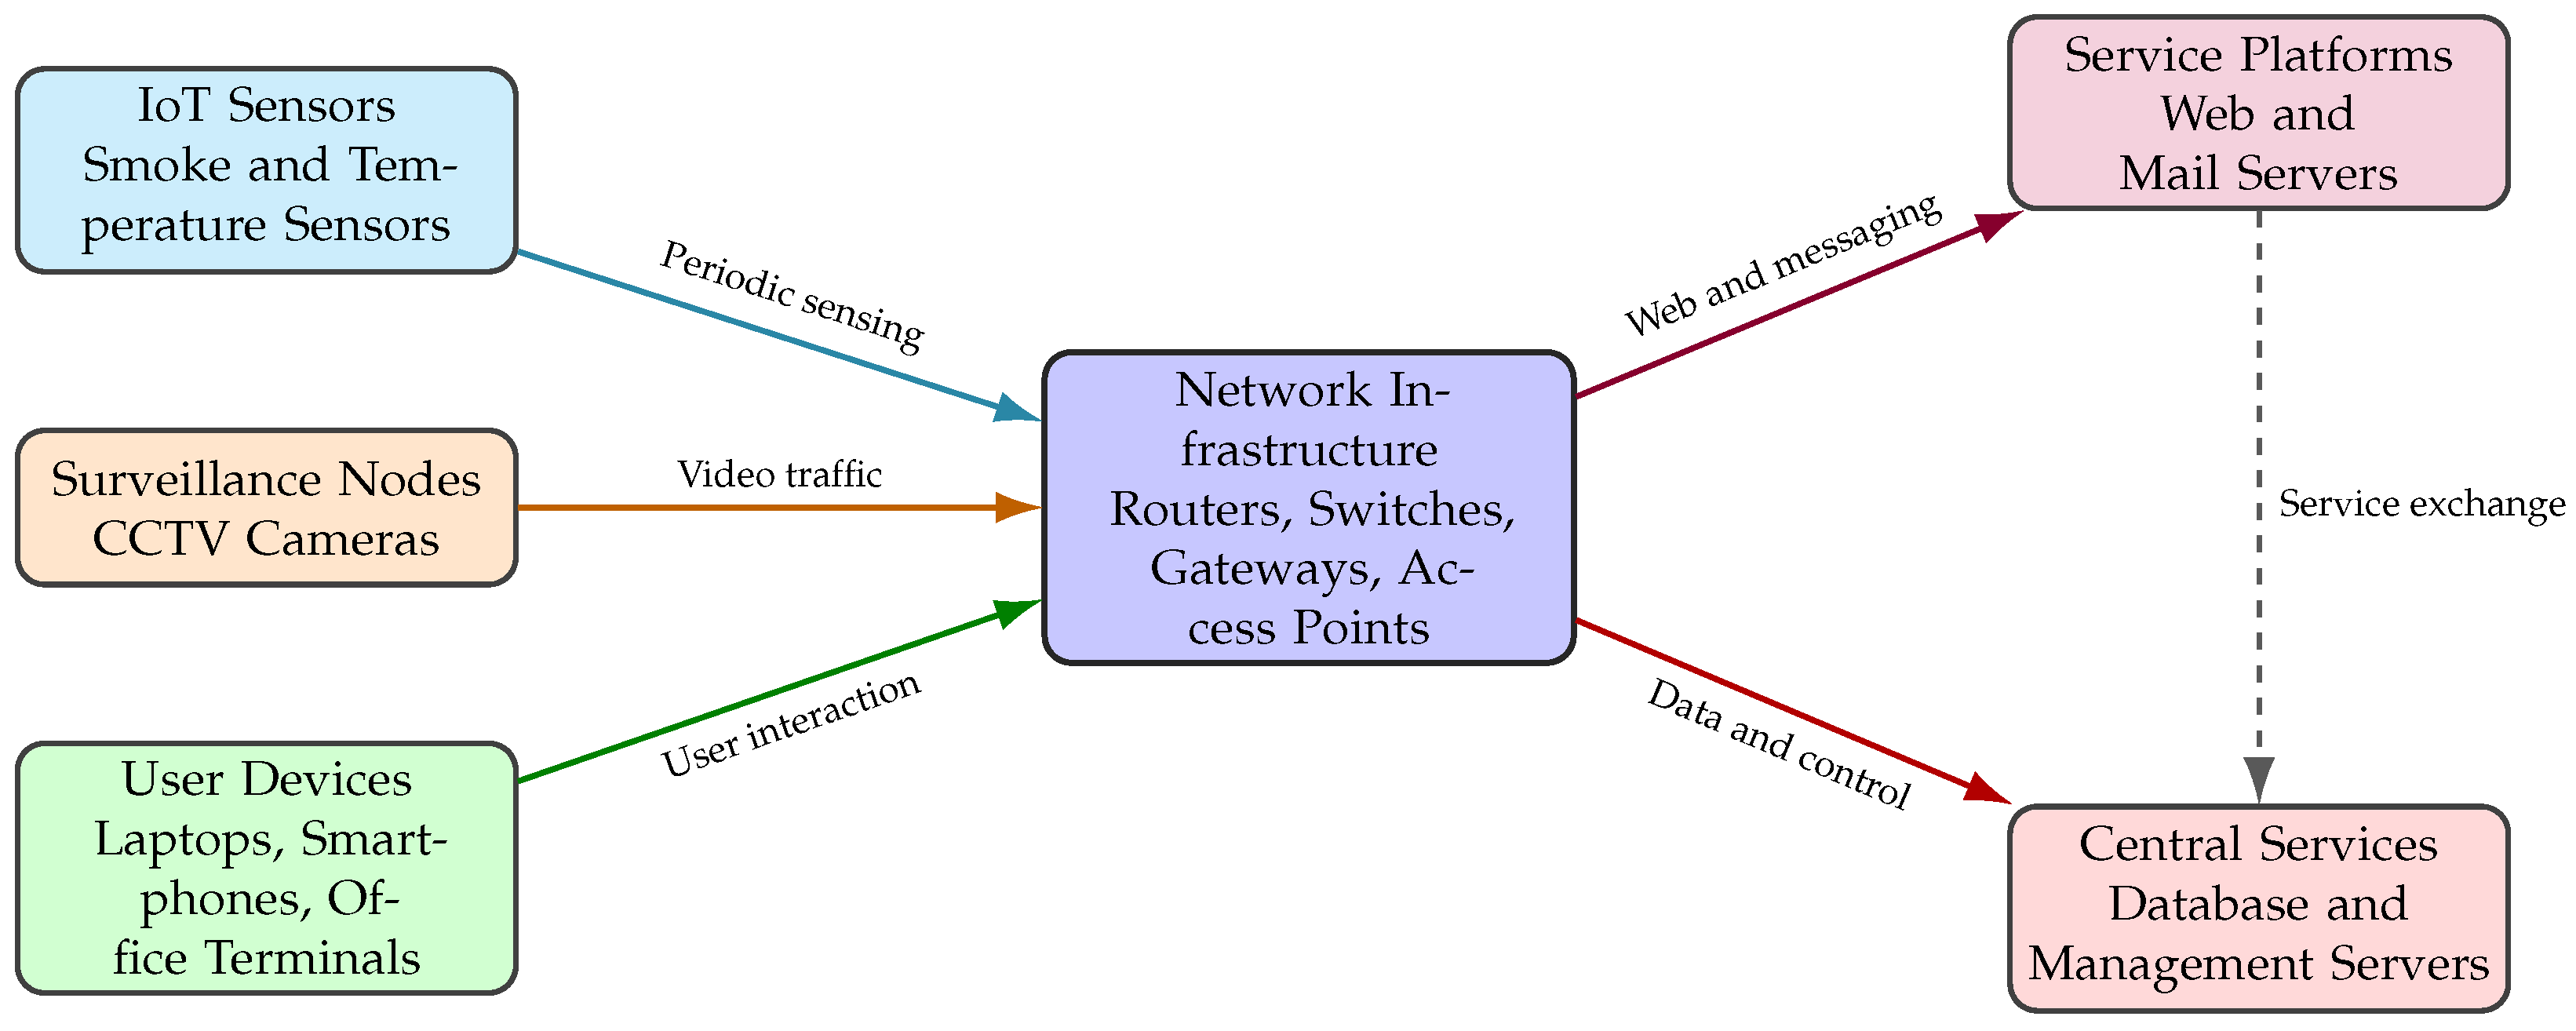
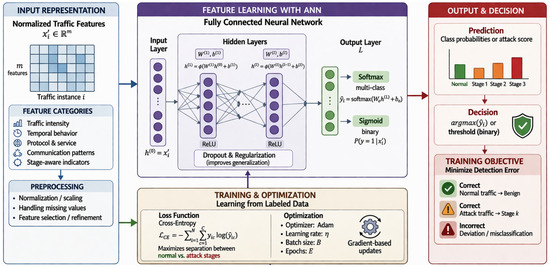
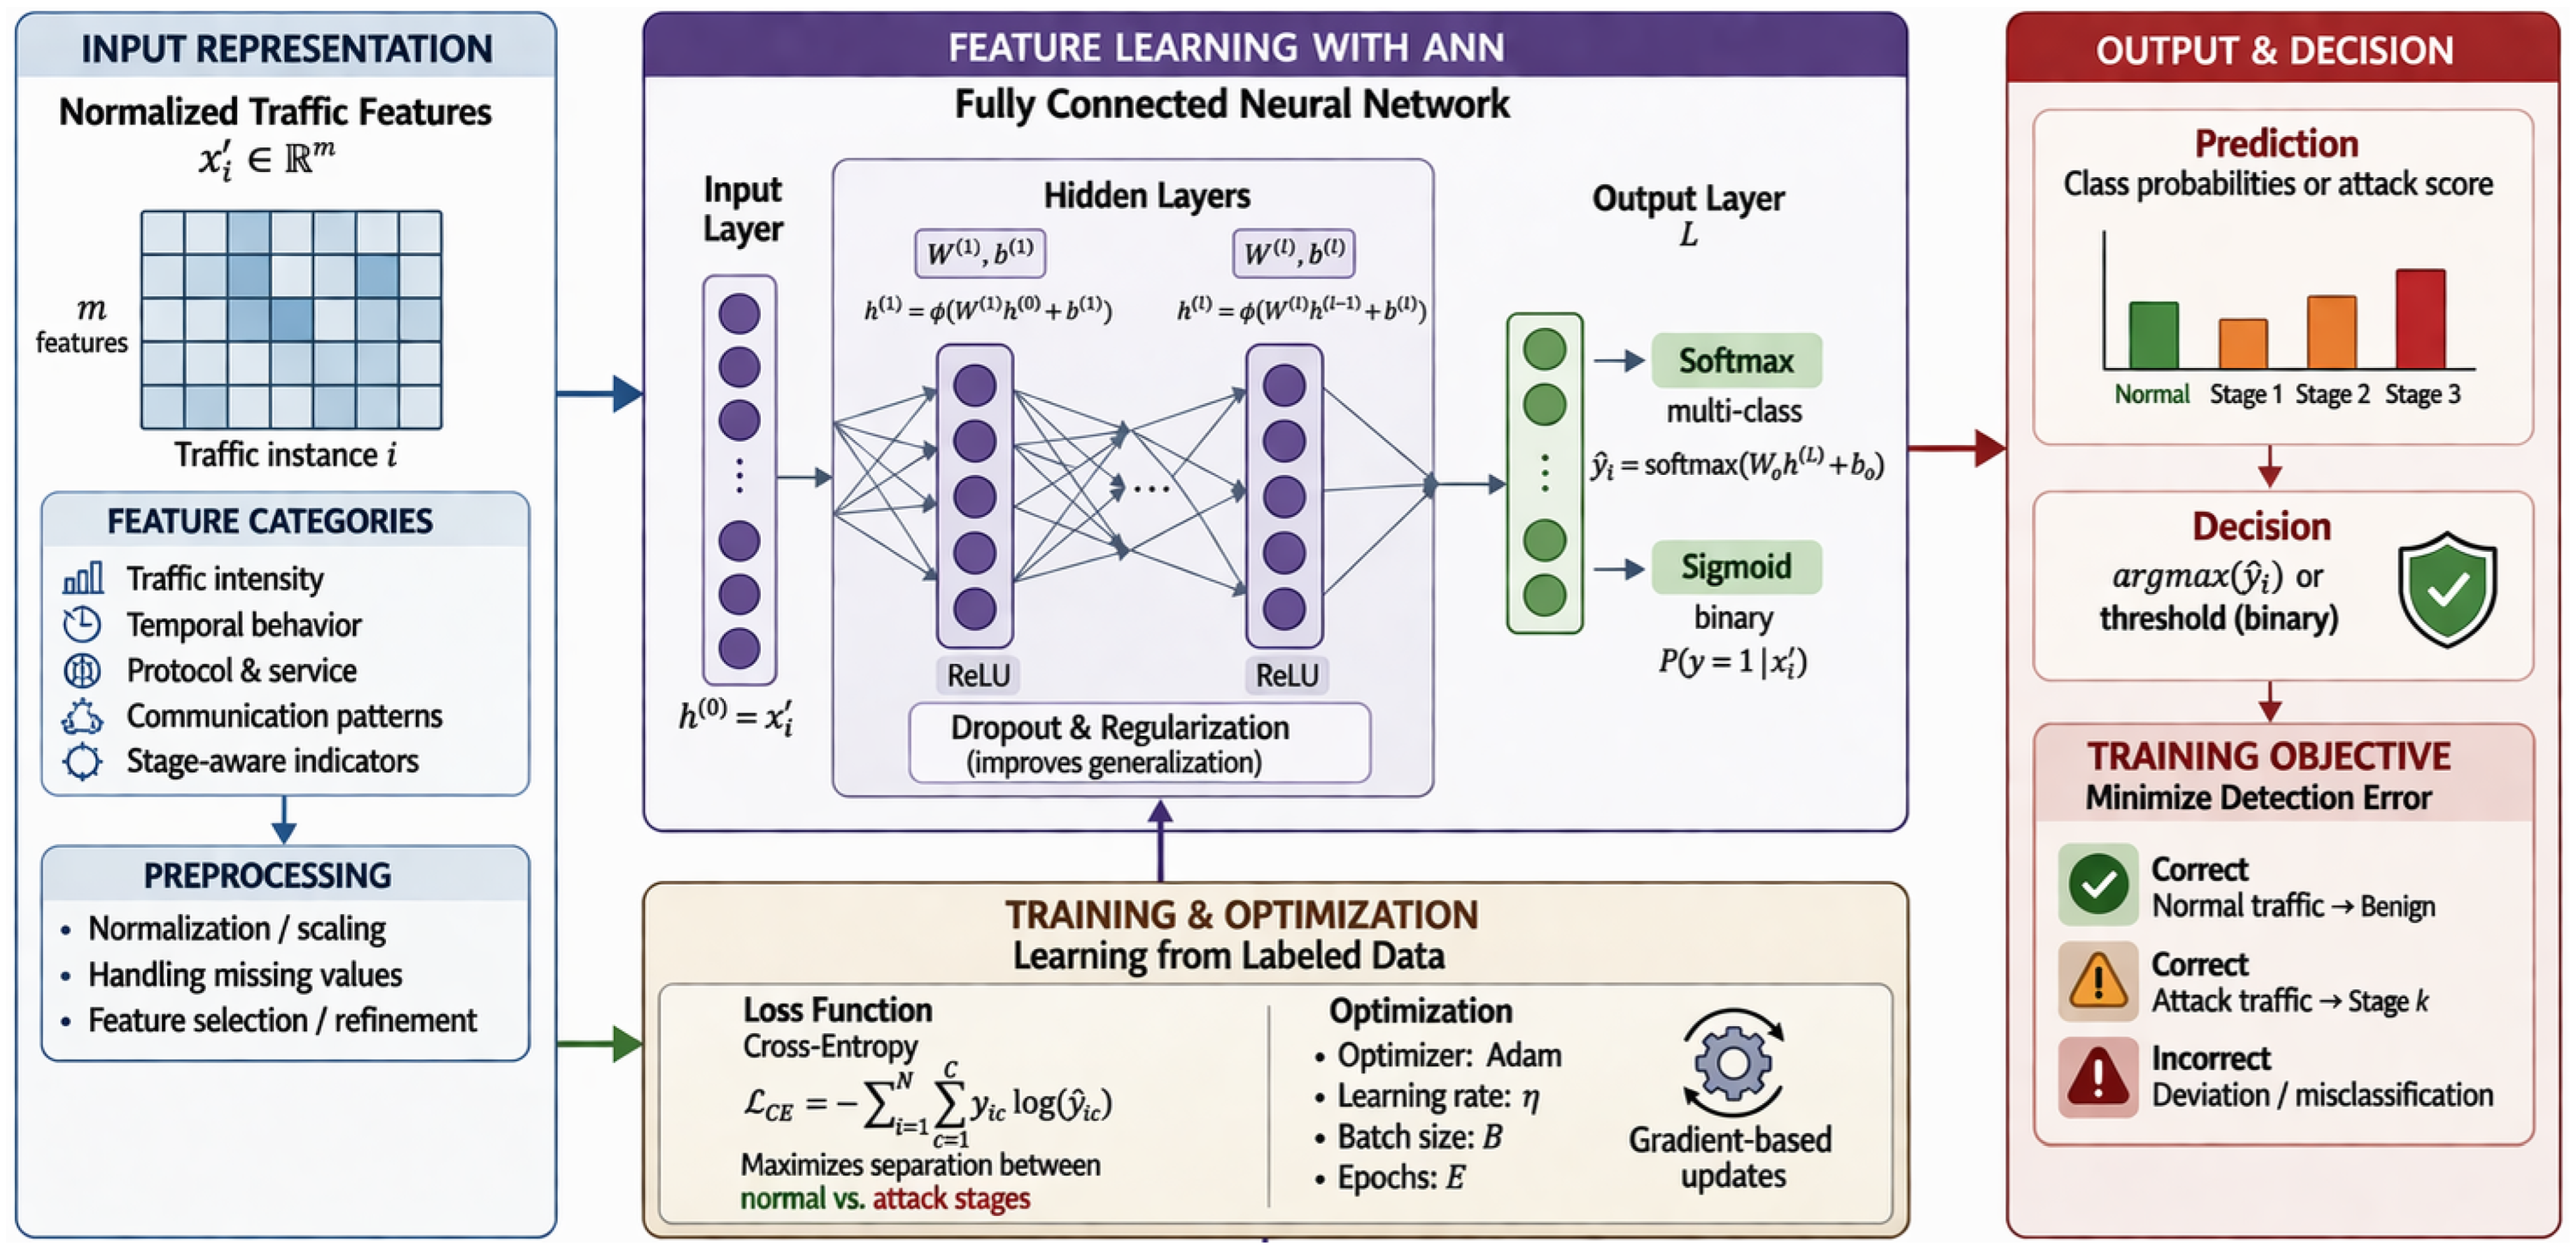
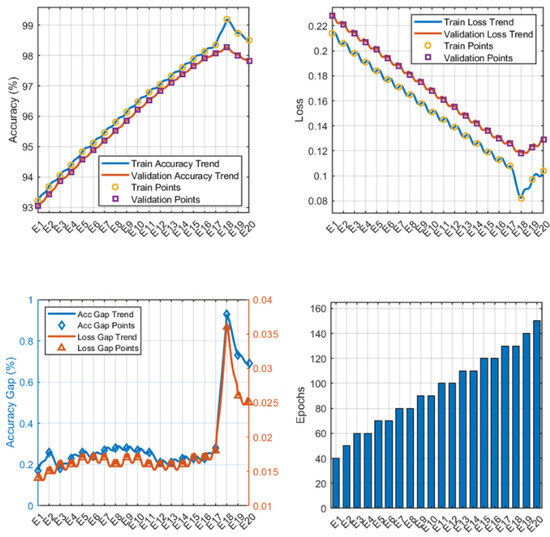
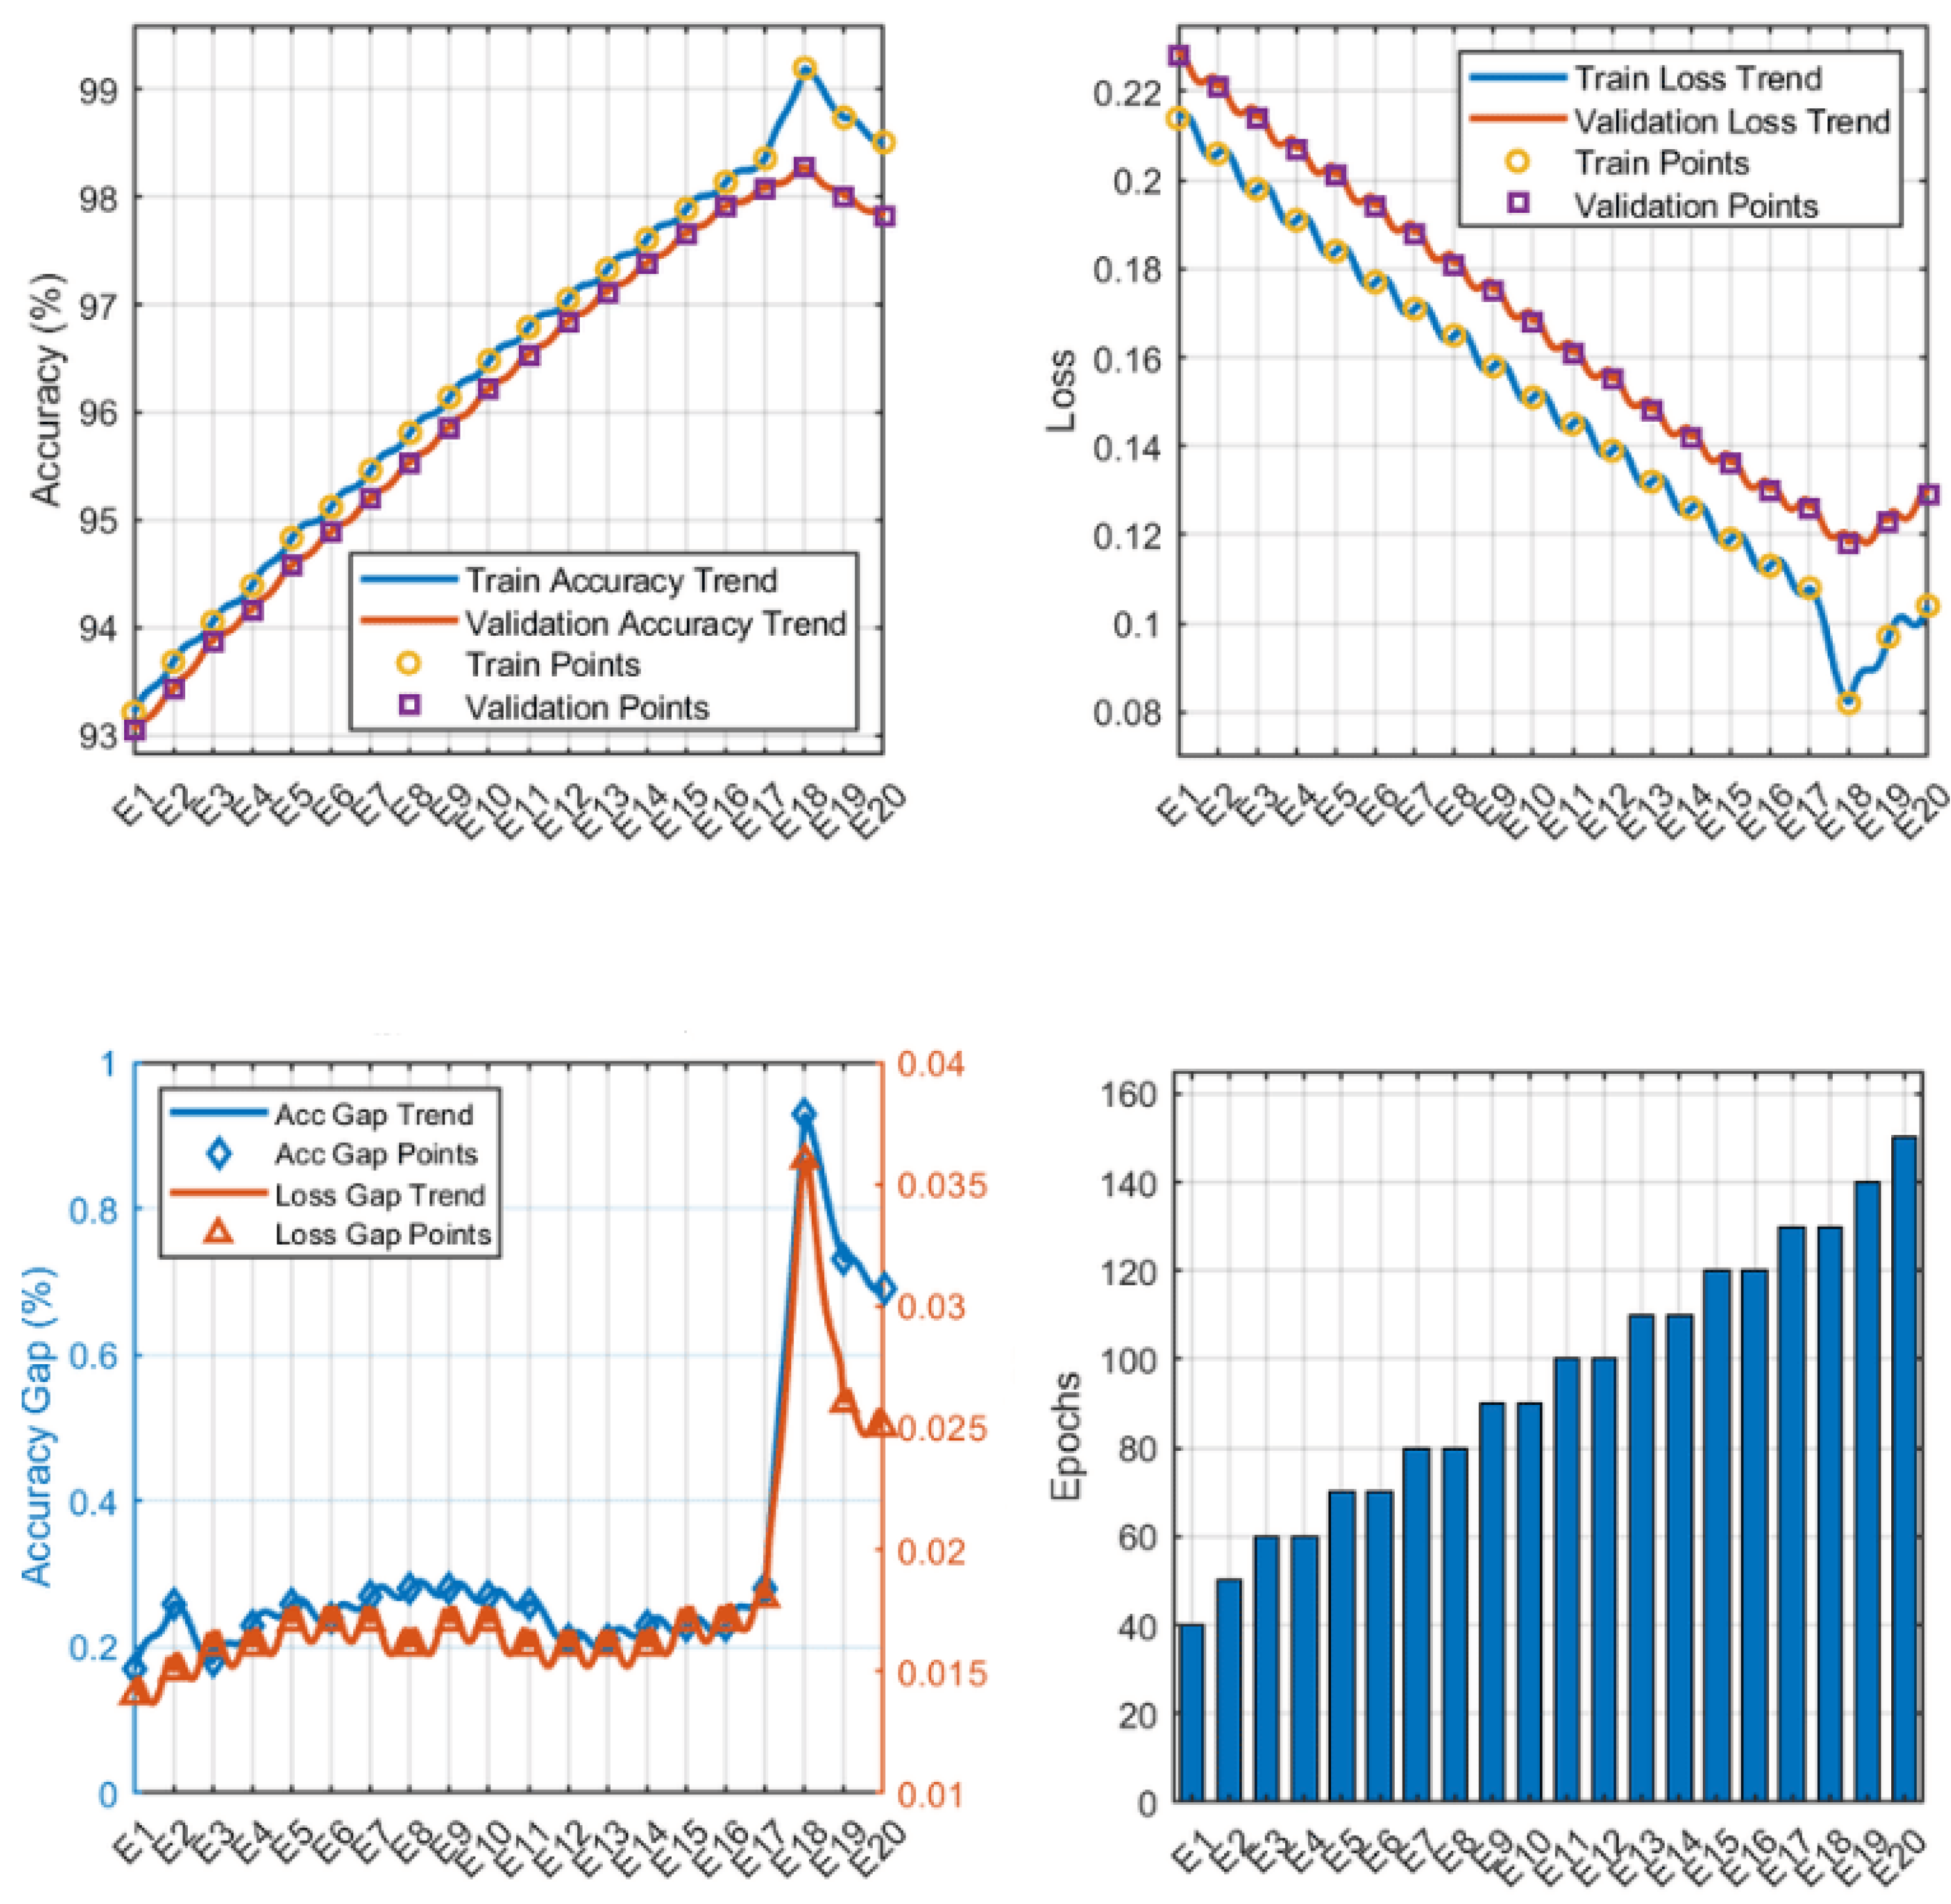
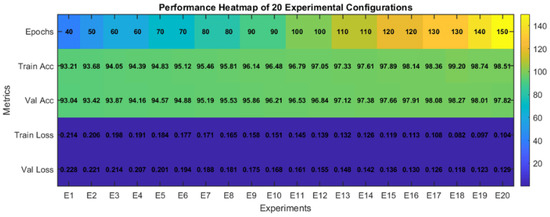
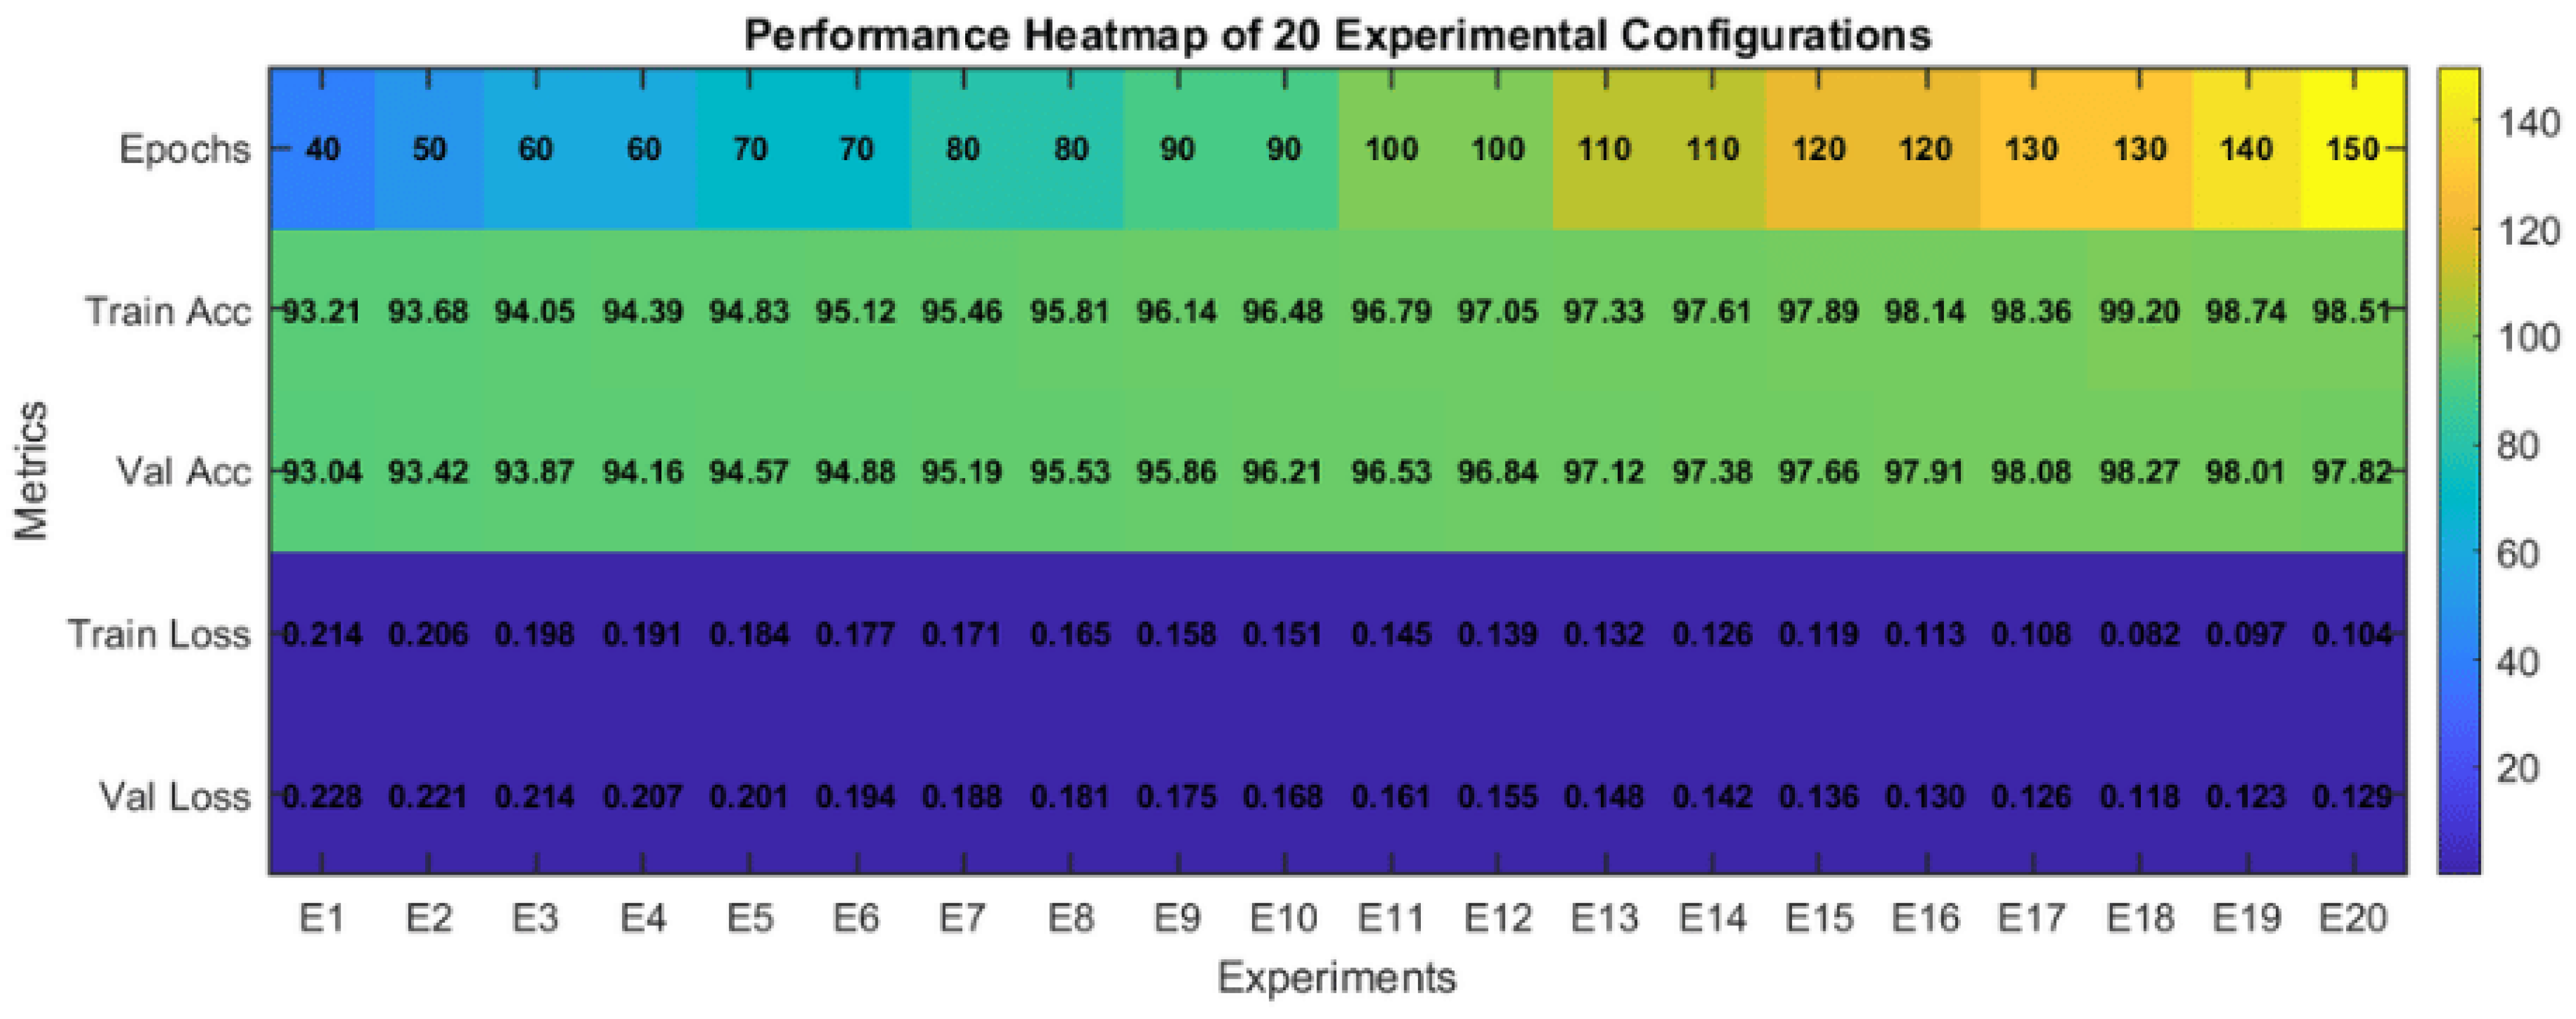
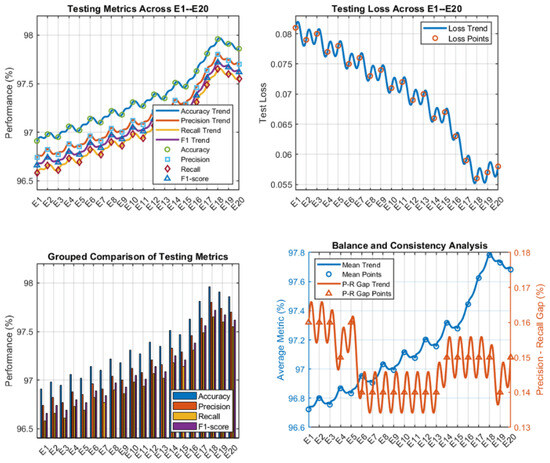
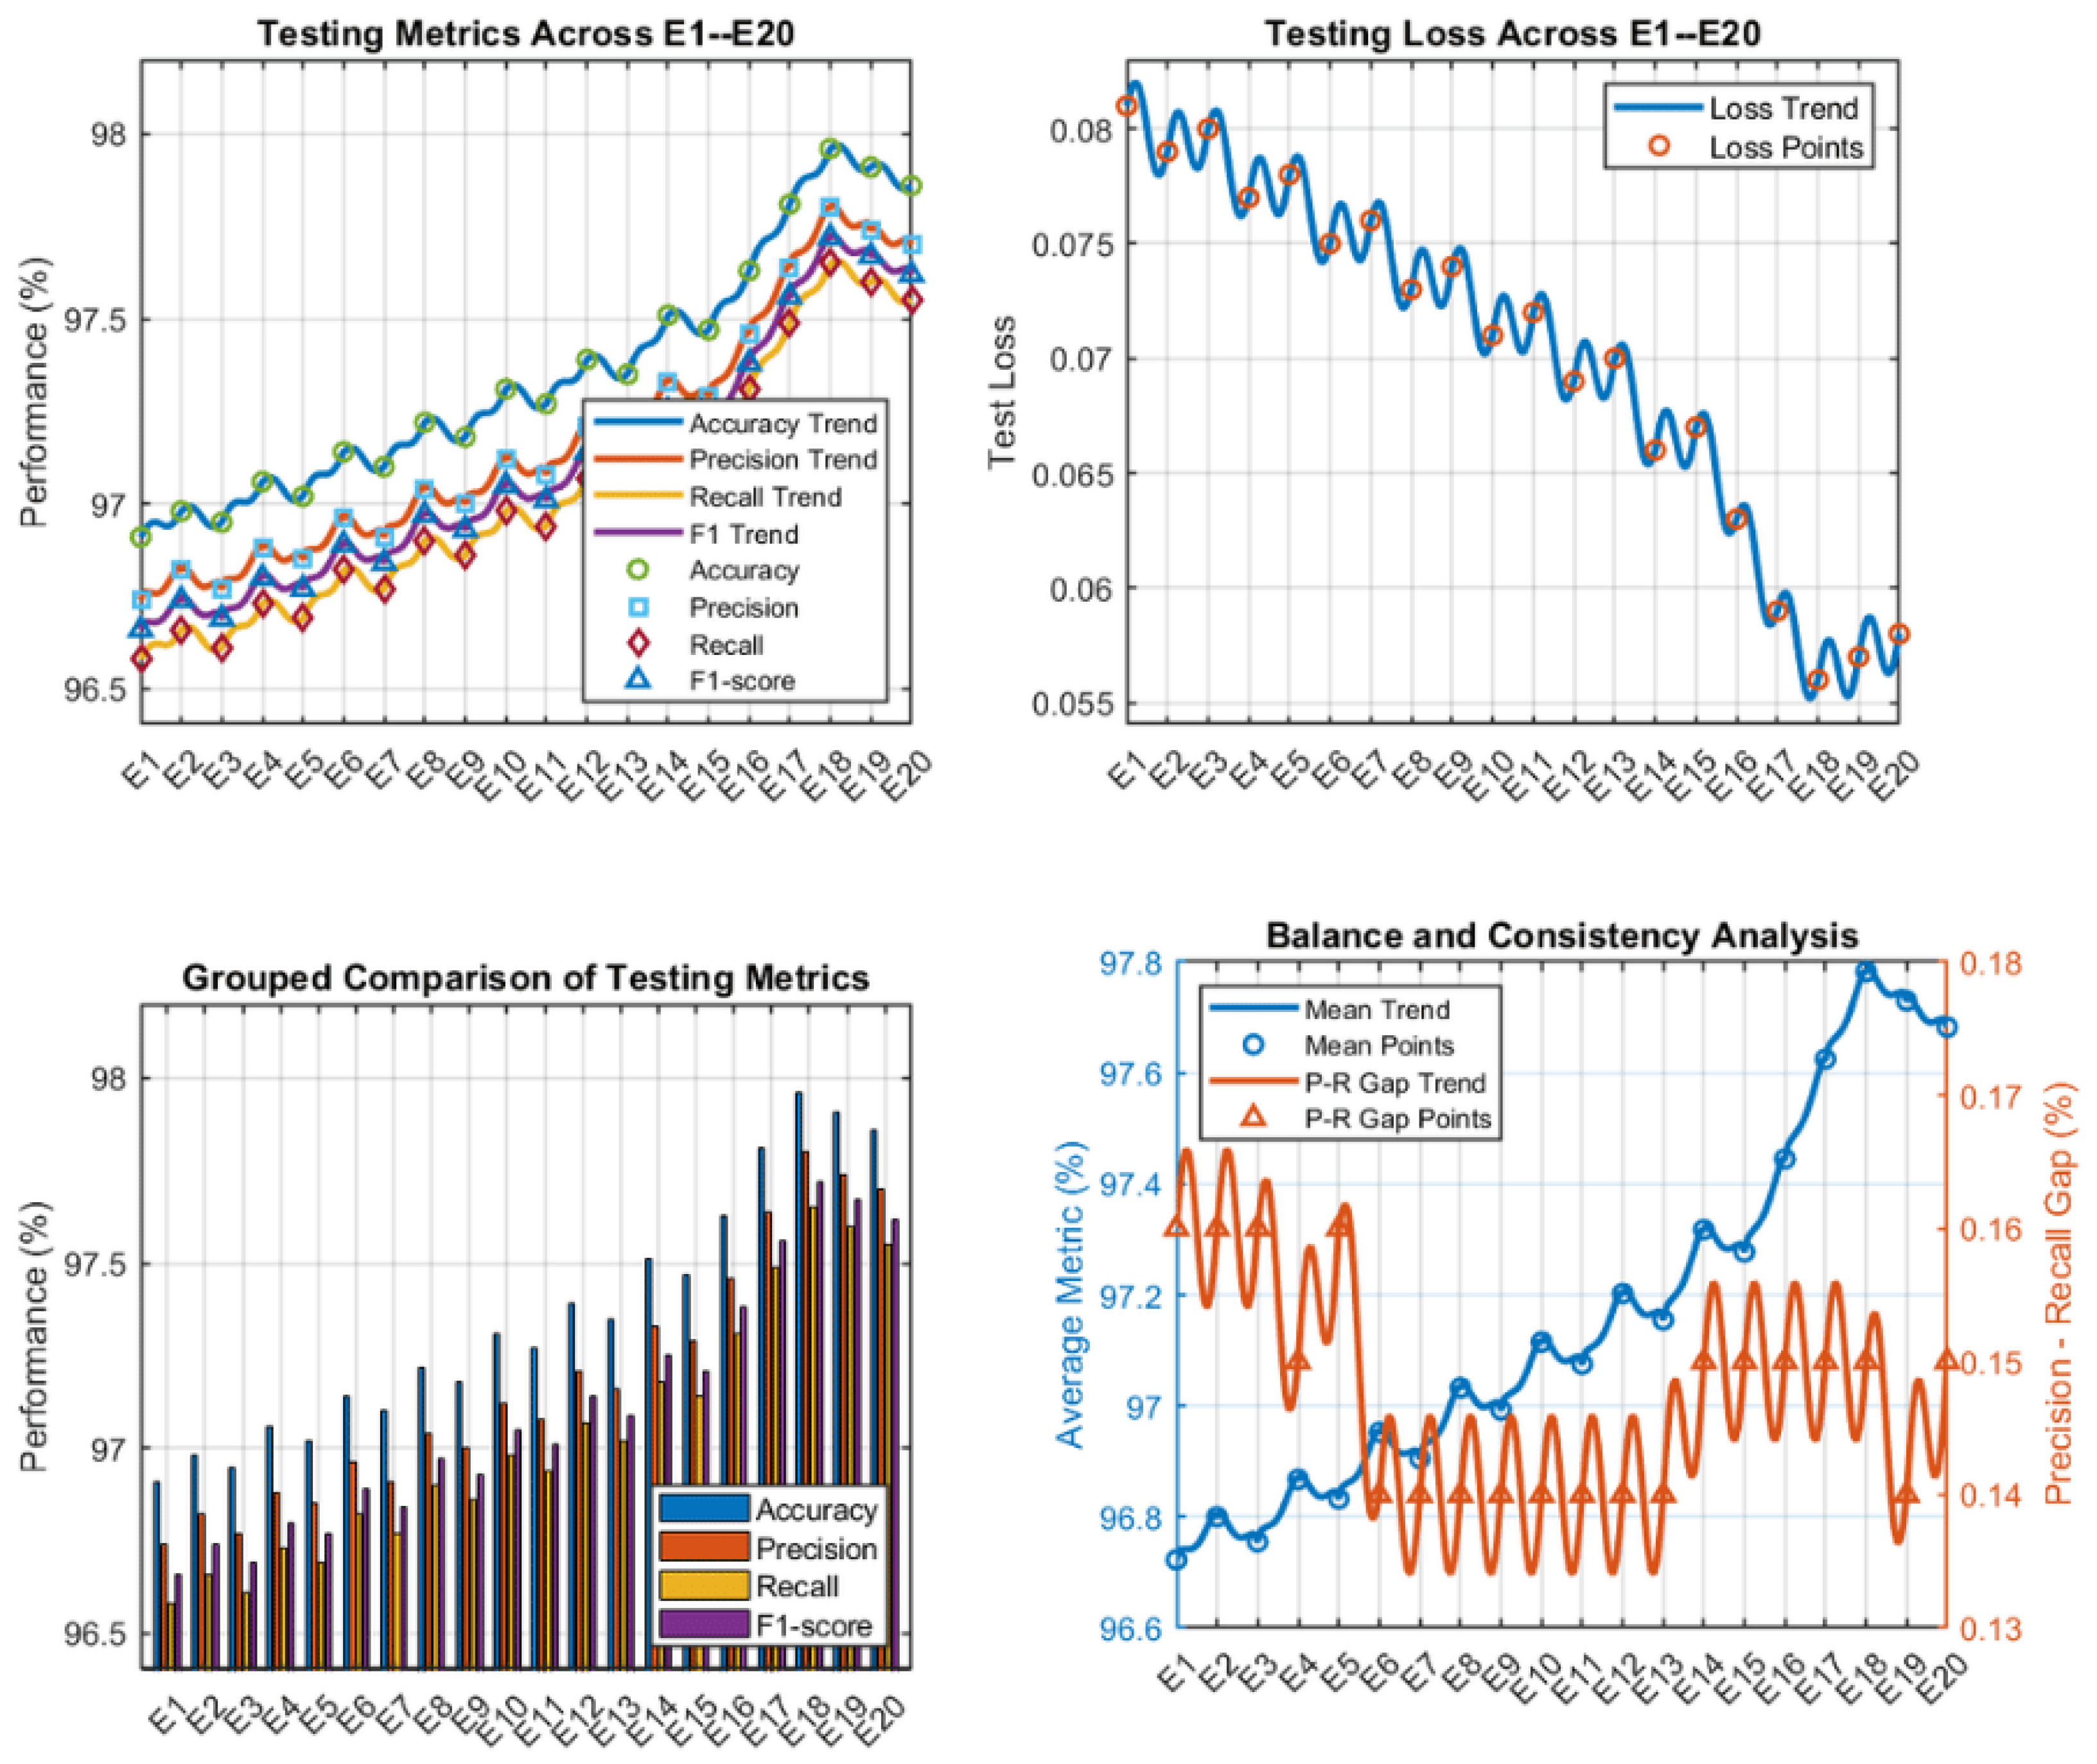
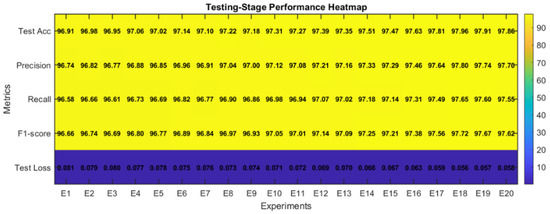
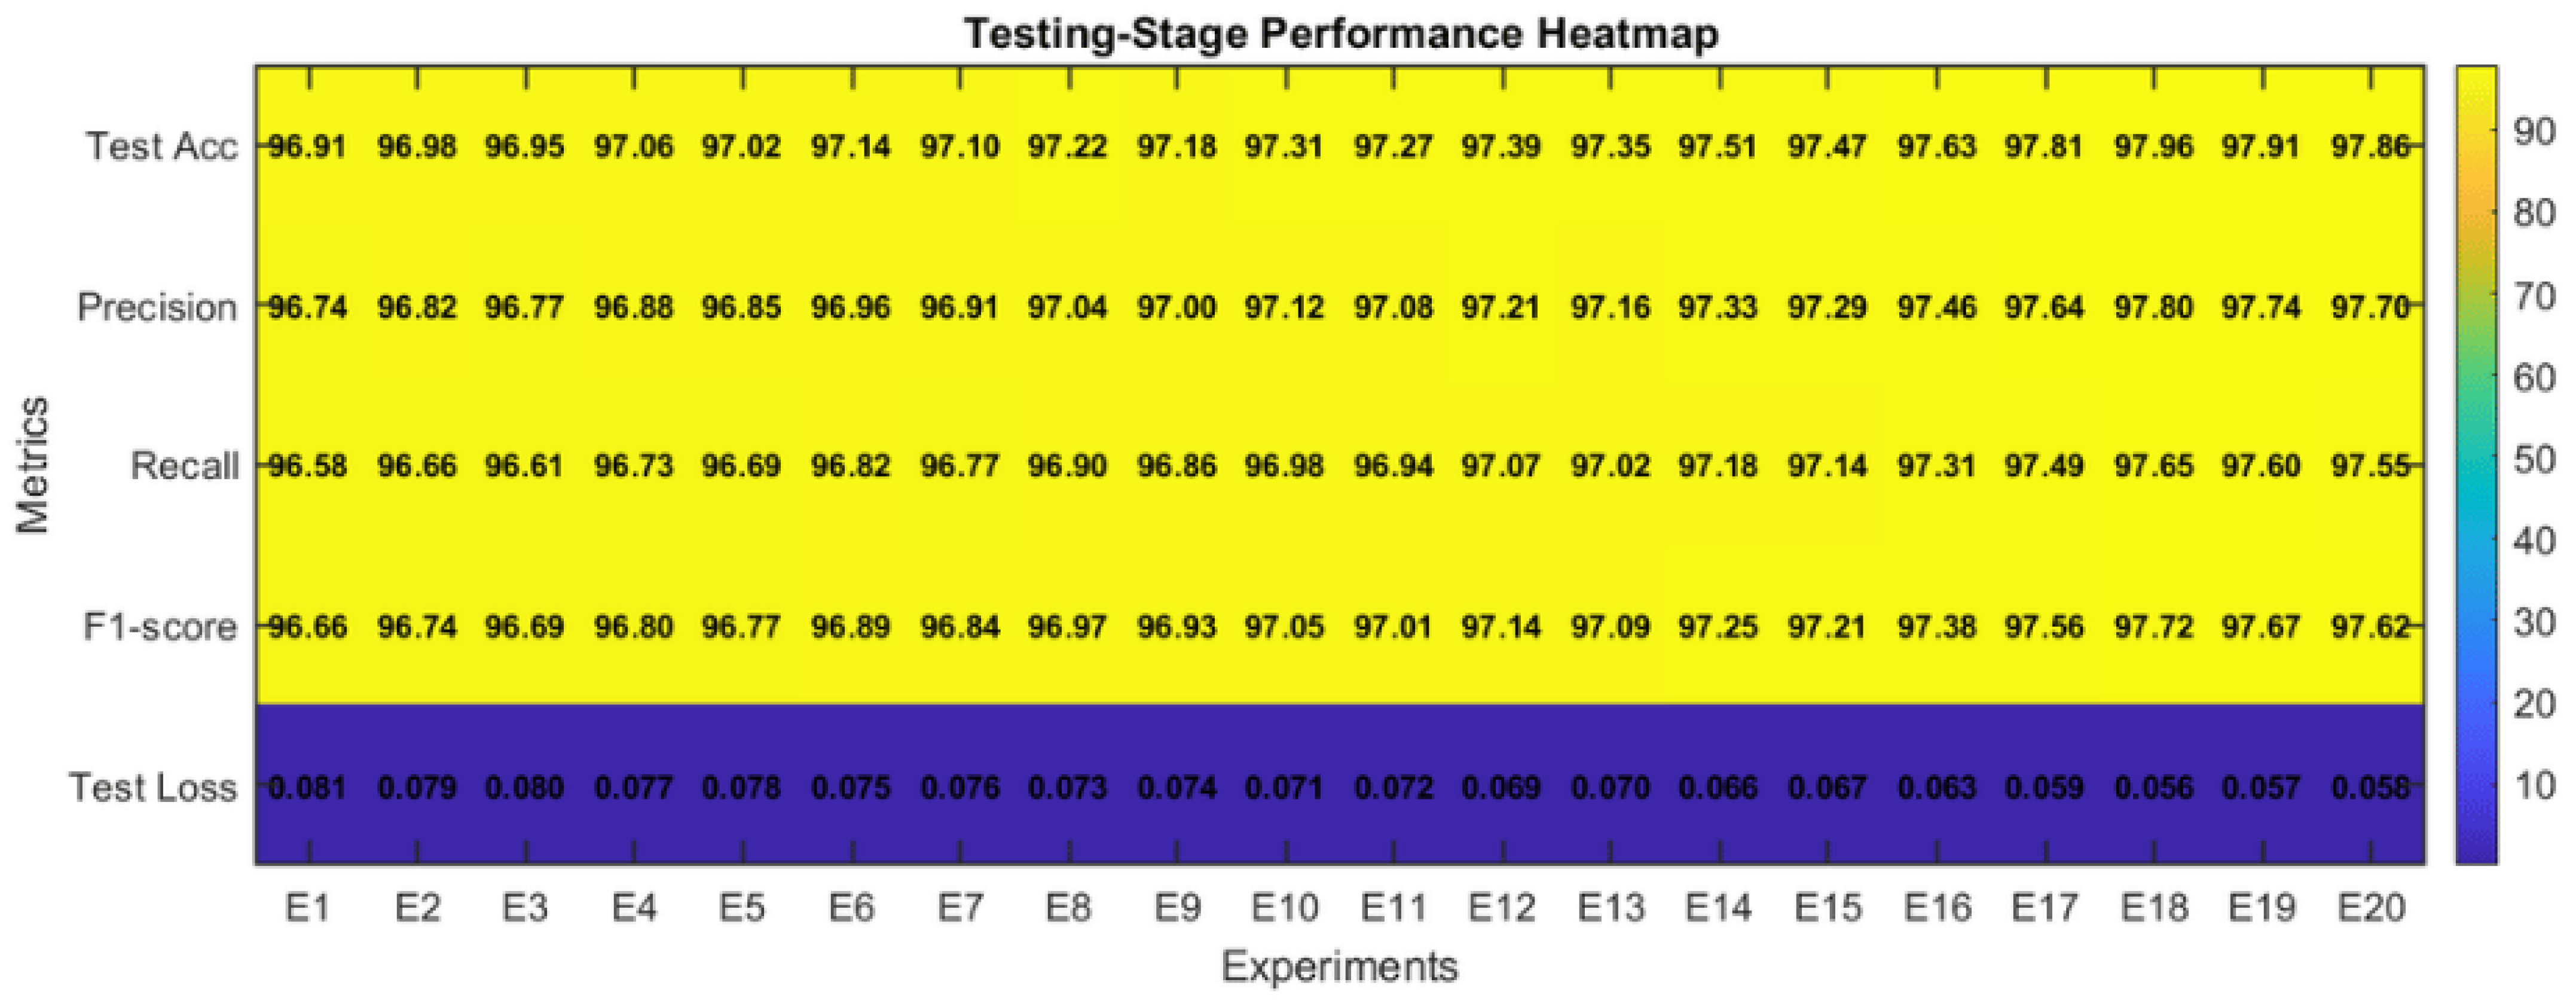
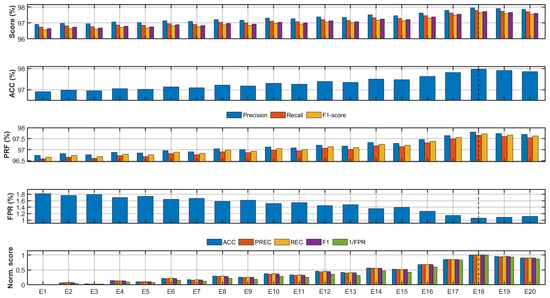
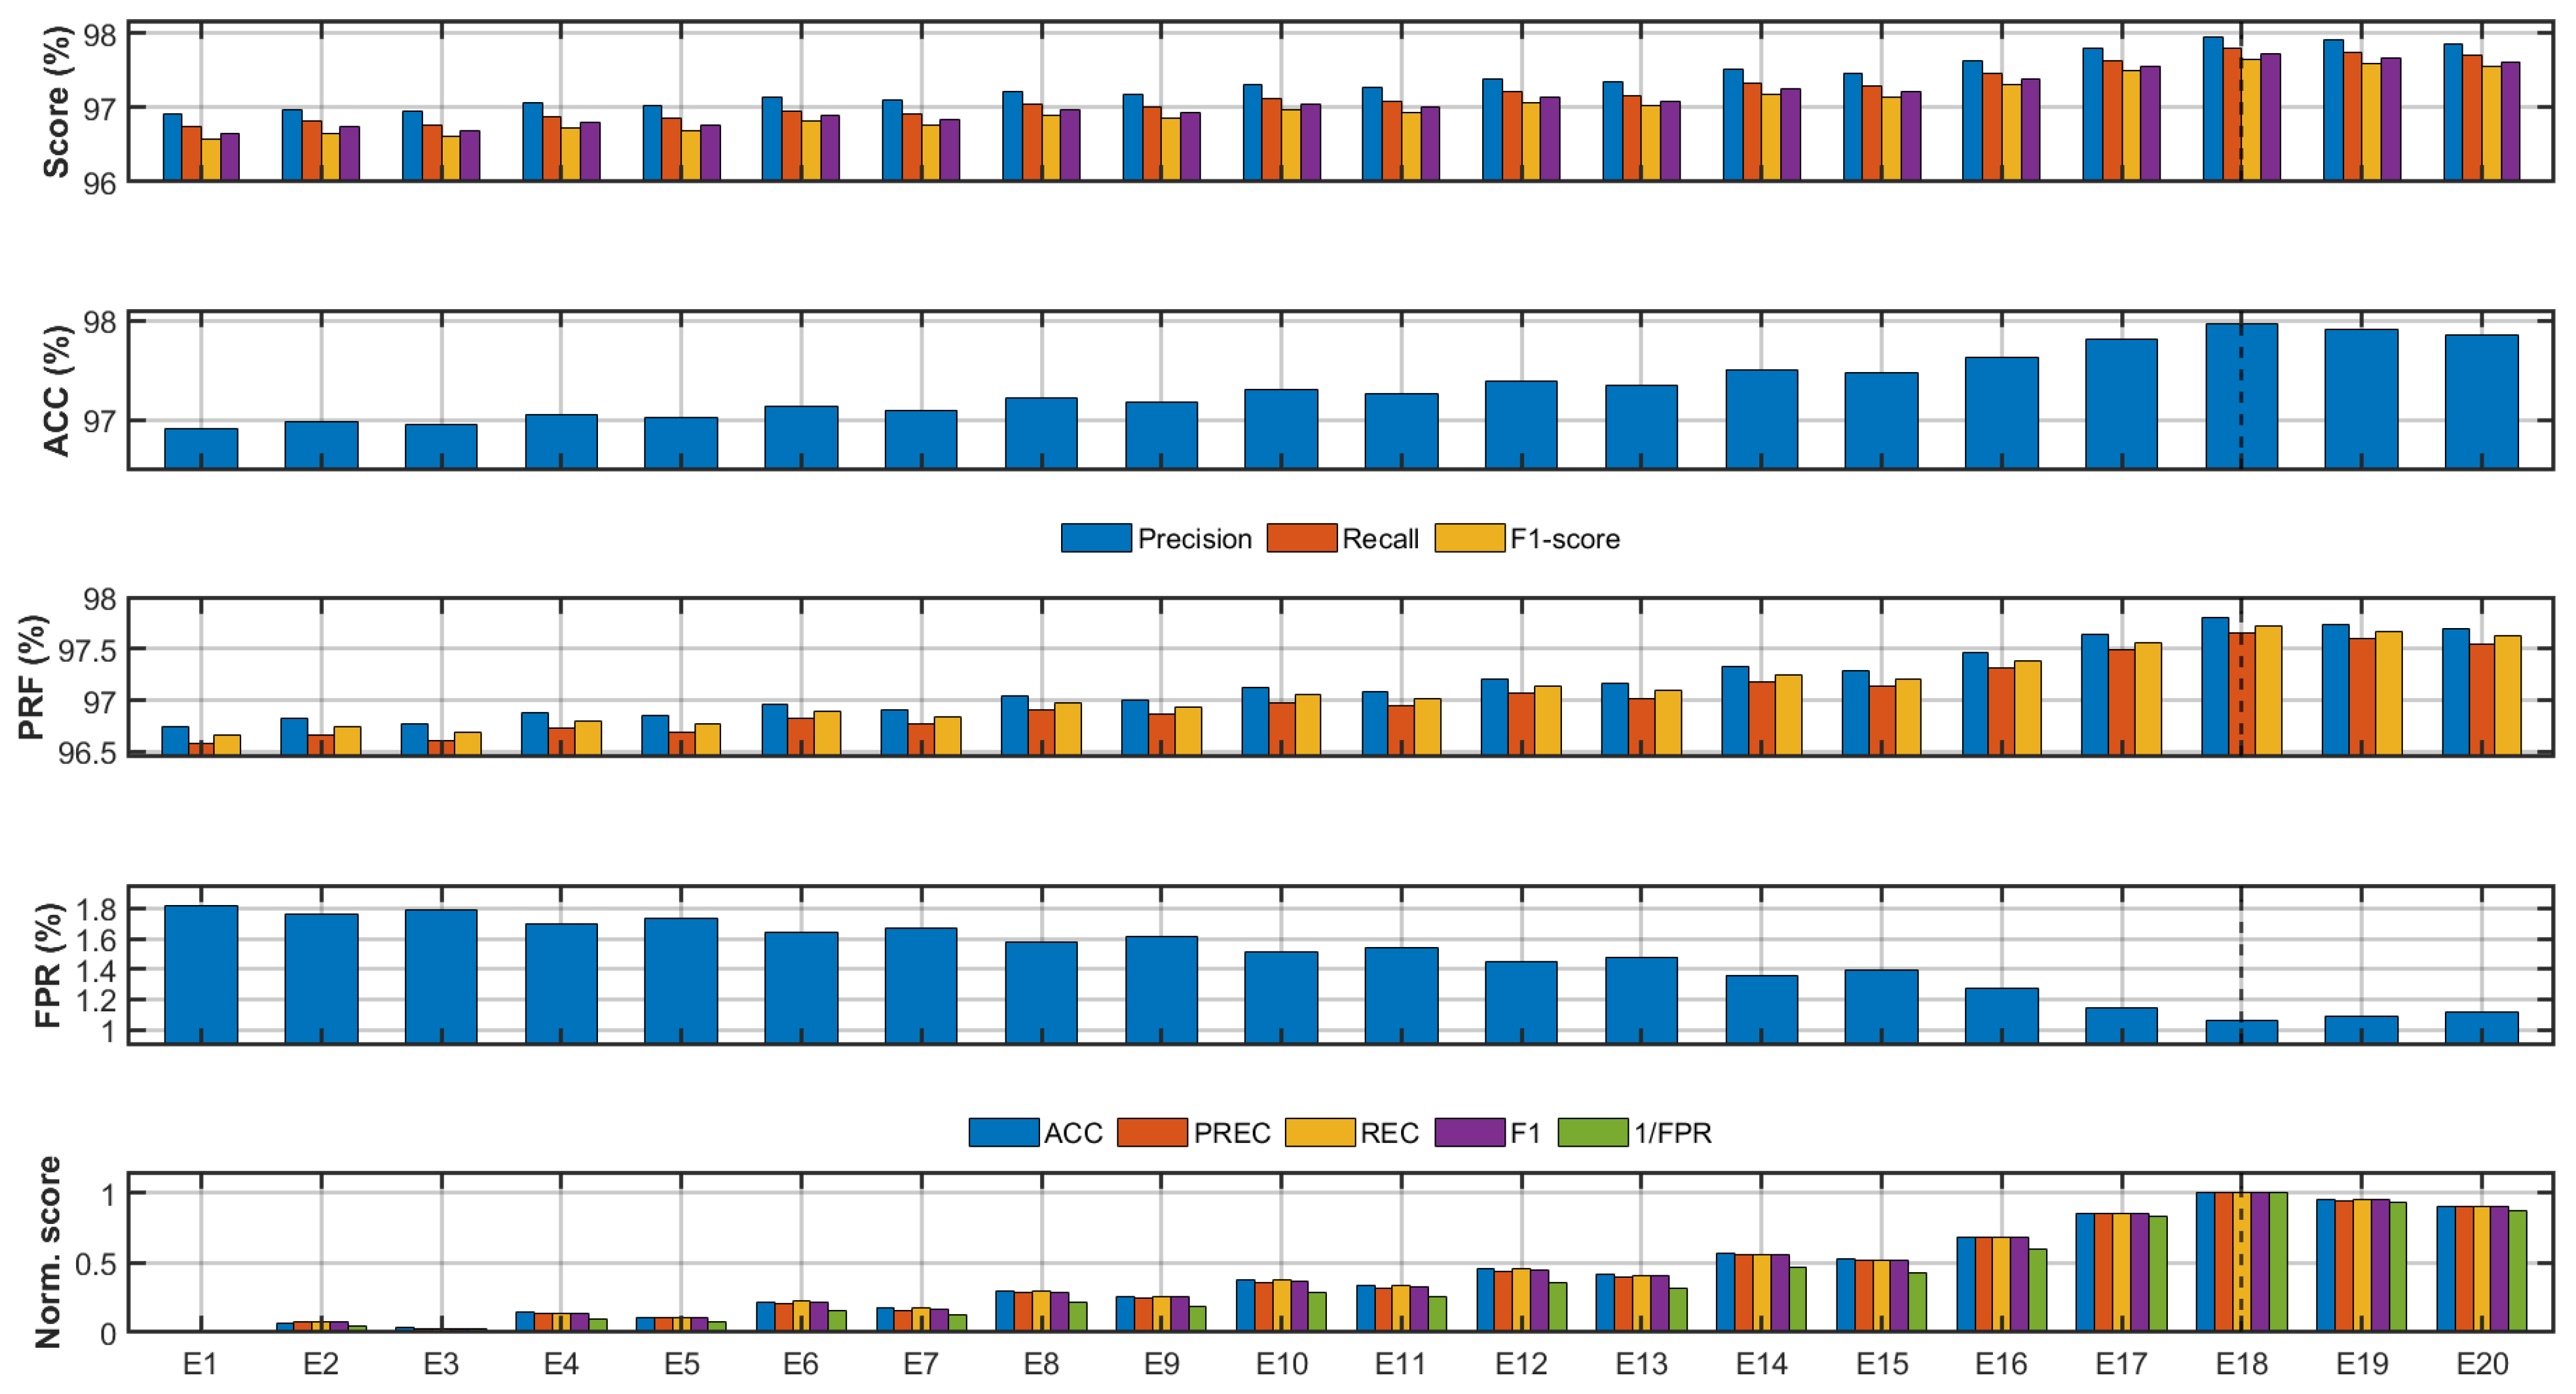
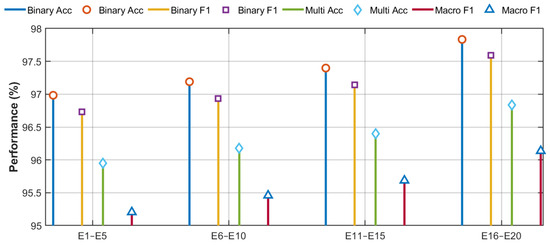
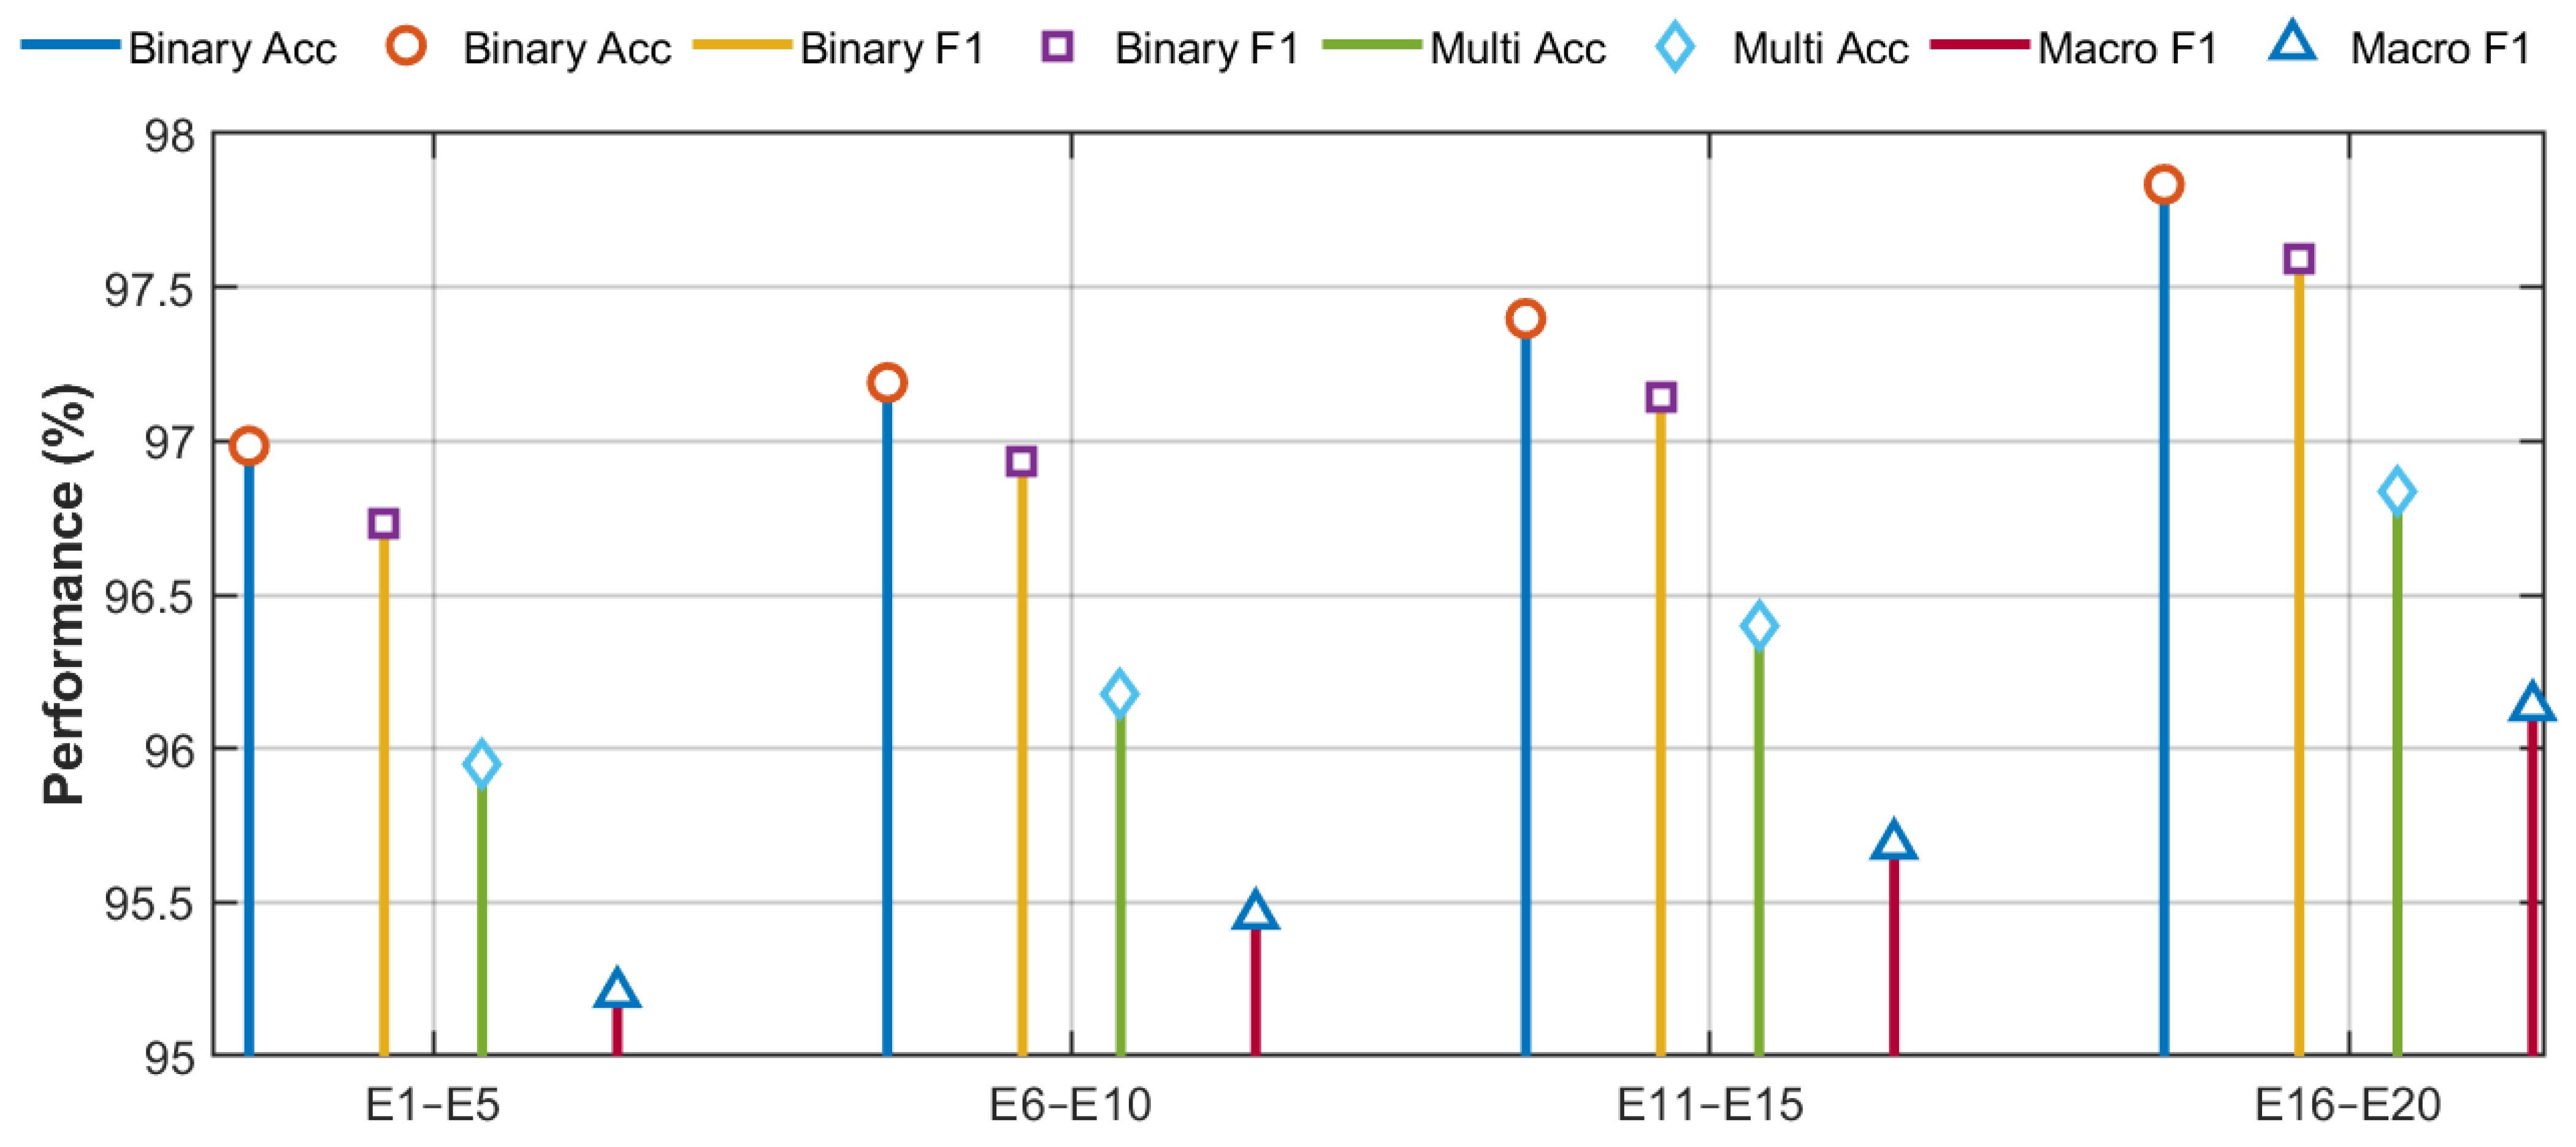

Disclaimer/Publisher’s Note: The statements, opinions and data contained in all publications are solely those of the individual author(s) and contributor(s) and not of MDPI and/or the editor(s). MDPI and/or the editor(s) disclaim responsibility for any injury to people or property resulting from any ideas, methods, instructions or products referred to in the content. |
© 2026 by the authors. Licensee MDPI, Basel, Switzerland. This article is an open access article distributed under the terms and conditions of the Creative Commons Attribution (CC BY) license.