


Abstract
Background: Breast cancer is the most common malignancy and the leading cause of cancer-related death for women globally. There is currently no tumor-specific targeted therapy for TNBC, in contrast to other clinical subtypes of breast cancer. Nervonic acid (NA), a very long-chain omega-9 fatty acid, has been reported to have neuroprotective and anti-inflammatory properties, but the anticancer effect of NA is poorly understood. The aim of this study is to investigate the anticancer potential of NA. Methods: In order to investigate the anticancer effect of nervonic acid on the MDA-MB-231 breast cancer cell line, we performed a cell viability assay, assessed redox balance, performed nuclear morphological staining, evaluated gene expression, and carried out immunoblotting. Results: The results showed that NA treatment markedly decreased cell viability, increased ROS production, and increased protein expression levels of the apoptotic markers Caspase-3, -8, and -9 and p53 compared to untreated cells. Conclusions: From a mechanistic viewpoint, NA treatment altered the redox balance and changed the expression pattern of p53 and Caspase-3, -8, and -9 proteins to initiate apoptosis. This investigation has shown that NA has potential anticancer activity against the MDA-MB-231 breast cancer cell line.
1. Introduction
Worldwide, cancer is a major cause of mortality and disability, with breast and cervical cancer being the most prevalent among women [1]. Every year, over 500,000 people are diagnosed with cervical cancer, and over 280,000 die from it [2]. Additionally, one in eight women will be diagnosed with breast cancer (BC), making it the most common malignancy in women, despite various advanced diagnostic and treatment approaches. About 2.31 million new cases of BC were recorded globally in 2022, accounting for 11.6% of total cancer cases. Breast cancer accounts for 0.67 million deaths, or 6.9% of all cancer-related deaths, thus being the primary cause of cancer-related mortality in women [3,4]. Over the past few decades, numerous researchers have worked diligently to reduce breast cancer incidence and mortality worldwide. Currently, biomarkers or molecular indicators are important for BC treatment from the perspectives of detection, diagnosis, and prognosis [5,6]. Estrogen receptor (ER), progesterone receptor (PR), and human epidermal growth factor receptor 2 (HER2) are common biomarkers that are used to identify the molecular subtypes of BC: luminal A, luminal B, basal-like, and HER2-positive [7]. The only subtype of BC lacking targeted therapy is triple negative breast cancer (TNBC), which makes up about 15–20% of breast cancers and lacks the estrogen receptor (ER), progesterone receptor (PR), and human epidermal growth factor receptor 2 (HER2). TNBC is associated with increased risk of metastatic progression and early recurrence, poor prognosis, and the development of therapeutic resistance [8]. Numerous physiological processes, such as membrane fluidity, eicosanoid metabolism, gene expression, and cell signaling, are regulated by fatty acids (FAs), which are commonly found in the daily diet. The potential of fatty acids, such as ALA, EPA, and DHA, to prevent the onset and spread of cancer has been well investigated [9]. Furthermore, research in humans has shown that consuming a large amount of fish oil, which is rich in omega-3 polyunsaturated fatty acids, can reduce the risk of cancer. The number of carbons, the existence of double bonds between carbons, and the location of those double bonds are some of the factors that determine the effects of fatty acids on cancer. The health benefits of omega-3 and omega-6 FAs are widely documented. Recently, there has been substantial interest in research regarding the biological benefits of omega-9 FAs, a primary type of monounsaturated fatty acid (MUFA) found in both plants and animals. Hypogeic acid (16:1), oleic acid (18:1), elaidic acid (18:1), gondoic acid (20:1), mead acid (20:3), erucic acid (22:1), and nervonic acid (24:1) are the most common omega-9 FAs. In addition to having anti-inflammatory properties, MUFAs are a healthier substitute for saturated animal fats [10,11]. In previous reports, researchers also have studied the anticancer effects of MUFAs, including oleic acid and mead acid, on human breast cancer cells [12,13]. Nervonic acid (C24:1 Δ15, cis-15-tetracosenoic acid, NA), a functional very long-chain omega-9 MUFA primarily sourced from plant seed oil and fish oil, was first identified in the nerve tissues of mammals. Sphingolipid, a crucial component of white matter and myelinated nerve fibers, is created when NA combines with sphingosine via amide bonds. NA can strengthen immunity, repair damage to the central nervous system, and enhance brain function. NA plays several physiological roles in addition to protecting brain cells. NA can enhance immune function by increasing the number of cells that produce antibodies, the activity of NK cells, and the transformation and proliferation of splenic lymphocytes. NA supplementation can reduce the generation of pro-inflammatory cytokines and chemokines. It is essential for immunological regulation and the prevention of metabolic diseases because of its anti-inflammatory properties [14,15,16]. The biological roles of NA have been the focus of an increasing number of investigations. Thus, the main goal of this work is to determine whether nervonic acid exerts its anticancer effects by via increasing the expression of apoptotic regulators in the MDA-MB-231 (triple negative breast cancer) cell line.
2. Materials and Methods
2.1. Chemicals and Reagents
Penicillin–streptomycin solution, phosphate-buffered saline (PBS) solution (10×), heat-inactivated fetal bovine serum (FBS), bovine serum albumin (BSA), and trypsin–EDTA 10×-solution were procured from HiMedia, Thane, Maharashtra, India. Nervonic acid was purchased from Sigma Aldrich, Stockholm, Sweden (cat# 87117-100MG). The SYBR green master mix used for RT-PCR was purchased from Agilent, Cedar Creek, TX, USA (Cat#600882), and the One-step TUNEL In Situ Apoptosis Kit (Green, AF488) was purchased from Elabscience, Wuhan, China (Cat no: E-CK-A321). P53 (cat# 60283-2-Ig) and Caspase-9 (cat#66169-1-Ig) mouse monoclonal IgG antibodies were procured from ProteinTech, San Diego, CA, USA. Caspase-8 (cat# E-AB-22107) and Caspase-3 (FNab09938) mouse monoclonal IgG antibodies were purchased from Elabscience and FineTest, Wuhan, China. The goat anti-mouse IgG-HRP (cat# 11–301) secondary antibody was purchased from Abgenex, Bhubaneswar, Odisha, India.
2.2. Cell Culture and Maintenance
The MDA-MB-231 breast cancer cell line (highly invasive) was purchased from NCCS, Pune, India (Req No. 1587/2023-24) at passage number P43. The cell line was validated by cell line authentication report (job no. 1587/2023-24). The cells were normally grown at 37 °C in Leibovitz’s L-15 medium supplemented with 10% fetal bovine serum and antibiotics (100 U/mL penicillin and 100 µg/mL streptomycin) with no CO2. Every 2 days, the medium was changed. When the cells reached more than 70% confluency, they were collected by trypsinization and re-seeded into a new culture flask.
2.3. Fatty Acid Treatment
In order to explore the effect of fatty acids, MDA-MB-231 cells were grown under control conditions for 24 h in the presence of nervonic acid (NA) at final concentrations of 2.5 μM, 5.0 μM, 7.5 μM, and 10 μM in an incubator at 37 °C. The nervonic acid was dissolved in DMSO to the desired concentrations.
2.4. Cell Viability Assay (MTT)
To investigate the viability of MDA-MB-231 cells, a 3-(4,5-dimethylthiazol-2-yl)-2,5-diphenyl tetrazolium bromide (MTT) assay kit (Hi-Media, Thane, Maharashtra, India) was used. Briefly, MDA-MB-231 cells (5 × 10³ cells/mL) were seeded in 96-well plates with 100 μL of complete media. Following a 24 h period, the cells were exposed to different nervonic acid concentrations for 6, 12, or 24 h. To evaluate the cytotoxic effect of DMSO alone under the tested experimental conditions, cells were incubated with DMSO (1:1000) and served as the vehicle control group. MTT reagent was added to a final concentration of 10% of the total volume of each well after the treatment was finished, and the wells were then incubated at 37 °C for 4 h in the dark. Next, 100 μL of solubilization solution were added to each well, and the wells were shaken in the dark for 30 min to allow the crystals to dissolve. Finally, the optical density at 570 nm was measured using a microplate reader with a reference wavelength of 630 nm. The following formula was used to determine the percentage of cell proliferation: % of viable cells = (OD of sample–OD of blank)/(OD of treated–OD of blank) × 100 [17].
2.5. Determination of Cellular Redox Status (GSH, GSSG, NO and MDA Levels)
After treatment with nervonic acid, the amounts of reduced glutathione (GSH) and oxidized glutathione (GSSG) in the cell lysate (1 × 10⁶ cells/mL) were measured. The cell lysate was mixed with 25% trichloroacetic acid (TCA) and centrifuged at 2000× g for 15 min to remove the proteins that had precipitated. The supernatant was aspirated and then diluted to 1 mL with 0.2 M sodium phosphate buffer (pH 8.0). Then, 2 mL of DTNB (0.6 mmol) was added. The OD of the yellow complex that was produced when GSH and DTNB (Ellman’s reagent) reacted was measured at 405 nm after 10 min of mixing. A standard curve was generated using standard reduced glutathione. GSH levels were expressed as μg of GSH/mg of protein. The amount of oxidized glutathione in the cell lysate was tested after GSH had been derivatized with 2-vinyl pyridine. Briefly, 0.5 mL of the test sample and 2 μL of 2-vinylpyidine were combined, and the mixture was incubated at 37 °C for 1 h. Centrifuging the reaction mixture at 1000× g for 10 min allowed the precipitated proteins to settle after the reaction mixture had been deproteinized with 4% sulfosalicylic acid. After collecting the supernatant, the GSSG level was measured using a conventional GSSG curve and the DTNB response at 412 nm absorption. The standard GSSG curve was used to calculate the GSSG level. The GSSG levels were reported as μg of GSSG/mg protein [18]. Nitric oxide (NO) levels in MDA-MB-231 cells after treatment with nervonic acid were measured using an EZAssayTM Nitric Oxide Estimation Kit (CCK061-200, Hi-Media, Thane, Maharashtra, India) according to the manufacturer’s protocol [19]. In order to assess lipid peroxidation, malondialdehyde (MDA) levels were measured. Briefly, MDA-MB-231 cells treated with varying dosages of nervonic acid were lysed (1 × 10⁶ cells/mL), and the MDA level in this cell lysate was estimated. Following reaction with thiobarbituric acid (TBA) in acidic medium and measurement of the absorbance at 540 nm, MDA was identified spectrophotometrically as a thiobarbituric acid-reactive substance (TBARS). The findings from the lipid peroxidation experiments were expressed as nmol/mg protein [20].
2.6. Intracellular ROS Measurement
Intracellular ROS accumulation was measured using the 29,79-dichlorofluorescein diacetate (H2DCFDA) technique. H2DCFDA (2 mM in the total medium) was added to each well of six-well plates containing cultured cells after they had been treated with nervonic acid for the duration specified. Following a 20 min incubation period at 37 °C, cells were twice rinsed with PBS for 20 min each. Intracellular ROS accumulation was observed, and images were captured using a fluorescent microscope (OLYMPUS, Tokyo, Japan) [21]. In addition, the total quantity of ROS was measured using H2DCFDA dye and a multimode plate reader (Biotek, Hong Kong, China, Model: 22031606).
2.7. RNA Isolation and Assessment of Relative mRNA Expression by Semi-qPCR
MDA-MB-231 cells were seeded at a density of 1 × 10⁶ cells per well in a six-well plate. The cells were treated with nervonic acid after a 24 h incubation period to allow cell attachment. Following trypsinization, the cells were centrifuged for 15 min at 3000 rpm. RNA extraction was performed in accordance with the HiPurA Total RNA Miniprep purification kit methodology (HiMedia, Thane, Maharashtra, India). The Hi-cDNA synthesis kit (HiMedia, HiGenoMB, Thane, Maharashtra, India) instructions were followed to prepare cDNA. Using specific primers and the 2X PCR Tag Mixture, cDNA was amplified using a thermal cycler (T100TM Thermal Cycler, Bio-Rad, Hercules, CA, USA, Model No. 621BR38974). The sequences of the primers used for the gene expression experiments are as follows: P53 (sense: TGCGTGTGGAGTATTTGGATG, antisense: TGGTACAGTCAGAGCCAACCTC), Bcl2 (sense: TGTGGATGACTGACTACCTGAACC, antisense: CAGCCAGGAGAAATCAAACAGAGG), Bax (sense: CGGCGAATTGGAGATGAACTGG, antisense: CTAGCAAAGTAGAAGAGGGCAACC), Caspase-3 (sense: GTGGAACTGACGATGATATGGC, antisense: CGCAAAGTGACTGGATGAACC), Caspase-8 (sense: ACAATGCCCAGATTTCTCCCTAC, antisense: CAGACAGTATCCCCGAGGTTTG), Caspase-9 (sense: CGCCACCATCTTCTCCCTG, antisense: CCAACGTCTCCTTCTCCTCC), and the housekeeping gene GAPDH (sense: GGTGAAGGTCGGAGTCAACG, antisense: GTGAAGACGCCAGTGGACTC). The primers for all genes used in this study were supplied by Bioserve (Hyderabad, Telangana, India). Agarose gel electrophoresis was used to analyze the semi-qPCR results, and ethidium bromide was used to visualize the results. A GeNeiTMmini-submarine gel system was used to examined multiplex gene expression in nervonic acid-treated MDA-MB-231 cells. A Gel Documentation Imaging System (Bio-Rad, Model No. 1708275) was utilized to analyze the results.
2.8. Real-Time Fluorescence-Based Reverse Transcription
Apoptotic (p53, Bax, Caspase-3, -8, -9) and anti-apoptotic (Bcl2) gene transcription levels were assessed by real-time quantitative polymerase chain reaction (RT-qPCR) using SYBR green master mix and normalized to a housekeeping gene (GAPDH). All primer sequences and the cDNA preparation procedure are the same as previously described for the semi-qPCR. The RT-PCR reaction mixture consisted of 8 μL DPEC water, 10 μL SYBR green, and 0.5 μL each of the forward and reverse primers, with 1 μL cDNA. Then amplification of the samples was performed on an AriaMx Real-Time PCR System (G8830A, Agilent Technologies, New Delhi, India). A comparative analysis was then conducted based on the cycle number at which a significant increase in the amplification signal over the baseline was observed. Comparisons were made using the 2−ΔΔCT method [22].
2.9. Western Blot Analysis
After treatment with nervonic acid and washing with PBS, MDA-MB-231 cells were lysed on ice for 30 min using radioimmunoprecipitation assay buffer (RIPA, Rome, Italy) with a protease inhibitor cocktail. Using a UV-visible Double Beam Spectrophotometer (LABMAN, Bracknell, UK), the extracted protein was measured following the Lowry method. Equivalent amounts of protein were separated by 12% sodium dodecyl sulfate polyacrylamide gel electrophoresis (SDS-PAGE) and then transferred to a nitrocellulose membrane. After blocking the membrane with 2% bovine serum albumin (BSA), primary antibodies diluted to 1:1000 were added to the membranes and incubated at 4 °C overnight. Primary antibodies against p53, Caspase-8, Caspase-9, and Caspase-3 were used in this investigation. The membranes were then washed three times with PBS containing 0.1% Tween-20 before being incubating for 2 h at room temperature with horseradish peroxidase (HRP)-conjugated secondary antibody (1:7500). DAB (3,3′,4,4′-tetraaminobiphenyl tetrahydrochloride) was used to identify individual protein bands. Protein immunoreactivity was measured using ImageJ software, version 1.53e. The target protein to β-actin ratio was used to display the data.
2.10. Immunocytochemical Staining
p53 and Caspase-8 expression and distribution in the MDA-MB-231 cells were investigated by immunocytochemical staining after treatment with NA for 24 h. After being fixed with 4% paraformaldehyde for 10 min, cultured and treated cells were twice washed with PBST, permeabilized with 0.1% Triton X-100, then blocked with 3% BSA for 1 h at room temperature. Next, the cells were treated overnight at 4 °C with anti-p53 and anti-Caspase-8 antibodies diluted 1:100. The cell nuclei were then stained with DAPI, and the images were examined using fluorescence microscopy.
2.11. Assessment of Nuclear Morphological Changes by DAPI and AO/Et-Br Staining
Using DAPI nuclear staining, morphological alterations in the triple negative MDA-MB-231 cells were identified. Cells at a concentration of 1 × 10⁶ cells/mL were seeded into six-well culture plates and grown overnight, then exposed to 24 h nervonic acid treatment, followed by a PBS wash and 20 min paraformaldehyde (4%) fixation. The cells were incubated with DAPI stain solution (250 ng/mL for each well) for 5 min at 37 °C after being permeabilized with 0.2% (w/v) Triton X-100. The cells were washed with PBS, and any alterations in nuclear morphology were evaluated using an Olympus fluorescent microscope, Tokyo, Japan (Model No. BX43F) [23]. ImageJ software was used to quantify living nuclei.
Two DNA-binding dyes, ethidium bromide (Et-Br) and acridine orange (AO), were also used to morphologically identify necrotic and apoptotic cells. In six-well plates, MDA-MB-231 cell lines were cultivated at a density of 1 × 10⁶ cells/mL. When they reached confluency, the cells were exposed to nervonic acid for a duration of 24 h. Additionally, in accordance with usual procedure, the cells were washed with PBS and stained with a 1:1 v/v AO-EtBr dye mixture (each 100 μg/mL in PBS). Next, the images of stained cells were captured immediately using a fluorescence microscope [24]. Apoptosis was quantified using ImageJ software.
2.12. Fluorescence Microscopy––TUNEL Assay
DNA fragmentation was detected using the terminal deoxynucleotidyl transferase (TdT)-mediated dUDP-biotin nick end labeling (TUNEL) assay. Following seeding of the cells (at a density of 1 × 10⁶ cells/mL) on a glass coverslip, they were exposed to nervonic acid. After nervonic acid treatment for 24 h, TUNEL staining was performed using an in-situ cell death detection kit (Elabscience, E-CK-A321). In brief, cells were fixed in 1 mL of 10% formaldehyde solution (Sigma Aldrich) for 5 min, permeabilized in 1 mL of 1% Triton X-100 in PBS for 5 min, and then incubated with 50 μL of the TUNEL reagent for 60 min at 37 °C. After incubation, the cells were washed thrice with PBS and stained with DAPI at room temperature for 5 min. Again, they were washed with PBS, and the coverslips were placed on glass slides, adding anti-fluorescence quenching agent. A fluorescence microscope was used to capture the images. For at least five separate microscope fields (>100 total cells counted/condition), the percentage of positively stained cells was determined using ImageJ software [25].
2.13. Statistical Analysis
The obtained data were analyzed using GraphPad Prism 8.0.1 software. Values of three independent biological replicates (n = 3) were expressed as the mean ± standard error of the mean (SEM). Each treatment group was compared to the control group using one-way analysis of variance (ANOVA) followed by Tukey’s multiple comparison test. p values ˂ 0.05 were considered statistically significant. Statistical results were labelled in figures as follows: * p < 0.05, ** p < 0.01, *** p < 0.001, **** p < 0.0001.
3. Results
3.1. Effect of Nervonic Acid on Cell Viability
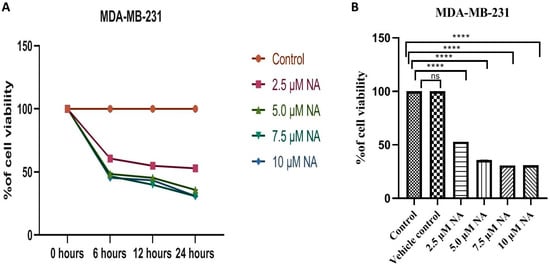
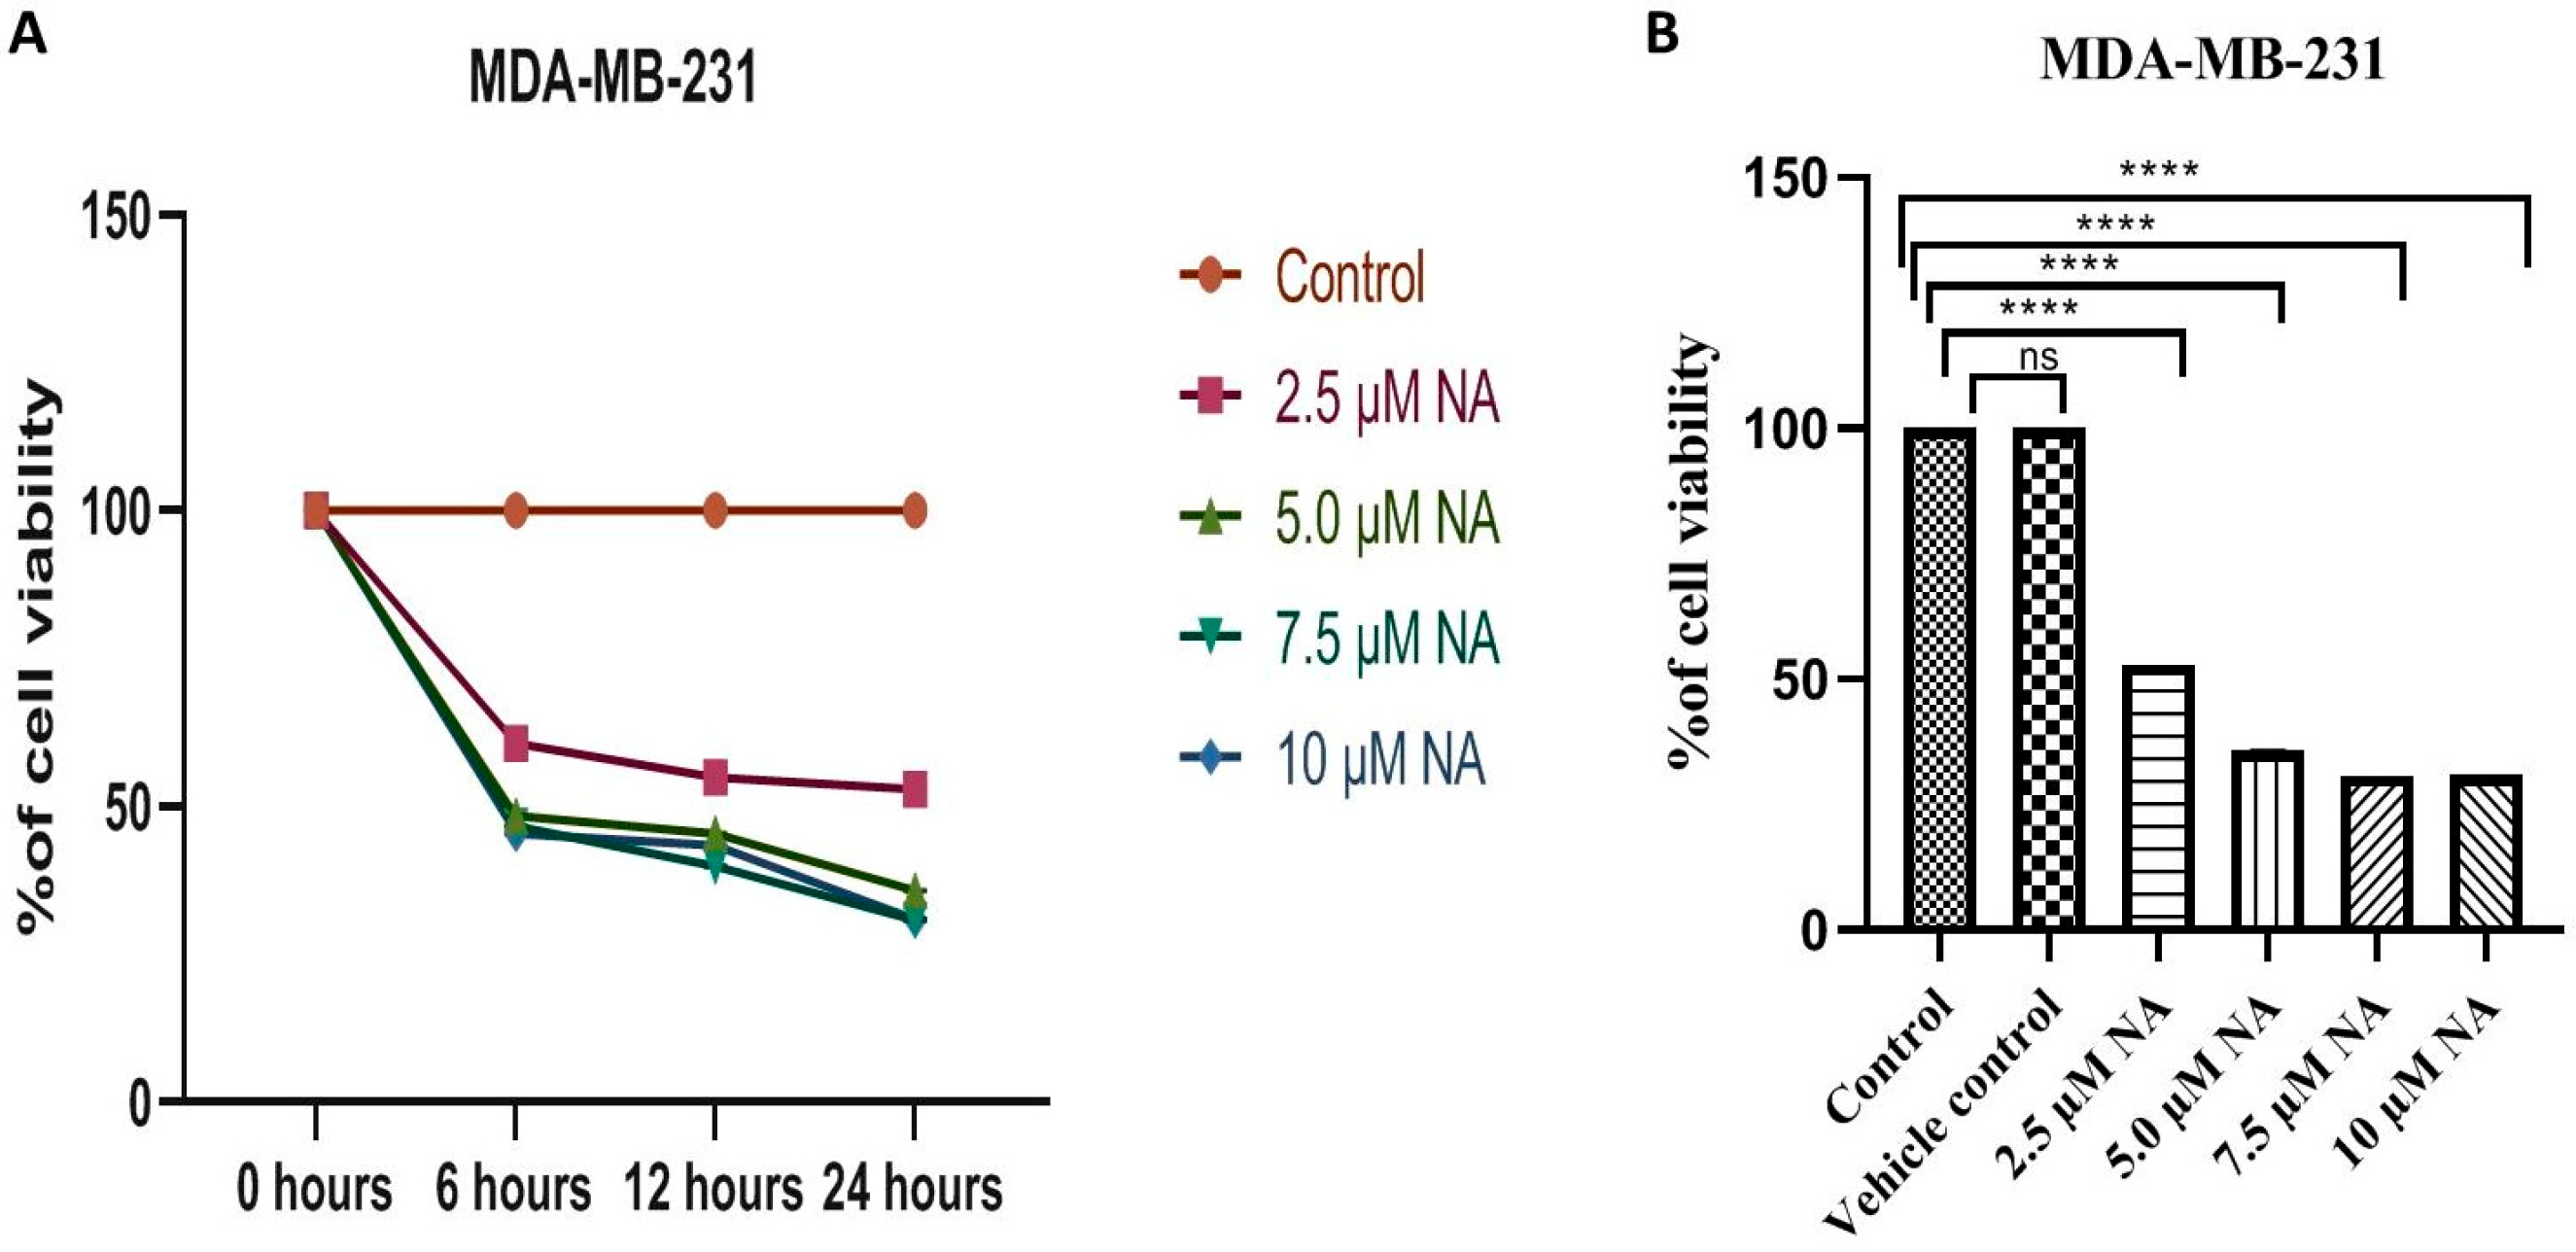
The human TNBC cell line MDA-MB 231 was used to determine cell viability after treatment with nervonic acid at different doses. A reduction in cell viability was observed after treatment with nervonic acid in a time- and dose-dependent manner (Figure 1A,B). The time-dependent experiment showed that the number of viable cells was significantly (p ≤ 0.001) reduced after treatment with nervonic acid for up to 24 h. The results showed 60.67%, 54.99%, and 52.99% cell viability followed incubation with nervonic acid (2.5 μM); 48.38%, 45.46%, and 35.79% cell viability following incubation with nervonic acid (5.0 μM); 46.69%, 39.93%, and 30.87% viability following incubation with nervonic acid (7.5 μM); and 45.46%, 43.47%, and 31.95% viability of MDA-MB-231 cells followed incubation with nervonic acid (10 μM) for 6 h, 12 h, and 24 h, respectively. The vehicle control group treated with DMSO showed no significant (p ≤ 0.05) changes in comparison to the control group. Nervonic acid treatment at 7.5 μM and 10 μM concentrations for 24 h had a promising effect on the reduction of viability of MDA-MB-231 cells compared to the control cells. The most significant decrease in cancer cell viability was observed following 24 h of exposure to nervonic acid at a dosage of 10 μM.
Figure 1.
(A) Effect of nervonic acid on the MDA-MB 231 breast cancer cell line (5 × 10³ cells/mL). Cell viability was measured by the MTT method at different time intervals. (B) Cell viability was determined by the MTT method after 24 h of treatment. Triplicate values are expressed as mean ± SEM; **** p < 0.0001 indicate significant differences and ns indicate no significant differences from the control group.
3.2. Evaluation of Intracellular Redox Balance
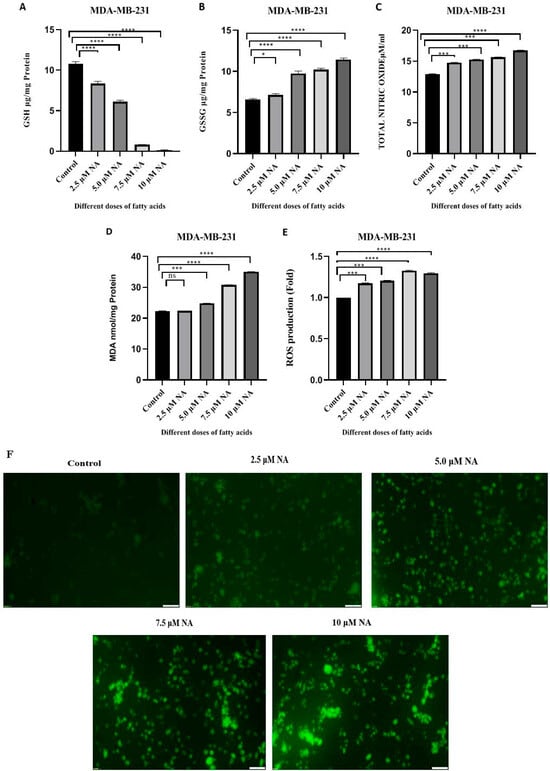
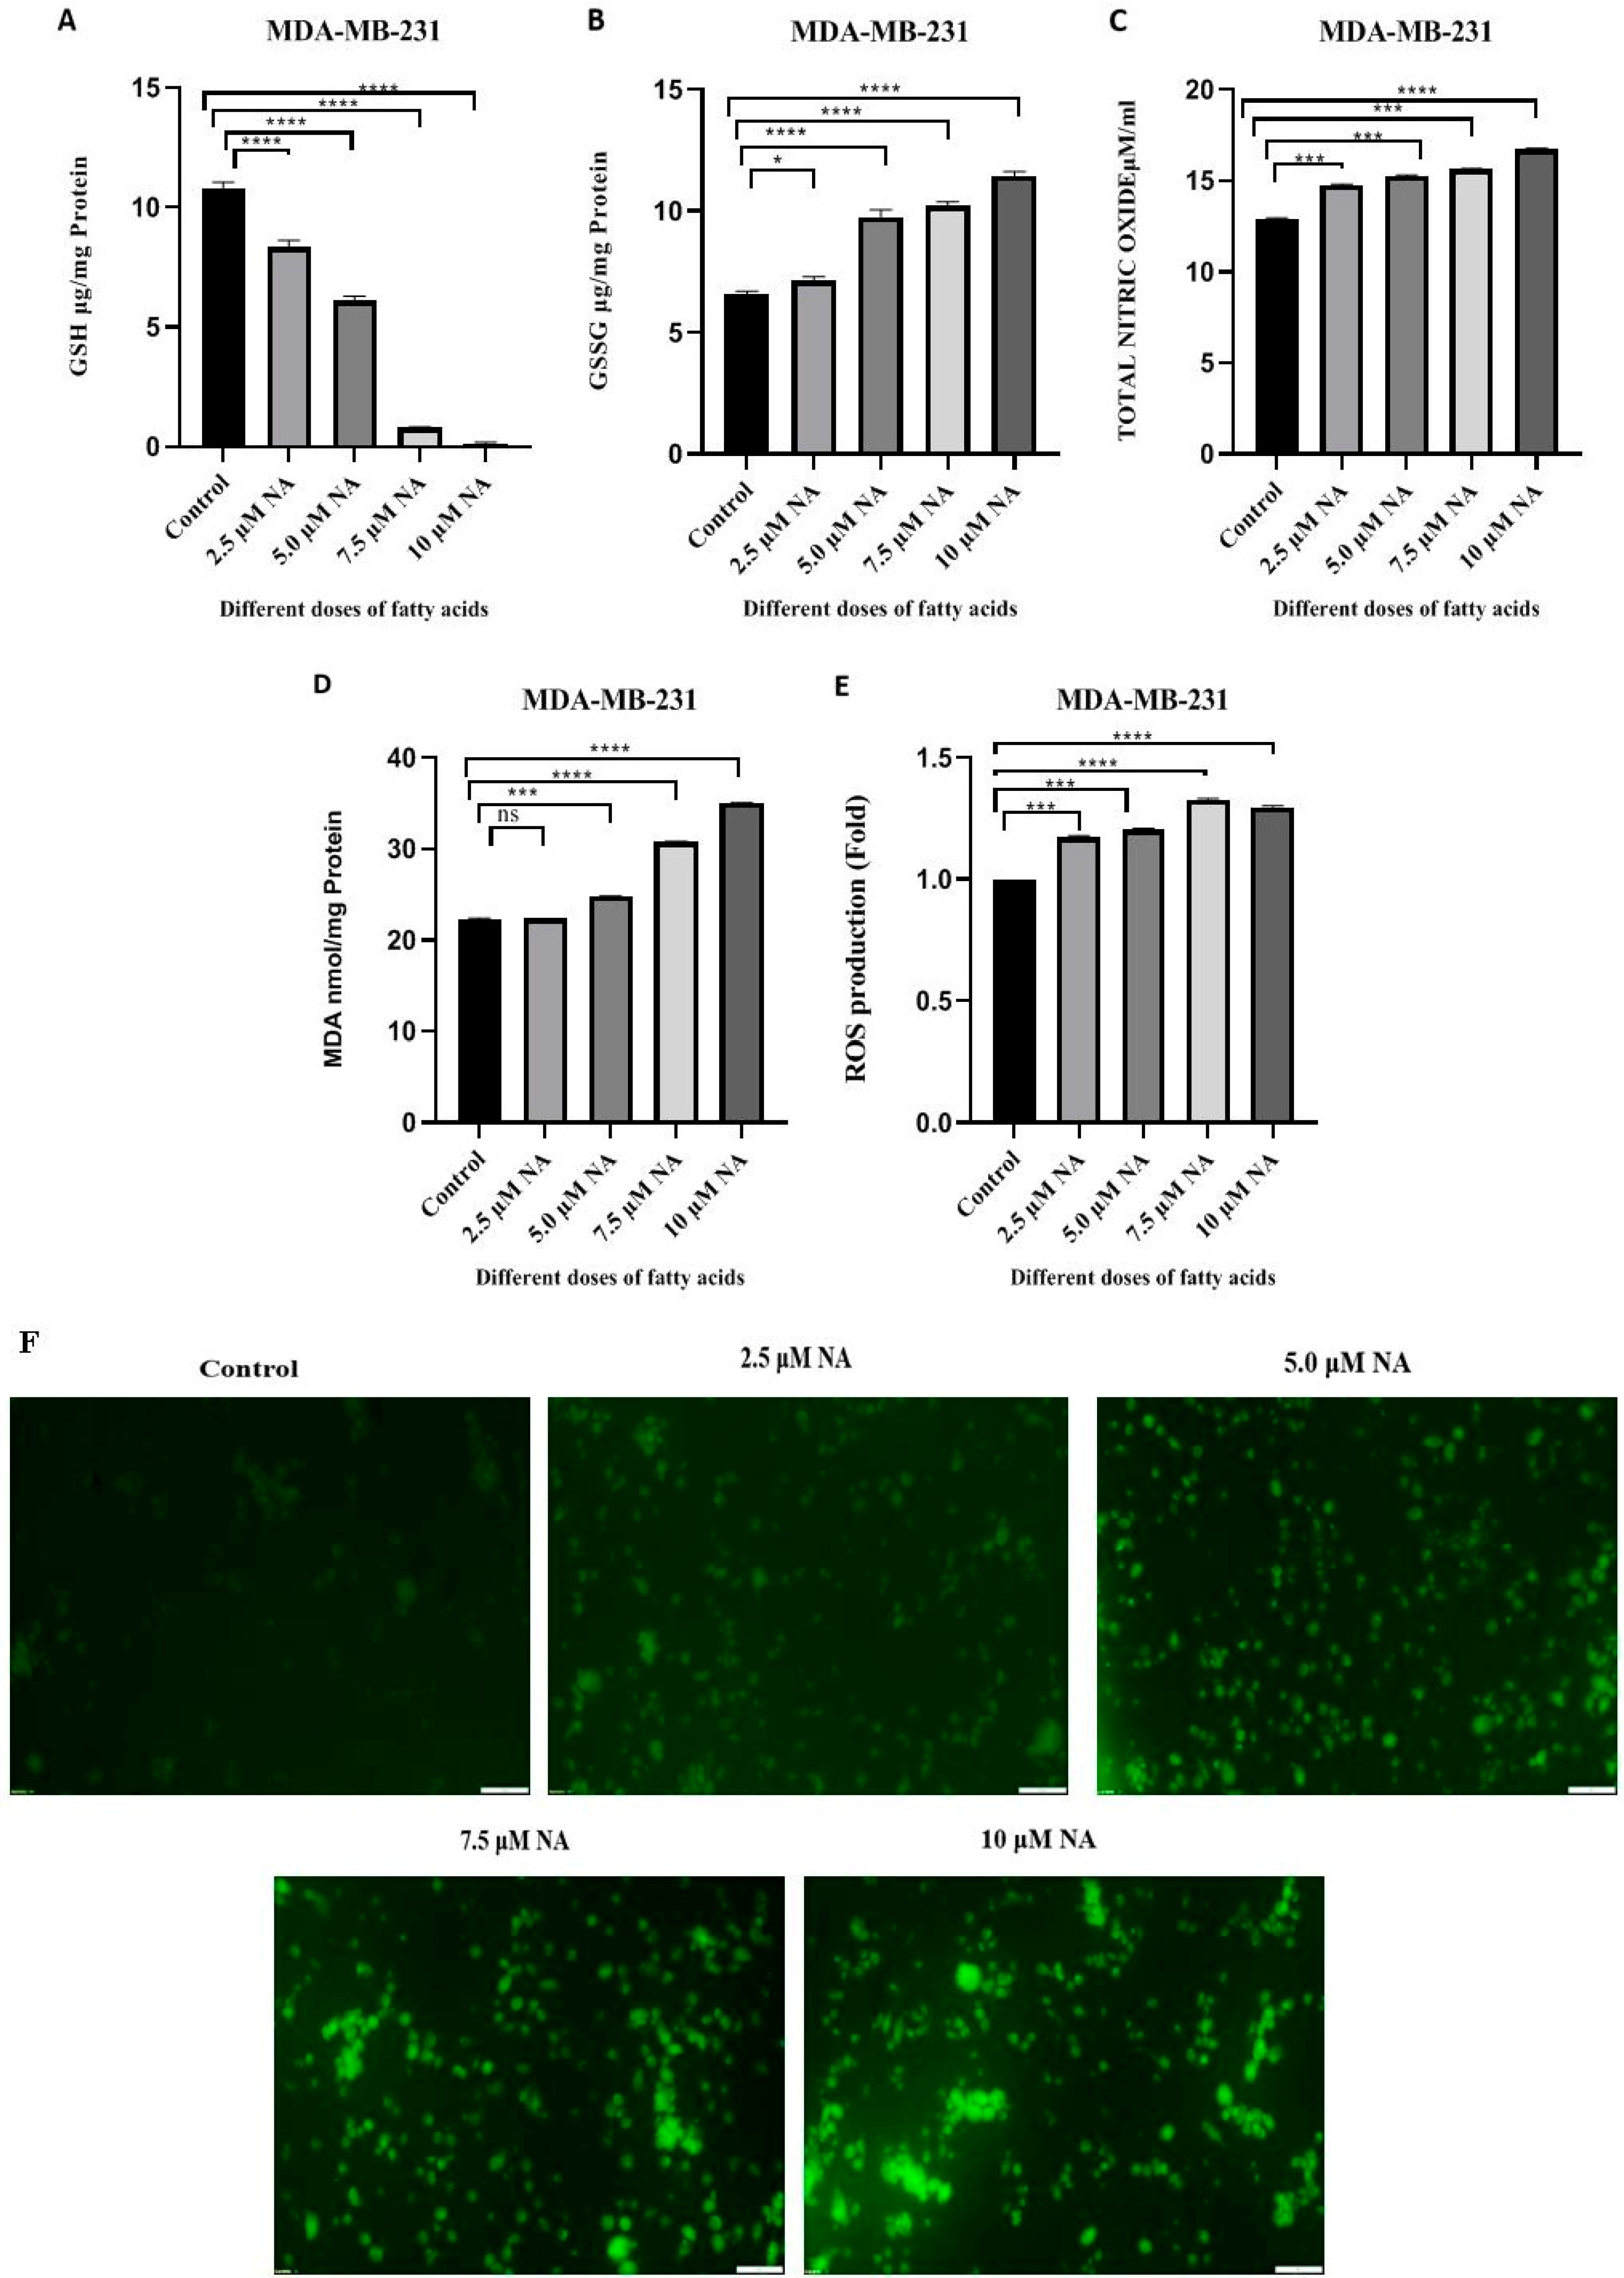
To detect oxidative stress, nitric oxide, GSH, GSSG, and MDA levels were investigated. GSH acts as an important intracellular antioxidant and regulator of cellular redox balance. The GSH content was significantly (p < 0.001) decreased by 22.37%, 42.28%, 92.42%, and 98.17% compared to the untreated control cells after treatment with nervonic acid at concentrations of 2.5 μM, 5.0 μM, 7.5 μM, and 10 μM, respectively (Figure 2A). The GSSG level was elevated considerably (p < 0.01) up to 50.60%, 53.03%, and 74.24% at doses of 5.0 μM, 7.5 μM, and 10 μM, respectively, of nervonic acid compared to untreated MDA-MB-231 cells (Figure 2B). No significant changes were noted at a dose of 2.5 μM. A change in the GSH/GSSG ratio indicates increased vulnerability of cells to oxidative stress. Nitric oxide (NO) plays a complex role in regulating intracellular redox balance and modulating cancer treatment. The NO level was markedly increased in MDA-MB-231 cells up to 14.05%, 17.99%, 20.92%, and 29.65% following treatment with nervonic acid at concentrations of 2.5 μM, 5.0 μM, 7.5 μM, and 10 μM respectively (Figure 2C). There was a significant (p < 0.001), dose-dependent increase in NO levels with increasing nervonic acid concentrations. A high NO level inhibits tumor growth, angiogenesis, migration, and metastasis, thus preventing the spread of cancer. Nervonic acid treatment also increased the level of malondialdehyde (MDA), an end product of lipid peroxidation. The level of MDA was significantly (p < 0.01) increased after treatment with nervonic acid at doses of 5.0 μM, 7.5 μM, and 10 μM, up to 11.21%, 38.11%, and 56.92%, respectively. No significant changes were noted at a dose of 2.5 μM (Figure 2D). The elevated MDA levels suggest increased oxidative stress within MDA-MB-231 cells treated with nervonic acid in comparison to untreated cell.
Figure 2.
(A–E) Intracellular reduced glutathione (GSH), oxidized glutathione (GSSG), nitric oxide (NO), malondialdehyde (MDA) and reactive oxygen species (ROS) measurements of nervonic acid-treated MDA-MB 231 breast cancer cells (1 × 10⁶ cells/mL). Quantitative measurement of ROS production was performed using a multimode microplate reader at 480 and 530 nm. The data are the mean ± SEM of triplicates. * p < 0.05, *** p < 0.001, and **** p < 0.0001 indicate significant differences from the control group. ns—not significant. (F) The intracellular ROS level was determined by DCF fluorescence intensity and captured using a fluorescence microscopic; the images shown here are at 10× magnification. Scale bar = 100 µm.
3.3. Nervonic Acid-Induced ROS Generation
Reactive oxygen species (ROS) are a class of extremely potent molecules that evolved as key signaling pathway regulators. In response to death-inducing ligands (TNFα and Fas), increased ROS can cause programmed cell death (PCD), increase DISC assembly and effector caspase activation, and decrease Bcl-2 activity. We observed a significant (p < 0.001) increase in ROS generation. Nervonic acid treatment at doses of 2.5 μM, 5.0 μM, 7.5 μM, and 10 μM increased ROS generation in MDA-MB-231 cells 1.17-fold, 1.20-fold, 1.33-fold, and 1.29-fold, respectively (Figure 2E). Figure 2F shows that, in MDA-MB-231 cells treated with nervonic acid, the fluorescence intensity generated by H2DCFDA rose in a dose-dependent manner and was significantly higher than that seen in untreated MDA-MB-231 cells. Increased ROS generation likely leads to apoptosis in the breast cancer cell line MDA-MB-231.
3.4. Effect of Nervonic Acid on the Expression of Different Apoptotic and Anti-Apoptotic Genes
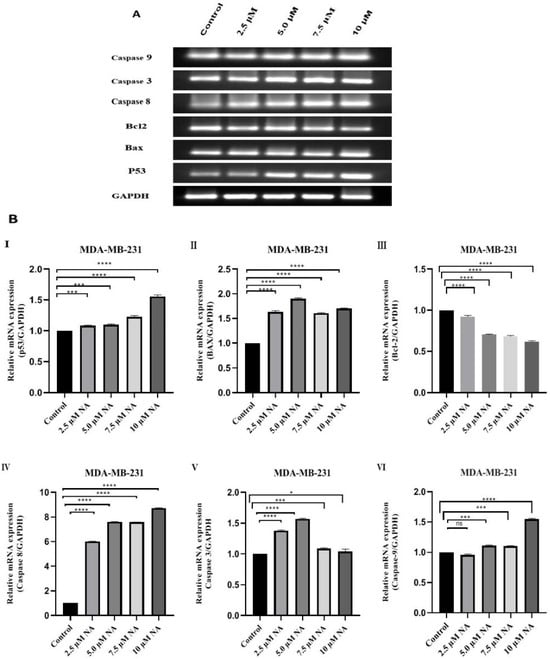
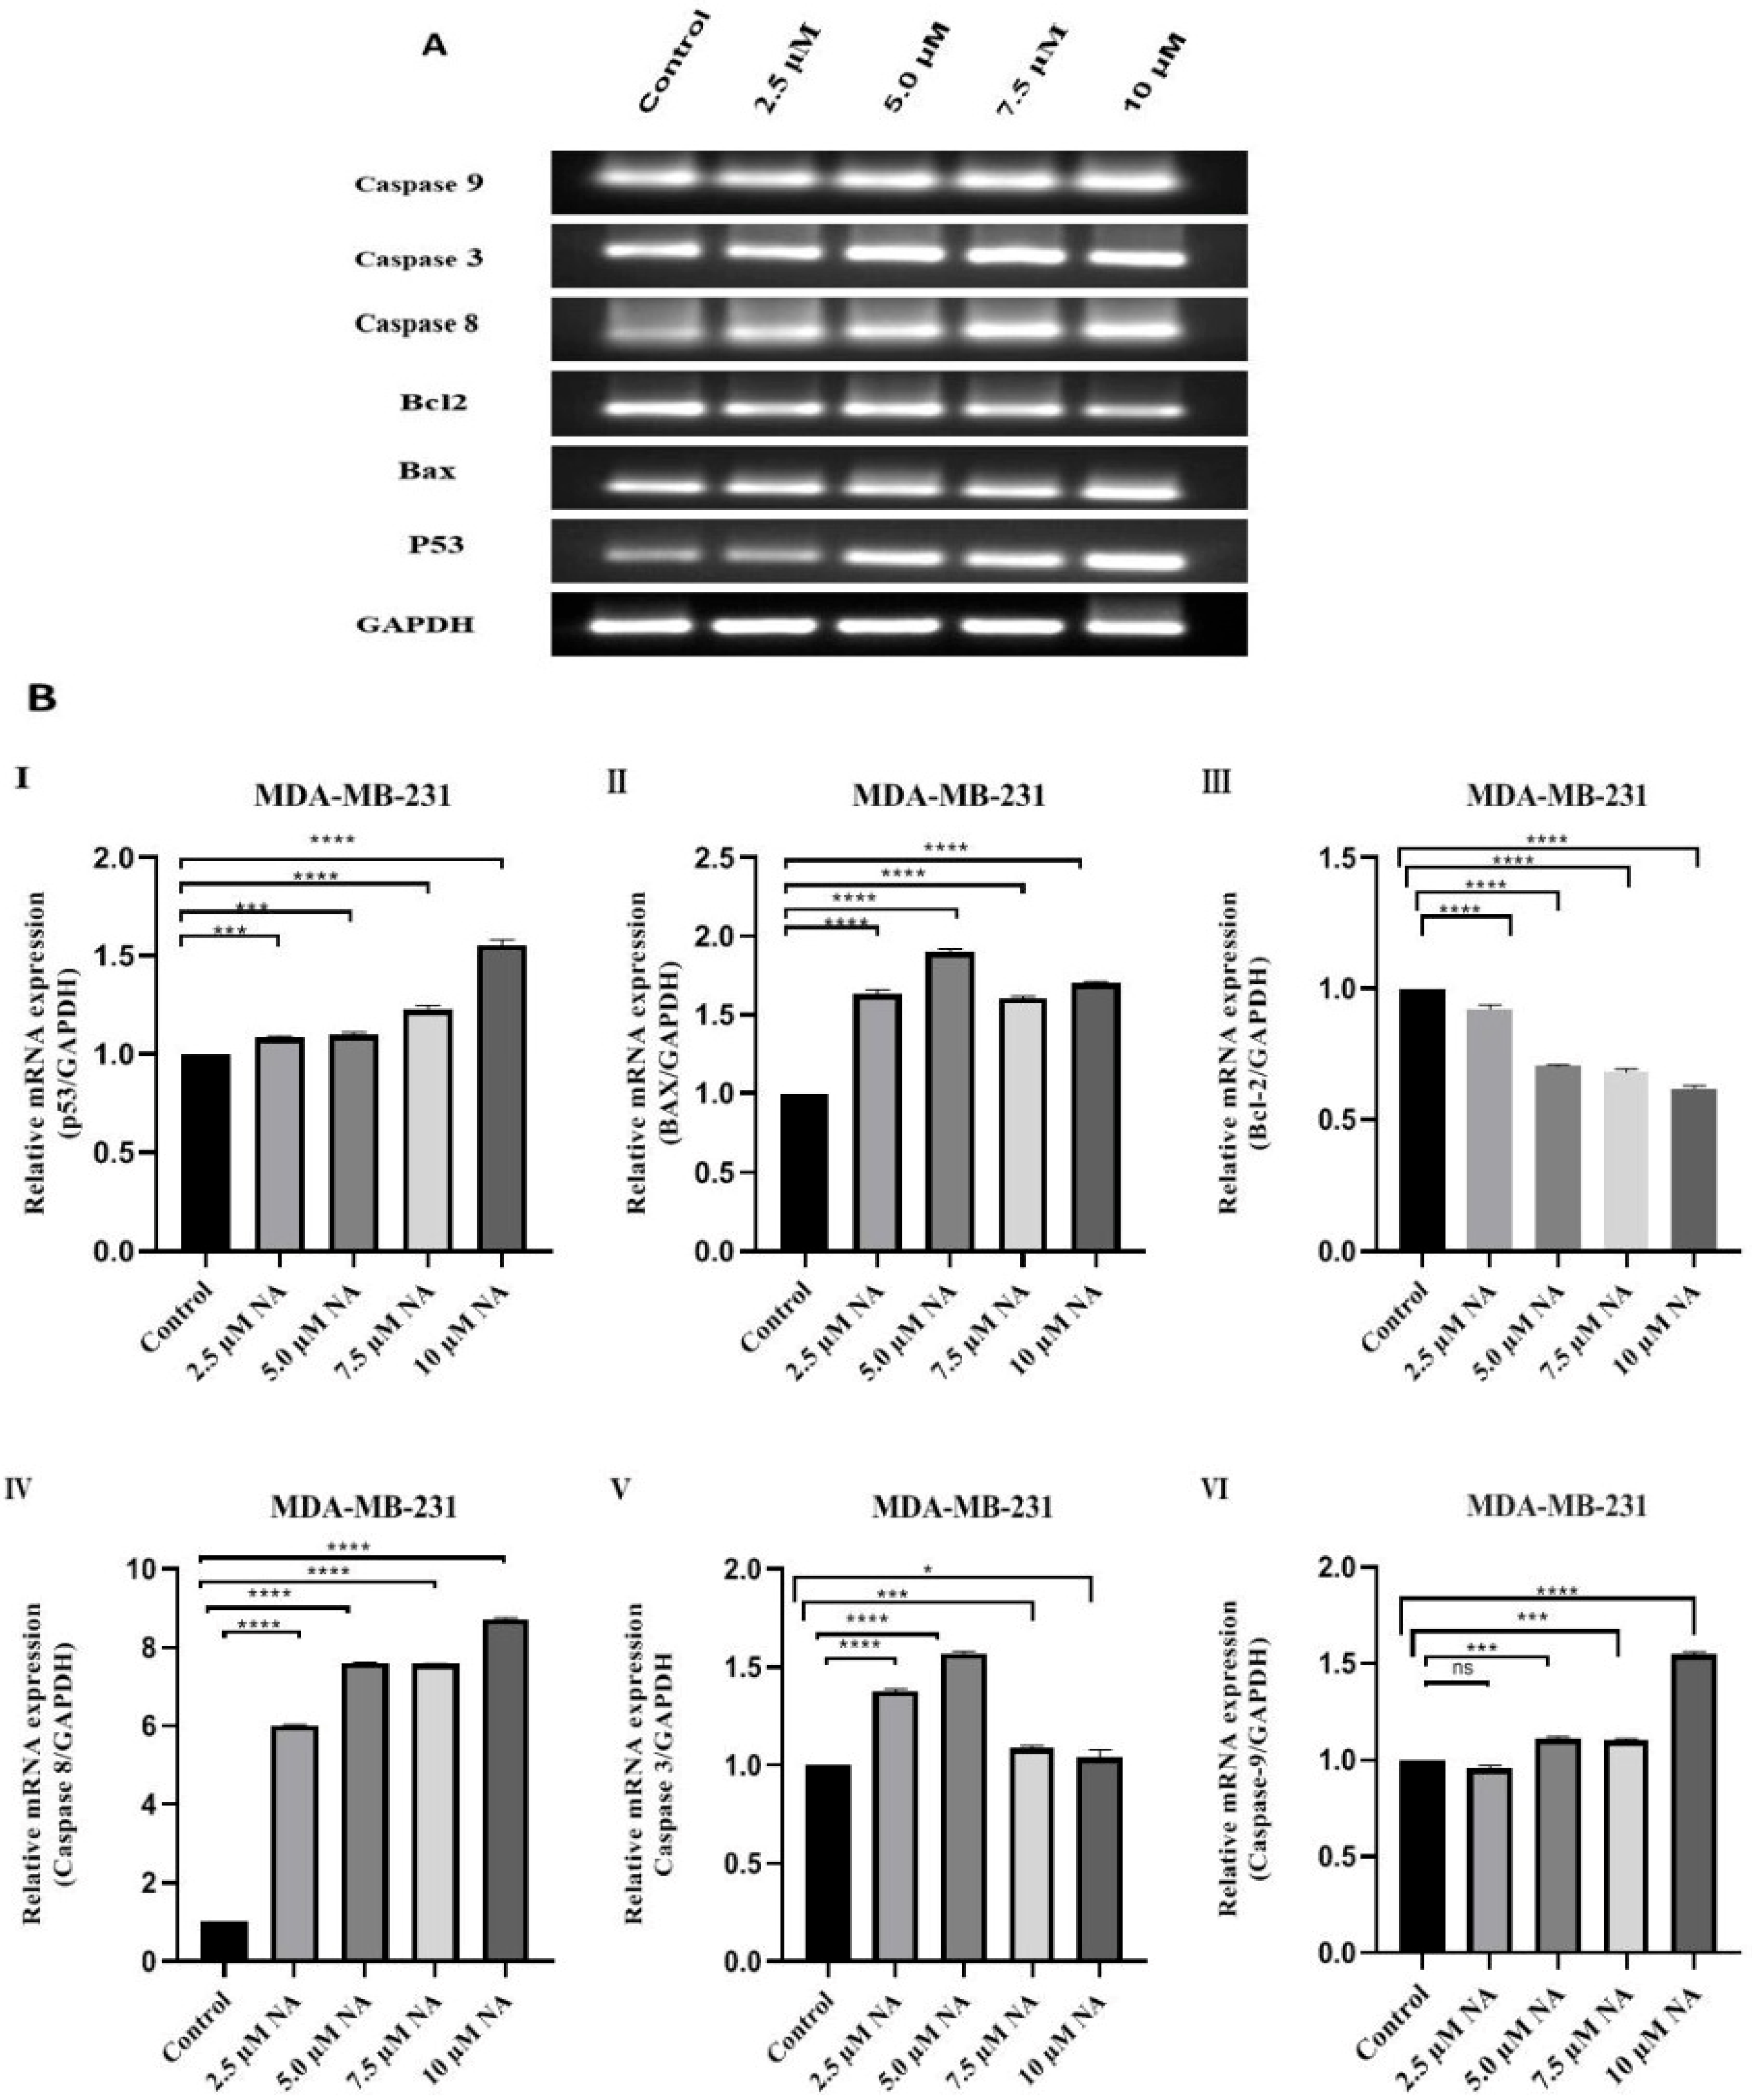
To investigate whether nervonic acid can affect the expression levels of several apoptosis-related genes, MDA-MB-231 cells were treated with different doses of nervonic acid for 24 h. Subsequently, the mRNA expression levels of the apoptotic genes p53, Bax, Caspase-3, and Caspase-8 and the anti-apoptotic gene Bcl2 were determined by PCR followed by agarose gel electrophoresis (Figure 3A). Figure 3B shows the RT-PCR values for the expression of different genes following treatment with nervonic acid. The expression level of p53 considerably rose by 1.09-, 1.1-, 1.22-, and 1.56-fold following treatment with 2.5 μM, 5.0 μM, 7.5 μM, and 10 μM of nervonic acid, respectively (Figure 3B(I)). Figure 3B(II) indicates that nervonic acid at doses of 2.5 μM, 5.0 μM, 7.5 μM, and 10 μM markedly increased the expression levels of Bax by 1.65-, 1.91-, 1.60-, and 1.70-fold respectively, in MDA-MB-231 cells. Figure 3B(III) indicates that nervonic acid at doses of 2.5 μM, 5.0 μM, 7.5 μM, and 10 μM significantly decreased the mRNA expression level of Bcl2 in MDA-MB-231 cells by 1.08-, 1.42-, 1.45-, and 1.61-fold-, respectively. Likewise, incubation of MDA-MB-231 cells with 2.5 μM, 5.0 μM, 7.5 μM, and 10 μM of nervonic acid markedly increased the expression levels of Caspase-8 by 6.02-, 7.62-, 7.56-, and 8.75-fold, respectively (Figure 3B(IV)). The expression level of Caspase-3 rose slightly by 1.38-, 1.58-, 1.08-, and 1.03-fold following treatment with 2.5 μM, 5.0 μM, 7.5 μM, and 10 μM of nervonic acid, respectively (Figure 3B(V)), and the expression level of Caspase-9 increased by 1.1-, 1.11-, and 1.56-fold, respectively, following treatment with 5.0 μM, 7.5 μM, and 10 μM of nervonic acid (Figure 3B(VI)). The RT-PCR results showed that the expression of p53, Bax, Caspase-3, Caspase-8, and Caspase-9 significantly increased, and the Bcl2 level considerably decreased, after treatment.
Figure 3.
(A) The expression of different genes as detected by semi-qPCR followed by agarose gel electrophoresis in nervonic acid-treated MDA-MB 231 breast cancer cells (1 × 10⁶ cells/mL). The results were normalized to GAPDH. (B) The expression levels of different mRNAs were quantified by RT-PCR in nervonic acid-treated MDA-MB 231 breast cancer cells (1 × 10⁶ cells/mL). The results were normalized to GAPDH (I–VI). Statistical analysis was performed by one-way ANOVA followed by Tukey’s multiple comparison test. Triplicate values were expressed as mean ± SEM. * p < 0.05, *** p < 0.001, and **** p < 0.0001 indicate significant differences from the control group. ns—not significant.
3.5. Effect of Nervonic Acid on the Expression of Proteins That Regulate Apoptosis
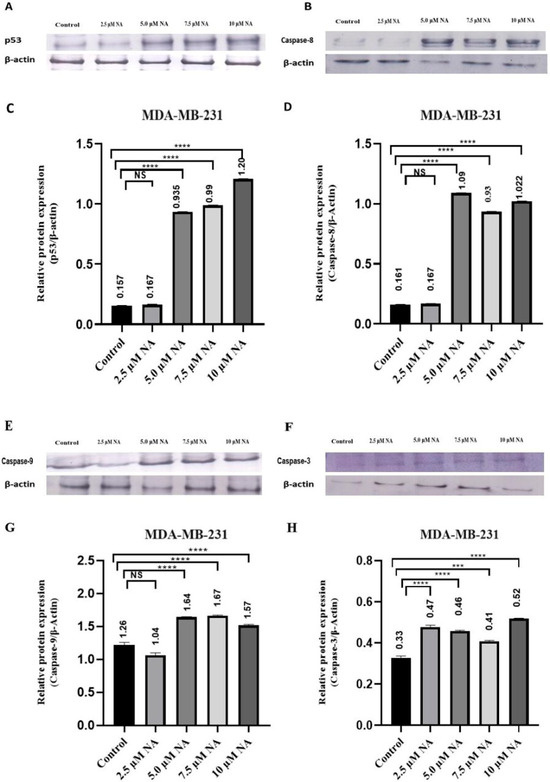
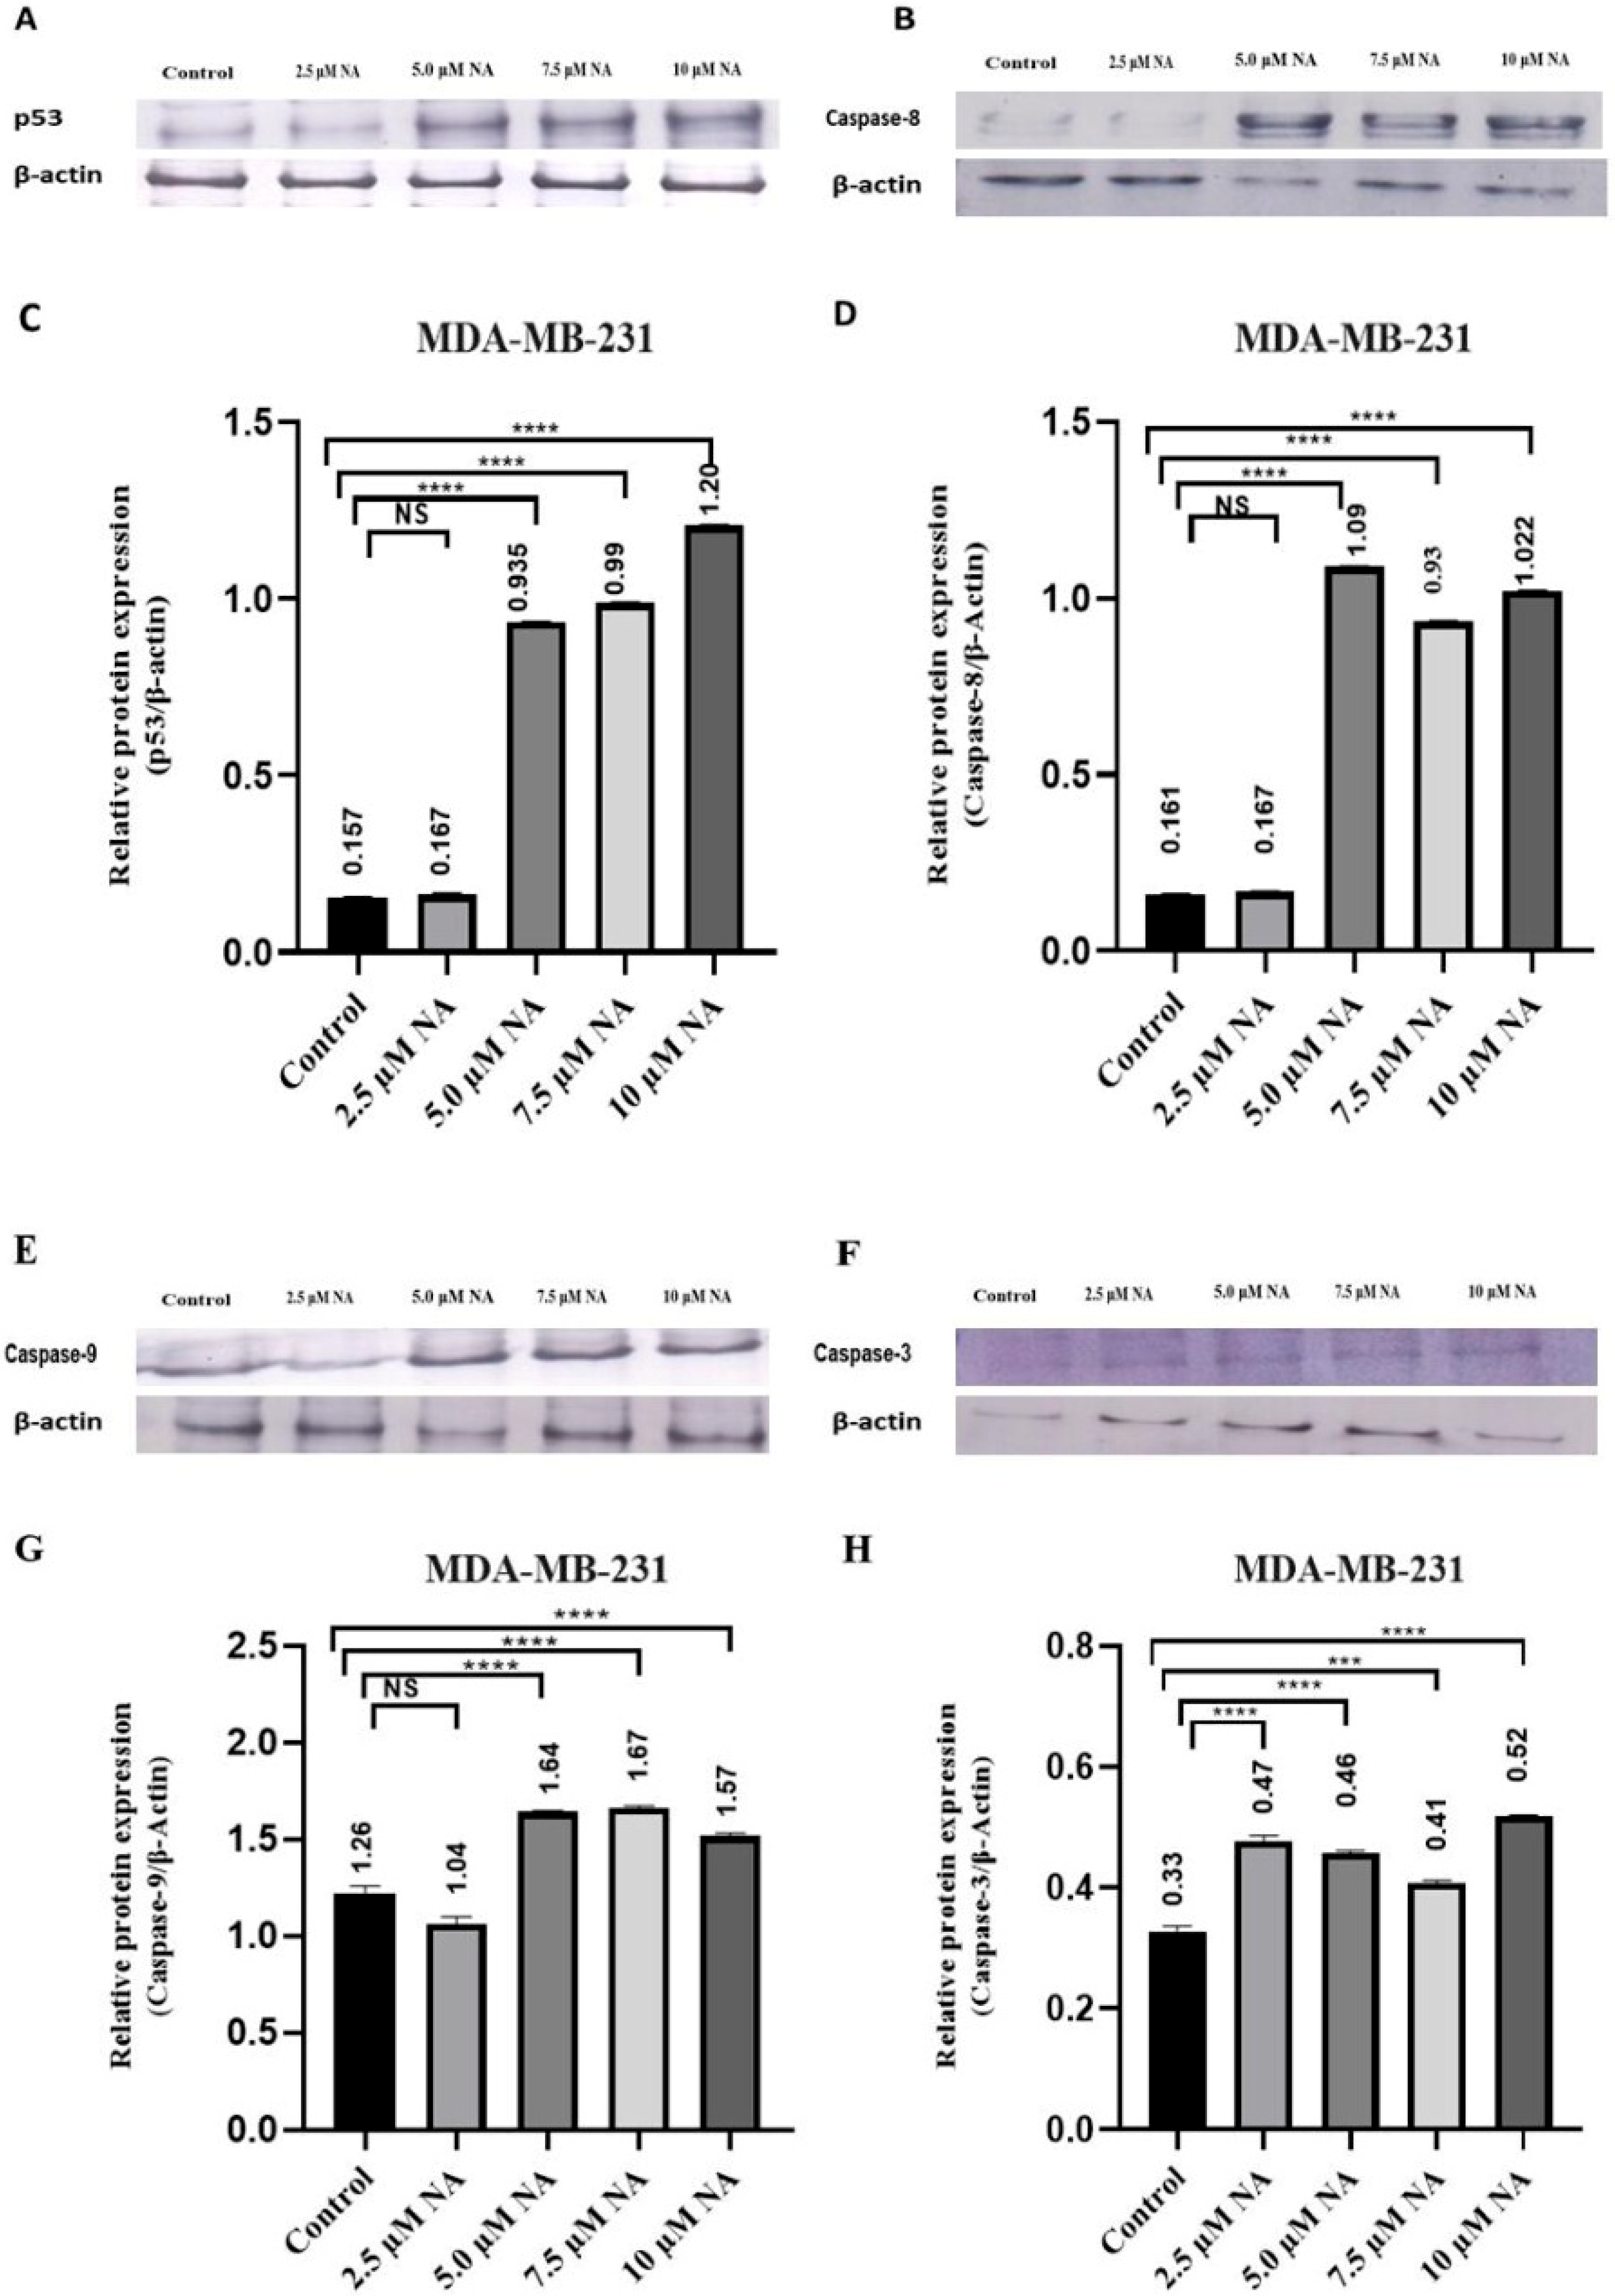
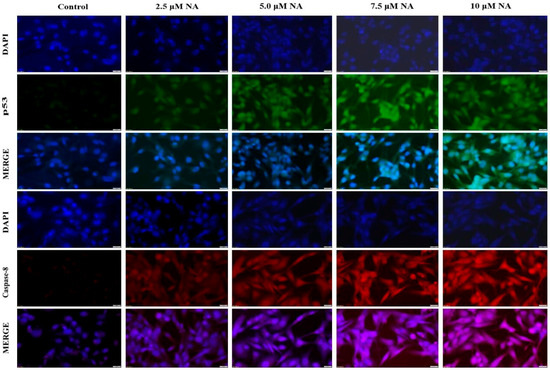
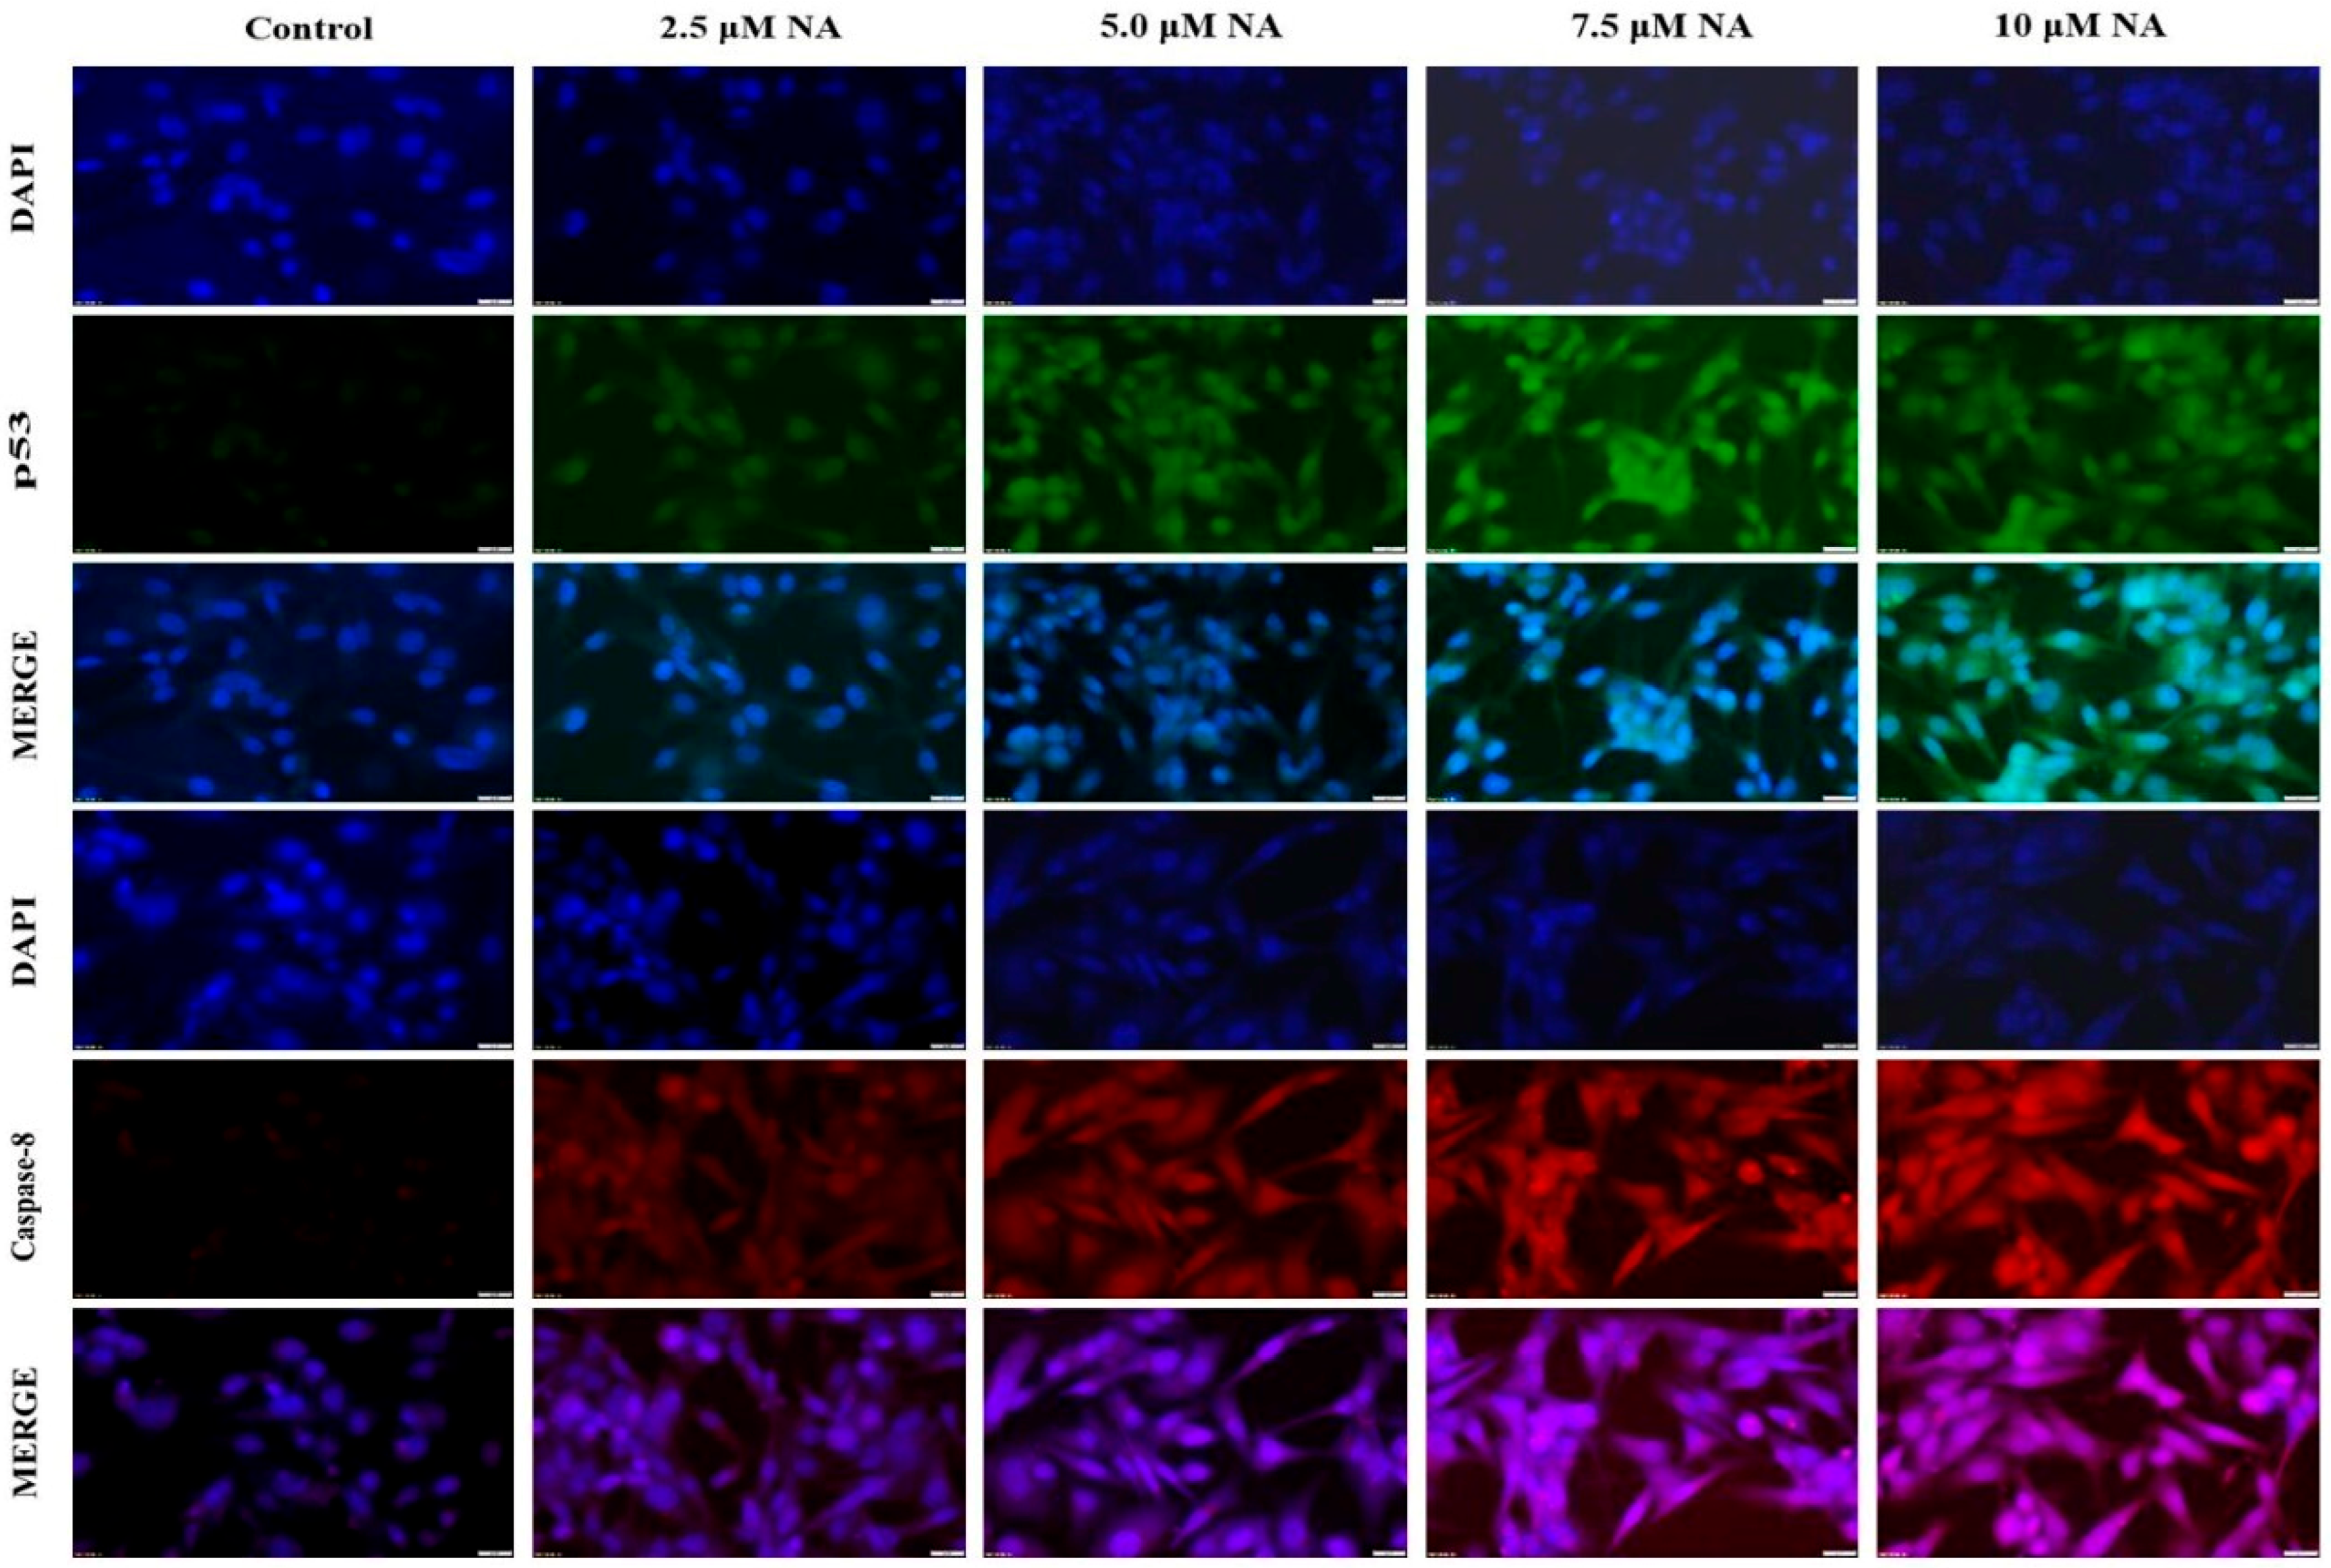
In order to understand the mechanism of apoptosis in MDA-MB-231 cells after exposure to nervonic acid, we analyzed the protein expression of p53, Caspase-8, Caspase-9, and Caspase-3. The western blot results showed that the expression level of the mentioned proteins considerably increased following treatment with NA for 24 h; the intensity ratios (target protein/β-actin), as measured by ImageJ software, are shown in Figure 4. After adjusting for β-actin expression levels, NA significantly increased the level of p53 protein in treated cells by around 1.06-, 5.96-, 6.31-, and 7.71-fold following treatment with 2.55 μM, 5.0 μM, 7.5 μM, and 10 μM of NA, respectively (Figure 4C). NA treatment also increased the expression of Caspase-8 compared to untreated cells by around 1.04-, 6.77-, 5.81-, and 6.35-fold following treatment with 2.55 μM, 5.0 μM, 7.5 μM, and 10 μM of NA, respectively (Figure 4D). Likewise, Caspase-9 protein expression significantly increased by 1.29-, 1.30-, and 1.18-fold following treatment with 5.0 μM, 7.5 μM, and 10 μM of NA, respectively (Figure 4G). Also, NA significantly increased Caspase-3 protein expression by 1.45-, 1.35-, 1.20-, and 1.54-fold following treatment with 2.55 μM, 5.0 μM, 7.5 μM, and 10 μM NA, respectively (Figure 4H). The intracellular p53 and Caspase-8 protein levels were detected by immunocytochemistry. As shown in Figure 5, with increasing NA concentration the green fluorescence gradually increased, which indicate that NA treatment increased p53 expression in a dose-dependent manner. Figure 5 also shows that NA treatment also gradually increased the red fluorescence, which indicates increased Caspase-8 levels in MDA-MB-231 cells after NA exposure.
Figure 4.
Protein expression studies of the apoptotic markers p53 (A,C), Caspase-8 (B,D), Caspase-9 (E,G), and Caspase-3 (F,H) in nervonic acid-treated MDA-MB 231 breast cancer cells (1 × 10⁶ cells/mL). The results were normalized to β-actin. Statistical analysis was performed by one-way ANOVA followed by Tukey’s multiple comparison test. Triplicate values were presented as mean ± SEM. *** p < 0.001, and **** p < 0.0001 indicate significant differences from the control group. NS–not significant.
Figure 5.
NA upregulated intercellular p53 and Caspase-8 expression in breast cancer cells. The expression levels of p53 and Caspase-8 after NA treatment for 24 h of MDA-MB-231 cells were detected. p53 was stained using an anti-p53 antibody with FITC (green fluorescence), Caspase-8 was stained using an anti-Caspase-8 antibody with TRITC (red fluorescence), and the nuclei were stained with DAPI (blue fluorescence). The image was analyzed using fluorescence microscope at 40× magnification, scale bar = 20 µm.
3.6. Morphological Assessment in MDA-MB-231 Cell by DAPI and AO/EB Staining
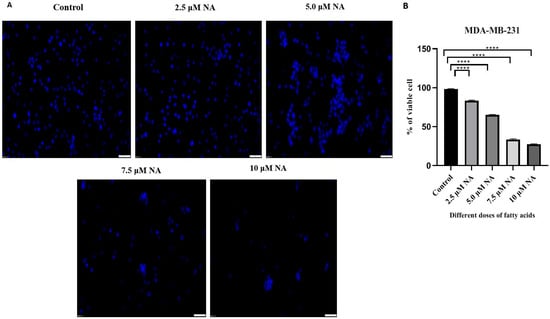
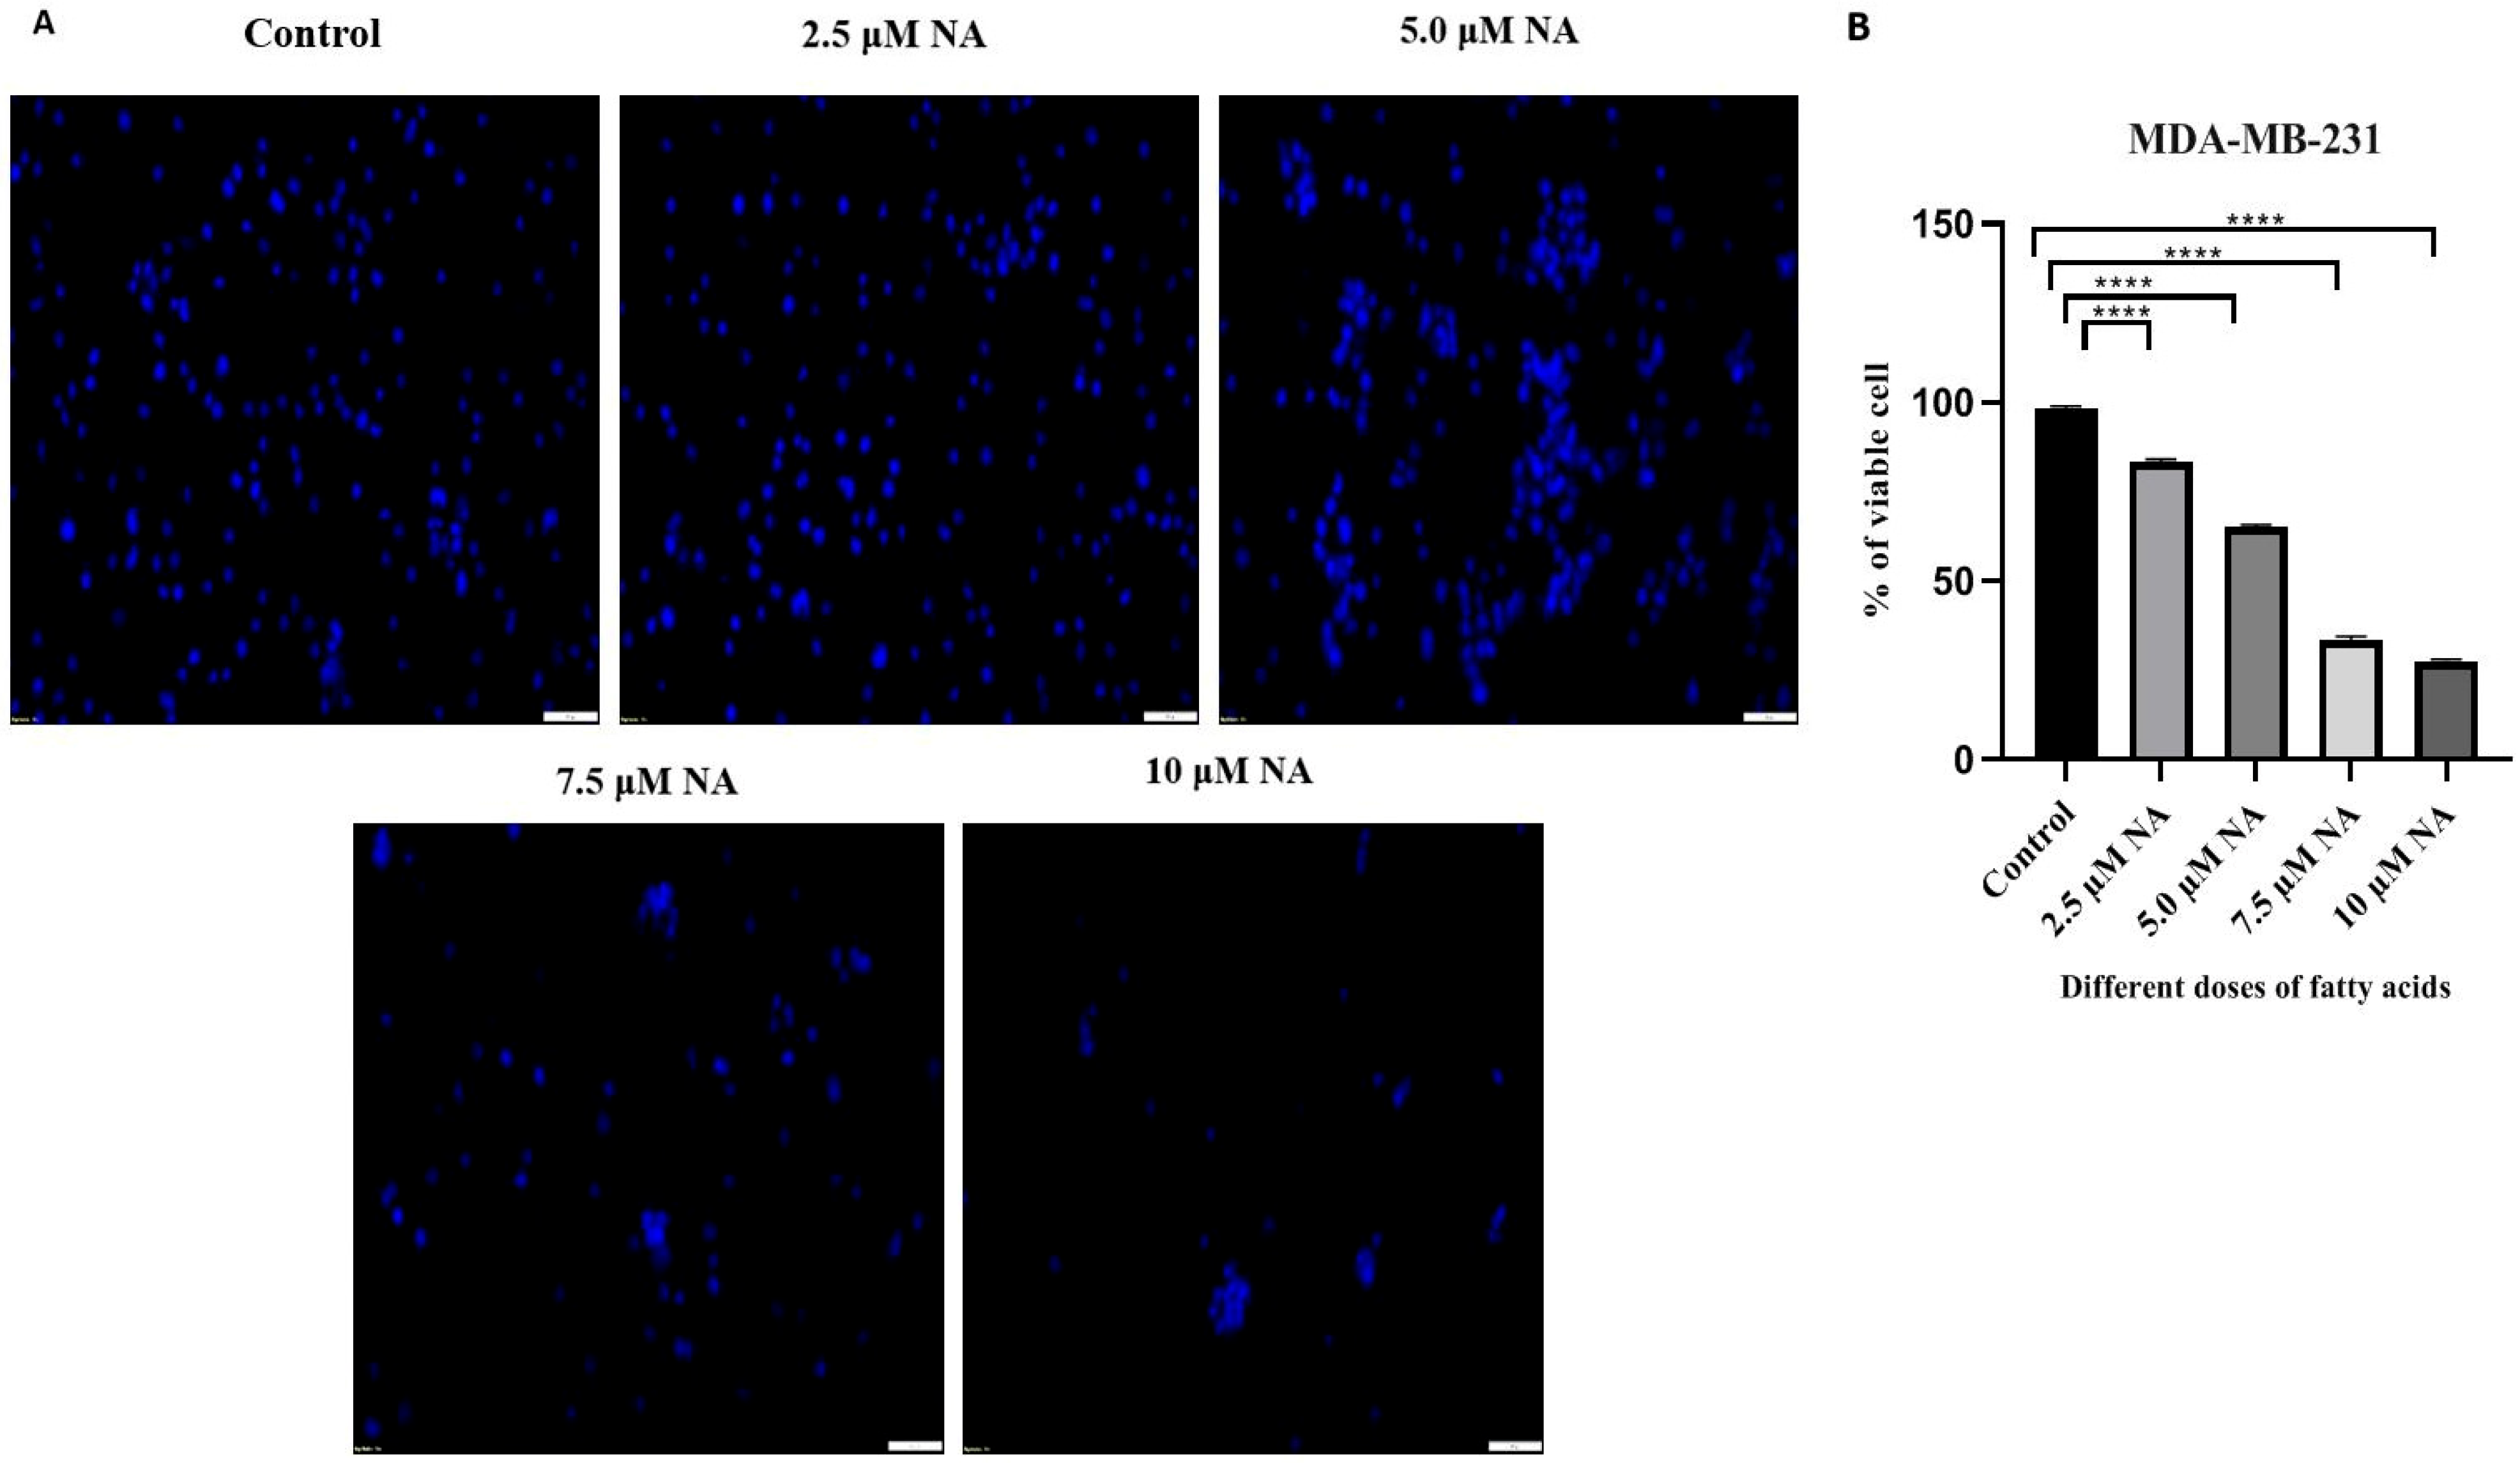
DAPI staining provided additional confirmation of the breakdown of nuclear integrity and the induction of nuclear fragmentation. Nuclear morphological alterations in MDA-MB-231 cells were observed under a fluorescence microscope using DAPI labeling. For 24 h, MDA-MB-231 cells were treated with several concentrations of nervonic acid (2.5 μM, 5.0 μM, 7.5 μM, and 10 μM) to examine its effect on breast cancer cell apoptosis. Figure 6A demonstrated that, whereas MDA-MB-231 cells treated with nervonic acid showed condensed or fractured nuclei, which are linked to apoptosis, the nuclear structure of untreated control cells remained intact. Figure 6B also showed that the live nuclei count was significantly decreased in the NA-treated group in comparison to untreated cells, as determined using ImageJ software.
Figure 6.
(A) The nuclear morphology of breast cancer cells was observed by DAPI staining of nervonic acid-treated MDA-MB 231 cells and captured using a fluorescence microscope; images are shown here at 10× magnification, scale bar = 100 µm. (B) Quantification of live nuclei by ImageJ software. Statistical analysis was denoted as **** p < 0.0001 using one-way ANOVA followed by Tukey’s multiple comparison test.
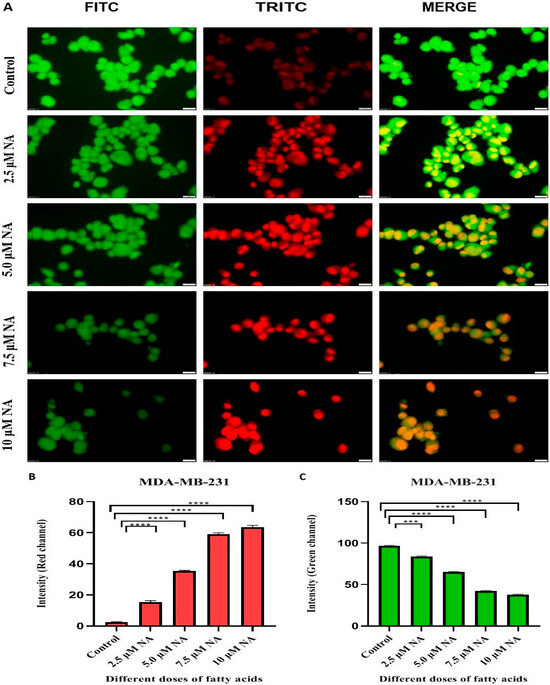
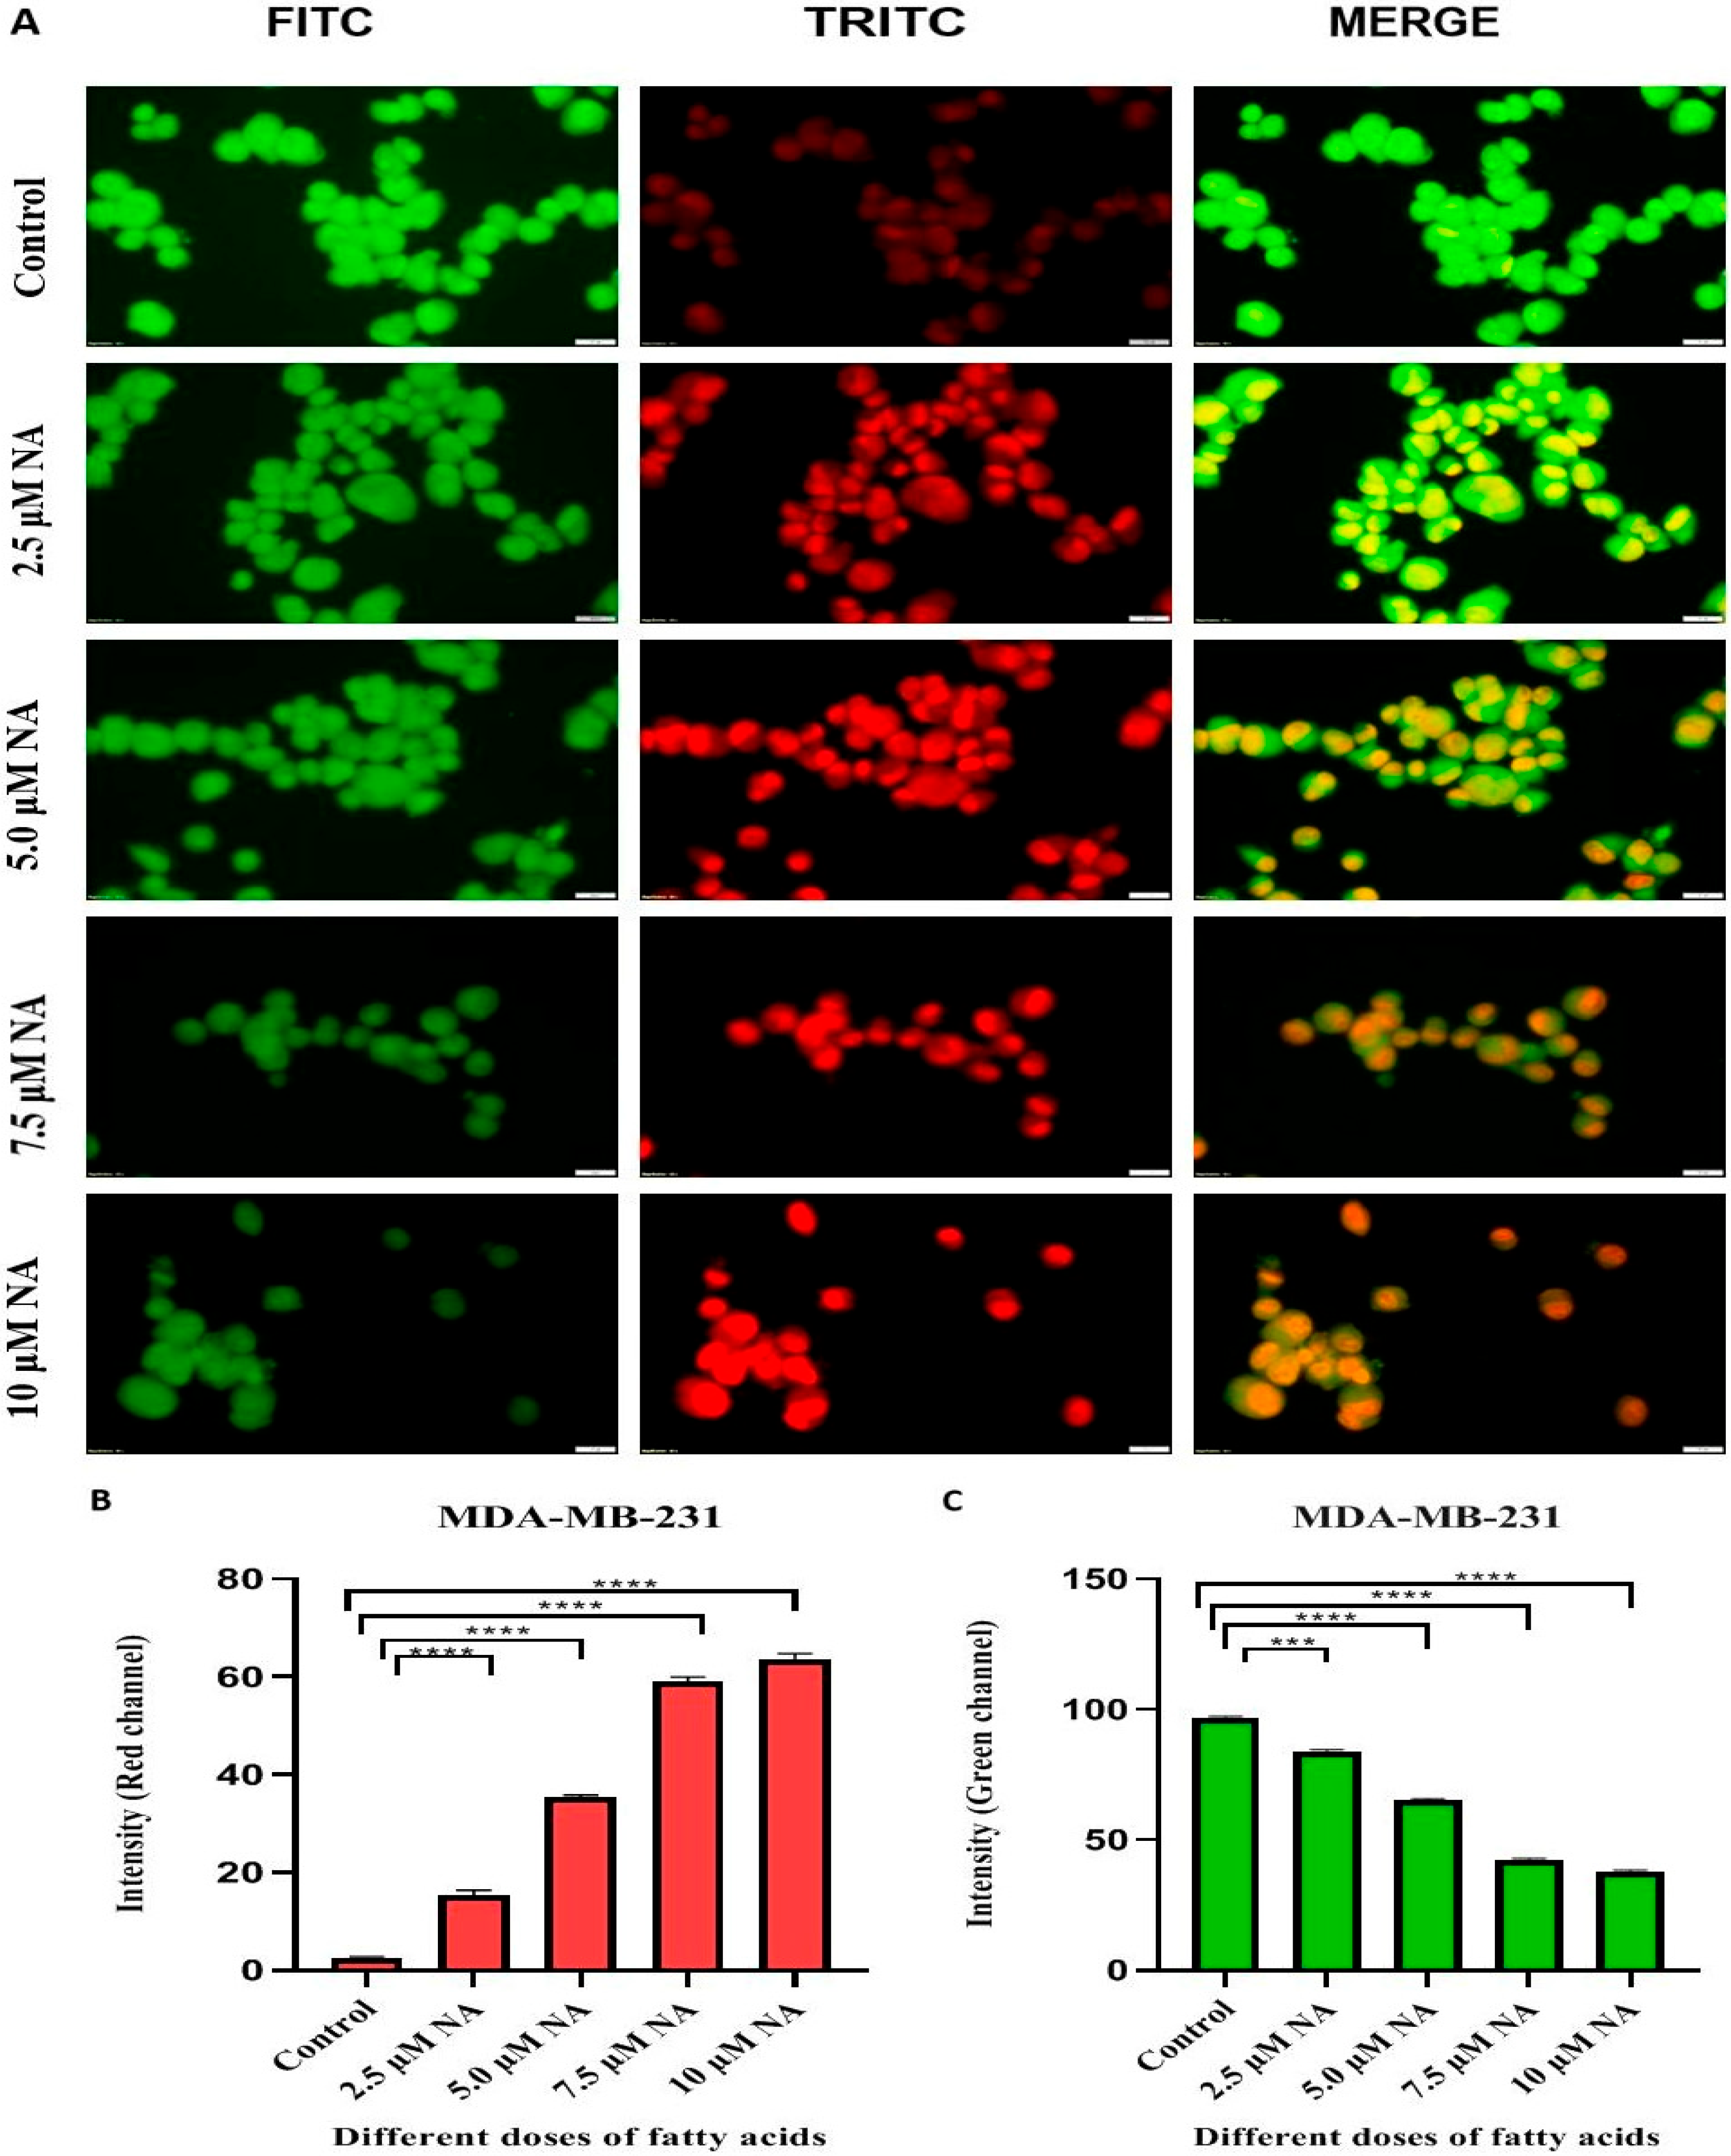
Dual acridine orange/ethidium bromide (AO/EB) fluorescence labeling was also employed to compare morphological alterations in the treated and control cells’ cell membranes. In general, both living and dead cells are stained green by vital AO dye, whereas only dead cells that have lost their cell membrane integrity are stained red by EB dye. The control cells contained nearly no red-stained cells and all healthy green cells with normal cellular structure, as seen in Figure 7A. However, nervonic acid-treated cells exhibited a considerable rise in EB-stained cells, indicating that the cells were in an apoptotic stage (Figure 7A). Quantification of apoptotic cells using ImageJ software and the blue and red channels also confirmed a higher apoptotic percentage in the NA-treated group, as shown in Figure 7B,C.
Figure 7.
(A) Detection of apoptosis using acridine orange (FITC—green fluorescence) and ethidium bromide (TRITC—red fluorescence) staining after nervonic acid treatment at four different doses for 24 h of MDA-MB 231 cancer cells using a fluorescence microscope (Olympus) at 40× magnification, scale bar = 20 µm. (B,C) Bar diagrams represent the viability (green channel) and death rate (red channel) of MDA-MB 231 breast cancer cells by AO-EtBr staining. Statistical analysis was denoted as *** p < 0.001, and **** p < 0.0001 using one-way ANOVA followed by Tukey’s multiple comparison test.
3.7. Nervonic Acid-Induced Apoptosis Analysis by TUNEL
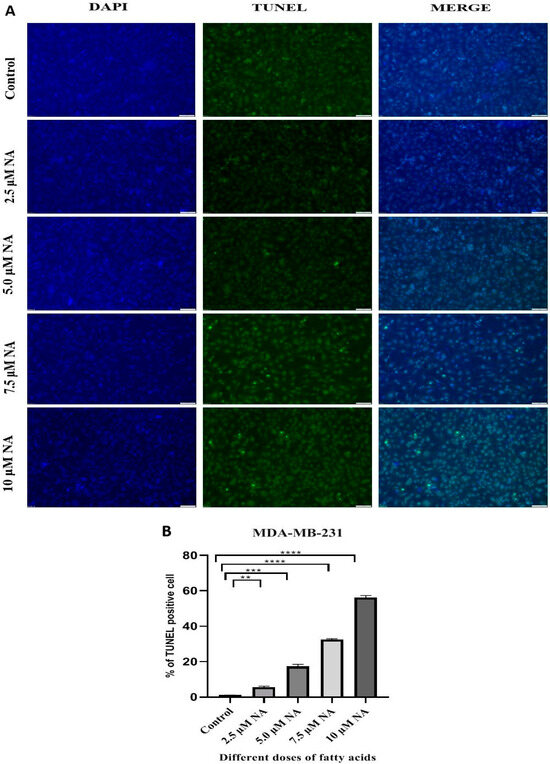
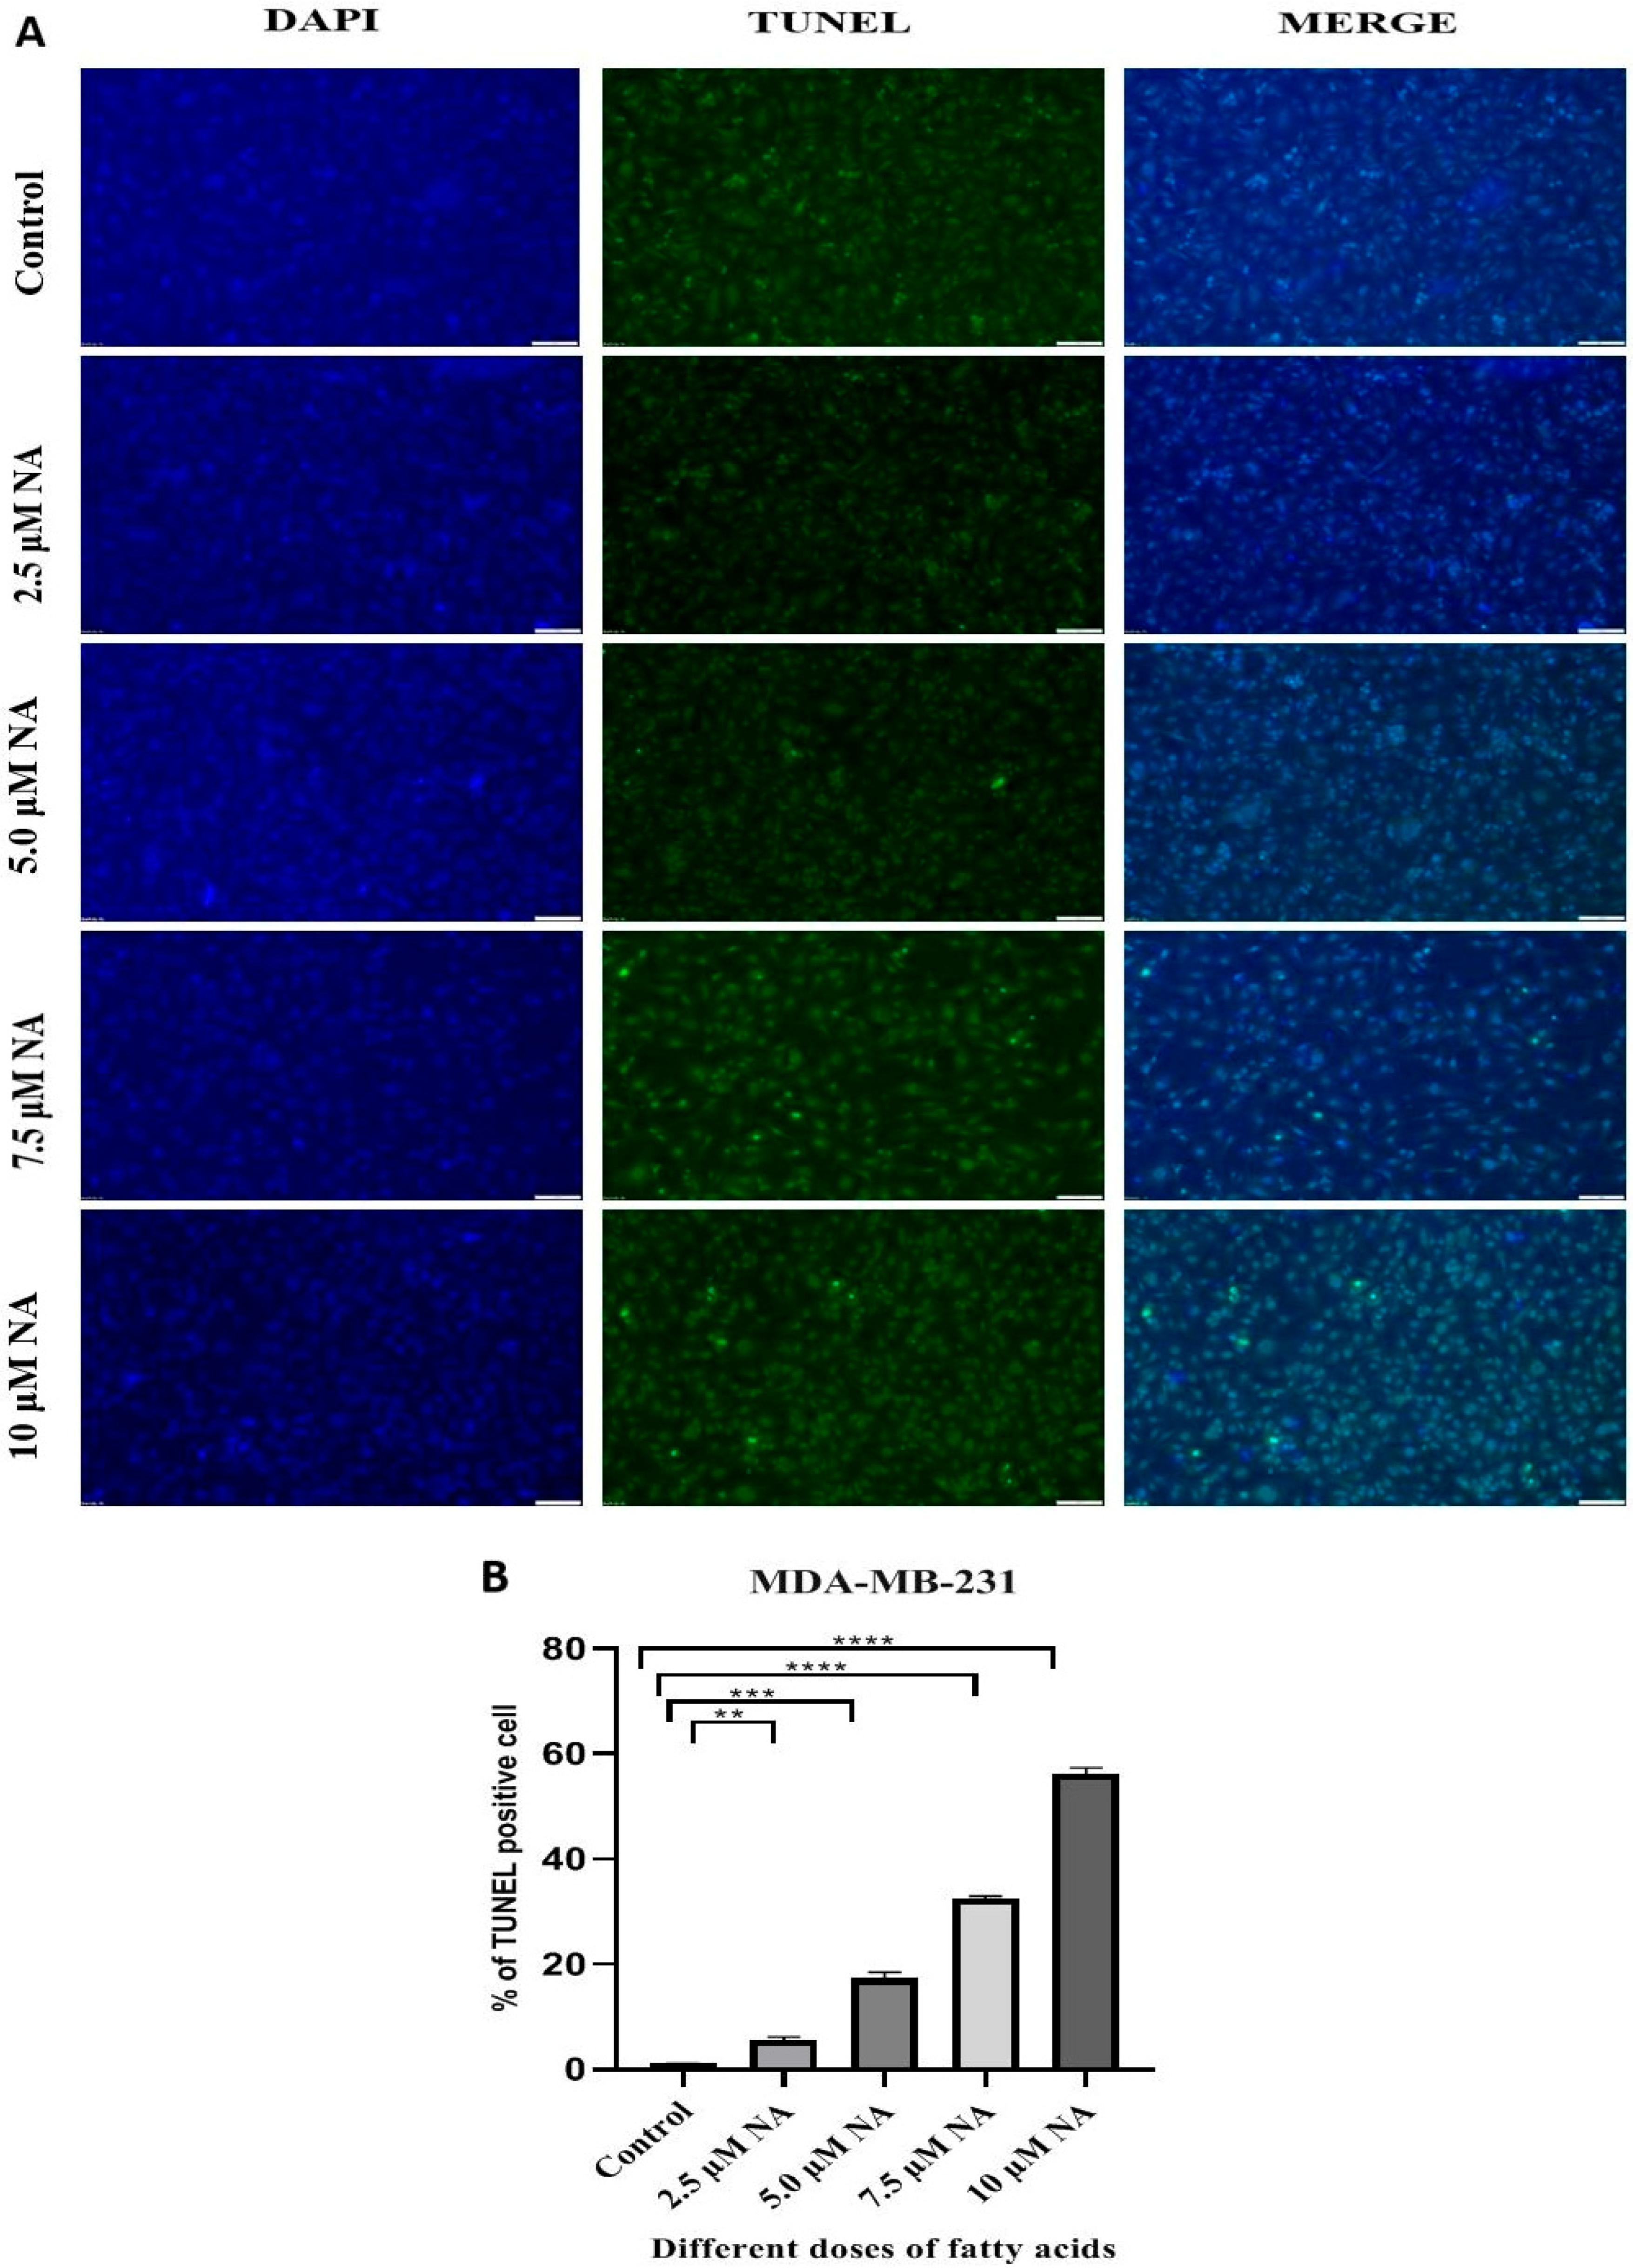
TUNEL analysis after nervonic acid treatment of MDA-MB-231 cells further demonstrated that nervonic acid causes apoptotic cell death. As predicted, following 24 h of treatment with 7.5 and 10 μM nervonic acid, there was a significant increase in TUNEL-positive cells and DNA fragmentation (Figure 8A) as compared to the other treated groups. The TUNEL-positive cell percentages were 5.34%, 17.45%, 32.04%, and 56.73% following treatment with 5.0 μM, 7.5 μM, and 10 μM of NA, respectively (Figure 8B). In cultured MDA-MB-231 cells, the TUNEL assay consistently demonstrated that nervonic acid primarily triggered apoptosis.
Figure 8.
(A) Detection of DNA fragmentation by TUNEL assay in nervonic acid-treated MDA-MB 231 cells by fluorescence microscopy; images are shown here at 10X magnification, scale bar = 100 µm. (B) Quantification of TUNEL-positive cell % using ImageJ software. Statistical significance was denoted as ** p < 0.01, *** p < 0.001, and **** p < 0.0001 using one-way ANOVA followed by Tukey’s multiple comparison test.
4. Discussion
Cancer has been a persistent threat to human life since its discovery, and even in cases when it is curable, it significantly lowers quality of life. The majority of anticancer medications currently available on the market are used to kill cancer cells and lessen the burden of tumors, but they are largely ineffective against some stages of carcinogenesis. Alternative methods to stop carcinogenesis are therefore desperately needed. One of the most investigated dietary factors for BC prevention is dietary fatty acids. In this regard, n-3, n-6, and, more recently, n-9 unsaturated fatty acids have become important elements in the research of dietary approaches for the prevention and treatment of BC [26,27]. Nervonic acid is a monounsaturated fatty acid with a 24-carbon backbone and a single double bond originating from the ninth carbon from the methyl end in the cis configuration. Nervonic acid plays crucial roles in brain development and the biosynthesis of nerve cell myelin, which has drawn much attention from researchers. Investigations into NA over the past few decades have already revealed its significance for human health, significant developmental potential, and promising application prospects. Because of its superior biofunctions, NA is essential in pharmaceutical and nutraceutical applications. In this study, the cytotoxic activity of nervonic acid toward MDA-MB-231 cells was evaluated using the MTT test, which entails the enzymatic conversion of MTT to insoluble formazan in viable cells. According to the MTT assay results, nervonic acid treatment caused dose-dependent growth suppression of breast cancer cells (Figure 1). Intracellular redox balance plays an important role in the genesis and treatment of cancer. In order to improve their chances of surviving and growing, cancer cells usually change this balance while also becoming resistant to therapy. Cancer cells are known to have enhanced antioxidant capacity to prevent oxidative damage imposed by endogenous or exogenous reactive oxygen species (ROS). It has been proven that cancer cells produce more glutathione (GSH), one of the most prevalent intracellular antioxidants. Numerous malignancies, including breast, ovarian, lung, and head and neck cancer, have been found to have elevated GSH levels. Elevated levels of cellular glutathione are essential for the initiation and proliferation of tumors due to its numerous physiological roles. Glutathione peroxidase (GPX) contains selenium at a catalytic site, which employs GSH as an electron donor to reduce H2O2 to H2O and transform the protein into its oxidized form, glutathione disulfide (GSSG). It is commonly known that GSSG is harmful to cells and is counterbalanced by the GSH level [28,29,30]. In this investigation, following nervonic acid treatment, MDA-MB-231 cells exhibited elevated GSSG and decreased GSH levels, indicating cellular stress. One important example of reactive nitrogen species (RNS) is NO, a reactive gas produced by a family of enzymes known as nitric oxide synthases (NOS), including neuronal NOS, endothelial NOS, and inducible/macrophage NOS. The pathophysiological situation in which stimulation of iNOS is connected to high quantities of reactive nitrogen metabolites seems to be associated with proapoptotic effects. The up-regulation of various defensive proteins, including hemeozygenase and cyclooxygenase-2, is linked to cell protection. Tumor suppressor protein p53 accumulation, caspase activation, cytochrome c release, and DNA breakage are common signs of NO-mediated apoptosis. Higher nitric oxide concentrations inhibited cell growth and metabolism and promoted apoptosis [31,32]. In this study, treatment with nervonic acid also raises the amount of NO produced by breast cancer cells. Lipid peroxidation (MDA level), a crucial biological indicator of an oxidative stress response that results in cell membrane damage, was observed in MDA-MB-231 cells as a result of the change in redox balance. A significantly higher level of MDA in MDA-MB-231 cells treated with nervonic acid was observed (Figure 2). Since intracellular ROS levels are also essential for preserving cellular homeostasis, varying ROS levels can result in a variety of biological reactions. ROS function as signaling molecules at low concentrations and cause cell damage and death at high concentrations. As seen in Figure 2E,F, nervonic acid raised the amount of ROS formation in a dose-dependent manner. Overproduction of ROS in cancer cells can trigger several signaling pathways, which can lead to cell cycle arrest and death [33]. These findings clearly demonstrated that nervonic acid altered the redox equilibrium in MDA-MB-231, resulting in cell death.
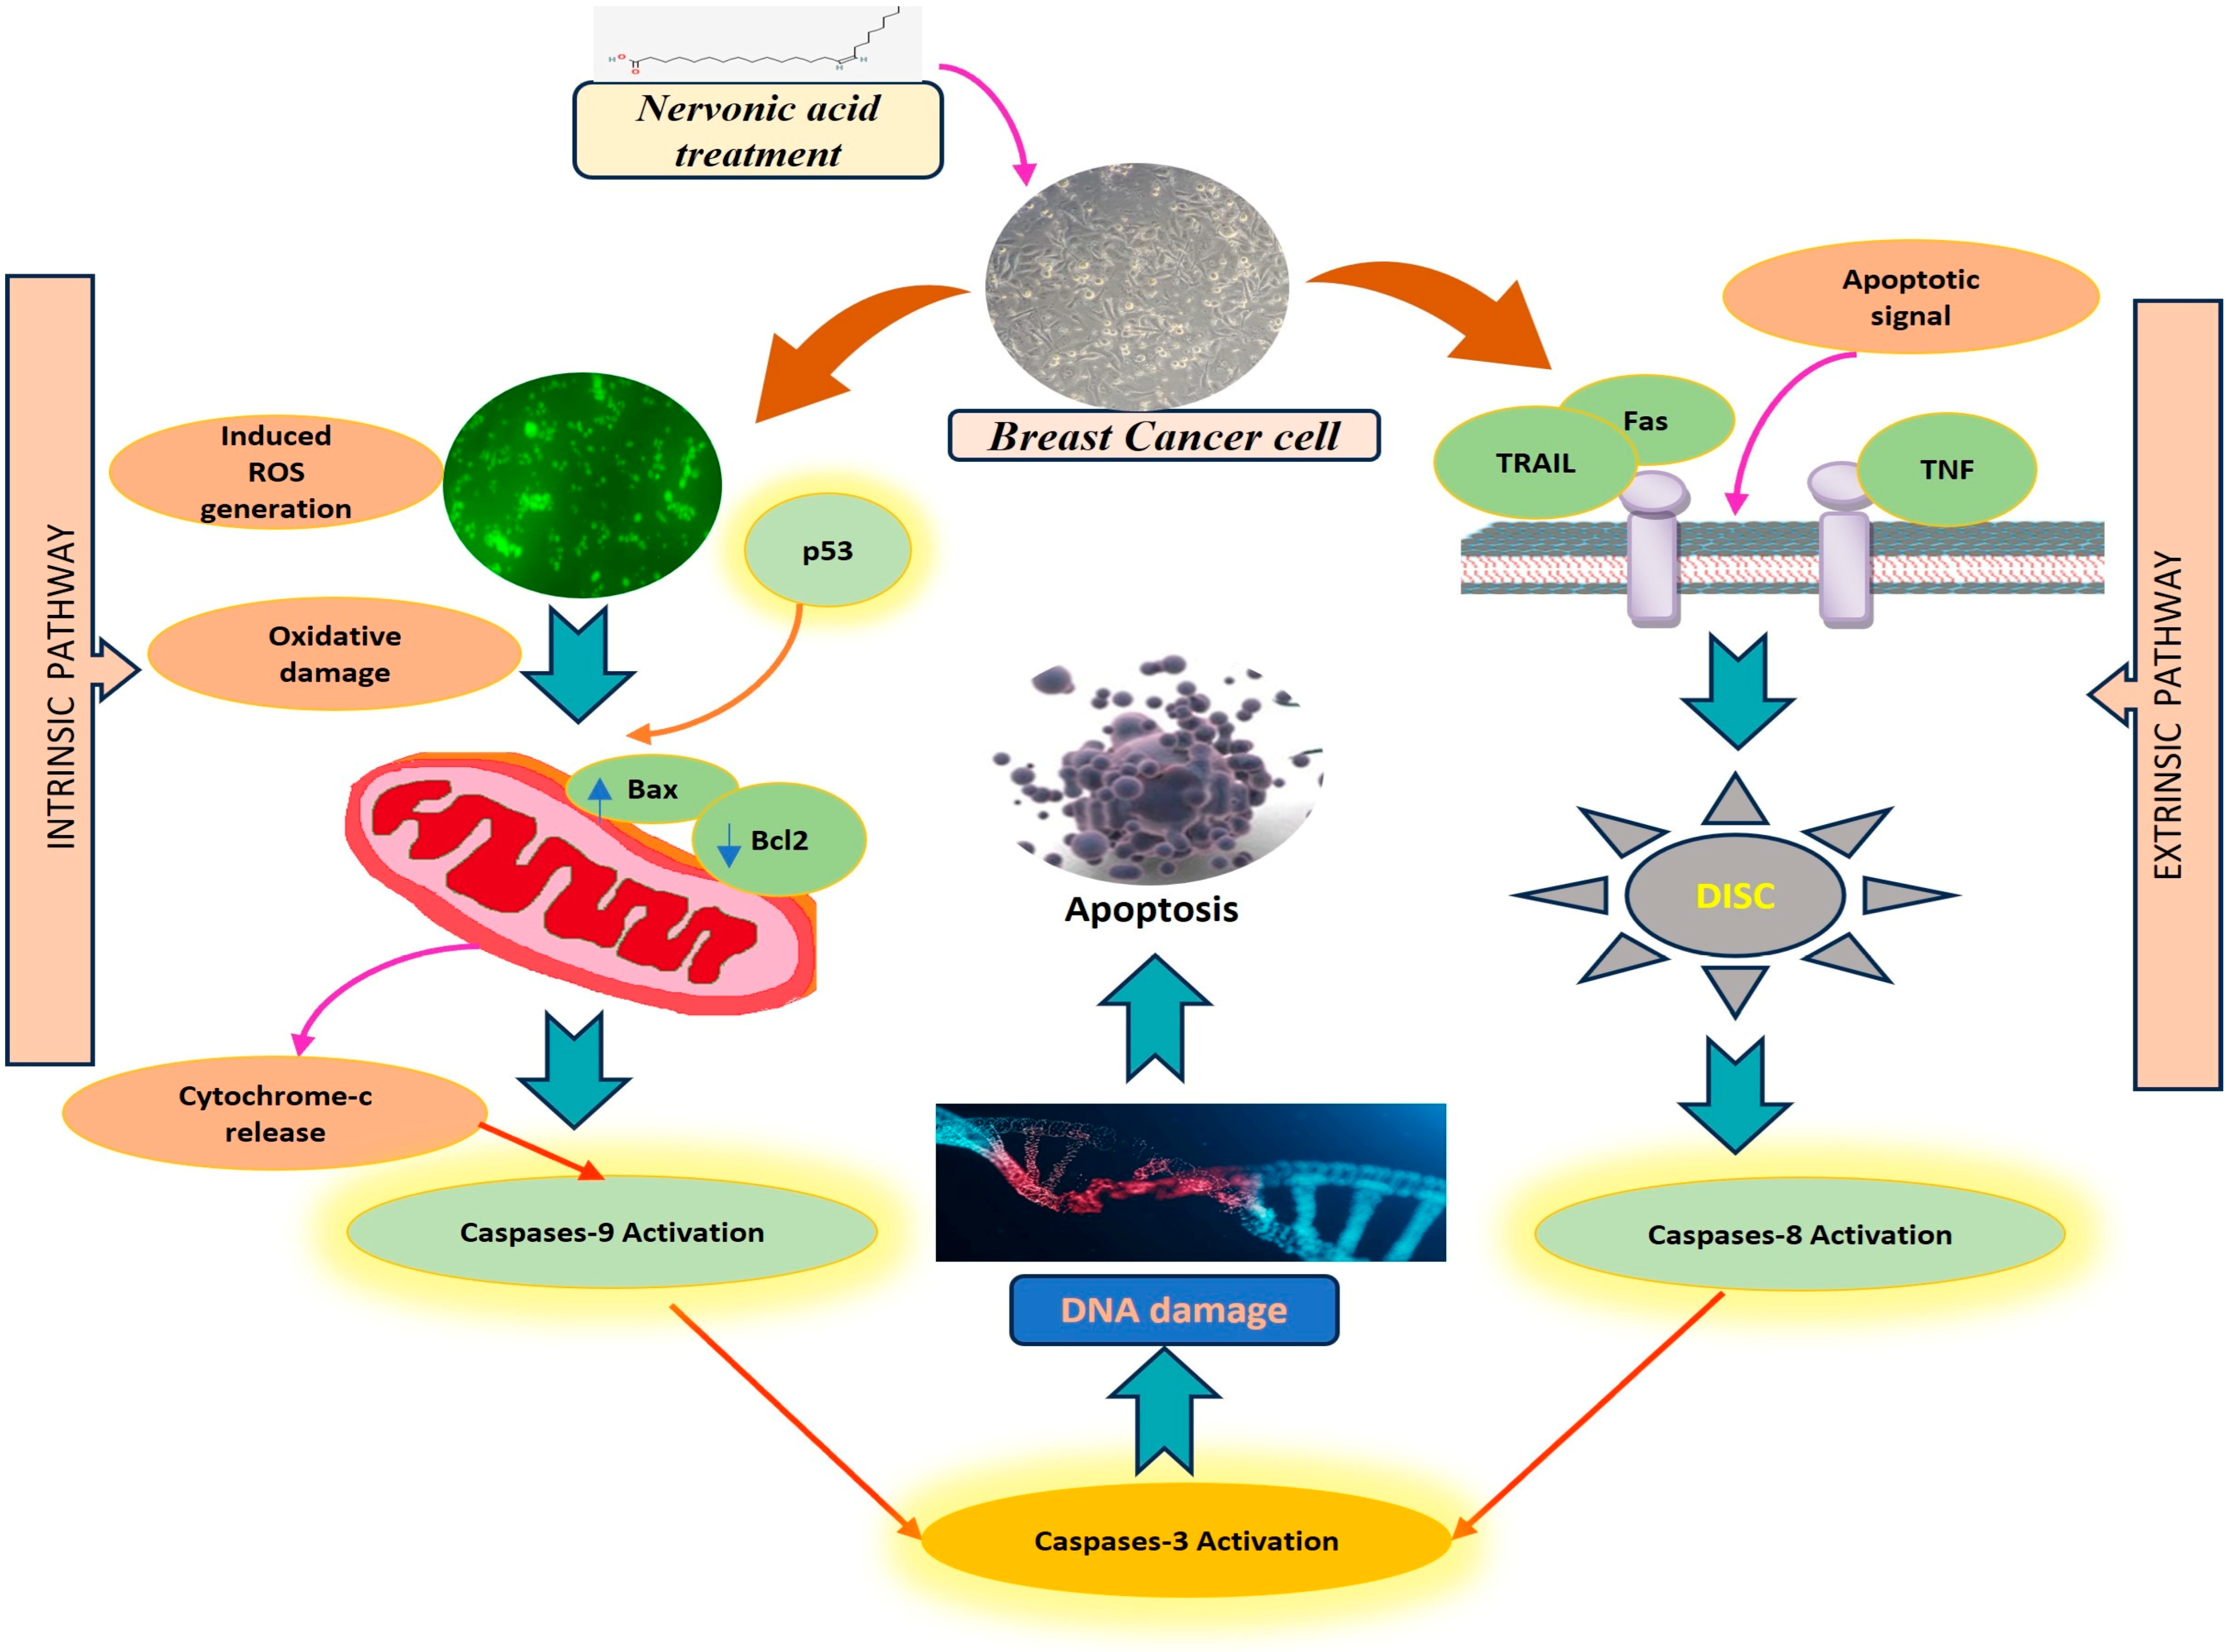
Apart from variables that regulate cell division, anomalies have been found in breast tumors involving multiple genes that control the apoptotic cascade, such as p53, bcl-2, bax, c-myc, and numerous others. As a tumor suppressor gene, in order to maintain the equilibrium of cellular metabolism, TP53 regulates a wide range of metabolic processes, including fatty acid synthesis, the pentose phosphate pathway, mitochondrial oxidative phosphorylation, glycolysis, and oxidation. p53 reportedly regulates various target genes directly, hence controlling biological processes such as cell cycle arrest, cell senescence, repair of DNA, metabolic adaptation, and cell death [34]. The two primary mechanisms that induce apoptosis include the intrinsic (or mitochondrial) and extrinsic pathways. Mitochondrial release of cytochrome-c initiates the intrinsic pathway. Cytochrome c and Apaf-1 create an ATP-dependent complex that activates Caspase-9 and Caspase-3. When ligands belonging to the DR superfamily bind to Caspase-8 and Caspase-3, the extrinsic (or death receptor (DR)) pathway is triggered [9]. Our results showed that nervonic acid treatment decreased the expression of anti-apoptotic (Bcl2) genes and raised the expression of apoptotic genes, including p53, Bax, Caspase-3, and Caspase-8, in MDA-MB-231 breast cancer cells (Figure 3). Furthermore, the results also demonstrated dose-dependent activation of the Caspase-3, -8, and -9 and p53 proteins following NA treatment, and it is hypothesized that this activation of apoptotic proteins is the initial step in NA-induced apoptotic cell death (Figure 4 and Figure 5).
A fluorescent dye called DAPI (4′,6-diamidino-2-phenylindole) can bind strongly to DNA regions that are rich in A and T and help visualize nuclear damage or chromatin condensation [35]. Nervonic acid-treated cells display the usual apoptotic changes, including chromatin condensation and nuclear disintegration, as demonstrated by DAPI staining (Figure 6). Additionally, employing AO/EtBr dual labeling, we found that nervonic acid treatment of MDA-MB-231 cells at different dosages resulted in morphological alterations and apoptotic signs. Under a fluorescence microscope, dual acridine orange/ethidium bromide (AO/EB) fluorescent labeling can be utilized to detect alterations in cell membranes linked to apoptosis [36]. In MDA-MB-231 cells, AO generated green fluorescence light in the absence of nervonic acid treatment. Et-Br produced orange-red fluorescence only when it bound to the DNA fragments of apoptotic cells and penetrated cells with damaged membranes (Figure 7). Additionally, DNA fragmentation in apoptotic cells can be observed by TUNEL assay. The assay takes advantage of the special capacity of terminal deoxynucleotidyl transferase (TdT), an atypical DNA polymerase, to catalyze the addition of suitable labeled deoxynucleotide triphosphates (most frequently dUTP analogs) to a single-stranded sequence with a free 3′-OH terminus, without the need for a template [37]. As the percentage of TUNEL-positive cells and the rate of DNA fragmentation increased following treatment, the TUNEL assay showed that nervonic acid promotes dose-dependent apoptosis in MDA-MB-231 breast cancer cells (Figure 8). Through a variety of mechanisms, including cell viability suppression, redox balance alteration, and apoptosis induction via apoptotic gene activation, we demonstrated in this study that nervonic acid, a monounsaturated fatty acid, exhibits strong anticancer properties in the MDA-MB-231 human breast cancer cell line. Nevertheless, our findings do not directly demonstrate nervonic acid’s anticancer effectiveness in an in vivo model.
5. Conclusions
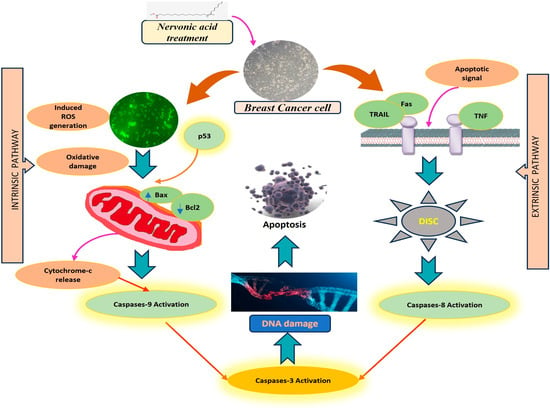
In conclusion, these results indicate nervonic acid (C24:1 Δ15, cis-15-tetracosenoic acid) has potential growth inhibitory and apoptotic effects against the MDA-MB-231 human breast cancer cell line that is mediated by caspase activation (Figure 9). Our in vitro data provide a new viewpoint on the role of nervonic acid in anti-proliferative and apoptotic cell death via ROS production, increased apoptotic gene expression, and morphological damage of DNA, as well as chromatin condensation and nuclear disintegration. However, further investigation into the molecular mechanisms in different breast cancer cell lines, as well as in animal models, is needed to better understand nervonic acid’s potential as an apoptosis promoter and an inhibitor of cell growth and proliferation.
Figure 9.
The hypothetical mechanism of nervonic acid-induced apoptosis by ROS generation and caspase activation.
Author Contributions
M.P.: writing—original draft, project administration, methodology, investigation, data curation, conceptualization. A.D.: methodology, investigation, formal analysis. S.R.: software, resources, data curation. P.D.: software, resources, data curation. R.K.: software, resources, formal analysis, data curation. T.P.: resources, investigation, formal analysis. K.G.: visualization, validation. S.P.: writing—review and editing, visualization, validation, supervision, software, funding acquisition, conceptualization. All authors have read and agreed to the published version of the manuscript.
Funding
This work was self-funded and performed at the Biodiversity and Environmental Studies Research Centre, Midnapore City College, Bhadutala, Paschim Medinipur, 721129, West Bengal, India.
Institutional Review Board Statement
Not applicable.
Informed Consent Statement
Not applicable.
Data Availability Statement
All data generated or analyzed during this study are included in this published article.
Acknowledgments
The authors are thankful to UGC, Govt of India for financial assistance, as they provided the NET JRF (Beneficiary ID BWBJG00066094). The authors are also thankful to the Director, Pradip Ghosh, Midnapore City College for provide all essential supports to carry out this work. The current research study presented in this manuscript is a part of the PhD research work of the first author.
Conflicts of Interest
The authors declare no conflicts of interest.
Abbreviations
The following abbreviations are used in this manuscript:
| TNBC | Triple negative breast cancer |
| PR | Progesterone receptor |
| HER2 | Human epidermal growth factor receptor 2 |
| PUFA | Polyunsaturated fatty acids |
| MUFA | Monounsaturated fatty acids |
| NA | Nervonic acid |
| GC-MS | Gas chromatography–mass spectrometry |
| DTNB | 5,5′-dithio-bis (2-nitrobenzoic acid) |
| GAPDH | Glyceraldehyde 3- phosphate dehydrogenase |
| Bcl2 | B-cell lymphoma |
| Bax | Bcl2-associated X protein |
| DAPI | 4′6-diamidino-2-phenylindole |
| TUNEL | Terminal deoxynucleotidyl transferase dUTP nick end labeling |
References
- Ginsburg, O.; Bray, F.; Coleman, M.P.; Vanderpuye, V.; Eniu, A.; Kotha, S.R.; Sarker, M.; Huong, T.T.; Allemani, C.; Dvaladze, A.; et al. The global burden of women’s cancers: A grand challenge in global health. Lancet 2017, 389, 847–860. [Google Scholar] [CrossRef] [Scilit] [PubMed]
- Yang, Z.; Yi, W.; Tao, J.; Liu, X.; Zhang, M.Q.; Chen, G.; Dai, Q. HPVMD-C: A disease-based mutation database of human papillomavirus in China. Database 2022, 2022, baac018. [Google Scholar] [CrossRef] [Scilit] [PubMed]
- Bray, F.; Laversanne, M.; Sung, H.; Ferlay, J.; Siegel, R.L.; Soerjomataram, I.; Jemal, A. Global cancer statistics 2022: GLOBOCAN estimates of incidence and mortality worldwide for 36 cancers in 185 countries. CA Cancer J. Clin. 2024, 74, 229–263. [Google Scholar] [CrossRef] [Scilit] [PubMed]
- Xu, Y.; Gong, M.; Wang, Y.; Yang, Y.; Liu, S.; Zeng, Q. Global trends and forecasts of breast cancer incidence and deaths. Sci. Data 2023, 10, 334. [Google Scholar] [CrossRef] [Scilit] [PubMed]
- Chang, L.; Weiner, L.S.; Hartman, S.J.; Horvath, S.; Kado, D.M. Breast cancer treatment and its effects on aging. J. Geriatr. Oncol. 2018, 10, 346–355. [Google Scholar] [CrossRef] [Scilit] [PubMed]
- Harwansh, R.K.; Deshmukh, R. Breast cancer: An insight into its inflammatory, molecular, pathological and targeted facets with update on investigational drugs. Crit. Rev. Oncol. Hematol. 2020, 154, 103070. [Google Scholar] [CrossRef] [Scilit] [PubMed]
- Hanusek, K.; Karczmarski, J.; Litwiniuk, A.; Urbańska, K.; Ambrozkiewicz, F.; Kwiatkowski, A.; Martyńska, L.; Domańska, A.; Bik, W.; Paziewska, A. Obesity as a Risk Factor for Breast Cancer-The Role of miRNA. Int. J. Mol. Sci. 2022, 23, 15683. [Google Scholar] [CrossRef] [Scilit] [PubMed]
- Maqbool, M.; Bekele, F.; Fekadu, G. Treatment Strategies Against Triple-Negative Breast Cancer: An Updated Review. Breast Cancer Targets Ther. 2022, 14, 15–24. [Google Scholar] [CrossRef] [Scilit] [PubMed]
- Montecillo-Aguado, M.; Tirado-Rodriguez, B.; Huerta-Yepez, S. The Involvement of Polyunsaturated Fatty Acids in Apoptosis Mechanisms and Their Implications in Cancer. Int. J. Mol. Sci. 2023, 24, 11691. [Google Scholar] [CrossRef] [Scilit] [PubMed]
- Guo, Z.; Bergeron, K.F.; Lingrand, M.; Mounier, C. Unveiling the MUFA-Cancer Connection: Insights from Endogenous and Exogenous Perspectives. Int. J. Mol. Sci. 2023, 24, 9921. [Google Scholar] [CrossRef] [Scilit] [PubMed]
- Farag, M.A.; Gad, M.Z. Omega-9 fatty acids: Potential roles in inflammation and cancer management. J. Genet. Eng. Biotechnol. 2022, 20, 48. [Google Scholar] [CrossRef] [Scilit] [PubMed]
- Kim, J.S.; Kim, D.K.; Moon, J.Y.; Lee, M.Y.; Cho, S.K. Oleic acid inhibits the migration and invasion of breast cancer cells with stemness characteristics through oxidative stress-mediated attenuation of the FAK/AKT/NF-κB pathway. J. Funct. Foods. 2024, 116, 106224. [Google Scholar] [CrossRef] [Scilit]
- Kinoshita, Y.; Yoshizawa, K.; Hamazaki, K.; Emoto, Y.; Yuri, T.; Yuki, M.; Shikata, N.; Kawashima, H.; Tsubura, A. Mead acid inhibits the growth of KPL-1 human breast cancer cells in vitro and in vivo. Oncol. Rep. 2014, 32, 1385–1394. [Google Scholar] [CrossRef] [Scilit] [PubMed]
- Li, Q.; Chen, J.; Yu, X.; Gao, J.M. A mini review of nervonic acid: Source, production, and biological functions. Food Chem. 2019, 301, 125286. [Google Scholar] [CrossRef] [Scilit] [PubMed]
- Liu, F.; Wang, P.; Xiong, X.; Zeng, X.; Zhang, X.; Wu, G. A Review of Nervonic Acid Production in Plants: Prospects for the Genetic Engineering of High Nervonic Acid Cultivars Plants. Front. Plant Sci. 2021, 12, 626625. [Google Scholar] [CrossRef] [Scilit] [PubMed]
- Yuan, S.N.; Wang, M.X.; Han, J.L.; Feng, C.Y.; Wang, M.; Wang, M.; Sun, J.Y.; Li, N.Y.; Simal-Gandara, J.; Liu, C. Improved colonic inflammation by nervonic acid via inhibition of NF-κB signaling pathway of DSS-induced colitis mice. Phytomedicine 2023, 112, 154702. [Google Scholar] [CrossRef] [Scilit] [PubMed]
- Dutta, A.; Panchali, T.; Khatun, A.; Jarapala, S.R.; Das, K.; Ghosh, K.; Chakrabarti, S.; Pradhan, S. Anti-cancer potentiality of linoelaidic acid isolated from marine Tapra fish oil (Ophisthopterus tardoore) via ROS generation and caspase activation on MCF-7 cell line. Sci. Rep. 2023, 13, 14125. [Google Scholar] [CrossRef] [Scilit] [PubMed]
- Kar Mahapatra, S.; Chakraborty, S.P.; Majumdar, S.; Bag, B.G.; Roy, S. Eugenol protects nicotine-induced superoxide mediated oxidative damage in murine peritoneal macrophages in vitro. Eur. J. Pharmacol. 2009, 623, 132–140. [Google Scholar] [CrossRef] [Scilit] [PubMed]
- Sun, J.; Zhang, X.; Broderick, M.; Fein, H. Measurement of nitric oxide production in biological systems by using Griess reaction assay. Sensors 2003, 3, 276–284. [Google Scholar] [CrossRef] [Scilit]
- Aguilar Diaz De Leon, J.; Borges, C.R. Evaluation of Oxidative Stress in Biological Samples Using the Thiobarbituric Acid Reactive Substances Assay. J. Vis. Exp. 2020, 159, e61122. [Google Scholar] [CrossRef] [Scilit] [PubMed]
- Kang, K.S.; Wang, P.; Yamabe, N.; Fukui, M.; Jay, T.; Zhu, B.T. Docosahexaenoic acid induces apoptosis in MCF-7 cells in vitro and in vivo via reactive oxygen species formation and caspase 8 activation. PLoS ONE 2010, 5, e10296. [Google Scholar] [CrossRef] [Scilit] [PubMed]
- Livak, K.J.; Schmittgen, T.D. Analysis of relative gene expression data using real-time quantitative PCR and the 2−ΔΔCT Method. Methods 2001, 25, 402–408. [Google Scholar] [CrossRef] [Scilit] [PubMed]
- Ali, A.; Banerjee, S.; Kamaal, S.; Usman, M.; Das, N.; Afzal, M.; Alarifi, A.; Sepay, N.; Roy, P.; Ahmad, M. Ligand substituent effect on the cytotoxicity activity of two new copper(ii) complexes bearing 8-hydroxyquinoline derivatives: Validated by MTT assay and apoptosis in MCF-7 cancer cell line (human breast cancer). RSC Adv. 2021, 11, 14362–14373. [Google Scholar] [CrossRef] [Scilit] [PubMed]
- Lv, Z.D.; Liu, X.P.; Zhao, W.J.; Dong, Q.; Li, F.N.; Wang, H.B.; Kong, B. Erratum: Curcumin induces apoptosis in breast cancer cells and inhibits tumor growth in vitro and in vivo. Int. J. Clin. Exp. Pathol. 2025, 18, 42–43. [Google Scholar] [CrossRef] [Scilit] [PubMed]
- Chelluboina, B.; Klopfenstein, J.D.; Gujrati, M.; Rao, J.S.; Veeravalli, K.K. Temporal regulation of apoptotic and anti-apoptotic molecules after middle cerebral artery occlusion followed by reperfusion. Mol. Neurobiol. 2014, 49, 50–65. [Google Scholar] [CrossRef] [Scilit] [PubMed]
- Liu, J.; Ma, D.W. The role of n-3 polyunsaturated fatty acids in the prevention and treatment of breast cancer. Nutrients 2014, 6, 5184–5223. [Google Scholar] [CrossRef] [Scilit] [PubMed]
- Vinka, L.; Jesús, V.M.; Reyes, C.; Sánchez, C.; Rodrigo, V.; Camila, F. Polyunsaturated fatty acids in the prevention, treatment, and survival of breast cancer. Nutrition 2026, 150, 113311. [Google Scholar] [CrossRef] [Scilit] [PubMed]
- Luo, M.; Fu, A.; Wu, R.; Wei, N.; Song, K.; Lim, S.; Luo, K.Q. High Expression of G6PD Increases Doxorubicin Resistance in Triple Negative Breast Cancer Cells by Maintaining GSH Level. Int. J. Biol. Sci. 2022, 18, 1120–1133. [Google Scholar] [CrossRef] [Scilit] [PubMed]
- Kennedy, L.; Sandhu, J.K.; Harper, M.E.; Cuperlovic-Culf, M. Role of Glutathione in Cancer: From Mechanisms to Therapies. Biomolecules 2020, 10, 1429. [Google Scholar] [CrossRef] [Scilit] [PubMed]
- Jardim, B.V.; Moschetta, M.G.; Leonel, C.; Gelaleti, G.B.; Regiani, V.R.; Ferreira, L.C.; Lopes, J.R.; Zuccari, D.A. Glutathione and glutathione peroxidase expression in breast cancer: An immunohistochemical and molecular study. Oncol. Rep. 2013, 30, 1119–1128. [Google Scholar] [CrossRef] [Scilit] [PubMed]
- Vakkala, M.; Kahlos, K.; Lakari, E.; Pääkkö, P.; Kinnula, V.; Soini, Y. Inducible nitric oxide synthase expression, apoptosis, and angiogenesis in in situ and invasive breast carcinomas. Clin. Cancer Res. 2000, 6, 2408–2416. [Google Scholar] [PubMed]
- Myśliwiec, A.; Bartusik-Aebisher, D.; Aebisher, D. The Role of Nitric Oxide in Cancer Treatment: Ally or Foe? Molecules 2025, 30, 2802. [Google Scholar] [CrossRef] [Scilit] [PubMed]
- Nourazarian, A.R.; Kangari, P.; Salmaninejad, A. Roles of oxidative stress in the development and progression of breast cancer. Asian Pac. J. Cancer Prev. 2014, 15, 4745–4751. [Google Scholar] [CrossRef] [Scilit] [PubMed]
- Marvalim, C.; Datta, A.; Lee, S.C. Role of p53 in breast cancer progression: An insight into p53 targeted therapy. Theranostics 2023, 13, 1421–1442. [Google Scholar] [CrossRef] [Scilit] [PubMed]
- Nekkanti, S.; Pooladanda, V.; Veldandi, M.; Tokala, R.; Godugu, C.; Shankaraiah, N. Synthesis of 1,2,3-Triazolo-fused-tetrahydro-β-carboline Derivatives via 1,3-Dipolar Cycloaddition Reaction: Cytotoxicity Evaluation and DNA-Binding studies. ChemistrySelect 2017, 2, 7210–7221. [Google Scholar]
- Liu, K.; Liu, P.C.; Liu, R.; Wu, X. Dual AO/EB staining to detect apoptosis in osteosarcoma cells compared with flow cytometry. Med. Sci. Monit. Basic Res. 2015, 21, 15–20. [Google Scholar] [CrossRef] [Scilit] [PubMed]
- Mirzayans, R.; Murray, D. Do TUNEL and Other Apoptosis Assays Detect Cell Death in Preclinical Studies? Int. J. Mol. Sci. 2020, 21, 9090. [Google Scholar] [CrossRef] [Scilit] [PubMed]
Disclaimer/Publisher’s Note: The statements, opinions and data contained in all publications are solely those of the individual author(s) and contributor(s) and not of MDPI and/or the editor(s). MDPI and/or the editor(s) disclaim responsibility for any injury to people or property resulting from any ideas, methods, instructions or products referred to in the content. |
© 2026 by the authors. Licensee MDPI, Basel, Switzerland. This article is an open access article distributed under the terms and conditions of the Creative Commons Attribution (CC BY) license.