


Abstract
Laser rangefinders that use the fixed-threshold method are subject to walk error, which arises because the moment of signal detection depends on its amplitude. In addition, saturation of the receiver channel at short and medium ranges further distorts the shape of the registered pulse and reduces measurement accuracy. This paper presents a ranging device based on high-speed digitization of the entire echo waveform with a sampling rate of up to 500 MHz. The hardware implementation makes it possible to activate the power-consuming units of the receiver channel immediately before the start of the ranging cycle, which improves the energy efficiency of the device. To compensate for the signal attenuation proportional to the square of the range, dynamic gain control is implemented. To determine the position of the intensity peak, an algorithm is proposed that selects the registered signal by its amplitude and, depending on the presence of saturation, chooses the appropriate calculation method. Experimental comparison of the proposed method with classical algorithms was performed on targets of various reflectivity at ranges from 750 m to 12 km under different meteorological optical ranges. The experimental results demonstrated high measurement repeatability, with standard deviations ranging from 0.15 to 0.22 m, and confirmed the applicability of the proposed algorithm under different atmospheric attenuation conditions.
1. Introduction
Laser rangefinders are one of the main tools for non-contact distance measurement and are widely used in modern remote sensing systems. Laser measurement technologies have found application in robotics, navigation, geodesy, and cartography [1]. The development of mobile laser scanners and autonomous robotic systems places increasing demands on both the accuracy of distance measurement and the speed of the measurement channel [2]. The operating principle of a laser rangefinder is based on registering the time of flight (TOF) of a pulse reflected from the probed target [3]. Depending on the time registration method, direct and indirect TOF measurements are distinguished.
Indirect methods include measurement of the phase shift between the transmitted and received signals. Phase-shift rangefinders use continuous modulated radiation and determine the range from the phase difference between the reference and received signals. A significant advantage of this method is the possibility of achieving high measurement accuracy at short and medium ranges of up to 500 m [4]. As the measurement range increases, the power budget of the optical channel becomes decisive. The power of the received echo signal decreases inversely with the square of the range. Additional attenuation is determined by the reflectivity of the target, atmospheric attenuation, and the characteristics of the transmitting and receiving optics. Therefore, for phase-shift systems, increasing the range requires higher emitted energy, a larger receiving optics aperture, improved photodetector sensitivity, or a longer accumulation time. These limitations make the pulsed direct TOF method more attractive for long-range measurement tasks.
In rangefinders based on the direct measurement method, the range is determined from the time interval between the moment the transmitted pulse is generated and the moment the reflected signal is registered. For pulsed systems, the choice of the method for determining the arrival time of the echo pulse is of fundamental importance. In the simplest case, a fixed threshold is used, where the STOP signal is generated at the moment the input signal crosses a predefined level. This approach is simple to implement and can be realized directly in the analog receiver channel. However, the threshold crossing time depends on the amplitude of the received signal; therefore, when the power of the signal reflected from the target changes, a time shift in the measurement result arises. This dependence is known as walk error [5]. The magnitude of the error is determined by the pulse shape, its amplitude, its duration, and the threshold level [6]. Even for a fixed shape of the transmitted pulse, a change in the amplitude of the received signal changes the position of the threshold crossing point and, consequently, the measured propagation time. For laser rangefinders this problem is of fundamental importance, since the echo signal power can vary by several orders of magnitude depending on the range, the reflectivity of the surface, and the radiation propagation conditions [7]. To reduce the influence of walk error, various timing discrimination methods are used. Along with a fixed threshold, peak detection and an adaptive threshold are employed. In the analog channel, the pulse peak can be determined using differentiating circuits with subsequent detection of the derivative zero crossing. An adaptive threshold, in turn, makes it possible to link the comparison level to the amplitude of the registered pulse and thereby reduce the dependence of the STOP signal generation moment on the echo signal power. Despite the improvement in analog timing discrimination methods, increasing their accuracy is accompanied by a more complex receiver channel [8]. Reducing the timing error may require wideband amplifiers, delay lines, additional automatic gain control circuits, and dedicated threshold-forming circuits [9]. Widening the bandwidth increases the intrinsic noise level of the receiver and raises the requirements for the speed of the electronic components. In application-specific integrated receivers, developers use architectures with a wide dynamic range and hardware compensation for the dependence of the trigger time on the signal amplitude; however, such solutions also require more complex circuitry [10]. Another direction is the transition from registering individual characteristic points of the pulse to digital registration of its full temporal shape, in which the device memory stores not only the moment of pulse detection but also the entire echo waveform within a specified time window [11]. This allows for the temporal position of the echo signal to be determined by digital processing of multiple samples, and thus sub-sample accuracy, better than the sampling period of the analog-to-digital converter (ADC), to be obtained [12]. In contrast to the traditional analog scheme, which stores only the moment of STOP signal generation, a digital receiver channel provides access to the original echo waveform, which can be used for subsequent target selection and classification.
Several approaches are used to determine the position of the peak of the signal reflected from the probed target. The simplest is to find the maximum sample, but its accuracy is directly limited by the sampling rate. A more accurate estimate can be obtained by calculating the weighted position of the samples (centroid) or by approximating the neighborhood of the peak with a mathematical function. In particular, second-order polynomial fitting makes it possible to recover the temporal position of the pulse peak, while the accuracy of such determination depends on the pulse width, the signal-to-noise ratio (SNR), and the sampling rate. Research results show that the shape parameters of the received signal directly affect the final ranging error.
An additional problem of digital systems is the saturation of the photodetector and subsequent amplification stages when high-power reflected pulses are registered. Such a situation is typical for short and medium ranges, as well as for targets with high reflectivity. Under saturation, the pulse shape is distorted, which leads to a bias in the results of the algorithms that determine the temporal position of the maximum. To compensate for this effect, special waveform reconstruction algorithms, multichannel receiver architectures, and methods for estimating the parameters of a saturated pulse are used [13,14]. Modern digital processing methods make it possible to perform reconstruction and decomposition of the echo waveform even when the registered signal has a complex shape [15].
Existing hardware methods based on signal reconstruction provide high accuracy, but they require a second high-speed ADC channel, which complicates the device and increases its power consumption and dimensions. Classical methods based on linear or polynomial fitting are simple to implement, but their accuracy decreases when processing saturated signals.
This paper considers the development of a single-channel device for high-speed processing of the echo waveform, using a filtering algorithm and an intensity peak position determination algorithm based on an asymmetric pulse model. This solution simplifies the hardware of the device and ensures high repeatability of the measured range values over the entire dynamic range of the instrument.
2. Device Description
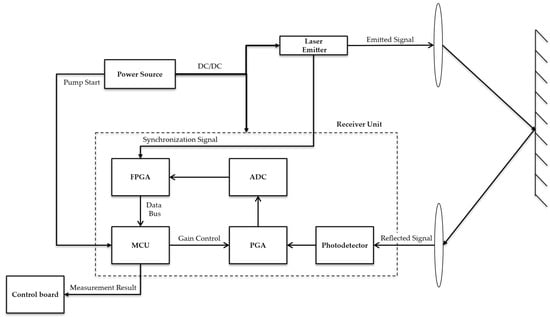
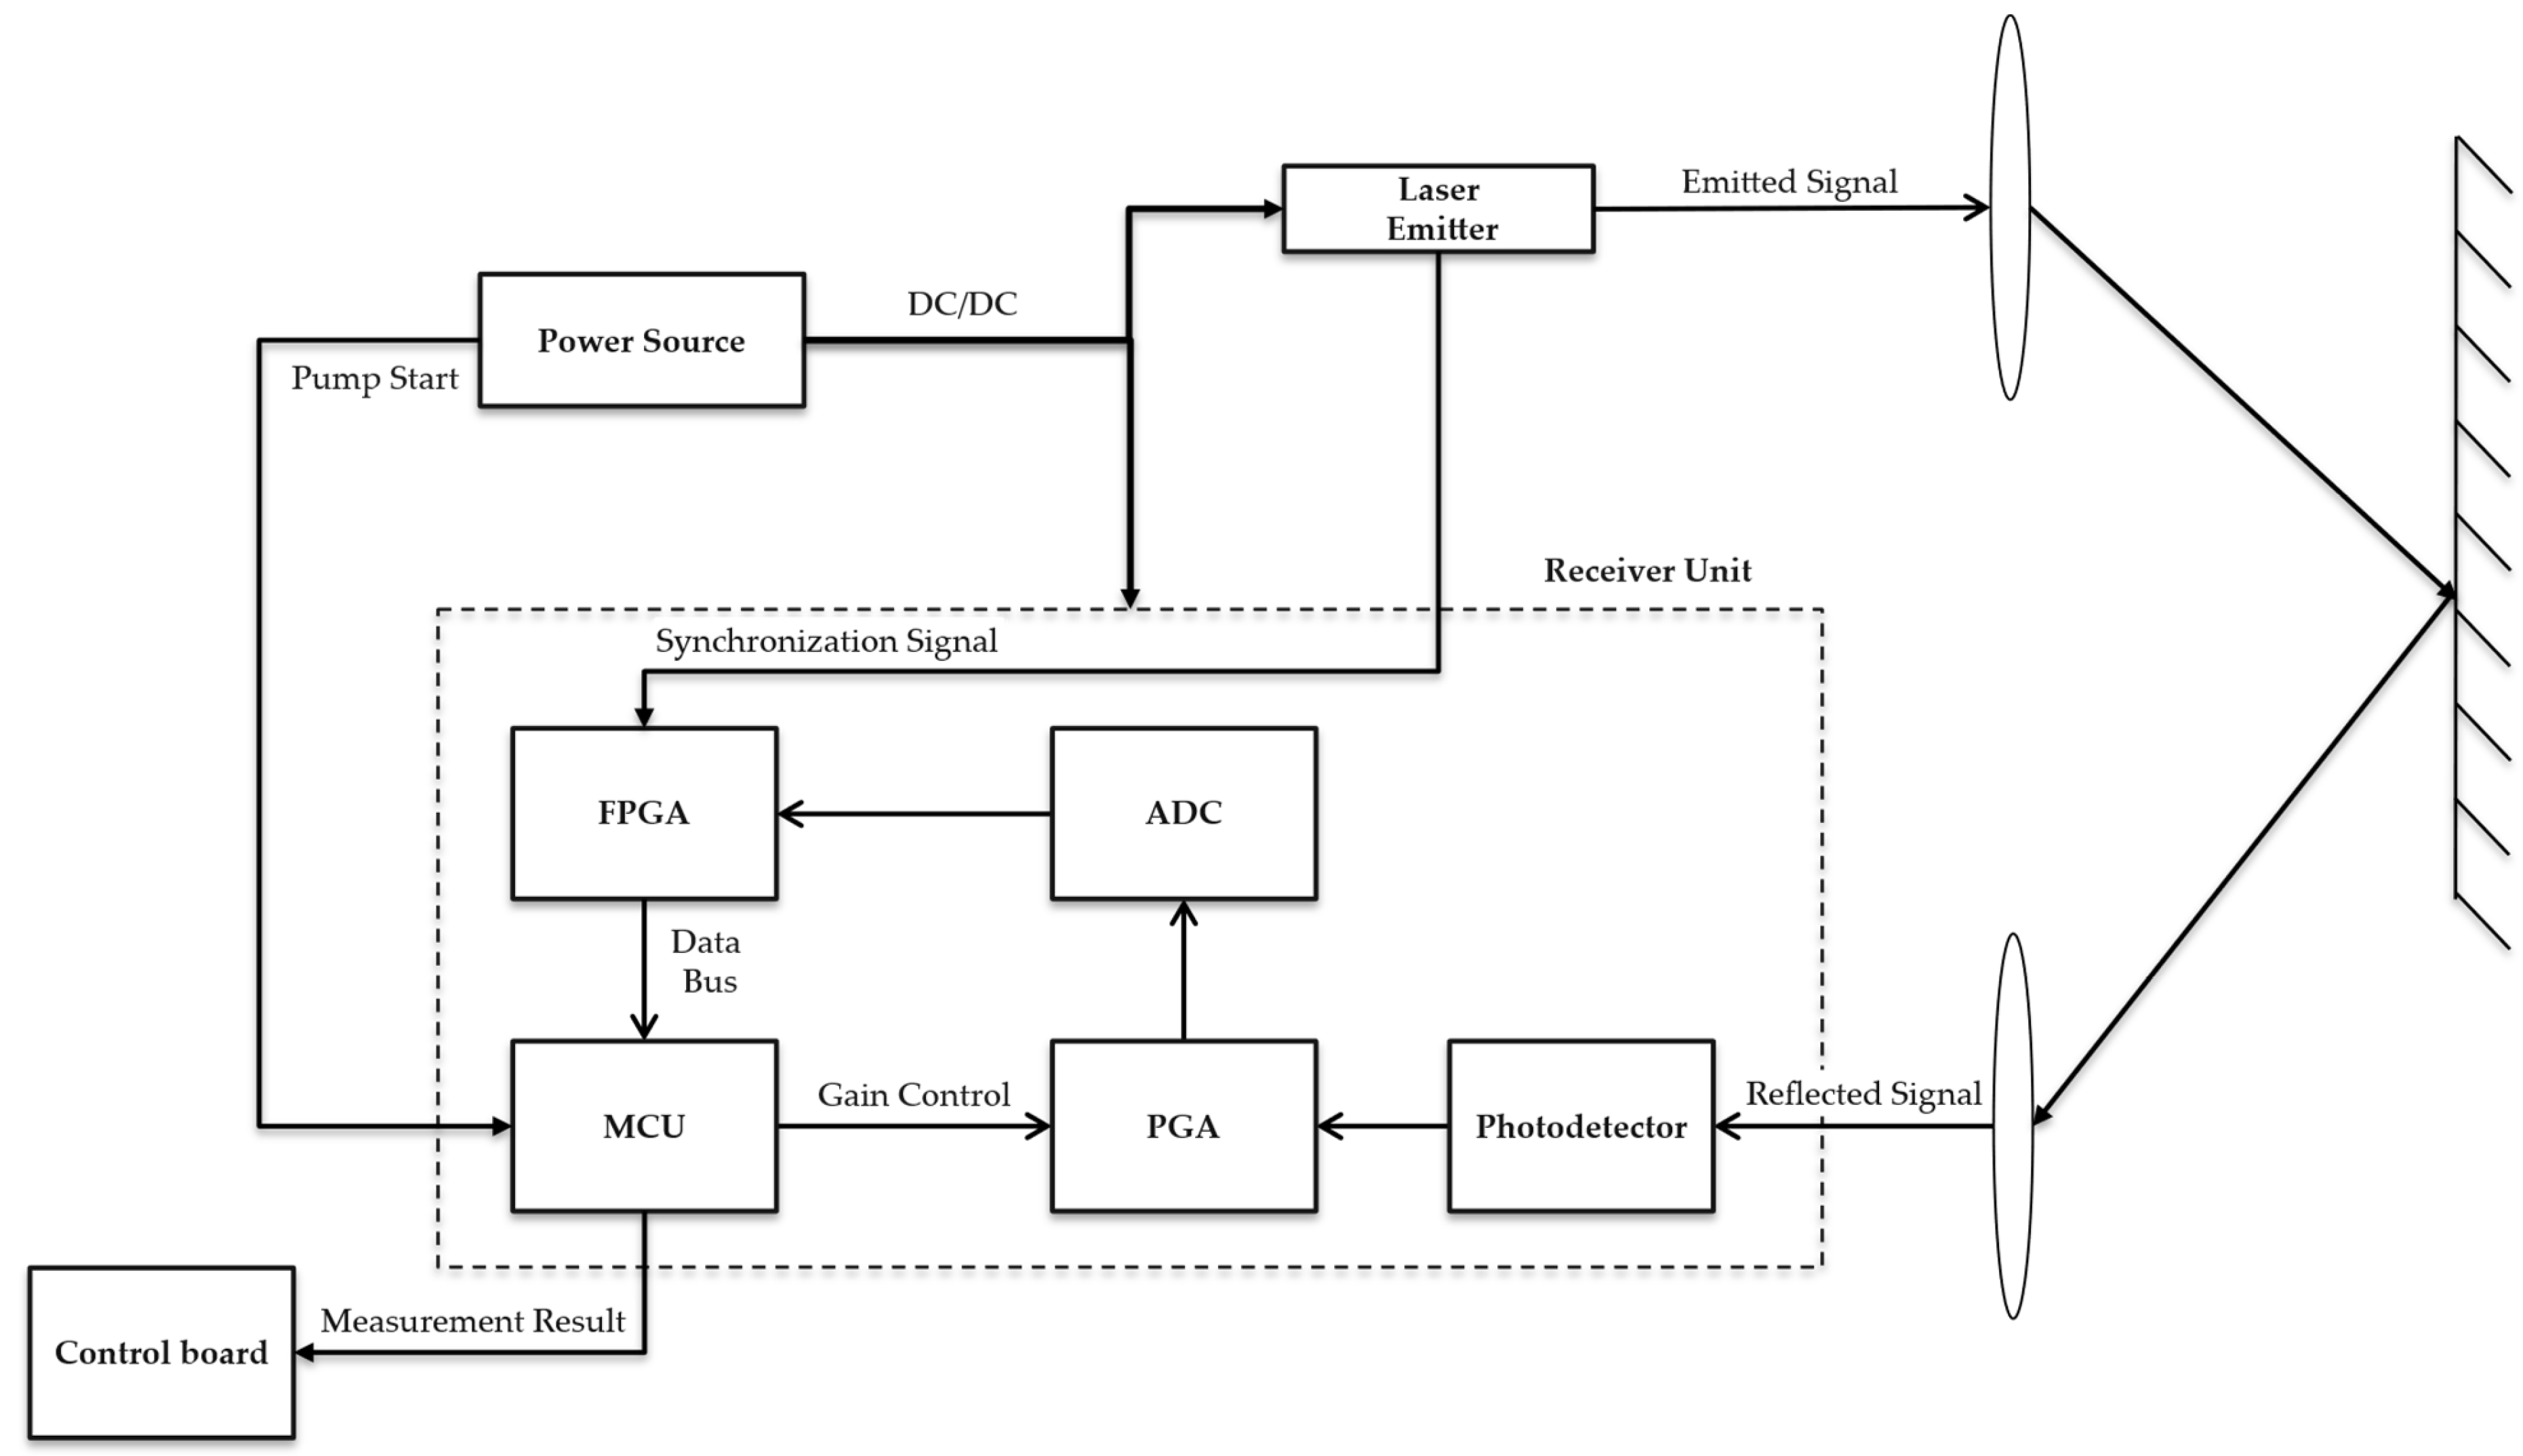
The block diagram of the device under development is shown in Figure 1. To optimize power consumption, before the laser pumping cycle begins, the power source and control unit generates a discrete control signal, in response to which the microcontroller unit (MCU) switches the power-consuming units of the receiver channel from sleep mode to active mode. At the moment the optical pulse is emitted, a hardware START synchronization signal is generated and sent to the field-programmable gate array (FPGA), which initiates data readout from the high-speed ADC.
Figure 1.
Optical TOF system diagram.
The reflected optical signal is detected by a photodetector module based on an avalanche photodiode (APD), which provides the required sensitivity of the receiver channel for ranging up to 20 km owing to internal avalanche gain. The developed device includes an adjustable gain control system for the receiver channel, which makes it possible to adapt the gain to the input signal level depending on the range to the target and thereby reduce the risk of excessive currents flowing through the APD, which could damage it at short ranges. This allows for the reception of both weak echo signals typical of long ranges and intense reflected signals at short distances while maintaining the stability and reliability of the receiver channel. In addition, the photodetector includes a compact temperature compensation system for the APD bias voltage, based on the temperature dependence of the voltage drop across a p-n junction. This system maintains stable operating conditions of the photodiode and an almost constant sensitivity of the receiver channel over the entire operating temperature range, which is especially important for long-range measurements [16,17].
The signal generated at the output of the photodetector module is fed to the second stage with adjustable gain, a programmable gain amplifier (PGA) LMH6401 (Texas Instruments, Dallas, TX, USA). From the PGA output, the analog signal is fed to the input of a high-speed 12-bit ADC HMCAD1520 (Analog Devices, Wilmington, MA, USA) operating at a sampling rate of up to 500 MHz, which digitizes the entire echo waveform array within a time window of up to 260 μs. The digitized data stream is continuously written to the internal memory of the FPGA Spartan-7 XC7S25 (AMD/Xilinx, San Jose, CA, USA). At the end of the ranging interval, the FPGA sets a logical ready flag, which initiates the transfer of the data array to the MCU STM32H725 (STMicroelectronics, Geneva, Switzerland) via a parallel bus for subsequent mathematical analysis and range calculation. The echo waveform processing algorithm is implemented in C language on the microcontroller. The device also supports a USB 2.0 communication interface, enabling the transmission of both the measured range and the recorded echo waveform data.
3. Dynamic Gain Control
In contrast to the previously considered device based on peak detection, the increased computational power has made it possible to tune the receiver channel more flexibly. To linearize the dynamic range, the processing unit generates a dynamic gain ramp Ku(t), which compensates for the attenuation of the useful signal inversely proportional to the square of the range [18]. The relationship between the voltage gain and the logarithmic gain is as follows:
where Uout—output voltage of the amplifier, Uin—input voltage of the amplifier, Ku—voltage gain [V/V], and Lu—logarithmic gain [dB].
To achieve full compensation, the gain must vary with the distance traveled by light. To shape the gain profile, a minimum gain K0, which acts at short ranges to prevent saturation of the receiver channel, and a distance R0, which defines the point from which the gain must start to increase, are specified [19]. The required dependence of the gain on the range has the form:
where R0—initial distance, and K0—initial gain.
The digital curve generated by the processing unit is transmitted to the PGA synchronously with the START pulse, which equalizes the echo signal levels over the entire operating range of distances and prevents overload of the analog channel and the ADC [20,21,22].
4. Range Measurement Methods
The range measurements are based on an algorithm for finding the temporal position of the center of the registered optical pulse:
where c—speed of light, and tSTOP—time corresponding to the position of the center of the optical pulse.
A fundamental task in processing the high-speed digitized data array is the accurate determination of the arrival time of the reflected pulse [23]. Since the real continuous optical signal is converted by the high-speed ADC into a discrete sequence of samples, direct determination of the temporal position of the pulse center faces a number of limitations that determine the final accuracy of the laser rangefinder.
One of the simplest implementations of the algorithm is a direct search for the maximum value. This approach requires virtually no computational resources, but its accuracy is limited by the ADC sampling period:
where Tsr—sampling period of an ADC, and fsr—sampling rate.
The peak localization error in this case is markedly systematic and varies periodically depending on the relative shift in the sampling phase with respect to the true maximum of the optical pulse. To overcome this limitation and to obtain an accuracy better than the ADC sampling period, algorithms are used that aim to reconstruct the continuous signal from a finite set of discrete samples of the echo waveform.
One of the common approaches is to calculate the weighted average of the set of samples exceeding a specified threshold [24]:
where Xs—position of the pulse center in sample indices, xi—time index of a sample, and yi—signal amplitude at the discrete point.
The method is computationally efficient; however, it gives satisfactory results only for symmetric signals and exhibits a significant estimation bias in the presence of pulse asymmetry and noise on the falling edge [25]. For more accurate localization, algorithms are used that approximate the shape of the peak with a second-degree parabolic function by the least squares (LS) method. The idea of the algorithm is that the pulse shape in the vicinity of the maximum is described by a parabolic function, and the time coordinate of the peak is found by an analytical solution of the system of LS equations [26]. Nevertheless, both the pulse centroid method and polynomial fitting assume that the undistorted signal shape is preserved and prove ineffective when the receiver channel saturates.
The problem of saturation of the photodetector and analog amplification stages arises when high-power optical pulses are received, which is typical for short and medium ranging distances, as well as for targets with high reflectivity. Under saturation, the pulse shape is distorted: the peak is clipped at the saturation threshold voltage, the effective pulse duration increases, and, owing to the inertia of the photodetector, a nonlinear time delay of the response occurs. Direct application of fitting methods to the clipped signal leads to a significant shift in the calculated pulse center and overestimation of the measured range.
Hardware and software methods are employed to compensate for errors caused by receiver saturation. Hardware solutions may use parallel channels with different gains to reconstruct the parameters of a saturated signal [13]. Software methods are based on timing-bias correction, waveform fitting, and decomposition of reflected pulses [14,15], as well as adaptive processing of recorded echo waveform data [25,26].
Different ranging accuracy levels have been reported in published studies. In ref. [3], a total measurement error of approximately 1 cm was obtained under laboratory conditions using pulse duration of 39 ns. In ref. [24] the ranging error did not exceed 20 mm at a distance of 40 m. For saturated signals, the pulse arrival-time estimation error reported in [13] was reduced from 0.7 to 0.14 ns after compensation, corresponding to a reduction in the equivalent range error from 0.11 to 0.02 m.
Direct comparison of these performance figures with the results of the present study is not appropriate because of differences in measurement systems, experimental conditions, and metrological performance metrics. The considered approaches also differ in hardware and computational complexity. Multichannel architectures require additional receiver channels, whereas waveform reconstruction and intelligent signal processing methods impose greater computational demands. Therefore, for a compact single-channel device with MCU-based processing, an analytical algorithm for estimating the peak position of saturated signals was selected, eliminating the need for an additional receiver channel and iterative waveform reconstruction.
5. Method Based on an Asymmetric Pulse Model
In developing the device based on high-speed signal processing, it was decided, in order to preserve the compactness of the instrument, to forgo hardware methods for compensating the error caused by saturation of the receiver channel when measuring distances to highly reflective targets at short and medium ranges, in favor of a software implementation of intensity peak position determination. The generalized processing sequence of the developed algorithm is presented as pseudocode in Algorithm 1.
The algorithm illustrates the functional sequence of data processing operations. First, the echo waveform is filtered using a matched filter, after which the reflected signals are detected and classified. The appropriate method for refining the temporal position of the pulse is then selected according to the type of detected signal. The mathematical expressions used for peak position estimation are given in Equations (5) and (8).
| Algorithm 1. Generalized Procedure for Selective Echo Signal Processing. |
| 1: Input: Digitized echo waveform S, processing parameters P 2: S_filtered ← FilterAndNormalize(S, P) 3: T ← GenerateAdaptiveThreshold(S_filtered, P) 4: Candidates ← ∅ 5: for each sample i outside the dead-time interval do 6: if S_filtered[i] > T[i] then 7: if SaturationDetected(S, i, P) then 8: UpdateSaturatedCandidate(Candidates, i) 9: else 10: UpdateLocalPeakCandidate(Candidates, i) 11: end if 12: else if ExtendedResponseDetected(S_filtered, i, P) then 13: UpdateExtendedCandidate(Candidates, i) 14: end if 15: end for 16: for each candidate in Candidates do 17: if candidate is saturated then 18: x_peak ← EstimateSaturatedPeak(candidate, P) 19: else 20: x_peak ← EstimateCentroid(candidate, S_filtered, P) 21: end if 22: L ← CalculateRange(x_peak, P) 23: end for 24: return L 25: Output: Estimated target distances L |
The data obtained as a result of laser ranging, represented as discrete points, contain not only the useful signal but also a noise component. Therefore, at the first stage, the acquired echo waveform data are passed through a filter. In practice, the shape of a real laser pulse received by the receiver differs from a normal distribution.
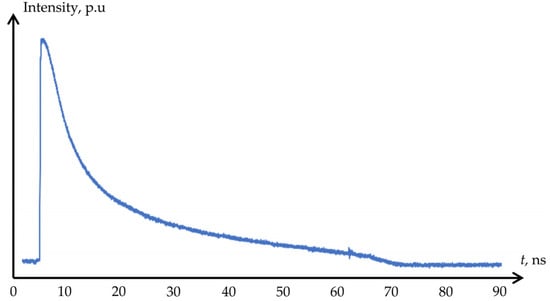
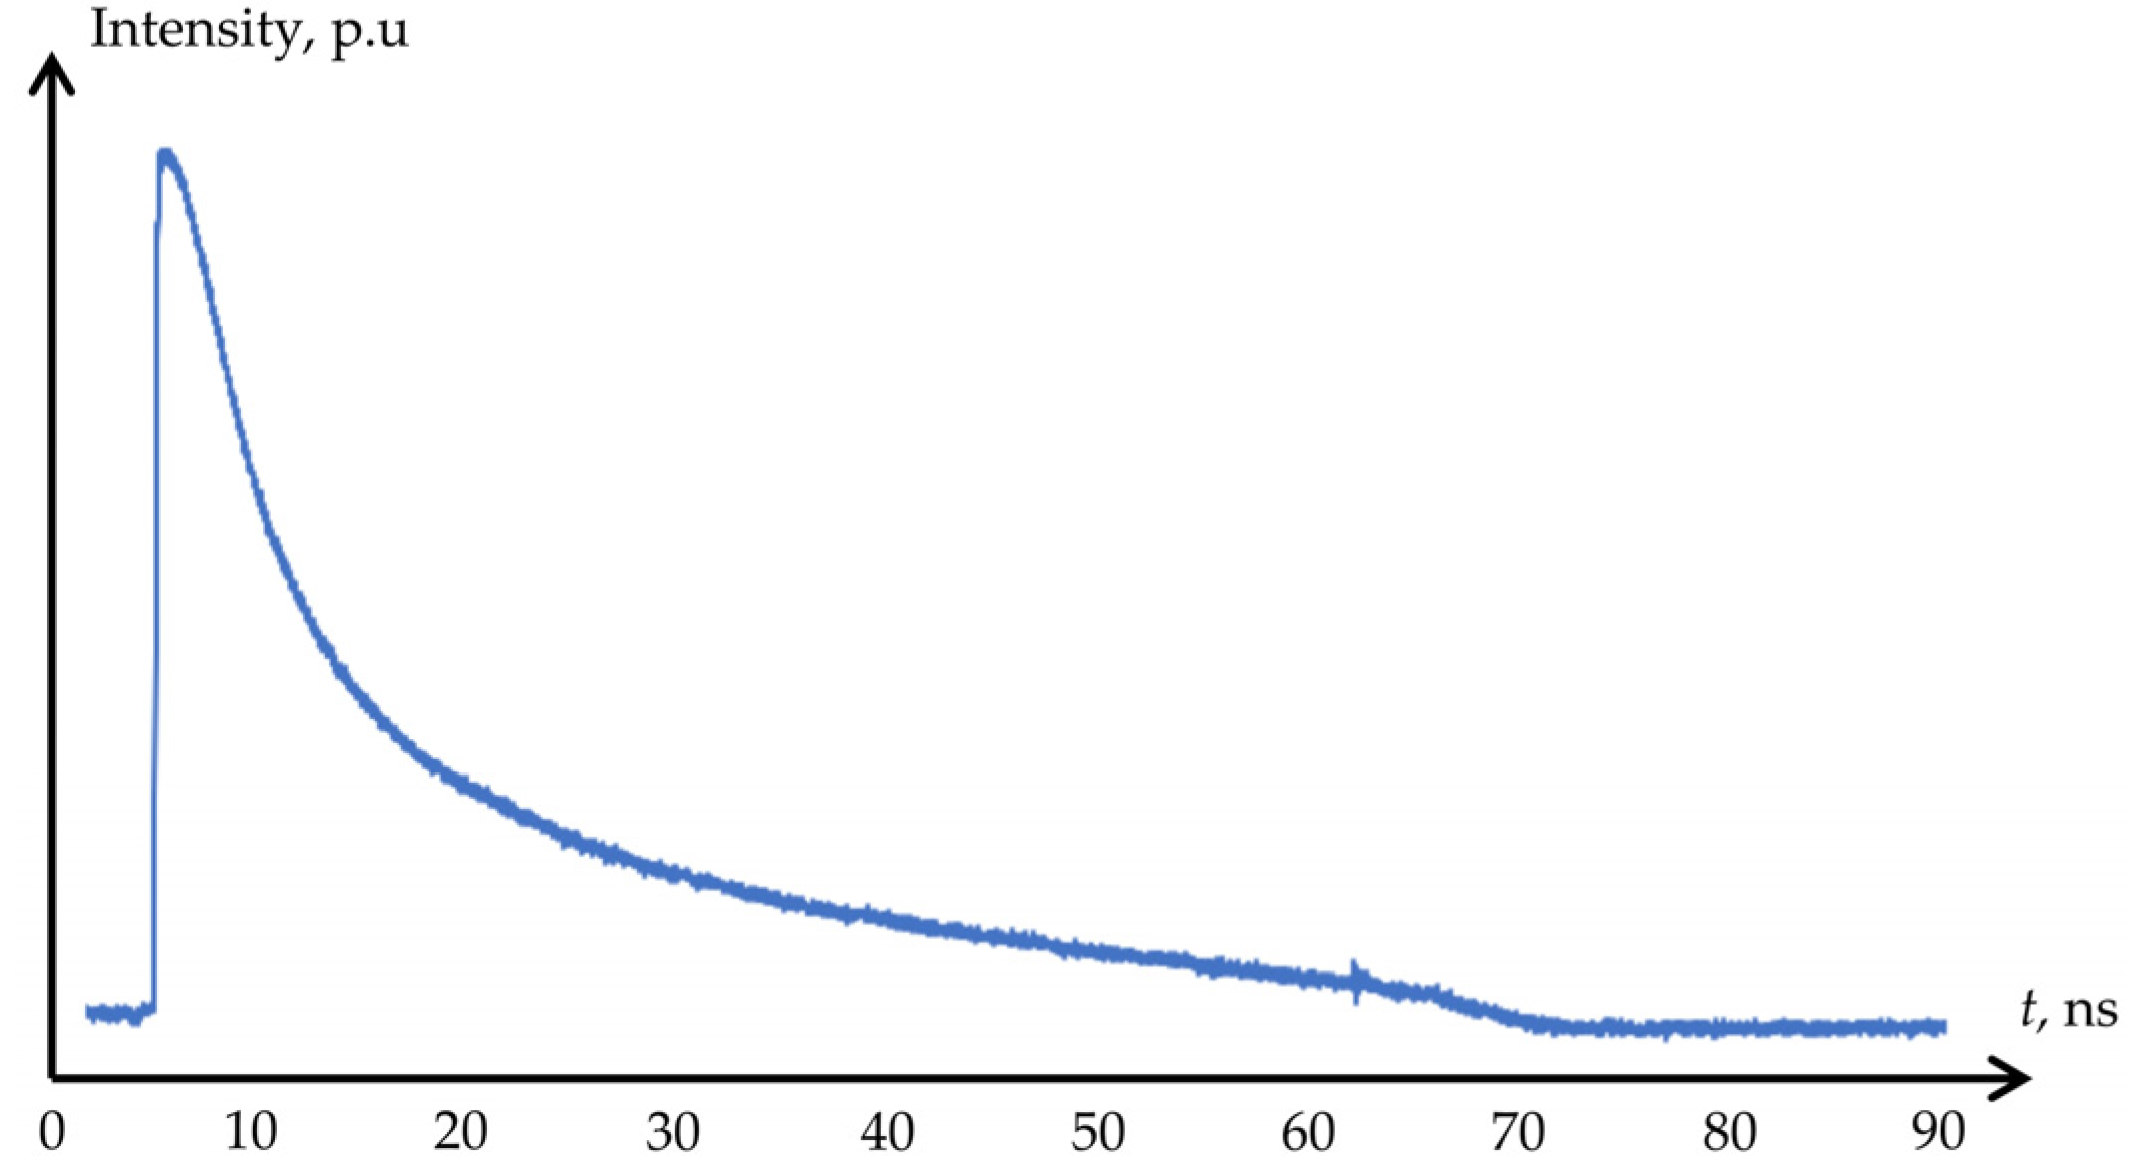
Figure 2 shows the pulse shape recorded by the photodetector. The steep rising edge and the prolonged falling edge are caused by the processes of charge carrier accumulation and recombination in the semiconductor structure of the photodiode, as well as by the instrument response function of the laser emitter itself.
Figure 2.
Laser pulse shape recorded by the photodetector.
Applying a classical symmetric Gaussian filter to a signal whose impulse response is characterized by different rise and fall times is not optimal. With a symmetric impulse response, the rising and falling portions are smoothed with the same width, whereas the real signal exhibits pronounced asymmetry. As a result, the maximum of the filtered signal can shift relative to its original position, which directly affects the accuracy of estimating the intensity peak position on the echo waveform and leads to a ranging error. Therefore, the impulse response of the filter is formed on the basis of a piecewise normal distribution function whose rise and fall parameters are set independently. This approach makes it possible to bring the filter shape closer to the characteristic form of the impulse response of the system under study:
where Apeak—amplitude of the asymmetric normal distribution, xpeak—discrete point corresponding to the amplitude Apeak, σrise—standard deviation (SD) of the rising edge, σfall—SD of the falling edge, xrise—set of discrete points of the rising edge, and xfall—set of discrete points of the falling edge.
The choice of parameters related to the filter window size and the SD parameters of the modeled response depends directly on the typical target to be probed and on the parameters of the receiver channel. To preserve the energy scale of the signals during the convolution operation, the formed profile is normalized to its maximum. To speed up the computations, an additional coefficient is introduced to convert the obtained values to integer format. Filtering is performed using the sliding discrete convolution method. For each current sample, a filter window is formed, within which each sample of the original signal is multiplied by the corresponding template coefficient, after which the resulting products are summed. In general form, the filtering result can be represented as:
where YF—signal amplitude after filtering, N—coefficient for conversion to integer values, M—filter window width, and y—amplitude of the useful signal before filtering.
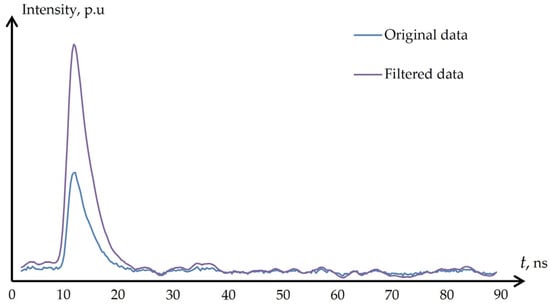
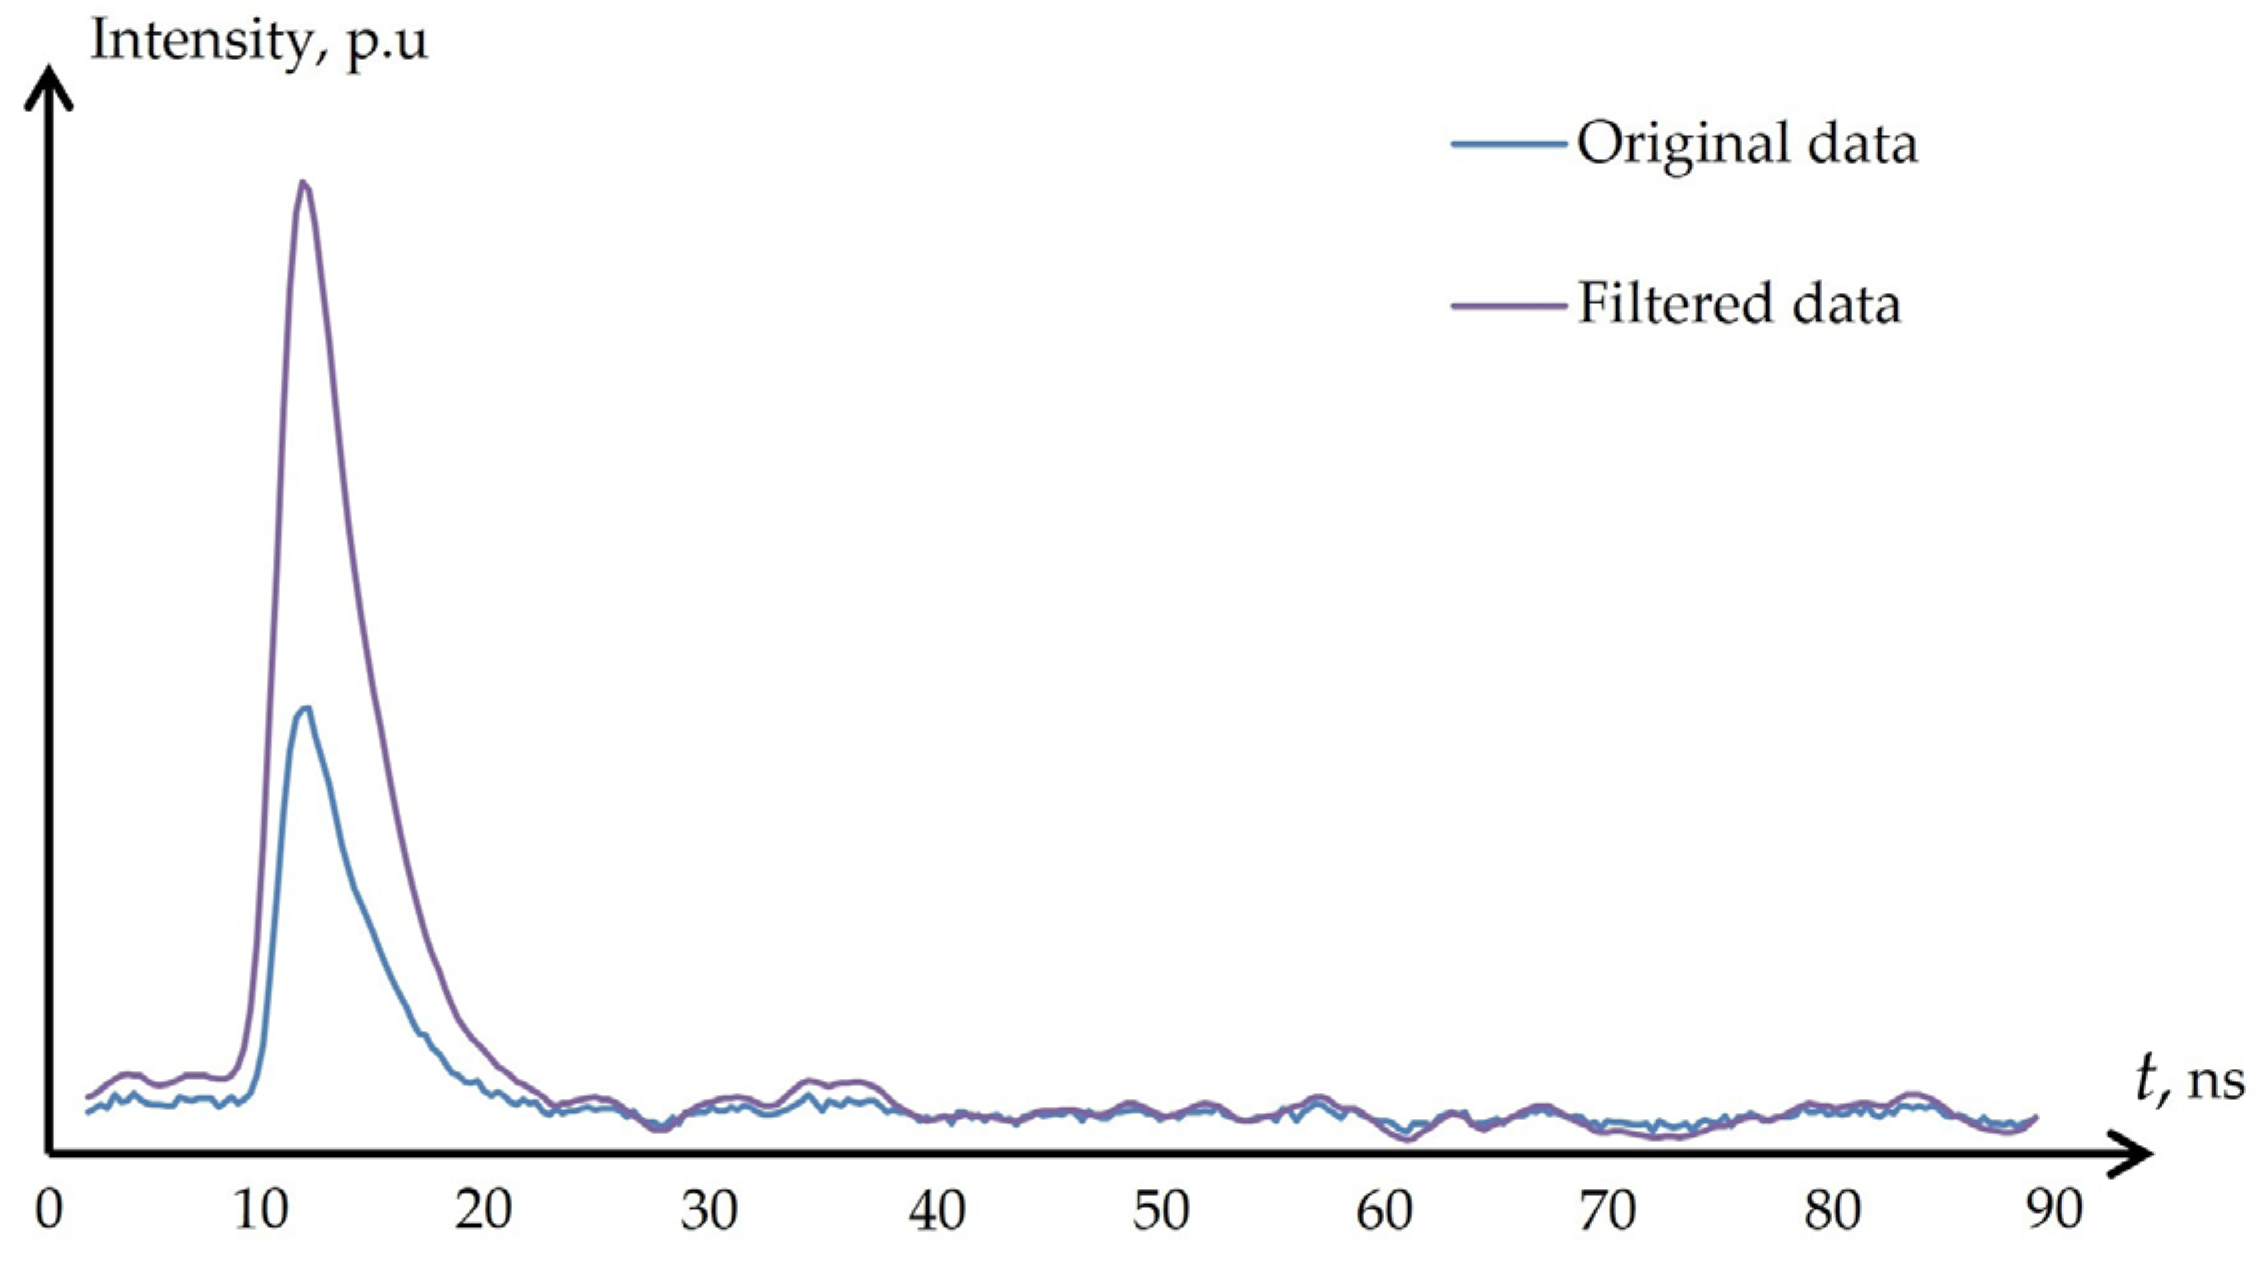
When the shape of the useful signal matches function (6), the contributions of individual samples add up during summation and form a pronounced maximum of the filter response. The signal components that do not have a stable correspondence to the specified shape, including the noise component, partially cancel each other out during convolution. As a result, the ratio of the useful signal response to the rest of the waveform increases, which makes it possible to distinguish the useful signal against the noise floor, as shown in Figure 3.
Figure 3.
Filter operation.
The filtering results show that the shape of the pulse reflected from the target is not distorted, which preserves the possibility of accurately determining the intensity peak position on the echo waveform.
To locate the useful signal on the echo waveform, the processing unit generates a virtual detection threshold. It is implemented by forming a piecewise function consisting of three parts. The first part sets the “dead time”, which corresponds to the duration of the backscatter interference. On the interval the function value is equal to the voltage Umax, which exceeds the saturation voltage of the receiver channel, thereby excluding the possibility of false triggering. The second part is a decreasing function in accordance with the law of signal attenuation inversely proportional to the square of the range. The last part is a constant voltage level USNR, which corresponds to the specified SNR. The value of the voltage USNR is the result of calculating the SD at the end of the echo waveform, where no signal is present, which enables automatic adjustment of the noise level depending on the interference environment during device operation. The optimal value of this coefficient is considered to be at least 5 [27]. The choice of the threshold value is dictated by the need to ensure an acceptably low probability of false comparator triggering by noise spikes while maintaining sufficient sensitivity to weak reflected signals. Reducing this coefficient below the specified value increases the probability of false alarms, since the amplitude distribution of the receiver channel noise is close to normal, and the threshold being exceeded by a noise spike becomes statistically significant at SNR < 5. Increasing the coefficient, in turn, reduces the maximum operating range of the device, since the amplitude of the useful signal decreases inversely with the square of the range.
The procedure for detecting reflected laser pulses on the echo waveform is divided into two stages: a coarse estimation with identification of the pulse type and its subsequent precise refinement. During the initial scan of the filtered data array, the algorithm finds the base discrete sample of the signal peak and classifies it based on an analysis of the derivative, the amplitude, and the width of the above-threshold portion. Depending on the registration conditions, three categories of signals are distinguished: single pulses, extended low-amplitude responses, and saturated pulses. For saturated signals, the algorithm records the boundary points of entry into and exit from the saturation zone. The determined signal type serves as a direct criterion for choosing the mathematical tool for sub-sample estimation. For unsaturated signals that retain their original shape, the classical weighted centroid method is used, whereas for pulses in saturation an analytical solution of the piecewise function based on the rising and falling edges of the received signal is applied. Given that at the points corresponding to the onset and end of saturation the function takes the maximum possible value that the ADC can register, the two equations of the piecewise function (6) can be equated and solved for the desired peak position [28]:
where xL—sample number corresponding to the saturation position on the rising edge of the signal, and xR—sample number corresponding to the saturation position on the falling edge of the signal.
The proposed peak position refinement method does not depend on the actual signal amplitude. The values of σrise and σfall are selected based on the typical measurement target that may be encountered during device operation, which is a limitation of the method, since it requires readjustment when the usage scenario of the instrument changes.
6. Experimental Results
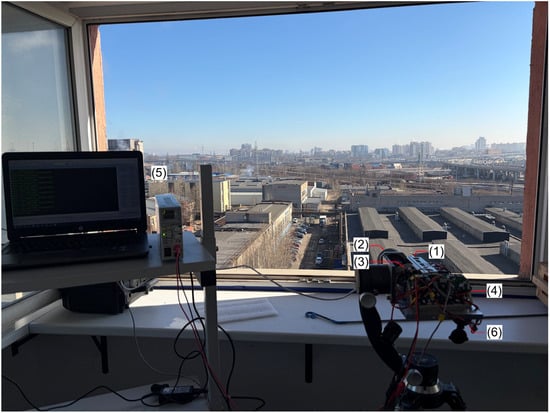
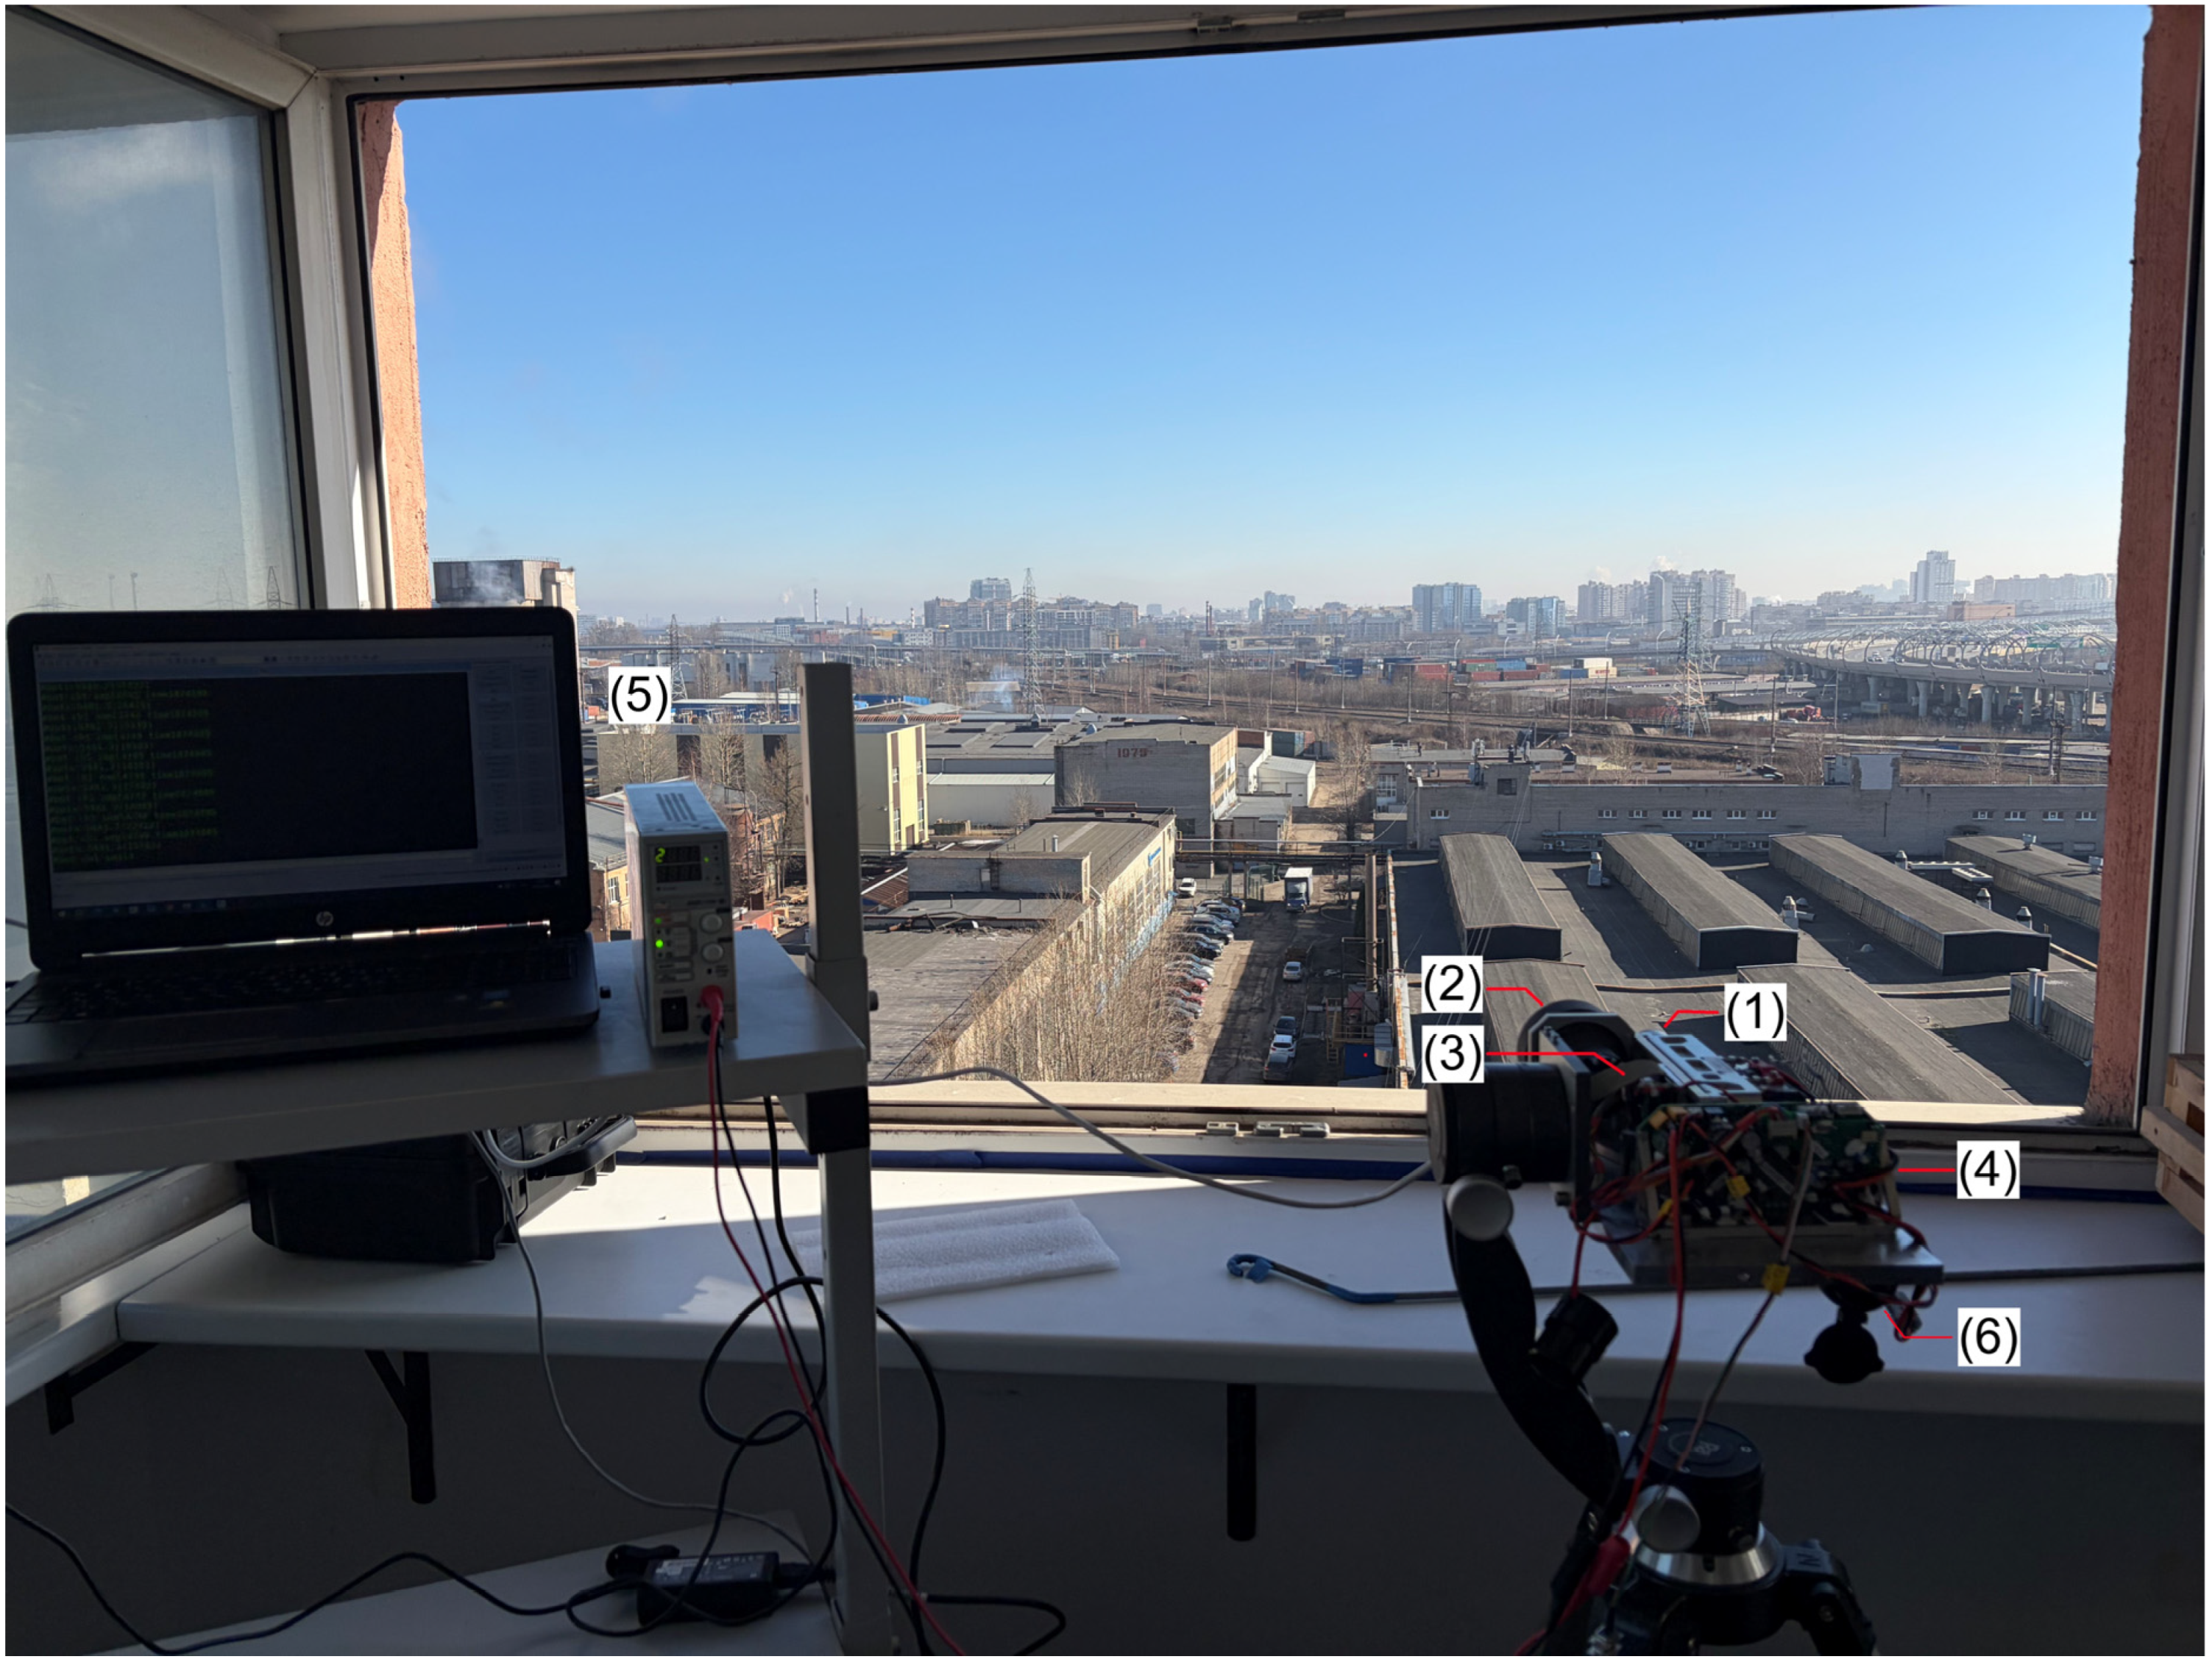
To evaluate the performance of the developed device, experimental measurements were conducted using a laser rangefinder. The experimental setup shown in Figure 4 consists of a commercial laser emitter (1) and an optical receiving channel (2).
Figure 4.
Experimental setup: (1) laser emitter; (2) optical receiving channel; (3) high-speed echo waveform digitization unit; (4) power supply; (5) personal computer; (6) optical sight.
The APD-based photodetector and the high-speed echo waveform digitization unit (3) are custom-developed components manufactured as part of this research. The laser emitter and receiver channel are powered by a power supply (4). The measurement data are transmitted to a personal computer (5) via a USB 2.0 interface for subsequent processing. The optical sighting channel (6) was aligned with the laser emission axis with an angular accuracy better than 0.1 mrad, reducing pointing errors when probing targets with small angular dimensions at long ranges. The beginning of the measurement cycle was synchronized using a photodiode integrated into the laser emitter housing, ensuring identical measurement conditions when the two measuring devices based on different operating principles were used sequentially.
The reference distances to the investigated targets were determined using a commercial laser rangefinder with a display resolution of 0.1 m and a manufacturer-specified maximum measurement error not exceeding 1.5 m at ranges up to 20 km. The optical parameters of the reference rangefinder correspond to those of the experimental setup and are presented in Table 1. The reference instrument was selected to obtain independent distance measurements that could be directly compared with the results obtained by processing the recorded echo waveforms.
Table 1.
Emitter technical specification.
Unlike the reflected-pulse timing analysis methods investigated in this study, the reference rangefinder directly provides a numerical distance measurement. Its readings can therefore be used as a common basis for comparing all investigated algorithms without additional data conversion or the introduction of calculation procedures specific to individual digital signal processing methods. The primary objective of the experimental study was to determine how the echo-waveform processing method affects the measured distance. Accordingly, the reference rangefinder was used primarily to evaluate the relative deviations of the results obtained by different algorithms from independently measured distances. This approach enables the results of the algorithms to be expressed in the same units and allows for changes in their readings to be examined as functions of target distance and echo signal acquisition conditions.
For each investigated target, the reference distance was determined as the arithmetic mean of 5000 measurements. Averaging was performed to reduce the influence of random variations in the reference instrument readings. The resulting values were used as reference distances for comparative analysis rather than as metrologically certified distance values with negligible measurement uncertainty.
It should be noted that the manufacturer-specified maximum error of the reference rangefinder exceeds the observed deviations of the mean results obtained using the investigated algorithms. Consequently, this instrument cannot directly verify the absolute ranging error of the developed device at the centimeter level. Nevertheless, the reference measurement method provides readily interpretable results suitable for the comparative evaluation of the algorithms considered in this study.
The investigated targets were classified according to their distances from the measurement location and angular dimensions. They included buildings, pipes, and truss structures. The targets were selected to cover a range of reflective properties and geometric characteristics representative of practical ranging applications.
To investigate the performance of the device under receiver saturation conditions, targets located at distances of 750.27 and 1210.44 m were selected. Target geometry was also considered. Buildings represented large extended targets with dimensions exceeding the laser spot size, whereas pipes and elements of truss structures at long ranges had angular dimensions comparable to the beam divergence. These conditions approximate the probing of point-like targets and enable evaluation of device performance under unfavorable conditions in terms of the reflected optical energy.
Each target was probed 5000 times under different meteorological conditions. The recorded echo waveforms were processed using three algorithms: amplitude detection, the weighted centroid method, and the algorithm proposed in this study. Amplitude detection was performed using a detection threshold corresponding to 5SNR. The processing window for the weighted centroid algorithm and the asymmetric pulse model-based algorithm was set to 9 ADC samples. The parameters σrise and σfall were set to 3 and 6 ADC samples, respectively. These parameter values were determined by analyzing the pulses reflected from the investigated targets using the mathematical asymmetric pulse model. Before applying the range estimation algorithms, the matched filter described above was applied to each recorded echo waveform to ensure identical processing conditions. Table 2, Table 3 and Table 4 present the measurement results and standard deviations for each target under different meteorological conditions.
Table 2.
Experimental results. Algorithm based on the asymmetric pulse shape.
Table 3.
Experimental results. Amplitude detection algorithm.
Table 4.
Experimental results. Weighted centroid algorithm.
To quantitatively evaluate the metrological characteristics of the developed device, an additional analysis of the experimental results was performed. The analysis was based on the mean measured distances, experimental standard deviations, and deviations from the reference values. The deviations of the measurement results from the reference values were determined using the following expression:
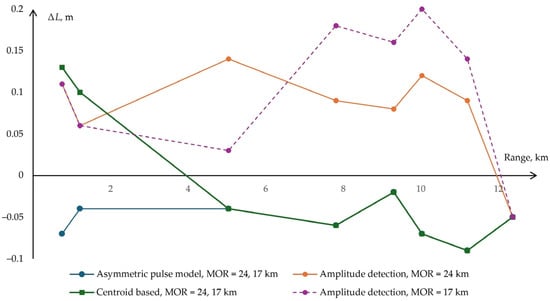
where ΔL—deviation of the measurement result, Lavg—mean distance obtained by processing the recorded echo waveforms using one of the investigated algorithms, and Lref—reference distance to the target. The calculation was performed for all three algorithms considered in this study. The resulting dependencies of the deviations from the reference values on target distance are presented in Figure 5.
ΔL = Lavg − Lref,
Figure 5.
Deviations of the mean measured distances from the reference values as functions of target distance for different echo waveform processing algorithms under different meteorological conditions.
The analysis showed that the maximum absolute deviation of the mean measured distance from the reference value was 0.09 m for the proposed algorithm. The corresponding maximum deviations were 0.20 m for the amplitude detection algorithm and 0.13 m for the weighted centroid method. The proposed algorithm exhibited negative deviations from the reference values at all investigated distances, ranging from –0.02 to –0.09 m. The consistently negative deviations may be associated with the characteristics of the reflected-pulse arrival-time estimation method.
It should be noted that these deviations cannot be regarded as verified values of the absolute systematic measurement error of the developed device, since the metrological characteristics of the reference rangefinder do not allow for the uncertainty of the reference distance to be considered negligible.
An additional measurement uncertainty evaluation was performed, considering uncertainty components evaluated by Type A and Type B methods.
The Type A uncertainty evaluation was based on statistical analysis of repeated measurements. For each investigated target, a dataset consisting of 5000 distance measurements was obtained under identical signal acquisition and processing conditions. The experimental standard deviation was calculated as follows:
where SD—experimental standard deviation, Lj—individual measurement result, and n—number of measurements.
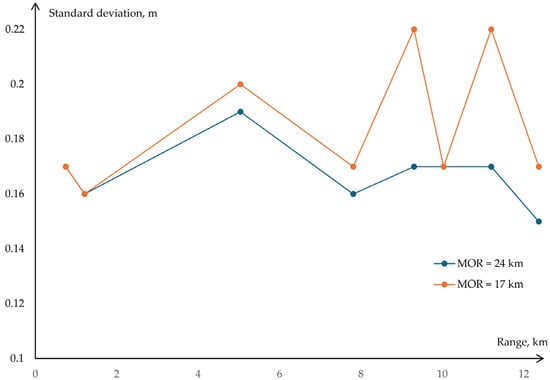
The standard deviation characterizes the random dispersion of individual measurement results. For the proposed algorithm, the obtained values ranged from 0.15 to 0.22 m, depending on target distance and meteorological conditions. The dependence of the standard deviation on target distance under different meteorological conditions is presented in Figure 6.
Figure 6.
Standard deviation versus range at different MOR values.
The standard uncertainty of the mean measurement result was evaluated using the following expression:
where uA—standard uncertainty of the mean measurement result evaluated by the Type A method. For the number of measurements performed, the corresponding standard uncertainty of the mean ranged from 0.0021 to 0.0031 m. This estimate assumes statistical independence of consecutive measurements and characterizes only the random component of the uncertainty of the mean value.
For the Type B uncertainty evaluation, the manufacturer-specified metrological characteristics of the reference rangefinder were considered. Since the manufacturer specifies only the limiting error values without providing information on their probability distribution, a rectangular (uniform) probability distribution within the interval of ±1.5 m was assumed:
where uB—standard uncertainty of the reference distance evaluated by the Type B method.
An additional uncertainty contribution arises from the 0.1 m display resolution of the reference rangefinder. However, this contribution should be considered separately only if its effect is not already included in the manufacturer-specified maximum permissible error. Therefore, to avoid possible double counting, the resolution-related uncertainty was not included as a separate component in the preliminary combined uncertainty evaluation. The combined standard uncertainty of the difference between the measured and reference values was determined as follows:
where uC—combined standard uncertainty. The expanded uncertainty of the comparison, using a coverage factor of k = 2, was calculated as follows:
where U—expanded uncertainty, and k—coverage factor.
U = uCk,
Thus, the uncertainty of the comparison is predominantly determined by the metrological characteristics of the reference rangefinder, which limits the possibility of verifying the absolute ranging error of the developed device at the level of the observed deviations. The presented uncertainty evaluation does not include additional contributions associated with time-base instability, synchronization delays, atmospheric propagation conditions, and the geometry of the reflecting surface. Quantitative evaluation of these components requires a separate investigation and is necessary to establish the complete measurement uncertainty budget of the developed device.
Nevertheless, the obtained results enable an assessment of the influence of echo waveform processing algorithms on measurement repeatability and relative deviations under identical signal acquisition conditions.
7. Discussion
The experimental results showed that the proposed algorithm provides standard deviations ranging from 0.15 to 0.22 m at target distances up to 12.37 km, whereas the corresponding values for the amplitude detection algorithm ranged from 0.26 to 0.63 m. The greatest improvement over the weighted centroid method was observed when processing saturated signals at distances of 750 and 1210 m, where the standard deviation decreased from 0.23 to 0.17 m and from 0.20 to 0.16 m, respectively. For unsaturated signals, the results coincide because both algorithms use the centroid-based pulse position estimation method. The maximum observed deviation of the mean measurement result from the reference value was 0.09 m for the proposed algorithm.
Figure 6 shows two local increases in the standard deviation at MOR = 17 km for target distances of 9.30 and 11.20 km, corresponding to targets with small angular dimensions. For these targets, the standard deviation increased from 0.17 to 0.22 m. A possible explanation is a reduction in the signal-to-noise ratio caused by atmospheric attenuation combined with the small angular dimensions of the targets. Operator-induced pointing errors may also have contributed to this effect, since even a small deviation of the line of sight relative to the target changes the conditions under which the reflected signal is formed and received.
Unlike the approaches discussed in Section 4, the proposed algorithm is intended for a single-channel system with limited computational resources. Its distinguishing feature is the selection of the pulse arrival-time estimation method depending on the presence of receiver saturation, eliminating the need for an additional receiving channel and iterative waveform reconstruction. However, the effectiveness of the method depends on how well the asymmetric pulse model parameters represent the actual reflected-pulse shape. Changes in receiver characteristics or probing conditions may therefore require adjustment of the algorithm parameters.
An additional limitation of the experimental methodology is the uncertainty associated with determining the reference distance. The expanded uncertainty of the comparison was estimated at 1.73 m using a coverage factor of k = 2, which does not allow for the absolute ranging error of the developed device to be verified at the level of the observed deviations. Thus, the presented results demonstrate improved measurement repeatability and reduced relative deviations when processing saturated signals, whereas determination of the complete measurement uncertainty requires additional metrological verification.
8. Conclusions
A single-channel ranging device based on high-speed echo waveform digitization at sampling rates of up to 500 MHz was developed. A signal processing algorithm combining matched filtering with selective pulse position estimation according to the presence of receiver saturation was proposed. This approach enables saturated signals to be processed without additional receiver channels or iterative computations. The hardware implementation also incorporates dynamic gain control and activates the power-consuming receiver components immediately before the start of the ranging cycle.
An experimental comparison of three algorithms using targets located at distances from 750 m to 12.37 km under different meteorological conditions showed that the proposed method provides standard deviations in the range of 0.15–0.22 m. For saturated signals, the standard deviation was reduced to 0.16–0.17 m, compared with 0.20–0.23 m for the weighted centroid method. The maximum observed deviation of the mean measured distance from the reference value was 0.09 m. However, the uncertainty evaluation demonstrated that a more accurate reference measuring instrument is required to verify the absolute ranging error of the developed device.
Future work will focus on investigating the influence of asymmetric pulse model parameters on range estimation, performing additional metrological verification of the measurement channel, and improving noise immunity through machine learning methods for selecting reflected signals within the echo waveform.
Author Contributions
Conceptualization, I.P. and A.U.; methodology, A.U.; software, I.P. and A.U.; validation, I.P., A.U. and D.K.; formal analysis, D.K.; investigation, I.P.; resources, A.U.; data curation, A.U.; writing—original draft preparation, I.P., A.U. and D.K.; writing—review and editing, I.P., A.U. and D.K.; visualization, I.P.; supervision, A.U. and D.K.; project administration, A.U.; funding acquisition, A.U. All authors have read and agreed to the published version of the manuscript.
Funding
This research received no external funding.
Institutional Review Board Statement
Not applicable.
Informed Consent Statement
Not applicable.
Data Availability Statement
The data that support the findings of the present study are available upon request from the authors.
Conflicts of Interest
The authors declare no conflicts of interest.
Abbreviations
The following abbreviations are used in this manuscript:
| ADC | Analog-to-Digital Converter |
| APD | Avalanche Photodiode |
| DC | Direct Current |
| FPGA | Field-Programmable Gate Array |
| LS | Least Squares |
| MCU | Microcontroller Unit |
| MOR | Meteorological Optical Range |
| PGA | Programmable Gain Amplifier |
| SD | Standard Deviation |
| SNR | Signal-to-Noise Ratio |
| TOF | Time of Flight |
References
- Raj, T.; Hashim, F.H.; Huddin, A.B.; Ibrahim, M.F.; Hussain, A. A Survey on LiDAR Scanning Mechanisms. Electronics 2020, 9, 741. [Google Scholar] [CrossRef] [Scilit]
- Roriz, R.; Cabral, J.; Gomes, T. Automotive LiDAR Technology: A Survey. IEEE Trans. Intell. Transp. Syst. 2022, 23, 6282–6297. [Google Scholar] [CrossRef] [Scilit]
- Muzal, M.; Zygmunt, M.; Knysak, P.; Drozd, T.; Jakubaszek, M. Methods of Precise Distance Measurements for Laser Rangefinders with Digital Acquisition of Signals. Sensors 2021, 21, 6426. [Google Scholar] [CrossRef] [Scilit]
- Bellisai, S.; Villa, F.; Tisa, S.; Bronzi, D.; Zappa, F. Indirect Time-of-Flight 3D Ranging Based on SPADs. Proc. SPIE 2012, 8268, 82681C. [Google Scholar] [CrossRef] [Scilit]
- Cho, H.-S.; Kim, C.-H.; Lee, S.-G. A High-Sensitivity and Low-Walk Error LADAR Receiver for Military Application. IEEE Trans. Circuits Syst. I Regul. Pap. 2014, 61, 3007–3015. [Google Scholar] [CrossRef] [Scilit]
- Lim, H. Constant Fraction Discriminator Involving Automatic Gain Control to Reduce Time Walk. IEEE Trans. Nucl. Sci. 2014, 61, 2351–2356. [Google Scholar] [CrossRef] [Scilit]
- Zygmunt, M.; Jakubaszek, M.; Sędek, B.; Drozd, T. Real-Time Measurement Technique of the Echo Signal Magnitude in ToF Laser Scanners. Measurement 2023, 208, 112453. [Google Scholar] [CrossRef] [Scilit]
- Yang, J.; Liu, X.; Gu, G.; Qian, W.; Ren, K.; Zhang, J.; Guo, P.; Gao, Q.; Chen, Q. A Double Threshold Correction Method for Walk Error in Pulsed Laser Ranging System. Infrared Phys. Technol. 2019, 100, 28–36. [Google Scholar] [CrossRef] [Scilit]
- Zheng, H.; Ma, R.; Liu, M.; Zhu, Z. A Linear Dynamic Range Receiver with Timing Discrimination for Pulsed TOF Imaging LADAR Application. IEEE Trans. Instrum. Meas. 2018, 67, 2684–2691. [Google Scholar] [CrossRef] [Scilit]
- Kurtti, S.; Nissinen, J.; Kostamovaara, J. A Wide Dynamic Range CMOS Laser Radar Receiver with a Time-Domain Walk Error Compensation Scheme. IEEE Trans. Circuits Syst. I Regul. Pap. 2017, 64, 550–561. [Google Scholar] [CrossRef] [Scilit]
- Chauve, A.; Mallet, C.; Bretar, F.; Durrieu, S.; Pierrot-Deseilligny, M.; Puech, W. Processing Full-Waveform Lidar Data: Modelling Raw Signals. In Proceedings of the ISPRS Workshop Laser Scanning and SilviLaser (LS SL) 2007, Espoo, Finland, 12–14 September 2007. [Google Scholar]
- Muzal, M.; Zygmunt, M. Analysis of the Impact of Changes in Echo Signal Parameters on the Uncertainty of Distance Measurements in p-ToF Laser Rangefinders. Sensors 2022, 22, 5973. [Google Scholar] [CrossRef] [Scilit]
- Li, S.; Fan, X.; Pan, H.; Yu, Q. A Compensation Method of Saturated Waveform for Space-Borne Laser Altimeter. Remote Sens. 2022, 14, 3158. [Google Scholar] [CrossRef] [Scilit]
- Sun, X.; Abshire, J.B.; Borsa, A.A.; Fricker, H.A.; Yi, D.; DiMarzio, J.P.; Paolo, F.S.; Brunt, K.M.; Harding, D.J.; Neumann, G.A. ICESat/GLAS Altimetry Measurements: Received Signal Dynamic Range and Saturation Correction. IEEE Trans. Geosci. Remote Sens. 2017, 55, 5440–5454. [Google Scholar] [CrossRef]
- Zhou, G.; Zhou, X.; Chen, J.; Jia, G.; Zhu, Q. LiDAR Echo Gaussian Decomposition Algorithm for FPGA Implementation. Sensors 2022, 22, 4628. [Google Scholar] [CrossRef] [Scilit]
- Pisarev, I.S.; Uhov, A.A. Development of a Photodetector Device Based on an Avalanche Photodiode with a Thermal Compensation System. In Proceedings of the IEEE 3rd International Conference on Problems of Informatics, Electronics and Radio Engineering, Novosibirsk, Russia, 15–17 November 2024. [Google Scholar]
- Pisarev, I.S.; Uhov, A.A.; Nikitichev, A.A. Avalanche Photodiode Gain Control Device. RU Patent 242,578, 31 March 2026. [Google Scholar]
- Wang, H.; Li, X.; Xu, L.; Xu, T. LiDAR Ranging System Based on Automatic Gain Control and Timing Discriminators. In Proceedings of the 2017 IEEE International Instrumentation and Measurement Technology Conference (I2MTC), Turin, Italy, 22–25 May 2017. [Google Scholar]
- Yoon, D.; Joo, J.-E.; Park, S.M. Mirrored Current-Conveyor Transimpedance Amplifier for Home Monitoring LiDAR Sensors. IEEE Sens. J. 2021, 21, 5589–5597. [Google Scholar] [CrossRef] [Scilit]
- Choi, Y.; Li, J.; Jung, D.; Choi, S.; Park, S.-M. A CMOS Optoelectronic Transceiver with Concurrent Automatic Power Control for Short-Range LiDAR Sensors. Sensors 2025, 25, 753. [Google Scholar] [CrossRef] [Scilit]
- Li, K.; Guo, J.; Zhao, Y. A CMOS AFE With 37-nA rms Input-Referred Noise and Marked 96-dB Timing DR for Pulsed LiDAR. IEEE Trans. Circuits Syst. I Regul. Pap. 2022, 69, 3565–3578. [Google Scholar] [CrossRef] [Scilit]
- Li, X.; Wang, H.; Yang, B.; Huyan, J.; Xu, L. Influence of Time-Pickoff Circuit Parameters on LiDAR Range Precision. Sensors 2017, 17, 2369. [Google Scholar] [CrossRef] [Scilit]
- Kostamovaara, J.; Kurtti, S.; Ruotsalainen, T. A 35 MHz CMOS Receiver for 3 ns Laser Pulses in Pulsed TOF Laser Ranging. IEEE Trans. Instrum. Meas. 2025, 74, 2009912. [Google Scholar] [CrossRef] [Scilit]
- Qi, B.; Wang, L.; Guo, D.; Wang, C. Energy-Barycenter Based Waveform Centroid Algorithm for Pulse Lidar Ranging System. Remote Sens. 2022, 14, 3938. [Google Scholar] [CrossRef] [Scilit]
- Yan, S.; Yang, G.; Li, Y.; Li, Q.; Zhang, B.; Zhang, Y.; Wang, C. Pulse-Based Machine Learning: Adaptive Waveform Centroid Discrimination for LIDAR System. Infrared Phys. Technol. 2019, 103, 103100. [Google Scholar] [CrossRef] [Scilit]
- Xu, X.; Zhang, H.; Luo, M.; Tan, Z.; Zhang, M.; Yang, H.; Li, Z. Research on target echo characteristics and ranging accuracy for laser radar. Infrared Phys. Technol. 2019, 96, 330–339. [Google Scholar] [CrossRef] [Scilit]
- Bahuguna, K.C.; Sharma, P.; Vasan, N.S.; Gaba, S.P. Laser Range Sensors. Def. Sci. J. 2007, 57, 881–890. [Google Scholar] [CrossRef] [Scilit]
- LaChapelle, J.G. Lidar Detector System Having Range Walk Compensation. U.S. Patent 10,732,281, 4 August 2020. [Google Scholar]

Disclaimer/Publisher’s Note: The statements, opinions and data contained in all publications are solely those of the individual author(s) and contributor(s) and not of MDPI and/or the editor(s). MDPI and/or the editor(s) disclaim responsibility for any injury to people or property resulting from any ideas, methods, instructions or products referred to in the content. |
© 2026 by the authors. Licensee MDPI, Basel, Switzerland. This article is an open access article distributed under the terms and conditions of the Creative Commons Attribution (CC BY) license.