


Abstract
Traditional and COVID-19-specific severity scores are applied in intensive care units (ICUs) to guide decision-making and predict mortality. Since traditional severity scores (APACHE II, SAPS II, SAPS 3, and SOFA) were not originally designed for SARS-CoV-2, this study compared their performance with COVID-19–specific models (Shang-COVID and SEIMC), including a novel distinction between early (≤7 days) and late (>7 days) ICU mortality. Adult ICU COVID-19 patients from the first two pandemic waves in Portugal were included (n = 286). Six scores were calculated, and four outcomes assessed: hospital, ICU, early ICU, and late ICU mortality. Discrimination was assessed using ROC curves with AUCs, 95% CIs, and p-values. AUCs were compared using the Delong test (early vs. late ICU mortality and across scores within each wave) and the Hanley & McNeil test (between waves for each score). Traditional scores demonstrated robust mortality prediction. SEIMC performed well for hospital (AUCwave1 = 0.808; AUCwave2 = 0.724) and ICU mortality (AUCwave1 = 0.805; AUCwave2 = 0.706). SEIMC (AUCwave1 = 0.786; AUCwave2 = 0.800) and Shang-COVID (AUCwave1 = 0.617; AUCwave2 = 0.736) showed potential for early mortality prediction but require further validation and recalibration. Overall performance was superior during the first wave, likely reflecting differences in patient characteristics, viral variants, and health measures. Traditional severity scores demonstrated stable robust prediction of ICU and hospital mortality in COVID-19 cases. Disease-specific scores did not significantly outperform established models, though also showed good predictive ability in some contexts, particularly early ICU mortality. These findings highlight the need for continuous validation and recalibration of predictive tools as clinical contexts evolve.
1. Introduction
The global health crisis caused by the emergence of SARS-CoV-2 in late 2019 and rapidly escalated into a pandemic, placing unprecedented strain on healthcare systems worldwide. Clinical manifestations of COVID-19 varied widely, ranging from mild respiratory symptoms to severe pneumonia, acute respiratory distress syndrome (ARDS), multi-organ failure, and death, with the most critically ill patients requiring admission to intensive care units (ICUs) [1]. In this context, accurate prediction of patient outcomes became paramount for optimizing patient management, guiding decision-making regarding escalation or limitation of care, and ensuring the efficient allocation of limited healthcare resources. Consequentially, both established prognostic scoring systems and tools specifically developed for patients with COVID-19 were applied to estimate morbidity and mortality and help support clinical management across different healthcare settings during the pandemic.
Among the most widely used and well-established scoring systems is the Acute Physiology and Chronic Health Evaluation II (APACHE II) score [2]. It provides a multifaceted assessment of disease severity by integrating various physiological and laboratory parameters, along with acute and chronic health factors, using the worst values recorded during the first 24 h of ICU admission [2]. The APACHE II score has undergone extensive validation, demonstrating its effectiveness in predicting outcomes for ICU patients across a range of pathologies [3,4,5,6,7,8]. In a similar manner, the Simplified Acute Physiology Score II (SAPS II) [9] and SAPS 3 [10] are utilized extensively in the assessment of illness severity within ICUs. The purpose behind the development of these systems was to facilitate the prediction of mortality risk in critically ill patients through the integration of various physiological parameters. SAPS II is based on a combination of physiological and laboratory measures, while SAPS 3 incorporates a broader range of variables, including patient demographic data and clinical characteristics [9,10]. The relative ease with which these systems can be applied is noteworthy, although the accuracy of the results is contingent on the specific disease processes of ICU patients [11]. Another key tool for mortality prediction is the Sequential Organ Failure Assessment (SOFA) score, which was developed to quantify organ dysfunction in critically ill patients [12]. It evaluates multiple organ systems, including respiratory, cardiovascular, hepatic, renal, coagulation and neurological, assigning a score to each based on dysfunction levels. The SOFA score has been extensively utilized in the context of sepsis and other critically ill populations, offering insights into organ failure progression and severity [12,13,14]. It is important to note that the APACHE II, SAPS II and SAPS 3 scores were originally calibrated to predict in-hospital mortality.
While traditional severity scores have been widely employed, their original design did not account for the unique characteristics of SARS-CoV-2. Early in the COVID-19 pandemic, many of these systems proved useful for triage purposes [3,15,16], but their predictive accuracy has been questioned, particularly given the disease’s atypical progression. Hence, the application of these scores within ICUs has been the focus of extensive research during the pandemic. Studies have yielded divergent results, with some indicating that these scores can be useful in the early stages of hospital admission. For example, Wilfong et al. [17] demonstrated that APACHE II and SOFA can effectively predict ICU admission and mortality, with APACHE II performing best with an AUC of 0.851 (95% CI: 0.789–0.917) [17]. However, their utility appears to be more limited in patients already admitted to the ICU. Stephens et al. [18] showed that important scores, including APACHE II, tend to underestimate disease severity and poorly correlate with observed mortality in these cases. These findings give rise to concerns about the applicability of traditional scores in atypical clinical scenarios, such as severe SARS-CoV-2 infections, where pathophysiological and clinical features differ from those of the populations for which these systems were originally developed. Consequently, while scores like APACHE II may offer valuable insights in the early stages of the disease, it is imperative to acknowledge their limitations in monitoring and prognosticating critically ill patients, particularly in emerging disease contexts.
To address the limitations of traditional scoring systems, disease-specific tools have been developed to improve risk assessment and guide clinical decision-making in COVID-19 patients. Among these are the COVID-19 Spanish Society of Infectious Diseases and Clinical Microbiology (SEIMC) score [19] and the Shang-COVID score [20], both designed to predict 30-day mortality or critical illness using clinical and laboratory parameters at hospital admission. The SEIMC score, developed in Spain, utilizes variables such as age, sex, oxygen saturation, neutrophil-to-lymphocyte ratio, estimated glomerular filtration rate, and the presence of dyspnea to estimate the 30-day mortality risk [19]. While it has exhibited favorable predictive performance in hospitalized patients, its implementation in ICU settings and for distinguishing early versus late mortality remains untested. In a similar manner, the Shang-COVID score, originally called the COVID-19 Scoring System (CSS) and developed in China, combines clinical, laboratory, and radiological data to identify patients at high risk of clinical deterioration [20]. Although effective for early risk stratification, like the SEIMC score, it remains a static admission model that has not been evaluated considering the timing of death in the ICU. In a comparative study that evaluated the predictive performance of various COVID-19-specific scoring systems [11], the Shang-COVID severity score achieved the highest accuracy for predicting 30-day mortality (AUC = 0.836), followed by SEIMC (AUC = 0.807), both demonstrating strong predictive value in hospitalized patients [11]. In conclusion, whilst both scores are beneficial in terms of early triage and mortality risk estimation, they do not consider the temporal progression of the disease in critically ill patients.
To date, no COVID-19-specific score has been validated to distinguish early (within 7 days) from late ICU mortality, highlighting a significant gap that this study aims to address. It is also crucial to reassess these scores across different pandemic waves to evaluate their ongoing applicability, as many were initially validated using first-wave populations. Over time, shifts in affected population characteristics, treatment approaches (that evolved from experimental therapies into evidence-based protocols), and the virus itself—involving changes in transmissibility and pathogenicity all around the world, including in Portugal [21]—may have affected the accuracy of early prognostic tools. Studying the distinct features of each wave not only enhances the understanding of these shifts but also supports the refinement of severity scores to better reflect current clinical settings.
Considering the limitations of existing scoring systems and the evolving nature of the pandemic, the present study aimed to compare the performance of traditional severity scores (APACHE II, SAPS II, SAPS 3, and SOFA) with COVID-19-specific scores (Shang-COVID and SEIMC) in predicting mortality among ICU patients with COVID-19 across different pandemic waves in Portugal.
2. Materials and Methods
The present study included patients infected with SARS-CoV-2 who were admitted to the ICU at Hospital de São José, part of Unidade Local de Saúde de São José in Lisbon, Portugal, between 10 March and 22 August 2020 (first wave), and between 23 August and 19 December 2020 (second wave).
Demographic and clinical data, including daily ICU blood test results, were retrieved from the hospital’s electronic medical records system for all COVID-19 patients admitted between March and December 2020. SARS-CoV-2 infection was confirmed using real-time polymerase chain reaction (RT-PCR), and patients younger than 18 years of age and those still hospitalized at the time of data extraction were not considered (n = 321; wave 1: n = 135; wave 2: n = 186). Patients without records of routine ICU blood analyses or with missing information required for severity score calculation were excluded from the analysis (n = 286; wave 1: n = 125; wave 2: n = 161). The final cohort included all remaining patients with documented RT-PCR testing, ICU admission and discharge dates, and hospital discharge information.
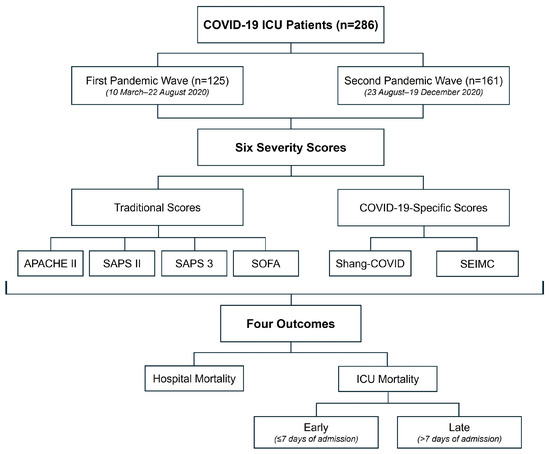
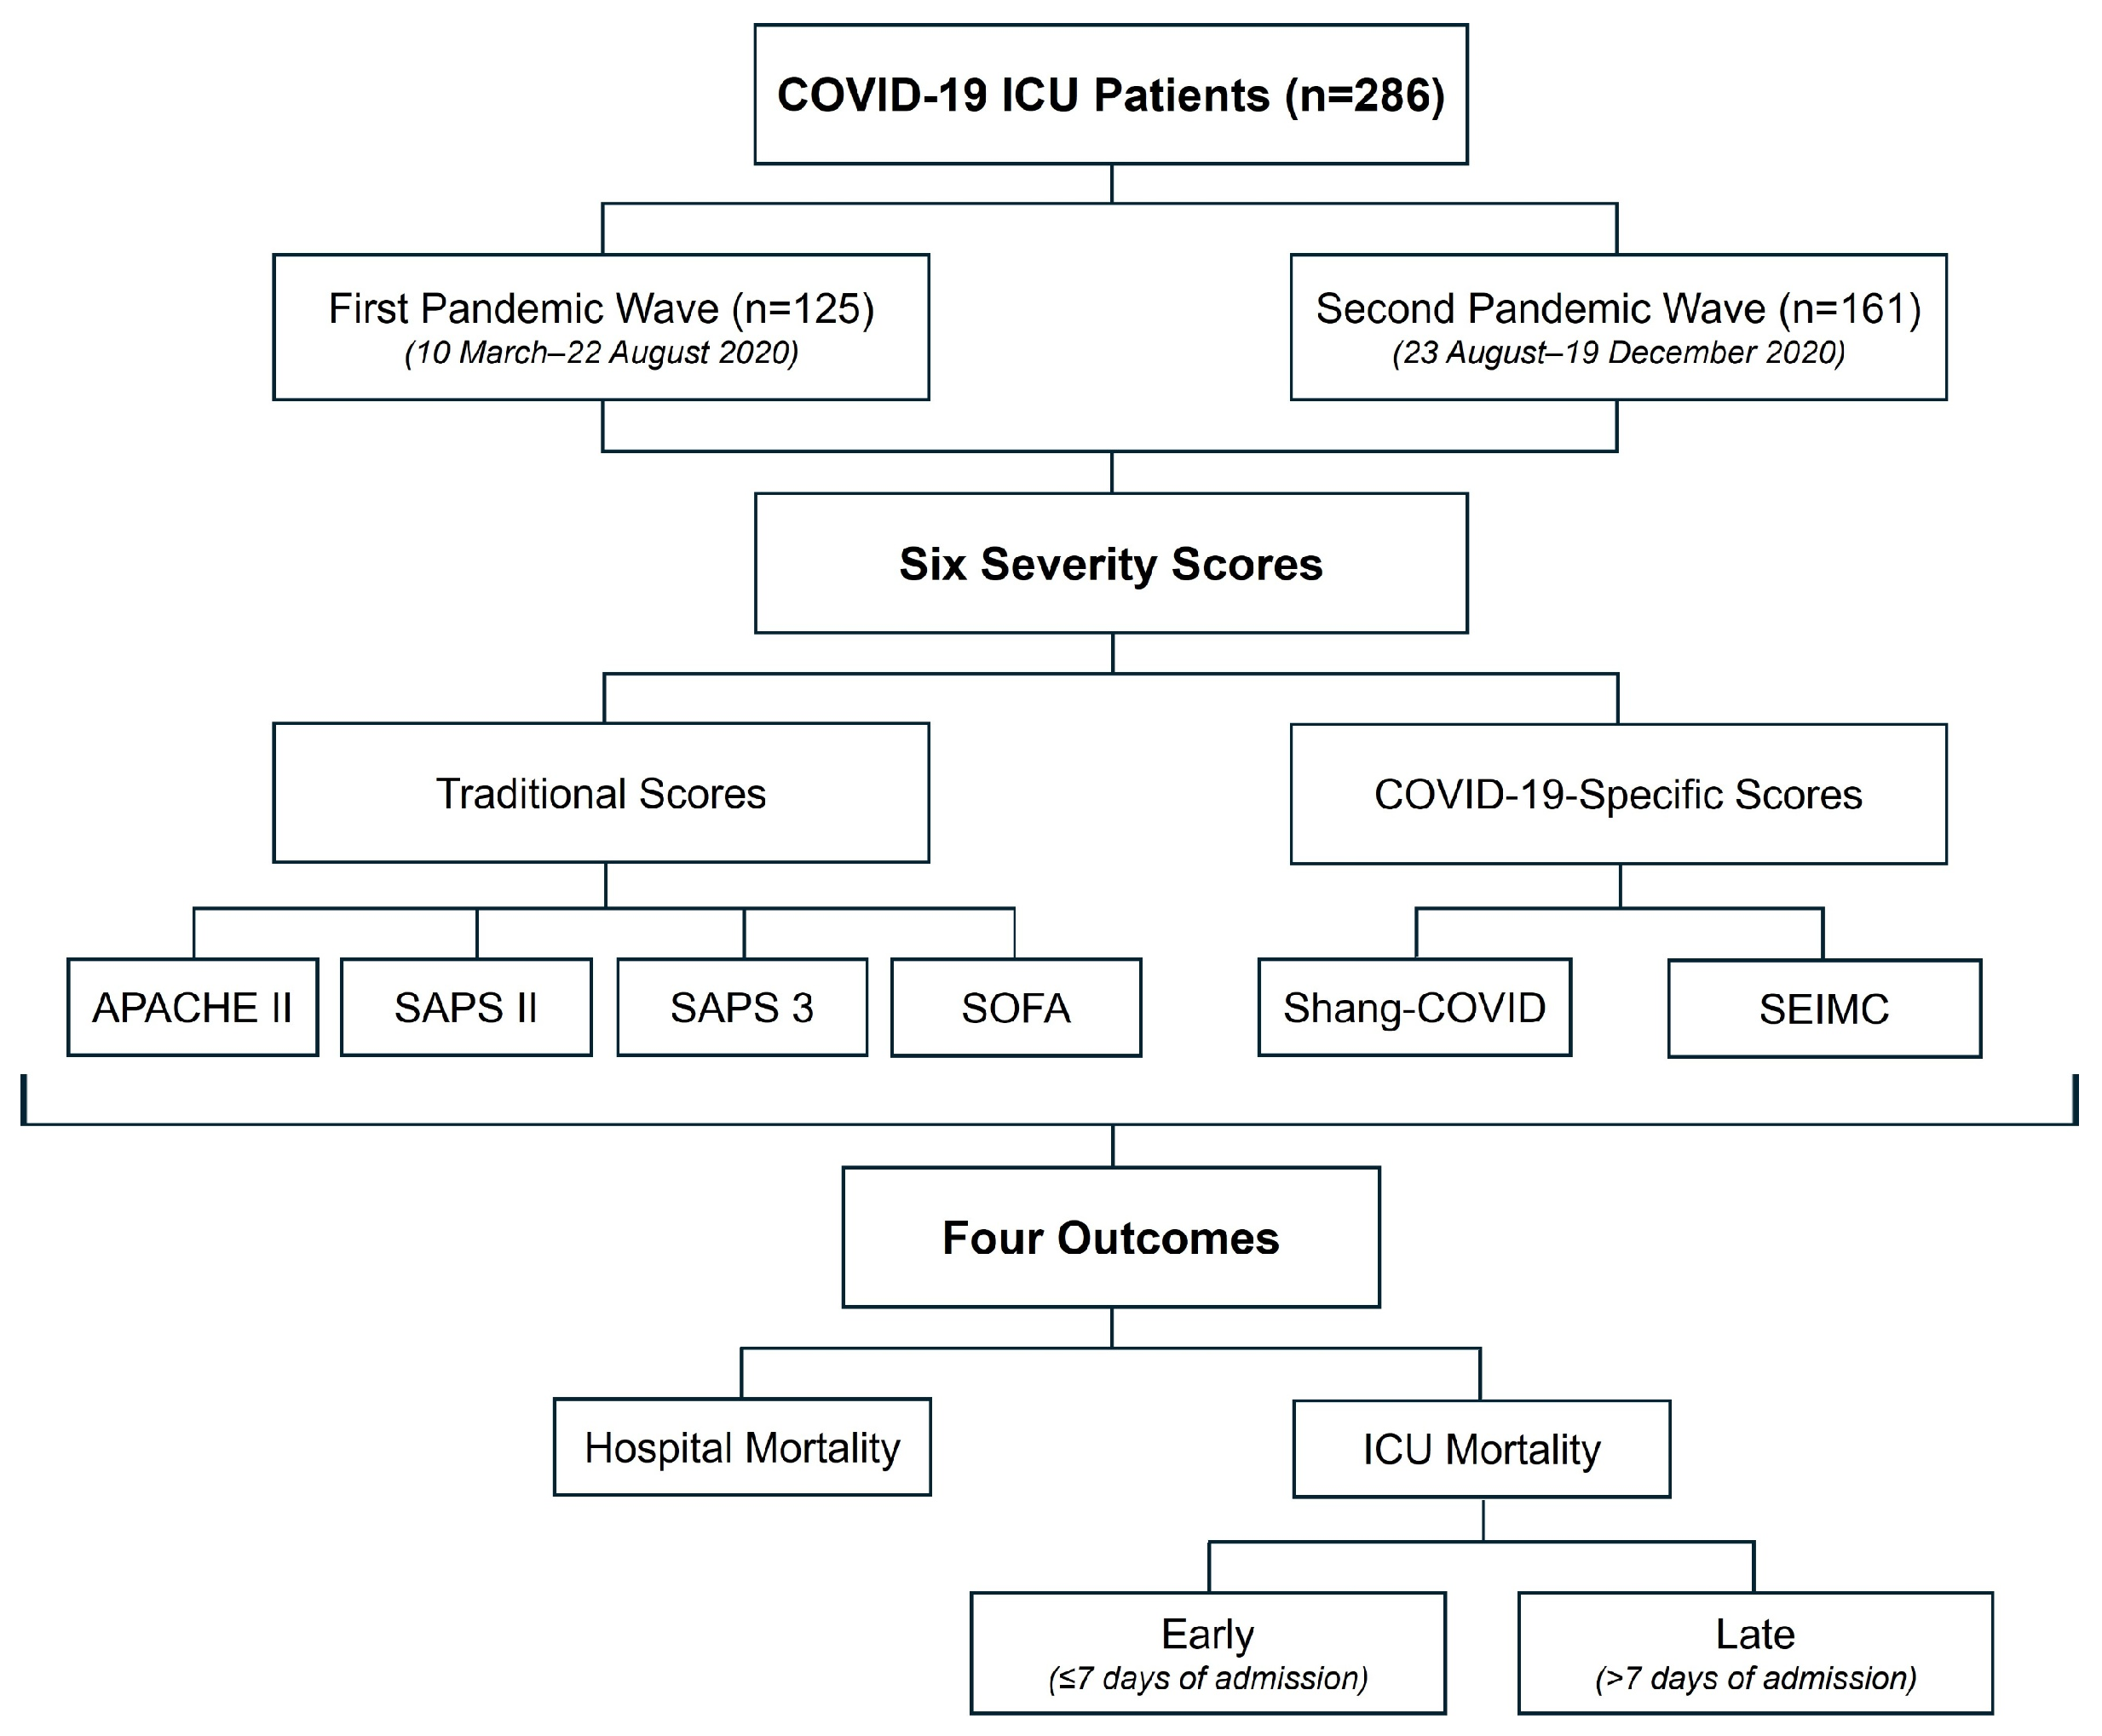
Six severity scores (i.e., APACHE II, SAPS II, SAPS 3, SOFA, Shang-COVID, and SEIMC) were calculated for each patient, and four outcomes were assessed: hospital mortality, ICU mortality, early ICU mortality (death within seven days of ICU admission) and late ICU mortality (death after seven days of ICU admission) (Figure 1). The scores were calculated by a qualified healthcare professional using clinical information obtained from clinical diaries, according to the respective scores’ formulas detailed in the literature.
Figure 1.
Overview of the study design scheme illustrating the patient population, severity scoring systems, and clinical outcomes assessed in critically ill COVID-19 patients.
Clinical data were extracted from the hospital’s database in compliance with anonymity and legal and ethical requirements, including written informed consent and approval by the local Ethics Committee (1043/2021, 20 May 2020).
2.1. Variables
Data for calculating the mentioned scores were extracted from hospital-supplied Excel databases. The way these variables were used was determined by how they were included in the corresponding equations supporting each score. The calculations included a range of demographic, clinical, and laboratory variables, including sex, age, weight, height, body mass index (BMI), the presence of comorbidities, the need for invasive mechanical ventilation (IMV) and/or extracorporeal membrane oxygenation (ECMO), dyspnea, arterial oxygen saturation (SaO2), fraction of inspired oxygen (FiO2), albumin, leukocyte count, neutrophils, lymphocytes, D-dimer, creatinine, diastolic blood pressure, glomerular filtration rate (GFR), lactate dehydrogenase (LDH), C-reactive protein (CRP), procalcitonin (PCT), creatine kinase (CK), and statin use. All scores were calculated using the worst values recorded within the first 24 h of ICU admission.
Respiratory support included IMV, ECMO, and/or high-flow oxygen (HFO), recorded at least one time during patients’ ICU admission. The total number of ICU deaths included both early deaths (within seven days of ICU admission) and late deaths (after seven days of ICU admission). Hospital mortality encompassed all deaths that occurred during ICU stay as well as those that occurred after ICU discharge, while the patients remained hospitalized.
2.2. Statistical Analysis
Categorical variables were represented by their absolute frequencies (percentages), while continuous variables were represented by the mean (standard deviation) or the median (25th–75th percentile), when these were presented with an asymmetric distribution and deviations from normality. To assess the normality of the continuous variables, the Kolmogorov–Smirnov and Shapiro–Wilk tests were used as appropriate. In addition, certain variables were categorized based on the objectives and clinical criteria, while others were recoded. Continuous variables were analyzed using the Mann–Whitney test, and categorical variables were analyzed using chi-squared or Fisher’s exact tests, when the assumptions of the chi-squared test were not met.
The discriminative ability of severity scores concerning death outcomes was assessed by the ROC curve analysis, reporting the AUC estimates with their 95% confidence interval (CI) and p-values. In addition, optimal cut-off values together with the corresponding sensitivity and specificity based on the maximum Youden index were calculated for the six scoring systems in both waves. The Delong test was utilized to ascertain whether the AUC of each score differed significantly between early and late ICU death [22]. Moreover, this test was employed to compare the AUCs corresponding to the various scores within each wave [23]. To compare the AUCs for each severity score between the two waves, the Hanley & McNeil test for comparing independent AUCs was used [24,25].
A significance level of 0.05 was considered. Data were analyzed using IBM SPSS Statistics software, version 29 (IBM Corp., Armonk, NY, USA) and RStudio, version 2022.12.0 (PBC, Boston, MA, USA), with R software, version 4.6.0 (R Core Team, R: A language and environment for statistical computing. R Foundation for Statistical Computing, Vienna, Austria; available at https://www.R-project.org/, accessed on 15 March 2026).
3. Results
3.1. Patient Demographics and Clinical Characteristics
In Table 1, patient demographics and clinical characteristics are presented according to the first and second COVID-19 waves. The two groups of ICU patients (first wave: n = 125; second wave: n = 161) showed a similar median age (67 years), with no significant differences in sex distribution or overall comorbidity burden. Likewise, individual comorbidities, including arterial hypertension, ischemic heart disease, diabetes, chronic respiratory disease, chronic kidney disease, chronic liver disease, dyslipidemia, solid and/or hematologic malignancies, prior stroke, and obesity, did not differ significantly between groups (all p > 0.05). However, a significant reduction in IMV (80.0% vs. 59.0%, p < 0.001), an increase in HFO (12.8% vs. 40.9.0%, p < 0.001), and a higher ICU mortality rate were observed in the second wave (39.8% vs. 21.6%, p = 0.001). Furthermore, late ICU deaths (23.0% vs. 10.4%; p = 0.005) and overall hospital mortality (47.8% vs. 28.0%; p < 0.001) were also significantly higher in the second wave.
Table 1.
Demographic characteristics, respiratory support techniques, clinical outcomes, and severity score results of patients during the first and second waves of the COVID-19 pandemic.
No significant differences were identified in ICU length of stay or in APACHE II, SAPS II, SAPS 3, SOFA, Shang-COVID, or SEIMC scores. Thus, the previously described disparities occurred despite comparable demographic characteristics, comorbidities, and clinical severity scores, suggesting that alternative factors, such as alterations in care dynamics or the disease course itself, may have influenced outcomes.
3.2. Scores’ Discriminative Performance by Outcome
Table 2 presents the AUC values with corresponding 95% confidence intervals and p-values for the six scoring systems across the first and second waves of the pandemic for each of the four studied outcomes. Additionally, the results of the AUC comparisons between the two waves were also included.
Table 2.
Estimated AUCs (95% CIs), p-values, sensitivity, specificity, and cutoffs for the scoring systems across four outcomes during the first and second pandemic waves, including AUC comparisons between waves.
For hospital mortality, all scores demonstrated statistically significant discriminative value (p < 0.05) in both waves. In general, the scores showed better discriminative power in the first wave, but with no significant differences compared to the second wave. The SEIMC score had the highest discriminative ability in the first wave (AUC = 0.808), followed by SAPS 3 and the Shang-COVID score. In the second wave, APACHE II achieved the highest AUC (0.769), with SAPS 3 and SAPS II performing similarly. While most scores showed slight performance improvements in the second wave, the SEIMC and Shang-COVID scores declined. Regarding traditional scores, SOFA and SAPS II exhibited modest improvement but remained among the lower-performing scores. In general, traditional scores showed better discriminative power during the second wave, whereas COVID-19-specific scores performed better in the first wave, but with no significant differences observed.
For ICU mortality, once again all scores showed good discriminative performance. Most scores had a good performance in both waves, even though they showed better discriminative power in the first wave, but without significant differences compared to the second wave. SEIMC led in the first wave (AUC = 0.805), followed by SAPS 3 and APACHE II. In the second wave, APACHE II retained a strong performance (AUC = 0.742), while SEIMC showed reduced discriminative ability. Overall, most scores performed better in the first wave, with COVID-19-specific scores showing the most substantial drops.
Regarding early ICU mortality, SEIMC performed best in the first wave (AUC = 0.786), followed by SOFA and APACHE II. In the second wave, SAPS 3 showed the highest AUC (0.822), with APACHE II and SOFA maintaining strong performance. Notably, the Shang-COVID score, non-significant in the first wave (p = 0.158), improved significantly in the second (AUC = 0.736, p < 0.001). However, there were again no significant differences between the results of the two waves.
For late ICU mortality, SEIMC, SAPS 3 and Shang-COVID showed significantly higher AUCs in the first wave (0.827 vs. 0.641, p = 0.008; 0.822 vs. 0.634, p = 0.009; and 0.803 vs. 0.576, p = 0.004, respectively). The Shang-COVID score, initially strong (AUC = 0.803), lost statistical significance in the second wave (p = 0.173). Overall, the scoring systems generally showed better discriminative performance in the first wave in comparison with the second wave.
3.3. Comparison Between Severity Scores’ Performance by Outcome for Each Wave
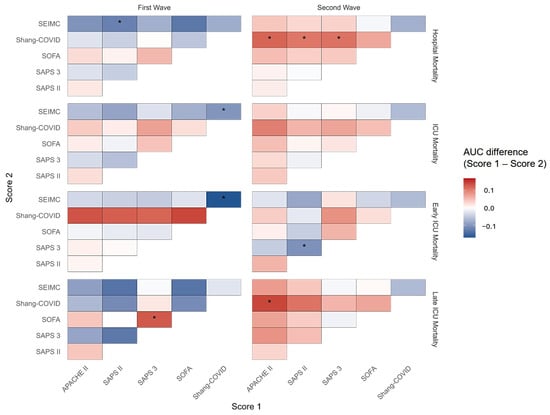
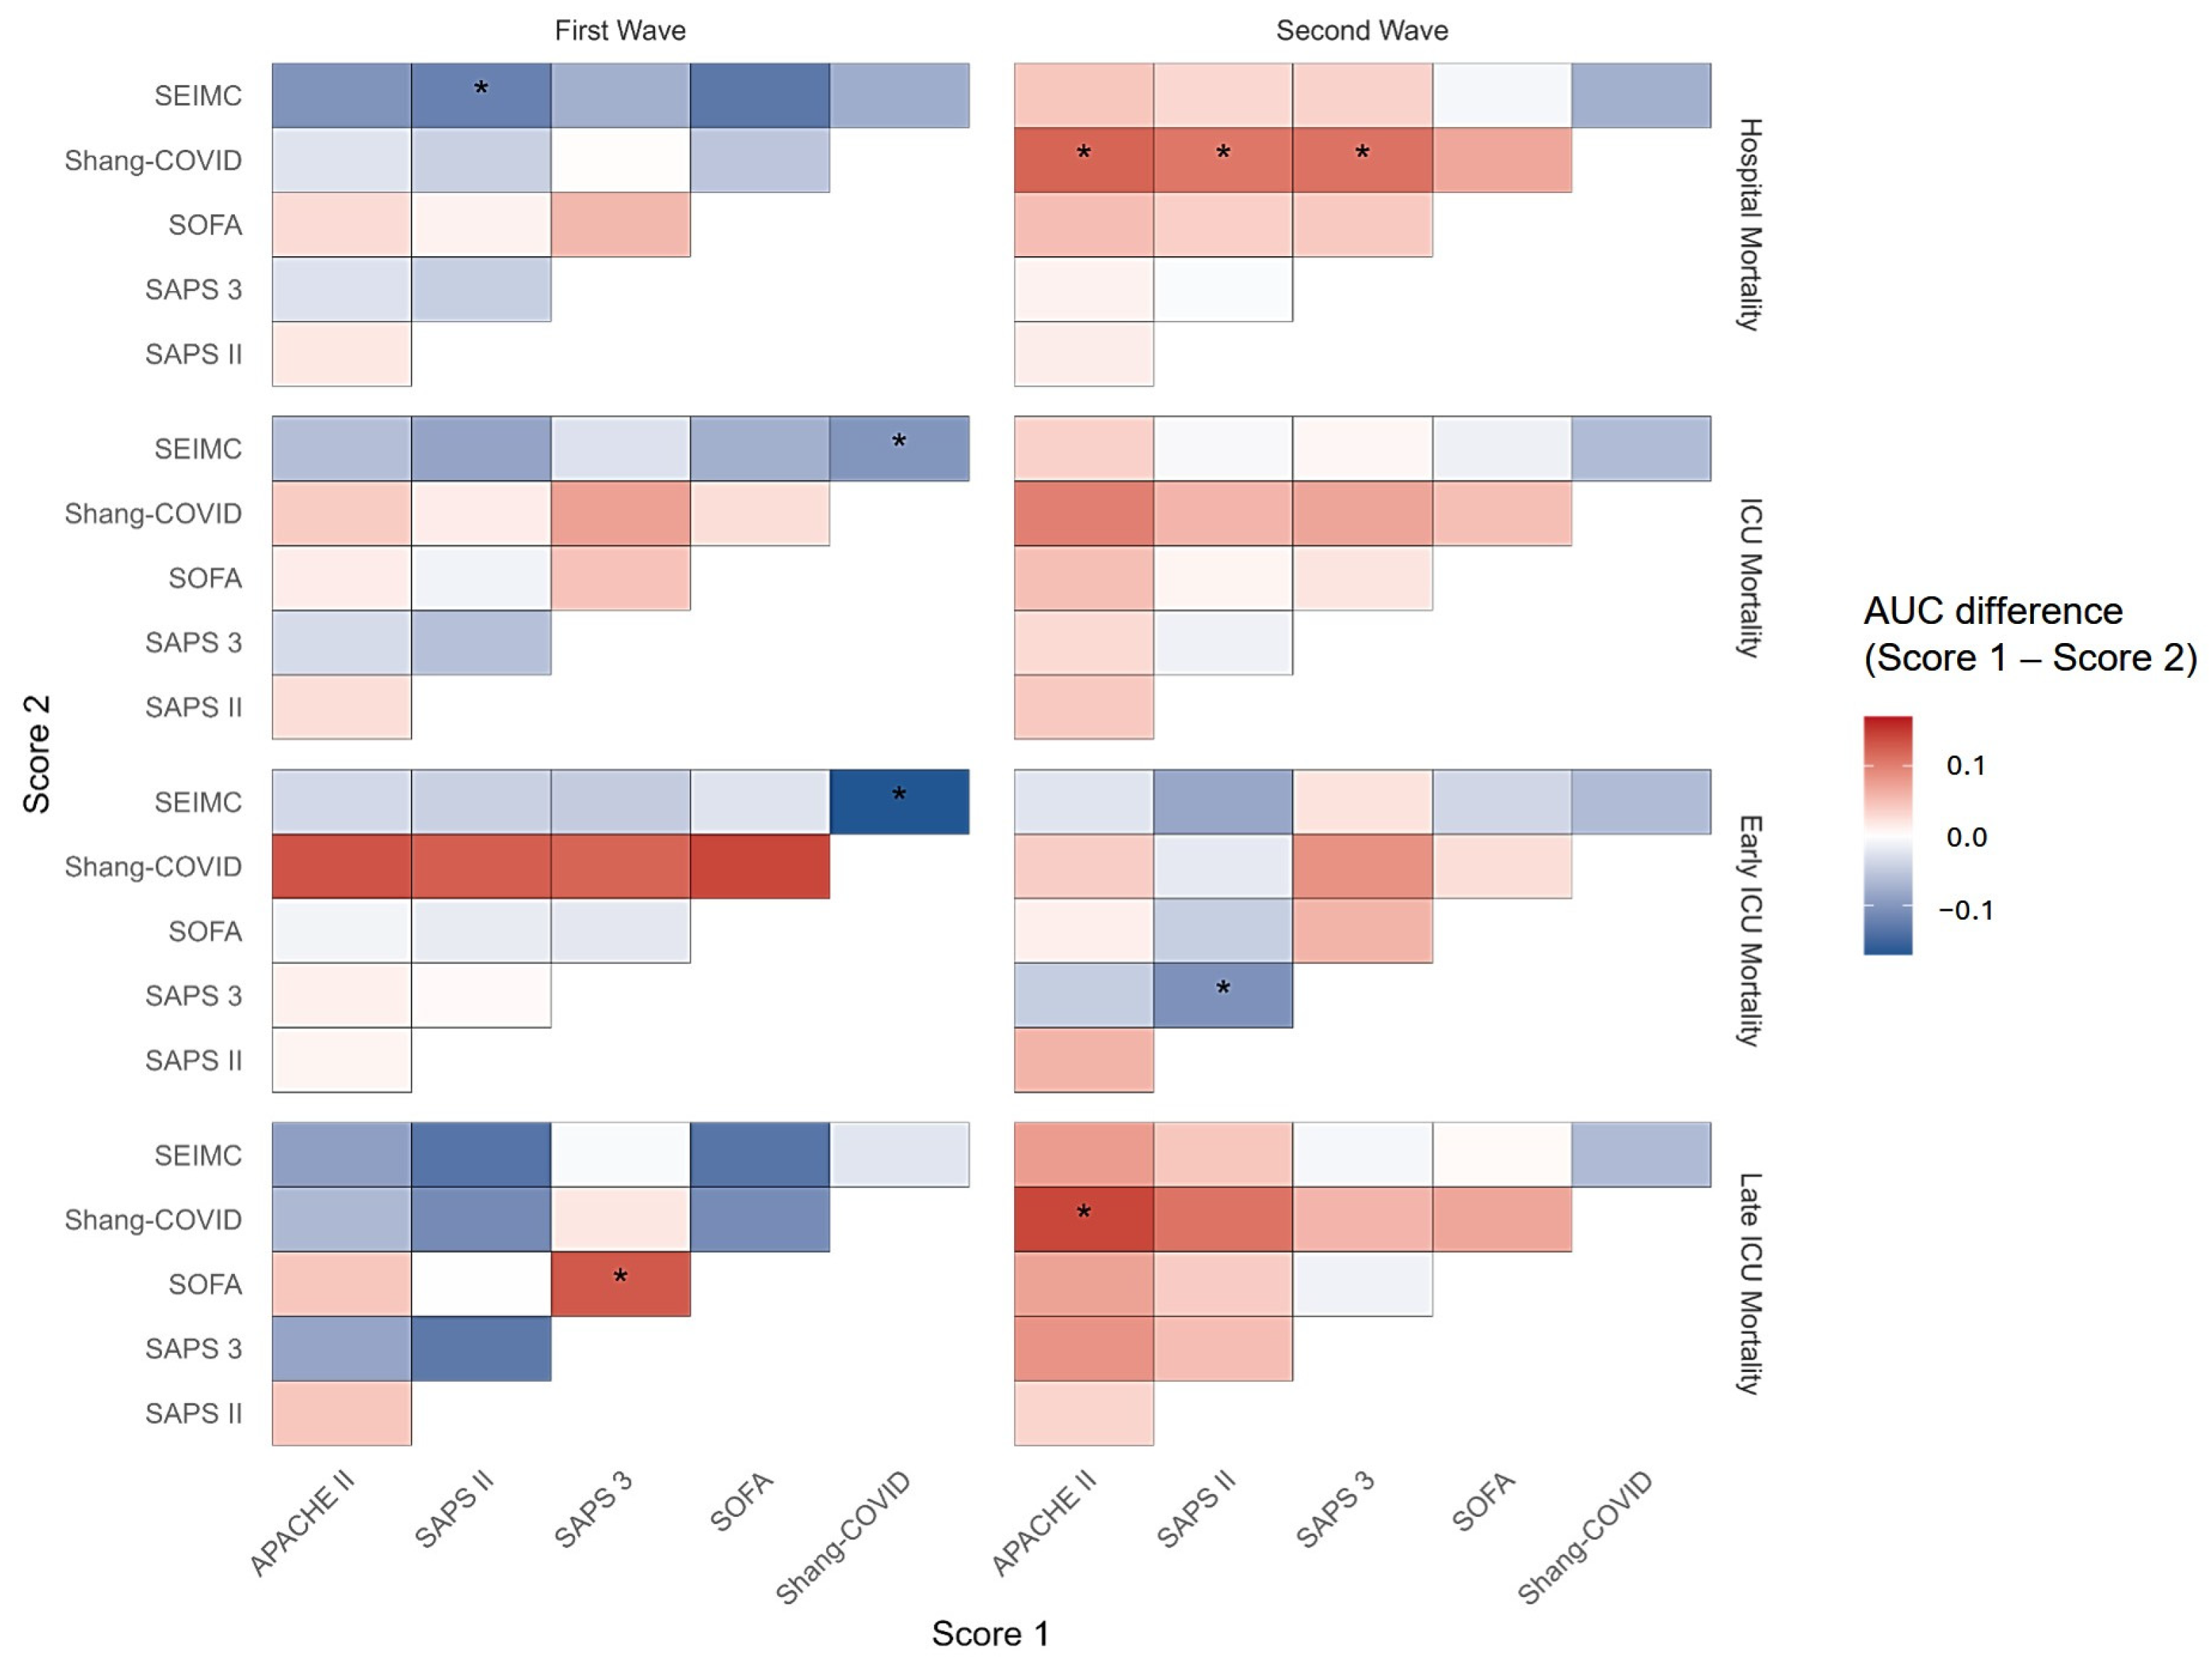
Figure 2 presents a heatmap of pairwise differences in AUCs across the two pandemic waves and four outcomes. This visualization highlights disparities in discriminative performance among the various scoring systems, with statistically significant differences highlighted.
Figure 2.
Heatmap showing pairwise differences in AUCs between scoring systems across the two pandemic waves and for each of the four outcomes. Pairwise differences were calculated as the AUC of the score shown on the x-axis (Score 1) minus the AUC of the score shown on the y-axis (Score 2). Corresponding AUC values are reported in Table 2. * Statistically significant differences based on DeLong’s Test for correlated ROC curves.
Regarding hospital mortality, in the first wave the SEIMC demonstrated significantly superior discrimination in comparison to SAPS II (p = 0.043), thus confirming its stronger predictive capacity. The comparison between Shang-COVID and SEIMC in the first wave almost reached statistical significance (p = 0.051), suggesting a potential trend favoring SEIMC. In the second wave, Shang-COVID performed significantly worse than APACHE II (p = 0.016), SAPS II (p = 0.027), and SAPS 3 (p = 0.017).
Regarding ICU mortality, the Shang-COVID score was significantly inferior to the SEIMC score in the first wave (p = 0.030), thus emphasizing the robustness of the SEIMC score in this context. No significant comparisons were noted in the second wave for this outcome.
For early ICU mortality, Shang-COVID again underperformed relative to SEIMC in the first wave (p = 0.025) and SAPS II performed significantly worse than SAPS 3 in the second wave (p = 0.045). This supports the idea that SAPS 3 had a stronger discriminative ability during that period.
Regarding late ICU mortality, SAPS 3 demonstrated significantly superior performance in the first wave in comparison to SOFA (p = 0.039). Furthermore, APACHE II exhibited superiority over Shang-COVID (p = 0.021). This finding serves to reinforce the hypothesis that Shang-COVID is a less effective tool for predicting this outcome in the second wave, just like for hospital mortality.
3.4. Comparative Performance of Severity Scores in Predicting Early vs. Late ICU Mortality
Results in Table 3 compare the ability of the six severity scoring systems to predict early versus late ICU mortality across the two waves of the pandemic. This comparison was made to evaluate whether differences in AUCs between early and late death were statistically significant.
Table 3.
Early versus late ICU mortality—AUCs comparison by score.
In the first wave, none of the scores showed significant differences in predictive performance between early and late ICU deaths, indicating that the severity scores had similar discriminative ability regardless of the timing of death. In the second wave, however, three scores—SAPS 3, SEIMC, and Shang-COVID—showed statistically significant differences in AUCs, with marked drops in performance predicting late ICU mortality. For SAPS 3, the AUC estimate for early ICU death was 0.822 versus 0.634 for late ICU death, p = 0.003. The substantial drop in AUC for late deaths suggests that SAPS 3 loses discriminative power as patient trajectories become more prolonged or influenced by late ICU complications not captured at admission. The SEIMC score, developed specifically for COVID-19, also had superior performance for early ICU deaths—the AUC estimate for early ICU death was 0.800 versus 0.641 for late ICU death, and p = 0.043. Like SAPS 3, its predictive value decreased for late mortality, possibly due to evolving clinical variables over the ICU course that it does not account for. The Shang-COVID score showed the lowest AUC for late ICU deaths—the AUC estimate for early ICU death was 0.736 versus 0.576 for late ICU death, and p = 0.047. These results suggest limited utility in predicting outcomes for patients who survive beyond the early critical phase. It is more useful for identifying those at risk of early deterioration.
4. Discussion
The COVID-19 pandemic has led to the application and development of severity scores designed to predict the prognosis of hospitalized patients, including in ICUs. Our study compared the predictive performance of six severity scores—four traditional (APACHE II, SAPS II, SAPS 3, SOFA) and two specifically created for COVID-19 (SEIMC and Shang-COVID)—in predicting hospital and ICU mortality among patients admitted during the first two waves of the pandemic in Portugal. In addition to hospital mortality, our study specifically differentiated between early and late ICU mortality, an aspect that has been less thoroughly explored in the existing literature.
When initially looking at patient demographics and clinical characteristics, one notable observation was that patients admitted during the second wave exhibited higher hospital (28.0% vs. 47.8%, p < 0.001) and ICU (21.6% vs. 39.8%, p = 0.001) mortality, being that in this last case the difference was significant only for late ICU mortality (10.4% vs. 23.0%, p = 0.005). This pattern is consistent with previous reports involving overlapping patient populations, with similar baseline characteristics [21,26]. During the first wave of COVID-19 in Portugal, viral circulation was dominated by early European lineages, mainly B.1 and B.1.1 (Pango nomenclature), whereas in the second wave the B.1.177 lineage (Pango), became predominant, largely due to increased mobility and travel across Europe [21]. However, there is no consistent evidence that B.1.177 was associated with greater disease severity, suggesting that the higher mortality during the second wave is more likely explained by epidemiological factors. These included more widespread infection with greater involvement of older and more vulnerable populations (in a pre-vaccination context), a higher overall burden of cases, and increased pressure on the healthcare system, rather that differences in intrinsic variant virulence [21]. Importantly the more marked difference in late ICU mortality, rather than early mortality, suggests that patients in the second wave may have had more severe baseline conditions or developed more complicated clinical courses. This likely reflects a higher risk of complications such as secondary infections and organ dysfunction, contributing to worse outcomes. Furthermore, in both waves, hospital mortality exceeded ICU mortality, with differences of 6.4% in the first wave and 8.0% in the second—a common finding in the literature. According to a recent meta-analysis [27], this difference can range from 3% to 7%. A comparable trend was also reported in a Portuguese study by Santos et al., also involving COVID-19 patients, where hospital mortality was 20.1% compared with an overall ICU mortality of 25.4% [28]. Notably, despite higher mortality in the second wave, the use of IMV decreased, while HFO was more frequently applied, likely reflecting evolving respiratory management strategies and a shift toward less invasive support approaches depending on disease severity. Similar trends have been reported elsewhere, describing an inverse correlation between IMV and HFO use from the first to the second wave, with HFO associated with shorter clinical recovery and a reduced ICU burden compared to prolonged IMV use [21].
Despite the observed differences in mortality, none of the six severity scores differed significantly between the two waves. Considering that these scores were calculated at admission, this suggests that factors beyond baseline severity, such as changes in treatment protocols or variations in disease progression, likely influenced patient outcomes. Similar findings have been described in other international studies comparing the first and second waves, where scores such as SOFA [29,30], SAPS II [29], SAPS 3 [31], and APACHE [32] showed no significant differences between waves. Interestingly, in the study by Asghar et al. [30], SOFA scores obtained both in the first and seventh days of ICU admission also revealed no differences between the two waves, which is consistent with our findings.
When analyzing the discriminative performance of the severity scores by outcome and comparing them between waves, all six scores demonstrated statistically significant discriminative value for both hospital and ICU mortality, with slightly better performance in the first wave. For instance, SEIMC achieved AUCs of 0.808 (0.722–0.895) and 0.805 (0.719–0.891) for hospital and ICU mortality, respectively. Despite being developed using hospital admission data, this score performed well in predicting both outcomes, with similar results to the original validation cohort (AUC of 0.845 (0.819–0.870)) [19]. Shang-COVID also showed good results, particularly for late ICU mortality in the first wave (AUC = 0.803 (0.702–0.904)). However, performance for hospital mortality (its original target) decreased (AUC = 0.730), especially in the second wave (AUC = 0.648), differing notably from the original training cohort (AUC = 0.919, with calibration p = 0.264) [20]. This overall improved performance of the scores in the first wave may be attributed to more consistent admission criteria and case selection during the early phase of the pandemic, when ICU admission was often limited to patients with clearly severe presentations. In contrast, during the second wave, evolving treatment protocols, resource strain, and broader admission criteria may have introduced more variability, making outcomes less predictable by baseline severity scores.
After evaluating the performance of each severity score individually, comparisons were made between the scores’ predictive performance by outcome within each wave, to assess whether COVID-19-specific scores offered any advantage over traditional scoring systems. In the first wave, although the SEIMC score showed notably better performance than the traditional SAPS II for predicting hospital mortality (p = 0.030), overall, no statistically significant differences were observed between the two types of scores. However, in the second wave, traditional scores appeared to outperform the COVID-19-specific ones. Notably, SAPS II (p = 0.027), SAPS 3 (p = 0.017), and APACHE II (0.016) significantly outperformed the Shang-COVID score for hospital mortality, and APACHE II also demonstrated superior performance over Shang-COVID for late ICU mortality (p = 0.021). This observation is consistent with the original design of SAPS II, SAPS 3, and APACHE II, which were specifically developed for the prediction of hospital mortality, thereby explaining their superior performance in this context. Hence, the indication that conventional scoring systems may offer greater prognostic value during the second wave could be associated with the clinical progression of patients infected with SARS-CoV-2. This is particularly relevant in cases of late ICU mortality and hospital mortality, which often involve patients with more severe or prolonged illness, frequently influenced by underlying diseases or comorbidities, and who are at higher risk of developing secondary complications such as hospital-acquired bacterial infections. It is hypothesized that traditional severity scores may be more effective in capturing the impact of these secondary complications. Recognizing their ability to reflect such evolving clinical dynamics may support more tailored risk stratification and prognostication, especially when considering the timing and trajectory of patient deterioration. Therefore, it is necessary to highlight the ability of conventional severity scoring systems in predicting mortality during emerging disease outbreaks like COVID-19, comparing to disease-specific scores that did not show significant advantage.
From another perspective, when comparing the COVID-19-specific scores, although the Shang-COVID severity score has previously demonstrated high predictive accuracy for 30-day mortality, reportedly achieving an AUC of 0.836 and outperforming the SEIMC score (AUC = 0.807) in the comparative study by Chung et al. [11], our findings reveal a more nuanced performance profile. Across both the first and second waves of the pandemic, the Shang-COVID score consistently exhibited significantly lower discriminative ability compared to the SEIMC score in predicting hospital mortality (p = 0.051), ICU mortality (p = 0.030) during the first wave, and early ICU mortality (p = 0.025). These results suggest that, while the Shang-COVID score may demonstrate efficacy in specific populations or settings, the SEIMC score exhibited superior and more consistent predictive accuracy across a range of clinical outcomes within our cohort. Such discrepancies may be attributable to variations in treatment protocols. It is possible that the SEIMC score may be more suited to the characteristics of the Portuguese population, given that it is a score created in Spain (Iberian Peninsula). This highlights the importance of external validation of prognostic models across diverse clinical contexts before widespread application.
Beyond analyzing and comparing the performance of severity scores across the first two waves of the pandemic, this study also examined mortality from a different perspective by distinguishing between early and late ICU mortality. Early ICU mortality referred to deaths occurring within seven days of ICU admission, often reflecting the initial severity of the disease and existing comorbidities. Late ICU mortality, on the other hand, encompassed deaths after seven days, frequently associated with complications such as secondary infections, organ failure, or prolonged mechanical ventilation. Recognizing this distinction allows for a more nuanced understanding of disease progression and the timing of clinical interventions. In this regard, scores like SAPS 3 and APACHE II demonstrated good discriminative capacity, highlighting their continued relevance for predicting specific outcomes in critical care settings. SAPS 3 performance was indeed relatively high in the first wave (AUC = 0.738) but significantly declined in the second (AUC = 0.634). However, its predictive ability was stronger for early ICU mortality, with AUCs of 0.738 and 0.822 in the first and second waves, respectively. In the second wave, it even significantly outperformed SAPS II (p = 0.045). These findings align with the original SAPS 3 study [10], which reported an AUC of 0.830 (0.824–0.838) for ICU mortality with data from the 24 h of admission, across various regions. This highlights the potential use of already existing severity scores to identify COVID-19 patients at risk of dying within the first 7 days of ICU admission. This time frame proved to be clinically meaningful. By distinguishing these high-risk patients using models like not only SAPS 3, but also SEIMC as formerly mentioned, clinicians could increase monitoring and allocate resources more efficiently, potentially improving outcomes through earlier interventions. This strategy highlights a promising avenue for risk-based ICU management, in which predictive scores guide clinical decision-making beyond initial triage.
Limitations
This study involved the collection of clinical data during the COVID-19 pandemic in Portugal, presenting some methodological and data-related constraints that should be considered when interpreting the results. First, this is a single-center retrospective study restricted to two pandemic waves, which limits the overall sample size and reduces statistical power, particularly for subgroup analyses such as early and late ICU mortality, where the number of events was relatively small. These factors may compromise the ability to detect more subtle effects and limit the generalizability of the findings to broader and more diverse populations.
Second, the presence of missing data, especially in key variables required for score calculation, led to the exclusion of a small proportion of patients with incomplete records, which could have introduced some degree of selection bias. However, the number of excluded patients was relatively small (n = 35 out of the total ICU COVID-19 admissions in the study period), and missingness appeared to occur at random, suggesting that the impact of this bias is likely limited. Nonetheless, this should be taken into account when interpreting the results.
Third, although optimal cut-off values together with sensitivity and specificity were provided for the main scoring systems, these analyses were included for exploratory and comparative purposes only. Given the relatively small cohort size, these parameters should not be interpreted as definitive thresholds for clinical application. Furthermore, calibration analyses were not performed, as robust assessments of calibration require larger cohorts to ensure reliable and clinically meaningful estimates.
Given these limitations, the findings in this study should be interpreted with caution, as some observed AUC values were moderate rather than high. External validation in larger, multicenter cohorts is therefore essential to confirm these results and to more robustly assess both discrimination and calibration of these scoring systems in critically ill COVID-19 patients. Overall, these constraints reinforce that the analyses were primarily intended for comparative purposes and highlight the need for further studies using larger and more representative datasets.
5. Conclusions
Our findings underscore the robustness of classical severity scores in predicting mortality in emerging diseases like COVID-19. In our analysis, COVID-specific scores did not present significantly better performance than traditional models, reinforcing the idea that well-established scoring systems such as SAPS 3 retain strong prognostic value even in novel clinical contexts. Nonetheless, the good performance of the SEIMC score in predicting both hospital (AUC1stwave = 0.808; AUC2ndwave = 0.724) and ICU mortality (AUC1stwave = 0.805; AUC2ndwave = 0.706) in Portugal was consistent with findings from international studies, emphasizing the importance of local validation of severity scores.
In general, better results were observed in the first wave. Hence, it is important to remember that these COVID-19-specific scores were developed and validated using data from patients affected during the first wave of the pandemic, when the SARS-CoV-2 emerged. These early populations differed not only in demographic, clinical, and genetic characteristics compared to those in later waves, but also in the public health measures and clinical management regulations applied at the time (both in hospitals and the broader community). Another important difference was the virus strain, as the emergence of new variants and evolving patterns of disease likely influenced the accuracy of these models, whose validation cohorts no longer reflected the evolving clinical context.
These findings underscore the complex nature of COVID-19 in critically ill patients and the challenges in predicting outcomes. While established severity scores like SAPS II, SAPS 3, SOFA and APACHE II demonstrated good overall performance, newer COVID-specific scores like SEIMC (AUC1stwave = 0.786; AUC2ndwave = 0.800) and Shang-COVID (AUC1stwave = 0.617; AUC2ndwave = 0.736) showed promise for early mortality prediction. This highlights the importance of using appropriate scoring systems for different aspects of mortality risk assessment in COVID-19 patients, which can aid clinical decision-making and resource allocation in intensive care settings. Importantly, given the relatively limited sample size of the present study, these findings should be interpreted with caution, as they were intended for comparative purposes, and further validation in larger, multicenter cohorts is warranted to strengthen their generalizability and clinical applicability.
Future perspectives in the use of severity scores for COVID-19 prognosis should focus on enhancing their accuracy and applicability across different waves and patient populations. While traditional scores have shown consistent predictive value, their performance can be influenced by shifts in demographics, treatment protocols, and healthcare resources over time. Similarly, COVID-specific scores show promise but require ongoing validation as the disease and its variants evolve. Therefore, continuous validation and recalibration of these scores is necessary to maintain their relevance and ensure they reflect the evolving nature of the disease and its management.
Author Contributions
D.A.M., C.P.V.R., I.P. and L.B.: Conceptualization; D.A.M., C.P.V.R. and I.P.: Data curation; D.A.M., C.P.V.R. and I.P.: Formal analysis; C.R.C.C. and L.B.: Funding acquisition; All authors: Investigation; D.A.M., C.P.V.R., I.P. and L.B.: Methodology; C.R.C.C. and L.B.: Project administration; C.R.C.C. and L.B.: Resources; C.R.C.C., L.B. and I.P.: Supervision; C.P.V.R.: Visualization; D.A.M., C.P.V.R. and I.P.: Writing—original draft; All authors: Writing—review and editing. All authors have read and agreed to the published version of the manuscript.
Funding
This research was supported by national funds from the Fundação para a Ciência e Tecnologia (FCT), I.P., under the following grants: DSAIPA/DS/0117/2020, UIDB/00297/2020 (https://doi.org/10.54499/UIDB/00297/2020) and UIDP/00297/2020 (https://doi.org/10.54499/UIDP/00297/2020). Additional support was provided by FCT through the project with reference 2023.01951.BD (https://doi.org/10.54499/2023.01951.BD).
Institutional Review Board Statement
This study was performed in line with the principles of the Declaration of Helsinki. Approval was granted by the institutional Ethics Committee of Unidade Local de Saúde São José (ULS São José), Lisbon, Portugal, specifically Comissão de Ética para a Saúde, on 20 May 2020 (number 1043/2021), in the scope of the Predictive Models of COVID-19 Outcomes for Higher Risk Patients Towards a Precision Medicine (PREMO) project.
Informed Consent Statement
Informed consent was obtained from all subjects involved in the study and approval was obtained before collecting any data.
Data Availability Statement
The datasets used for this study are available from the corresponding author on reasonable request.
Conflicts of Interest
The authors declare no conflict of interest.
References
- Li, X.; Mi, Z.; Liu, Z.; Rong, P. SARS-CoV-2: Pathogenesis, therapeutics, variants, and vaccines. Front. Microbiol. 2024, 15, 1334152. [Google Scholar] [CrossRef] [Scilit]
- Knaus, W.A.; Draper, E.A.; Wagner, D.P.; Zimmerman, J.E. APACHE II: A severity of disease classification system. Crit. Care Med. 1985, 13, 818–829. [Google Scholar] [CrossRef] [Scilit]
- Yildrim, S.; Kirakli, C. Accuracy of conventional disease severity scores in predicting COVID-19 ICU mortality: Retrospective single-center study in Turkey. Ann. Saudi Med. 2022, 42, 408–414. [Google Scholar] [CrossRef] [Scilit]
- Mumtaz, H.; Ejaz, M.K.; Tayyab, M.; Vohra, L.I.; Sapkota, S.; Hasan, M.; Saqib, M.M. APACHE scoring as an indicator of mortality rate in ICU patients: A cohort study. Ann. Med. Surg. 2023, 85, 416–421. [Google Scholar] [CrossRef] [Scilit]
- Tian, Y.; Yao, Y.; Zhou, J.; Diao, X.; Chen, H.; Cai, K.; Ma, X.; Wang, S. Dynamic APACHE II Score to Predict the Outcome of Intensive Care Unit Patients. Front. Med. 2022, 8, 744907. [Google Scholar] [CrossRef] [Scilit]
- Ahmed, Y.; Adam, M.; Bakkar, L.M. Effectiveness of APACHE II and SAPS II scoring models in foreseeing the outcome of critically ill COPD patients. Egypt. J. Bronchol. 2019, 13, 654–659. [Google Scholar] [CrossRef] [Scilit] [PubMed]
- Headley, J.; Theriault, R.; Smith, T.L. Independent validation of apache ii severity of illness score for predicting mortality in patients with breast cancer admitted to the intensive care unit. Cancer 1992, 70, 497–503. [Google Scholar] [CrossRef] [Scilit] [PubMed]
- Patel, P.; Gupta, S.; Patel, H.; Bashar, M.A. Assessment of APACHE II Score to Predict ICU Outcomes of Patients with AKI: A Single Center Experience from Haryana, North India. Indian J. Crit. Care Med. 2022, 26, 276–281. [Google Scholar] [CrossRef] [Scilit] [PubMed]
- Gall, J.R.; Lemeshow, S.; Saulnier, F. A New Simplified Acute Physiology Score (SAPS II) Based on a European/North American Multicenter Study. JAMA 1993, 270, 2957–2963. [Google Scholar] [CrossRef] [Scilit]
- Moreno, R.P.; Metnitz, P.G.H.; Almeida, E.; Jordan, B.; Bauer, P.; Campos, R.A.; Iapichino, G.; Edbrooke, D.; Capuzzo, M.; Le Gall, J.-R. SAPS 3—From evaluation of the patient to evaluation of the intensive care unit. Part 2: Development of a prognostic model for hospital mortality at ICU admission. Intensive Care Med. 2005, 31, 1345–1355. [Google Scholar] [CrossRef] [Scilit]
- Chung, H.P.; Tang, Y.H.; Chen, C.Y.; Chen, C.H.; Chang, W.K.; Kuo, K.C.; Chen, Y.-T.; Wu, J.-C.; Lin, C.-Y.; Wang, C.-J. Outcome prediction in hospitalized COVID-19 patients: Comparison of the performance of five severity scores. Front. Med. 2023, 10, 1121465. [Google Scholar] [CrossRef] [Scilit] [PubMed]
- Vincent, J.L.; Moreno, R.; Takala, J.; Willatts, S.; De Mendonça, A.; Bruining, H.; Reinhart, C.K.; Suter, P.M.; Thijs, L.G. The SOFA (Sepsis-related Organ Failure Assessment) score to describe organ dysfunction/failure. Intensive Care Med. 1996, 22, 707–710. [Google Scholar] [CrossRef]
- Li, W.; Wang, M.; Zhu, B.; Zhu, Y.; Xi, X. Prediction of median survival time in sepsis patients by the SOFA score combined with different predictors. Burn. Trauma 2020, 8, tkz006. [Google Scholar] [CrossRef] [Scilit] [PubMed]
- Qiu, X.; Lei, Y.P.; Zhou, R.X. SIRS, SOFA, qSOFA, and NEWS in the diagnosis of sepsis and prediction of adverse outcomes: A systematic review and meta-analysis. Expert Rev. Anti Infect. Ther. 2023, 21, 891–900. [Google Scholar] [CrossRef] [Scilit]
- Vicka, V.; Januskeviciute, E.; Miskinyte, S.; Ringaitiene, D.; Serpytis, M.; Klimasauskas, A.; Jancoriene, L.; Sipylaite, J. Comparison of mortality risk evaluation tools efficacy in critically ill COVID-19 patients. BMC Infect. Dis. 2021, 21, 1173. [Google Scholar] [CrossRef] [Scilit]
- Monk, M.; Torres, J.; Vickery, K.; Jayaraman, G.; Sarva, S.T.; Kesavan, R. A Comparison of ICU Mortality Scoring Systems Applied to COVID-19. Cureus 2023, 15, e35423. [Google Scholar] [CrossRef] [Scilit]
- Wilfong, E.M.; Lovly, C.M.; Gillaspie, E.A.; Huang, L.C.; Shyr, Y.; Casey, J.D.; Rini, B.I.; Semler, M.W. Severity of illness scores at presentation predict ICU admission and mortality in COVID-19. J. Emerg. Crit. Care Med. 2021, 5, 7. [Google Scholar] [CrossRef] [Scilit]
- Stephens, J.R.; Stümpfle, R.; Patel, P.; Brett, S.; Broomhead, R.; Baharlo, B.; Soni, S. Analysis of Critical Care Severity of Illness Scoring Systems in Patients with Coronavirus Disease 2019: A Retrospective Analysis of Three U.K. ICUs. Crit. Care Med. 2020, 49, e105–e107. [Google Scholar] [CrossRef] [Scilit]
- Berenguer, J.; Borobia, A.M.; Ryan, P.; Rodríguez-Baño, J.; Bellón, J.M.; Jarrín, I.; Carratalà, J.; Pachón, J.; Carcas, A.J.; Yllescas, M.; et al. Development and validation of a prediction model for 30-day mortality in hospitalised patients with COVID-19: The COVID-19 SEIMC score. Thorax 2021, 76, 920–929. [Google Scholar] [CrossRef] [Scilit]
- Shang, Y.; Liu, T.; Wei, Y.; Li, J.; Shao, L.; Liu, M.; Zhang, Y.; Zhao, Z.; Xu, H.; Peng, Z.; et al. Scoring systems for predicting mortality for severe patients with COVID-19. eClinicalMedicine 2020, 24, 100426. [Google Scholar] [CrossRef] [Scilit] [PubMed]
- Von Rekowski, C.P.; Pinto, I.; Fonseca, T.A.H.; Araújo, R.; Calado, C.R.C.; Bento, L. Analysis of six consecutive waves of ICU-admitted COVID-19 patients: Key findings and insights from a Portuguese population. Geroscience 2025, 47, 2399–2422. [Google Scholar] [CrossRef] [Scilit]
- DeLong, E.R.; DeLong, D.M.; Clarke-Pearson, D.L. Comparing the areas under two or more correlated receiver operating characteristic curves: A nonparametric approach. Biometrics 1988, 44, 837–845. [Google Scholar] [CrossRef] [Scilit] [PubMed]
- Robin, X.; Turck, N.; Hainard, A.; Tiberti, N.; Lisacek, F.; Sanchez, J.C.; Müller, M. pROC: An open-source package for R and S+ to analyze and compare ROC curves. BMC Bioinform. 2011, 12, 77. [Google Scholar] [CrossRef] [Scilit]
- McNeil, B.J.; Hanley, J.A. Statistical Approaches to the Analysis of Receiver Operating Characteristic (ROC) Curves. Med. Decis. Mak. 1984, 4, 137–150. [Google Scholar] [CrossRef] [Scilit]
- Hanley, J.A.; McNeil, B.J. The meaning and use of the area under a receiver operating characteristic (ROC) curve. Radiology 1982, 143, 29–36. [Google Scholar] [CrossRef] [Scilit]
- Von Rekowski, C.P.; Fonseca, T.A.H.; Araújo, R.; Brás-Geraldes, C.; Calado, C.R.C.; Bento, L.; Pinto, I. The Characteristics and Laboratory Findings of SARS-CoV-2 Infected Patients during the First Three COVID-19 Waves in Portugal—A Retrospective Single-Center Study. Medicina 2024, 60, 59. [Google Scholar] [CrossRef] [Scilit]
- Hosein, F.S.; Roberts, D.J.; Turin, T.C.; Zygun, D.; Ghali, W.A.; Stelfox, H.T. A Meta-Analysis to Derive Literature-Based Benchmarks for Readmission and Hospital Mortality after Patient Discharge from Intensive Care. Crit. Care 2014, 18, 715. [Google Scholar] [CrossRef] [Scilit]
- Santos, M.M.S.; Pereira, I.J.; Cuboia, N.; Reis-Pardal, J.; Adrião, D.; Cardoso, T.; Aragão, I.; Santos, L.; Sarmento, A.; Rosa, R.G.; et al. Predictors of Early and Long-Term Mortality after ICU Discharge in Critically Ill COVID-19 Patients: A Prospective Cohort Study. PLoS ONE 2023, 18, e0293883. [Google Scholar] [CrossRef] [Scilit] [PubMed]
- Contou, D.; Fraissé, M.; Pajot, O.; Tirolien, J.A.; Mentec, H.; Plantefève, G. Comparison between first and second wave among critically ill COVID-19 patients admitted to a French ICU: No prognostic improvement during the second wave? Crit. Care 2021, 25, 3. [Google Scholar] [CrossRef] [Scilit] [PubMed]
- Asghar, M.S.; Yasmin, F.; Ahsan, M.N.; Alvi, H.; Taweesedt, P.; Surani, S. Comparison of first and second waves of COVID-19 through severity markers in ICU patients of a developing country. J. Community Hosp. Intern. Med. Perspect. 2021, 11, 576–584. [Google Scholar] [CrossRef] [Scilit]
- Darlington, P.; Roël, M.; Cronhjort, M.; Hanna, G.; Hedman, A.; Joelsson-Alm, E.; Schandl, A. Comparing severe COVID-19 outcomes of first and second/third waves: A prospective single-centre cohort study of health-related quality of life and pulmonary outcomes 6 months after infection. BMJ Open 2023, 13, e071394. [Google Scholar] [CrossRef] [Scilit] [PubMed]
- Taboada, M.; González, M.; Alvarez, A.; Eiras, M.; Costa, J.; Álvarez, J.; Seoane-Pillado, T. First, second and third wave of COVID-19. What have we changed in the ICU management of these patients? J. Infect. 2021, 82, e14–e15. [Google Scholar] [CrossRef] [Scilit] [PubMed]

Disclaimer/Publisher’s Note: The statements, opinions and data contained in all publications are solely those of the individual author(s) and contributor(s) and not of MDPI and/or the editor(s). MDPI and/or the editor(s) disclaim responsibility for any injury to people or property resulting from any ideas, methods, instructions or products referred to in the content. |
© 2026 by the authors. Licensee MDPI, Basel, Switzerland. This article is an open access article distributed under the terms and conditions of the Creative Commons Attribution (CC BY) license.