


Abstract
In Italy, occupational SARS-CoV-2 infection entered the accident-at-work system through a distinctive medico-legal framework. We examined whether the positive-disposition proportion differed from contemporaneous non-COVID injury claims and changed as administrative series matured. We harmonized 3,129,447 records from the Italian National Institute for Insurance against Accidents at Work (INAIL) and combined them with 32 national occupational COVID-19 reports. Repeated snapshots assessed completed 2020 and 2021 series; same-cut-off analyses compared COVID-19 with reconstructed non-COVID claims for 2020–2022. Published positive-disposition proportions rose from 87% to 89% for 2020 claims and from 66.5% to 74% for 2021 claims. At 30 April 2023, proportions were 89%, 74%, and 70% for COVID-19 versus 62.85%, 63.42%, and 59.15% for non-COVID claims, yielding differences of 26.15, 10.58, and 10.85 percentage points. All tested rounding and insurance-management scenarios retained positive differences. Denominator sensitivity was greatest in 2021, where the reference difference reached zero after the exclusion of 94.8% of communication/franchise records; the reference tipping point was not reached within 0–100% exclusion in 2020 or 2022. These are administrative outcomes at specified cut-offs; the more recent event years had less time to mature. Positive-disposition proportions should, therefore, be interpreted jointly with claim composition, denominator specification, and administrative follow-up when comparing compensation statistics and planning surveillance for future occupational epidemics.
1. Introduction
The COVID-19 pandemic confronted workers’ compensation systems with an abrupt claim stream in which occupational causation was unusually difficult to assess. Unlike a traumatic event with a readily identifiable time and place, SARS-CoV-2 infection may arise through competing opportunities for exposure, while the evidentiary context changes with community transmission, workplace outbreaks, diagnostic practice, and the interval between infection and claim assessment. Insurance systems, therefore, were required to translate evolving epidemiological and clinical evidence into individual decisions while processing rapidly expanding and continuously changing claim stocks.
The legal treatment of occupational COVID-19 was not uniform across Europe. A 35-country survey found that 94% of participating systems permitted recognition as an occupational disease, an occupational injury, or both, although eligible occupations and evidentiary criteria differed substantially [1]. European policy continues to call for national compensation mechanisms, compatible statistics, and epidemiological reporting for recognized occupational diseases [2]. Italy operationalized protection through its accident-at-work framework. Article 42(2) of Decree-Law No. 18 of 17 March 2020, converted by Law No. 27 of 24 April 2020, brought confirmed infection contracted in connection with work within the protection administered by the Italian National Institute for Insurance against Accidents at Work (INAIL) [3,4]. This approach was consistent with the Italian medico-legal doctrine under which a virulent agent may fulfil the violent-cause requirement of an occupational injury [5].
Within this statutory classification, INAIL guidance introduced a presunzione semplice, or rebuttable evidentiary presumption of occupational origin, for healthcare personnel and other workers whose actual duties entailed elevated exposure, including frequent contact with the public [5,6]. Recognition remained an evaluative medico-legal process based on evidence such as duties and workplace attendance, temporal and territorial epidemiology, workplace clusters, clinical and diagnostic findings, anamnesis, and plausible alternative sources of infection [7]. Contemporary Italian occupational-health scholarship distinguished SARS-CoV-2 as a specific biological risk in healthcare-related activities and as a generic or aggravated generic risk in most other workplaces, with corresponding implications for the Risk Assessment Document [8]. Subsequent work translated evolving evidence on transmission into updated organizational, environmental, and personal protective measures for workplaces [9]. Italian surveillance studies documented the scale of occupational COVID-19 notification, its early concentration among healthcare and social-care workers, and subsequent changes in the occupational and geographical distribution of claims [10,11,12,13]. At the administrative cut-off of 30 April 2023, the final national report recorded 320,724 claims, including 901 fatal notifications, for events from January 2020 through April 2023 [14]. Those studies described who claimed and when; they did not establish whether the COVID-19 claim stream developed a positive-disposition pattern distinct from the ordinary injury universe processed by the same national system.
Occupational COVID-19, therefore, offers a naturalistic, system-level test case for insurance medicine: an externally generated surge of infection claims entered an established compensation system through a specific statutory classification and evidentiary framework. We use administrative signature to mean the observed pattern of administrative dispositions at a defined cut-off, reflecting claim composition, evidentiary assessment, and administrative processing together. This signature can be compared descriptively with contemporaneous non-COVID injury claims; it does not identify the causal contribution of an individual legal component.
A valid system-level comparison must first address administrative maturity. A positive-disposition proportion observed at one calendar date is not solely a property of claims arising in the corresponding event year. Late notifications, documentary integration, investigation, correction, and reclassification can alter both numerator and denominator after that year has ended. Workers’ compensation research outside the COVID-19 setting has, likewise, shown that outcome indicators may change materially with administrative follow-up [15]. Comparisons made at unequal cut-offs may, therefore, confound substantive differences between claim groups with unequal time for consolidation. Denominator composition adds a further medico-legal problem when pending or communication/franchise records are counted alongside claims already decided on their merits.
The Italian open-data system makes this question addressable but creates specific analytical constraints. National occupational COVID-19 reports provide repeated aggregate snapshots and rounded positive-disposition percentages, whereas semiannual claim-level injury files contain detailed administrative dispositions but no COVID-19 marker. The sources also differ slightly in insurance-management coverage. A defensible analysis, therefore, requires common-cut-off alignment, aggregate reconstruction of the non-COVID benchmark, propagation of uncertainty from rounded numerators, and explicit testing of denominator and management assumptions.
We conducted a nationwide retrospective administrative study to examine two linked propositions: the positive-disposition proportion changes as event-year series mature, and occupational COVID-19 claims have a higher positive-disposition proportion than contemporaneous non-COVID claims when both are measured at the same cut-off. We then assessed whether the contrast persisted across all rounding-compatible numerators, the tested insurance-management alignments, and alternative treatment of communication/franchise records. This framework describes temporal maturation separately from the same-cut-off comparison, without treating the latter as an adjusted causal effect.
2. Materials and Methods
2.1. Study Design and Reporting
We conducted a retrospective nationwide study of routinely collected Italian occupational-injury insurance data. The study combined: (i) a repeated-snapshot analysis of administrative maturation in occupational COVID-19 claims; and (ii) a same-cut-off aggregate comparison of the proportion of claims with a positive administrative disposition among occupational COVID-19 and reconstructed non-COVID injury claims. The insurance claim, rather than the individual worker, was the unit of analysis. No record-level linkage between the COVID-19 reports and the open injury database was possible or attempted.
The repeated-snapshot component evaluated completed 2020 and 2021 event-year series at 3 administrative cut-offs: 31 December 2021, 30 April 2022, and 30 April 2023. These were open administrative series rather than fixed cohorts because late notifications, corrections, and reclassification could change both numerator and denominator between releases. The April 2022 report covered only January–April 2022 events for that year; it was, therefore, not compared with the complete 2022 event year in April 2023 as though the releases represented follow-up of an invariant cohort. Event year 2022 entered only the same-cut-off analysis based on the final snapshot. Partial-year 2023 events were excluded.
Exploratory feasibility work established source availability and informed the final analytical definitions. Because feasibility work included examination of the same public data series, this study is reported as a fully documented retrospective analysis and was not preregistered. Transformation rules, predefined deterministic sensitivity scenarios, validation checks, and the complete computational workflow are preserved in a versioned Zenodo (CERN, Geneva, Switzerland) reproducibility compendium (https://doi.org/10.5281/zenodo.22729485, accessed on 28 October 2026). Reporting follows the STROBE statement and the RECORD extension for routinely collected health data [16,17] (Supplementary Materials).
2.2. Italian Insurance and Medico-Legal Setting
Article 42(2) of Decree-Law No. 18 of 17 March 2020, converted by Law No. 27 of 24 April 2020, placed confirmed SARS-CoV-2 infection contracted in connection with work within occupational-injury protection [3,4]. INAIL Circular No. 13 of 3 April 2020 and subsequent guidance applied a rebuttable evidentiary presumption of occupational origin to healthcare personnel and other workers whose actual duties entailed elevated exposure, including frequent contact with the public [5,6].
The presumption did not make recognition automatic. Recommendation SSC No. 8/2020 required a case-specific medico-legal assessment considering the worker’s actual duties and workplace attendance, temporal and territorial epidemiology, workplace clusters, clinical and diagnostic evidence, anamnesis, and evidence supporting an alternative source of infection [7]. Workers outside the initially exemplified occupational categories remained eligible following ordinary assessment of occupational causation. The exposure evaluated in this study was the administrative classification of a claim as occupational COVID-19, not individual eligibility for the presumption. We use positive disposition consistently for the administrative outcome; recognition refers to the medico-legal process leading to that outcome and does not by itself imply benefit payment.
2.3. Data Sources
INAIL published 32 national occupational COVID-19 monitoring reports between 21 April 2020 and 30 April 2023 [18]. The complete series was archived for provenance and contextual analyses. Administrative recognition and compensation outcomes were reported in only 3 releases, with cut-offs at 31 December 2021, 30 April 2022, and 30 April 2023. The last was the final periodic monitoring report [14]. For each usable release, we encoded the administrative cut-off, event year or partial-year coverage, number of notified claims, reported positive-disposition percentage, and printed precision. Exact sex-by-age counts of all and fatal COVID-19 notifications were obtained from the final report tables. Every encoded row retained the source URL, PDF filename, physical source page, extraction status, and a coverage or approximation note. Encoded cells were checked twice against their source pages. The spatial extension used the 21 final territorial monitoring reports released with the 30 April 2023 national update and the official generalized Istat regional boundaries valid on 1 January 2023 [19,20].
The comparator source was the historical INAIL semiannual injury snapshot, with DataRilevazione equal to 30 April 2023 [21,22]. All 21 geographical files were included: the 20 regional groupings and the residual “Other or unclassified place” file. The snapshot contains completed event years 2018–2022; the analysis was restricted to events from 1 January 2020 through 31 December 2022. Official INAIL typological tables were used to decode administrative disposition, fatal-case investigation, compensation, insurance management, tariff, economic activity, birthplace, and province codes [23]. The semiannual files contain no COVID-19 indicator; the non-COVID comparator was, therefore, reconstructed only at the national event-year level by arithmetic decomposition at the common administrative cut-off.
2.4. Data Acquisition and Immutable Source Archive
A purpose-built Python (Python Software Foundation, Beaverton, OR, USA) 3.12.14 pipeline downloaded every object directly from its institutional URL: 21 regional or residual injury archives, all 32 national COVID-19 reports, 21 final territorial COVID-19 reports, 5 principal medico-legal documents, 9 official typological tables, and one official boundary archive. Raw objects were retained without modification. A machine-readable manifest recorded source category, label, URL, relative location, size, acquisition and verification timestamps, and the license displayed by the source page, or a redistribution-verification flag where no data license was stated.
Downloads were idempotent and used temporary partial files followed by atomic replacement. Every ZIP underwent format validation, confirmation that it contained exactly 1 CSV, and exact comparison of its internal header with the expected ordered 25-field schema. PDF magic bytes and typological-table content were checked to prevent an HTML error response from being accepted as source data. The build stopped after any download, archive, schema, or content-type failure.
2.5. Construction of the Harmonized Master Database
Regional CSVs were streamed directly from verified ZIP archives in 100,000-record chunks. All source fields were initially read as character data. Five date fields were parsed using the explicit %d/%m/%Y format; numeric identifiers and quantitative fields were converted with failures retained as missing and exposed by quality-control outputs; geographic and classification codes remained character strings. The pipeline appended harmonized occurrence context, administrative-outcome label, positive-disposition flag, fatal-claim flag, event year, source region, archive name, and original row number.
The claim-level master was stored as Zstandard-compressed Parquet with dictionary encoding, row-group statistics, and a fixed Arrow schema. A self-contained DuckDB catalogue stored a physical copy of the claim master together with COVID-19 recognition tables, report summary, age–sex table, source manifest, parsing-quality table, all 9 official code tables, aggregate quality-control outputs, and the reconstructed comparison. The master contained 3,129,447 claims. Claim identifiers were unique and every record carried the expected 30 April 2023 extraction date.
Only aggregate, non-identifying outputs were prepared for publication. The public records contain internal rather than direct identifiers; however, their longitudinal stability together with dates, age, and geography creates residual re-identification risk. No re-identification was attempted; internal claimant, claim, employer, and insurance-position identifiers were excluded from analytical supplements. Exact national sex-by-age cells already published by INAIL were reproduced only at their original aggregation.
2.6. Eligibility and Administrative-Outcome Definitions
Records were eligible for the final-cut-off analysis when the event occurred from 1 January 2020 through 31 December 2022, occurrence mode was valid, and an administrative-disposition code was present. Code N in ModalitaAccadimento denoted occurrence in the course of work and code S denoted commuting. Because COVID-19 reports did not provide this mode allocation and both settings can enter occupational protection when statutory conditions are met, the primary comparator included both valid modes. Work occasion-only counts were retained as a universe diagnostic.
The primary outcome was a positive administrative disposition at the relevant snapshot, corresponding strictly to code P in DefinizioneAmministrativa. Code N denoted a negative disposition, I a claim under investigation, and F the official franchise category, also described in INAIL statistical usage as communication/franchise. Code F was never included in the positive numerator. The primary denominator included all notified records with a valid occurrence mode and a P, N, I, or F disposition. Pending claims were retained because the estimand was the proportion of all notified claims that had reached a positive disposition by the cut-off; the published COVID-19 percentages, likewise, used notified claims. Excluding pending records would instead condition the comparison on completed processing; comparable event-year-specific COVID-19 adjudicated-claim denominators were unavailable. Pending claims were not classified as rejected; the resulting proportion was not an acceptance proportion among adjudicated claims.
Code F has a practical meaning beyond an unsuccessful claim: it includes communications and short-duration events within the three-day waiting period. For the ordinary injury managements used as the comparator, temporary-disability indemnity starts on the fourth day after the event; absence of payment during the waiting period is not a negative determination of occupational origin [24]. In contrast, the statutory protection for confirmed occupational COVID-19 extended to quarantine or home isolation with work absence [3,5], which would generally be expected to exceed three days during the study period. This context can produce different F-category frequencies. The reports did not provide exact COVID-19 F counts or individual isolation durations; therefore, the difference could not be measured directly. Secondary descriptive outcomes were negative, pending, and F distributions; positive dispositions among fatal COVID-19 notifications; compensation conditional on a positive disposition; benefit types; compensated absence days; and fatal notifications per 1000 notified claims within age-by-sex strata.
2.7. Aggregate Reconstruction of the Non-COVID Comparator
For each event year, we first removed the number of Navigation claims assigned by the selected scenario from the published COVID-19 total and removed the corresponding Navigation-positive claims from the COVID-19 positive count. We then subtracted these management-aligned COVID-19 quantities from, respectively, all eligible injury claims and all positive injury dispositions at the shared 30 April 2023 cut-off. The resulting denominator and numerator defined the reconstructed non-COVID comparator. This procedure was aggregate arithmetic decomposition, not probabilistic imputation or record linkage.
INAIL published event-year positive-disposition percentages rather than exact positive counts. We did not treat multiplication of a claim count by a rounded percentage as an observed numerator. The printed percentage served only as the descriptive center of the reference scenario and could, therefore, yield an explicitly labelled fractional scenario-equivalent count. For uncertainty propagation, we identified the rounding interval implied by the last printed decimal place, converted its lower and upper limits into the corresponding inclusive integer-count range, and enumerated every positive count that reproduced the published percentage at the reported precision.
2.8. Universe Concordance and Navigation Scenarios
The semiannual files define Industry and Services, State Account, and Agriculture managements, whereas COVID-19 reports also include Navigation. The final report assigned approximately 0.6% of all COVID-19 notifications to Navigation but did not publish exact event year-specific Navigation counts or outcomes. The reference reconstruction assumed a 0.6% Navigation share in each event year and equal positive-disposition proportions within and outside Navigation. The national all-period share was an anchor for these assumptions, not an observed allocation for each event year.
The deterministic grid tested Navigation shares of 0%, 0.3%, 0.55%, 0.6%, 0.65%, 0.9%, and 1.2%. The 0.6% value reproduced the published national anchor; 0.55% and 0.65% bracketed its one-decimal rounding thresholds. The 0.3%, 0.9%, and 1.2% values tested one-half, one-and-a-half times, and twice that anchor, while 0% represented no Navigation subtraction. These values assessed departures from the assumed event-year allocation; they were not empirical estimates or a probabilistic interval. For each share and rounding-compatible total numerator, we evaluated the minimum and maximum logically compatible positive Navigation allocation. The resulting limits were labelled management-and-rounding scenario envelopes rather than confidence intervals.
2.9. Statistical Analysis
Counts and proportions of the 4 administrative dispositions were summarized by event year at the common 30 April 2023 cut-off. Administrative maturation was described for completed 2020 and 2021 event-year series. For each series and release, we plotted the published positive-disposition proportion with its rounding-compatible range and contemporaneous denominator. For each consecutive pair, the percentage-point change was obtained by subtracting the earlier published proportion from the later one; the same subtraction was repeated across all rounding-compatible numerator combinations to obtain the minimum and maximum compatible changes. We also recorded elapsed days and change in claim stock.
At the final cut-off, occupational COVID-19 and reconstructed non-COVID positive-disposition proportions were compared separately for 2020, 2021, and 2022. The absolute difference was obtained by subtracting the non-COVID proportion from the COVID-19 proportion. The prevalence ratio compared the two proportions by division, while the supplementary odds ratio compared their positive-disposition odds. No pooled primary estimate was specified because claim composition, epidemic intensity, diagnostic practice, and administrative maturity differed materially by event year.
The influence of the F category was evaluated using a denominator tipping-point analysis. We progressively removed between 0% and 100% of reconstructed non-COVID F records from the denominator while leaving the positive numerator unchanged, recalculated the COVID-19 minus non-COVID positive-disposition difference, and defined the tipping point as the excluded fraction at which the difference reached zero. If the algebraic solution exceeded 100%, the tipping point was reported as not reached within the evaluated 0–100% range. This diagnostic analysis assumed that all removed F records were non-COVID; exact COVID-19 F counts were unavailable. The reference curve was displayed together with the complete rounding-and-Navigation scenario envelope.
Fatal COVID-19 recognition was descriptive because reports supplied only an overall rounded proportion rather than event-year-specific recognized fatal counts. Within each published age-by-sex stratum, fatal notifications were divided by all notified claims and expressed per 1000. The source data are near-census administrative counts, not a probability sample. Primary uncertainty was consequently represented by rounding-compatible count sets and structural scenario envelopes; conventional binomial confidence intervals and null-hypothesis tests were not used as the principal uncertainty measure.
2.10. Regional Spatial Extension
To determine whether occupational COVID-19 changed the geographic composition of the national claim portfolio, we conducted a descriptive regional extension for events occurring from 1 January 2020 through 31 December 2022, all observed at the 30 April 2023 cut-off. Region was the finest common geography at which exact COVID-19 event-period totals, non-COVID comparators, and a shared administrative cut-off could be aligned. Exact COVID-19 totals were obtained from 21 final territorial monitoring reports; events occurring in the first 4 months of 2023 were subtracted using the exact count reported for each territory. The autonomous provinces of Bolzano and Trento were combined to correspond to the Trentino-Alto Adige regional comparator. All-injury counts were aggregated from the claim-level master by region of occurrence under the same eligibility rules used in the national analysis.
The national reference Navigation share of 0.6% was applied uniformly to the regional COVID-19 totals as a simplifying spatial-analysis assumption. It was not an observed regional share: event period-specific regional management allocations were not resolved, and the actual regional shares could differ. The adjusted COVID-19 count was subtracted from each region’s all-injury count to reconstruct the non-COVID portfolio. Two complementary measures were displayed: the percentage of each region’s local injury portfolio attributable to COVID-19 and a relative representation index comparing the region’s share of the national COVID-19 total with its share of the national reconstructed non-COVID total. An index of 1 marked national balance; higher values indicated disproportionate COVID-19 concentration. Regional codes were linked to the official generalized Istat boundaries valid on 1 January 2023 [20]. These descriptive measures were conditional on the uniform adjustment and did not enter the national positive-disposition estimates.
2.11. Quality Assurance and Reproducibility
The workflow succeeded only after all predefined validation checks passed: exact schema identity across 21 regional files; constant extraction date; unique non-missing claim identifiers; permitted administrative and occurrence-mode codes; valid event dates; field-level reporting of failed typed coercions; positive counts not exceeding denominators; reconciliation of age–sex tables to 320,724 total and 901 fatal notifications; non-empty rounding-compatible numerator sets; and logical feasibility of each reconstructed cell.
Independent numerical lock checks required all-valid-mode claim and positive counts of 572,400 and 398,503 in 2020, 564,412 and 363,074 in 2021, and 703,432 and 429,004 in 2022. Corresponding work-occasion-only checks were 506,609 and 357,634, 479,837 and 311,486, and 609,566 and 377,752. All 12 checks passed.
2.12. Software and Generative Artificial Intelligence
All statistical analyses were personally performed, checked, and interpreted by Tommaso D’Anna using R (R Foundation for Statistical Computing, Vienna, Austria) version 4.6.1 (64-bit UCRT) on Windows 11 (Microsoft Corporation, Redmond, WA, USA) build 26200. The analytical and graphical workflow used stats, graphics, grDevices, grid, utils, and splines, all version 4.6.1. Source acquisition and database construction used Python version 3.12.14 with pandas 2.3.3, PyArrow 21.0.0, DuckDB 1.5.5, pdfplumber 0.11.10, and pyshp 2.3.1. Full software details, session information, and reproduction commands are preserved in the Zenodo compendium.
OpenAI Codex (GPT-6 model; OpenAI, San Francisco, CA, USA) provided ancillary assistance with code refinement, troubleshooting, figure-layout refinement, and English-language editing. T.D. personally executed and checked the analytical code and numerical results and retained responsibility for source selection, analytical decisions, interpretation, and the final text. G.M. reviewed the medico-legal framing and the final manuscript. The executable scripts and validation outputs reproduce the reported results from the documented institutional sources.
2.13. Bias and Interpretive Safeguards
The study population comprised claims notified to INAIL, not all occupational SARS-CoV-2 infections. Reporting propensity, diagnostic confirmation, occupational composition, epidemic intensity, and access to medical certification changed over time. Workers outside the insured population were absent. COVID-19 and other injury claims also differed in mechanism, severity, evidence, and claimant composition; the reconstructed non-COVID proportion was, therefore, a contemporaneous administrative benchmark rather than an individual counterfactual.
Aggregate COVID-19 data precluded adjustment for occupation, sector, age, sex, region, clinical severity, diagnostic evidence, or individual eligibility for the evidentiary presumption. Apparent temporal changes combined decision-making with late reporting, corrections, and changes in the claim stock. These constraints were addressed through event-year stratification, common-cut-off alignment, deterministic sensitivity analyses, and explicit outcome terminology.
2.14. Ethics, Data Protection, and Data Availability
The study used public secondary administrative data released without direct personal identifiers and involved no participant contact, intervention, access to clinical records, or attempt at re-identification. Only aggregate outputs are intended for publication. Ethics committee review and informed consent were, therefore, not applicable to this secondary aggregate-data study.
A versioned reproducibility compendium containing the source manifest, data dictionary, transformation rules, Python and R programs, machine-readable quality-control reports, non-identifying aggregate data, tables, and figures is archived on Zenodo (https://doi.org/10.5281/zenodo.22729485). Claim-level Parquet and DuckDB objects are not redistributed because the public source records contain stable internal identifiers and granular dates and geography. Institutional URLs and documented acquisition metadata permit the excluded raw and record-level inputs to be reacquired and independently reconstructed.
3. Results
3.1. Analytical Population and Administrative Dispositions
The harmonized master contained 3,129,447 claims arising in 2018–2022. Applying the event-period and administrative eligibility criteria yielded the 2020–2022 analysis described below; source acquisition and validation procedures are reported in Section 2.4, Section 2.5 and Section 2.11.
The common-cut-off analysis comprised 1,840,244 claims arising in 2020–2022. Of these, 1,190,581 had a positive disposition, 361,444 a negative disposition, 229,866 a communication/franchise disposition, and 58,353 remained pending. The positive-disposition proportion was 69.62% in 2020, 64.33% in 2021, and 60.99% in 2022. Pending records represented 1.15%, 1.83%, and 5.89%, respectively (Table 1). The 2022 series had less time to mature and a substantially larger unresolved share; its lower positive-disposition proportion at this cut-off should not be interpreted as lower eventual recognition.
Table 1.
Administrative dispositions in the all-valid-mode injury universe at the 30 April 2023 cut-off.
3.2. Administrative Maturation
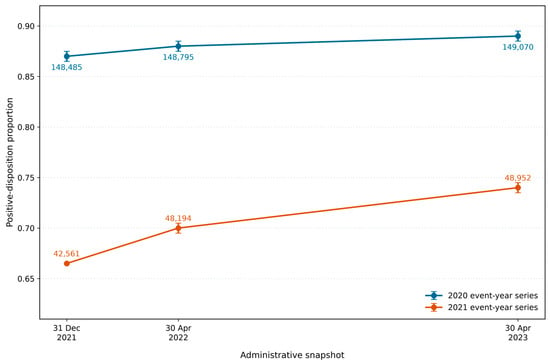
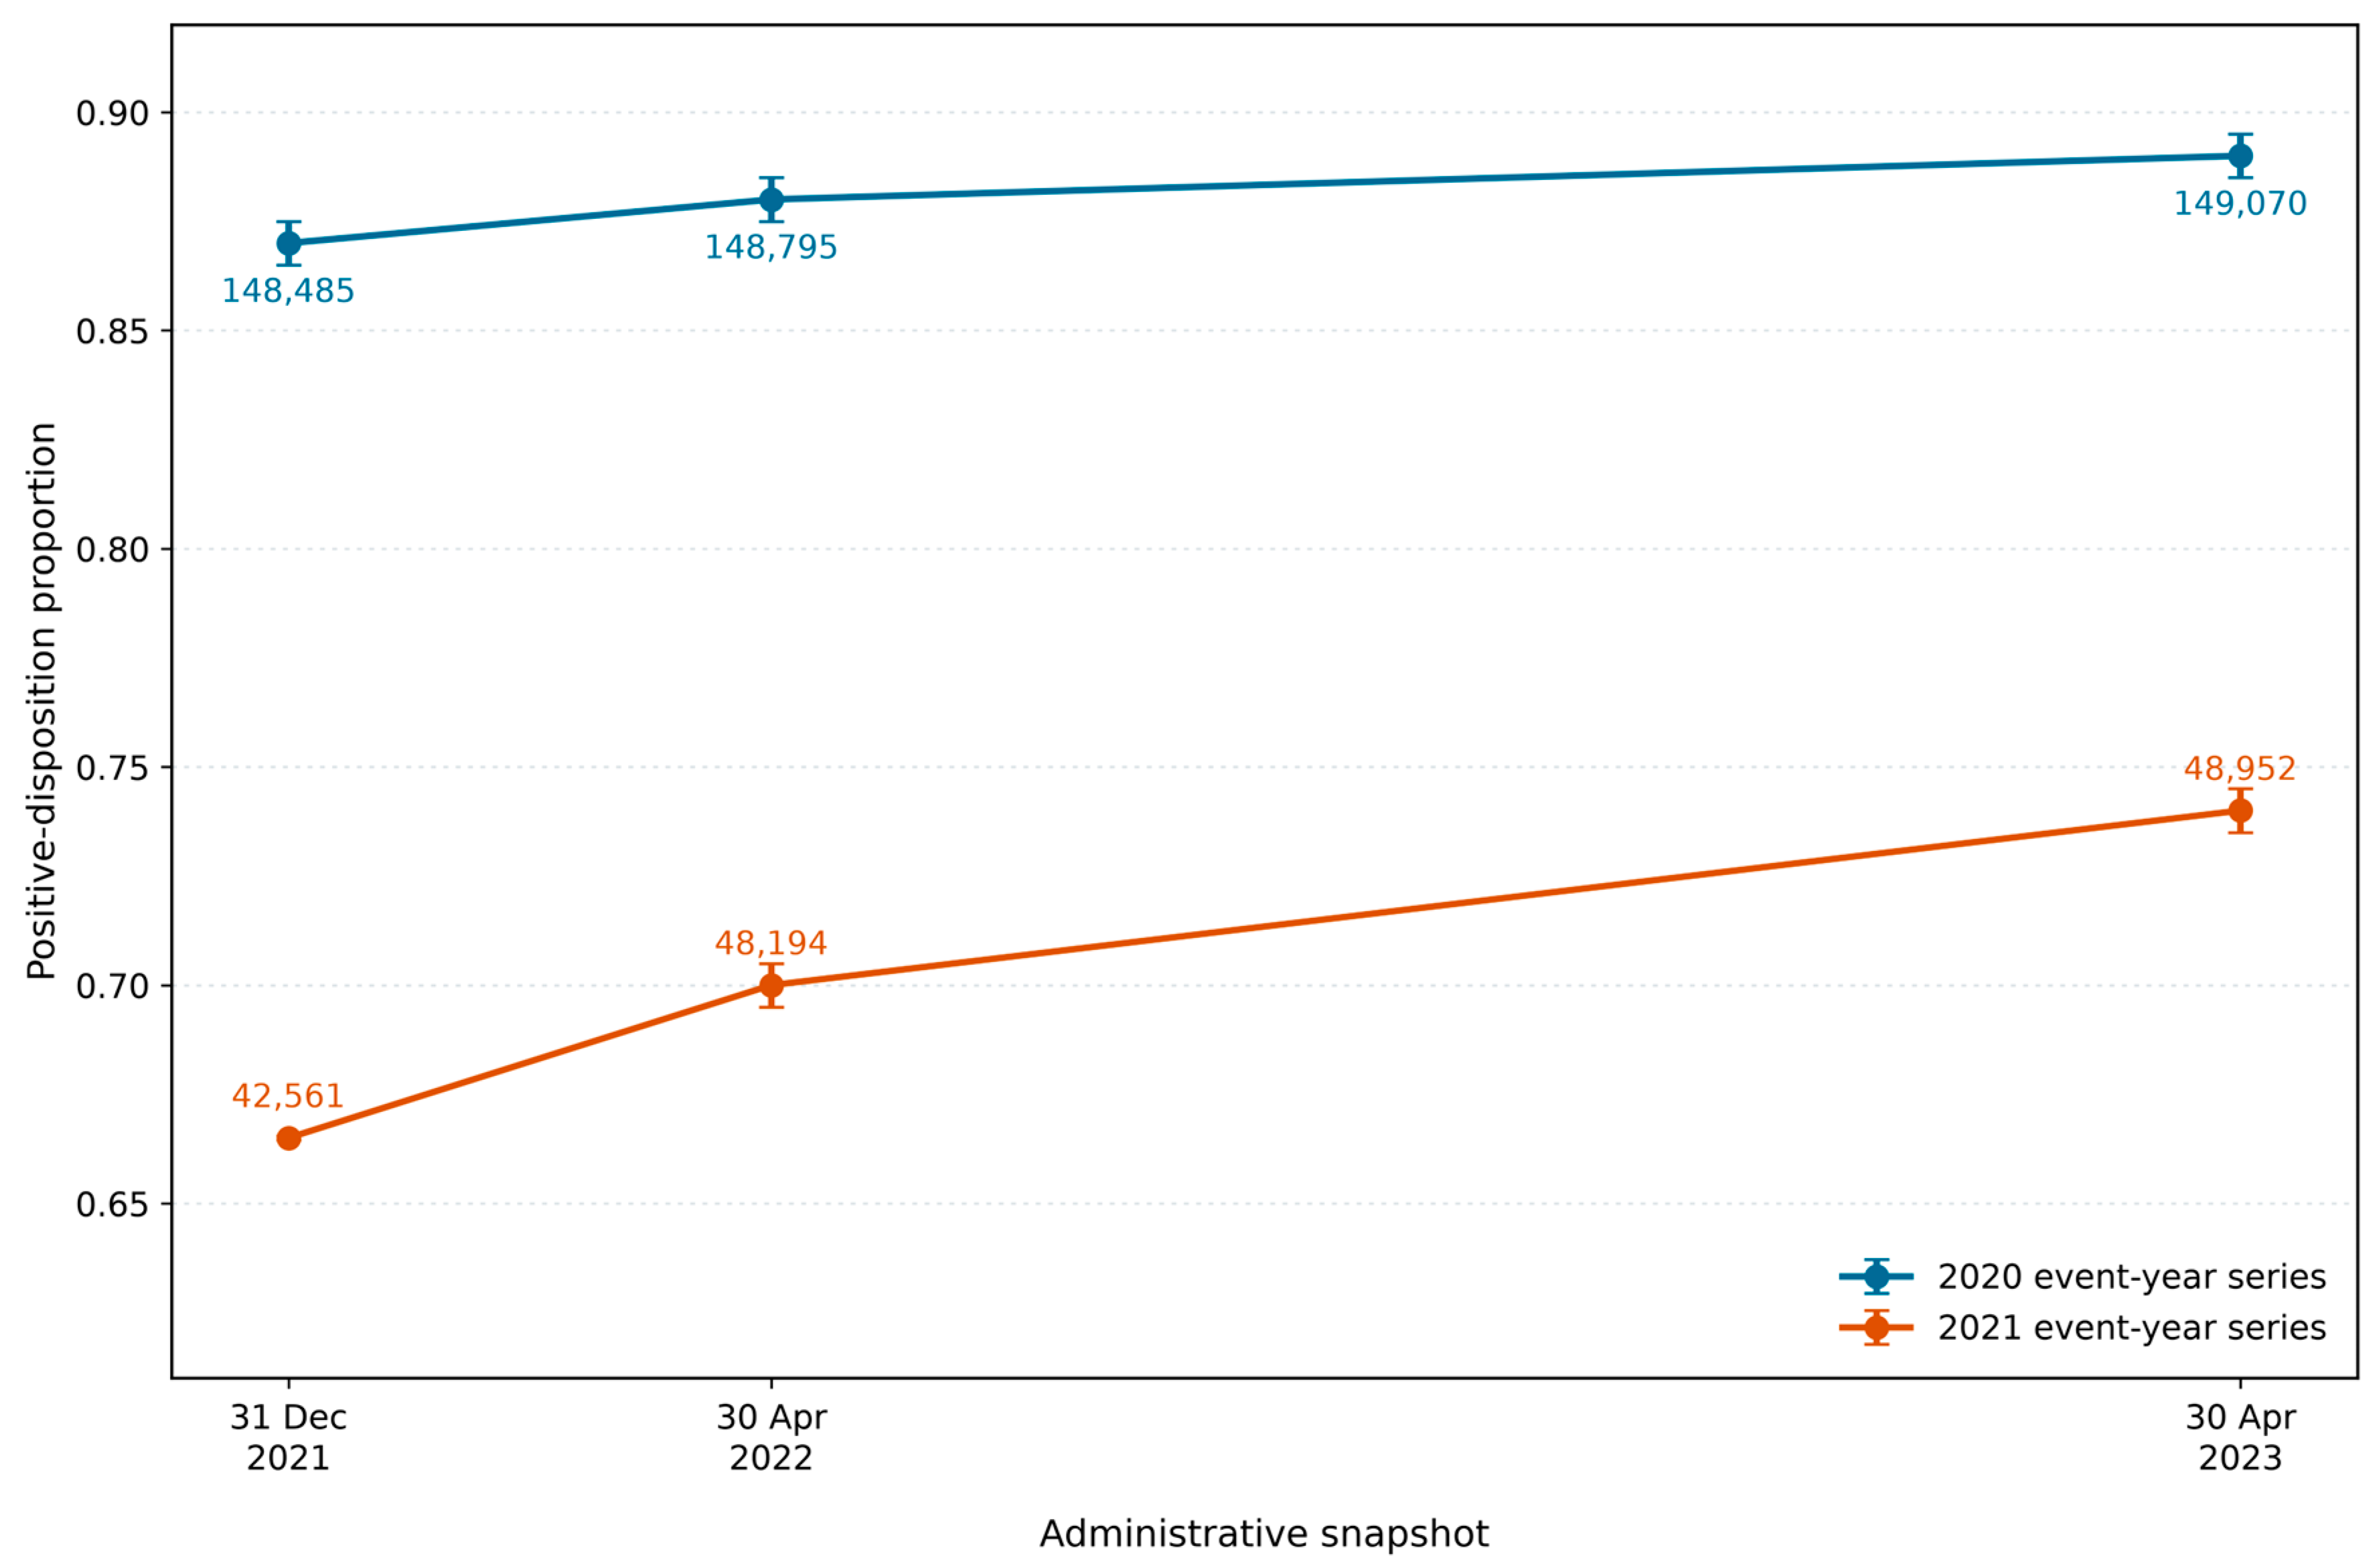
For the completed 2020 event-year series, the published positive-disposition proportion increased from 87% at 31 December 2021 to 88% at 30 April 2022 and 89% at 30 April 2023. Over the same period, the notified stock increased from 148,485 to 148,795 and 149,070 claims. The two consecutive published increases were each 1.0 percentage point. After propagation of every integer numerator compatible with the rounded percentages, their changes ranged from 0.0005 to 1.9993 percentage points and from 0.0004 to 1.9993 percentage points, respectively.
Administrative maturation was more pronounced for the 2021 series. Positive disposition increased from 66.5% at 31 December 2021 to 70% at 30 April 2022 and 74% at 30 April 2023, while the claim stock increased from 42,561 to 48,194 and 48,952. Consecutive changes were 3.5 percentage points (rounding-compatible range, 2.951–4.048) and 4.0 percentage points (3.002–4.999) (Table 2 and Figure 1).
Table 2.
Repeated occupational COVID-19 recognition snapshots for completed event years 2020 and 2021.
Figure 1.
Administrative maturation of positive dispositions in repeated occupational COVID-19 event-year series. Points show percentages published for completed event years 2020 and 2021; labels give contemporaneous claim stocks using commas as thousands separators. Error bars are rounding-compatible ranges, not sampling confidence intervals.
3.3. COVID-19 and Reconstructed Non-COVID Comparison
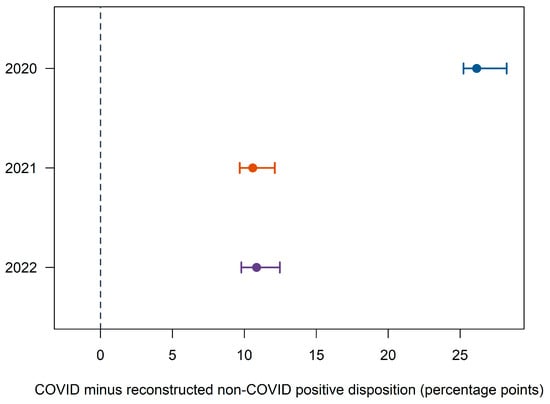
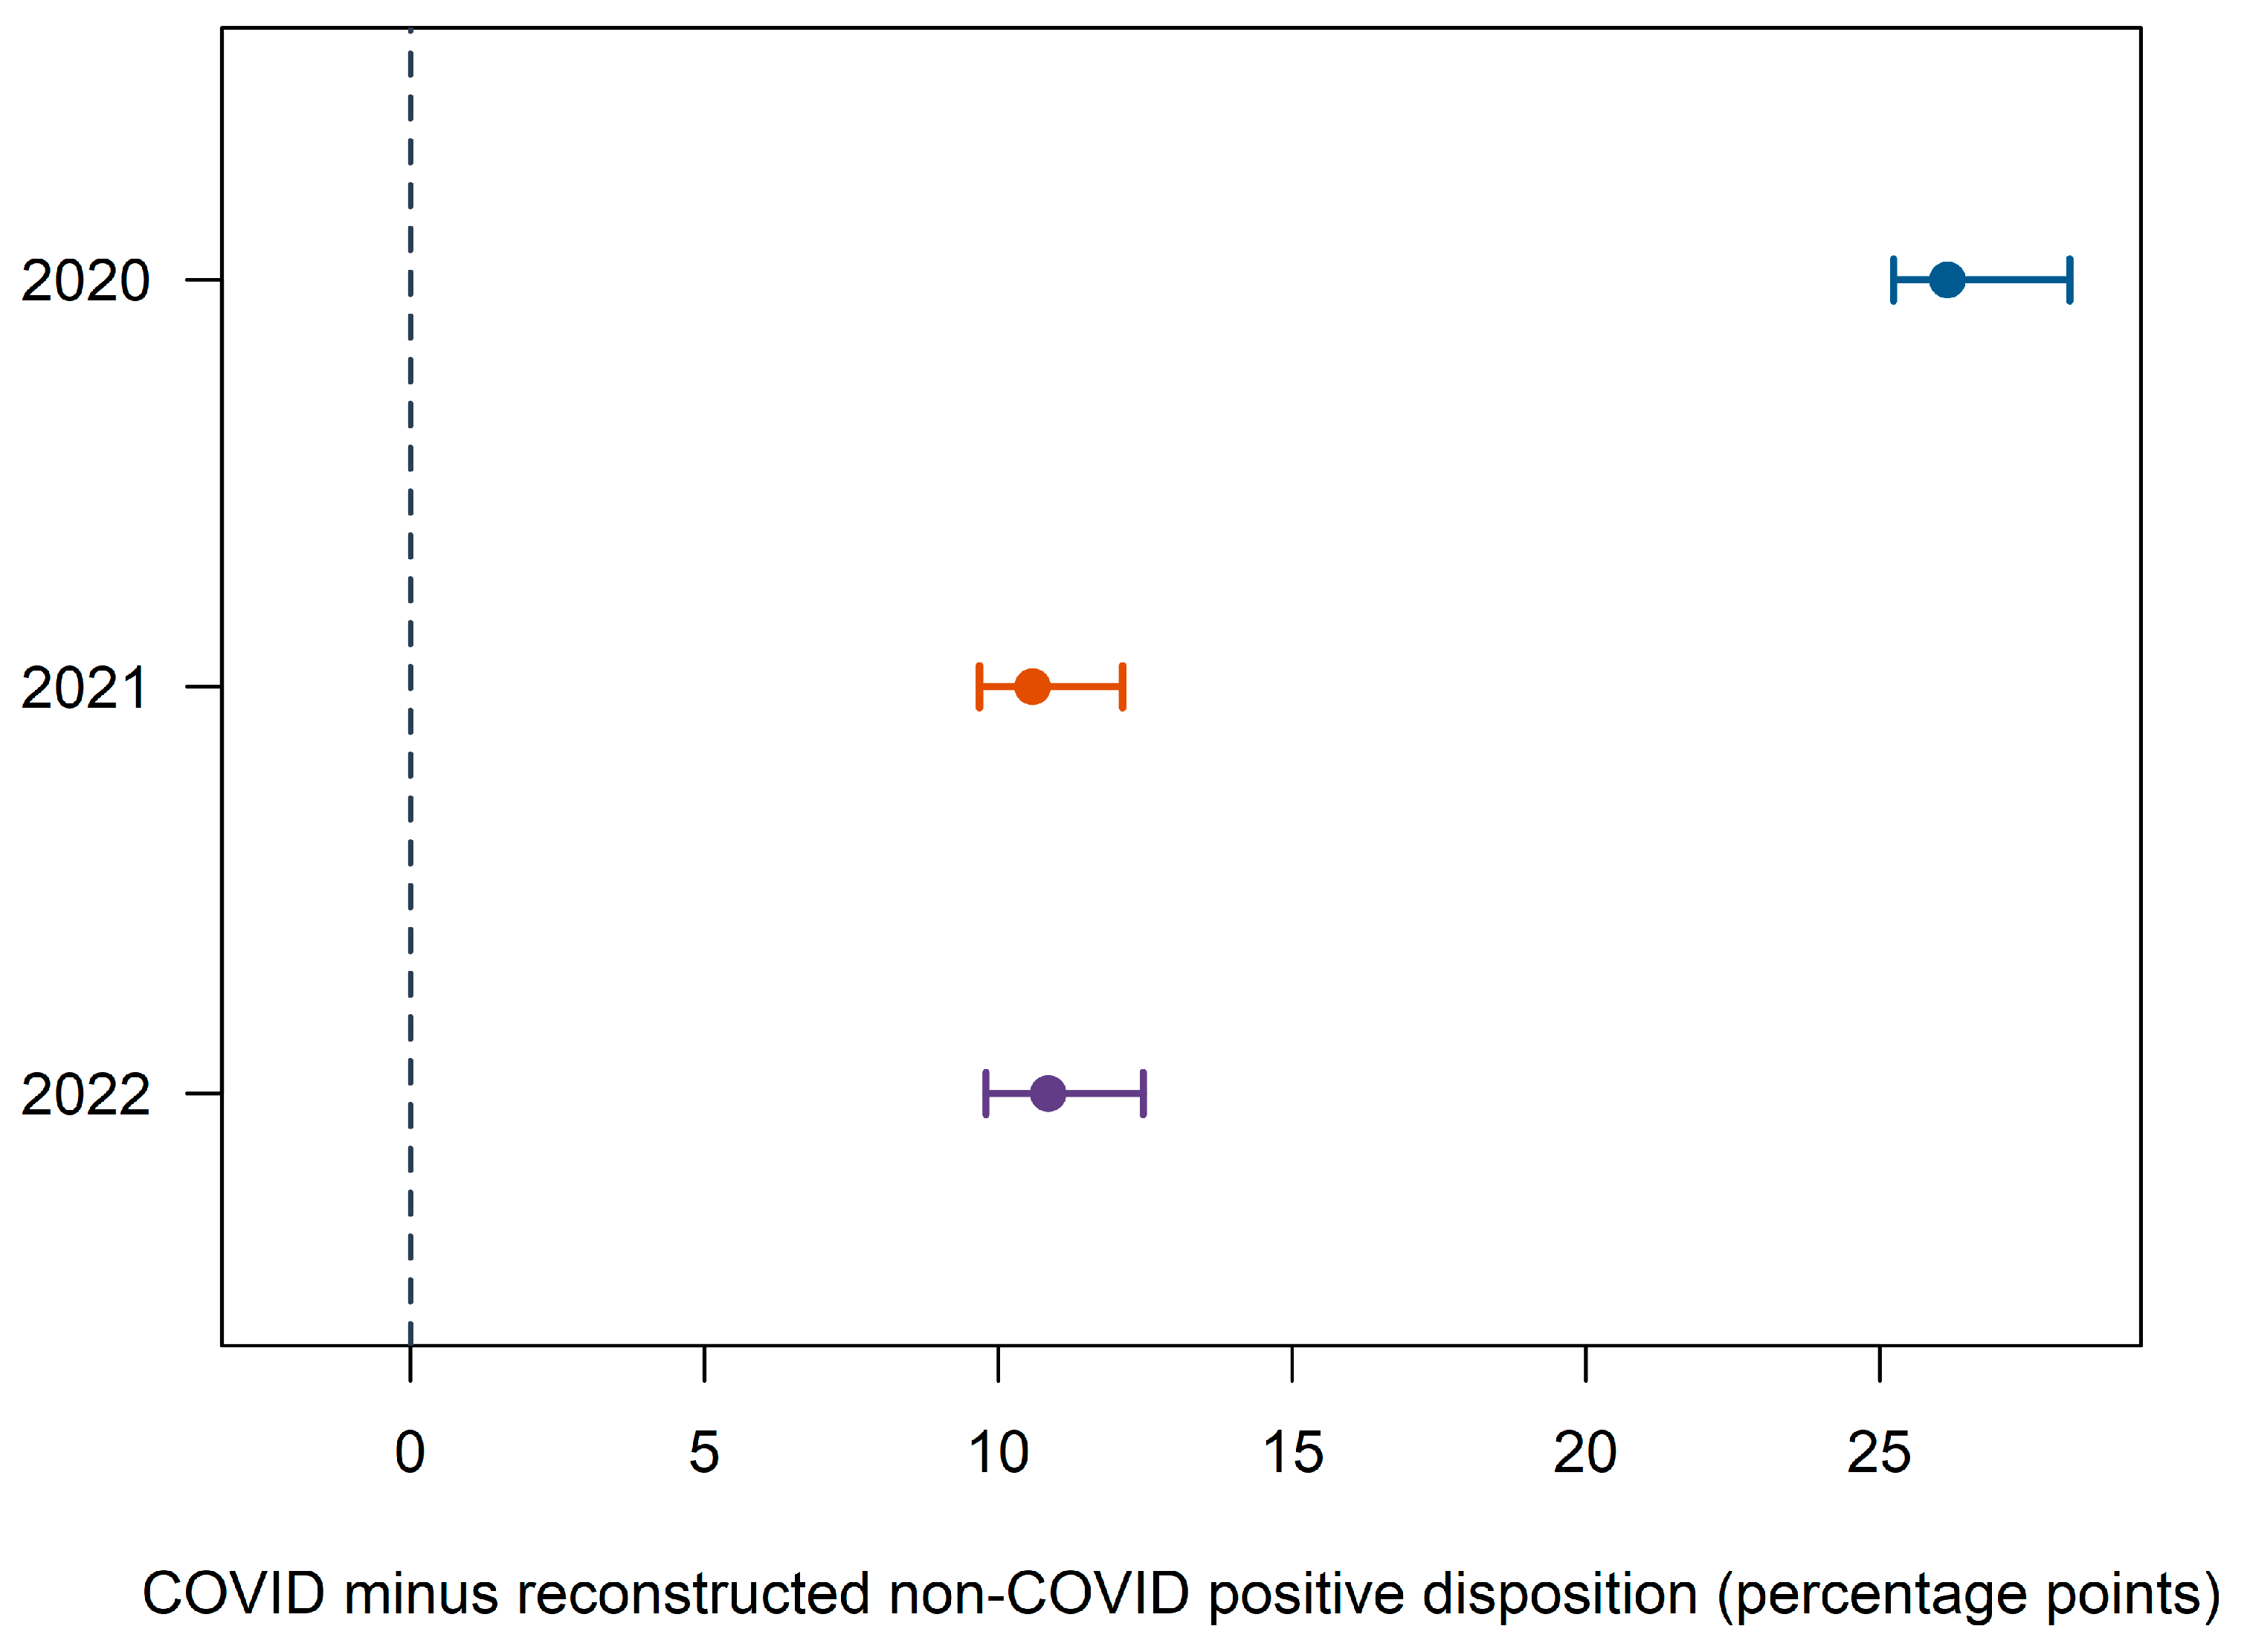
At the shared cut-off of 30 April 2023, published positive-disposition proportions for occupational COVID-19 claims were 89% in 2020, 74% in 2021, and 70% in 2022. Under the reference management-alignment scenario, reconstructed non-COVID proportions were 62.85%, 63.42%, and 59.15%. Differences were 26.15, 10.58, and 10.85 percentage points, and prevalence ratios were 1.416, 1.167, and 1.183, respectively. These were cut-off-specific administrative comparisons: the shared observation date did not give different event years equal follow-up; exact COVID-19 pending counts were unavailable by event year.
Every combination of rounding-compatible COVID-19 numerators, predefined Navigation shares, and logically compatible allocations of Navigation-positive claims retained a positive difference. The structural scenario envelope was 25.23–28.23 percentage points for 2020, 9.68–12.11 for 2021, and 9.79–12.47 for 2022 (Table 3 and Figure 2).
Table 3.
COVID-19 and reconstructed non-COVID positive dispositions at the shared 30 April 2023 cut-off.
Figure 2.
Difference in positive administrative disposition between occupational COVID-19 claims and the reconstructed non-COVID benchmark at the shared 30 April 2023 cut-off. Points show the reference scenario; horizontal bars show the full rounding-and-management envelope. The dashed line denotes no difference.
3.4. Denominator Sensitivity
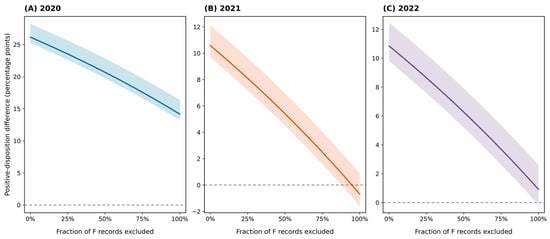
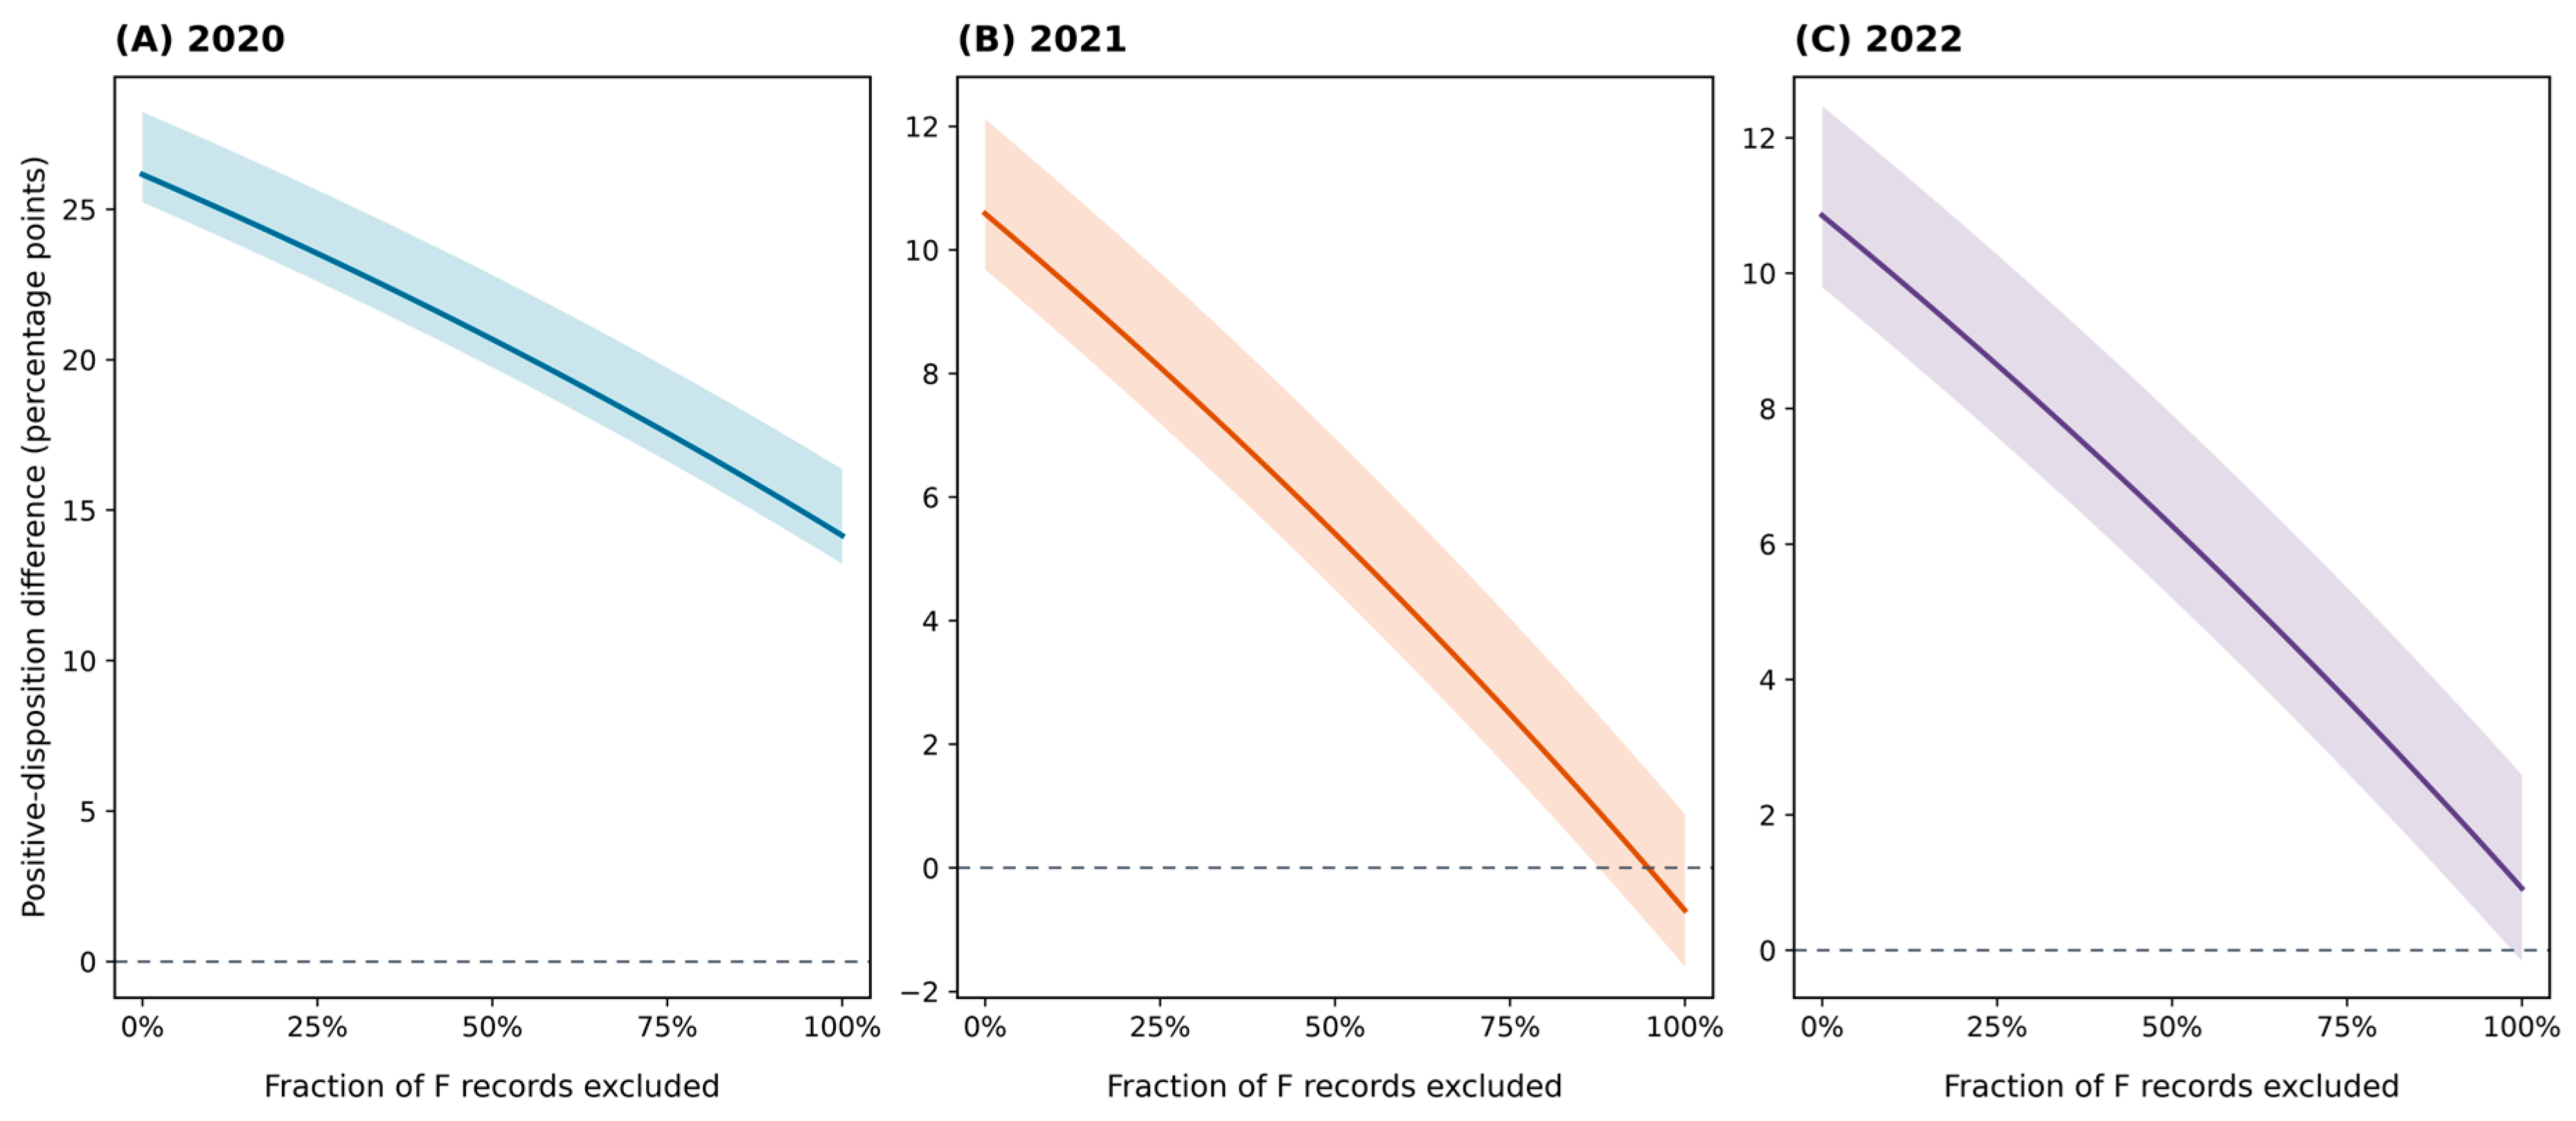
In the reference scenario, the tipping point was not reached within 0–100% exclusion of reconstructed non-COVID communication/franchise records in either 2020 or 2022. In 2021, the difference reached zero after exclusion of 94.8% of these records. Thus, only the 2021 reference curve crossed zero within the evaluated exclusion range (Table S3 and Figure 3).
Figure 3.
Sensitivity of the COVID-19 versus non-COVID positive-disposition difference to treatment of communication/franchise (F) records. Each panel identifies its event year directly: (A) 2020; (B) 2021; and (C) 2022. The horizontal axis is the fraction of reconstructed non-COVID F records removed under the diagnostic assumption that all F records were non-COVID. Solid lines show the reference scenario and shaded areas the rounding-and-Navigation envelope. Reference tipping points were not reached within 0–100% exclusion in 2020 and 2022; the 2021 reference tipping point was 94.8%.
When rounding and management assumptions were varied simultaneously, the lower edge of the complete scenario envelope reached zero at approximately 88% exclusion in 2021 and 99% in 2022; it remained positive throughout the evaluated range in 2020. These envelope results differ from the reference tipping points because they include the most adverse tested rounding-and-management combinations (Figure 3).
3.5. Fatal Notifications, Recognition, and Compensation
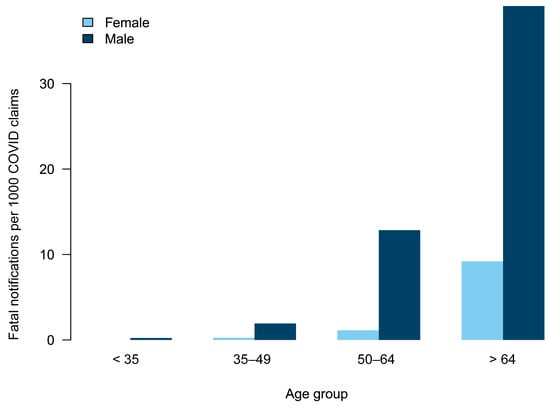
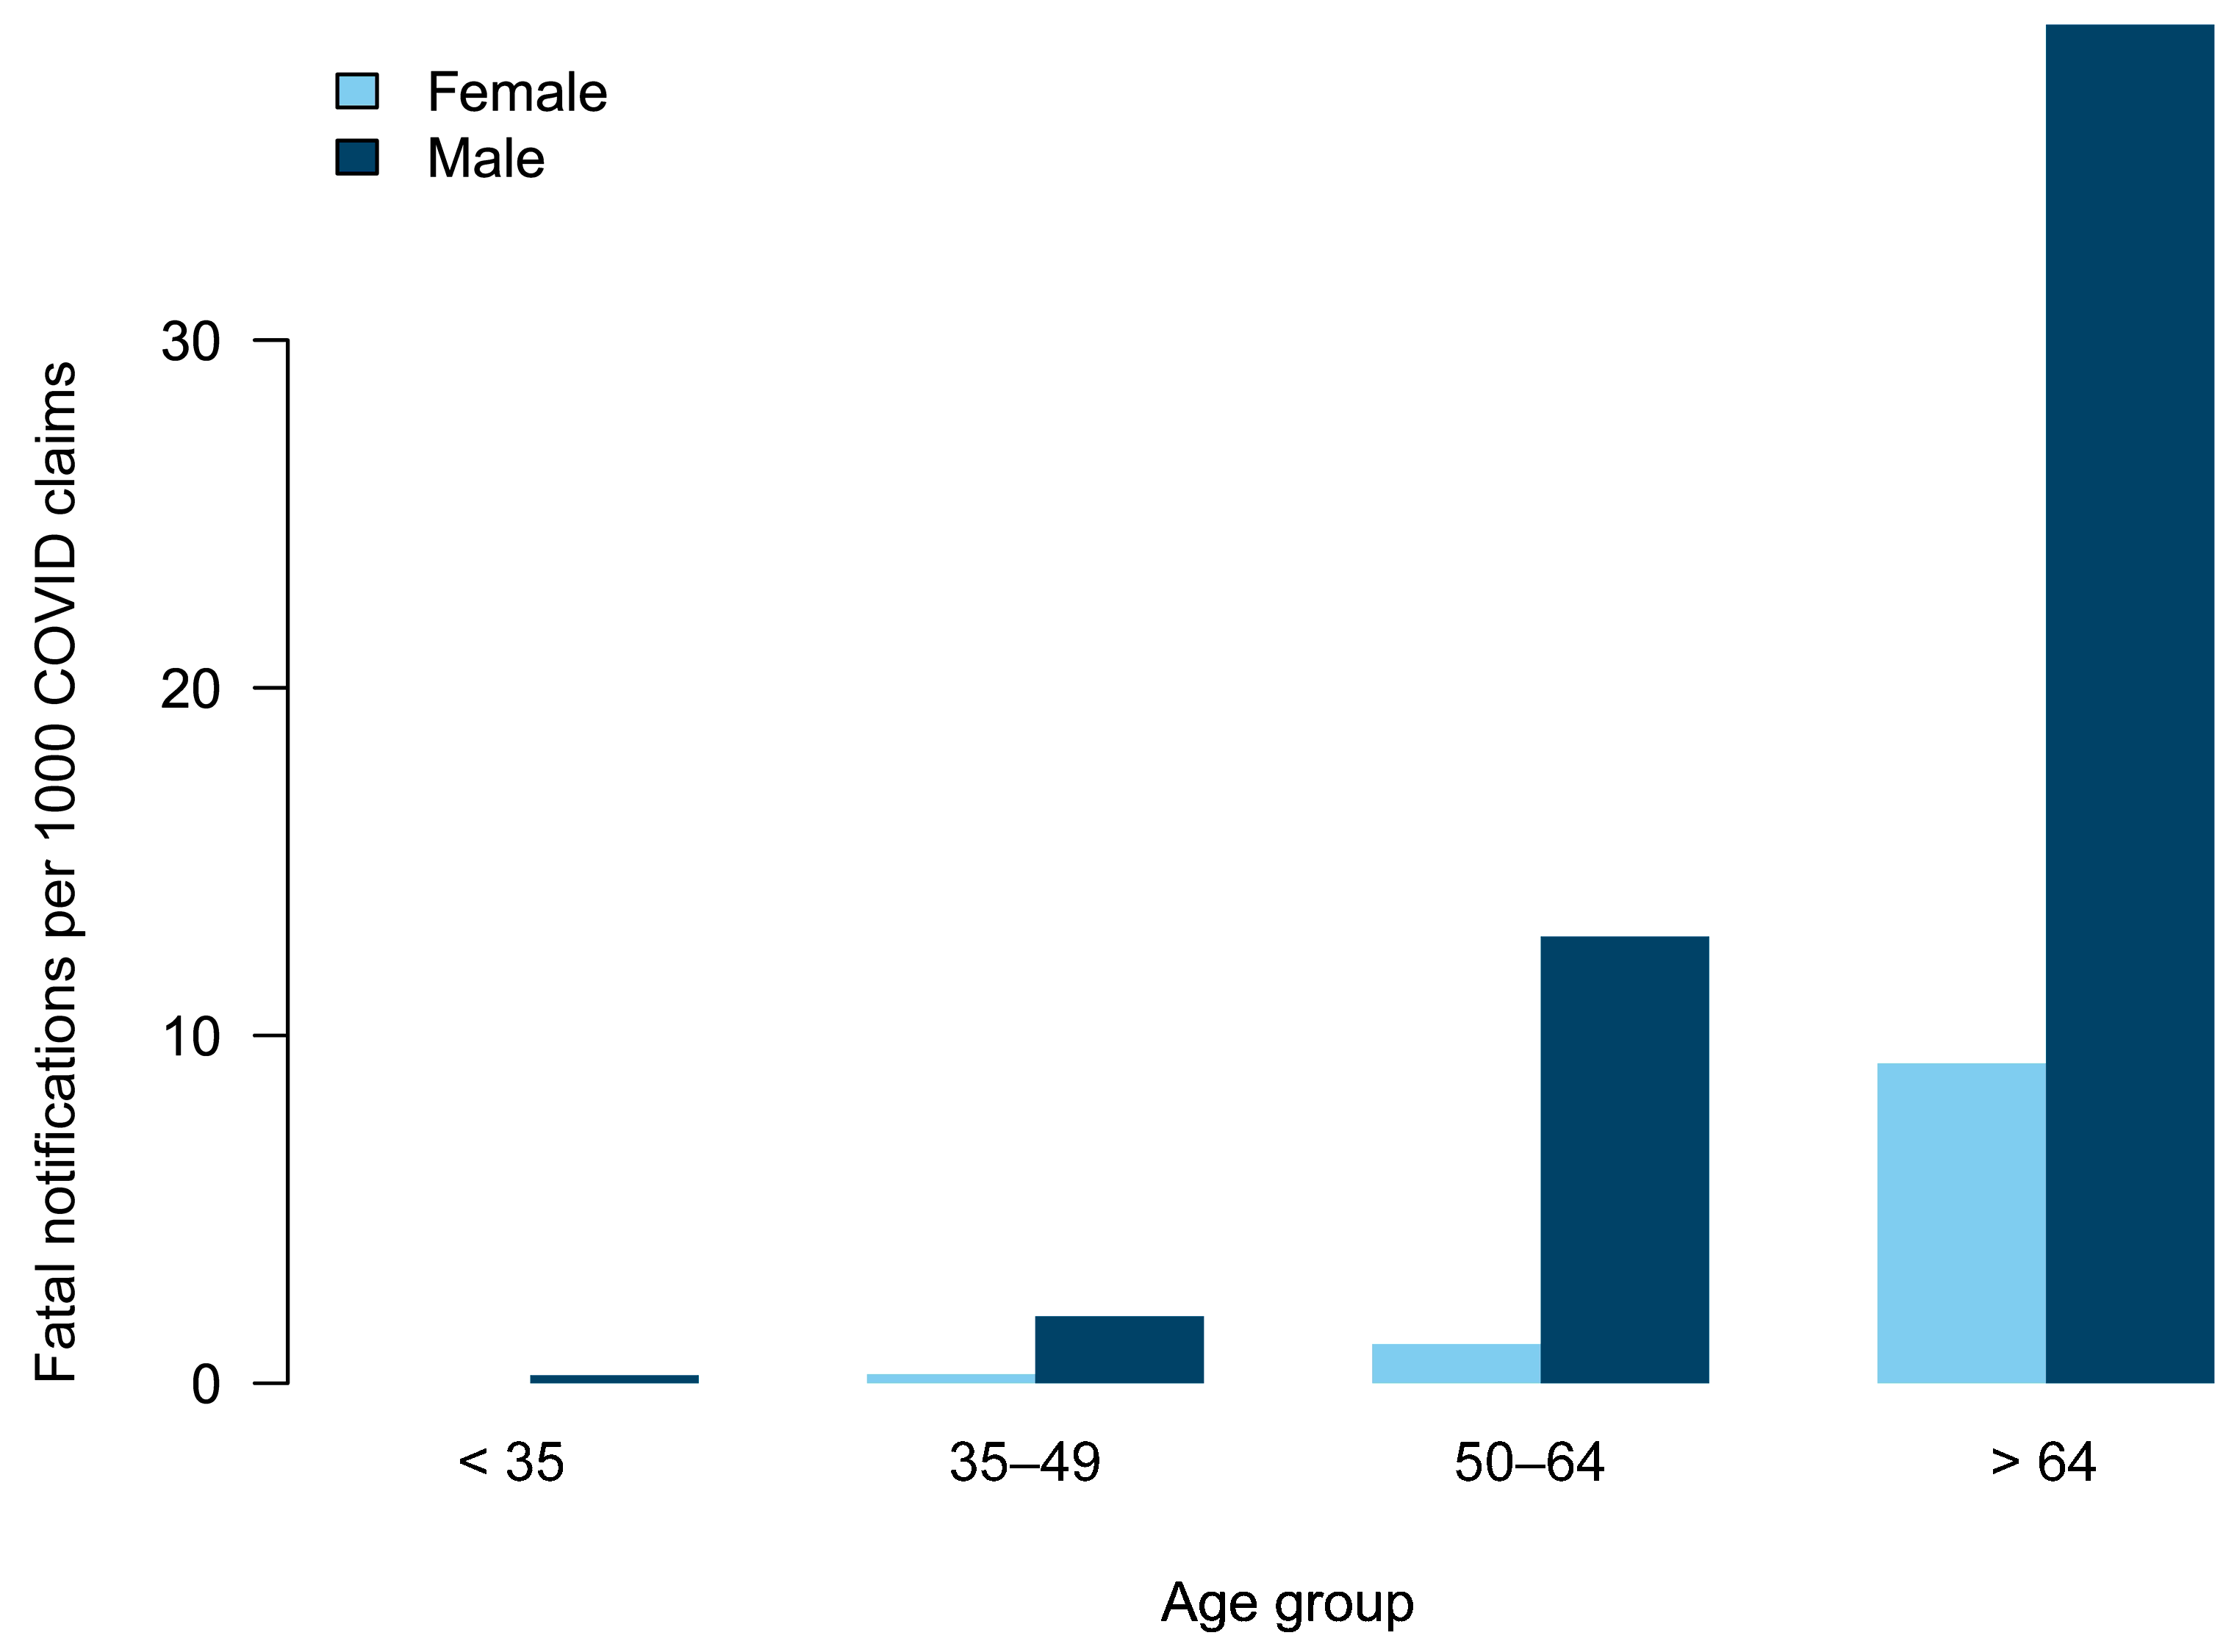
At the 30 April 2023 cut-off, the national report contained 320,724 occupational COVID-19 notifications for events from January 2020 through April 2023, including 901 fatal notifications. Fatal notifications per 1000 notified claims were higher in older age groups and among men in every published age group: 0 versus 0.23 below 35 years, 0.26 versus 1.93 at 35–49 years, 1.13 versus 12.85 at 50–64 years, and 9.20 versus 39.07 above 64 years for women and men, respectively (Figure 4). These are descriptive proportions among notified claims, not population mortality rates.
Figure 4.
Fatal notifications per 1000 notified occupational COVID-19 claims by age group and sex at 30 April 2023. Numerators and denominators are exact values from the final national report. The measure is a descriptive proportion within notified claims.
Across all event periods represented in each report, overall positive disposition was 83% at 31 December 2021, 76% at 30 April 2022, and 79% at 30 April 2023. The positive-disposition proportion among fatal notifications was 63% at all 3 cut-offs at the published precision. Among recognized claims, 96%, 95%, and 94% were reported as compensated, while mean compensated absence was 30, 27, and 23 days. At the final cut-off, temporary-disability benefits represented 99% of benefits, permanent-impairment benefits 0.8%, and survivors’ pensions 0.2%; compensated absence exceeded 4.5 million days (Table 4).
Table 4.
Overall occupational COVID-19 recognition and compensation summaries at 3 administrative cut-offs.
3.6. Regional Reconfiguration of the Claims Portfolio
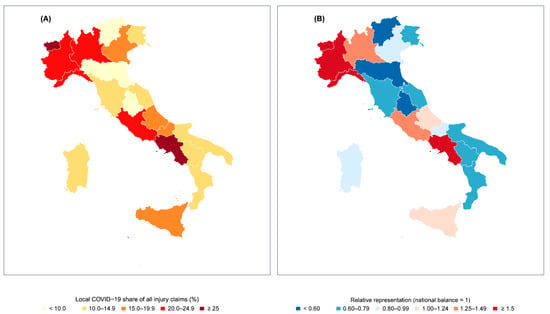
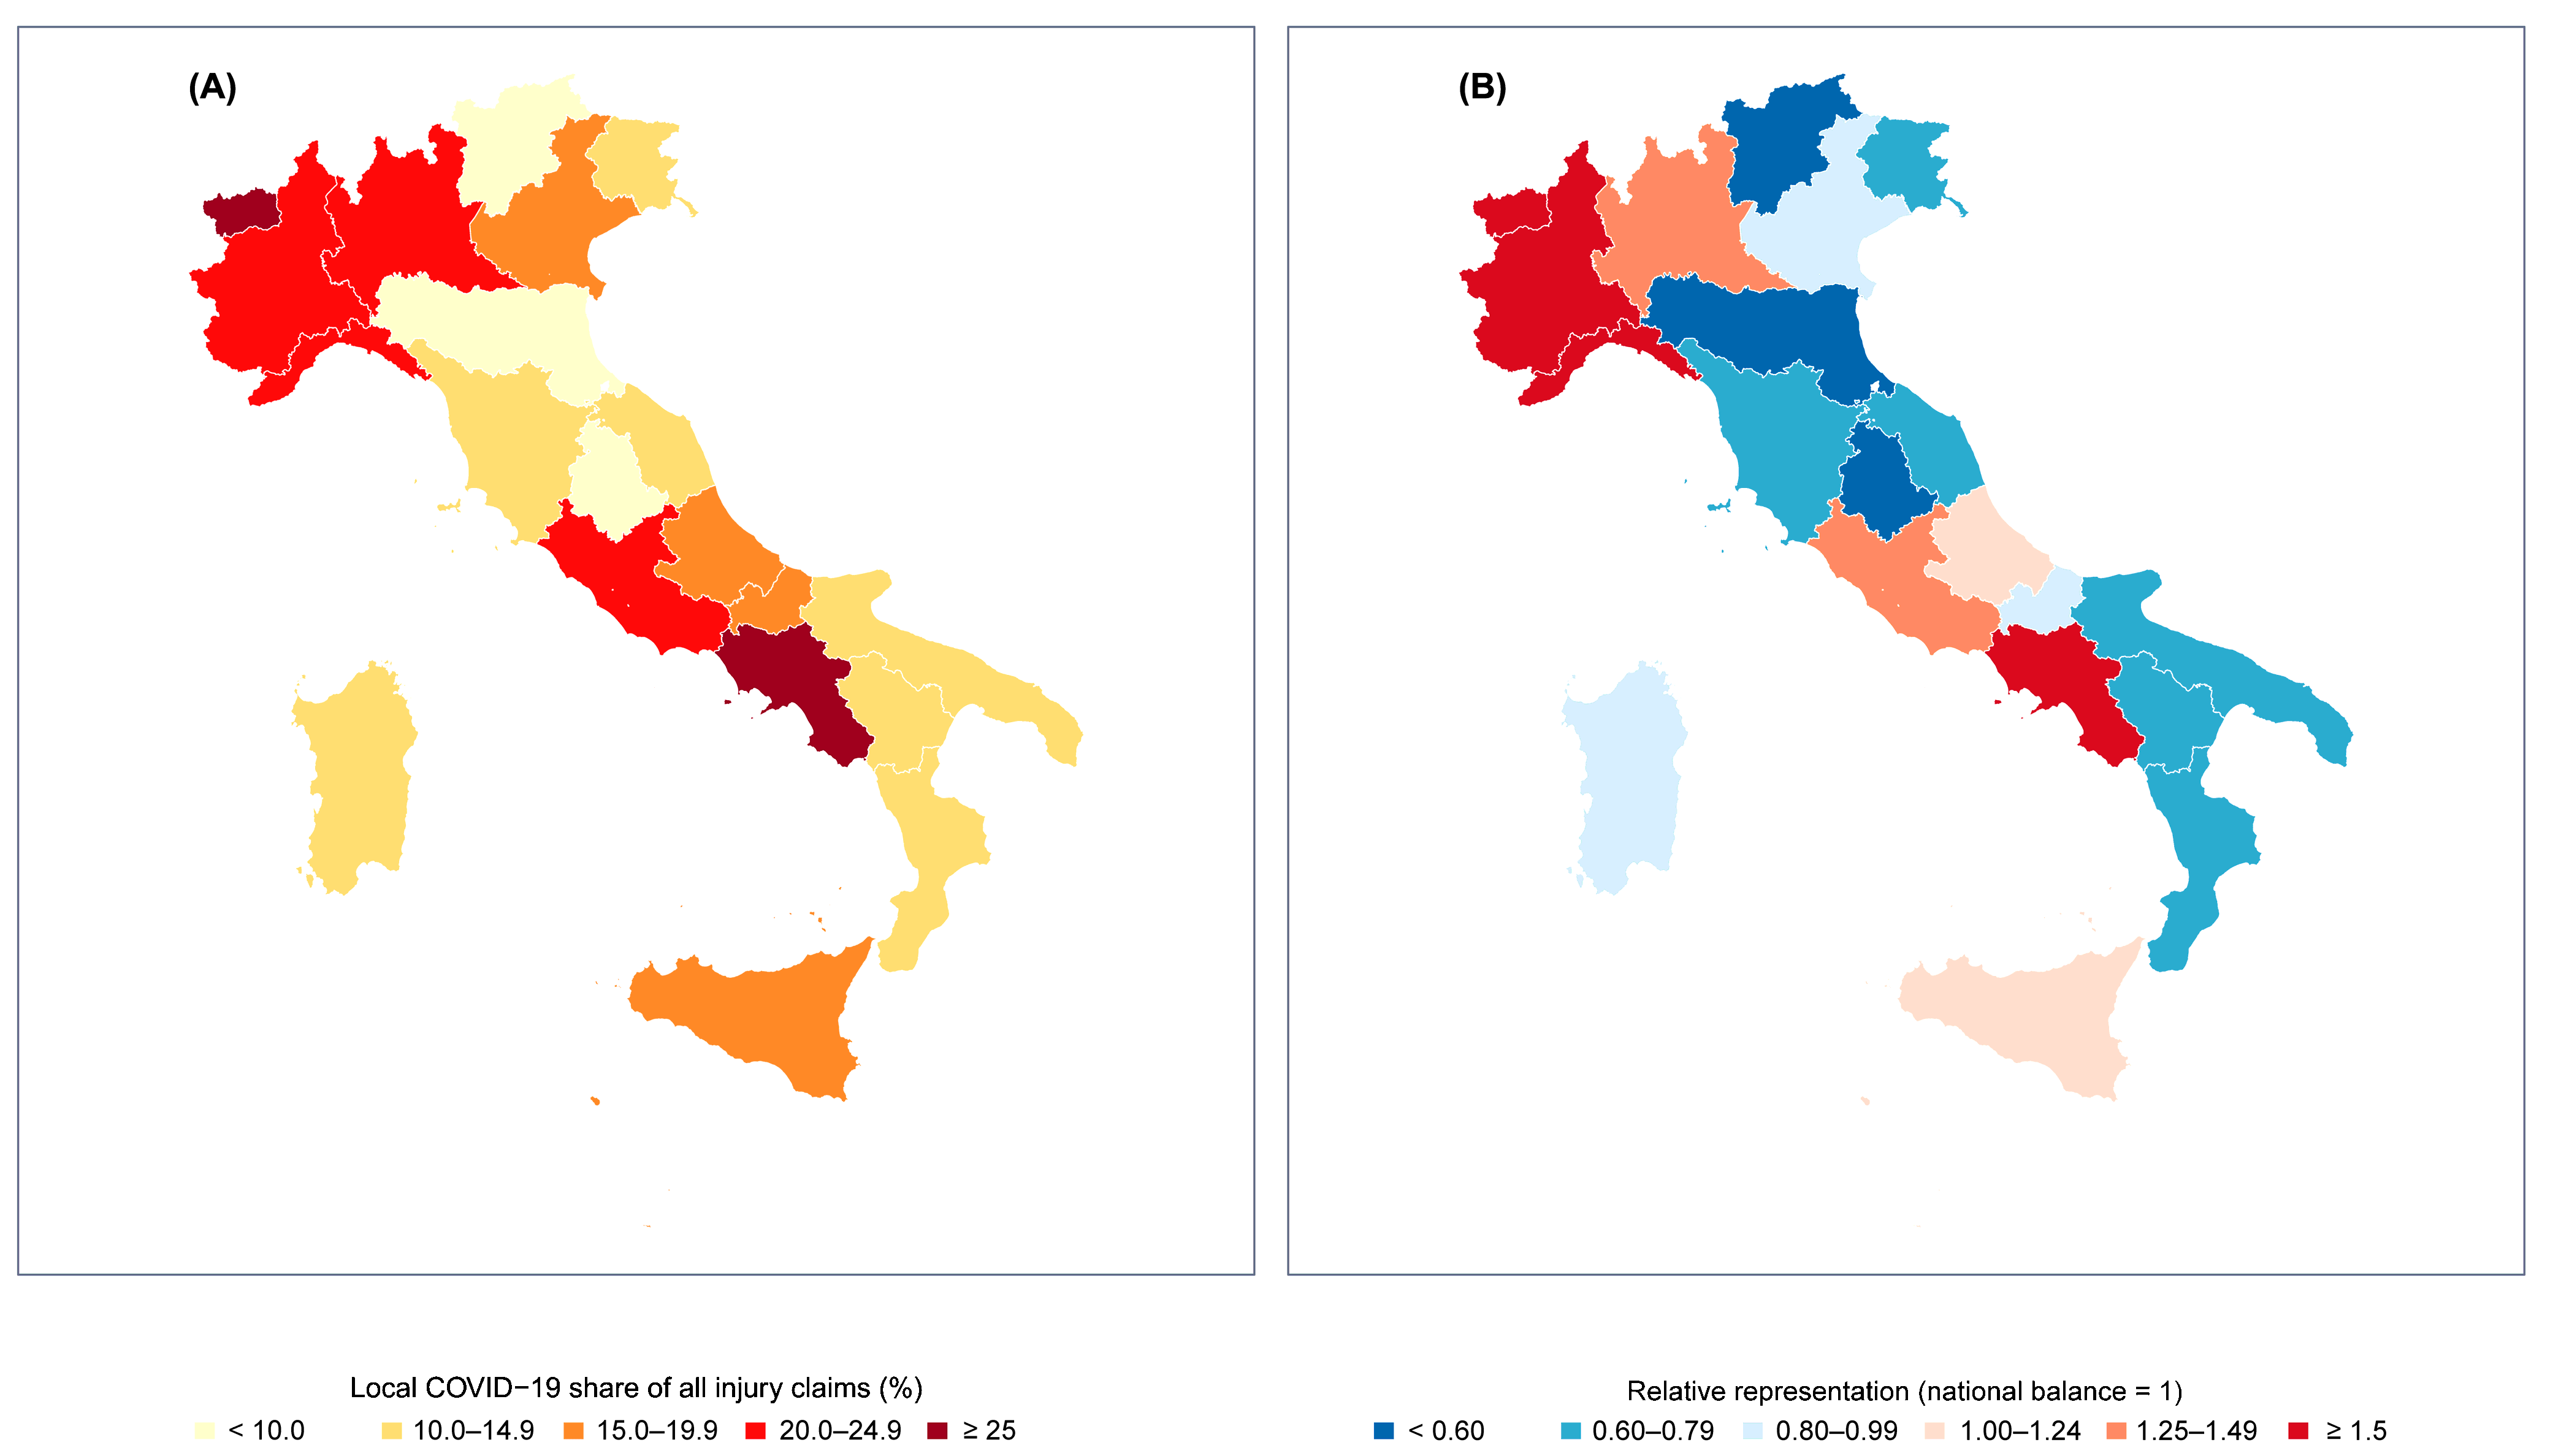
The spatial extension aligned 317,895 occupational COVID-19 notifications and 1,840,244 all-injury claims across all 20 regions for events in 2020–2022 at the 30 April 2023 cut-off. After reference management alignment and reconstruction of the non-COVID portfolio, occupational COVID-19 represented between 9.07% of the local injury claim stock in Umbria and 31.39% in Campania. Eight regions contributed a greater share of national COVID-19 claims than of national reconstructed non-COVID claims. Relative representation was highest in Campania (2.207), Valle d’Aosta (1.682), Piemonte (1.607), and Liguria (1.571), and lowest in Umbria (0.481), Emilia-Romagna (0.486), and Trentino-Alto Adige (0.530).
4. Discussion
This nationwide study found higher positive-disposition proportions for occupational COVID-19 than for reconstructed non-COVID claims and documented changes as administrative series matured. At 30 April 2023, the COVID-19 minus non-COVID differences were 26.15 percentage points for 2020, 10.58 for 2021, and 10.85 for 2022. Positive-disposition proportions also rose by two percentage points in the 2020 series and by 7.5 points in the 2021 series between December 2021 and April 2023. Every tested rounding and insurance-management scenario retained a positive difference under the primary denominator. The denominator analysis qualified this finding: the reference difference reached zero at 94.8% F-record exclusion in 2021, while the lower scenario envelope reached zero at approximately 88% in 2021 and 99% in 2022. A common cut-off supports within-year comparisons but does not equalize maturity across event years.
The pandemic supplied a naturalistic, system-level test case for insurance medicine. Infection claims were processed within a framework that classified occupational infection as an injury and applied a rebuttable evidentiary presumption to specified high-exposure activities while retaining individual medico-legal assessment. The higher positive-disposition proportion is an administrative signature of that overall pathway in the observed claim population. It combines legal classification, occupational mix, exposure opportunities, documentation, and administrative processing; these data cannot isolate an effect of the presumption or establish that individual COVID-19 claims received more favorable decisions under otherwise equivalent conditions.
Administrative maturation is a second dimension of the observed pattern. The published proportion for the 2021 series rose by 7.5 percentage points between December 2021 and April 2023, while its notification stock increased by 6391 claims; the 2020 series rose by two points. A claim-year percentage, therefore, describes an evolving administrative stock at a specified cut-off. This accords with evidence that compensation indicators change as administrative data mature [15]. At the final cut-off, pending claims in the all-injury universe accounted for 5.89% of 2022 records, compared with 1.15% in 2020 and 1.83% in 2021. Differential maturity, therefore, contributes to the interpretation of lower proportions in more recent event years; the available aggregates cannot separate its contribution from changes in claim composition or decisions.
The magnitude of the COVID-19 versus non-COVID difference varied across pandemic phases. The 26.15-percentage-point difference in 2020 coincided with the early concentration of claims among healthcare and other high-exposure workers documented by Italian surveillance [10,11,12]. Changes in the occupational distribution across later phases [13] provide a plausible compositional explanation for the narrowing to 10.58 and 10.85 points in 2021 and 2022. A broader claimant pool may include more workers whose actual duties did not support the rebuttable presumption and whose occupational infection required ordinary case-specific evidence [5,6,7]. This was not a documented withdrawal of the presumption after 2020: it remained applicable to qualifying high-exposure activities, including some non-healthcare work. Individual occupation, eligibility, and disposition were not jointly available; thus, the contribution of this shift could not be estimated. The later years, nevertheless, retained a higher positive-disposition proportion under the primary denominator.
The sensitivity analyses addressed rounded COVID-19 percentages and differences in insurance-management coverage. Enumerating compatible numerators and the tested Navigation allocations yielded scenario envelopes whose lower limits remained positive under the primary denominator. Code F requires a separate interpretation because short-duration non-COVID events can remain within the three-day waiting period, whereas confirmed occupational COVID-19 could involve protected quarantine or isolation extending beyond that period [3,5,24]. This institutional difference can affect denominator composition without representing a difference in recognition on the merits. The diagnostic removal of non-COVID F records, therefore, tested denominator sensitivity, rather than identifying a preferred denominator. Under the reference assumptions, zero was reached at 94.8% exclusion in 2021 and was not reached within 0–100% in 2020 or 2022; under the full scenario envelope, its lower edge reached zero at approximately 88% and 99% exclusion in 2021 and 2022. The direction was stable across the tested rounding and management scenarios, but denominator choice remained consequential.
At the final cut-off, 94% of claims with a positive disposition were reported as compensated, compensated absence exceeded 4.5 million days, and temporary-disability benefits constituted 99% of benefits [14]. These figures describe the scale and predominantly temporary-disability composition of compensation; no comparative estimate of financial or benefit burden was available. Fatal notifications per 1000 notified claims were higher among men and in older age groups. The figures identify age-by-sex strata with higher fatal-notification proportions within the notified claim population; they do not estimate mortality among workers or the wider population. The positive-disposition proportion among fatal notifications was 63%, compared with 79% across all notifications at the same cut-off, including the partial 2023 event period.
The lower positive-disposition proportion among fatal notifications warrants cautious medico-legal interpretation. Assessment of death-related benefits requires evidence not only of occupational acquisition but also of a causal contribution of infection to death [7,25]. The older age profile of fatal notifications [14], coexisting disease, and alternative community exposures could complicate those assessments. These are possible explanations, not observed reasons for non-recognition in this study. Comorbidity does not itself exclude a compensable contribution from occupational infection, and these data do not demonstrate a formally higher standard of proof for fatal claims. The aggregates do not report individual decision reasons, death-causation assessments, or processing times; the 63% figure is not a survivor-pension award rate.
The regional extension showed variation in claim composition: COVID-19 accounted for 9.07–31.39% of regional injury claim stocks and 8 of 20 regions contributed a greater share to the national COVID-19 portfolio than to the reconstructed non-COVID portfolio. The relative representation index identified Campania, Valle d’Aosta, Piemonte, and Liguria as the highest concentrations relative to their non-COVID portfolios (Figure 5). These measures describe the composition of notified caseloads, rather than directly measuring staff workload or regional recognition. They remain conditional on applying the national 0.6% Navigation adjustment uniformly; actual regional management shares may differ.
Figure 5.
Regional reconfiguration of the Italian occupational-injury claims portfolio during the COVID-19 emergency, for events in 2020–2022 observed at 30 April 2023. Panel (A) shows management-aligned occupational COVID-19 notifications as a percentage of all locally notified injury claims; and panel (B) shows relative representation: each region’s percentage contribution to national COVID-19 claims compared with its percentage contribution to national reconstructed non-COVID claims; 1 marks national balance, higher values indicate disproportionate COVID-19 concentration, and lower values indicate the converse. COVID-19 counts were obtained from the 21 final territorial monitoring reports after exclusion of exactly reported January–April 2023 events; the 0.6% Navigation reference adjustment was applied consistently with the national reconstruction. Polygons are official, generalized Istat regional boundaries valid on 1 January 2023.
The Italian experience is informative in a wider comparative setting. Nys et al. found that most European systems permitted some form of occupational COVID-19 recognition, but legal classification, occupational eligibility, proof requirements, and benefits differed markedly [1]. The present study adds two within-system dimensions: an exceptional claim pathway may display a recognition pattern distinct from the surrounding compensation population; and the measured magnitude of that pattern changes with administrative follow-up. Cross-jurisdictional comparisons should, therefore, align diagnostic and legal definitions, contemporaneous comparator populations, event-year coverage, administrative maturity, and outcome coding.
Major strengths include complete capture of the 21 geographical components of the nationwide injury snapshot, all 32 national reports, and all 21 final territorial reports; exact same-cut-off alignment of the 20-region spatial extension; linkage to official Istat boundaries; a documented source archive and machine-readable provenance manifest; validation checks; and explicit treatment of rounded numerators, management mismatch, and denominator specification. The tipping-point analysis expresses the stability of the central recognition finding directly, without attaching artificial sampling precision to near-census administrative counts.
The public-source structure defines the study’s limits. The injury master contained no COVID-19 flag, making the comparator an aggregate arithmetic reconstruction rather than a record-level matched group. Individual adjustment for occupation, region, age, sex, severity, diagnostic evidence, and adjudication pathway was unavailable in the national comparison. These factors may explain part of the observed difference and prevent causal attribution to the presumption or another single legal mechanism. Repeated releases represented open administrative stocks and could not identify individual transitions or time to decision. A shared cut-off did not eliminate unequal follow-up across event years; COVID-19 pending counts were not available separately by event year. COVID-19 outcomes appeared as rounded aggregates in only three releases, Navigation was present only in the COVID-19 reporting universe, and notified claims did not enumerate every occupational infection. The uniform regional Navigation share was a simplifying assumption; differences in actual regional shares could alter the mapped composition measures. Regional outcome numerators were unavailable; the spatial extension, therefore, described claim composition rather than regional positive-disposition proportions. Province-level sources could not provide an equally mature comparator with exact event-period alignment. The estimand remains a cut-off-specific administrative outcome within the observed claim population.
The findings support a practical reporting standard for future occupational epidemics. Surveillance systems should publish exact recognition numerators and denominators simultaneously by event year, observation cut-off, administrative status, and insurance management. Successive releases should distinguish newly notified claims from corrections, reclassifications, and decisions on previously reported claims. Maturation curves and transparent status-specific denominators would enable medico-legal practitioners, occupational physicians, insurers, and policymakers to distinguish evolving adjudication from changes in epidemic or occupational risk. Administrative maturation should be incorporated into surveillance design from the outset.
5. Conclusions
At the shared 30 April 2023 cut-off, occupational COVID-19 claims had positive-disposition proportions that were 10.58–26.15 percentage points higher than reconstructed non-COVID injury claims. The published proportion for 2021 claims increased by 7.5 points between December 2021 and April 2023. Every tested rounding and insurance-management scenario retained a positive difference under the primary denominator. With progressive exclusion of non-COVID communication/franchise records, the reference difference reached zero at 94.8% exclusion in 2021 and did not reach zero within 0–100% exclusion in 2020 or 2022; the lower scenario-envelope edge reached zero at approximately 88% in 2021 and 99% in 2022. The regional extension described COVID-19 shares of 9.07–31.39% of regional claim stocks under the uniform Navigation assumption. These findings support joint reporting of disposition-specific numerators, denominators, event year, observation cut-off, and insurance management. They describe administrative patterns rather than a causal effect of a legal rule or eventual recognition. Future occupational-epidemic surveillance should include repeated snapshots to make maturation and denominator composition explicit.
Supplementary Materials
The following supporting information can be downloaded at: https://www.mdpi.com/article/10.3390/covid6110192/s1. Supplementary Methods: Supplementary Methods S1: Data provenance and extraction; Supplementary Methods S2: Aggregate reconstruction and rounded numerators; Supplementary Methods S3: Management concordance; Supplementary Methods S4: Denominator specification; Supplementary Methods S5: Validation, privacy, and reproducibility; Supplementary Methods S6: Regional spatial extension. Figure S1: Administrative disposition profile for all valid-mode injury records at the shared 30 April 2023 cut-off. Bars show the percentage classified as positive, negative, communication/franchise, or pending in each event year. Supplementary Tables: Table S1: Consecutive changes in the repeated recognition series. pp, percentage points; Table S2A: Reference reconstruction at the shared 30 April 2023 cut-off. Comparable counts are scenario-equivalent quantities under the 0.6% Navigation reference assumption; Table S2B: Reference effect measures and complete predefined rounding-and-management envelopes; Table S3: Reference-scenario denominator tipping points; Table S4: Exact fatal occupational COVID-19 notifications by age and sex at 30 April 2023; Table S5: All-valid-mode and work-occasion-only injury universes at the final cut-off. F, communication/franchise; Table S6: Source and automated validation summary; Table S7A: Regional COVID-19 and reconstructed non-COVID claim composition, official region codes 1–10; Table S7B: Regional COVID-19 and reconstructed non-COVID claim composition, official region codes 11–20; Table S8: Regional source reconciliation and linkage to official ISTAT polygons. Supplementary Data S1: Complete 303-row communication/franchise denominator-sensitivity scenario grid, providing the minimum and maximum COVID-19 versus reconstructed non-COVID positive-disposition differences across the evaluated fractions of excluded F records. Machine-readable CSV versions of Tables S1–S8 are also provided. Supplementary File: The completed STROBE and RECORD reporting checklists, prepared in accordance with the corresponding published guidelines [16,17], are also provided as supplementary materials.
Author Contributions
Conceptualization, T.D.; methodology, T.D. and G.M.; software, T.D.; validation, T.D. and G.M.; formal analysis, T.D.; investigation, T.D. and G.M.; data curation, T.D.; writing—original draft preparation, T.D.; writing—review and editing, T.D. and G.M.; visualization, T.D.; project administration, T.D. All authors have read and agreed to the published version of the manuscript.
Funding
This research received no external funding.
Institutional Review Board Statement
Not applicable. The study used exclusively public secondary administrative data, involved no participant contact or intervention, and reported only aggregate non-identifying results.
Informed Consent Statement
Not applicable. The study used secondary public administrative data and involved no participant contact.
Data Availability Statement
The original analysis-ready aggregate data, source manifest, data dictionary, processing and statistical code, validation outputs, tables, and figures are openly available in Zenodo at https://doi.org/10.5281/zenodo.22729485 (accessed on 28 October 2026). The accompanying revised supplement provides the updated tipping-point presentation and revision-specific source data and figure code. Institutional INAIL sources, original URLs, retrieval dates, file sizes, and licenses are documented in the repository manifest. Claim-level Apache Parquet files (generated using PyArrow version 21.0.0), DuckDB database objects (DuckDB version 1.5.5), and sparse multidimensional strata are not redistributed; they can be reconstructed from the institutional source files using the archived code.
Acknowledgments
T.D., is supported for this research by University of Rome Tor Vergata, Doctoral Course of Medical-Surgical Biotechnologies and Translational Medicine, XLI Cycle. The authors acknowledge INAIL for maintaining the public occupational-injury datasets and occupational COVID-19 monitoring archive.
Conflicts of Interest
The authors declare no conflicts of interest.
Abbreviations
The following abbreviations are used in this manuscript:
| Abbreviation | Meaning |
| COVID-19 | Coronavirus disease 2019 |
| F | Communication/franchise administrative disposition |
| INAIL | Italian National Institute for Insurance against Accidents at Work |
| RECORD | REporting of studies Conducted using Observational Routinely collected health Data |
| STROBE | Strengthening the Reporting of Observational Studies in Epidemiology |
| Istat | Italian National Institute of Statistics |
References
- Nys, E.; Pauwels, S.; Adam, B.; Amaro, J.; Athanasiou, A.; Bashkin, O.; Bric, T.K.; Bulat, P.; Caglayan, C.; Canu, I.G.; et al. Recognition of COVID-19 with occupational origin: A comparison between European countries. Occup. Environ. Med. 2023, 80, 694–701. [Google Scholar] [CrossRef] [Scilit] [PubMed]
- European Commission. Commission Recommendation (EU) 2025/2609 of 18 December 2025 Concerning the European Schedule of Occupational Diseases. 2025. Available online: https://eur-lex.europa.eu/eli/reco/2025/2609/oj/eng (accessed on 3 September 2026).
- Italian Republic. Decreto-Legge 17 Marzo 2020, n. 18, Art. 42. Available online: https://www.normattiva.it/eli/id/2020/03/17/20G00034/CONSOLIDATED/20201109 (accessed on 3 September 2026).
- Italian Republic. Legge 24 aprile 2020, n. 27: Conversione in Legge, con Modificazioni, del Decreto-Legge 17 Marzo 2020, n. 18. Gazz. Uff. 2020, No. 110, Suppl. Ord. No. 16, pp. 1–39. Available online: https://www.gazzettaufficiale.it/eli/id/2020/04/29/20G00045/sg (accessed on 3 September 2026).
- Istituto Nazionale per l’Assicurazione contro gli Infortuni sul Lavoro (INAIL). Circolare n. 13 del 3 Aprile 2020: Tutela Infortunistica nei casi Accertati di Infezione da Coronavirus (SARS-CoV-2) in Occasione di Lavoro. Available online: https://www.inail.it/content/dam/inail-hub-site/documenti/2020/04/circolare%20n%2013%20del%203%20aprile%202020%20.pdf (accessed on 3 September 2026).
- INAIL. Circolare n. 22 del 20 Maggio 2020: Tutela Infortunistica nei casi Accertati di Infezione da Coronavirus (SARS-CoV-2) in Occasione di Lavoro-Chiarimenti. Available online: https://www.inail.it/content/dam/inail-hub-site/documenti/2020/05/circolare%20n%2022%20del%2020%20maggio%202020,0.pdf (accessed on 3 September 2026).
- INAIL, Sovrintendenza Sanitaria Centrale. Raccomandazione SSC n. 8/2020. Available online: https://www.inail.it/content/dam/inail-hub-site/documenti/2021/10/Raccomandazione%20SSC%208.pdf (accessed on 3 September 2026).
- Cirrincione, L.; Rapisarda, V.; Mazzucco, W.; Provenzano, R.; Cannizzaro, E. SARS-CoV-2 and the Risk Assessment Document in Italian Work; Specific or Generic Risk Even If Aggravated? Int. J. Environ. Res. Public Health 2021, 18, 3729. [Google Scholar] [CrossRef] [Scilit] [PubMed]
- Cirrincione, L.; Plescia, F.; Ledda, C.; Rapisarda, V.; Martorana, D.; Lacca, G.; Argo, A.; Zerbo, S.; Vitale, E.; Vinnikov, D.; et al. COVID-19 Pandemic: New Prevention and Protection Measures. Sustainability 2022, 14, 4766. [Google Scholar] [CrossRef] [Scilit]
- Marinaccio, A.; Boccuni, F.; Rondinone, B.M.; Brusco, A.; D’Amario, S.; Iavicoli, S. Occupational factors in the COVID-19 pandemic in Italy: Compensation claims applications support establishing an occupational surveillance system. Occup. Environ. Med. 2020, 77, 818–821. [Google Scholar] [CrossRef] [Scilit] [PubMed]
- Marinaccio, A.; Brusco, A.; Bucciarelli, A.; D’Amario, S.; Iavicoli, S. Temporal trend in the compensation claim applications for work-related COVID-19 in Italy. Med. Lav. 2021, 112, 219–228. [Google Scholar] [CrossRef] [Scilit] [PubMed]
- Marinaccio, A.; Gariazzo, C.; Brusco, A.; Bucciarelli, A.; D’Amario, S.; Scarselli, A.; Iavicoli, S. Occupational impact in COVID-19 pandemic according to one year of compensation claims in Italy. Epidemiol. Prev. 2021, 45, 513–521. [Google Scholar] [CrossRef] [Scilit] [PubMed]
- Boccuni, F.; Rondinone, B.M.; Buresti, G.; Brusco, A.; Bucciarelli, A.; D’Amario, S.; Persechino, B.; Iavicoli, S.; Marinaccio, A. COVID-19 occupational risk incidence and working sectors involved during the pandemic in Italy. Saf. Health Work 2023, 14, 398–405. [Google Scholar] [CrossRef] [Scilit] [PubMed]
- INAIL. Scheda Nazionale Infortuni COVID-19: Dati Rilevati al 30 Aprile 2023. 26 May 2023. Available online: https://www.inail.it/content/dam/inail-hub-site/documenti/2023/05/scheda-tecnica-contagi-covid-30-aprile-2023.pdf (accessed on 3 September 2026).
- LeBeau, M.; Duguay, P.; Boucher, A.; Busque, M.A. The impact of compensation data maturity on OHS indicators. Saf. Sci. 2020, 121, 542–549. [Google Scholar] [CrossRef] [Scilit]
- von Elm, E.; Altman, D.G.; Egger, M.; Pocock, S.J.; Gotzsche, P.C.; Vandenbroucke, J.P.; STROBE Initiative. The Strengthening the Reporting of Observational Studies in Epidemiology (STROBE) statement: Guidelines for reporting observational studies. BMJ 2007, 335, 806–808. [Google Scholar] [CrossRef] [Scilit] [PubMed]
- Benchimol, E.I.; Smeeth, L.; Guttmann, A.; Harron, K.; Moher, D.; Petersen, I.; Sørensen, H.T.; von Elm, E.; Langan, S.M. The REporting of studies Conducted using Observational Routinely-collected health Data (RECORD) statement. PLoS Med. 2015, 12, e1001885. [Google Scholar] [CrossRef] [Scilit] [PubMed]
- INAIL. Archivio dei Report Nazionali Sulle Denunce di Infortunio da COVID-19. Available online: https://www.inail.it/portale/it/inail-comunica/covid/prodotti-informativi/report-covid-19.html (accessed on 3 September 2026).
- INAIL. COVID-19, Dall’inizio della Pandemia Denunciati più di 320mila Contagi sul Lavoro. Available online: https://www.inail.it/portale/it/inail-comunica/news/notizia.2023.05.covid-19-dall-inizio-della-pandemia-denunciati-pi-di-320mila-contagi-sul-lavoro.html (accessed on 12 September 2026).
- Istituto Nazionale di Statistica (Istat). Confini delle Unità Amministrative a Fini Statistici. Available online: https://www.istat.it/notizia/confini-delle-unita-amministrative-a-fini-statistici-al-1-gennaio-2018-2/ (accessed on 12 September 2026).
- INAIL. Dati Storici-Infortuni sul Lavoro. Available online: https://dati.inail.it/portale/it/gli-open-data-inail/dati-storici/infortuni-sul-lavoro.html (accessed on 3 September 2026).
- INAIL. Infortuni sul Lavoro-Dati con Cadenza Semestrale. Available online: https://dati.inail.it/portale/it/dataset/infortuni-sul-lavoro/dati-con-cadenza-semestrale.html (accessed on 3 September 2026).
- INAIL. Infortuni sul Lavoro-Tabelle Tipologiche. Available online: https://dati.inail.it/portale/it/dataset/infortuni-sul-lavoro/tipologiche.html (accessed on 3 September 2026).
- INAIL. Indennità Giornaliera per Inabilità Temporanea Assoluta. Available online: https://www.inail.it/portale/assicurazione/it/lassicurazione-inail/quali-sono-le-prestazioni-di-inail/prestazioni-economiche/indennita-giornaliera-per-inabilita-temporanea-assoluta.html (accessed on 15 October 2026).
- INAIL. Rendita ai Superstiti. Available online: https://www.inail.it/portale/assicurazione/it/lassicurazione-inail/quali-sono-le-prestazioni-di-inail/prestazioni-economiche/rendita-ai-superstiti.html (accessed on 15 October 2026).

Disclaimer/Publisher’s Note: The statements, opinions and data contained in all publications are solely those of the individual author(s) and contributor(s) and not of MDPI and/or the editor(s). MDPI and/or the editor(s) disclaim responsibility for any injury to people or property resulting from any ideas, methods, instructions or products referred to in the content. |
© 2026 by the authors. Licensee MDPI, Basel, Switzerland. This article is an open access article distributed under the terms and conditions of the Creative Commons Attribution (CC BY) license.