


Abstract
Resin 3D-printed molds are being increasingly favored for PDMS microfluidics across many disciplines. However, resin diversity, as well as secret manufacturer formulations, leads to a lack of standardization when using 3D printing for microscale applications. The impact of physical resin properties, both in its monomeric concoction and polymerized lattices at 100 µm or lower scales, needs quantification. We tested the performance of locally available resin formulations, isolating the impact of resin pigments and how it impacted the resin’s properties and performance. Lower resin viscosity improved feature fidelity (edge filleting < 25 µm) and improved resolution limit for recessed features, while cured polymer mechanical strength impacted the limit for positive mold features. We combined our findings to fabricate quality negative and positive mold structures in the mold and determined the best protocols associated with limitations during the fabrication of such structures. The methodologies in this study are expected to be widely applicable across various resin types and simplify the adoption of 3D printing protocols for specific feature fabrication in microscale molds for PDMS devices.
1. Introduction
Soft lithography microfluidics has been monumental in the development of intricate, small-scale, high-throughput technologies. These include large-scale, low-medium cell culture [1,2], cell screening [3,4], cell manipulation [5,6], small animal manipulation [7,8], and bio-robotics manipulation [9,10]. The first step in PDMS soft lithography is the fabrication of a master mold. With recent advances in 3D printing technology [11], Stereolithographic (SLA) and Vat Photopolymerization (VPP) have become a popular choice for microfluidic mold fabrication in many institutions. The wide availability of 3D printers and resins in the maker and hobbyist space has made this approach low-cost [12,13] and easily accessible, enabling microfluidics research without expensive equipment or specialized skill sets.
Due to high market demands [14], numerous companies have presented resin formulations for different applications. These resins are based on some combination of methacrylate monomers with a photo initiator [15,16,17,18], along with additives such as plasticizers, pigments, and photo absorbers. The pigment-related chemicals often have a dual role as photo absorbers [19] or UV scattering [20,21]. Manufacturers use models such as the Grunberg–Nissan viscosity model [22] to target an intended viscosity [23] and safe cure temperature. However, they rarely account for how these physical values affect the resin’s applicability at the microscale. In microfluidic mold fabrication, even small dimensional deviations that would be negligible in other applications can significantly alter device performance. Careful resin selection is therefore critical.
Manufacturers advertise resins using buzzwords such as “8 K”, “10 K”, “Ultra”, and “High Toughness”. However, these labels make it difficult to assess actual performance limitations, particularly in microfluidics where print fidelity is critical. Resins have been widely evaluated for flexural strength in dental [24,25,26] and orthodontic [27,28] contexts [29,30,31], including in vivo study [32]. These findings, however, are not directly applicable to microfluidic molds. Resin viscosity is another important consideration for “bottom-up”-style 3D printers. Low viscosity reduces the viscous forces acting on the print as it is lifted from the vat. Despite this, the broader impact of viscosity on print quality, beyond lift forces, has not been systematically investigated.
Most current research in resin 3D printing for microfluidics focuses on the post-processing [33,34,35]. This is because residual liquid resin can inhibit soft lithographic curing [36,37] and reduce biocompatibility [38,39] in medical and biological applications. However, printability and dimensional accuracy also deserve attention. Improper resin selection or shifts in fabrication precision by just a few microns can compromise device quality and reproducibility. Many factors affect print quality, including layer height, exposure time, print orientation, light wavelength, photo initiator type, photo absorber type, and the particle size of suspended components. Quantifying each factor independently is difficult. However, it should be possible to predict resin behavior comparatively from physical properties alone, helping users navigate marketing claims.
Despite the importance of resin selection for microscale applications, no prior work has systematically linked resin viscosity and ultimate tensile strength to microscale fabrication performance in VPP-based microfluidic molds. Both parameters are either supplier-reported or rapidly measurable in-lab, making them practical guides that require no chemical characterization. In this study, we evaluated common microfluidic structures at sub-1000 µm scales. We found that the minimum printable dimension for positive features correlates with the tensile properties of the cured resin, while the limit for negative (recessed) features and print sharpness correlate with resin viscosity. These two parameters thus serve as accessible, chemistry-free guides for resin selection and a framework for efficient adoption of 3D-printed microfluidic molds.
2. Materials and Methods
2.1. Equipment and Materials
The resins that we tested for this paper were the SK High Toughness Grey (SK01U) and the SK High Toughness White (SK02U), which are denoted as Grey and White resin, respectively. Both are from the SK Honpo (Tokyo, Japan)High Toughness series. The detailed formulation is not publicly disclosed by the manufacturer; the acrylate-based assignment in this study was based on FTIR measurements (Nicolet Summit X, Thermo Fisher, Waltham, MA, USA). As is characteristic of such proprietary formulations, the product specification does not explicitly disclose the components or the dye ratios. Accordingly, we do not assign a specific base composition solely from the manufacturer documentation; instead, we interpret these resins as photopolymer materials with spectral features consistent with an (meth)acrylate-based system, which have been widely used as main material for microfluidic mold fabrication [40].
White photopolymer resins employ inorganic scattering particles such as TiO2 to achieve opacity [41]. The formulation of Grey photopolymer resins in commercial practice typically involves adding a small amount of carbon black (approximately 1 wt% of the pigment content) to a White TiO2-based base resin [42]. We hypothesized that the same could be the case in the resins we tested. We also prepared a mixture at a ratio of 4:1 (White: Grey) to determine if modifying resin properties through simple resin blending could be a viable method for tuning performance when printing microfluidic molds. This mixture is designated in the text as “Mixed Resin”.
All mold samples and specimens for tensile testing were 3D-printed using a Sonic Mini 8K 3D printer (Phrozen, Hsinchu City, Taiwan). The pixel size of the screen is 22 µm × 22 µm, which represents the nominal XY pixel pitch of the LCD screen rather than a guaranteed minimum printable feature size. Both the printer and the resins were acquired from SK Honpo’s online store.
2.2. 3D Printer Screen Power Measurement
Our model of 3D printer uses a single LED module projected onto the screen through a large Fresnel lens to illuminate the masks displayed. To understand the exact power output from the 3D printer screen and ensure irradiance uniformity while printing our samples, we recorded the flux from the screen using an Optical Power Meter (Thorlabs PM400, Newton, NJ, USA) at 8 separate points (2 vertical × 4 horizontal) when the screen was fully illuminated. Five measurements were taken and then averaged for each zone.
2.3. Overcuring Measurement: Sample Preparation
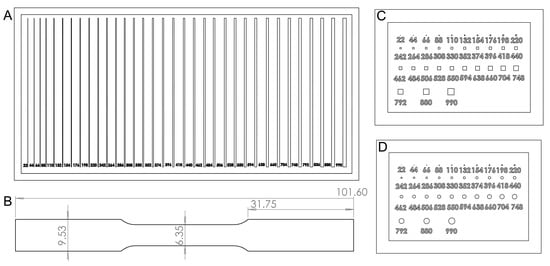
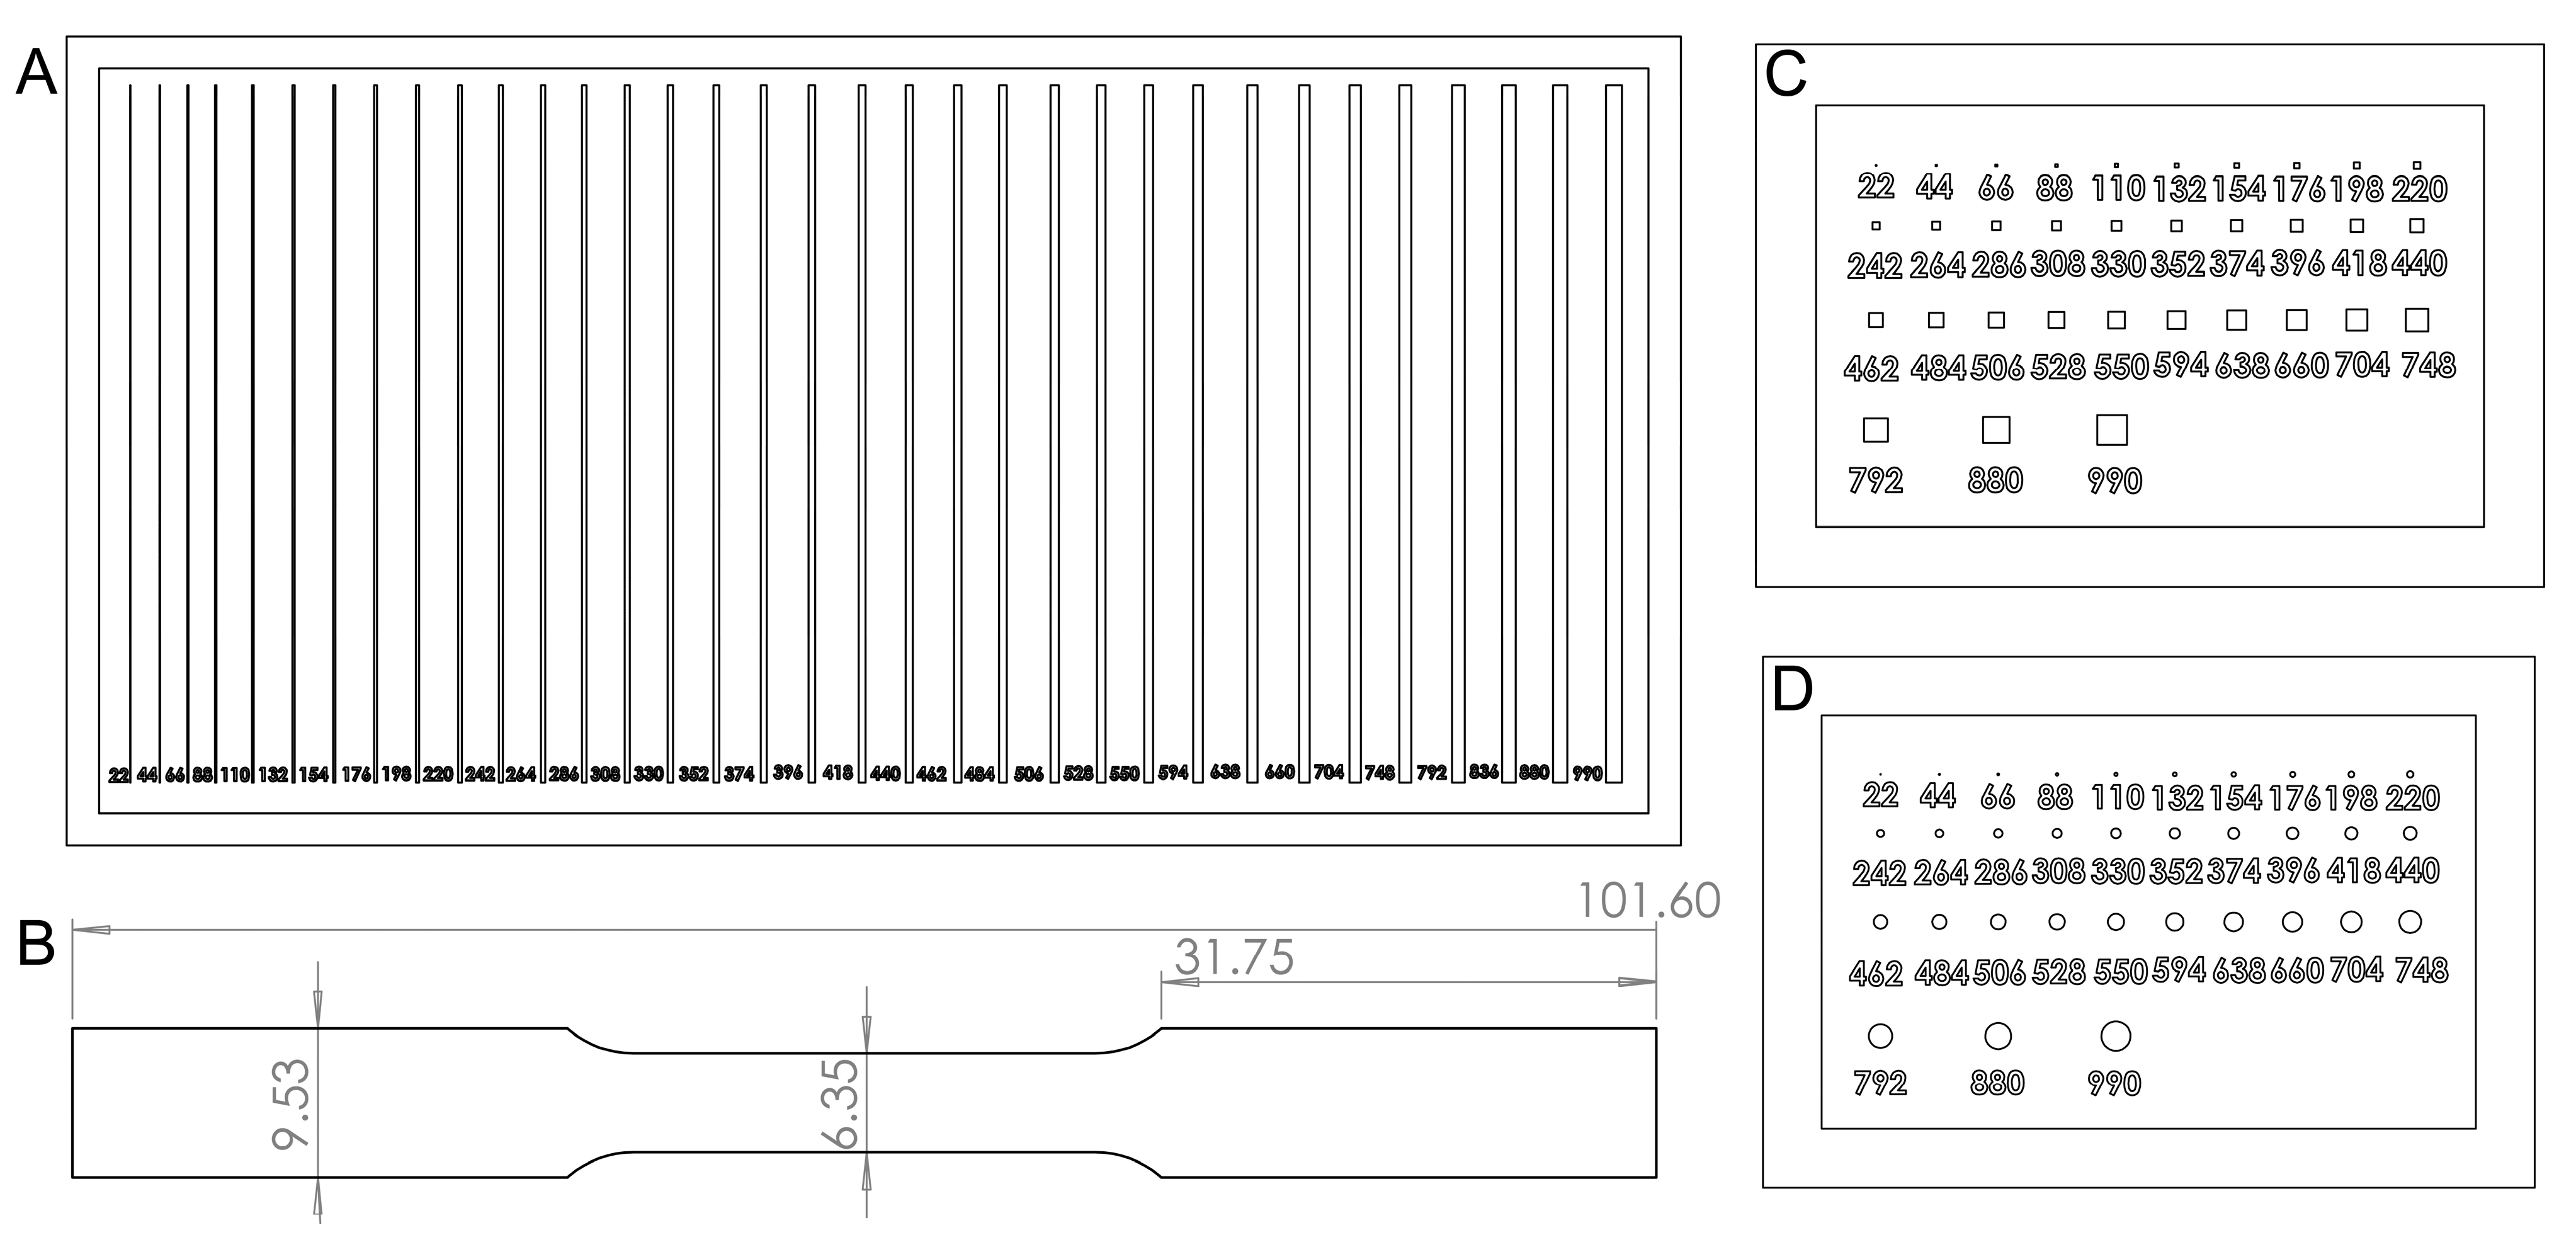
To test the performance of the resins in a microfluidic context, we designed three molds using SolidWorks 2021 SP0.0 with squares, circles, and lines (Figure 1A–C), the most common structures used in microfluidic devices. The structures were 200 µm deep to assist in cross-sectional observation. The sizes of the structures started at 22 µm (width and height for squares, radii for circles, and width for the lines) and increased by 22 µm to 550 µm, then by 44 µm to 792 µm, and finally to 880 and 990 µm (Figure 1A–C). The files were sliced using Chitubox Pro 1.4.1.
Figure 1.
Sample and specimen designs for resin testing. (A) Positive line structures, (B) positive square microwell-type structures, and (C) positive circular microwell-type structures (all designed as molds for PDMS microfluidic channels). (D) Subsize dumbbell-shaped tensile test specimen (all dimensions are in mm).
After printing, samples were sonicated in fresh isopropyl alcohol (IPA, 95%, Rock Paint Co., Ltd., Osaka, Japan) for 180 s, then rinsed manually with additional IPA using a wash bottle. After N2 blow-drying, samples were post-cured for 3 h in a UV chamber (SK Honpo Secondary Hardener DIY Kit Plus, SKU: SLCURE1PLUS, 405 nm, 49 mW/cm2 at the center of the chamber) and subsequently heated at 80 °C for 3 h on a hotplate. These steps remove residual monomers, which otherwise inhibit platinum-catalyzed curing of silicone elastomers, preventing PDMS molding. Since dimensional changes from post-processing contribute to the final device geometry, all samples, including those not used for PDMS molding, underwent the identical procedure before measurement.
Microstructure dimensions (channels, microposts, and microwells) were measured using a Keyence VHX-7000 microscope(Osaka, Japan). Edge detection-based composite 3D imaging was applied where necessary. The deviation of each printed dimension from its design value was recorded.
2.4. Soft Lithography Molded Samples
The positive channel molds were used for soft lithography to create PDMS samples with embedded channels. Base polymer and curing agent of Silpot 184 PDMS (Toray Dow-Corning, Tokyo, Japan) were mixed at a ratio of 10:1, centrifuged and poured over the molds. The mold was then placed under a vacuum of −0.7 MPa to ensure no air bubble remained in it and the silicone covered all the features of the mold. The PDMS was left on a hotplate at 80 °C till hard. The PDMS samples were then removed and cut through the middle using a razor blade for observation of the channel cross sections under the microscope.
2.5. Tensile Test Specimen Preparation
The physical properties of solids change with their dimensions. Since the structures we are concerned with are generally very small, we opted to test subsize dumbbell-shaped specimens (based on the ASTM E8 standard) of cured resin with a thickness of ~1 mm (Figure 1D). The full length of the specimen was 101.6 mm and the width at the grip and the reduced section was 9.53 and 6.35 mm, respectively. This geometry more closely corresponds to the dimensions of microfluidic devices and aligns with the confines of the equipment available in our lab (MCT-2150, load cell limit < 500 N, A&D Company, Ltd., Tokyo, Japan). The specimens were printed at 50 µm layer height with an exposure time of 3.25 s. The prints were then sonicated in fresh IPA for 120 s, dried with paper towels, and cured in the secondary curing chamber for 3 h to mimic the same degree of conversion as the molds. Any prints containing bubbles were rejected as they presented initiation points for fracture formation.
2.6. Viscosity Measurement of Resins
Resin viscosity varies between samples due to colloidal heterogeneity; manufacturers therefore provide a viscosity range rather than a definitive value. Some resins are also prone to separation, and shaking prior to printing is recommended for even dispersion. Additionally, photopolymerization releases heat [43], which may raise the temperature within the vat during printing. To ascertain that the relative viscosity difference between resins was maintained at elevated temperature, viscosity was measured at two temperatures: 23 °C (ambient room temperature) and 50 °C (estimated in situ temperature during photopolymerization-induced heating). Each resin was heated to the target temperature on a hotplate and evaluated using a tuning fork vibro viscosimeter (A&D Company, Ltd., SV-10).
3. Results
3.1. UV Power Output of the 3D-Printed Screen
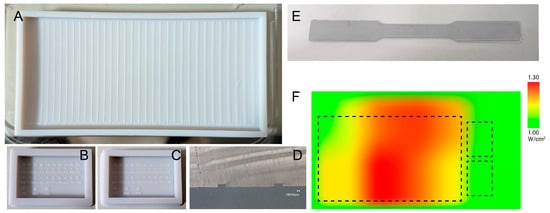
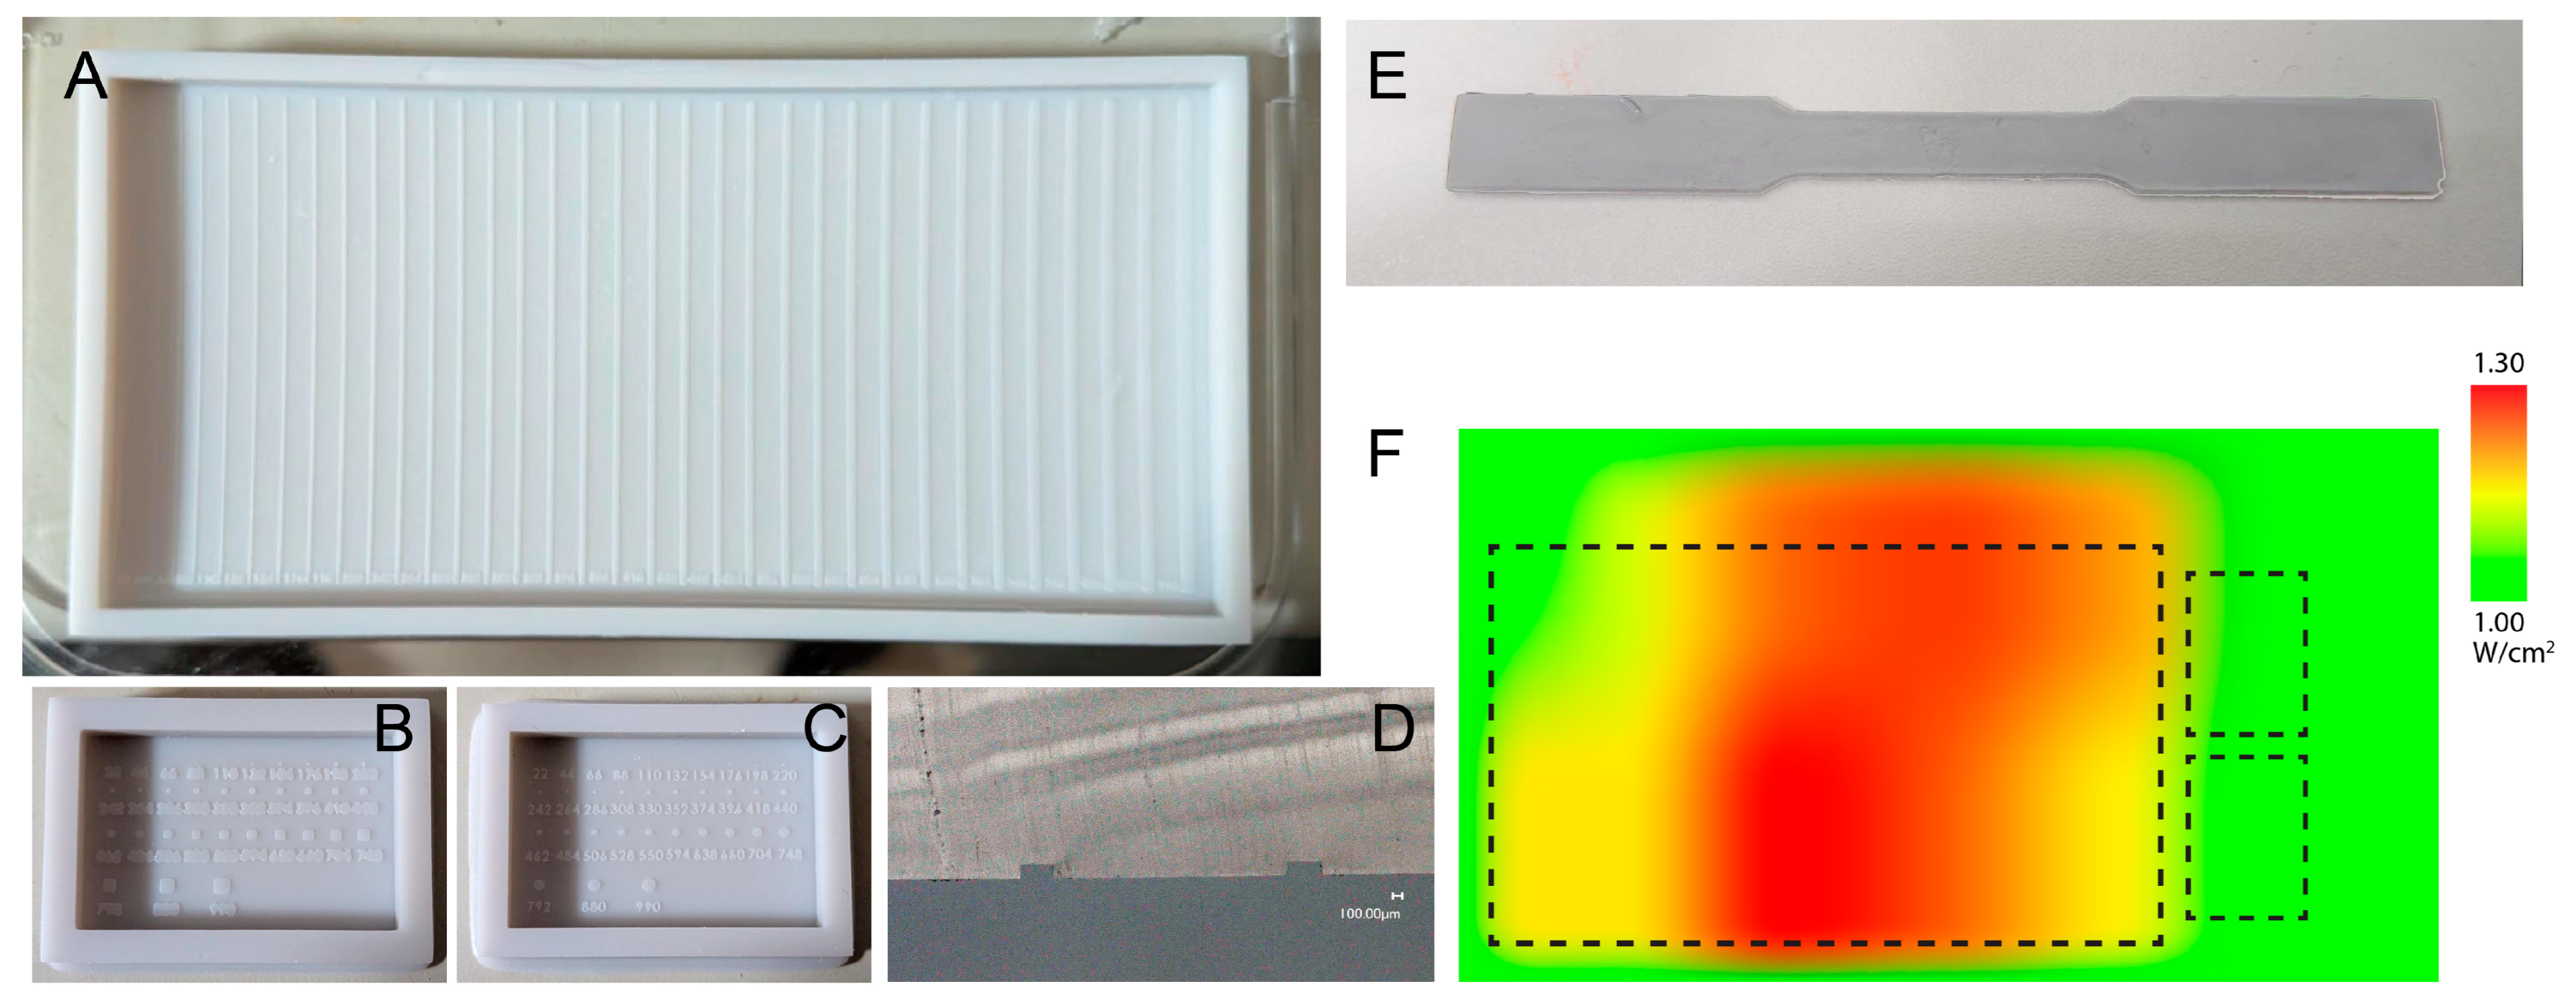
Measurement of channel width in early print samples showed large deviation in dimensional value between measurements over long distances. The variation in data for 220 µm thick designed channel taken within 600 µm showed an average standard deviation of 0.7%, whereas the deviation of measurements within a distance of 30 mm showed a larger deviation of 2.8%. Microstructures on the smaller microwell molds are less affected as the microstructures are more localized and not spread over a larger area like the channels. This variance implied the uneven UV characteristics of the 3D printer impacted the dimensional values of our test samples. The power distribution across the printer screen was characterized before fabrication to ensure that dimensional differences between printed samples reflected resin properties rather than inconsistent UV exposure. The average output was 1.16 mW across the eight measured zones, but with a standard deviation of 0.29 (25%), indicating significant non-uniformity (Figure 2F). The most powerful area was at the bottom left, decreasing elliptically towards the edges. By placing all samples in the bottom left and top center regions of the build plate, where variance dropped to 0.09 (7.8%), UV exposure was kept sufficiently uniform to attribute any dimensional differences to the resin itself rather than printer artifacts (Figure 2A–E).
Figure 2.
Fabricated molds for observation of overcuring performance. (A) Channels (positive). (B) Square microwells (positive). (C) Circular microwells (positive). (D) Cross section of PDMS cast of (A). (E) Subsized tensile test specimen and corresponding dimensions. (F) Heatmap of UV power distribution across the 3D printer screen surface. Dotted lines show the placement of the printed molds during fabrication. This placement strategy tries to mitigate dimensional variation across printed channels on the molds.
3.2. Determination of Best Printing Parameters for Microscale Fabrication
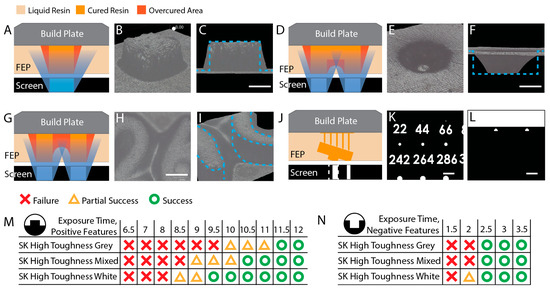
Before comparing resin performance, it was necessary to establish printing parameters that would allow microscale features to form reliably without introducing artifacts from over- or under-exposure. Standard parameters recommended for general part fabrication are not appropriate for microfluidic molds, and the reasons are fundamental to how VPP printing works at small scales. Exposure time exerts a dual effect on the fabricating structure. When exposure is too short, crosslinking of the monomers is insufficient to form a strong, stable solid network. The resulting weak structure tends to erode under the mechanical stresses of printing, causing cascading failures as subsequent layers are cured on top of already-failed regions. On the other hand, excessive exposure allows UV light to bleed beyond the intended mask boundary (Figure 3A–C), curing resin in unintended areas and causing overcuring. In extreme cases, this fills in negative structures entirely (Figure 3D–F) or merges closely spaced features (Figure 3G–I), rendering the mold unusable. Optimizing UV dosage to avoid both failure modes is essential in all VPP processes, but the challenge is especially acute for microfluidic structures, where feature dimensions are orders of magnitude smaller than in typical fabrication or hobbyist applications.
Figure 3.
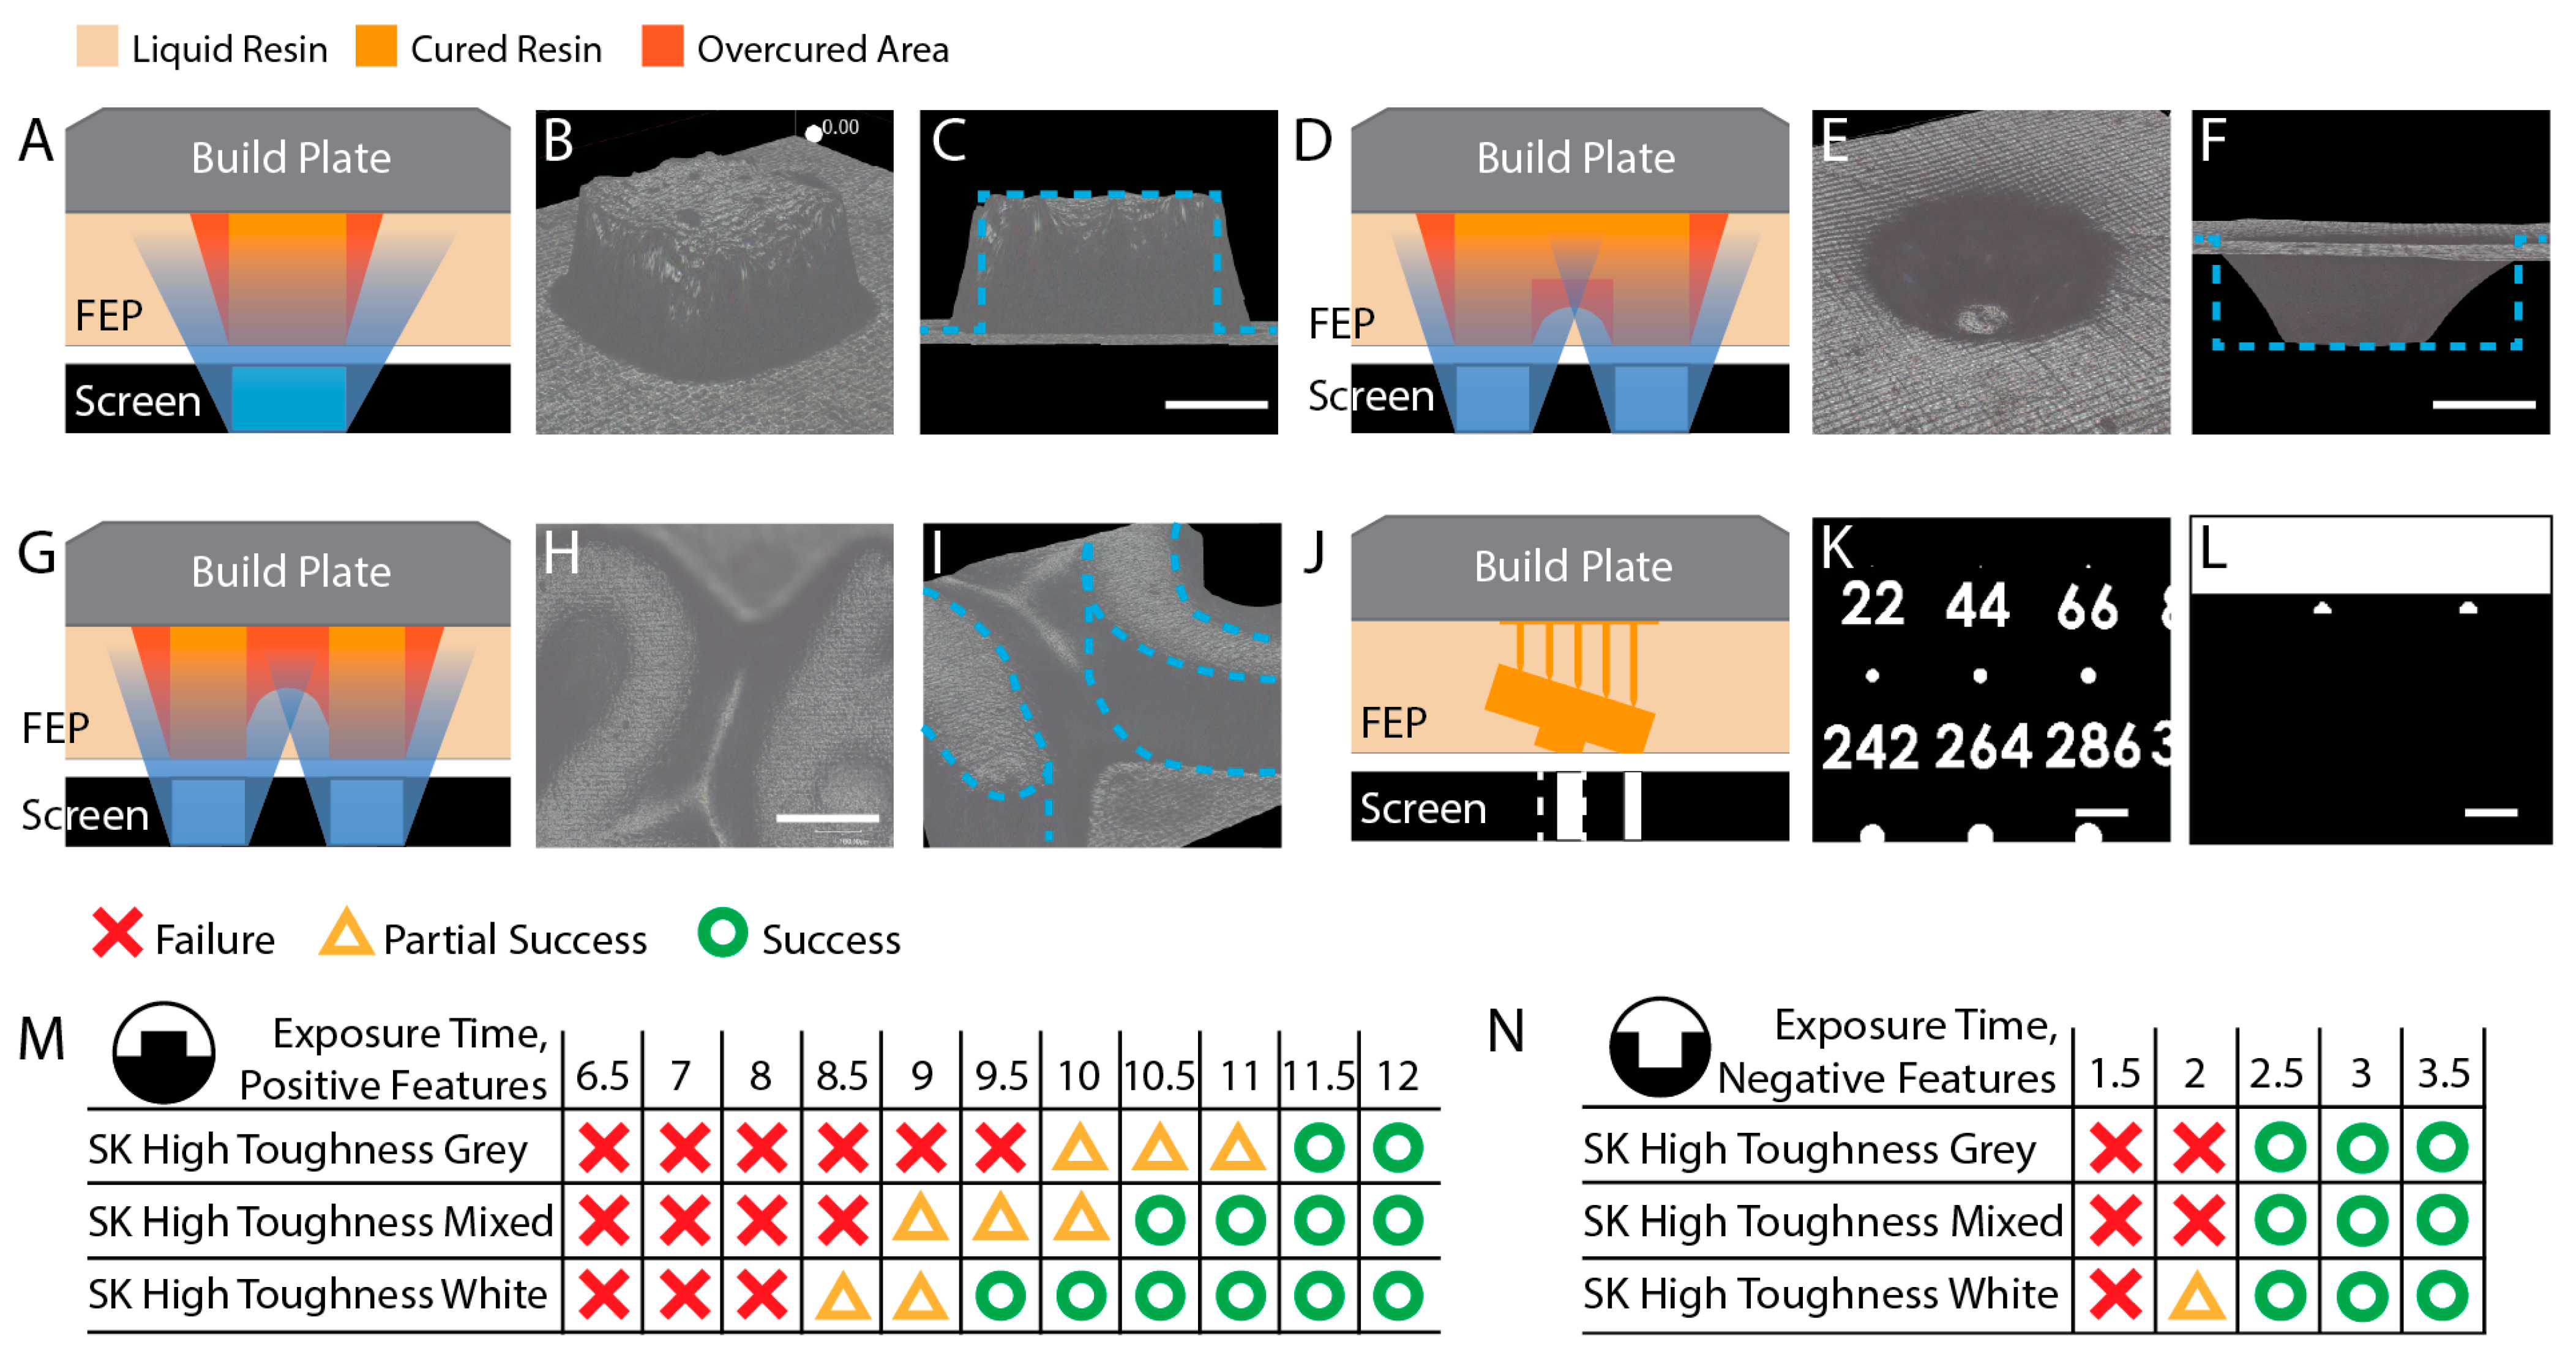
Analysis of light-bleed effects and optimization of exposure parameters for microfluidic mold fabrication. (A) Schematic of additional material overcuring. (B) Perspective (imaging area 140.8 µm wide) and (C) side views of 3D composite imaging of overcuring. Blue dashed lines correspond to the intended structure. Scale bars: 100 µm. (D) Schematic of resin fill-in of negative structures. (E) Perspective (imaging area 91.2 µm wide) and (F) side views of 3D imaging of this phenomenon. Blue dotted lines show the intended structure. Scale bars: 100 µm. (G) Schematic of failure through feature merging. (H) Top-down image of the dimension numbering in sample molds displaying this phenomenon. (I) 3D image showing that the space between the numbers 2 and 6 has cured with additional resin, reducing print definition. (imaging area 144.8 µm wide) Blue dotted lines show the intended structure in the absence of overcuring and feature merging. (J) Reduction in the microstructure footprint when the mold is printed at an angle to the build plate. Masks generated by the slicer software (Chitubox Pro) when the mold is placed (K) flat and (L) tilted relative to the build plate. The tilted orientation (L) shows a reduction in mask size for the same (242 µm) micropost, which could cause fabrication failures. Scale bars: 0.6 mm. Success/failure matrices for (M) positive and (N) negative microstructures across all tested resins.
The severity of this challenge arises from the relationship between mask area and UV dose. The total power delivered to the resin surface is given by:
where P is the power of the UV light emitted from the screen, I is the intensity of the UV projection lamp, and A is the area of the layer mask. Because microstructure masks are generally only a few pixels wide, the total UV energy incident on the resin is drastically reduced compared to bulk part fabrication. Features that would cure reliably at standard exposure times may therefore fail to form when the mask area is small. This means that the exposure times required for reliable microstructure fabrication are substantially longer than those used for general applications.
P = I × A,
Print orientation presents a related problem. In standard SLA VPP practice, parts are printed at an angle to the build plate to prevent semi-cured layers from sagging during the print, which can cause delamination and uneven features along the z-axis. For microfluidic molds, however, this approach is counterproductive. Tilting the mold causes the slicer software to project each layer as a reduced cross-sectional plane, and the footprint of the mold mask is reduced by the cosine of the tilt angle (Figure 3J–L). This further reduces the already limited UV dose reaching the microscale features, and in some cases causes the slicer to ignore features entirely when their projected footprint falls below the minimum pixel size of the printer screen. Microfluidic molds must therefore always be printed flat relative to the build plate.
To determine the minimum effective exposure for positive microstructures under these constraints, channels 200 µm tall and 100 µm wide were fabricated using each test resin. These were evaluated under a microscope for breaks or imperfections along their length. Any failed section would produce a blocked channel in the final microfluidic device, rendering it unusable. Three samples per resin were printed at 50 µm layer height at exposure values ranging from 6.5 to 12.0 s, incremented by 0.5 s. Any break or imperfection in the lines was classified as a failure. Prints with one or two failures out of three samples were classified as partial failures, while cases where all three failed were classified as complete failures.
All resins failed at short exposure times. The White resin showed partial successes beginning at 8.5 s, with the failure rate decreasing as exposure increased. Starting at 11.5 s, no failures were observed across any resin type or the mixture (Figure 3M). Channels were complete and continuous without significant breaks or kinks. This value represents the lowest effective exposure needed for reliable microstructure fabrication while minimizing the risk of additional overcuring and was therefore adopted as the standard exposure time for all positive microstructure fabrication throughout this study.
Negative microstructures presented the opposite challenge. Overcuring encroaches on recessed features from the surrounding illuminated areas, progressively reducing their effective dimensions. Lower exposure times, therefore, improve dimensional accuracy for negative features. However, reducing exposure on the large flat surface of the mold base introduces the risk of delamination. A parallel optimization study was conducted across all resins, testing exposure values from 1.5 to 3.5 s in 0.5 s increments at 50 µm layer height. If any of the three samples per condition showed delamination, the condition was classified as a partial success; absence of delamination in all three samples was classified as a success. Delamination was observed at exposures up to 2.0 s for all resins except the White resin. At 2.5 s and above, no delamination was observed for any resin (Figure 3N). All negative mold samples in this study were therefore printed at 2.5 s, balancing dimensional accuracy with structural integrity of the mold base.
3.3. Fabrication Limits and Overcuring Performance for Positive Mold Features
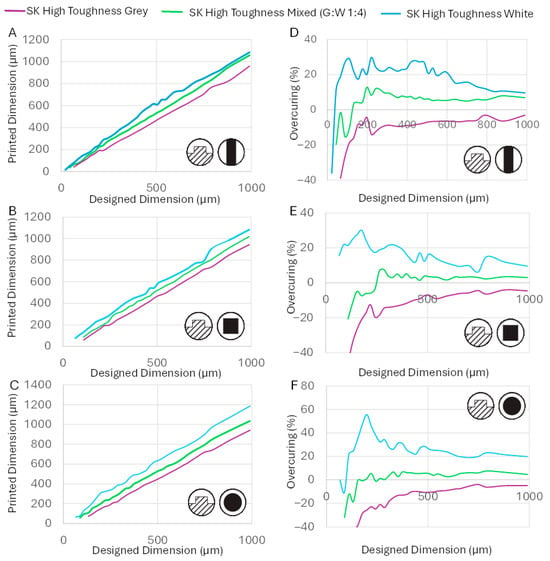
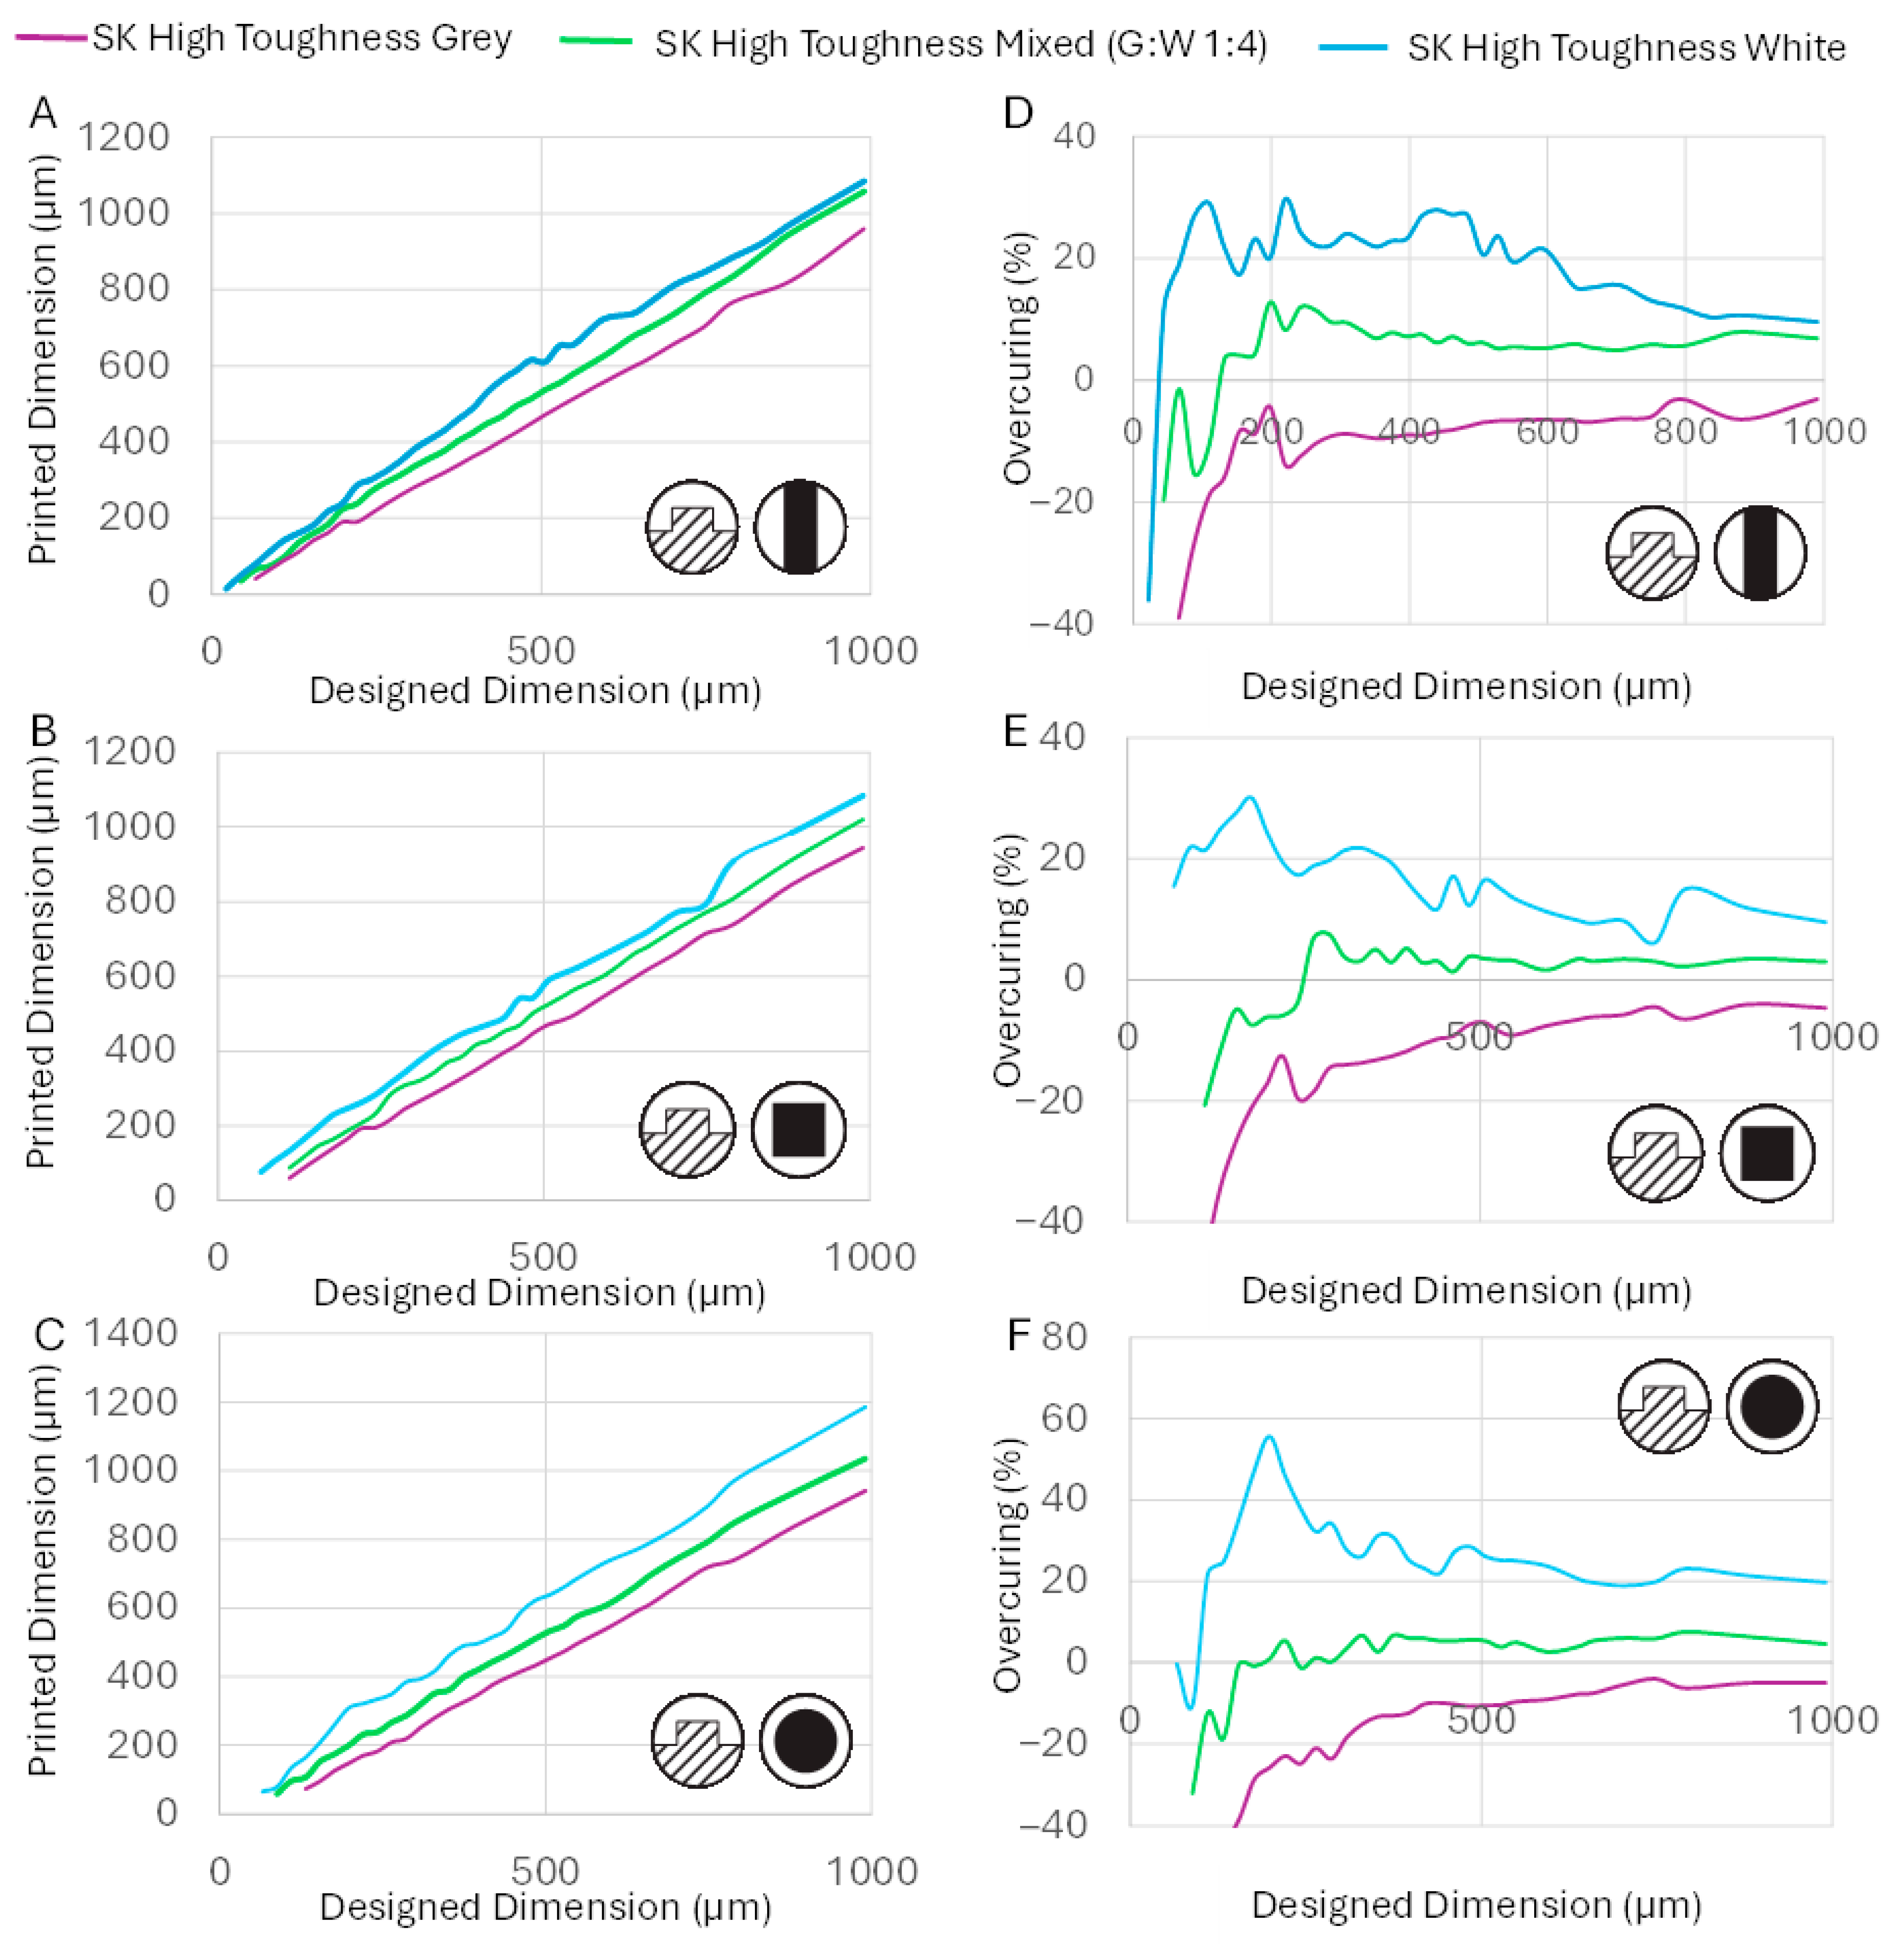
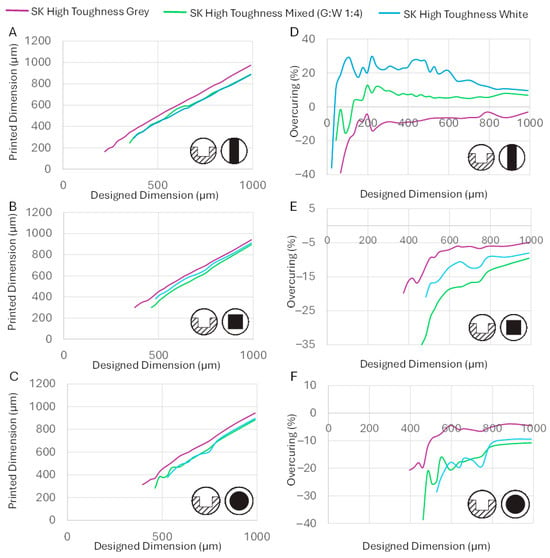
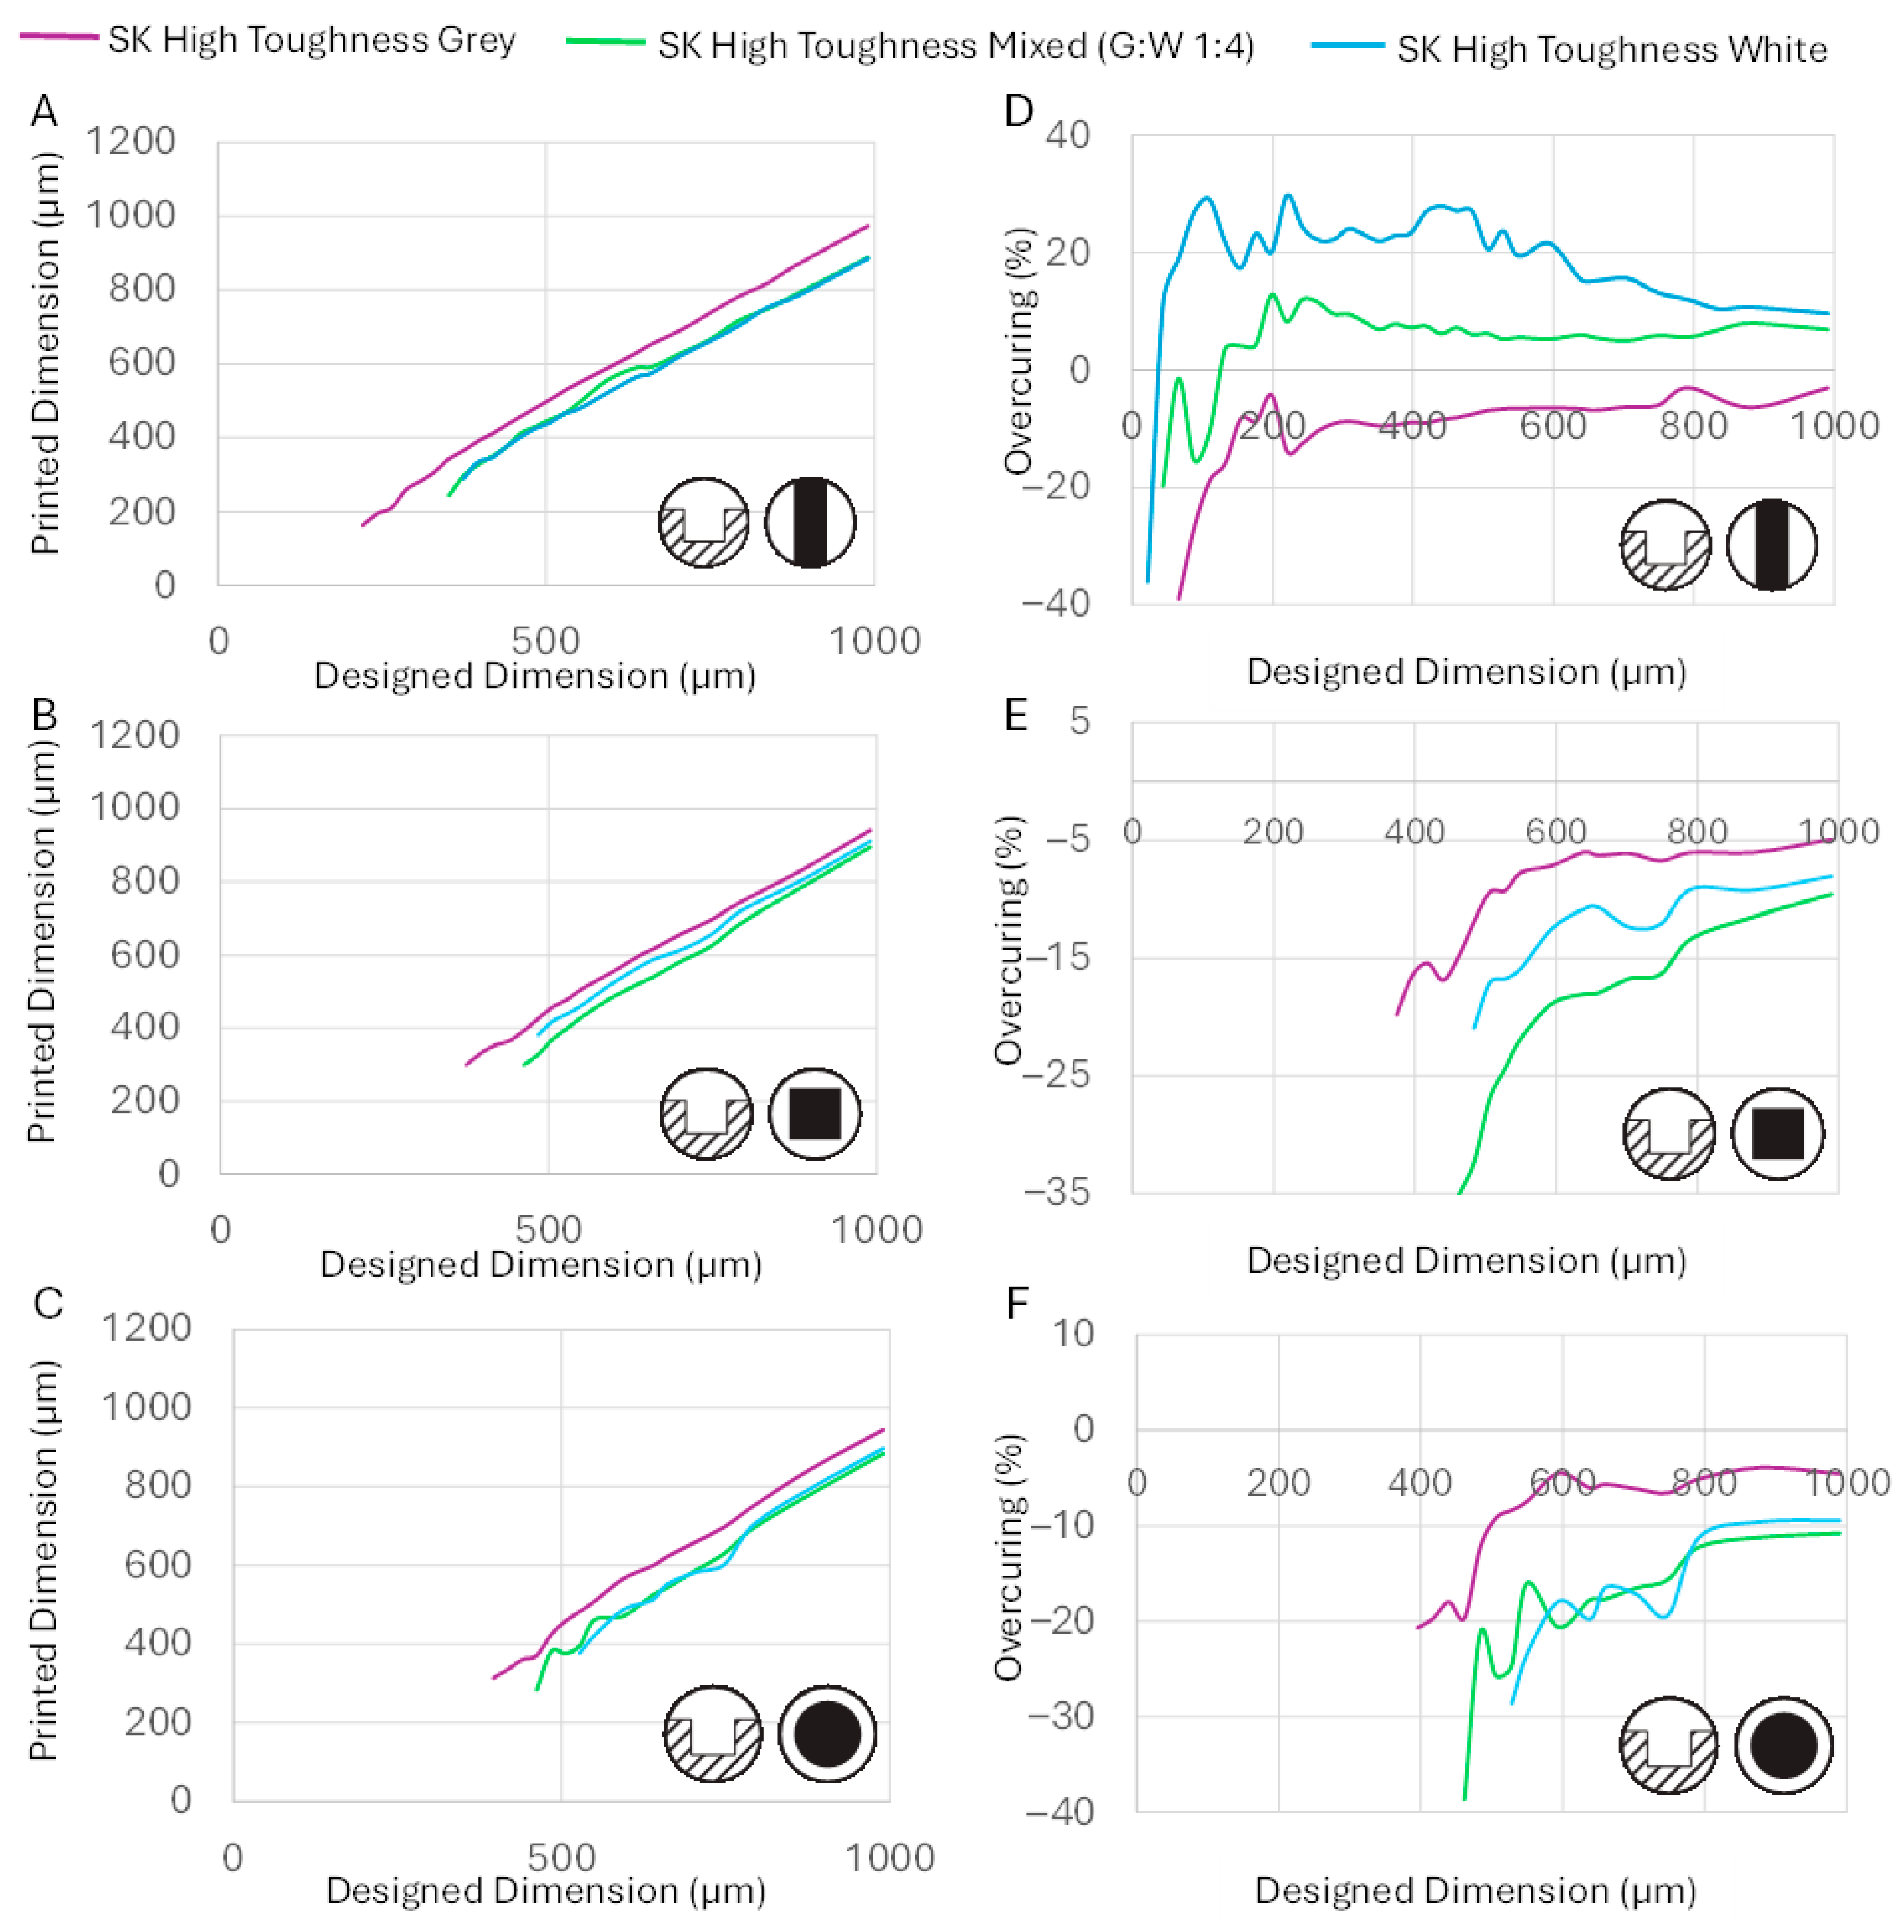
The printed dimensions (Figure 4A–C) and percentage overcuring relative to the designed dimensions (Figure 4D–F) were measured for each resin and structure type. The central finding was that each resin displayed a distinct fabrication limit, the minimum dimension that could be reliably printed for a given structure, and that these limits differed substantially between resins despite their near-identical base chemistry.
Figure 4.
Accuracy performance of tested resins for positive mold features. (Inset) The schematic of the type of mold feature fabricated. The designed vs. printed dimensions when printing (A) tall channels, (B) square microposts and (C) circular microposts. The rate of overcuring for subsequent design dimensions for fabrication of (D) tall channels, (E) square microposts and (F) circular microposts.
The fabrication limits were strongly influenced by the structure geometry, for reasons related to UV dose and mechanical stress. Channels showed the best (lowest) fabrication limits of the three structure types, as their elongated mask geometry delivers a comparatively larger cumulative UV dose across the whole structure, and their wider cross-section is less susceptible to shear stresses during printing. Square microposts had smaller, more widely spaced masks and received less UV, resulting in a higher fabrication limit. Circular micropost masks were smaller still than their square equivalents of the same nominal dimension, yielding the worst fabrication limits of all three types. Below each resin’s fabrication limit, one of two failure modes was observed: either the weakly crosslinked resin layers failed to adhere to the base and were washed away during cleaning, or the completed microstructure fractured under the mechanical stresses of the fabrication process.
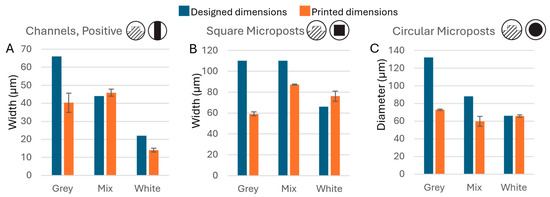
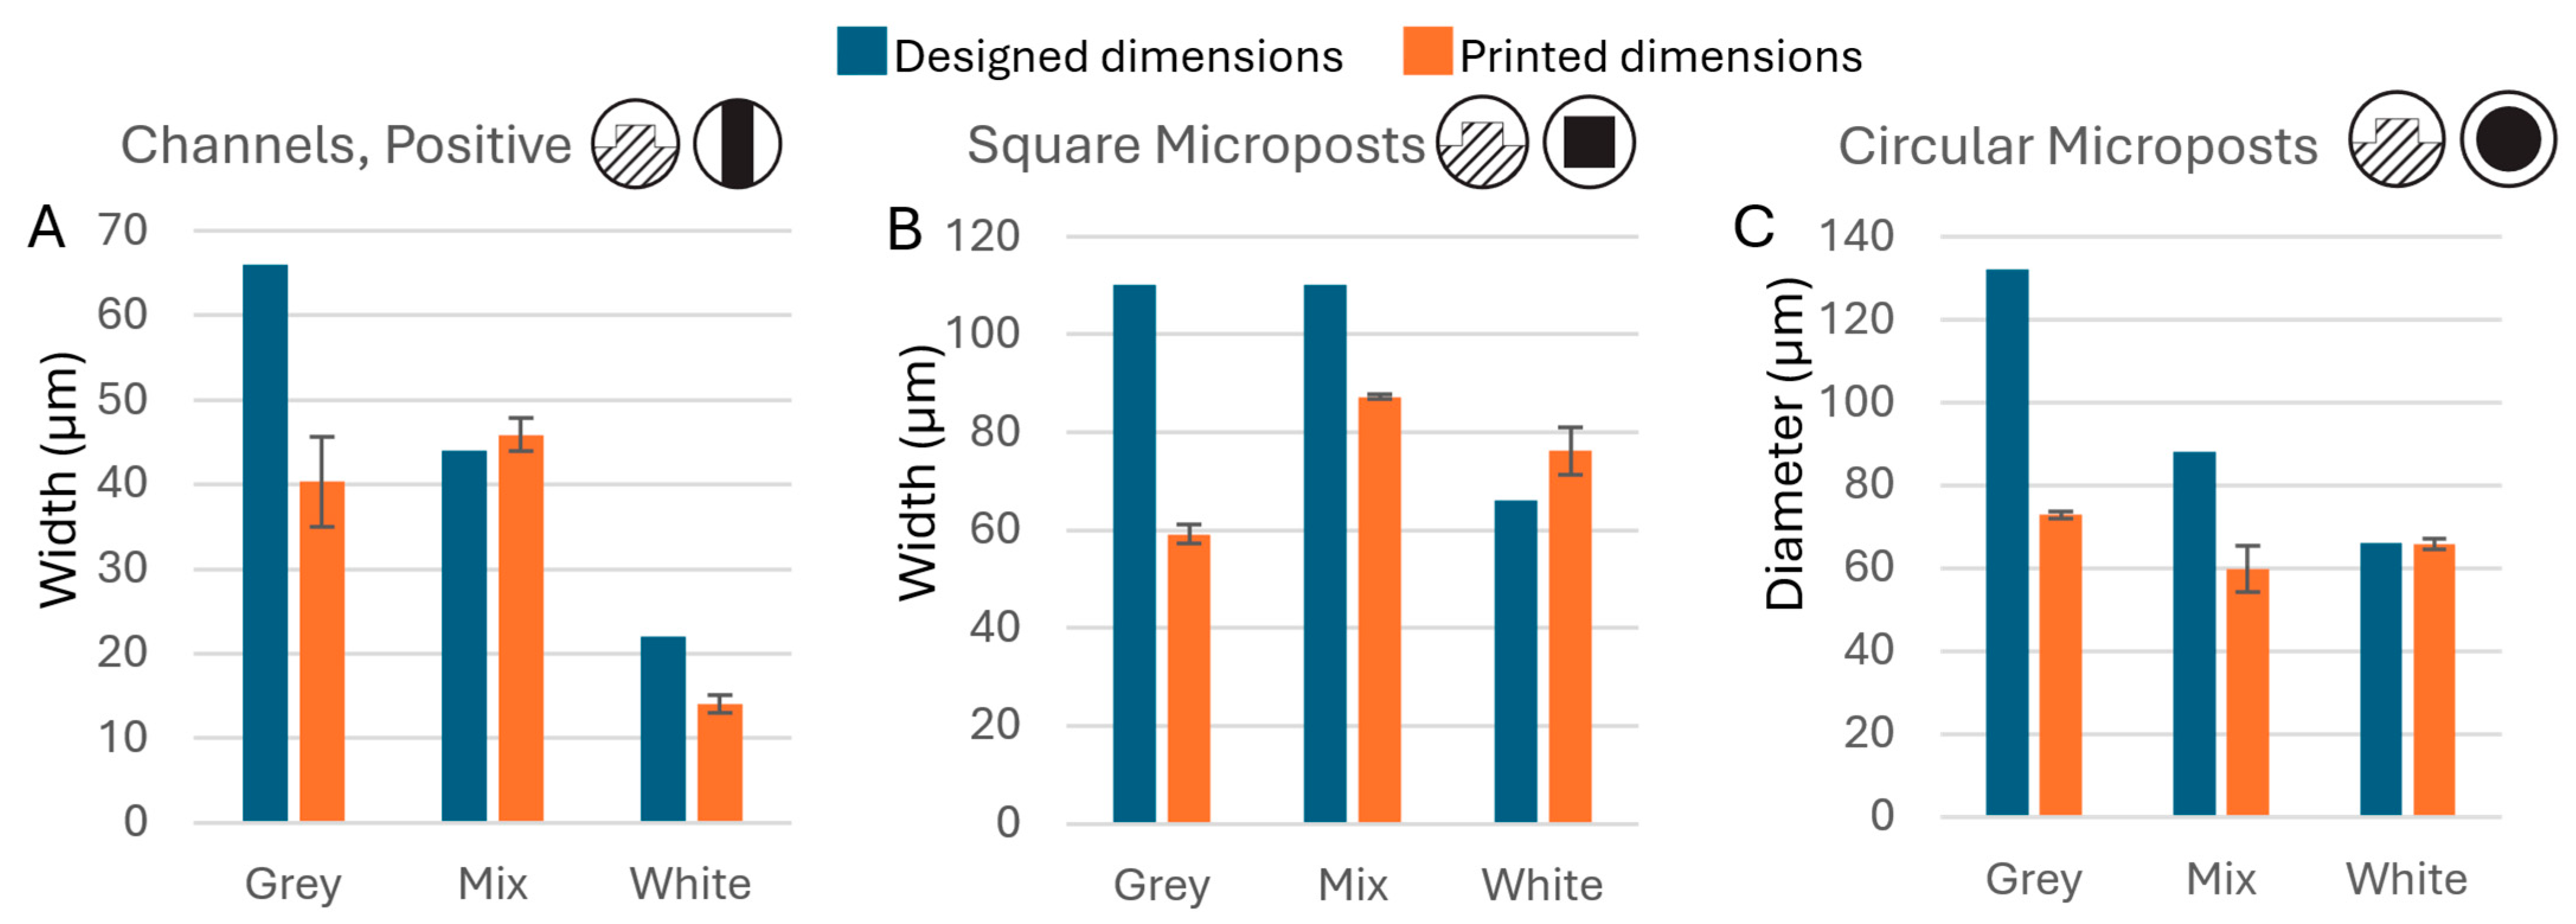
At the minimum fabricable dimension, all resins showed a larger-than-usual discrepancy between designed and printed values (Figure 5), because the limited mask area delivered insufficient UV flux to fully cure the intended geometry even when fabrication was technically possible. Notably, the White resin, despite its tendency to overcure and its poorer dimensional accuracy at larger scales, achieved better fidelity and lower fabrication limits than the Grey resin at the smallest printable dimensions, as its overcuring tendency partially compensated for the reduced UV dose. The White resin consistently printed 22 µm designed channels (average printed width: 14.1 µm), while the smallest channel the Grey resin could reliably produce was 66 µm (average: 35.3 µm). Similar trends were observed for microposts: the Grey resin’s limits were 110 µm for square microposts (59.2 µm printed) and 132 µm for circular microposts (72.8 µm printed), while the White resin achieved 66 µm for both square (76.2 µm printed) and circular (65.8 µm printed) forms.
Figure 5.
Fabrication limits for positive microstructures. Comparison of design dimensions versus actual printed dimensions for the smallest fabricable (A) positive channels (n = 6), (B) square microposts (n = 4), and (C) circular microposts (n = 4) for each resin.
The White resin consistently overcured at larger scales while the Grey resin consistently undercured, yet their roles reversed at the smallest printable dimensions. Since only the pigment composition differs between the two resins, these large differences in fabrication behavior must be attributed to the colorant components alone. This finding carries a practical implication: switching to a differently pigmented resin within the same product line may produce substantially different and unpredictable fabrication results without prior evaluation.
To confirm that the observed behavioral differences were caused by the pigment rather than some other uncontrolled variable, the Grey and White resins were blended at a ratio of 4:1 (White:Grey) to produce the Mixed resin, and its fabrication performance was evaluated. The Mixed resin printed 44 µm channels (45.9 µm printed), 110 µm square microposts (87.2 µm printed), and 88 µm circular microposts (59.8 µm printed) performance intermediate between the two parent resins, as expected from the mixing ratio. This result confirms that resin fabrication behavior can be predictably tuned by blending resins of known properties, provided their base composition is similar.
3.4. Fabrication Limits and Overcuring Performance for Negative Mold Features
Negative mold features presented a fundamentally different and more challenging situation than positive features. Near-UV light (395–405 nm), used in entry-level 3D printers, scatters significantly more than the deep UV (~270 nm) used in photolithography. This scattering causes illuminated mask regions to influence adjacent dark areas, and the effect is especially severe for negative features, where the unlit recessed areas are surrounded by illuminated regions. UV bleed from the surrounding areas cures resin within the recession over successive layer exposures, progressively filling it in. As a result, high exposure times encroach on negative features far more adversely than on positive ones, making negative features inherently more difficult to fabricate accurately with hobbyist-grade printers. Overcuring and fabrication limits for recessed features were therefore evaluated separately for mold channels, square microwells, and circular microwells, which correspond to raised walls, square microposts, and circular microposts in the final PDMS device, respectively.
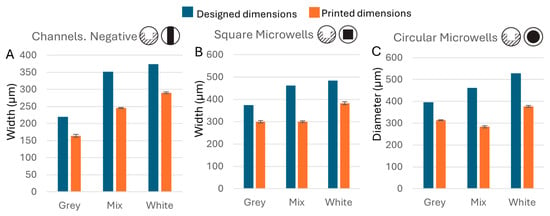
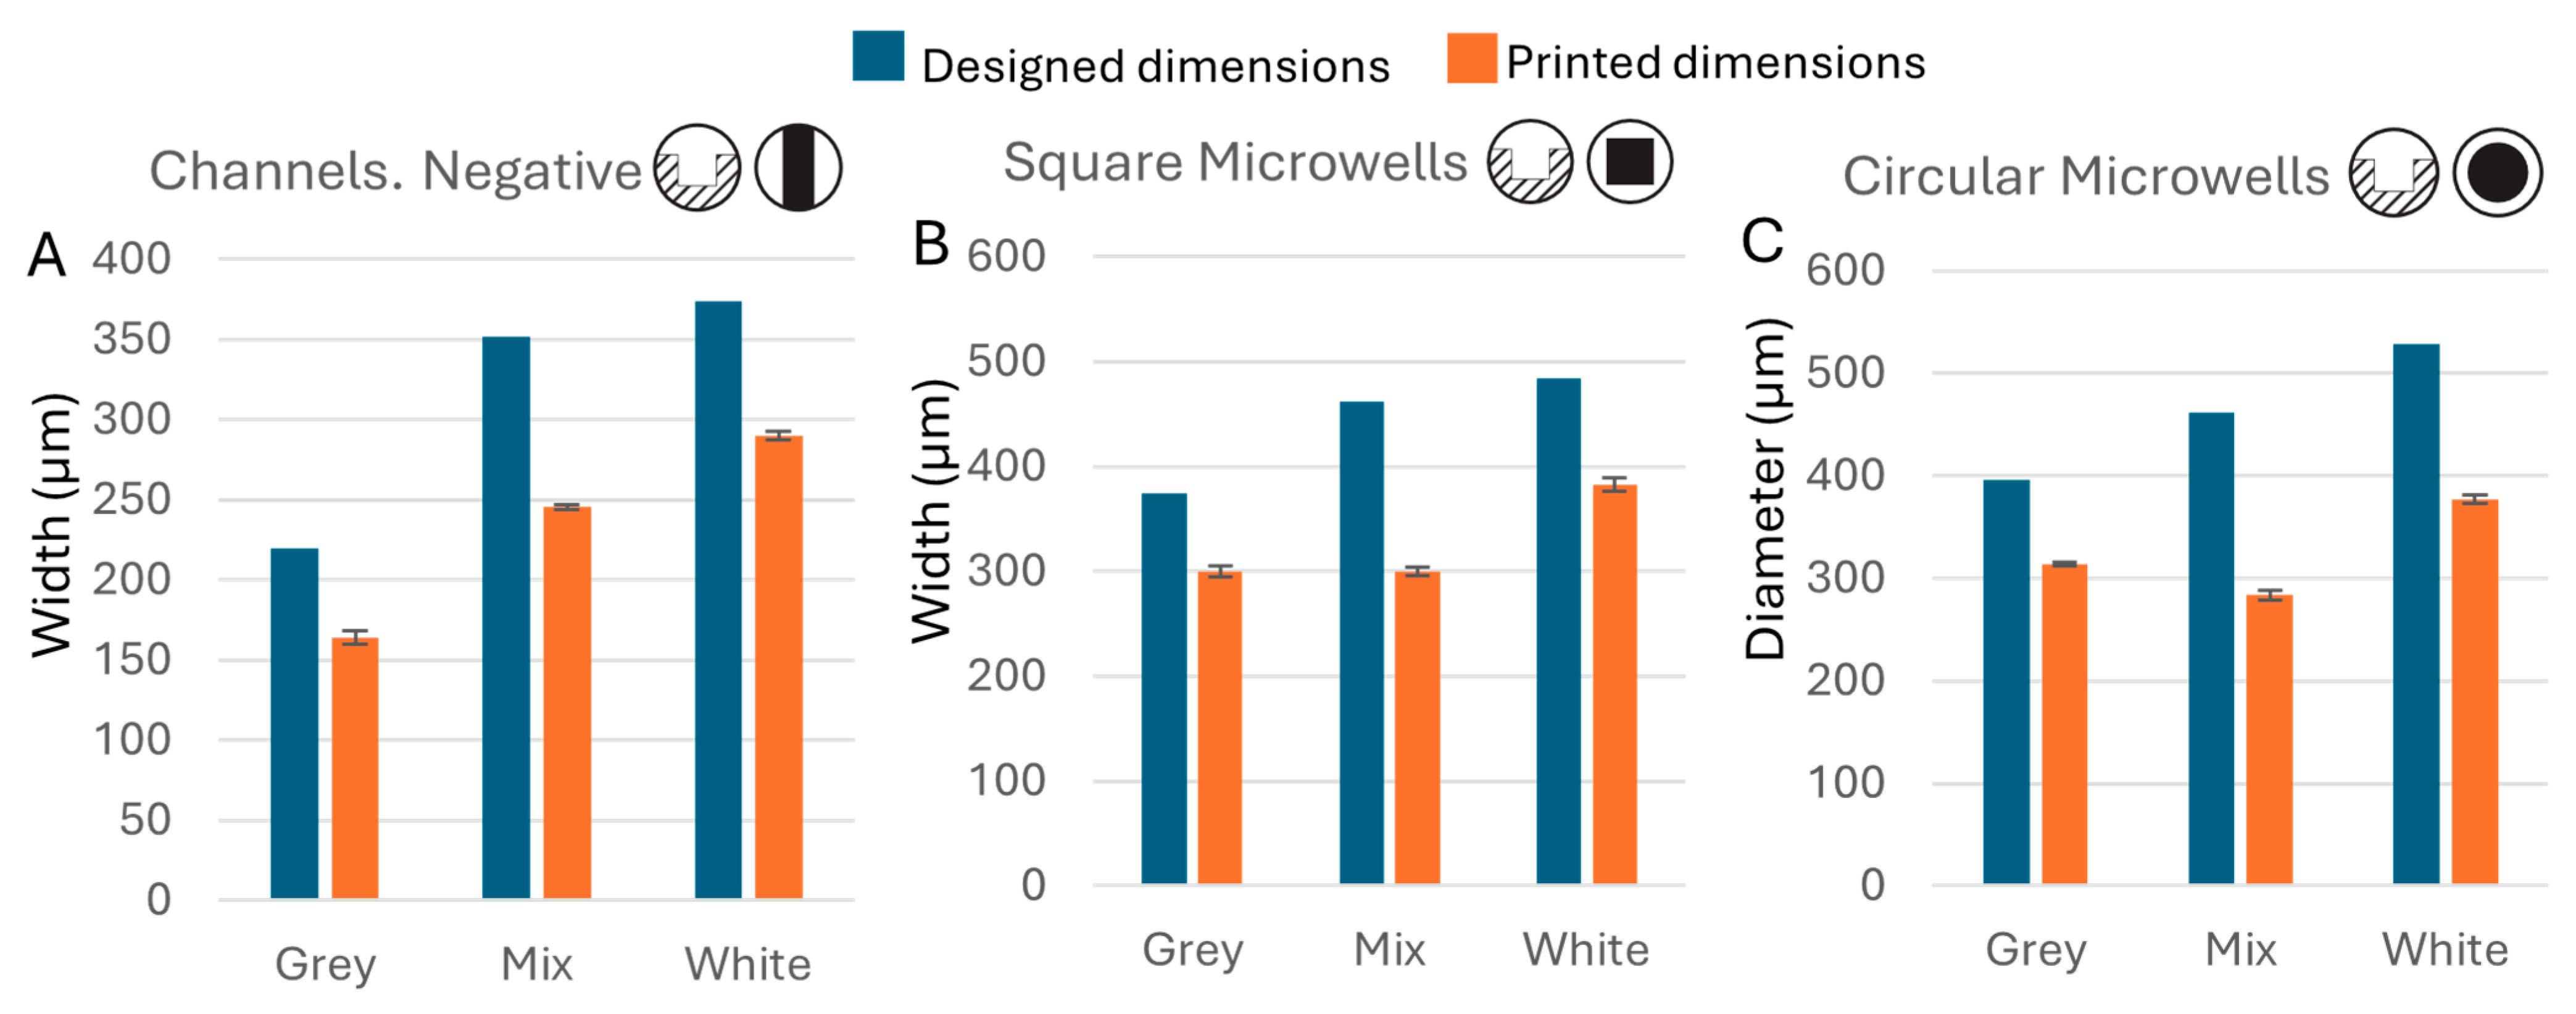
Microscope observation confirmed this increased difficulty (Figure 6A–C). Counterintuitively, the Grey resin, which undercured positive features, outperformed the White resin for negative features. The minimum fabricable negative feature sizes for the Grey resin were 220 µm (163.7 µm printed), 374 µm (299.9 µm printed), and 396 µm (314.0 µm printed) for channels, square microwells, and circular microwells, respectively. The White resin performed worse, consistent with its greater overcuring tendency: limits were 374 µm (289.9 µm printed), 484 µm (382.7 µm printed), and 528 µm (377.0 µm printed). The Mixed resin fell between the two, with limits of 352 µm (245.3 µm printed), 462 µm (299.6 µm printed), and 462 µm (283.4 µm printed) (Figure 7).
Figure 6.
The accuracy performance of tested resins for negative mold features. (Inset) The schematic of the type of mold features fabricated. The designed vs. printed dimensions when printing (A) recessed channels, (B) square microwells and (C) circular microwells. The rate of overcuring for subsequent design dimensions for fabrication of (D) recessed channels, (E) square microwells and (F) circular microwells.
Figure 7.
Fabrication limits for negative microstructures. Comparison of design dimensions versus actual printed dimensions for the smallest fabricable (A) negative channels (n = 4), (B) square microwells (n = 4), and (C) circular microwells (n = 4) for each resin.
Overcuring behavior for negative structures followed the same pattern as for positive structures (Figure 6D–F): the Grey resin showed the least overcuring, with printed negative structures close to but smaller than the designed dimensions, as expected. Both the White and Mixed resins showed substantial overencroachment throughout the tested size range, with printed dimensions considerably smaller than designed.
The reason the Grey resin excels at negative features while the White excels at positive features remains unclear, but the data consistently implicate the pigment as the governing variable. The Mixed resin’s behavior was again intermediate but asymmetric: its fabrication limits were closer to those of the White resin, consistent with its 4:1 White:Grey composition, while its overcuring behavior fell between the two parent resins, reflecting stronger influence from the Grey component than its mixing ratio alone would suggest. This asymmetry once again illustrates how small changes in resin formulation can produce disproportionate and non-trivially predictable effects on microscale fabrication performance, and underscores the importance of empirical evaluation when switching resins.
3.5. Impact of Resin Mechanical Strength on Mold Performance
The fabrication limits observed for positive features in Section 3.3 suggest that mechanical strength plays a key role in determining how small a structure can be reliably printed: stronger resins should allow smaller features to survive the stresses of fabrication. Tensile testing confirmed this hypothesis and revealed that the three resins, despite differing only in pigment composition, exhibited markedly different mechanical properties.
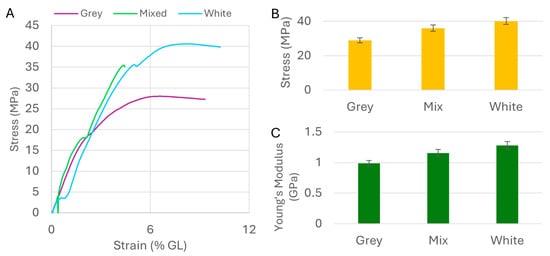
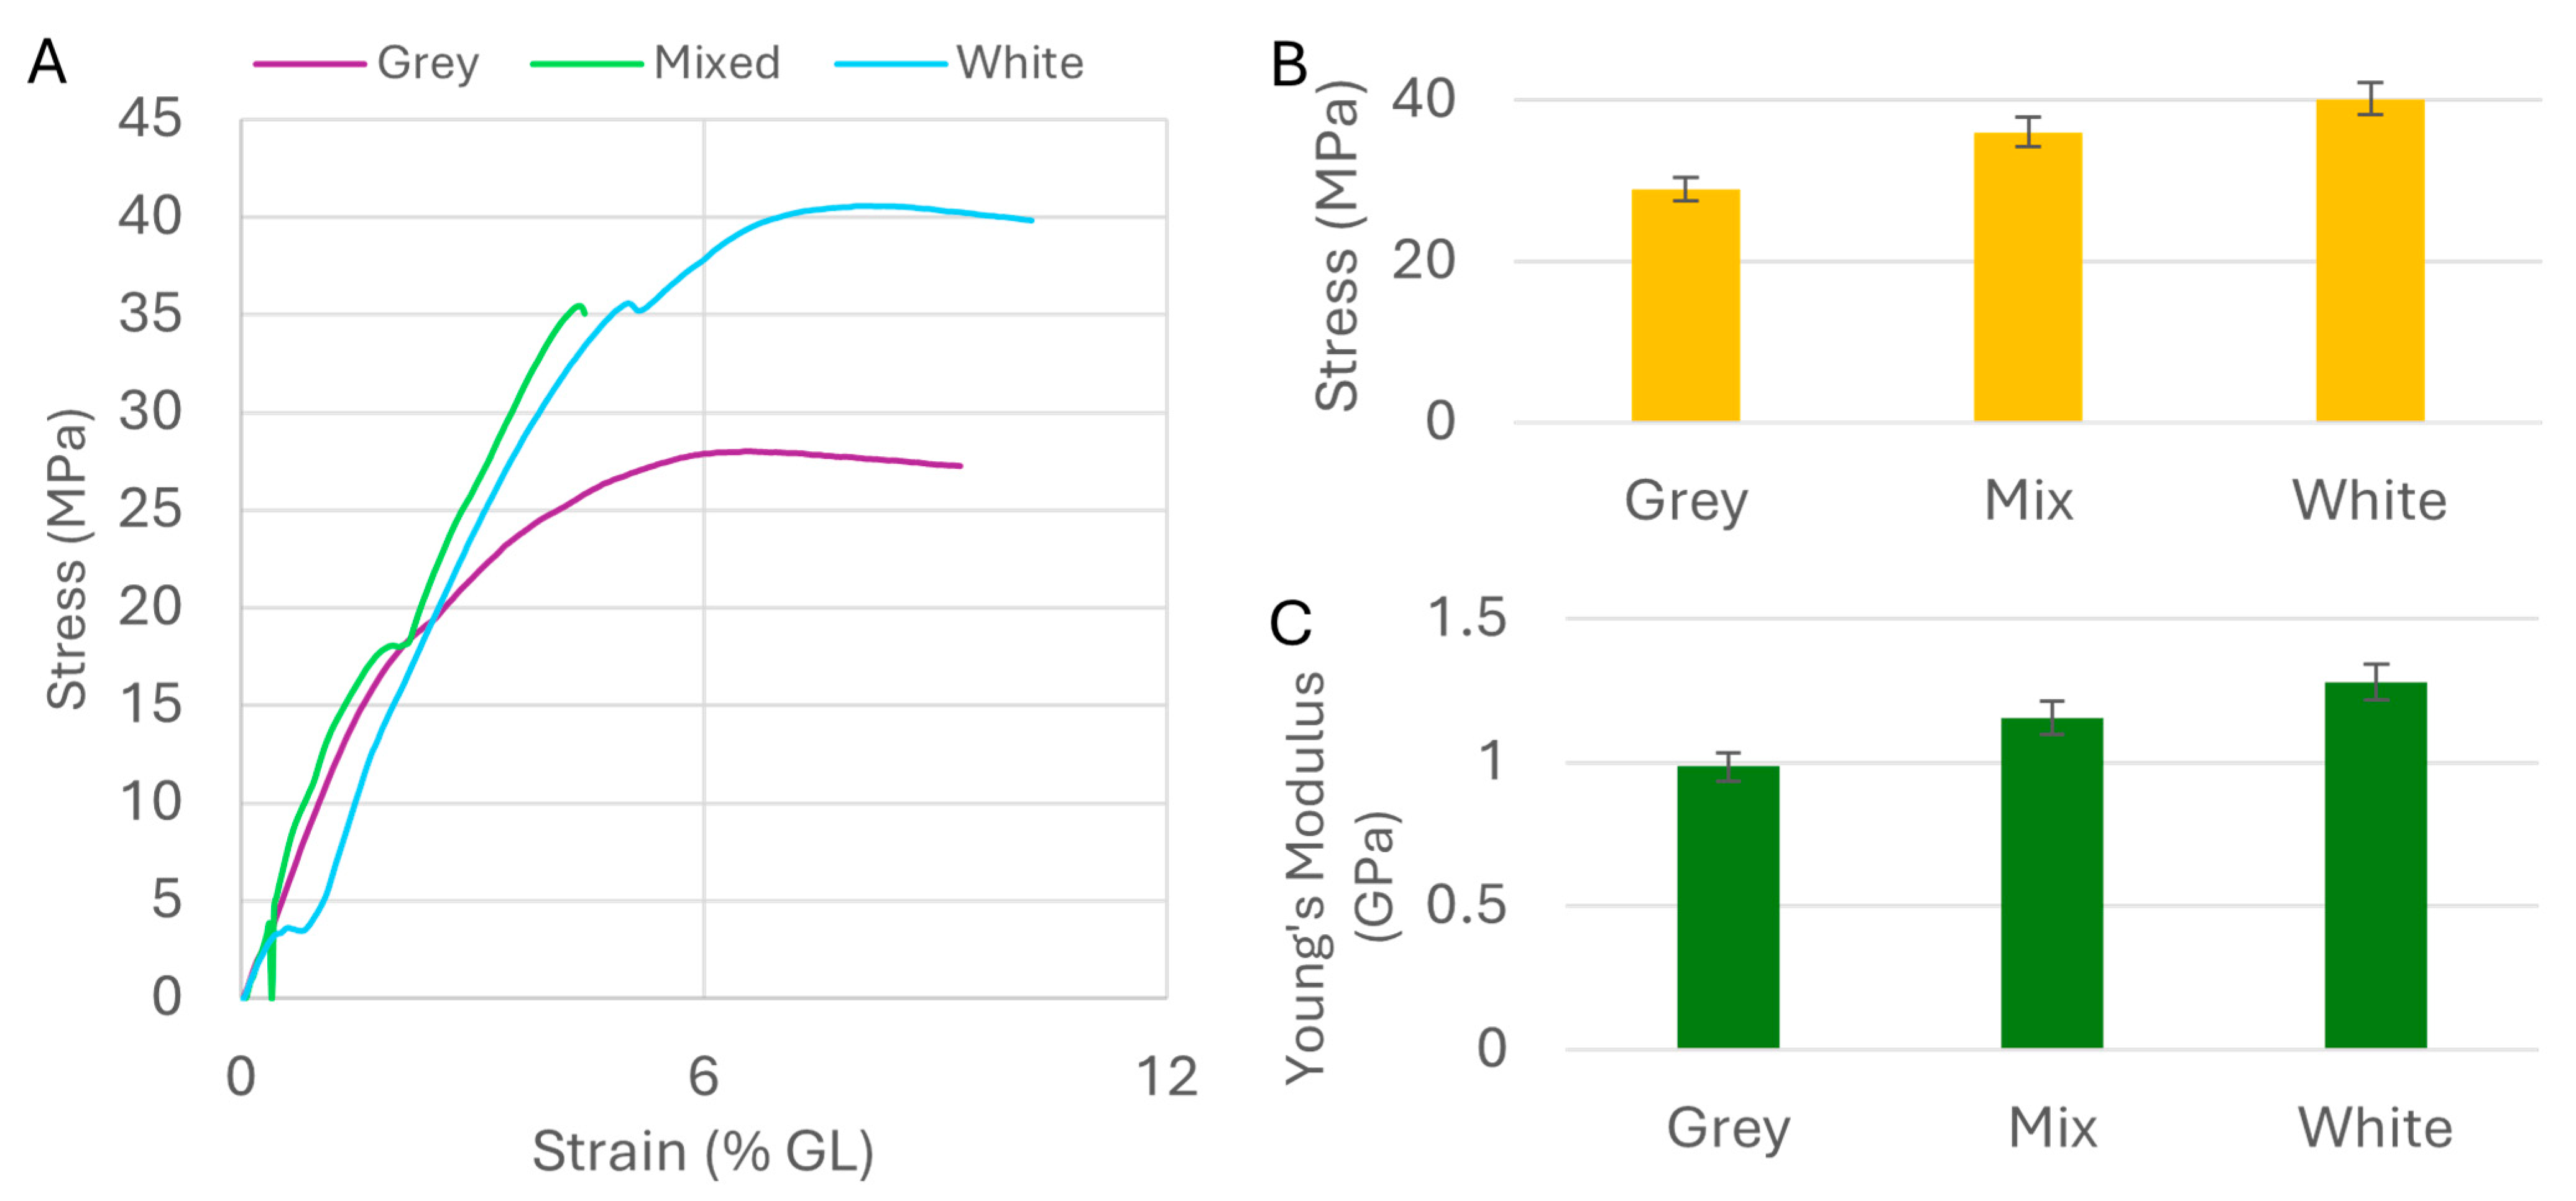
Ten specimens from each resin were tested under tensile load until failure. Most samples failed without fracture, and the stress–strain curves varied from sample to sample. Despite this variability, the averaged curves revealed clear and consistent distinctions between the resins (Figure 8A), confirming that even small differences in pigment composition can significantly affect the mechanical properties of the cured polymer. The White resin had the highest UTS at 40.15 MPa, the Grey the lowest at 28.94 MPa, and the Mixed resin fell between at 36.06 MPa, a systematic gradient of approximately 28% between the extremes (Figure 8B). This monotonic trend is consistent with a pigment-driven effect on photopolymerization: the absorptive Grey pigment competes with the photo initiator for UV energy, reducing crosslink density and thereby lowering both UTS and Young’s modulus. Young’s modulus followed the same order: 0.99 GPa (Grey), 1.16 GPa (Mixed), and 1.28 GPa (White), again reflecting significant property shifts driven by pigment alone (Figure 8C).
Figure 8.
Tensile properties of the resins: (A) The stress–strain curves of the tested resins; (B) the bar graph of the average ultimate strength of each resin type; (C) the bar graph of Young’s modulus of the resins. Lower value means more elasticity.
These mechanical differences directly explain the fabrication limit data in Section 3.3. Higher UTS allows for finer positive features to withstand the mechanical stresses of printing without fracturing or detaching from the base, resulting in a lower fabrication limit. The high UTS of the White resin enables fabrication of features approaching the theoretical pixel resolution of the printer, while the lower UTS of the Grey resin results in a correspondingly higher fabrication limit. For applications requiring the finest positive features, selecting a resin with high UTS is therefore the primary criterion. Although differences in mechanical properties were observed among the tested resins, all three exhibited sufficient strength for practical microfluidic mold fabrication.
3.6. Impact of Resin Viscosity on Mold Performance
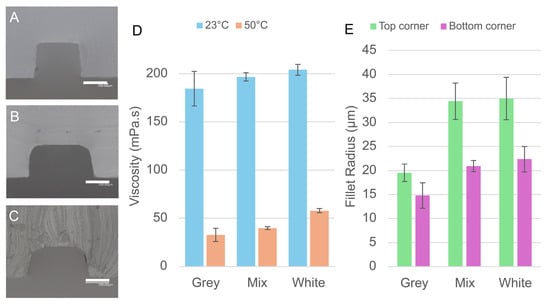
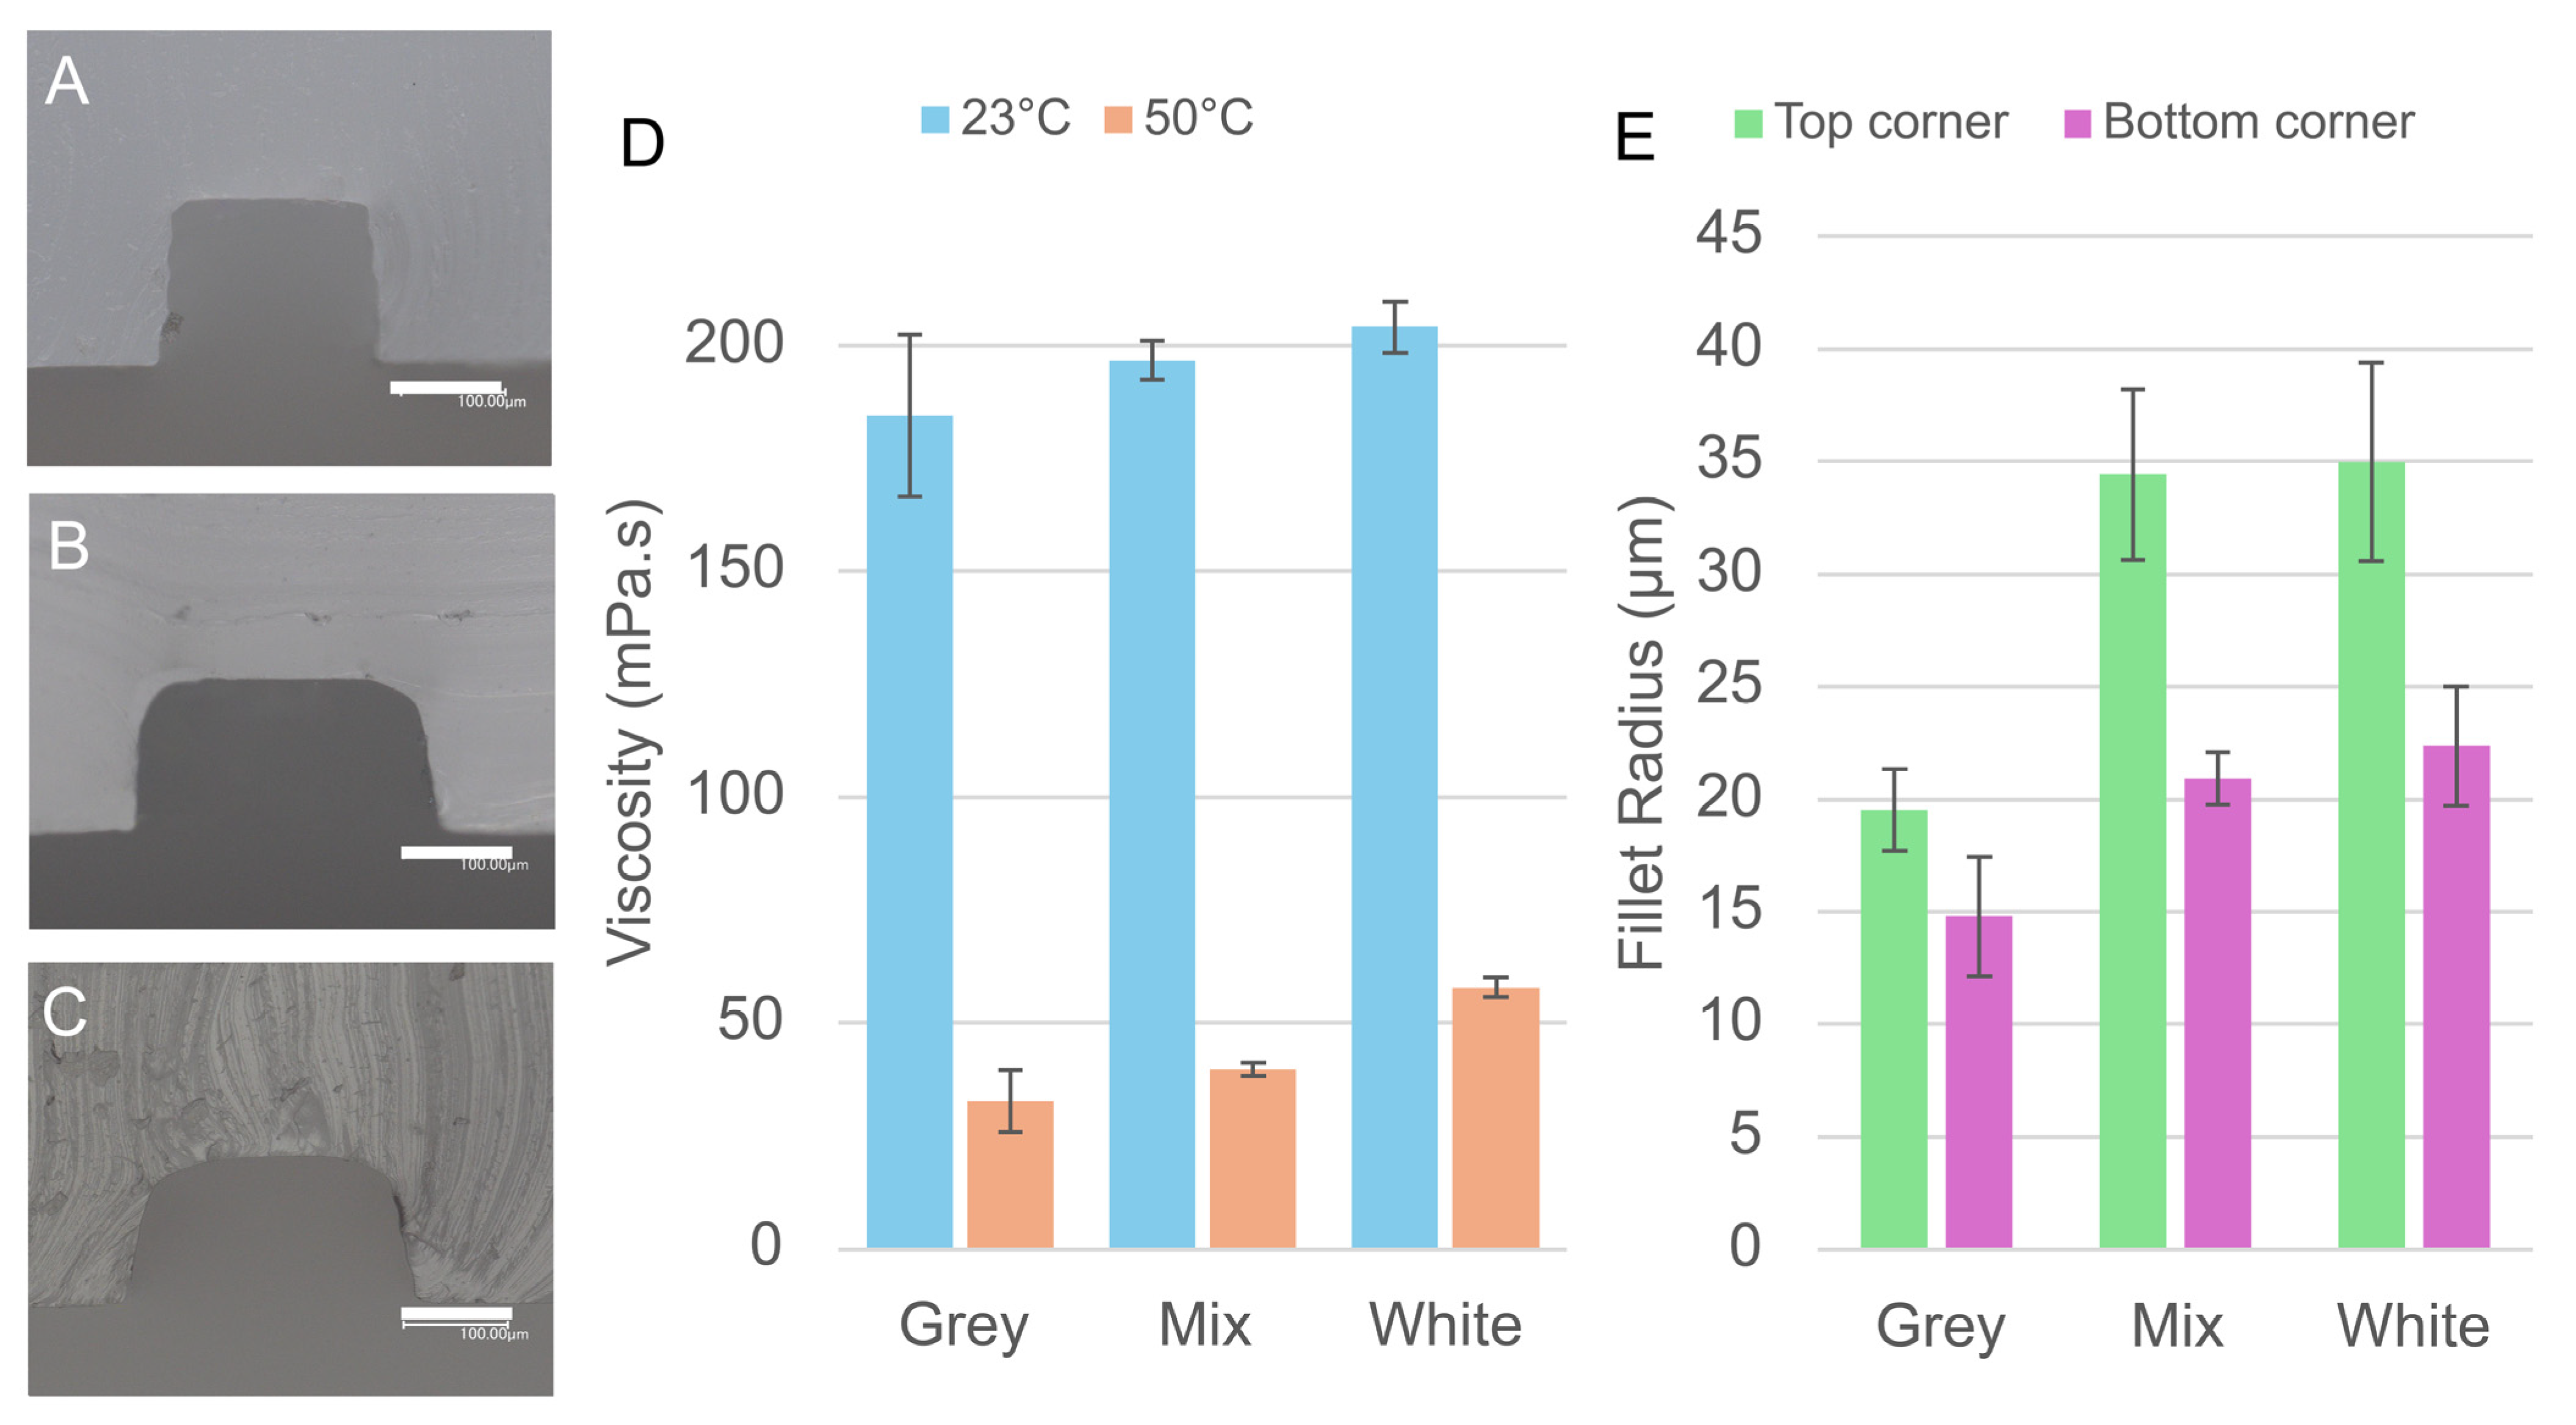
While UTS governs the fabrication limits of positive features, resin viscosity emerged as the key parameter controlling both the fabrication limits of negative features and the sharpness of printed edges, two aspects of print quality that UTS alone cannot explain. The average viscosities of Grey, Mixed, and White resins at 23 °C were 184.4, 196.6, and 204.0 mPa·s, respectively. Viscosity was also measured at 50 °C (estimated in situ temperature during photopolymerization-induced heating) to confirm that the relative ranking was preserved at elevated temperature; values dropped to 32.58, 39.67, and 57.8 mPa·s, respectively, maintaining the same order (Figure 9D). All printing experiments were conducted at ambient temperature; vat temperature was not used as a controlled variable. This order does not correlate with the overcuring or dimensional accuracy results for positive features, confirming that viscosity does not directly influence positive mold fabrication.
Figure 9.
Influence of resin viscosity on the cross-sectional morphology of microchannels. (A–C) Cross-sectional micrographs of PDMS channels cast from molds printed with (A) White, (B) Mixed, and (C) Grey resins, showing the relationship between resin viscosity, interlayer line visibility, and corner fillet radius. Scale bars: 100 µm. (D) Measured viscosity of each resin at 23 °C and 50 °C. (E) Fillet radii at the upper and lower channel corners for each resin.
Viscosity directly explains the superior performance of the Grey resin for negative mold features. The highly viscous White resin performs far worse than the low viscosity Grey resin across all geometries. More viscous resins are retained more strongly within small recesses by capillary pressure and drain more slowly before curing, effectively reducing the apparent opening of recessed features and worsening their fabrication limits. This effect is particularly pronounced in microwell geometries, where the high aspect ratio of the small holes amplifies capillary drag. The Mixed resin showed an intermediate viscosity between its two parent components, once again confirming that blending similar resins can predictably tune this property. Thus, lower resin viscosities improve negative feature fabrication limits.
The influence of viscosity on print quality was further examined through cross-sectional microscopy of PDMS channels cast from the printed molds. At the scales involved in microfluidic fabrication, the interlayer gaps created during layer-by-layer printing are narrow enough to generate capillary forces. More viscous resins are drawn into these gaps and drain more slowly, allowing them to cure in place and produce smoother, more rounded channel walls. Less viscous resins drain readily, leaving the interlayer steps exposed in the final cast. This effect was clearly visible in the micrographs: channels cast from the White resin molds showed smooth, featureless walls with no visible interlayer lines (Figure 9A), while those from the Mixed resin showed faint interlayer structure (Figure 9B), and those from the Grey resin displayed clearly defined interlayer lines (Figure 9C).
Corner fillet radii, measured at both the top and bottom of the channel cross-sections, provided a quantitative measure of this rounding effect. At corners away from the mold surface, average fillet values were 35.0 µm (White), 34.4 µm (Mixed), and 19.5 µm (Grey). At the mold-surface corners, values were 22.4 µm (White), 20.9 µm (Mixed), and 14.8 µm (Grey) (Figure 9E). The mold-surface values are particularly significant in practice: if adjacent positive mold features are placed too closely together, the filleted bases could merge, eliminating the gap between features and corrupting the mold geometry. High viscosity could also lead to more rounded channel openings, which could be undesirable if the sharp structure is important to the applicability of the device.
Overall, the Grey resin, with the lowest viscosity and lowest overcuring tendency, produced the sharpest, most precisely defined prints. The White and Mixed resins, with higher viscosity and greater overcuring, produced more rounded channel profiles. These results establish clear guidance for resin selection: when sharp feature edges and fine negative structures are required, a low-viscosity resin is preferred; when smooth channel walls are desired without post-processing of the mold, a more viscous resin is the better choice. As viscosity can vary significantly with particle settling, thorough mixing of the resin before use is strongly recommended for consistent results.
4. Discussion
This study set out to determine whether two readily accessible physical parameters, resin viscosity and ultimate tensile strength, could serve as practical guides for resin selection in VPP-based microfluidic mold fabrication, without requiring knowledge of the resin’s chemical composition. The results confirmed this framework and revealed that pigment alone, present at less than 1 wt%, was sufficient to drive differences in both physical properties and microscale fabrication performance.
The key correlations established were as follows. Higher UTS in the cured polymer enabled the fabrication of finer positive mold features, as stronger structures withstand the mechanical stresses of printing without fracturing. Lower resin viscosity, on the other hand, improved both the fabrication limits of negative mold features and the sharpness of printed edges by reducing capillary retention of resin within recessed areas and interlayer gaps. These two parameters thus map onto two distinct aspects of mold quality, and resin selection should be guided accordingly: high UTS for fine positive features, low viscosity for fine negative features and sharp edges.
The finding that viscosity and UTS can be monotonically tuned through simple blending of resins within the same product line is practically significant. It means that a single optimized resin need not exist. A blend can be formulated to balance competing requirements [22,23]. The Mixed resin (4:1 White:Grey) consistently showed intermediate behavior across all measured parameters, validating the predictability of this approach.
The pigment-driven mechanism underlying these property differences was also clarified. TiO2 particles in the White resin increase viscosity as a particulate filler and promote overcuring through UV scattering [20,21,41]. In the Grey resin, carbon black absorbs UV and competes with the photoinitiator, reducing crosslink density [19] and thus lowering both UTS and Young’s modulus, while the reduced TiO2 content accounts for the lower viscosity. The behavior of all three resins, including the Mixed resin, is fully consistent with this mechanism.
Beyond resin selection, this study also identified best practices for microstructure fabrication. Exposure times far exceeding manufacturer recommendations (11.5 s for positive, 2.5 s for negative microstructures at ~100 µm scale) were required for reliable feature formation. Optimization for print structures is crucial in micro-mold fabrication [33]. Printing flat relative to the build plate was essential to preserve the mask footprint and UV dose at the microscale. Prior understanding of post-processing protocols for resin molds [34,35] is a key advantage for rapid fabrication in PDMS microfluidics [36,37]. The guidelines established here should be broadly applicable across resin types and printer models, providing a practical starting point that reduces the number of optimization iterations required when setting up a new fabrication workflow.
5. Conclusions
This study demonstrated two accessible physical parameters, resin viscosity and ultimate tensile strength, which can serve as reliable guides for resin selection in VPP-based microfluidic mold fabrication, without requiring knowledge of the resin’s chemical composition. The positive mold fabrication limit correlated with UTS of the cured resin, while the negative mold fabrication limit and cross-sectional print sharpness correlated with resin viscosity. Resins differing only in pigment composition (~1 wt%) showed differences in both parameters, confirming that even minor formulation changes can substantially affect microscale performance. Blending resins within the same product line was demonstrated as a predictable and effective strategy for tuning these properties when a single resin cannot satisfy all fabrication requirements. Practical guidelines for exposure time (11.5 s for positive, 2.5 s for negative microstructures) and print orientation were also established, providing a starting framework applicable to acrylate-based resins sharing similar pigment strategies, though validation with additional commercial products remains a topic for future work. These findings offer a methodology for demystifying proprietary “black box” resins and accelerating the adoption of SLA-VPP 3D printing in microfluidic research.
Author Contributions
Conceptualization, M.N. and R.H.C.; methodology, M.N. and R.H.C.; software, M.N., R.H.C. and S.O.; validation, M.N., R.H.C., T.S., S.O. and T.S.S.; formal analysis, R.H.C.; investigation, R.H.C.; resources, M.N. and T.S.; data curation, M.N. and R.H.C.; writing—original draft preparation, R.H.C.; writing—review and editing, M.N. and T.S.S.; visualization, R.H.C.; supervision, M.N.; project administration, M.N.; funding acquisition, M.N. All authors have read and agreed to the published version of the manuscript.
Funding
This research was funded by the Japan Society for the Promotion of Science (JSPS) KAKENHI, Grant Numbers JP23H00166 and JP25K21448.
Institutional Review Board Statement
Not applicable.
Informed Consent Statement
Not applicable.
Data Availability Statement
The data presented in this study are available on request from the corresponding author.
Conflicts of Interest
The authors declare no conflicts of interest.
Abbreviations
The following abbreviations are used in this manuscript:
| 3D | 3 dimensional |
| SLA | Stereolithographic |
| VPP | Vat Photopolymerization |
| PDMS | Polydimethylsiloxane |
| UV | Ultraviolet |
| LED | Light Emitting Diode |
| IPA | Isopropyl Alcohol |
| ASTM | American Society for Testing and Materials |
| UTS | Ultimate Tensile Strength |
References
- Greaney, A.J.; McCarthy, C.M.; Vethil, J.P.; Abubaker, M.; Reardon, E.C.; Crowley, F.D.; Cunnane, E.M.; Mulvihill, J.J.E. A Comprehensive Protocol for PDMS Fabrication for Use in Cell Culture. PLoS ONE 2025, 20, e0323283. [Google Scholar] [CrossRef] [Scilit] [PubMed]
- Utami, T.; Danoy, M.; Khadim, R.R.; Tokito, F.; Arakawa, H.; Kato, Y.; Kido, T.; Miyajima, A.; Nishikawa, M.; Sakai, Y. A Highly Efficient Cell Culture Method Using Oxygen-permeable PDMS-based Honeycomb Microwells Produces Functional Liver Organoids from Human Induced Pluripotent Stem Cell-derived Carboxypeptidase M Liver Progenitor Cells. Biotech. Bioeng. 2024, 121, 1177–1189. [Google Scholar] [CrossRef] [Scilit]
- Liu, X.; Zhou, J.; Yan, R.; Tang, T.; Wei, S.; Li, R.; Hou, D.; Weng, Y.; Wang, D.; Shen, H.; et al. An Optimized PDMS Microfluidic Device for Ultra-Fast and High-Throughput Imaging Flow Cytometry. Lab Chip 2023, 23, 3571–3580. [Google Scholar] [CrossRef] [Scilit]
- Probst, C.; Grünberger, A.; Wiechert, W.; Kohlheyer, D. Polydimethylsiloxane (PDMS) Sub-Micron Traps for Single-Cell Analysis of Bacteria. Micromachines 2013, 4, 357–369. [Google Scholar] [CrossRef] [Scilit]
- Cortés-Llanos, B.; Wang, Y.; Sims, C.E.; Allbritton, N.L. A Technology of a Different Sort: Microraft Arrays. Lab Chip 2021, 21, 3204–3218. [Google Scholar] [CrossRef] [Scilit]
- Lee, K.; Kim, S.-E.; Nam, S.; Doh, J.; Chung, W.K. Upgraded User-Friendly Image-Activated Microfluidic Cell Sorter Using an Optimized and Fast Deep Learning Algorithm. Micromachines 2022, 13, 2105. [Google Scholar] [CrossRef] [Scilit]
- Leung, J.C.K.; Taylor-Kamall, R.W.; Hilliker, A.J.; Rezai, P. Agar-Polydimethylsiloxane Devices for Quantitative Investigation of Oviposition Behaviour of Adult Drosophila Melanogaster. Biomicrofluidics 2015, 9, 034112. [Google Scholar] [CrossRef] [Scilit] [PubMed]
- Bischel, L.L.; Mader, B.R.; Green, J.M.; Huttenlocher, A.; Beebe, D.J. Zebrafish Entrapment By Restriction Array (ZEBRA) Device: A Low-Cost, Agarose-Free Zebrafish Mounting Technique for Automated Imaging. Lab Chip 2013, 13, 1732–1736. [Google Scholar] [CrossRef] [Scilit]
- Tanizaki, K.; Santra, T.S.; Shibata, T.; Nagai, M. Microvalve Actuated by Vorticella: Self-Oscillating Valve and Improvement Measures to Calcium-Responsive Valve. Mech. Eng. J. 2021, 8, 21–00199-21–00199. [Google Scholar] [CrossRef] [Scilit]
- Nagai, M.; Hirano, T.; Shibata, T. Phototactic Algae-Driven Unidirectional Transport of Submillimeter-Sized Cargo in a Microchannel. Micromachines 2019, 10, 130. [Google Scholar] [CrossRef] [Scilit] [PubMed]
- Iftekar, S.F.; Aabid, A.; Amir, A.; Baig, M. Advancements and Limitations in 3D Printing Materials and Technologies: A Critical Review. Polymers 2023, 15, 2519. [Google Scholar] [CrossRef] [Scilit]
- Shallan, A.I.; Smejkal, P.; Corban, M.; Guijt, R.M.; Breadmore, M.C. Cost-Effective Three-Dimensional Printing of Visibly Transparent Microchips within Minutes. Anal. Chem. 2014, 86, 3124–3130. [Google Scholar] [CrossRef] [Scilit]
- Zhang, J.M.; Li, E.Q.; Aguirre-Pablo, A.A.; Thoroddsen, S.T. A Simple and Low-Cost Fully 3D-Printed Non-Planar Emulsion Generator. RSC Adv. 2016, 6, 2793–2799. [Google Scholar] [CrossRef] [Scilit]
- Bhattacharjee, N.; Urrios, A.; Kang, S.; Folch, A. The Upcoming 3D-Printing Revolution in Microfluidics. Lab Chip 2016, 16, 1720–1742. [Google Scholar] [CrossRef] [Scilit] [PubMed]
- Ling, L.; Lai, T.; Chung, P.-T.; Sabet, S.; Tran, V.; Malyala, R. A Novel 3D-Printing Model Resin with Low Volumetric Shrinkage and High Accuracy. Polymers 2025, 17, 610. [Google Scholar] [CrossRef] [Scilit] [PubMed]
- Kim, J.-W.; Allen, M.J.; Recker, E.A.; Stevens, L.M.; Cater, H.L.; Uddin, A.; Gao, A.; Eckstrom, W.; Arrowood, A.J.; Sanoja, G.E.; et al. Hybrid Epoxy–Acrylate Resins for Wavelength-Selective Multimaterial 3D Printing. Nat. Mater. 2025, 24, 1116–1125. [Google Scholar] [CrossRef] [Scilit] [PubMed]
- Yao, J.; Hakkarainen, M. Methacrylated Wood Flour-Reinforced “All-Wood” Derived Resin for Digital Light Processing (DLP) 3D Printing. Compos. Commun. 2023, 38, 101506. [Google Scholar] [CrossRef] [Scilit]
- Lantean, S.; Roppolo, I.; Sangermano, M.; Pirri, C.F.; Chiappone, A. Development of New Hybrid Acrylic/Epoxy DLP-3D Printable Materials. Inventions 2018, 3, 29. [Google Scholar] [CrossRef] [Scilit]
- Seo, J.W.; Kim, G.M.; Choi, Y.; Cha, J.M.; Bae, H. Improving Printability of Digital-Light-Processing 3D Bioprinting via Photoabsorber Pigment Adjustment. Int. J. Mol. Sci. 2022, 23, 5428. [Google Scholar] [CrossRef] [Scilit]
- Tolosana-Moranchel, A.; Pecharromán, C.; Faraldos, M.; Bahamonde, A. Strong Effect of Light Scattering by Distribution of TiO2 Particle Aggregates on Photocatalytic Efficiency in Aqueous Suspensions. Chem. Eng. J. 2021, 403, 126186. [Google Scholar] [CrossRef] [Scilit]
- Chen, S.-G.; Yang, J.; Jia, Y.-G.; Lu, B.; Ren, L. TiO2 and PEEK Reinforced 3D Printing PMMA Composite Resin for Dental Denture Base Applications. Nanomaterials 2019, 9, 1049. [Google Scholar] [CrossRef] [Scilit]
- Grunberg, L.; Nissan, A.H. Mixture Law for Viscosity. Nature 1949, 164, 799–800. [Google Scholar] [CrossRef] [Scilit]
- Tu, J.; Makarian, K.; Alvarez, N.J.; Palmese, G.R. Formulation of a Model Resin System for Benchmarking Processing-Property Relationships in High-Performance Photo 3D Printing Applications. Materials 2020, 13, 4109. [Google Scholar] [CrossRef] [Scilit]
- Tahayeri, A.; Morgan, M.; Fugolin, A.P.; Bompolaki, D.; Athirasala, A.; Pfeifer, C.S.; Ferracane, J.L.; Bertassoni, L.E. 3D Printed versus Conventionally Cured Provisional Crown and Bridge Dental Materials. Dent. Mater. 2018, 34, 192–200. [Google Scholar] [CrossRef] [Scilit]
- Lee, K.-Y.; Cho, J.-W.; Chang, N.-Y.; Chae, J.-M.; Kang, K.-H.; Kim, S.-C.; Cho, J.-H. Accuracy of Three-Dimensional Printing for Manufacturing Replica Teeth. Korean J. Orthod. 2015, 45, 217. [Google Scholar] [CrossRef] [Scilit]
- Nesic, D.; Schaefer, B.M.; Sun, Y.; Saulacic, N.; Sailer, I. 3D Printing Approach in Dentistry: The Future for Personalized Oral Soft Tissue Regeneration. J. Clin. Med. 2020, 9, 2238. [Google Scholar] [CrossRef] [Scilit] [PubMed]
- Campobasso, A.; Battista, G.; Lo Muzio, E.; Colombo, S.; Paglia, M.; Federici Canova, F.; Gianolio, A.; Beretta, M. New 3D Printed Polymers in Orthodontics: A Scoping Review. Eur. J. Paediatr. Dent. 2023, 24, 224–228. [Google Scholar] [CrossRef] [Scilit]
- Tartaglia, G.M.; Mapelli, A.; Maspero, C.; Santaniello, T.; Serafin, M.; Farronato, M.; Caprioglio, A. Direct 3D Printing of Clear Orthodontic Aligners: Current State and Future Possibilities. Materials 2021, 14, 1799. [Google Scholar] [CrossRef] [Scilit]
- Saini, R.S.; Gurumurthy, V.; Quadri, S.A.; Bavabeedu, S.S.; Abdelaziz, K.M.; Okshah, A.; Alshadidi, A.A.F.; Yessayan, L.; Mosaddad, S.A.; Heboyan, A. The Flexural Strength of 3D-Printed Provisional Restorations Fabricated with Different Resins: A Systematic Review and Meta-Analysis. BMC Oral Health 2024, 24, 66. [Google Scholar] [CrossRef] [Scilit] [PubMed]
- Mudhaffer, S.; Haider, J.; Satterthwaite, J.; Silikas, N. Effects of Print Orientation and Artificial Aging on the Flexural Strength and Flexural Modulus of 3D Printed Restorative Resin Materials. J. Prosthet. Dent. 2025, 133, 1345–1357. [Google Scholar] [CrossRef] [Scilit]
- Kim, S.-M. Comparison of Flexural Strength According to Polymerization Time of Photocurable 3D Printing Resin. Korean Acad. Prev. Dent. 2024, 20, 186–190. [Google Scholar] [CrossRef] [Scilit]
- Sayahpour, B.; Eslami, S.; Stuhlfelder, J.; Bühling, S.; Dahmer, I.; Goteni, M.; Kopp, S.; Nucci, L. Evaluation of Thickness of 3D Printed versus Thermoformed Aligners: A Prospective in Vivo Ageing Experiment. Orthod. Craniofacial Res. 2024, 27, 831–838. [Google Scholar] [CrossRef] [Scilit] [PubMed]
- Guttridge, C.; Shannon, A.; O’Sullivan, A.; O’Sullivan, K.J.; O’Sullivan, L.W. Effects of Post-Curing Duration on the Mechanical Properties of Complex 3D Printed Geometrical Parts. J. Mech. Behav. Biomed. Mater. 2024, 156, 106585. [Google Scholar] [CrossRef] [Scilit]
- Packaeser, M.G.; Santana, A.C.; Dal Piva, A.M.d.O.; Kleverlaan, C.J.; Tribst, J.P.M. Optimizing Post-Processing Parameters of 3D-Printed Resin for Surgical Guides. J. Compos. Sci. 2025, 9, 553. [Google Scholar] [CrossRef] [Scilit]
- Batmaz, S.G.; Süsgün Yıldırım, Z.; Uçar, Y. The Effect of Post-Processing Washing Time on the Physical and Chemical Properties of 3D Printable Resin Materials. BMC Oral Health 2025, 25, 1663. [Google Scholar] [CrossRef] [Scilit]
- Kownacki, I.; Marciniec, B.; Steinberger, H.; Kubicki, M.; Hoffmann, M.; Ziarko, A.; Szubert, K.; Majchrzak, M.; Rubinsztajn, S. Effect of Triorganophosphites on Platinum Catalyzed Curing of Silicon Rubber. Appl. Catal. A Gen. 2009, 362, 106–114. [Google Scholar] [CrossRef] [Scilit]
- Venzac, B.; Deng, S.; Mahmoud, Z.; Lenferink, A.; Costa, A.; Bray, F.; Otto, C.; Rolando, C.; Le Gac, S. PDMS Curing Inhibition on 3D-Printed Molds: Why? Also, How to Avoid It? Anal. Chem. 2021, 93, 7180–7187. [Google Scholar] [CrossRef] [Scilit]
- Oskui, S.M.; Diamante, G.; Liao, C.; Shi, W.; Gan, J.; Schlenk, D.; Grover, W.H. Assessing and Reducing the Toxicity of 3D-Printed Parts. Environ. Sci. Technol. Lett. 2016, 3, 1–6. [Google Scholar] [CrossRef] [Scilit]
- Prakash, J.; Shenoy, M.; Alhasmi, A.; Al Saleh, A.A.; C, S.G.; Shivakumar, S. Biocompatibility of 3D-Printed Dental Resins: A Systematic Review. Cureus 2024, 16, e51721. [Google Scholar] [CrossRef] [Scilit]
- Poskus, M.D.; Wang, T.; Deng, Y.; Borcherding, S.; Atkinson, J.; Zervantonakis, I.K. Fabrication of 3D-Printed Molds for Polydimethylsiloxane-Based Microfluidic Devices Using a Liquid Crystal Display-Based Vat Photopolymerization Process: Printing Quality, Drug Response and 3D Invasion Cell Culture Assays. Microsyst. Nanoeng. 2023, 9, 140. [Google Scholar] [CrossRef] [Scilit]
- Bennett, G.; Beatty, M.W.; Simetich, B. Evaluation of Printability, Color Difference, Translucency, and Surface Roughness over Time in a 3D-Printed TiO2-Containing Denture Base Resin: A Pilot Study. Materials 2025, 18, 3683. [Google Scholar] [CrossRef] [Scilit]
- Choi, Y.; Yoon, J.; Kim, J.; Lee, C.; Oh, J.; Cho, N. Development of Bisphenol-A-Glycidyl-Methacrylate- and Trimethylolpropane-Triacrylate-Based Stereolithography 3D Printing Materials. Polymers 2022, 14, 5198. [Google Scholar] [CrossRef] [Scilit]
- Park, I.; Lim, S.-H.; Shin, D.; Lee, K.S.; Jang, S.; Yim, H.J.; Won, C.; Jeong, J.I. Heat Transfer Analysis during a Curing Process for UV Nanoimprint Lithography. J. Mech. Sci. Technol. 2009, 23, 927–930. [Google Scholar] [CrossRef] [Scilit]
Disclaimer/Publisher’s Note: The statements, opinions and data contained in all publications are solely those of the individual author(s) and contributor(s) and not of MDPI and/or the editor(s). MDPI and/or the editor(s) disclaim responsibility for any injury to people or property resulting from any ideas, methods, instructions or products referred to in the content. |
© 2026 by the authors. Licensee MDPI, Basel, Switzerland. This article is an open access article distributed under the terms and conditions of the Creative Commons Attribution (CC BY) license.