


Abstract
Sesame (Sesamum indicum L.) cv. BRS Anahí is a promising crop for agricultural diversification in the Brazilian semi-arid region, although saline irrigation can limit its development and productivity. The objective of this study was to evaluate the physiological and productive responses of sesame irrigated with brackish water under different fertilization treatments. The experiment was conducted in a greenhouse at the Federal University of Ceará, using a completely randomized design in a 4 × 2 factorial scheme, with four replications. These corresponded to four fertilization treatments (F1: HomeBiogas liquid biofertilizer from CAGECE; F2: HomeBiogas from food waste; F3: shrimp biofertilizer; and F4: mineral fertilization—NPK) and two irrigation water salinity levels (0.8 and 3.0 dS m−1). Irrigation with 3.0 dS m−1 significantly reduced the analyzed variables; however, the intensity of these effects varied according to the fertilization treatment. Treatment F1 promoted greater physiological activity under saline conditions, partially mitigating saline stress. At low salinity, treatments F1 and F3 showed productivity performance similar to F4, while at high salinity, F3 was less effective. The results highlight the potential of the selected biofertilizers to improve sesame performance under saline irrigation.
1. Introduction
Sesame (Sesamum indicum L.) is cultivated in approximately 70 countries, particularly across Asia and Africa, where the leading producers—Sudan, India, Myanmar, and Tanzania—together account for approximately 64% of the world’s planted area [1]. In Brazil, sesame shows high production potential due to its rusticity and adaptability, representing an important alternative for agricultural diversification, particularly in semi-arid regions [2]. During the 2025/26 harvest season, Brazilian sesame output reached approximately 1.13 million tonnes with cultivated area expanding modestly year-on-year to roughly 280 thousand hectares nationwide [3]. However, its cultivation is often concentrated in areas characterized by irregular rainfall and high temperatures, where water scarcity and quality constraints are major limiting factors.
In the Brazilian semi-arid region, the use of saline water for irrigation is common due to edaphoclimatic conditions and limitations in water resource management [4]. Salt stress affects plant development through two combined mechanisms: initially, the reduction in soil osmotic potential hinders water uptake—even when soil moisture is adequate—creating a condition of physiological drought; subsequently, the excessive accumulation of Na+ and Cl− ions in plant tissues compromises ionic homeostasis and membrane integrity, intensifying damage to the photosynthetic apparatus [5,6]. In sesame, these responses have been reported as reductions in plant height and leaf area [7], as well as decreases in stomatal aperture and photosynthesis caused by salts present in irrigation water [8]. Thus, leaf gas exchange parameters serve as early indicators of salt stress, directly reflecting its effects on crop growth and productivity.
To mitigate the adverse effects of salinity, different fertilization strategies have been investigated. Mineral fertilization has shown potential to alleviate salt stress by improving plant nutritional status and physiological performance. For instance, potassium fertilization enhanced peanut tolerance to saline conditions by competing with Na+ for root uptake sites, thereby limiting cytosolic Na+ accumulation and supporting osmotic adjustment and stomatal regulation [9]. Similarly, phosphate fertilization can contribute to greater root system development, improving water uptake under saline conditions [10].
In addition to mineral inputs, the use of organic sources has gained attention as a sustainable alternative. Biofertilizers derived from organic residues can improve soil structure, increase nutrient availability, and enhance plant tolerance to abiotic stress [11]. Previous studies have demonstrated that organic fertilization—such as biofertilizers based on cattle and poultry manure—can mitigate salt stress and increase the productivity of crops irrigated with brackish water [6,12,13].
Despite these advances, few studies have directly compared how biofertilizers derived from different feedstocks such as biogas sludge from sanitation systems, food waste digestate, and crustacean (shrimp) processing waste differ in their physiological modes of action and their ability to maintain source–sink regulation under saline irrigation, particularly in oilseed crops. This information is relevant because these biofertilizers differ substantially in composition and bioactive fractions: biogas-derived digestates are characterized primarily by their nutrient and humic substance content [14], whereas shrimp-derived biofertilizers contain chitin/chitosan fractions with distinct elicitation and antioxidant priming properties [15]. The literature reports physiological and biochemical tolerance mechanisms across various sesame genotypes in response to stress conditions worldwide, and plant growth-promoting rhizobacteria have been shown to mitigate salt stress in sesame through osmolyte accumulation and antioxidant enzyme activation [16,17]; however, the comparative efficacy of biofertilizers derived from markedly different feedstocks remains underexplored for this crop.
Based on this, it is hypothesized that biofertilizers can mitigate the negative effects of salinity on gas exchange and yield components of sesame, with this mitigating capacity depending on the composition and raw material of each biofertilizer. Therefore, this study aimed to evaluate the physiological and productive responses of sesame irrigated with brackish water under mineral fertilization and biofertilizers of different origins. The originality of this study lies in the direct physiological comparison between biofertilizers of contrasting raw materials and mineral fertilization in sesame under saline irrigation. Practically, identifying biofertilizers able to sustain sesame’s physiological performance and productivity under salinity offers smallholder farmers in the Brazilian semi-arid region a low-cost, circular-economy alternative to mineral fertilizers, while adding value to regional agro-industrial and sanitation waste streams.
2. Materials and Methods
2.1. Experimental Conditions
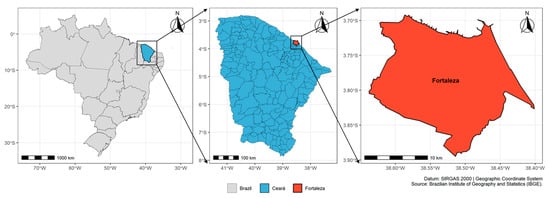
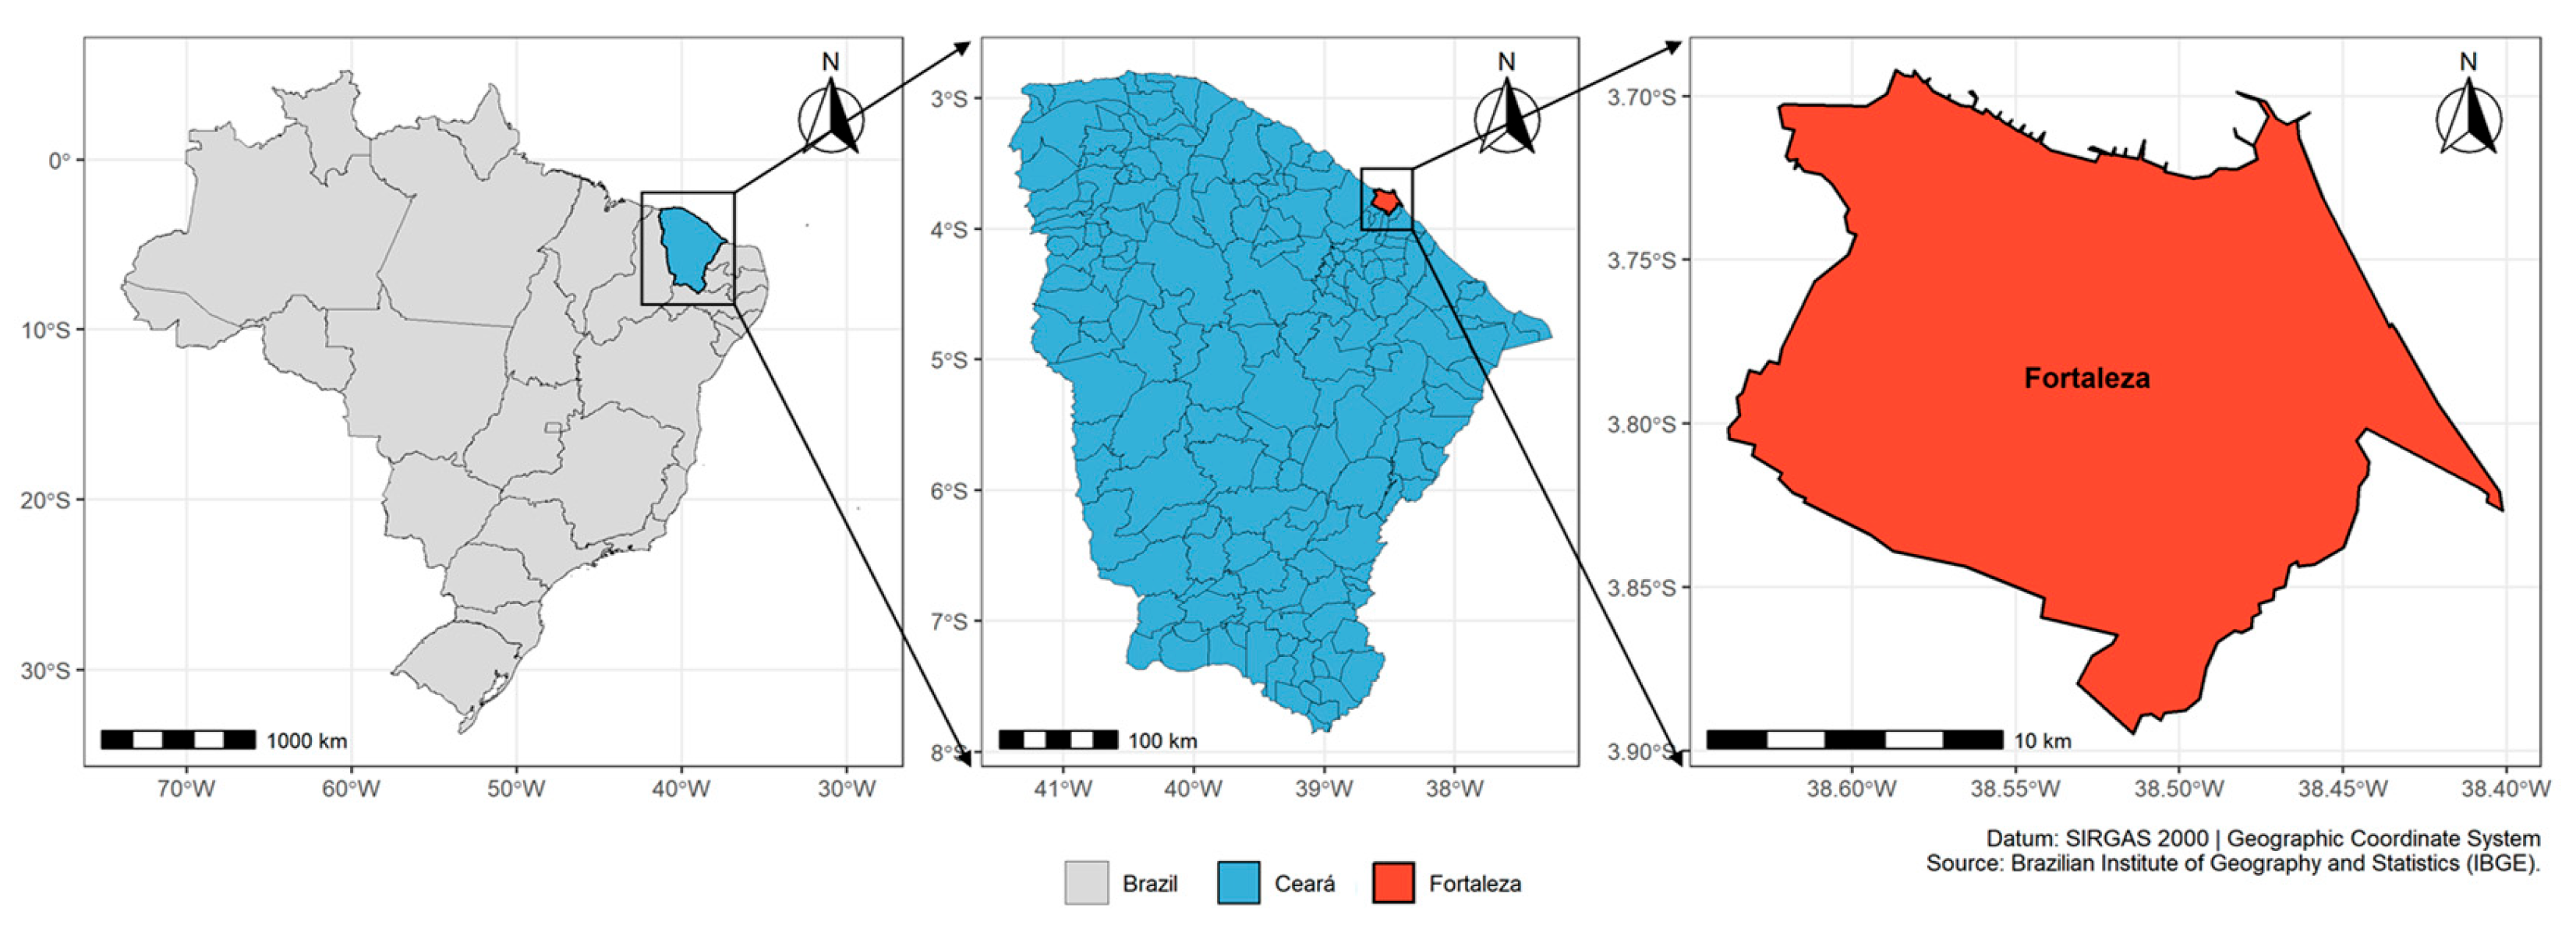
The experiment was conducted in a greenhouse from August to November 2024 at the experimental area of the Agrometeorological Station of the Federal University of Ceará (UFC), Pici Campus, Fortaleza, Ceará, Brazil (3°44′44″ S, 38°34′55″ W; 25 m altitude) (Figure 1).
Figure 1.
Location of the experimental area in the municipality of Fortaleza, Ceará, Brazil.
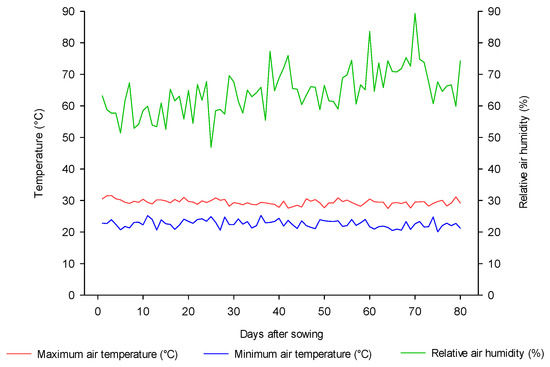
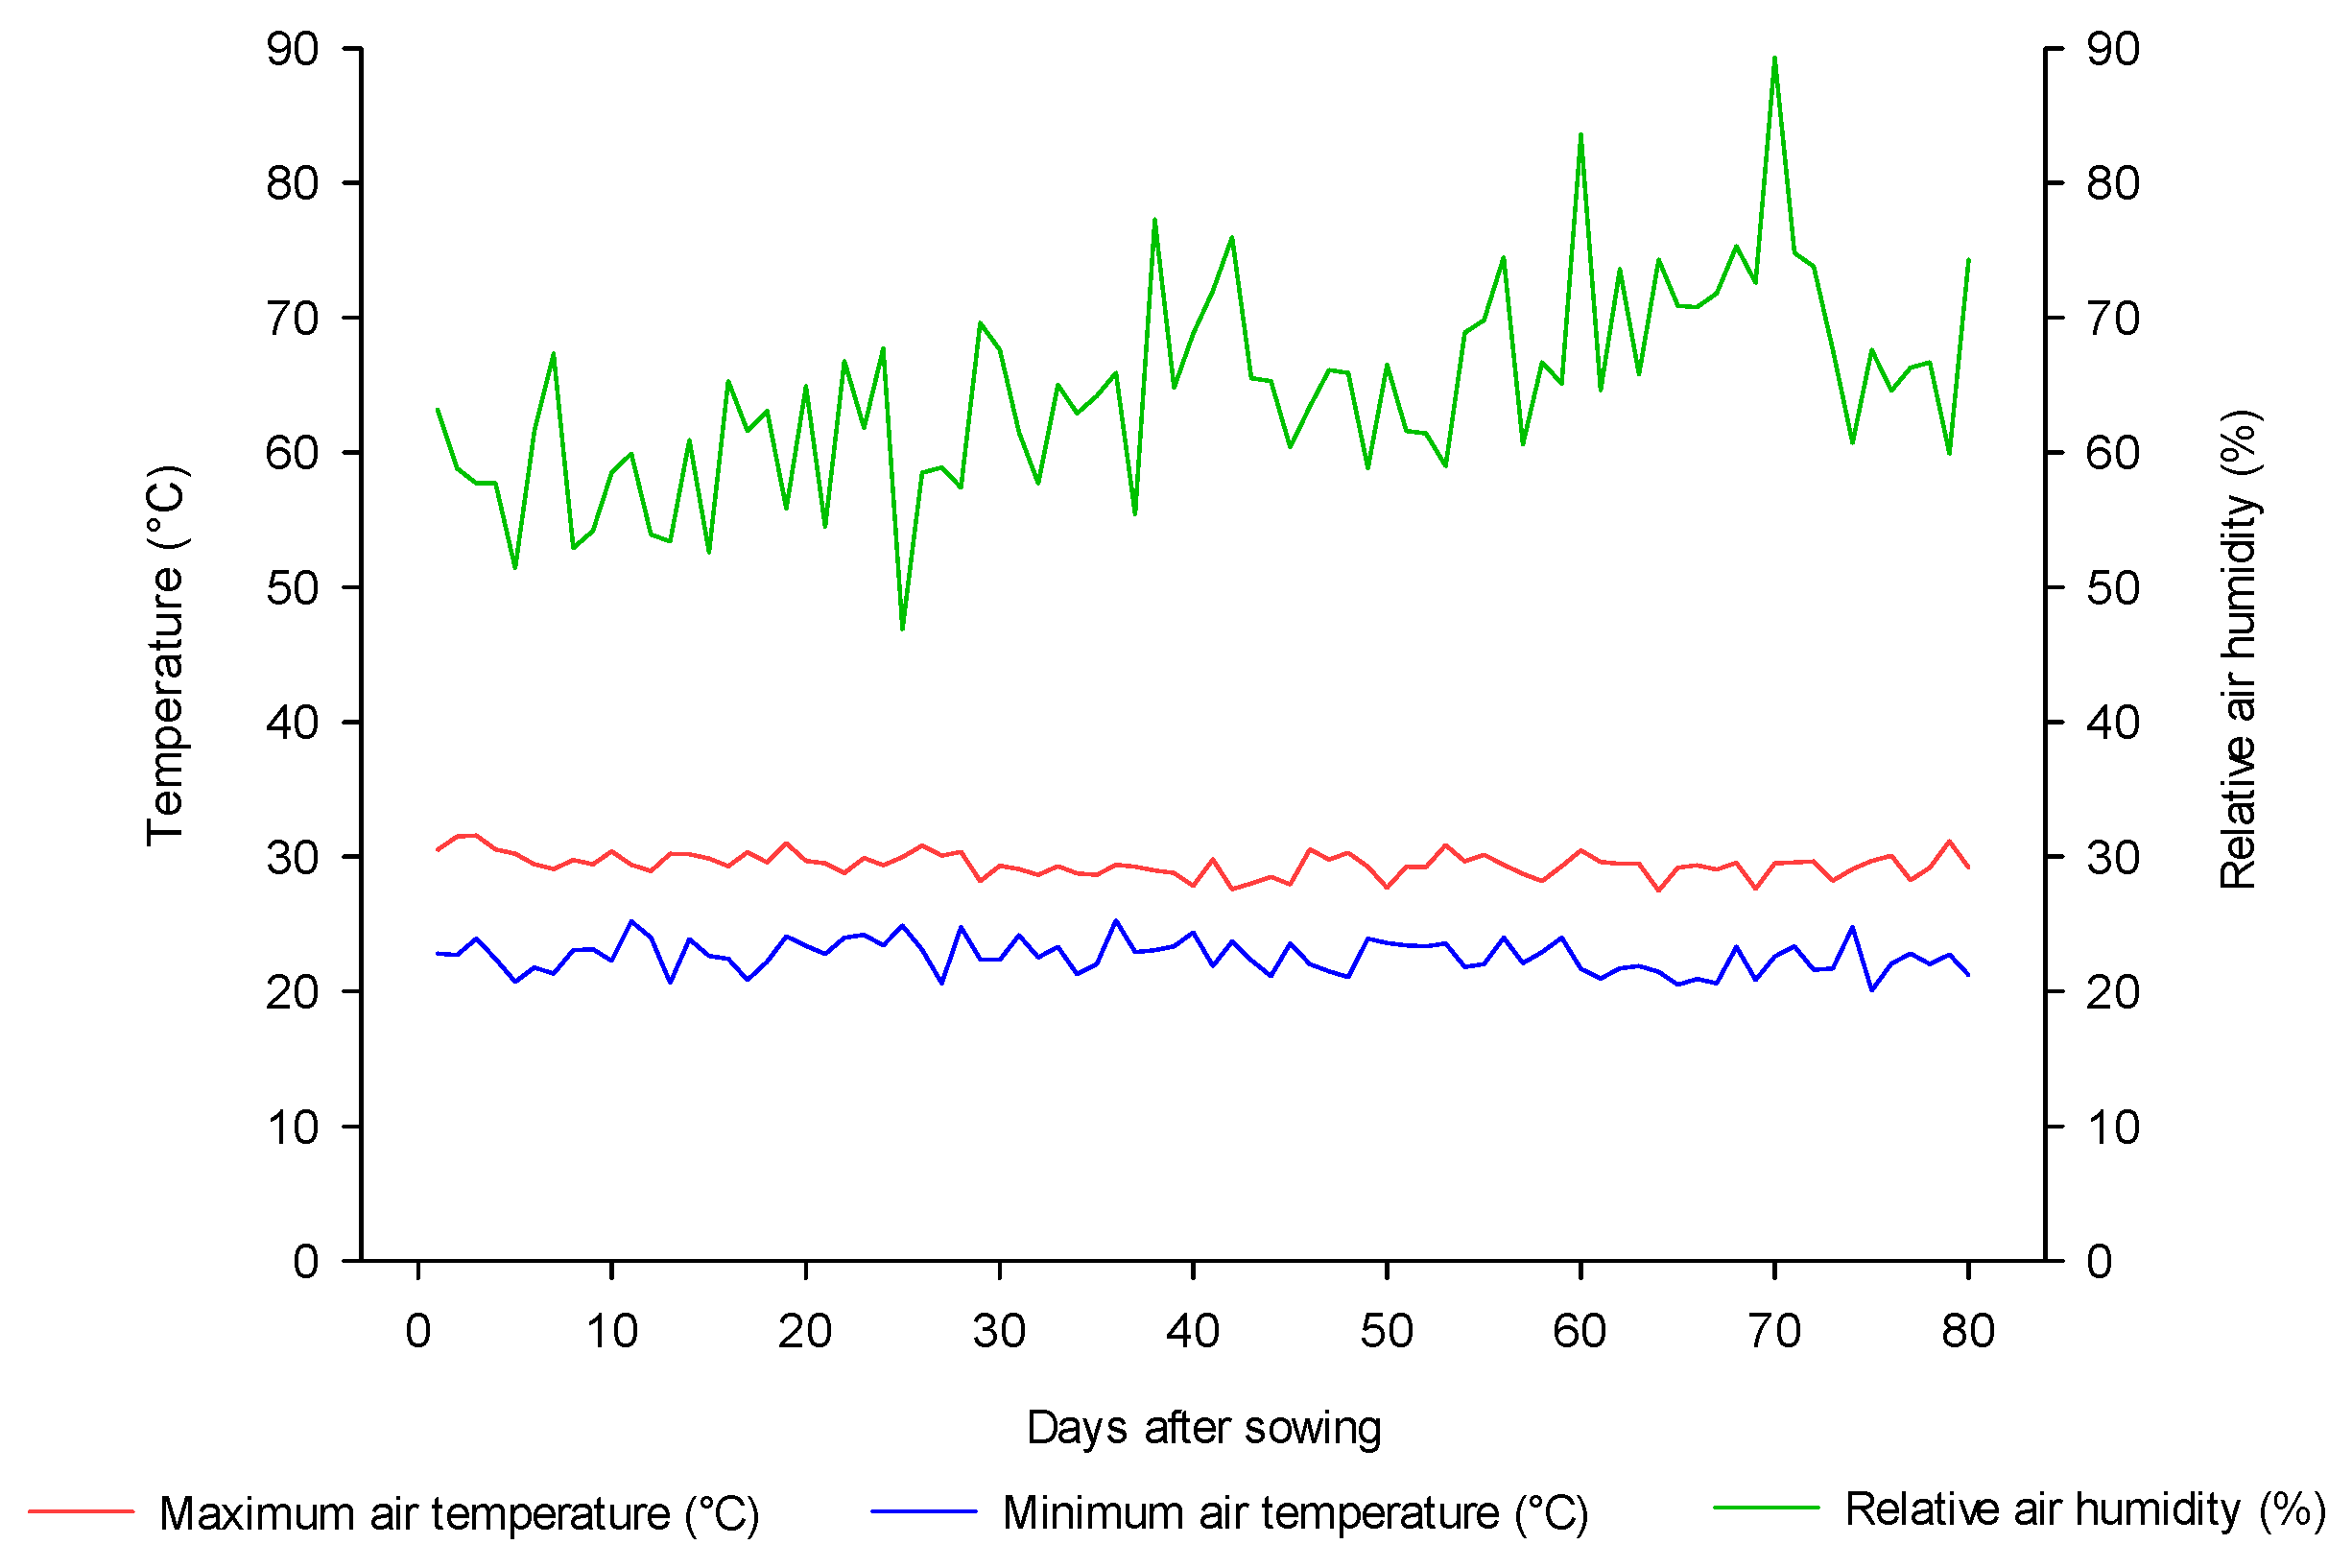
Daily maximum and minimum air temperatures and mean relative humidity were recorded throughout the experimental period (Figure 2) using a digital thermo-hygrometer (FEPRO-MUT50), Exbom, São Paulo, Brazil.
Figure 2.
Variation in maximum and minimum temperatures and relative humidity throughout the experimental cycle.
2.2. Experimental Design
A completely randomized design in a 4 × 2 factorial scheme was adopted, with 4 replications. It consisted of four fertilization strategies: F1 = 100% liquid biofertilizer derived from organic waste processed by the Water and Sewage Company of Ceará (CAGECE) using a HomeBiogas system; F2 = 100% liquid biofertilizer derived from food waste processed via HomeBiogas; F3 = 100% shrimp-based biofertilizer; and F4 = 100% mineral fertilization (NPK) and two levels of electrical conductivity of the irrigation water (0.8 and 3.0 dS m−1).
2.3. Preparation and Experimental Procedures
The experiment was conducted in 20 L polyethylene pots filled with a substrate composed of arisco soil, sand, and organic compost in a 7:2:1 ratio (v/v). The soil was air-dried and sieved (2 mm mesh) prior to substrate preparation, following standard procedures described in the EMBRAPA Manual de Métodos de Análise de Solo [18]. The chemical properties of the substrate are presented in Table 1.
Table 1.
Chemical properties of the substrate used in the experiment.
Sesame seeds of the cultivar ‘BRS Anahí’ were sown, with five seeds per pot; thinning began seven days after sowing (DAS) and continued until one plant per pot remained. The biofertilizers from CAGECE and food waste were produced using a HomeBiogas™ Model 2.0 system (HomeBiogas Ltd., Beit Yanai, Israel), an intermediate-scale anaerobic biodigester with a 1200 L digestion chamber and 700 L gas storage capacity. The system includes an organic waste inlet, a biodigestion tank, a gas storage chamber with a filtration unit, a pressure system for gas distribution, and an effluent outlet. The shrimp biofertilizer was supplied by BioTech4Life Soluções Biotecnológicas, Fortaleza, Brazil. Shrimp residues were ground and subjected to fermentation in a bioreactor with the addition of a consortium of lactic acid bacteria. The material underwent hydrolysis for 48 h until complete degradation of the solid fraction.
All biofertilizers were chemically characterized by the Laboratory for Soil, Water, Plant Tissue, and Fertilizer Analysis of the Soil Science Department at UFC (Table 2).
Table 2.
Chemical composition of the biofertilizers.
Mineral fertilization was based on substrate analysis (Table 1) and crop recommendations [19], corresponding to 40 kg ha−1 N, 80 kg ha−1 P2O5, and 60 kg ha−1 K2O. Considering a density of 10,000 plants ha−1, the equivalent per plant was 4 g N, 8 g P2O5, and 6 g K2O, applied via urea (45% N), single superphosphate (18% P2O5), and potassium chloride (60% K2O).
Organic fertilization was based on substrate properties and biofertilizer composition (Table 2). Because F1 and F2 had lower nutrient concentrations per unit volume than F3, they were applied at a higher weekly rate (2.0 L pot−1 week−1, split into 500 mL applications over the week), whereas the more concentrated F3 was applied at 500 mL pot−1 week−1. To determine nutrient supply from each source, a balance was calculated between the initial nutrients provided by the substrate, the input from the biofertilizer, and the crop’s nutritional requirements. Based on this estimate, the need for mineral and organic supplementation was determined to meet the N, P, and K nutritional demands per plant. Table 3 summarizes the nutritional management adopted.
Table 3.
Summary of the nutritional management adopted in the experiment.
Saline irrigation water (3.0 dS m−1) was prepared using NaCl, CaCl2·2H2O, and MgCl2·6H2O in a 7:2:1 ratio, following the relationship between electrical conductivity and ionic concentration (mmol L−1 = EC × 10) [20]. Regarding the ionic composition of the irrigation waters, samples of the supply water (0.8 dS m−1) and the saline solution (3.0 dS m−1) were analyzed at the Soil, Water, Plant Tissue, and Fertilizer Analysis Laboratory of the Department of Soil Science at UFC (Table 4).
Table 4.
Chemical characteristics of the irrigation waters.
Irrigation with saline water started 15 days after sowing (DAS) and continued until harvest (80 DAS). Irrigation was applied daily, maintaining soil moisture near field capacity, with a leaching fraction of 0.15 [21], determined according to the drainage lysimeter method [22]. The irrigation volume was calculated as:
where:
VI—volume of water to be applied in the irrigation event (mL);
Vp—volume of water applied in the previous irrigation event (mL);
Vd—volume of water drained (mL);
LF—leaching fraction of 0.15;
2.4. Measured Variables
At 45 DAS, physiological variables were measured: CO2 assimilation rate (A, µmol CO2 m−2 s−1), stomatal conductance (gs, mol H2O m−2 s−1), transpiration (E, mmol m−2 s−1), internal CO2 concentration (Ci, µmol mol−1), and leaf temperature (LT, °C). Leaf gas exchange was measured between 08:00 and 10:00 h on fully expanded leaves using a portable open-system infrared gas analyzer (ADC BioScientific LCi Analyser, ADC BioScientific Ltd., Hoddesdon, UK). Measurements were taken under ambient greenhouse conditions, with photosynthetic photon flux density ranging from 79 to 482 µmol m−2 s−1 (mean 229.1 ± 139.8), reference CO2 concentration ranging from 393 to 404 µmol mol−1 (mean 396.5 ± 2.2), and leaf chamber temperature ranging from 33.5 to 36.1 °C (mean 34.7 ± 0.7).
At 80 DAS, yield components were evaluated: number of capsules per plant (NC), determined by counting all capsules per plant; capsule diameter (CD, mm) and capsule length (CL, mm), measured with a digital caliper (Davely, 150 mm) on five capsules randomly selected per plant and averaged; mean capsule mass (MCM, g), determined by weighing all capsules per plant on an analytical balance (Mylabor, São Paulo, Brazil, precision 0.0001 g) and dividing by the total number of capsules; and yield (Y, g plant−1), determined by weighing seeds from all capsules per plant.
2.5. Statistical Analysis
Data normality was assessed using the Kolmogorov–Smirnov test (p ≤ 0.05). Data were subjected to a two-way analysis of variance (ANOVA) based on a fixed-effects model, with fertilization strategy, salinity level, and their interaction treated as fixed factors, using the F-test (p ≤ 0.05). When a significant effect was detected, means were compared using Tukey’s HSD test (p ≤ 0.05): lowercase letters were used to compare fertilization strategies within the same salinity level, and uppercase letters were used to compare salinity levels within the same fertilization strategy. Pearson’s correlation analysis was performed to evaluate relationships among variables, using the corr_coef function of the “metan” package (version 1.19.0) [23]. All analyses were conducted using R software (version 4.1.1) [24].
3. Results
3.1. Physiological Variables
The analysis of variance revealed a significant interaction between fertilization strategies and salinity for CO2 assimilation (p ≤ 0.05), stomatal conductance, and transpiration (p ≤ 0.01), indicating that the physiological response of sesame to salinity depends on the fertilization approach. No significant effects were observed for internal CO2 concentration and leaf temperature (Table 5).
Table 5.
Summary of the analysis of variance for gas exchange in sesame plants irrigated with brackish water under different fertilization methods.
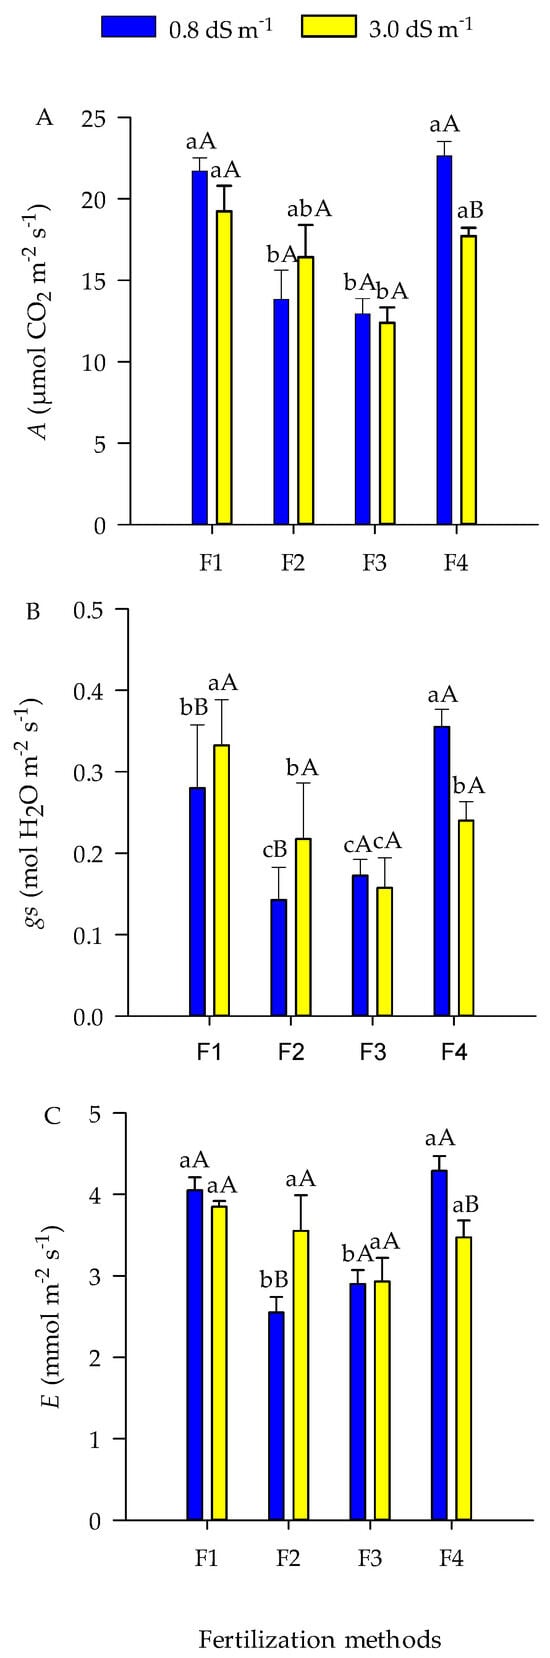
CO2 assimilation was not affected by salinity under F1, F2, and F3, whereas a reduction was observed under F4 when irrigated with saline water (Figure 3A), indicating greater sensitivity of mineral fertilization to salt stress.
Figure 3.
CO2 assimilation rate (A), stomatal conductance (B), and transpiration (C) in sesame plants irrigated with brackish water and under different fertilization methods. F1 = 100% with CAGECE’s HomeBiogas liquid biofertilizer; F2 = 100% with HomeBiogas liquid biofertilizer from food waste; F3 = 100% with shrimp biofertilizer; F4 = 100% mineral fertilizer—NPK. Lowercase letters compare the mean values of the different fertilization treatments at the same EC level, and uppercase letters compare the mean EC values for each fertilization source. Means with the same letters do not differ statistically from one another according to Tukey’s test (p ≤ 0.05). Vertical bars represent the standard error (n = 4).
For stomatal conductance, F1 and F2 showed increases of 18% and 52%, respectively, under higher salinity, while F4 exhibited a 32% reduction (Figure 3B). These results indicate that biofertilizers favored the maintenance of stomatal activity under saline conditions, whereas mineral fertilization was negatively affected. No significant differences were observed between salinity levels under F3.
Transpiration did not differ between salinity levels under F1 and F3, whereas F2 showed higher values under saline conditions and F4 showed a reduction (Figure 3C), reinforcing the differential effect of fertilization strategies on plant water regulation.
3.2. Yield Variables
The analysis of variance indicated a significant interaction between fertilization strategies and salinity for number of capsules, mean capsule mass (p ≤ 0.01), and capsule diameter (p ≤ 0.05), demonstrating that these yield components are influenced by the combination of both factors. Capsule length and yield showed isolated effects of fertilization and salinity (Table 6).
Table 6.
Summary of the analysis of variance for yield components in sesame plants subjected to brackish water irrigation under different fertilization methods.
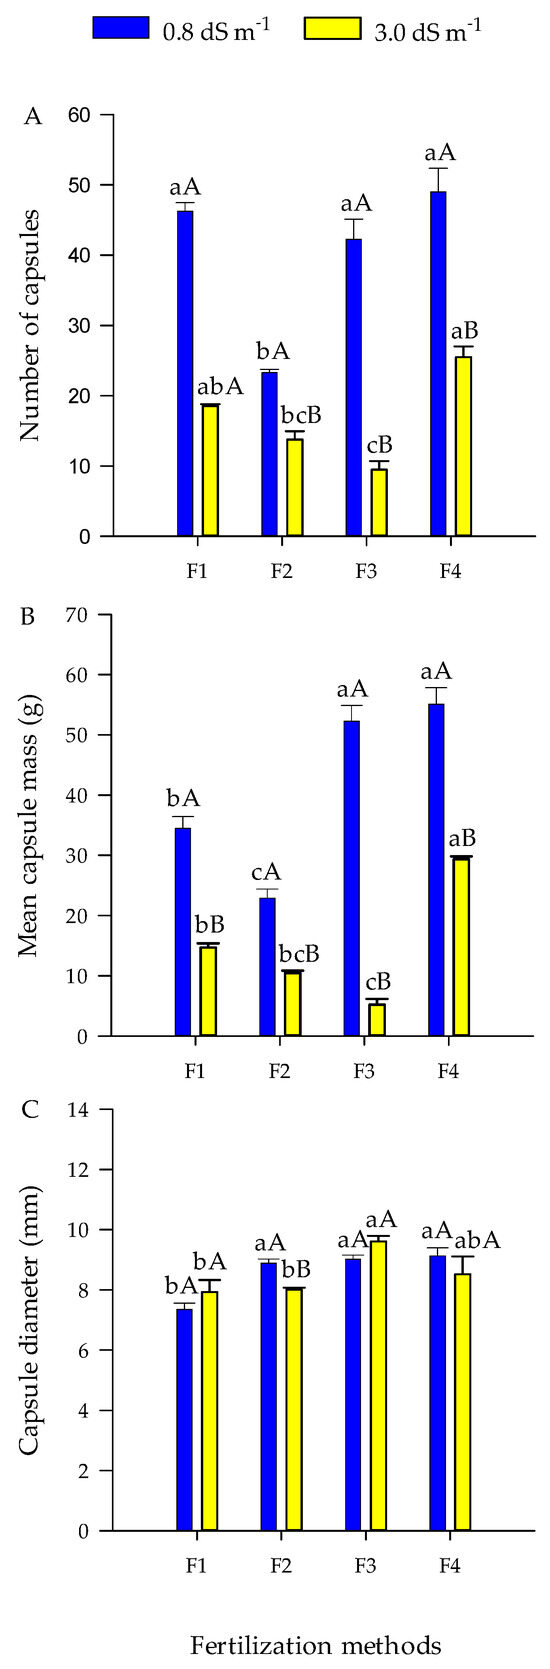
The number of capsules decreased under higher salinity in all treatments, with reductions of 60, 40, 77, and 48% for F1, F2, F3, and F4, respectively (Figure 4A), indicating high sensitivity of this variable to salt stress. Mean capsule mass was higher under lower salinity across all fertilization strategies (Figure 4B), confirming the consistent negative effect of salinity on capsule filling.
Figure 4.
Number of capsules (A); mean capsule mass (B); capsule diameter (C) in sesame plants irrigated with brackish water and under different fertilization methods. F1 = 100% with CAGECE’s HomeBiogas liquid biofertilizer; F2 = 100% with HomeBiogas liquid biofertilizer from food waste; F3 = 100% with shrimp biofertilizer; F4 = 100% mineral fertilizer—NPK. Lowercase letters compare the mean values of the different fertilization treatments at the same EC level, and uppercase letters compare the mean EC values for each fertilization source. Means with the same letters do not differ statistically from one another according to Tukey’s test (p ≤ 0.05). Vertical bars represent the standard error (n = 4).
Capsule diameter was affected by salinity only under F2, with a 10% reduction (Figure 4C), suggesting lower sensitivity of this trait compared to other yield variables.
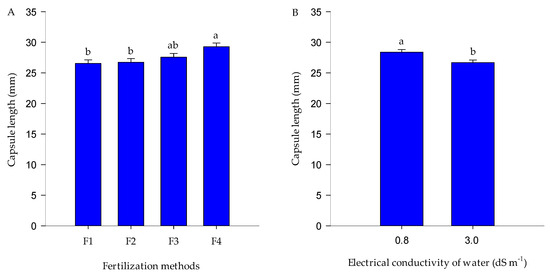
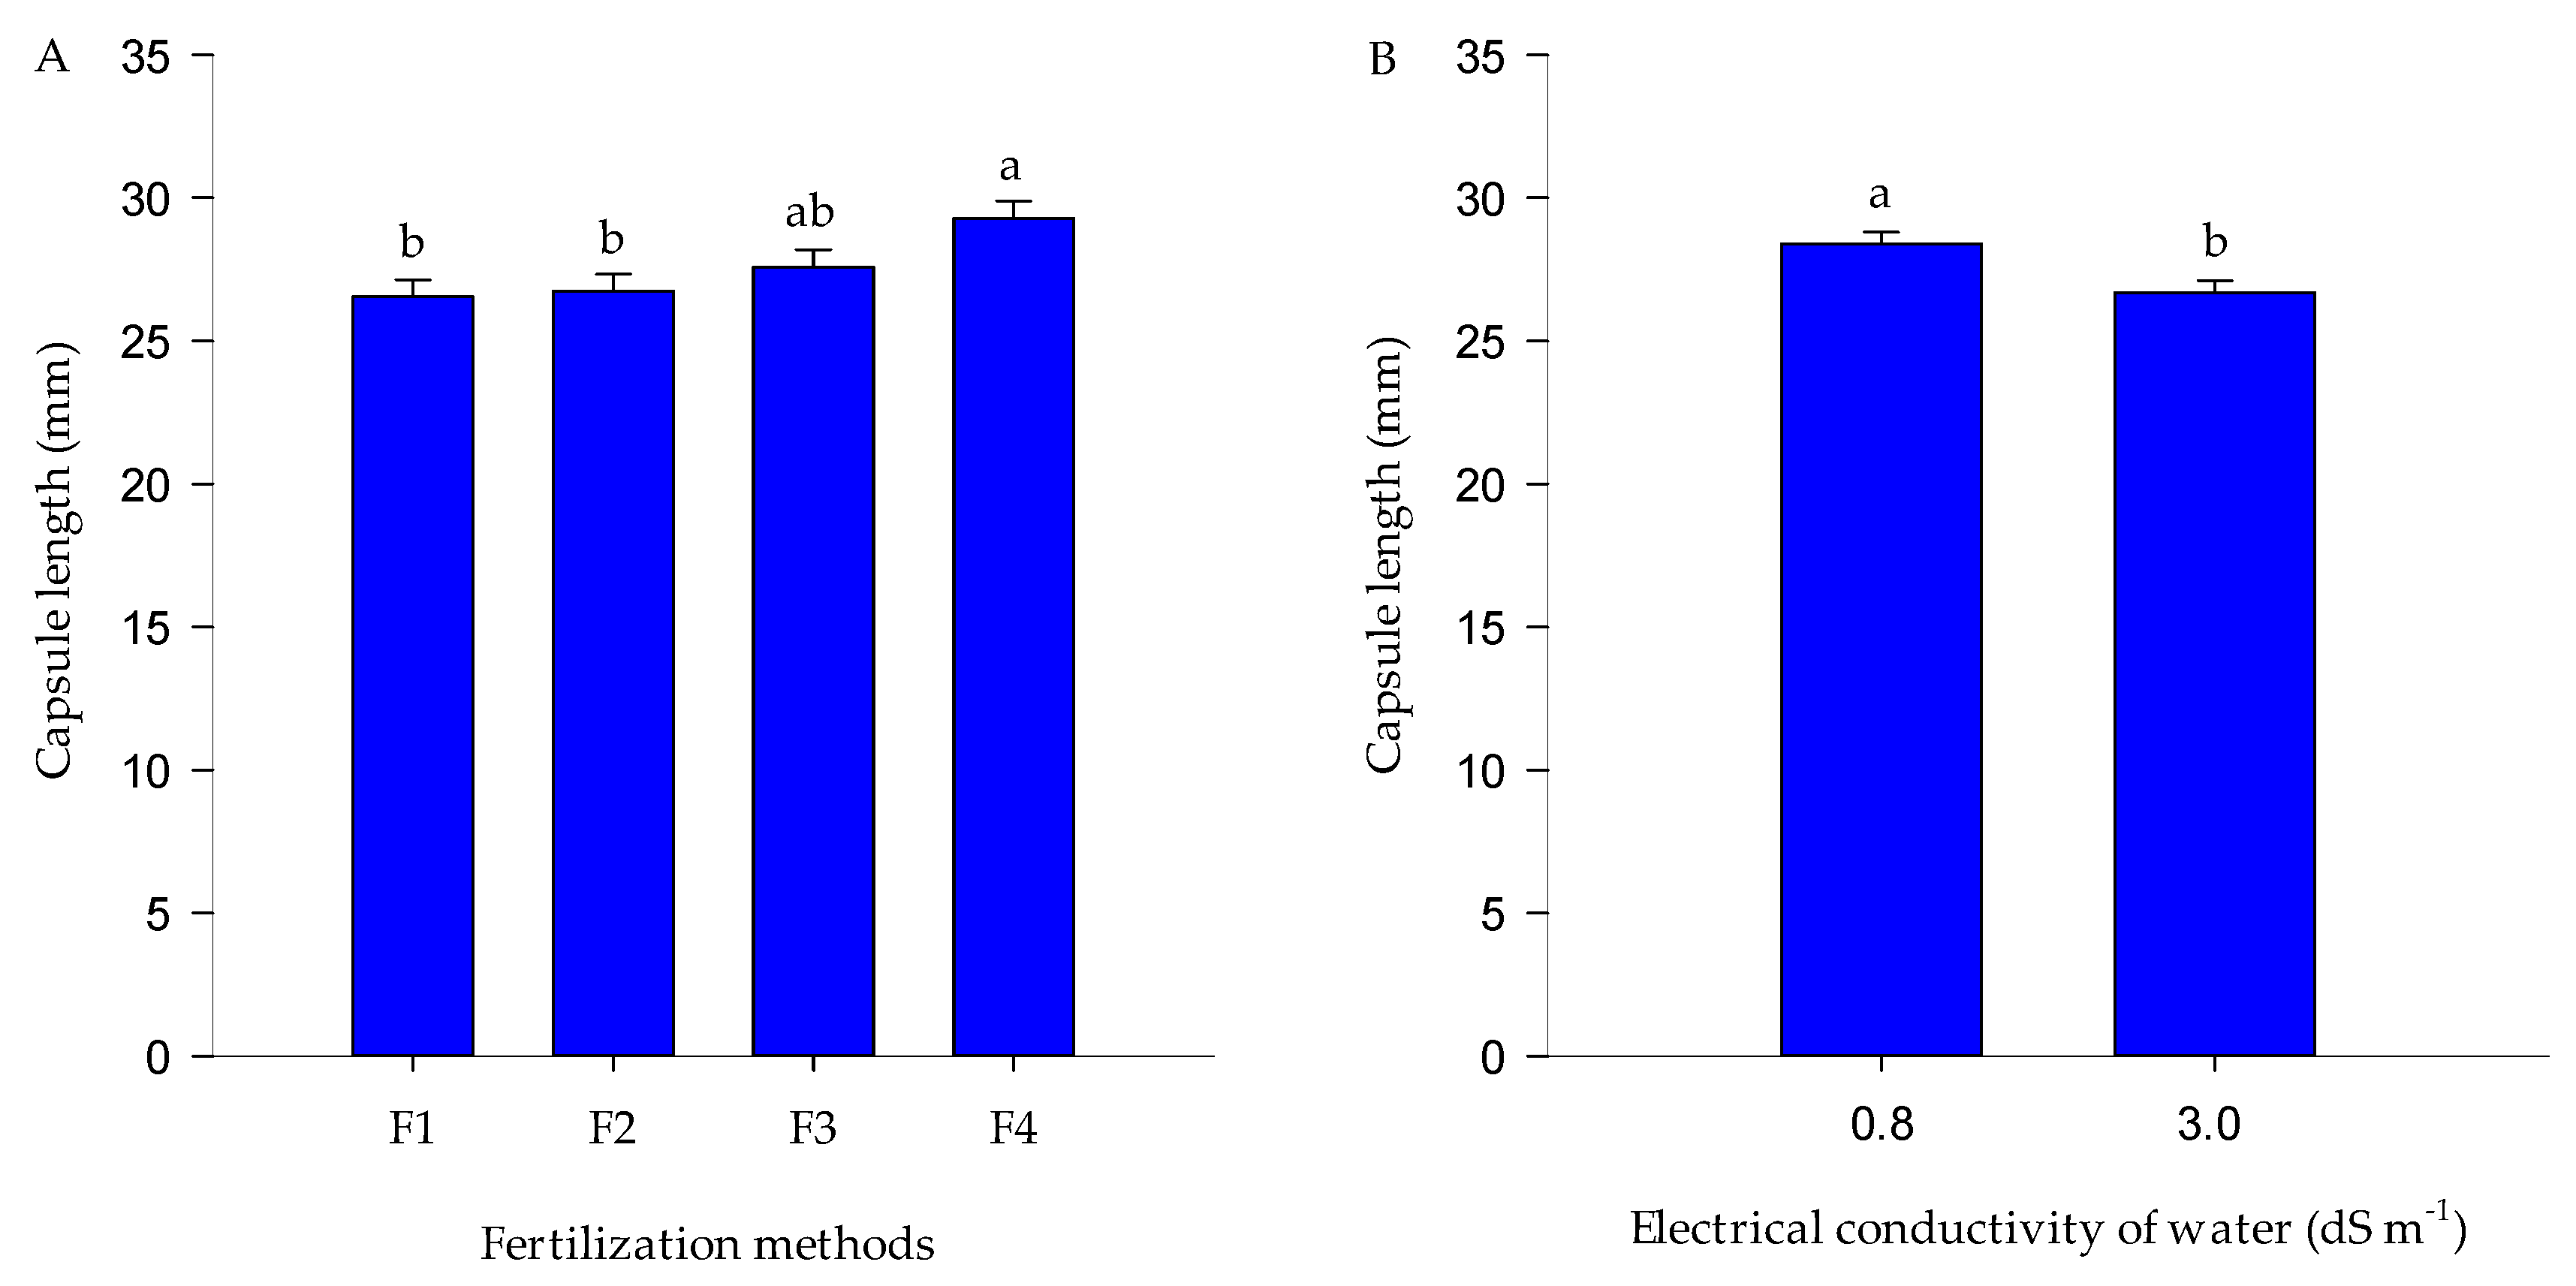
Capsule length was higher under F1 and F4 (Figure 5A) and reduced by 6% under higher salinity (Figure 5B), indicating the moderate effect of salt stress on this parameter.
Figure 5.
Capsule length as a function of fertilization methods (A) and salt stress (B) in sesame plants. F1 = 100% with CAGECE’s HomeBiogas liquid biofertilizer; F2 = 100% with HomeBiogas liquid biofertilizer from food waste; F3 = 100% with shrimp biofertilizer; F4 = 100% mineral fertilizer—NPK. Lowercase letters compare mean values among fertilization treatments (A) and between salinity levels (B), according to Tukey’s test (p ≤ 0.05). Means with the same letter do not differ statistically from one another. Vertical bars represent the standard error (n = 5).
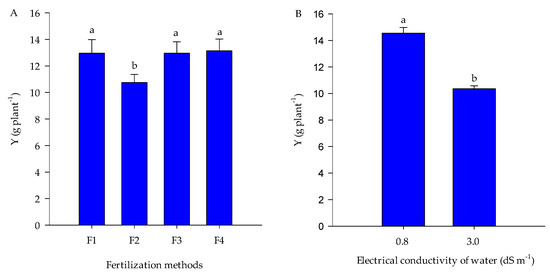
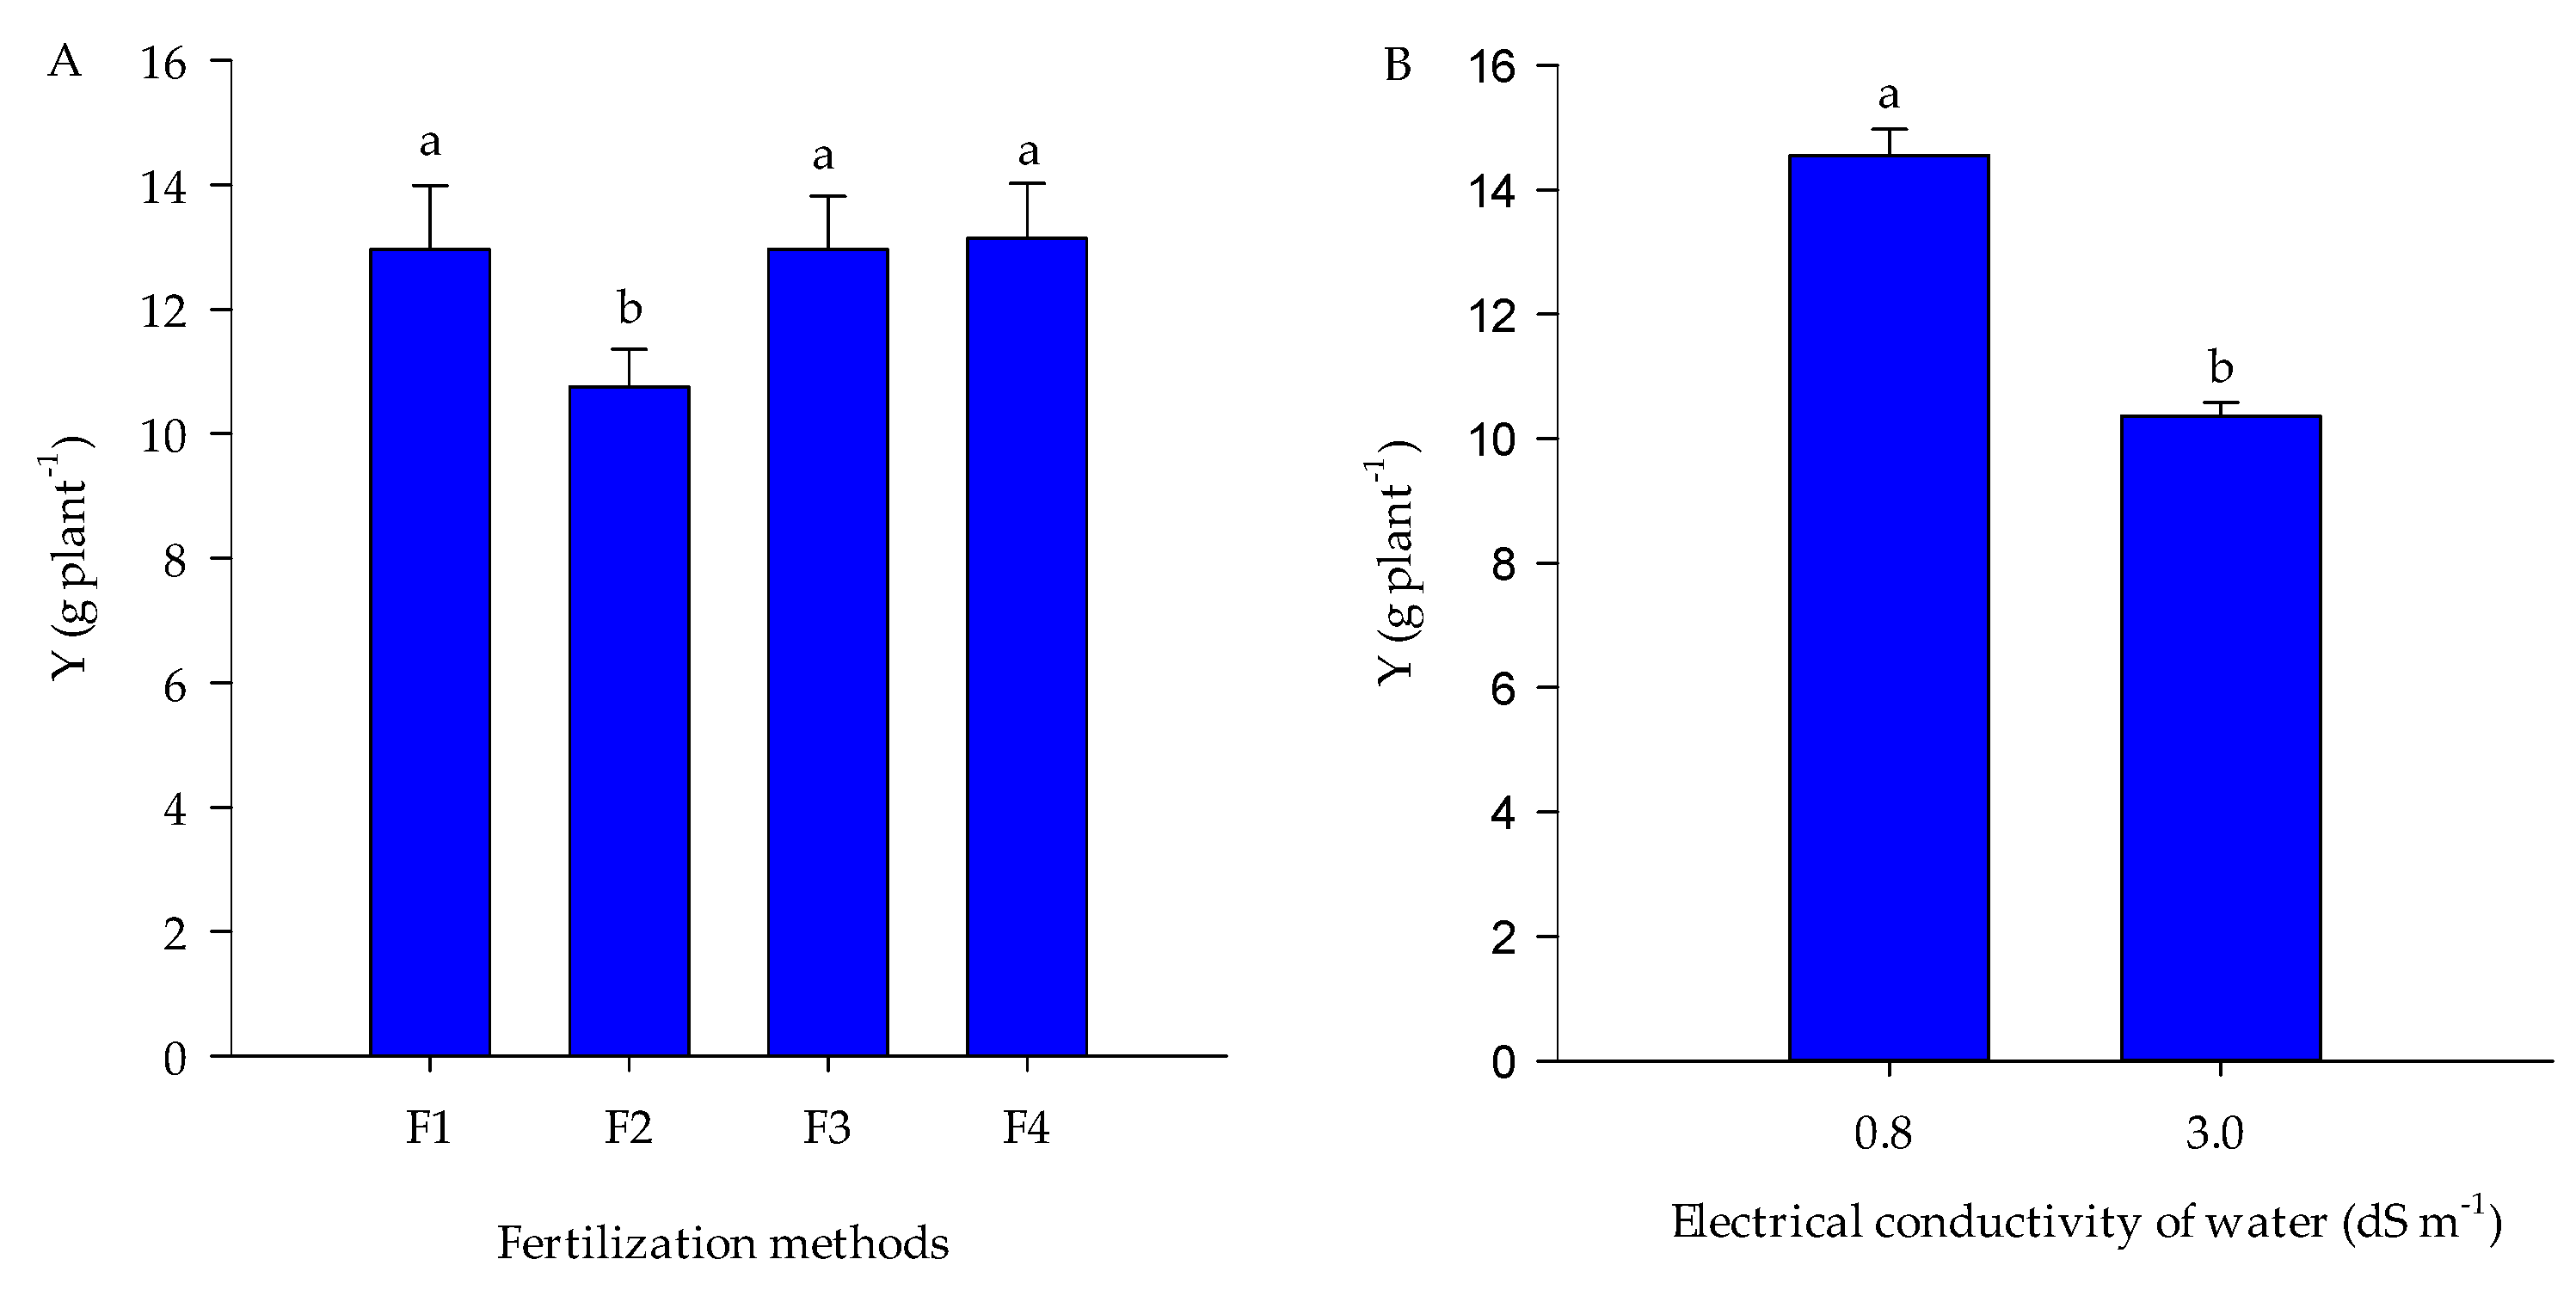
Yield was lower under F2 compared to the other treatments (Figure 6A), while salinity reduced overall productivity by 28% (Figure 6B), confirming the negative impact of saline irrigation on sesame performance.
Figure 6.
Yield as a function of fertilization methods (A) and salt stress (B) in sesame plants. F1 = 100% with CAGECE’s HomeBiogas liquid biofertilizer; F2 = 100% with HomeBiogas liquid biofertilizer from food waste; F3 = 100% with shrimp biofertilizer; F4 = 100% mineral fertilizer—NPK. Lowercase letters compare mean values among fertilization treatments (A) and between salinity levels (B), according to Tukey’s test (p ≤ 0.05). Means with the same letter do not differ statistically from one another. Vertical bars represent the standard error (n = 5).
3.3. Pearson Correlation
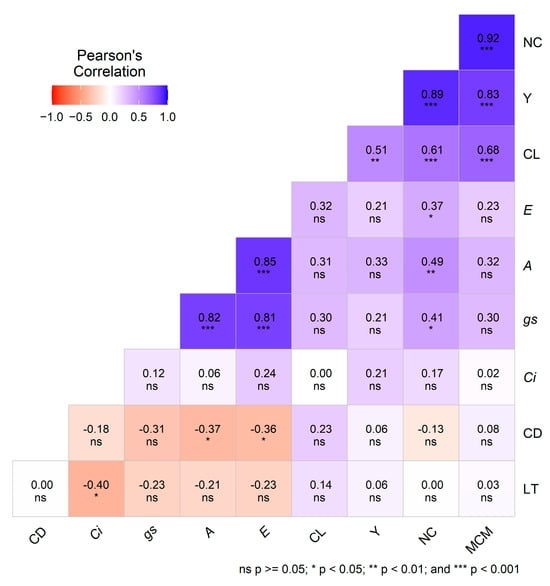
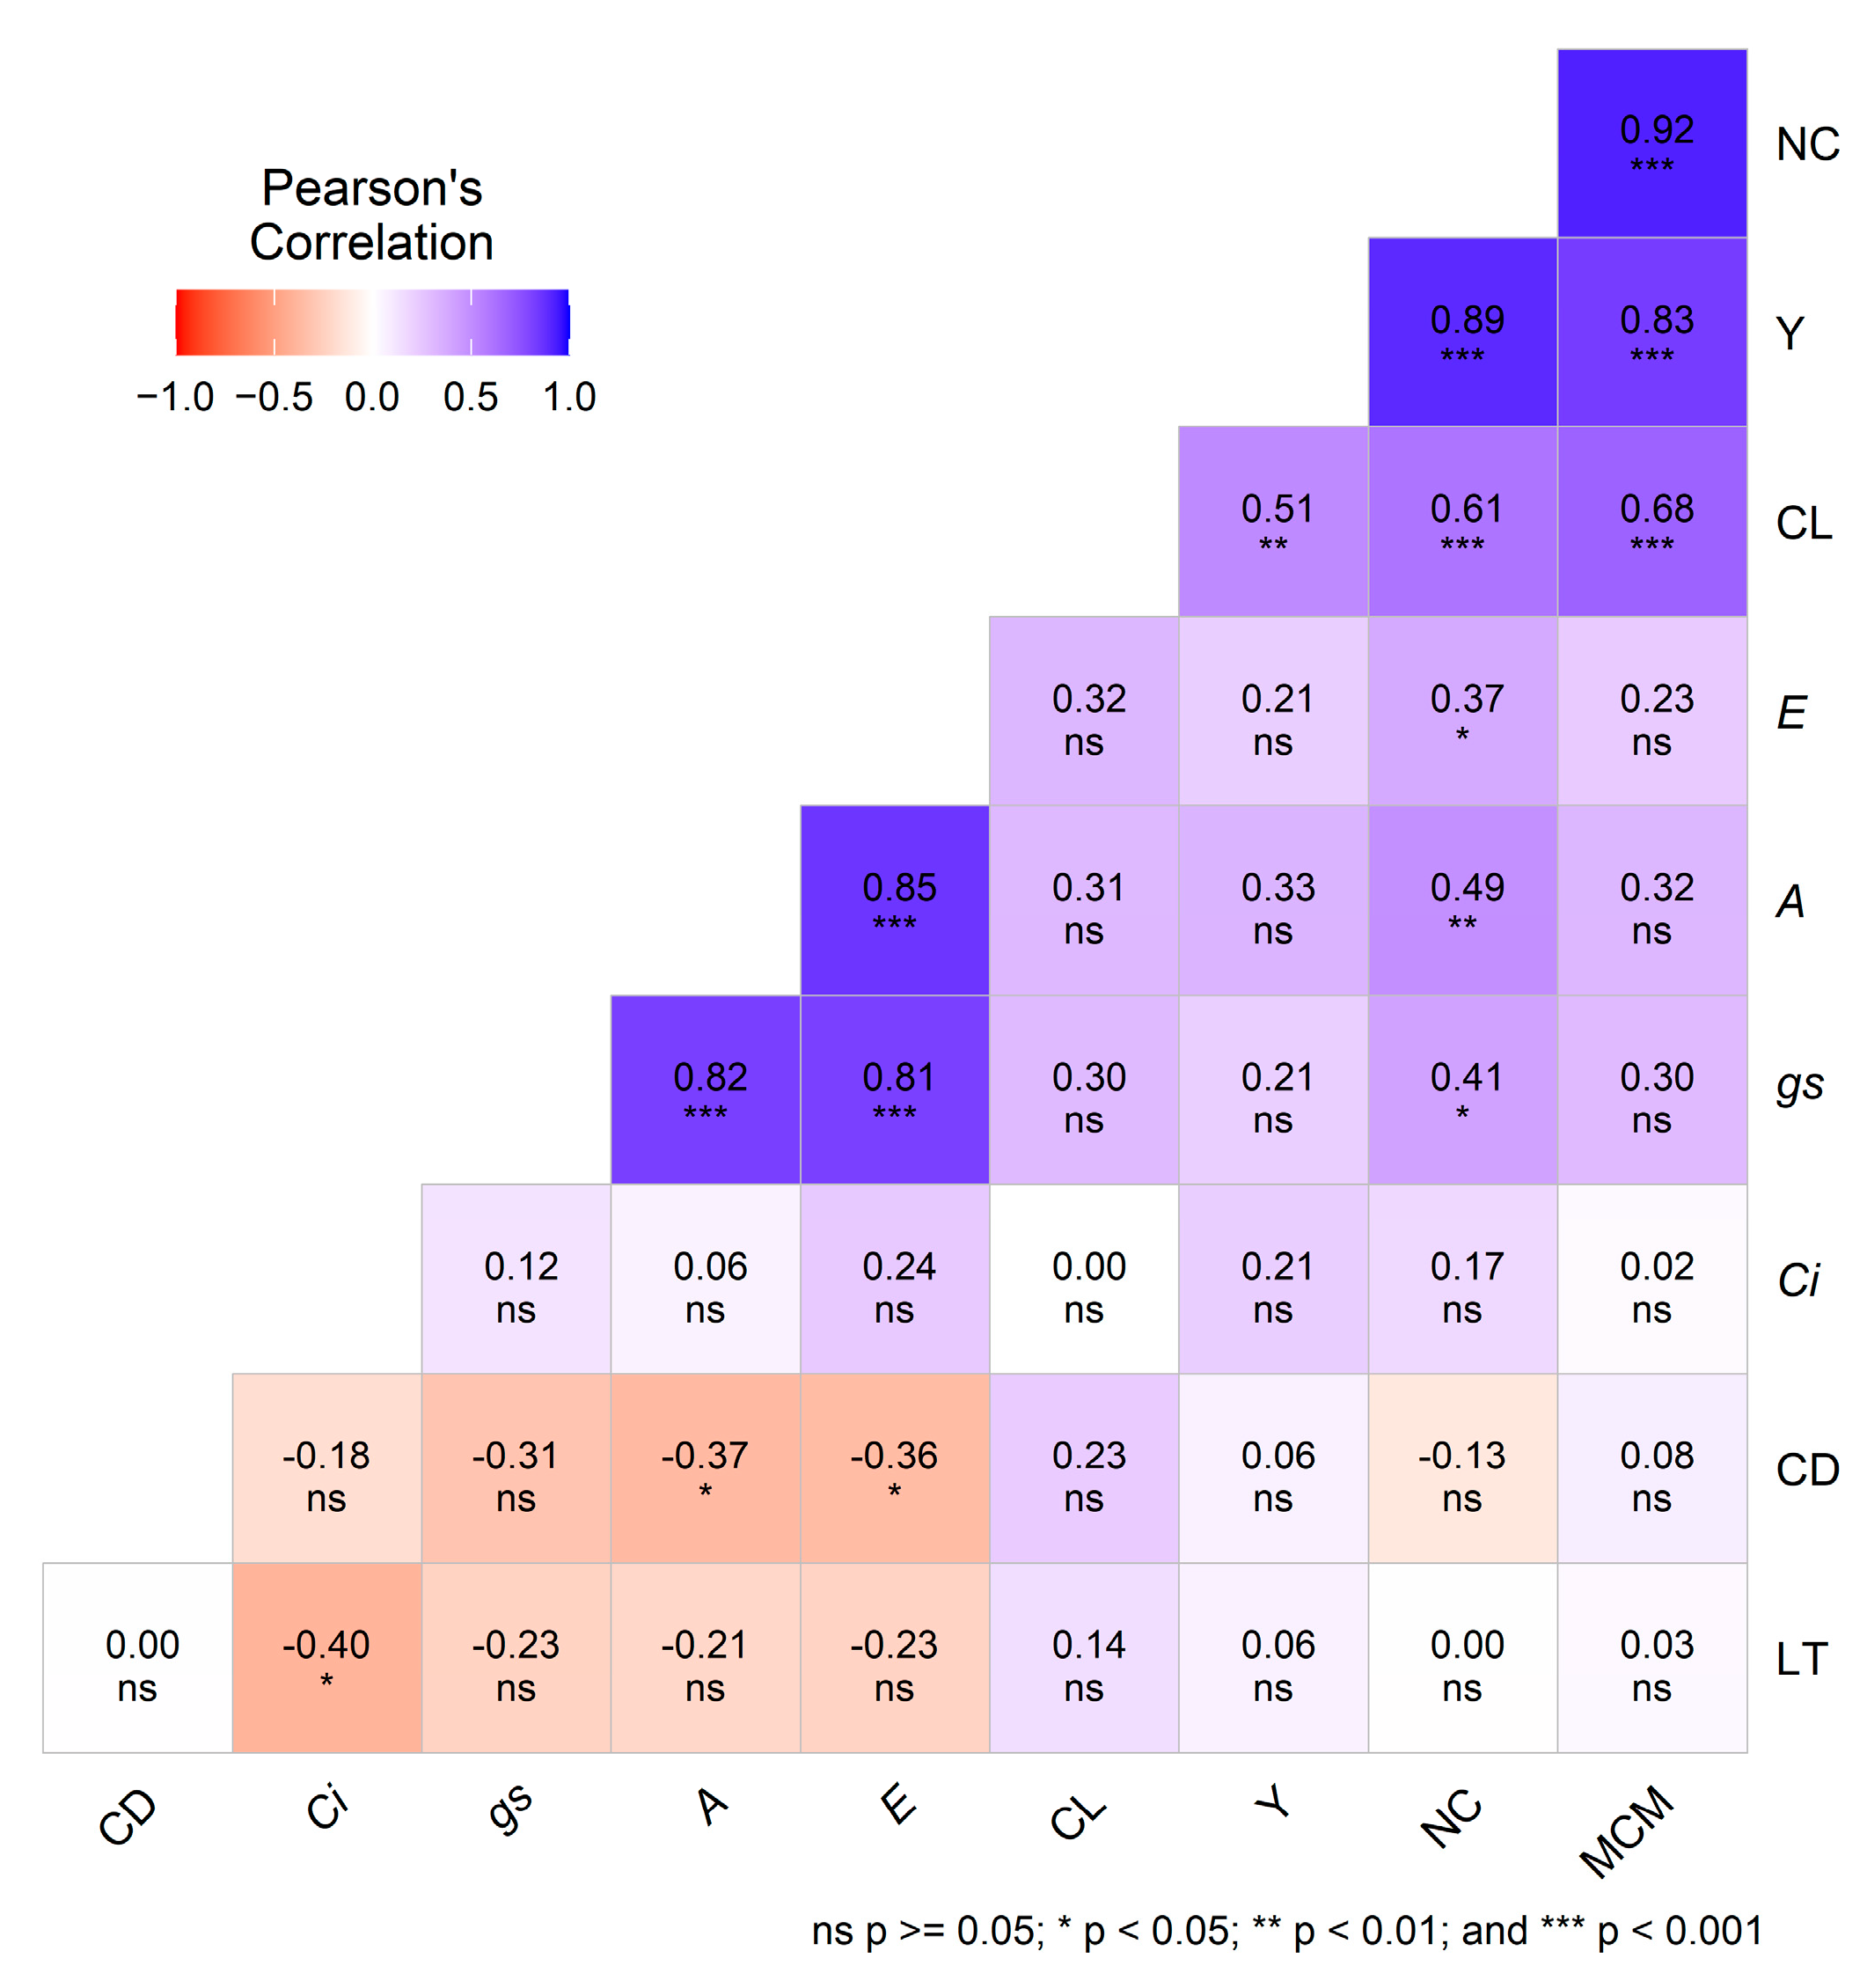
The correlation analysis revealed strong positive associations among yield variables. Mean capsule mass was strongly correlated with the number of capsules (r = 0.92 ***), consistent with the significant fertilization × salinity interaction detected for both traits by the two-way ANOVA (Table 6). Yield was positively correlated with both number of capsules (r = 0.89 ***) and mean capsule mass (r = 0.83 ***); although yield itself responded to fertilization and salinity as isolated main effects rather than through their interaction (Table 6), its strong association with these interaction-driven components indicates that yield formation is ultimately shaped by traits that are jointly regulated by fertilization strategy and salinity level.
Among physiological variables, CO2 assimilation was strongly and positively correlated with both stomatal conductance (r = 0.82 ***) and transpiration (r = 0.85 ***), while stomatal conductance and transpiration were also strongly correlated with each other (r = 0.81 ***), reflecting the tight physiological coupling that governs gas exchange under stomatal control: as stomata open or close in response to salinity and fertilization treatments, CO2 diffusion into the leaf and water vapor loss respond proportionally, since both processes share the same diffusive pathway through the stomatal pore.
This physiological coordination extended to yield formation: the number of capsules was positively correlated with stomatal conductance (r = 0.41 *), CO2 assimilation (r = 0.49 **), and transpiration (r = 0.37 *), indicating that treatments capable of sustaining gas exchange under saline conditions also translated into more favorable yield outcomes (Figure 7).
Figure 7.
Pearson correlation analysis for the variables analyzed. A—CO2 assimilation rate; gs—stomatal conductance; E—transpiration; Ci—intercellular CO2 concentration; LT—Leaf temperature; NC—Number of capsules; MCM—Mean capsule mass; CD—Capsule diameter; CL—Capsule length; Y—Yield. ns—p ≥ 0.05; *, **, and ***—significant at p < 0.05, p < 0.01, and p < 0.001, respectively.
4. Discussion
Salinity negatively affected gas exchange and productivity in sesame (Sesamum indicum L.), although the magnitude of these effects depended on the fertilization strategy, as evidenced by the significant interaction between salinity and fertilization for physiological variables. The reduction in CO2 assimilation under saline conditions, particularly under mineral fertilization (F4), indicates impaired photosynthetic performance, mainly associated with stomatal limitation—an adaptive response that minimizes water loss but consequently restricts CO2 diffusion into the substomatal cavity [25]. Similar responses have been widely reported in sesame and other crops, confirming the sensitivity of photosynthetic processes to osmotic stress [26,27].
In contrast, the maintenance of CO2 assimilation and stomatal conductance under biofertilizer treatments (F1 and F2) suggests a mitigating effect of organic inputs on salt-induced physiological constraints. This response is likely associated with improvements in soil physicochemical properties, enhanced nutrient availability, and activation of plant defense mechanisms [28,29]. Additionally, the presence of humic substances may promote root development and water uptake efficiency, supporting physiological activity under stress conditions [30]. This pattern is consistent with findings in sesame under non-saline conditions, where the slower nutrient release of an organomineral biofertilizer favored net CO2 assimilation during the flowering stage compared to mineral fertilization, despite not surpassing it in yield components, reinforcing that the physiological benefits of organic sources may be more closely tied to the timing and gradual availability of nutrients than to nutrient content alone [31].
The higher stomatal conductance observed under salinity in F1 and F2 indicates a distinct physiological adjustment compared to mineral fertilization, suggesting improved stomatal functionality and sustained gas exchange capacity. Similar responses have been reported in peanut under saline irrigation with organic fertilization [10,13], reinforcing the role of organic inputs in enhancing tolerance to abiotic stress. Likewise, smaller reductions in stomatal conductance have been observed in sesame genotypes under salt stress, indicating a potential tolerance mechanism to brackish water use [8].
The divergent physiological responses among biofertilizers can be more directly linked to their contrasting nutrient supply profiles (Table 3) than to organic amendment per se. F2 delivered potassium far in excess of crop demand (191% of the estimated requirement), F1 supplied potassium moderately above demand (115%), whereas F3 supplied only 36% of the potassium demand—despite supplying nitrogen at the exact crop requirement (100%) and phosphorus in the largest excess among all treatments (154%). Given the central role of K+ in stomatal guard cell osmoregulation and in competing with Na+ for root uptake sites [32], this graded potassium availability—highest in F2, moderate in F1, and markedly restricted in F3—is the most plausible driver of the differential stomatal conductance sustained under salinity (Figure 3B). Notably, the fact that F3 received adequate-to-excess nitrogen and phosphorus yet still showed the weakest stomatal response reinforces potassium, rather than overall nutrient sufficiency, as the key limiting factor. Sodium content of the biofertilizers was not determined in this study; therefore, biofertilizer-derived sodium cannot be entirely ruled out as a contributing factor to these differential responses, alongside the potassium-driven mechanism proposed above.
These results reinforce a broader principle of organic fertilization: the benefits attributed to biofertilizers are not a uniform or guaranteed outcome of using organic inputs but depend heavily on the specific raw material, nutrient profile, and mode of action of each source. This heterogeneity has also been documented outside the context of salinity. In an evaluation involving multiple crops and the use of insect waste as organic fertilizer, the magnitude and consistency of the response varied considerably across crops, application rates, and soil fertility conditions, with no simple dose-dependency pattern observed; this highlights that organic fertilizer performance is highly source- and context-specific, and not intrinsically superior or inferior to mineral fertilization [33]. In this regard, the present findings indicate that the choice of biofertilizer raw material—rather than the generic use of organic fertilization—is the decisive factor in determining whether physiological and productivity benefits will be achieved under saline conditions.
These findings align with international evidence on biofertilizer-mediated salt tolerance across oilseed crops. In sesame itself, biofertilization with the phosphate-solubilizing bacterium Rhodopseudomonas spp. improved nitrogen and phosphorus uptake, growth, and yield under salt-affected soil conditions, supporting the broader role of microbial biofertilizers in sustaining nutrient acquisition under salinity [34]. In peanut, halotolerant plant growth-promoting rhizobacteria enhanced nitrogen content and maintained ionic homeostasis under saline conditions, reducing reactive oxygen species accumulation [35]. In sunflower, the co-application of Bacillus subtilis and biogas slurry improved the potassium-to-sodium ratio and physiological performance under salinity [36], a mechanism consistent with the potassium-driven stomatal responses observed for F1 and, more markedly, F2 in the present study. However, contrasting results have also been reported: microbial inoculation effects on salinity tolerance vary considerably with feedstock composition, plant species, and salinity intensity, which may explain why F3 (shrimp-derived biofertilizer, rich in phosphorus but markedly low in potassium relative to the other sources) did not replicate the stomatal protection observed in F1 and F2.
Regarding transpiration, the stability observed in F1 and F3 further supports the buffering effect of organic fertilization on plant water relations, whereas the reduction observed under mineral fertilization (F4) indicates greater sensitivity to osmotic stress, limiting water flux and gas exchange, in agreement with previous findings [37,38]. This physiological stability may also be related to gradual nutrient release and improved osmotic adjustment capacity under organic inputs [30].
Salinity significantly reduced both the number and mass of capsules, confirming its strong impact on the reproductive development of sesame. The number of capsules was the most affected variable, indicating high sensitivity of the reproductive phase to saline stress, as previously reported [39,40]. This effect may be associated with the reduction in soil water potential caused by salt accumulation, which increases the energetic cost required to maintain metabolic activities, ultimately leading to the formation of smaller reproductive structures [41]. Additionally, these reductions are linked to impaired flower formation and increased reproductive abortion under stress conditions.
A similar reduction in the number of capsules under increased salinity was reported in sesame cultivation [39]. Furthermore, similar effects were also observed in peanut plants under saline stress, in which a reduction in capsule length was reported [42]. Although biofertilizers showed comparable performance to mineral fertilization at low salinity—particularly F1 and F3—which reinforces their potential as substitutes under favorable conditions, the lower efficiency of F3 at high salinity highlights the importance of selecting appropriate organic sources, since differences in composition directly influence plant responses [43]. The similarity between biofertilizers is possibly associated with the presence of microorganisms in their composition, which can increase the availability of nutrients through biological processes such as nutrient solubilization and the production of metabolites that promote plant growth and fruit development [44,45].
Strong positive correlations among yield components reinforce their interdependence, with the number of capsules emerging as a key determinant of capsule mass and overall productivity [46]. Similar relationships have been reported in sesame, including strong correlations between yield and number of capsules (0.90 ***) and between capsule traits and seed formation [47]. Salinity also negatively affected capsule mass, reflecting limitations in assimilate allocation and reproductive sink strength [48]. Reductions in yield components under saline conditions have been widely documented not only in sesame [39,40] but also in other oilseed crops such as peanut [5], sunflower [49], and cotton [50], indicating a generalized sensitivity of reproductive processes to salt stress. The reduction in capsule diameter under salinity, particularly in F2, further reflects impaired water and nutrient uptake due to osmotic constraints [48]. Although plants may attempt to reallocate assimilates to reproductive structures under stress, this compensatory mechanism becomes insufficient under higher salinity levels [51].
The positive correlations between physiological variables (gs, A, and E) and the number of capsules indicate that the maintenance of gas exchange under saline conditions is closely linked to reproductive performance. Higher photosynthetic rates likely enhance assimilate supply to reproductive organs, supporting capsule formation and development [52]. These relationships are also governed by source–sink dynamics, in which salinity-induced limitations in assimilate transport can impair reproductive development [53]. Stomatal regulation plays a central role in this process, as stomatal opening directly controls both CO2 assimilation and transpiration [54]. While positive correlations between stomatal conductance and CO2 assimilation have been reported in Cucumis anguria [55], contrasting negative correlations among gas exchange variables have also been observed in sesame under stress conditions [56], indicating that environmental factors can alter the coordination of physiological processes.
The strong positive correlations between gas exchange variables and the number of capsules (Section 3.3) indicate that salinity constrains reproductive development largely through its impact on source activity. Under salt stress, stomatal closure limits CO2 diffusion and reduces net photosynthesis, decreasing the pool of photoassimilates available for translocation to reproductive sinks; concurrently, salinity can impair phloem loading and long-distance sucrose transport, further restricting assimilate delivery to developing capsules [53]. This source limitation is compounded by increased maintenance respiration costs under osmotic and ionic stress, which divert carbon away from reproductive structures [41]. Biofertilizers such as F1 and F2, by sustaining stomatal conductance and CO2 assimilation under salinity, likely preserved a larger photoassimilate pool and more stable source-to-sink flux, consistent with their comparatively higher capsule numbers and mean capsule mass under high salinity. In contrast, the limited source activity under F4 (mineral fertilization) and F3 under high salinity likely constrained sink filling capacity, reinforcing that biofertilizer-driven physiological maintenance operates primarily by preserving source strength rather than by directly enhancing sink development. Interestingly, this decoupling between physiological performance and yield has not always been observed: in sesame grown without saline stress, an intermediate biofertilizer dose achieved the highest CO2 assimilation rate without a corresponding improvement in yield components [31], contrasting with the direct translation of physiological maintenance into yield benefits observed for F1 and F2 in the present study. This discrepancy may indicate that source–sink coupling becomes more physiologically decisive specifically under stress conditions, when assimilate supply is a limiting factor for reproductive development, rather than under favorable growing conditions where sink capacity itself may be the primary constraint.
Overall, these findings demonstrate that biofertilizers represent a promising strategy to improve sesame performance under both non-saline and saline conditions, contributing to more resilient agricultural systems in semi-arid regions. The use of organic residues—including food waste, shrimp processing waste, and sanitation-derived inputs—reinforces the role of nutrient recycling in sustainable agriculture [32,51,57]. In particular, the biofertilizer derived from CAGECE HomeBiogas highlights the potential integration of sanitation systems into circular production models, reducing dependence on mineral fertilizers while enhancing crop resilience under abiotic stress conditions.
5. Conclusions
A salinity level of 3.0 dS m−1 impaired gas exchange and sesame productivity, confirming the sensitivity of physiological and reproductive processes to salt stress. However, the magnitude of these effects depended on the fertilization strategy; the efficacy of each biofertilizer was linked primarily to its nutrient supply, particularly potassium availability. Fertilization treatments F1 and F2, which supplied potassium at levels meeting or exceeding crop demand, demonstrated a greater capacity to maintain CO2 assimilation and stomatal conductance under saline conditions; conversely, treatment F3—characterized by limited potassium supply despite adequate phosphorus levels—showed a more restricted physiological response.
Under low-salinity conditions, biofertilizers derived from CAGECE waste (F1) and shrimp waste (F3) yielded productivity comparable to mineral fertilization (F4), highlighting their potential as sustainable fertilization alternatives. However, under higher salinity, treatment F3 resulted in significant reductions in capsule number and mass, indicating lower efficiency in mitigating salt stress under more severe conditions.
Overall, these results demonstrate that biofertilizer efficacy under saline irrigation depends on the raw material used—meaning success is not guaranteed simply by organic fertilization—and that the proper selection of biofertilizer sources can enhance sesame performance, contributing to more sustainable production systems in semi-arid regions.
Author Contributions
Conceptualization, L.S.d.N. and G.G.d.S.; Methodology, L.S.d.N., G.G.d.S., J.F.R., A.O.d.S. and F.D.B.d.S.; Software, L.S.d.N.; Validation, L.S.d.N., G.G.d.S., J.F.R. and F.D.B.d.S.; Formal analysis, L.S.d.N.; Investigation, L.S.d.N., J.F.R., R.S.C. and F.D.B.d.S.; Resources, G.G.d.S., R.S.d.C. and M.A.B.; Data curation, L.S.d.N.; Writing—original draft preparation, L.S.d.N.; Writing—review and editing, G.G.d.S., J.F.R., T.J.D., F.F.P. and F.D.B.d.S.; Visualization, L.S.d.N.; Supervision, G.G.d.S., A.O.d.S., M.A.B. and F.F.P.; Project administration, G.G.d.S.; Funding acquisition, G.G.d.S. All authors have read and agreed to the published version of the manuscript.
Funding
This research was financially supported by the National Council for Scientific and Technological Development (CNPq)—Process n° [131235/2024-9] Brazil.
Data Availability Statement
The raw data supporting the conclusions of this article will be made available by the authors upon reasonable request. The data are not publicly available due to confidentiality considerations associated with a biofertilizer supplied by a startup company, as the product is currently under development and testing. Furthermore, data sharing upon request helps ensure appropriate interpretation and use of the dataset.
Acknowledgments
The authors acknowledge the National Council for Scientific and Technological Development (CNPq), Brazil; the Graduate Program in Agricultural Engineering (PPGEA) of the Federal University of Ceará (UFC); the National Institute of Science and Technology for Sustainable Agriculture in the Tropical Semi-Arid Region (INCTAgris); BioTech4Life Soluções Biotecnológicas; and the Water and Sewage Company of the State of Ceará (CAGECE).
Conflicts of Interest
The authors declare no conflicts of interest.
References
- FAOSTAT—Food and Agriculture Organization of the United Nations. Production Quantities of Dry Sesame by Country; FAO: Rome, Italy, 2026. [Google Scholar]
- Martins, L.A.; Maia, J.C.D.S.; Basílio, J.P.; Camili, E.C.; Melo, S.P.D. Growth and Seed Yield of K3 Sesame Crops in a Typic Hapludox with Potassium Fertilization. Rev. Caatinga 2024, 37, e12504. [Google Scholar] [CrossRef] [Scilit]
- CONAB—Companhia Nacional de Abastecimento. Acompanhamento Da Safra Brasileira de Grãos, Safra 2025/26, Primeiro Levantamento; CONAB: Brasília, Brazil, 2025. [Google Scholar]
- Lessa, C.I.N.; De Lacerda, C.F.; Cajazeiras, C.C.D.A.; Neves, A.L.R.; Lopes, F.B.; Silva, A.O.D.; Sousa, H.C.; Gheyi, H.R.; Nogueira, R.D.S.; Lima, S.C.R.V.; et al. Potential of Brackish Groundwater for Different Biosaline Agriculture Systems in the Brazilian Semi-Arid Region. Agriculture 2023, 13, 550. [Google Scholar] [CrossRef] [Scilit]
- Oliveira, G.D.S.; Sousa, G.G.D.; Viana, T.V.D.A.; Santos, S.D.O.; Nascimento, L.S.; Sousa, H.C.; Silva, A.G.D.; Simplicio, A.A.F.; Silva Junior, F.B.D.; Silva, A.O.D. Leaf Gas Exchange and Production of Peanut under Brackish Water Irrigation Strategies. Rev. Bras. Eng. Agríc. Ambient. 2025, 29, e293091. [Google Scholar] [CrossRef] [Scilit]
- Sousa, H.C.; Viana, T.V.D.A.; Sousa, G.G.D.; Azevedo, B.M.D.; Lessa, C.I.N.; Freire, M.H.D.C.; Goes, G.F.; Baldé, B. Productivity in the Peanut under Salt Stress in Soil with a Cover of Plant Mulch. Rev. Ciênc. Agronômica 2023, 54, 1–9. [Google Scholar] [CrossRef] [Scilit]
- Sousa, G.G.; Fiusa, J.N.; Leite, K.N.; Soares, S.C.; Silva, G.L.D. Água Salina e Biofertilizante de Esterco Bovino Na Cultura Do Gergelim. Agropecuária Téc. 2017, 38, 117–124. [Google Scholar] [CrossRef] [Scilit]
- Silva, A.A.R.D.; Lacerda, C.N.D.; Lima, G.S.D.; Soares, L.A.D.A.; Gheyi, H.R.; Fernandes, P.D. Morfofisiologia de genótipos de gergelim submetidos a diferentes estratégias de uso de água salina. IRRIGA 2021, 1, 42–55. [Google Scholar] [CrossRef] [Scilit]
- Abreu, F.D.S.; Viana, T.V.D.A.; Sousa, G.G.D.; Baldé, B.; Lacerda, C.F.D.; Goes, G.F.; Gomes, K.R.; Cambissa, P.B.C. Salt Stress and Potassium Fertilization on the Agronomic Performance of Peanut Crop. Rev. Caatinga 2024, 37, e11996. [Google Scholar] [CrossRef] [Scilit]
- Oliveira, G.D.S.; Viana, T.V.D.A.; Sousa, G.G.D.; Santos, S.D.O.; Costa, F.H.R.; Silva, A.G.D.; Pereira, A.P.D.A.; Lopes, F.B.; Goes, G.F.; Leite, K.N. Phosphate Fertilization, Biofertilizer and Bacillus sp. in Peanut Cultivation under Salt Stress. Rev. Bras. Eng. Agríc. Ambient. 2024, 28, e279003. [Google Scholar] [CrossRef] [Scilit]
- Mamouni, F.Z.; Ousmana, H.; El Hmaidi, A.; Razouk, R.; Kajji, A.; Daoui, K.; El Ouali, A.; Boukhlifi, F.; Makan, A. Evaluating the Impact of Biofertilizers vs. Chemical Fertilizers on Wheat Growth and Soil Fertility Using Self-Organizing Maps. J. Soil Sci. Plant Nutr. 2025, 25, 2872–2884. [Google Scholar] [CrossRef] [Scilit]
- Freire, M.H.D.C.; Viana, T.V.D.A.; Sousa, G.G.D.; Azevedo, B.M.D.; Sousa, H.C.; Goes, G.F.; Lessa, C.I.N.; Silva, F.D.B.D. Organic Fertilization and Salt Stress on the Agronomic Performance of Maize Crop. Rev. Bras. Eng. Agríc. Ambient. 2022, 26, 848–854. [Google Scholar] [CrossRef] [Scilit]
- Sousa, J.T.M.D.; Sousa, G.G.D.; Silva, E.B.D.; Silva Junior, F.B.D.; Viana, T.V.D.A. Physiological responses of peanut crops to irrigation with brackish waters and application of organo-mineral fertilizers. Rev. Caatinga 2021, 34, 682–691. [Google Scholar] [CrossRef] [Scilit]
- Lee, M.E.; Steiman, M.W.; St. Angelo, S.K. Biogas Digestate as a Renewable Fertilizer: Effects of Digestate Application on Crop Growth and Nutrient Composition. Renew. Agric. Food Syst. 2021, 36, 173–181. [Google Scholar] [CrossRef] [Scilit]
- Alenazi, M.M.; El-Ebidy, A.M.; El-shehaby, O.A.; Seleiman, M.F.; Aldhuwaib, K.J.; Abdel-Aziz, H.M.M. Chitosan and Chitosan Nanoparticles Differentially Alleviate Salinity Stress in Phaseolus vulgaris L. Plants. Plants 2024, 13, 398. [Google Scholar] [CrossRef] [Scilit]
- Sridhar, D.; Alheswairini, S.S.; Barasarathi, J.; Enshasy, H.A.E.; Lalitha, S.; Mir, S.H.; Nithyapriya, S.; Sayyed, R. Halophilic Rhizobacteria Promote Growth, Physiology and Salinity Tolerance in Sesamum indicum L. Grown under Salt Stress. Front. Microbiol. 2025, 16, 1590854. [Google Scholar] [CrossRef] [Scilit]
- Tadesse, M. Abiotic Stress in Sesame (Sesamum indicum L.): Impact and Molecular Strategies for Tolerance Enhancement. Plant Mol. Biol. Report. 2026, 44, 18. [Google Scholar] [CrossRef] [Scilit]
- Teixeira, P.C.; Donagemma, G.K.; Fontana, A.; Teixeira, W.G. Manual de Métodos de Análise de Solos, 3rd ed.; Embrapa: Brasília, Brazil, 2017. [Google Scholar]
- Beltrão, N.M.; Vieira, D.J. O Agronegócio Do Gergelim No Brasil; Embrapa: Brasília, Brazil, 2001. [Google Scholar]
- Rhoades, J.D.; Kandiah, A.; Mashali, A.M. Uso de Águas Salinas Para Produção Agrícola; UFPB: Campina Grande, Brazil, 2000. [Google Scholar]
- Ayers, R.S.; Westcot, D.W. A Qualidade Da Água Na Agricultura, 2nd ed.; UFPB: Campina Grande, Brazil, 1999. [Google Scholar]
- Bernardo, S.; Soares, A.A.; Mantovani, E.C. Manual de Irrigação, 9th ed.; UFV: Viçosa, Brazil, 2019. [Google Scholar]
- Olivoto, T.; Lúcio, A.D. Metan: An R Package for Multi-environment Trial Analysis. Methods Ecol. Evol. 2020, 11, 783–789. [Google Scholar] [CrossRef] [Scilit]
- R Core Team. R: A Language and Environment for Statistical Computing; R Core Team: Vienna, Austria, 2024. [Google Scholar]
- Sabino, F.D.C.; De Souza, L.S.B.; De Souza, M.A.G.; De Barros, J.P.A.; De Lucena, L.R.R.; Jardim, A.M.D.R.F.; Rocha, A.K.P.; Da Silva, T.G.F. Morphological Characteristics, Biomass Accumulation and Gas Exchange of an Important Species Native for Restoration in Semi-Arid Brazilian Areas Affected by Salt and Water Stress. Plant Stress 2021, 2, 100021. [Google Scholar] [CrossRef] [Scilit]
- Dias, A.S.; Lima, G.S.D.; Silva, S.S.D.; Soares, L.A.D.A.; Chaves, L.H.G.; Gheyi, H.R.; Lacerda, C.N.D.; Fernandes, P.D. Gas Exchange, Photosynthetic Pigments, and Photochemical Efficiency of Sesame under Salt Stress and Phosphate Fertilization. Semin. Ciênc. Agrár. 2022, 43, 1237–1256. [Google Scholar] [CrossRef] [Scilit]
- Mendonça, A.J.T.; Lima, G.S.D.; Soares, L.A.D.A.; Sá, V.K.N.O.D.; Silva, S.S.D.; Torres, R.A.F.; Ferreira, J.T.A.; Gheyi, H.R. Gas Exchange, Photochemical Efficiency and Growth of Hydroponic Okra under Salt Stress and Salicylic Acid. Rev. Caatinga 2024, 37, e12143. [Google Scholar] [CrossRef] [Scilit]
- Hamoud, Y.A.; Saleem, T.; Zia-ur-Rehman, M.; Shaghaleh, H.; Usman, M.; Rizwan, M.; Alharby, H.F.; Alamri, A.M.; Al-Sarraj, F.; Alabdallah, N.M. Synergistic Effect of Biochar with Gypsum, Lime, and Farm Manure on the Growth and Tolerance in Rice Plants under Different Salt-Affected Soils. Chemosphere 2024, 360, 142357. [Google Scholar] [CrossRef] [Scilit]
- Wang, X.; Duan, Z.; Yin, X.; Hu, Z.; Chen, J.; Li, H.; Li, R.; Li, Z.; Sun, W.; Zhang, H.; et al. Function and Mechanism of Monosodium Glutamate Residue on Improving the Humification of Chicken Manure and Spent Mushroom Substrates Co-Composting. J. Environ. Chem. Eng. 2025, 13, 118959. [Google Scholar] [CrossRef] [Scilit]
- Hareem, M.; Danish, S.; Obaid, S.A.; Ansari, M.J.; Datta, R. Mitigation of Drought Stress in Chili Plants (Capsicum annuum L.) Using Mango Fruit Waste Biochar, Fulvic Acid and Cobalt. Sci. Rep. 2024, 14, 14270. [Google Scholar] [CrossRef] [Scilit]
- Aguilera, J.G.; Silva, M.B.A.; Andrade, B.P.D.; Muguerrima, A.V.M.; Steiner, F.; Neves, E.P.; Zuffo, A.M.; Zanatta, T.S.D.C.; Aranibar, C.G.M.; Soto, C.A.M.; et al. Biofertilization with AFERT as an Alternative to Mineral Fertilization in Sesame (Sesamum indicum L.) Cultivation. Crops 2026, 6, 41. [Google Scholar] [CrossRef] [Scilit]
- Fatima, B.; Zahrae, M.F.; Razouk, R. Chitin/Chitosan’s Bio-Fertilizer: Usage in Vegetative Growth of Wheat and Potato Crops. In Chitin-Chitosan—Myriad Functionalities in Science and Technology; Dongre, R.S., Ed.; InTech: London, UK, 2018. [Google Scholar] [CrossRef] [Scilit]
- Platis, I.-K.; Katsogianni, I.; Natsiopoulos, D.; Mantzoukas, S.; Eliopoulos, P.A. Tenebrio molitor Frass as a Biofertilizer: Effects of Application Rate and Frequency on Growth and Yield of Greenhouse-Grown Vegetables. Crops 2026, 6, 51. [Google Scholar] [CrossRef] [Scilit]
- Nguyen Quoc, K.; Le Vinh, T.; Le Thanh, Q.; Tran Ngoc, H.; Do Thi, X.; Huynh Huu, D.; Ly Ngoc Thanh, X.; Le Thi My, T. Effects of Biofertilizer Supplementation, Rhodopseudomonas spp., on Nitrogen and Phosphorus Uptakes, Growth, and Yield of Sesame (Sesamum indicum L.) on Salt-Affected Soil. J. Plant Nutr. 2024, 47, 1–17. [Google Scholar] [CrossRef] [Scilit]
- Sharma, S.; Kulkarni, J.; Jha, B. Halotolerant Rhizobacteria Promote Growth and Enhance Salinity Tolerance in Peanut. Front. Microbiol. 2016, 7, 1600. [Google Scholar] [CrossRef] [Scilit]
- Hamid, S.; Ahmad, I.; Akhtar, M.J.; Iqbal, M.N.; Shakir, M.; Tahir, M.; Rasool, A.; Sattar, A.; Khalid, M.; Ditta, A.; et al. Bacillus subtilis Y16 and Biogas Slurry Enhanced Potassium to Sodium Ratio and Physiology of Sunflower (Helianthus annuus L.) to Mitigate Salt Stress. Environ. Sci. Pollut. Res. 2021, 28, 38637–38647. [Google Scholar] [CrossRef] [Scilit]
- Lacerda, C.F.D.; Oliveira, E.V.D.; Neves, A.L.R.; Gheyi, H.R.; Bezerra, M.A.; Costa, C.A.G. Morphophysiological Responses and Mechanisms of Salt Tolerance in Four Ornamental Perennial Species under Tropical Climate. Rev. Bras. Eng. Agríc. Ambient. 2020, 24, 656–663. [Google Scholar] [CrossRef] [Scilit]
- Sales, J.R.D.S.; Magalhâes, C.L.; Freitas, A.G.S.; Goes, G.F.; Sousa, H.C.D.; Sousa, G.G.D. Physiological Indices of Okra under Organomineral Fertilization and Irrigated with Salt Water. Rev. Bras. Eng. Agríc. Ambient. 2021, 25, 466–471. [Google Scholar] [CrossRef] [Scilit]
- Dias, A.S.; Lima, G.S.D.; Gheyi, H.R.; Nobre, R.G.; Santos, J.B.D. Emergence, growth and production of sesame under salt stress and proportions of nitrate and ammonium. Rev. Caatinga 2017, 30, 458–467. [Google Scholar] [CrossRef] [Scilit]
- Gubert, A.C.; Castro, J.N.; Lima, V.M.M. Desenvolvimento Da Cultura Do Gergelim Em Diferentes Concentrações de NaCl. Rev. Eletrônica Interdiscip. 2024, 16, 706–716. [Google Scholar]
- Silva, S.S.D.; Lima, G.S.D.; Lima, V.L.A.D.; Gheyi, H.R.; Soares, L.A.D.A.; Lucena, R.C.M. Gas Exchanges and Production of Watermelon Plant under Salinity Management and Nitrogen Fertilization. Pesqui. Agropecuária Trop. 2019, 49, e54822. [Google Scholar] [CrossRef] [Scilit]
- Goes, G.F.; Sousa, G.G.D.; Santos, S.D.O.; Silva Júnior, F.B.D.; Ceita, E.D.R.D.; Leite, K.N. Produtividade da cultura do amendoim sob diferentes supressões da irrigação com água salina. IRRIGA 2021, 26, 210–220. [Google Scholar] [CrossRef] [Scilit]
- Jeyaraj, S.; Beevy, S.S. Insights into the Drought Stress Tolerance Mechanisms of Sesame: The Queen of Oilseeds. J. Plant Growth Regul. 2024, 43, 3370–3391. [Google Scholar] [CrossRef] [Scilit]
- Santos, S.D.O.; Sousa, G.G.D.; Viana, T.V.D.A.; Oliveira, G.D.S.; Goes, G.F.; Silva, A.O.D.; Silva, A.R.A.D.; Gomes, K.R.; Muengo, J.M.K.; Nogueira, R.D.S. Bacillus sp., Fertilization Forms, and Salt Stress on Soybean Production. Rev. Bras. Eng. Agríc. Ambient. 2024, 28, e279072. [Google Scholar] [CrossRef] [Scilit]
- Zainuddin, N.; Keni, M.F.; Ibrahim, S.A.S.; Masri, M.M.M. Effect of Integrated Biofertilizers with Chemical Fertilizers on the Oil Palm Growth and Soil Microbial Diversity. Biocatal. Agric. Biotechnol. 2022, 39, 102237. [Google Scholar] [CrossRef] [Scilit]
- Shaibu, A.S.; Abduljalil, U.; Yakubu, A.B. Stability Analysis of Sesame (Sesamum indicum L.) Genotypes in the Savannas of Nigeria Using Multi-Traits Stability Index. Ecol. Genet. Genom. 2025, 37, 100415. [Google Scholar] [CrossRef] [Scilit]
- Gedifew, S.; Demelash, H.; Abate, A.; Abebe, T.D. Association of Quantitative Traits and Genetic Diversity in Ethiopian Sesame (Sesamum indicum L.) Genotypes. Heliyon 2024, 10, e26676. [Google Scholar] [CrossRef] [Scilit]
- Lima, G.S.D.; Fernandes, C.G.J.; Soares, L.A.D.A.; Gheyi, H.R.; Fernandes, P.D. Gas exchange, chloroplast pigments and growth of passion fruit cultivated with saline water and potassium fertilization. Rev. Caatinga 2020, 33, 184–194. [Google Scholar] [CrossRef] [Scilit]
- Luna, N.R.D.S.; Bezerra, F.M.L.; Lopes, F.B.; Borges, F.R.M.; Sousa, G.G.D.; Noronha, V.S.D.; Lacerda, C.F.D. Use of Algae Extract as an Agent to Mitigate Salt Stress in Sunflower Crop. Rev. Bras. Eng. Agríc. Ambient. 2024, 28, e279088. [Google Scholar] [CrossRef] [Scilit]
- Fatima, R.T.; Soares, L.A.D.A.; Lima, G.S.D.; Ferreira, J.T.A.; Paiva, F.J.S.; Roque, I.A.; Gheyi, H.R. Morphophysiology and Production of Naturally Colored Cotton under Salt Stress and Foliar Application of Salicylic Acid. Ciênc. Rural 2025, 55, e20240164. [Google Scholar]
- Xiang, P.; Zheng, J.; Wang, Y.; Liu, J. Irrigation with a Brackish Water-Biogas Slurry Regulates Soil Salinity and Water Use Efficiency to Improve Tomato Quality. Irrig. Sci. 2026, 44, 14. [Google Scholar] [CrossRef] [Scilit]
- Smith, M.R.; Rao, I.M.; Merchant, A. Source-Sink Relationships in Crop Plants and Their Influence on Yield Development and Nutritional Quality. Front. Plant Sci. 2018, 9, 1889. [Google Scholar] [CrossRef] [Scilit]
- Badiel, B.; Nana, R.; Namena, L.; Konate, B.; Djinet, A.I.; Nguinambaye, M.M.; Tamini, Z. Temporary Water Stress Effect on Vegetative and Flowering Stages of Sesame (Sesamum indicum L.) Plants. Agric. Sci. Res. J. 2017, 7, 230–240. [Google Scholar]
- Martínez-Maldonado, F.E.; Castaño-Marín, A.M.; Duarte-Carvajalino, J.M.; Silva-Arero, E.A.; Goez-Vinasco, G.A.; Molina Varón, J.A. Physiological Features of Potato (Solanum tuberosum L. Var. Diacol Capiro) Canopy Reflectance Changes under Different Levels of Water Stress. Potato Res. 2026, 69, 46. [Google Scholar] [CrossRef] [Scilit]
- Ribeiro, J.E.D.S.; Oliveira, P.H.D.A.; Coêlho, E.D.S.; Silva, E.F.D.; Silva, A.G.C.D.; Fernandes, A.D.N.; Ferreira, F.N.; Lima, J.V.L.; Silveira, L.M.D.; Júnior, A.P.B. Morphophysiological and Nutritional Responses of West Indian Gherkin Cultivars Under Salt Stress and Exogenous Carnitine Application. Agronomy 2026, 16, 606. [Google Scholar] [CrossRef] [Scilit]
- Lahmaoui, S.; Hidri, R.; Msaad, H.; Farssi, O.; Lamsaadi, N.; El Moukhtari, A.; Zorrig, W.; Farissi, M. Biostimulatory Effects of Foliar Application of Silicon and Sargassum Muticum Extracts on Sesame Under Drought Stress Conditions. Plants 2025, 14, 2358. [Google Scholar] [CrossRef] [Scilit]
- Ding, B.; Cao, H.; Bai, Y.; Guo, S.; Zhang, J.; He, Z.; Wang, B.; Jia, Z.; Liu, H. Effect of Biofertilizer Addition on Soil Physicochemical Properties, Biological Properties, and Cotton Yield under Water Irrigation with Different Salinity Levels in Xinjiang, China. Field Crops Res. 2024, 308, 109300. [Google Scholar] [CrossRef] [Scilit]

Disclaimer/Publisher’s Note: The statements, opinions and data contained in all publications are solely those of the individual author(s) and contributor(s) and not of MDPI and/or the editor(s). MDPI and/or the editor(s) disclaim responsibility for any injury to people or property resulting from any ideas, methods, instructions or products referred to in the content. |
© 2026 by the authors. Licensee MDPI, Basel, Switzerland. This article is an open access article distributed under the terms and conditions of the Creative Commons Attribution (CC BY) license.