


Abstract
Improving grain quality alongside yield remains a primary objective in rice breeding, especially under irrigated systems in Thailand, where consumer demand for soft-textured, premium table rice continues to grow. This study evaluated physicochemical and pasting characteristics of ten advanced non-glutinous rice genotypes compared with high- and low-amylose checks across three irrigated environments during off-season 2024. Combined ANOVA revealed highly significant genotype, environment, and genotype × environment interaction effects, with genotypes contributing up to 94.30% of total variation for key quality traits. Grain breadth and elongation rate were predominantly influenced by environmental conditions. Principal component analysis showed that PC1 and PC2 explained 72.86% of total variance, separating genotypes based on amylose-driven starch properties and paste stability. High-amylose genotypes exhibited low peak viscosity and high setback, whereas low-amylose genotypes showed greater swelling, higher breakdown, and softer pasting behavior. Selected genotypes exhibited distinct quality profiles; specifically, DS24-Inter-8 and DS24-Inter-10 combined low-to-intermediate amylose (15.09–19.73%) with high gel consistency (84.78–96.22 mm). Interestingly, DS24-Inter-4 maintained high gel consistency (97.78 mm) despite a higher amylose content (26.39%), indicating a unique soft-cooking profile for high-amylose types. In contrast, DS24-Inter-7 and DS24-Inter-9 showed typical firmer, high-amylose characteristics. These contrasting quality profiles indicate that the genotypes were suitable for different utilization purposes depending on the desired physicochemical and textural attributes. Therefore, the advanced genotypes demonstrated stable and diverse quality profiles under irrigated conditions, warranting further multi-location and multi-season evaluation.
1. Introduction
Rice (Oryza sativa L.) is a foundational global staple, supplying over 20% of caloric intake and sustaining rural livelihoods across Asia [1,2]. As production systems intensify and markets shift toward differentiated quality standards, grain quality has become a decisive factor shaping market value, particularly within premium non-glutinous or non-waxy rice markets of Southeast Asia [3]. Grain quality encompasses multiple dimensions, such as eating and cooking quality (ECQ), nutritional value, appearance traits, milling performance, and hygiene quality, with ECQ being the most influential attribute governing consumer acceptance [4,5,6].
The ECQ of rice is governed mainly by starch molecular composition and its functional behavior during gelatinization and cooling. Key physicochemical traits, including apparent amylose content (AAC), gel consistency (GC), gelatinization temperature (GT), and pasting properties, capture the structural organization of amylose and amylopectin and directly predict ECQ attributes such as cooked-rice hardness/softness, stickiness, cooking time, and retrogradation tendency [7,8]. At the molecular level, these quality-related traits are regulated by a coordinated network of Starch Synthesis-Related Genes (SSRGs), including AGPase, SS, GBSSI, SBE, and DBE [9]. The Waxy (Wx) locus is the principal determinant of AAC and GC [10,11], whereas GT is governed largely by ALK/SSIIa, which modulates amylopectin chain-length distribution and crystalline structure [12,13]. Additional SSRGs, such as SBEI/BEIIb and ISA1, contribute to amylopectin branching patterns, affecting swelling power, viscosity breakdown, and retrogradation behavior [14,15].
Instrumental profiling, particularly Rapid Visco Analyzer (RVA) analysis, provides standardized functional indicators of starch behavior during heating and cooling, including swelling capacity, paste stability under shear, and retrogradation tendency [16,17,18,19]. These RVA-derived parameters complement AAC, GC, and GT by translating starch structural differences into measurable rheological patterns that are directly relevant to ECQ. Across South and Southeast Asia, consistent associations among AAC, RVA parameters, and consumer sensory preference have been reported, supporting RVA as a practical tool for discriminating cooking-quality groups in rice germplasm [5,17,20,21]. Nonetheless, prior studies have focused primarily on landraces or traditional cultivars, resulting in limited understanding of quality expression in advanced non-glutinous breeding lines developed for irrigated production systems. Achieving stable ECQ across environments remains a major breeding challenge because the determinants of rice texture are largely established during grain filling, when endosperm starch is synthesized and deposited. Thermal and edaphic variation during this stage (e.g., temperature, radiation, irrigation regime, and nutrient availability) can modify amylose accumulation, amylopectin chain organization, and starch crystallinity, thereby shifting AAC, GT, and RVA pasting profiles and ultimately altering sensory texture attributes such as softness, stickiness, cooking time, and retrogradation tendency [22,23,24]. Consequently, multi-environment studies consistently report substantial genotype × environment (G × E) effects for these quality traits, leading to inconsistent ECQ performance across locations and seasons [4,25,26,27]. However, evaluations of advanced breeding lines under irrigated ecosystems remain limited.
Thailand’s Central Plain, an internationally important irrigated rice production zone, is characterized by heterogeneous microclimates and spatially variable soil fertility, particularly during dry-season cultivation [28]. Although ECQ and starch properties have been documented for Thai rice cultivars, the stability and G × E interaction responses of advanced non-glutinous breeding lines, especially those targeting the growing demand for soft-cooking rice, remain insufficiently understood. This study aims to evaluate the physicochemical and pasting characteristics of advanced non-glutinous rice genotypes across multiple irrigated environments in Thailand to identify those combining soft-cooking ECQ attributes with stable performance for high-quality production systems.
2. Materials and Methods
2.1. Study Site Descriptions
The experiment was conducted at three representative irrigated rice-growing locations in the central plain of Thailand during the dry season: Pathum Thani (14°03′54″ N, 100°38′46″ E), Suphan Buri (14°46′30″ N, 99°54′40″ E), and Chai Nat (15°15′19″ N, 100°02′17″ E). These sites were selected to represent major dry season irrigated production environments with contrasting soil and climatic conditions in Thailand’s central plain. The study was carried out during the 2024 dry season (January–May 2024).
Monthly weather data, including maximum and minimum temperatures and cumulative rainfall, were obtained from nearby meteorological stations and are summarized in Figure S1. Across locations, daily temperatures during the grain-filling period ranged from 25.75 to 36.70 °C, with low rainfall typical of dry-season cultivation. All experimental fields were managed under controlled canal-based irrigation, and standing water depth was maintained at approximately 5–10 cm throughout the cropping period.
2.2. Soil Properties
Topsoil samples (0–15 cm) were collected from each site prior to land preparation using a composite sampling method adapted from standard soil analysis procedures. Five subsamples were collected in a zig-zag pattern across each field and combined to obtain one representative sample per location. Samples were air-dried, ground, and passed through a 2 mm sieve prior to analysis.
Soil pH, organic matter content, texture, and macronutrient levels (total N, available P, and exchangeable K, Ca, and Mg) were determined following established protocols, with analyses conducted at the Soil Science Laboratory, Department of Plant and Soil Sciences, Chiang Mai University. A summary of the physicochemical properties of soils at the three locations is presented in Table S1.
In brief, Pathum Thani soils were classified as clay, Suphan Buri soils as sandy loam, and Chai Nat soils as sandy clay loam, reflecting the inherent heterogeneity of irrigated lowland soils in Thailand’s Central Plain.
2.3. Plant Materials and Experimental Design
Ten advanced non-glutinous rice breeding lines (designated DS24-Inter-1 to 10; where DS24 and Inter signify the 2024 dry season and advanced intermediate status, respectively) were evaluated. These lines were developed under the irrigated lowland breeding pipeline of the Ruamjai Pattana Kwamroo Research Station, Thailand. Two reference cultivars, RJP233088 (low-amylose) and RD85 (high-amylose), served as contrasting ECQ checks (Table 1).
Table 1.
Non-glutinous rice genotypes were used in this study.
The experiment was arranged in a randomized complete block design (RCBD) with three replications per site. Twenty-five-day-old seedlings were transplanted at 25 × 25 cm spacing into four-row plots (5 × 1 m). Crop management followed Thai Rice Good Agricultural Practices (GAP) [29] to ensure consistency across environments.
At maturity, ten representative panicles per genotype per replication were harvested. Grain processing and milling followed standard procedures, and milled rice flour was prepared and stored at −20 °C prior to analysis of GC, ASV, AAC, and RVA pasting properties.
2.4. Measurement of Grain Dimensions (Length, Breadth, and Shape)
For each genotype and replication, thirty fully developed head rice kernels were randomly selected for grain-dimension measurements. Grain length and breadth (mm) were measured using a digital Vernier caliper with 0.01 mm precision, following standard IRRI grain-quality evaluation procedures [30]. Measurements were conducted at approximately 14% grain moisture content.
Based on kernel length, genotypes were classified as extra-long (>7.50 mm), long (6.61–7.50 mm), medium (5.51–6.60 mm), or short (<5.50 mm), according to IRRI classification criteria [30].
Grain shape was expressed as the length-to-breadth (L/B) ratio, calculated as:
where L is the average grain length (mm) and W is the average grain width (mm). Based on the L/B ratio, grains were categorized as slender (>3.0), medium (2.1–3.0), bold (1.1–2.0), or round (<1.1) following IRRI standards [20].
2.5. Determination of 1000 Grain Weight
The 1000-grain weight was determined by randomly counting and weighing 1000 head rice kernels per genotype at approximately 14% moisture content, following standard grain-quality evaluation procedures [20].
2.6. Evaluation of Grain Chalkiness
Grain chalkiness was evaluated using 100 head rice kernels per genotype and replication. Kernels were visually scored under uniform lighting on a six-point scale (0–5) based on the proportion of chalky area on the endosperm surface, adapted from the IRRI Standard Evaluation System [30]. A chalkiness value was calculated as:
where is the chalkiness score and is the number of kernels at each score. Chalkiness was classified as low (0–1.0), medium (1.10–1.50), medium-to-high (1.60–1.90), or high (2.0–5.0).
Chalkiness value = ∑(Ci × Xi)/100,
2.7. Determination of Gel Consistency
GC was determined following the method described by Cagampang et al. [31], as detailed in the IRRI Standard Evaluation System [30]. Briefly, rice flour samples were gelatinized, allowed to cool horizontally, and the gel length (mm) was measured after a fixed setting period. Based on gel length, samples were classified into hard (26–40 mm), medium (41–60 mm), and soft (>60 mm) gel consistency classes.
2.8. Determination of Gelatinization Temperature by Alkali Spreading Value
GT was determined to use the ASV test following the IRRI Standard Evaluation System [30]. Six intact milled rice kernels per genotype were incubated in 1.7% (w/v) KOH at 30 °C for 23 h. Kernel spreading was visually scored on a 1–7 scale, with higher ASV indicating lower gelatinization temperature.
2.9. Determination of Elongation Ratio
Elongation ratio (ER) was determined as the ratio of the mean length of cooked rice kernels to that of uncooked kernels, following standard procedures [32]. Measurements were performed on ten randomly selected kernels per genotype.
2.10. Determination of Apparent Amylose Content
AAC was determined using the iodine-binding colorimetric method described by Juliano [33], as detailed in the IRRI Standard Evaluation System [30]. Rice samples were classified as low (10–19%), intermediate (20–24%), or high (>25%) amylose types according to standard criteria.
2.11. Measurement of Pasting Properties
Pasting properties were measured using an RVA (model 3-D; Newport Scientific, Warriewood, Australia) following Li et al. [34]. Rice flour (3.0 g, adjusted to 14% moisture basis) was mixed with 25 mL distilled water in an RVA canister. The suspension was stirred at 960 rpm for 10 s, then maintained at 160 rpm throughout the test.
The standard heating-cooling cycle consisted of equilibration at 50 °C for 60 s, heating to 95 °C over 4 min, holding at 95 °C for 2 min, cooling to 50 °C over 4 min, and holding at 50 °C for 2 min. Peak viscosity (PV), trough viscosity (TV), final viscosity (FV), breakdown viscosity (BD), setback viscosity, peak time (PeT), and pasting temperature (PaT) were recorded automatically in Rapid Visco Units (RVU). To facilitate comparison with SI units, a conversion factor of 1 RVU = 12 centipoise (cP) may be applied, according to the manufacturer’s specifications. Each sample was analyzed in triplicate.
2.12. Statistical Analysis
Prior to combined analysis, data from each environment were tested for homogeneity of error variances using Levene’s test following Gomez and Gomez [35]. As error variances were homogeneous (α = 0.05), a combined analysis of variance (ANOVA) across the three environments was performed using the following linear model:
where is the observed value of genotype in replication of environment ;
- is the overall mean;
- is the fixed effect of environment (k = 1–3);
- is the effect of replication nested within environment ;
- is the effect of genotype (i = 1, …, 12);
- is the G × E interaction; and
- is the residual error of mean.
For inference, genotype, environment, and genotype × environment interaction were treated as fixed effects, while replication nested within environment was treated as a random blocking factor to account for field variability. Mean comparisons among genotypes were conducted using Fisher’s least significant difference (LSD) test at α = 0.05. All univariate statistical analyses were performed using STATISTIX software (version 10.0; Analytical Software, Tallahassee, FL, USA).
Multivariate relationships among physicochemical and RVA traits were explored using principal component analysis (PCA) implemented in GraphPad Prism version 10.2.3 (GraphPad Software, San Diego, CA, USA). Variables were autoscaled (z-score standardized), and PCA was conducted based on the correlation matrix. The major contributing variables were identified by calculating Pearson’s correlation coefficients between individual traits and the first two principal components, with effect sizes for PC1 and PC2 estimated according to Ongrak et al. [36]. To assess uncertainty in variance explained by the principal components, bootstrap resampling (10,000 iterations) was performed using MATLAB R2025b (MathWorks, Natick, MA, USA) to generate 95% confidence intervals.
3. Results
3.1. Variance Components for Physicochemical and Pasting Characteristics
A combined analysis of variance revealed significant (p < 0.05) effects of genotype, environment, and G × E interaction for all physicochemical and pasting traits, except for the L/B ratio, for which G × E interaction was non-significant (Table 2). Genotypic effects were the predominant source of variation, explaining 41.13–94.30% of the total sum of squares for most traits, including ACC, GC, ASV, and pasting viscosity parameters, indicating strong genetic control over these quality attributes. In contrast, GR showed a greater influence on environmental variation, accounting for 42.87% and 46.59%, respectively. For PaT, genotype (41.13%) and G × E (30.75%) contributed nearly equally to the total variation, indicating differential thermal behavior across environments. These variance patterns were supported by location-specific means, which confirm the relative stability of key starch-quality traits across irrigated environments while revealing environmental modulation of selected parameters (Tables S2–S4). Thus, the high proportion of genetic variance for most traits indicates that the tested genotypes expressed consistent quality-related characteristics across locations, whereas traits associated with grain dimensions were more sensitive to environmental differences.
Table 2.
Combined analysis of variance for grain physical and chemical characteristics of non-glutinous rice genotypes evaluated across three irrigated locations in Thailand, off-season 2024.
3.2. Physical Characteristics
3.2.1. Grain Length and Breadth
Highly significant differences were observed among genotypes for both grain length and breadth (Table 3). DS24-Inter-1 (7.23 ± 0.24 mm) exhibited the greatest grain length, comparable to the long-grain check RD85 (7.28 ± 0.11 mm). Several advanced lines, including DS24-Inter-4, DS24-Inter-10, DS24-Inter-6, and DS24-Inter-9, also displayed long kernels, whereas DS24-Inter-2 had significantly shorter grains than both checks. Based on IRRI classification, all genotypes were categorized as long-grain types, showing suitability for consumer preferences in Thailand and export markets. Grain breadth differed among genotypes, with DS24-Inter-6 showing the lowest value, which is consistent with a narrower grain shape.
Table 3.
Grain physical characteristics of non-glutinous rice genotypes evaluated across three irrigated locations in Thailand, off-season 2024.
3.2.2. Grain Length-Breadth Ratio and Grain Shape
Significant differences in L/B ratio were detected (Table 3). DS24-Inter-6 (3.94 ± 0.17) showed the highest ratio, indicating a distinctly slender grain morphology, exceeding that of RD85. Conversely, DS24-Inter-2 and DS24-Inter-3 exhibited the lowest ratios, similar to the soft-cooking check RJP233088. All genotypes were classified as long grain; nevertheless, their degree of slenderness differed markedly, which may affect milling quality and market acceptance.
3.2.3. 1000-Grain Weight
A highly significant variation in 1000-grain weight was observed across genotypes (Table 3). All advanced lines recorded lower grain weight than RD85 (14.45 ± 1.51 g), reflecting differences in grain density and endosperm development. However, DS24-Inter-10, DS24-Inter-1, and DS24-Inter-4 were statistically comparable to RJP233088, indicating moderate grain filling. The lowest values were observed in DS24-Inter-8, DS24-Inter-7, and DS24-Inter-9, suggesting lighter kernels typical of soft-textured rice.
3.2.4. Grain Chalkiness
Grain chalkiness differed significantly among genotypes (Table 3). All advanced lines exhibited lower chalkiness than RJP233088, confirming improved grain transparency. The highest chalkiness levels appeared in DS24-Inter-7, DS24-Inter-9, DS24-Inter-1, and DS24-Inter-6, whereas DS24-Inter-10 (0.41 ± 0.32) recorded exceptionally low chalkiness, comparable to the high-quality check RD85. Genotypes were classified into four chalkiness groups: low (2 genotypes), medium (3 genotypes), medium to high (4 genotypes), and high (3 genotypes). This variation highlights opportunities for selecting lines with improved appearance quality suitable for premium markets.
3.2.5. Gel Consistency
Significant differences in GC were detected (Table 4). The softest (longest gel length) values were observed in DS24-Inter-9, DS24-Inter-4, DS24-Inter-7, and DS24-Inter-10, all of which did not differ significantly from either check variety. In contrast, DS24-Inter-1, DS24-Inter-3, and DS24-Inter-2 exhibited markedly shorter gel lengths, indicative of firmer cooked texture. Based on GC classification, rice lines were grouped into medium (3 genotypes) and soft (9 genotypes) categories, aligning with Thai consumer preference for soft, cohesive rice.
Table 4.
Gel consistency, alkali spreading value, and elongation ratio of non-glutinous rice genotypes evaluated across three irrigated locations in Thailand, off-season 2024.
3.2.6. Alkali Spreading Value
Substantial variation in ASV was observed (Table 4). DS24-Inter-4 (7.00) showed the highest ASV, indicating low GT. DS24-Inter-8 and DS24-Inter-3 also displayed high ASV values in contrast, DS24-Inter-7 (3.00) recorded the lowest ASV, corresponding to a high GT, and was lower than both check varieties. Based on ASV, genotypes were classified into low (3 genotypes), medium (7 genotypes), and high (2 genotypes) GT groups, demonstrating meaningful variation in starch thermal properties.
3.2.7. Elongation Ratio
No significant differences were detected among genotypes for ER (Table 4), suggesting that kernel expansion upon cooking remained largely stable across genetic backgrounds and environments.
3.3. Apparent Amylose Content
Genotypes differed significantly in their AAC (Table 5). The highest AAC values were observed in DS24-Inter-4 and DS24-Inter-9 (26.39 ± 1.96% and 25.59 ± 1.69%), though both remained slightly lower than the high-amylose check RD85 (28.15 ± 1.40%). At the lower end, DS24-Inter-10 and DS24-Inter-5 exhibited AAC values around 15%, characteristic of soft-textured rice. Genotypes were classified into low (5 genotypes), medium (3 genotypes), and high (4 genotypes) AAC groups, offering a useful range of starch profiles for developing both soft-cooking table rice and high-amylose types suited to processed-food applications.
Table 5.
Apparent amylose content and pasting viscosity properties of non-glutinous rice genotypes evaluated across three irrigated locations in Thailand, off-season 2024.
3.4. Pasting Viscosity Properties
All RVA-based pasting characteristics differed significantly among genotypes (Table 5). PV ranged from 153.14 ± 31.51 RVU (RD85) to 16.88 ± 1.35 RVU (DS24-Inter-6). High-AAC genotypes such as RD85 and DS24-Inter-9 displayed low PV and BD but high FV and setback, indicating restricted starch swelling and stronger retrogradation tendencies. In contrast, low-AAC genotypes, including DS24-Inter-5, DS24-Inter-6, and DS24-Inter-10, showed high PV and BD but lower setback values, reflecting greater granule swelling and reduced retrogradation. PeT averaged 5.99 min, while PaT varied across genotypes, with DS24-Inter-8 exhibiting the highest thermal requirement (91.11 °C). These contrasting profiles clearly differentiate the genotypes into functional quality groups aligned with consumer-preferred cooking textures.
3.5. Principal Component Analysis and Correlation
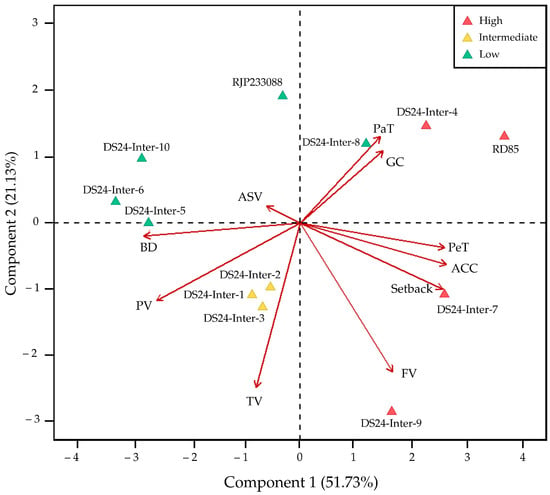
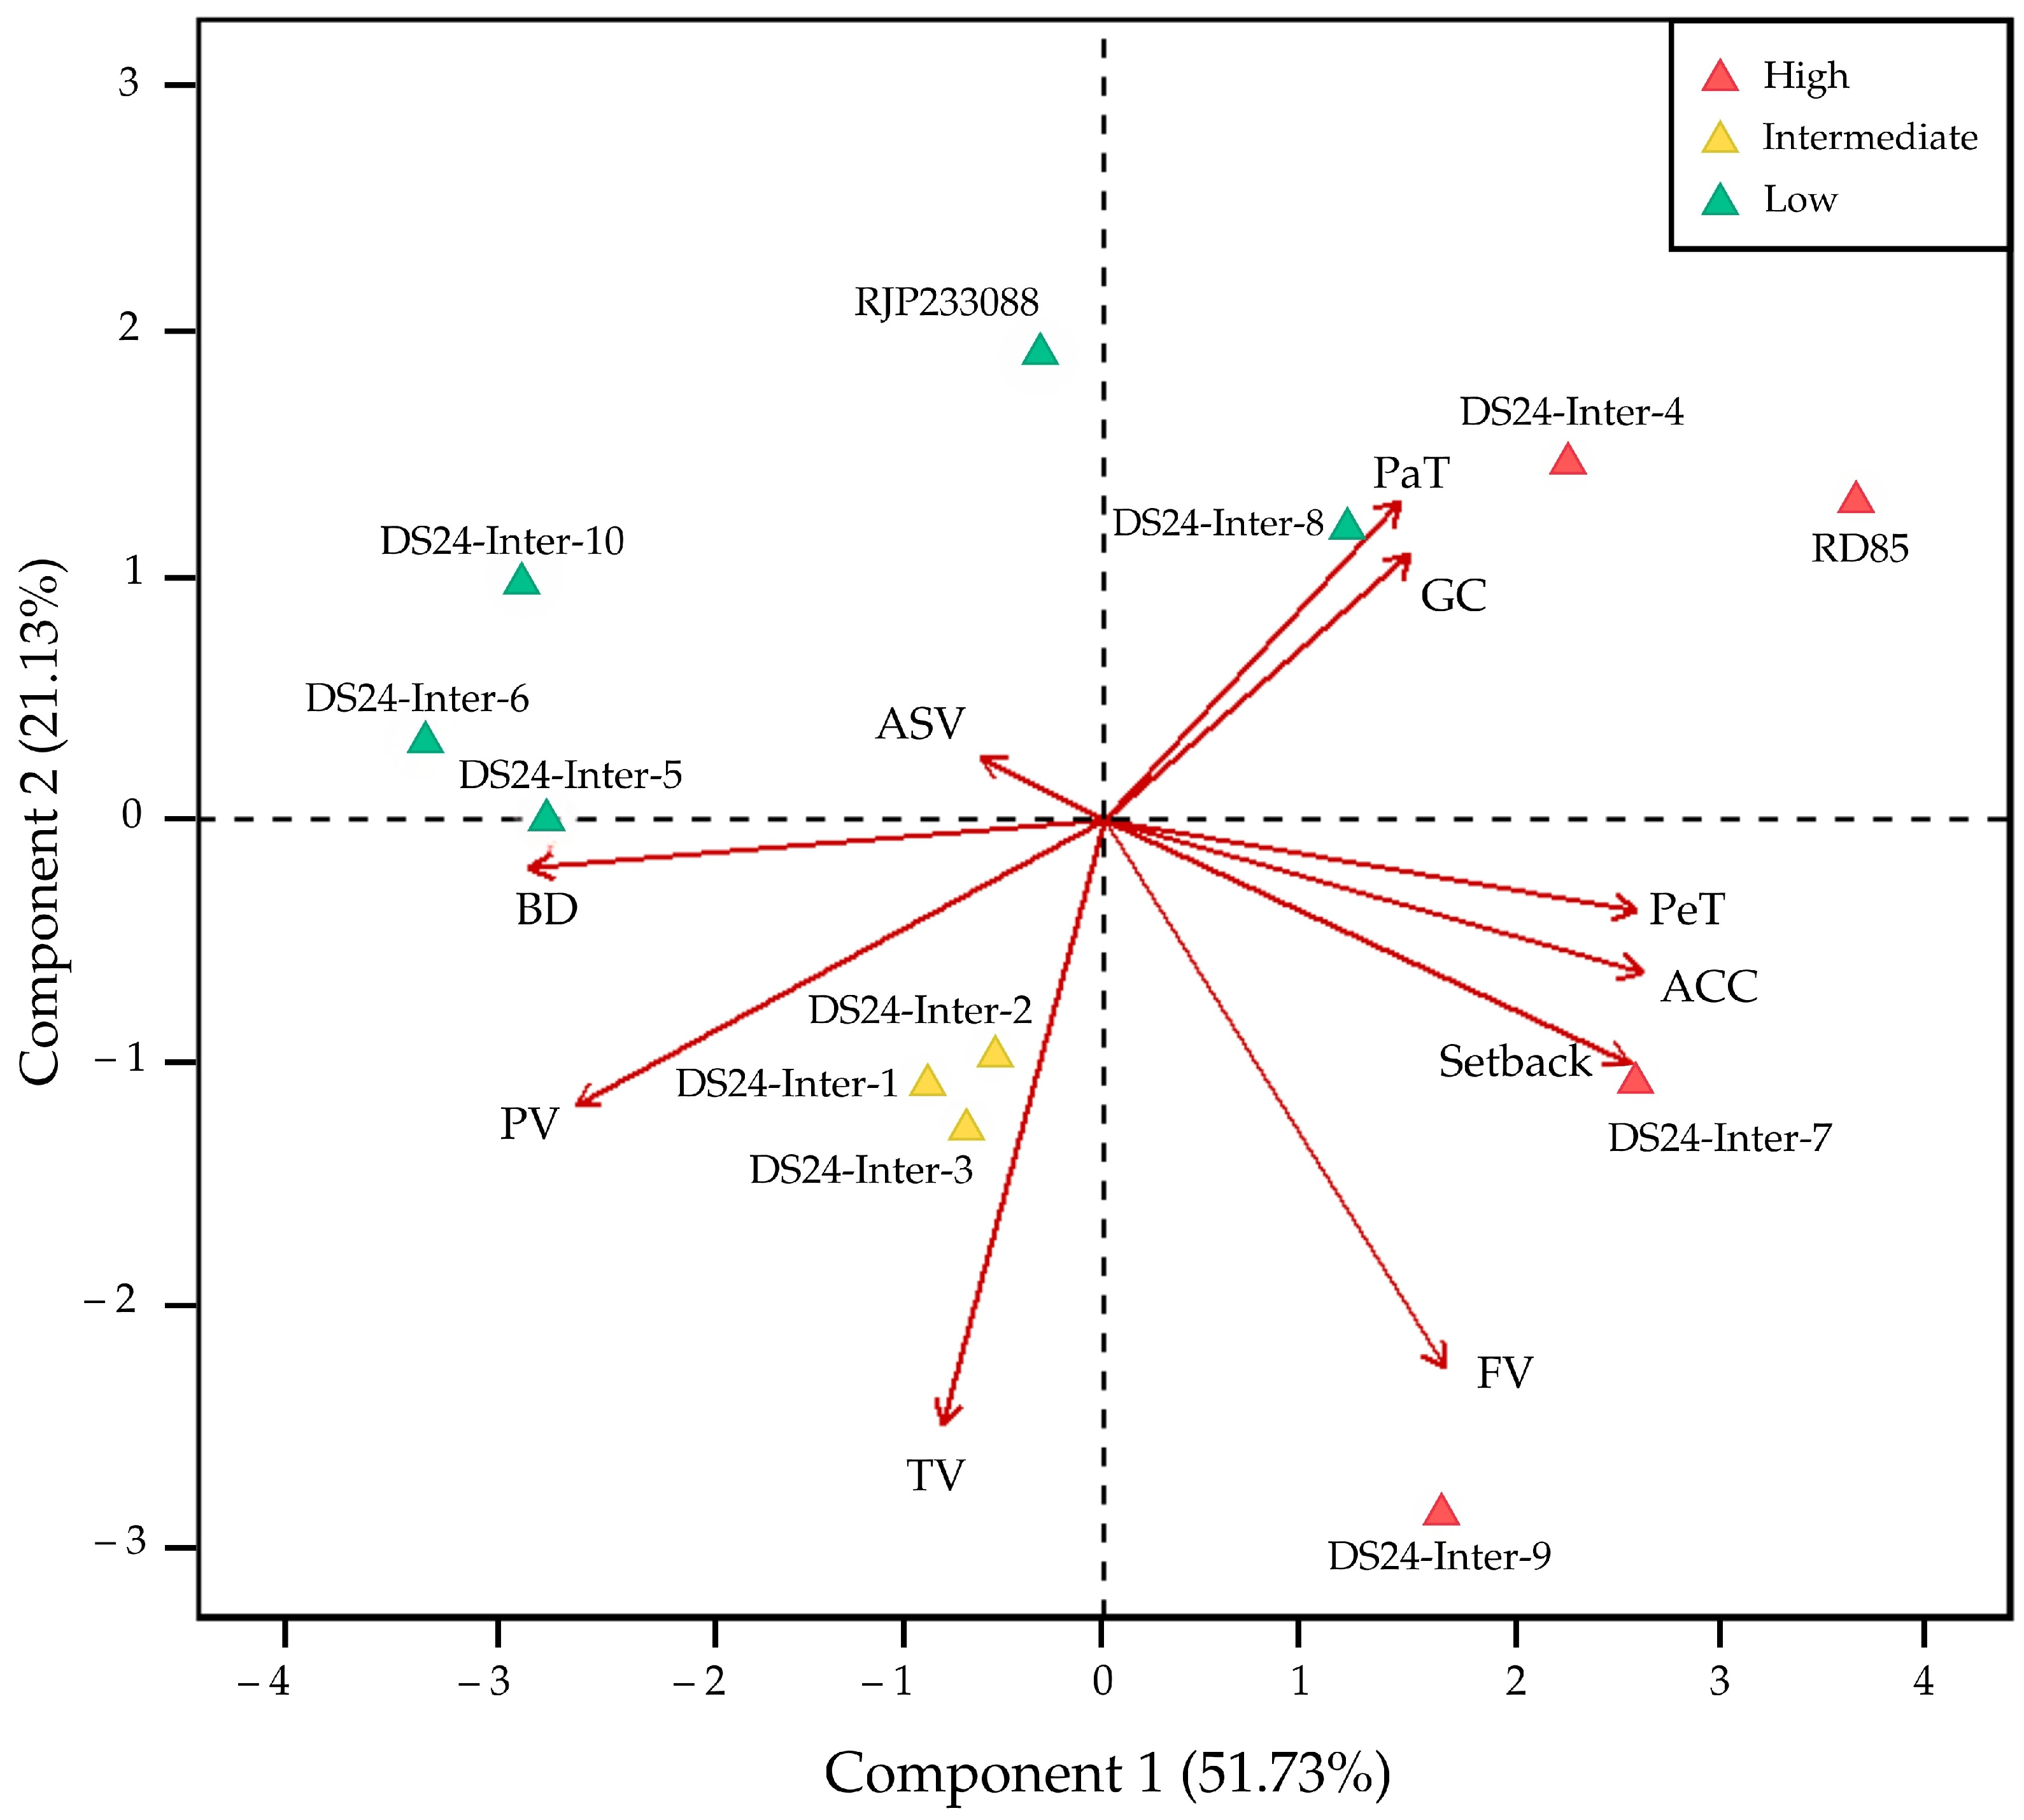
PCA was performed using ten key quality attributes to assess multivariate relationships among physicochemical and pasting properties. The first two principal components (PC1 and PC2) explained 72.86% of the total variance (Figure 1). PC1 accounted for 51.73% (95% CI: 40.35–75.79), driven mainly by variables strongly correlated with this axis, including AAC (r = 0.91), PeT (r = 0.90), and setback viscosity (r = 0.89) (Table 6). PC1 therefore predominantly captured differences in starch composition and retrogradation tendency. PC2 explained 21.13% (95% CI: 12.84–36.20), with TV (r = −0.87) and FV (r = −0.79) showing strong negative associations, reflecting variation related to paste stability and viscosity recovery.
Figure 1.
Score plot and loading plot of the first two principal components obtained from principal component analysis using grain physical and chemical characteristics of non-glutinous rice genotypes evaluated across three irrigated locations in Thailand, off-season 2024. ACC: Apparent amylose content; GC: Gel consistency; ASV: Alkali spreading value; PV: Peak viscosity; TV: Trough viscosity; BD: Breakdown; FV: Final viscosity; PeT: Peak time; PaT: Peak temperature. (green, yellow, and red triangle: low, medium, and high AAC, respectively).
Table 6.
Pearson correlation coefficients between original variables and principal components, based on the combined data of non-glutinous rice genotypes evaluated across three irrigated locations in Thailand, off-season 2024.
In the score plot, RD85, DS24-Inter-4, DS24-Inter-7, and DS24-Inter-9 were located on the positive side of PC1, corresponding to their association with higher AAC and setback viscosity (Figure 1). DS24-Inter-6, DS24-Inter-5, and DS24-Inter-10 clustered on the negative side of PC1, aligned with higher PV and BD, indicating stronger swelling capacity and paste disintegration behavior. Genotypes DS24-Inter-1, DS24-Inter-2, and DS24-Inter-3 were positioned near the center-left region of the plot, indicating intermediate and relatively balanced physicochemical and pasting characteristics. Along with PC2, DS24-Inter-4 and RD85 plotted positively and were associated with higher GC and PaT, whereas DS24-Inter-9 plotted strongly negatively, reflecting its association with higher FV and distinct paste stability behavior. Thus, the PCA separated the genotypes into three functional groups: (i) high-AAC/high-retrogradation types: RD85, DS24-Inter-4, DS24-Inter-7, and DS24-Inter-9; (ii) intermediate, balanced types: DS24-Inter-1, DS24-Inter-2, and DS24-Inter-3; and (iii) low-AAC, high-swelling viscous types: RJP233088, DS24-Inter-5, DS24-Inter-6, DS24-Inter-8, and DS24-Inter-10. These groupings provide a multivariate basis for selecting genotypes with contrasting starch-functionality profiles under irrigated lowland conditions.
4. Discussion
The multi-environment evaluation revealed clear and systematic patterns in the genetic, physicochemical, and rheological characteristics of advanced non-glutinous rice genotypes, highlighting the relative contributions of genotype, environment, and their interactions under irrigated lowland ecosystems in Thailand. Although trait means were not presented by individual location, the substantial environmental variance observed for grain breadth and elongation rate (Table 2) is consistent with site-to-site contrasts in soil properties (Table S1) and seasonal microclimatic conditions (Figure S1), which are known to influence grain expansion and endosperm packing during grain filling. The variance component analysis (Table 2) demonstrated that most physicochemical traits, particularly AAC, GC, GT (assessed by ASV), and RVA-derived pasting parameters, were predominantly governed by genotypic effects, accounting for 41.13–94.30% of the total variation. Whereas some traits showed moderate environmental responsiveness due to substantial G × E contributions (Table 2). The strong genetic contribution aligns with previous reports that Wx- and SSIIa-driven starch traits exhibit high heritability across indica and japonica backgrounds [37,38,39]. This interpretation should be regarded as a bounded inference, as the present study did not explicitly model location-specific means for each trait. Future analyses incorporating per-location estimates will be required to quantify the direct contribution of soil and climate variables to grain-quality expression.
Environmental variation further contributed to the strong plasticity observed in grain breadth and elongation rate (Table 2). The three irrigated environments differed markedly in thermal regime and rainfall distribution (Figure S1), with all sites reaching high daytime temperatures of 36–40 °C during grain filling, conditions known to accelerate grain-filling rate and disrupt amyloplast organization [40]. Suphan Buri, which exhibited the highest cumulative rainfall (274.5 mm) and sandy-loam texture (Table S1), likely experienced substantial fluctuations in root-zone moisture, promoting inconsistent cell expansion and kernel thickening. In contrast, the clayey, high-EC soil of Pathum Thani may have imposed osmotic constraints on endosperm expansion. These thermal and edaphic contrasts are consistent with previous reports showing that temperature, soil water availability, and nutrient status interactively regulate grain filling, starch deposition, and kernel morphology in rice [41]. The significant G × E interaction to PaT further reflects the sensitivity of SSIIa-mediated gelatinization behavior to environmental conditions such as heat and nitrogen supply during grain development [42,43]. Overall, while starch composition traits remained genetically stable, grain-physical and thermal-pasting traits clearly responded to the heterogeneous environmental conditions across irrigated ecosystems.
Grain weight varied significantly (Table 3), suggesting differences in endosperm filling and assimilating partitioning among genotypes. Variation in 1000-grain weight among the evaluated genotypes likely reflects differences in grain size, endosperm development, and assimilate partitioning, which are collectively regulated by multiple grain size-related loci such as GS3, GW2, and qSW5 [44,45,46]. Grain chalkiness varied markedly among the evaluated genotypes (Table 3). Low-chalkiness lines such as DS24-Inter-10 and DS24-Inter-4 exhibited improved grain translucency, which has been associated with more uniform endosperm development and tighter starch organization, contributing to superior milling quality [47,48]. In contrast, higher chalkiness observed in DS24-Inter-7 and DS24-Inter-9 may be attributed to disrupted starch accumulation during late grain filling, as chalk formation is highly sensitive to environmental stresses, particularly elevated temperature and fluctuating water availability, that interfere with orderly endosperm development and starch granule packing [49].
Variation in GC, ASV, and ER among genotypes (Table 4) reflects differences in starch molecular architecture, particularly amylopectin chain-length distribution. Genotypes exhibiting soft GC and high ASV, such as DS24-Inter-4 and DS24-Inter-10, are indicative of lower GT and loosely packed crystalline structures, traits strongly associated with functional variation at the ALK/SSIIa locus [12,39,50]. Natural allelic differentiation of SSIIa (ALKa and ALKb) has been shown to alter amylopectin fine structure, enzyme activity, and gelatinization behavior, thereby modulating cooking quality independent of AAC [39,50]. These findings support the observed differentiation in thermal and textural properties among the advanced non-glutinous rice genotypes evaluated in this study.
Pasting properties further highlighted starch structural diversity among the tested genotypes and their implications for ECQ. High-amylose genotypes such as RD85 and DS24-Inter-9 exhibited low PV and BD but high FV and setback (Table 5), reflecting restricted starch granule swelling and strong chain reassociation during cooling. These characteristics were typically associated with firmer cooked texture and faster retrogradation. In contrast, low-amylose genotypes, including DS24-Inter-5, DS24-Inter-6, and DS24-Inter-10, showed higher PV and BD but lower setback, indicating greater starch swelling and reduced retrogradation, which are hallmarks of soft-cooking rice increasingly favored by consumers. These contrasting RVA profiles were consistent with established relationships among AAC, gelatinization behavior, and sensory texture reported in Thai rice cultivars and other indica germplasm [21,51,52].
Multivariate analysis using PCA (Figure 1; Table 6) provided an integrated view of starch-related quality variation among the tested genotypes. PC1, accounting for 51.73% of the total variance, was strongly associated with apparent amylose content, setback viscosity, and peak time (Table 6), reflecting differences in starch composition and retrogradation behavior. Genotypes with high AAC, such as RD85, DS24-Inter-7, and DS24-Inter-9, clustered positively along PC1, consistent with firmer texture, delayed gelatinization, and higher retrogradation potential after cooling, attributes commonly linked to reduced eating softness [19,53]. PC2 explained an additional 21.13% of the variance and was primarily related to paste stability, as indicated by strong negative correlations with TV and FV (Table 5). Genotypes such as DS24-Inter-9, characterized by high TV and FV, plotted negatively along PC2, indicating greater paste stability but reduced smoothness. In contrast, DS24-Inter-8 and DS24-Inter-10 plotted positively on PC2, which was consistently associated with higher GC and lower FV across the evaluated locations (Tables S2–S4). These physicochemical properties are key indicators of starch swelling and softer cooking quality favored in soft-cook rice [21,47,48].
Overall, PCA effectively discriminated genotypes into distinct quality-oriented groups based on starch compositional and rheological attributes, reinforcing its value for identifying lines with contrasting ECQ profiles. The high-AAC/high-retrogradation cluster (RD85, DS24-Inter-4, DS24-Inter-7, and DS24-Inter-9) is expected to maintain firmer texture after cooling, supporting utilization where structural integrity is required (e.g., rice noodles, extruded snacks, and starch-based gels). Whereas the low-AAC/high-swelling cluster (RJP233088, DS24-Inter-5, DS24-Inter-6, DS24-Inter-8, and DS24-Inter-10) corresponds to soft-cooking texture traits increasingly preferred in premium table rice markets. Intermediate genotypes (DS24-Inter-1, DS24-Inter-2, and DS24-Inter-3) showed comparatively stable, moderate physicochemical profiles, which may be advantageous for breeding programs targeting balanced quality across irrigated environments. The results further indicate that most physicochemical and cooking-quality traits in these advanced genotypes were predominantly under genetic control, supporting their suitability for irrigated lowland ecosystems in Thailand. Nevertheless, traits exhibiting pronounced environmental sensitivity should be validated through expanded multi-environment trials to ensure quality stability under irrigated production systems.
5. Conclusions
This study demonstrates that grain-quality variation among advanced non-glutinous rice genotypes is largely governed by genetic factors, whereas environmental effects primarily influence grain dimensions. Multivariate analysis distinguished genotypes according to starch composition and paste stability. Genotypes with contrasting amylose levels exhibited distinct pasting behaviors, reflecting differences in swelling and retrogradation. Remarkably, several advanced genotypes expressed soft-cooking profiles characterized by favorable gelatinization and GC, aligning with the increasing demand for soft-textured rice in both domestic and international markets. These differentiated quality attributes support targeted utilization and reinforce the importance of selecting stable, high-quality genotypes for irrigated rice production systems.
Supplementary Materials
The following supporting information can be downloaded at: https://www.mdpi.com/article/10.3390/crops6020031/s1, Figure S1: Total rainfall and minimum and maximum temperature during crop growth in the off- season 2024. (a) Pathum Thani: (b) Chai Nat: (c) Suphan Buri; Table S1: Soil properties across tested locations; Table S2: Mean performance of 12 rice genotypes for gel consistency and alkali spreading value evaluated across individual locations during off-season 2024; Table S3: Mean performance of 12 rice genotypes for apparent amylose content evaluated across individual locations during off-season 2024; Table S4: Mean performance of 12 rice genotypes for pasting viscosity properties evaluated across individual locations during off-season 2024.
Author Contributions
Conceptualization, B.H.; methodology, B.H.; software, B.H.; investigation, T.T., P.P. and B.H.; resources, P.P. and B.H.; formal analysis, T.T. and B.H.; data curation, T.T. and B.H.; writing—original draft preparation, T.T. and B.H.; writing—review and editing, Y.J. and B.H.; project administration, B.H.; funding acquisition, B.H. All authors have read and agreed to the published version of the manuscript.
Funding
This research project was supported by the Faculty of Science and Technology, Thammasat University, Contract No SciGR17/2567.
Data Availability Statement
The original contributions presented in this study are included in the article and Supplementary Material. Further inquiries can be directed to the corresponding author.
Acknowledgments
The authors gratefully acknowledge the Department of Agricultural Technology, Faculty of Science and Technology, Thammasat University, Thailand, for the provision of research facilities and infrastructure support. The rice line/variety used for evaluation was supplied by the Ruamjai Pattana Kwamroo Research Station, Pathum Thani, Thailand. Authors wish to thank Panumart Ritthichai for valuable guidance in the statistical analysis.
Conflicts of Interest
The authors declare no conflicts of interest.
Abbreviations
The following abbreviations are used in this manuscript:
| AAC | Apparent amylose content |
| ALK | Amylose-Low Kernel gene |
| ANOVA | Analysis of Variance |
| ASV | Alkali spreading value |
| BD | Breakdown |
| Cis | Confidence intervals |
| C.V. | Coefficient of Variation |
| EC | Electrical Conductivity |
| ECQ | Eating and cooking quality |
| ER | Elongation ratio |
| FV | Final viscosity |
| GAP | Good Agricultural Practices |
| GC | Gel consistency |
| G × E interaction | Genotype × Environment interaction |
| GT | Gelatinization temperature |
| IRRI | International Rice Research Institute |
| LSD | Least Significant Difference |
| PaT | Peak temperature |
| PCA | Principal component analysis |
| PeT | Peak time |
| PV | Peak viscosity |
| RCBD | Randomized complete block design |
| RVA | Rapid Visco Analyzer |
| RVU | Rapid Visco Units |
| SSIIa | Soluble Starch Synthase Iia gene |
| SSRG | Starch Synthesis-Related Gene |
| TCW | Thermocline for Windows |
| TV | Trough viscosity |
References
- FAOSTAT. Production/Yield Quantities of Rice, Paddy in World + (Total). Food and Agriculture Organization of the United Nations. 2023. Available online: https://www.fao.org/faostat/en/#data/QCL/visualize (accessed on 1 November 2025).
- Zhao, M.; Lin, Y.; Chen, H. Improving nutritional quality of rice for human health. Theor. Appl. Genet. 2020, 133, 1397–1413. [Google Scholar] [CrossRef] [Scilit]
- Mohidem, N.A.; Hashim, N.; Shamsudin, R.; Che Man, H. Rice for food security: Revisiting its production, diversity, rice milling process and nutrient content. Agriculture 2022, 12, 741. [Google Scholar] [CrossRef] [Scilit]
- John, D.M.F.; Raman, M. Physicochemical properties, eating and cooking quality and genetic variability: A comparative analysis in selected rice varieties of South India. Food Prod. Process Nutr. 2023, 5, 49. [Google Scholar] [CrossRef] [Scilit]
- Thissa Marasingha, M.M.M.; Samarakoon, E.R.J.; Senarathne, B.M.K.; Samarasinghe, H.G.A.S. Comparative assessment of grain quality characteristics and cooking parameters of white rice (Oryza sativa Indica and Oryza sativa Japonica) varieties cultivated in Sri Lanka. Eng. Proc. 2024, 67, 58. [Google Scholar] [CrossRef] [Scilit]
- Zhou, L.H.; Zhang, C.Q.; Zhang, Y.D.; Wang, C.L.; Liu, Q.Q. Genetic manipulation of endosperm amylose for designing superior quality rice to meet the demands in the 21st century. J. Cereal Sci. 2022, 105, 103481. [Google Scholar] [CrossRef] [Scilit]
- Bao, J. Toward understanding the genetic and molecular bases of the eating and cooking qualities of rice. Cereal Foods World 2012, 57, 148–156. [Google Scholar] [CrossRef] [Scilit]
- Pang, Y.; Ali, J.; Wang, X.; Franje, N.J.; Revilleza, J.E.; Xu, J.; Li, Z. Relationship of rice grain amylose, gelatinization temperature and pasting properties for breeding better eating and cooking quality of rice varieties. PLoS ONE 2016, 11, e0168483. [Google Scholar] [CrossRef] [Scilit]
- Jeon, J.S.; Ryoo, N.; Hahn, T.R.; Walia, H.; Nakamura, Y. Starch biosynthesis in cereal endosperm. Plant Physiol. Biochem. 2010, 48, 383–392. [Google Scholar] [CrossRef] [Scilit]
- Tian, Z.; Qian, Q.; Liu, Q.; Yan, M.; Liu, X.; Yan, C.; Li, J. Allelic diversities in rice starch biosynthesis lead to a diverse array of rice eating and cooking qualities. Proc. Natl. Acad. Sci. USA 2009, 106, 21760–21765. [Google Scholar] [CrossRef] [Scilit] [PubMed]
- Cuevas, R.; Fitzgerald, M. Genetic diversity of rice grain quality. In Genetic Diversity in Plants; Çalişkan, M., Ed.; InTech: Rijeka, Croatia, 2012; pp. 285–310. [Google Scholar]
- Nakano, T.; Crofts, N.; Miura, S.; Oitome, N.F.; Hosaka, Y.; Ishikawa, K.; Fujita, N. Three Starch Synthase IIa (SSIIa) alleles reveal the effect of SSIIa on the thermal and rheological properties, viscoelasticity, and eating quality of glutinous rice. Int. J. Mol. Sci. 2023, 24, 3726. [Google Scholar] [CrossRef] [Scilit]
- Bao, J.; Deng, B.; Zhang, L. Molecular and genetic bases of rice cooking and eating quality: An updated review. Cereal Chem. 2023, 100, 1220–1233. [Google Scholar] [CrossRef] [Scilit]
- Fujita, N.; Miura, S.; Crofts, N. Effects of various allelic combinations of starch biosynthetic genes on the properties of endosperm starch in rice. Rice 2022, 15, 24. [Google Scholar] [CrossRef] [Scilit]
- Nakamura, Y. A model for the reproduction of amylopectin cluster by coordinated actions of starch branching enzyme isoforms. Plant Mol. Biol. 2023, 112, 199–212. [Google Scholar] [CrossRef] [Scilit] [PubMed]
- Pereira, C.L.; Sousa, I.; Lourenço, V.M.; Sampaio, P.; Gárzon, R.; Rosell, C.M.; Brites, C. Relationship between physicochemical and cooking quality parameters with estimated glycaemic index of rice varieties. Foods 2024, 13, 135. [Google Scholar] [CrossRef] [Scilit]
- Buenafe, R.J.Q.; Kumanduri, V.; Sreenivasulu, N. Deploying viscosity and starch polymer properties to predict cooking and eating quality models: A novel breeding tool to predict texture. Carbohydr. Polym. 2021, 260, 117766. [Google Scholar] [CrossRef] [Scilit] [PubMed]
- Wang, L.; Xie, B.; Shi, J.; Xue, S.; Deng, Q.; Wei, Y.; Tian, B. Physicochemical properties and structure of starches from Chinese rice cultivars. Food Hydrocoll. 2010, 24, 208–216. [Google Scholar] [CrossRef] [Scilit]
- Sangwongchai, W.; Thitisaksakul, M.; Sriwattana, N.; Phothiset, S.; Sakloetsakun, D.; Dongsansuk, A. Chemical composition, structural features, and physicochemical properties of starches from Thai indigenous rice varieties. Int. J. Food Prop. 2024, 27, 34–52. [Google Scholar] [CrossRef] [Scilit]
- Pokhrel, A.; Dhakal, A.; Sharma, S.; Poudel, A. Evaluation of physicochemical and cooking characteristics of rice (Oryza sativa L.) landraces of Lamjung and Tanahun districts, Nepal. Int. J. Food Sci. 2020, 2020, 1589150. [Google Scholar] [CrossRef] [Scilit]
- Varavinit, S.; Shobsngob, S.; Varanyanond, W.; Chinachoti, P.; Naivikul, O. Effect of amylose content on gelatinization, retrogradation and pasting properties of flours from different cultivars of Thai rice. Starch/Stärke 2003, 55, 410–415. [Google Scholar] [CrossRef] [Scilit]
- Deng, N.; Ling, X.; Sun, Y.; Zhang, C.; Fahad, S.; Peng, S.; Cui, K.; Nie, L.; Huang, J. Influence of temperature and solar radiation on grain yield and quality in irrigated rice system. Eur. J. Agron. 2015, 64, 37–46. [Google Scholar] [CrossRef] [Scilit]
- Zhang, X.; Guo, D.; Blennow, A.; Zörb, C. Mineral nutrients and crop starch quality. Trends Food Sci. Technol. 2021, 114, 148–157. [Google Scholar] [CrossRef] [Scilit]
- Chen, G.; Peng, L.; Gong, J.; Wang, J.; Wu, C.; Sui, X.; Tian, Y.; Hu, M.; Li, C.; He, X.; et al. Effects of water stress on starch synthesis and accumulation of two rice cultivars at different growth stages. Front. Plant Sci. 2023, 14, 1133524. [Google Scholar] [CrossRef] [Scilit]
- Bao, J.; Kong, X.; Xie, J.; Xu, L. Analysis of genotypic and environmental effects on rice starch. 1. Apparent amylose content, pasting viscosity, and gel texture. J. Agric. Food Chem. 2004, 52, 6010–6016. [Google Scholar] [CrossRef] [Scilit] [PubMed]
- Allahgholipour, M.; Ali, A.J.; Alinia, F.; Nagamine, T.; Kojima, Y. Relationship between rice grain amylose and pasting properties for breeding better quality rice varieties. Plant Breed. 2006, 125, 357–362. [Google Scholar] [CrossRef] [Scilit]
- Yu, J.; Zhu, D.; Zheng, X.; Shao, L.; Fang, C.; Yan, Q.; Zhang, L.; Qin, Y.; Shao, Y. The effects of genotype × environment on physicochemical and sensory properties and differences of volatile organic compounds of three rice types (Oryza sativa L.). Foods 2023, 12, 3108. [Google Scholar] [CrossRef] [Scilit] [PubMed]
- Pame, A.R.P.; Vithoonjit, D.; Meesang, N.; Balingbing, C.; Gummert, M.; Van Hung, N.; Singleton, G.R.; Stuart, A.M. Improving the sustainability of rice cultivation in central Thailand with biofertilizers and laser land leveling. Agronomy 2023, 13, 587. [Google Scholar] [CrossRef] [Scilit]
- TAS 4401-2008; Good Agricultural Practices for Rice. National Bureau of Agricultural Commodity and Food Standards (ACFS), Ministry of Agriculture and Cooperatives: Bangkok, Thailand, 2008.
- International Rice Research Institute (IRRI). Standard Evaluation System for Rice, 5th ed.; IRRI: Los Baños, Philippines, 2013. [Google Scholar]
- Cagampang, G.B.; Perez, C.M.; Juliano, B.O. A gel consistency test for eating quality of rice. J. Sci. Food Agric. 1973, 24, 1589–1594. [Google Scholar] [CrossRef] [Scilit]
- Hettiarachchi, H.A.P.W.; Rebeira, S.P.; Prasantha, B.D.R.; Wickramasinghe, H.A.M. Diversity of physical and cooking quality characters of selected traditional and improved rice varieties in Sri Lanka. Sri Lankan J. Biol. 2016, 1, 15–26. [Google Scholar] [CrossRef] [Scilit]
- Juliano, B.O. A simplified assay for milled-rice amylose. Cereal Sci. Today 1971, 16, 334–340. [Google Scholar]
- Li, S.; Ren, X.; Zhang, M.; Asimi, S.; Lv, Q.; Wang, Z.; Liang, S.; Wang, Z.; Meng, L. New perspective to guide rice breeding: Evaluating the eating quality of japonica rice. Cereal Chem. 2021, 99, 603–614. [Google Scholar] [CrossRef] [Scilit]
- Gomez, K.A.; Gomez, A.A. Statistical Procedures for Agricultural Research, 2nd ed.; John Wiley & Sons: New York, NY, USA, 1984. [Google Scholar]
- Ongrak, P.; Poolyarat, N.; Suksaengpanomrung, S.; Harakotr, B.; Jirakiattikul, Y.; Rithichai, P. Enhancing the growth, bioactive compounds, and antioxidant activity of kangkong (Ipomoea aquatica Forssk.) microgreens using dielectric barrier discharge plasma. Resources 2025, 14, 72. [Google Scholar] [CrossRef] [Scilit]
- Tong, C.; Chen, Y.; Tang, F.; Xu, F.; Huang, Y.; Chen, H.; Bao, J. Genetic diversity of amylose content and RVA pasting parameters in 20 rice accessions grown in Hainan, China. Food Chem. 2014, 161, 239–245. [Google Scholar] [CrossRef] [Scilit]
- You, H.; Zhang, O.; Xu, L.; Liang, C.; Xiang, X. Effects of soluble starch synthase IIa allelic variation on rice grain quality with different waxy backgrounds. J. Sci. Food Agric. 2020, 100, 5344–5351. [Google Scholar] [CrossRef] [Scilit] [PubMed]
- Umemoto, T.; Aoki, N.; Lin, H.; Nakamura, Y.; Inouchi, N.; Sato, Y.; Yano, M.; Hirabayashi, H.; Maruyama, S. Natural variation in rice starch synthase IIa affects enzyme and starch properties. Funct. Plant Biol. 2008, 35, 148–158. [Google Scholar] [CrossRef] [Scilit] [PubMed]
- Ma, W.; Wang, X.; Gu, C.; Lu, Z.; Ma, R.; Wang, X.; Lu, Y.; Cai, K.; Tang, Z.; Zhou, Z.; et al. Rice heat stress response: Physiological changes and molecular regulatory network research progress. Plants 2025, 14, 2573. [Google Scholar] [CrossRef] [Scilit]
- Chen, Y.; Wang, M.; Ouwerkerk, P.B.F. Molecular and environmental factors determining grain quality in rice. Food Energy Secur. 2012, 1, 111–132. [Google Scholar] [CrossRef] [Scilit]
- Xu, Y.; Guan, X.; Han, Z.; Zhou, L.; Zhang, Y.; Asad, M.A.U.; Wang, Z.; Jin, R.; Pan, G.; Cheng, F. Combined effect of nitrogen fertilizer application and high temperature on grain quality properties of cooked rice. Front. Plant Sci. 2022, 13, 874033. [Google Scholar] [CrossRef] [Scilit] [PubMed]
- Yao, D.; Wu, J.; Luo, Q.; Li, J.; Zhuang, W.; Xiao, G.; Deng, Q.; Lei, D.; Bai, B. Influence of high natural field temperature during grain filling stage on the morphological structure and physicochemical properties of rice (Oryza sativa L.) starch. Food Chem. 2020, 310, 125817. [Google Scholar] [CrossRef] [Scilit] [PubMed]
- Fan, C.; Xing, Y.; Mao, H.; Lu, T.; Han, B.; Xu, C.; Zhang, Q. GS3, a major QTL for grain length and weight and minor QTL for grain width and thickness in rice, encodes a putative transmembrane protein. Theor. Appl. Genet. 2006, 112, 1164–1171. [Google Scholar] [CrossRef] [Scilit]
- Song, X.J.; Huang, W.; Shi, M.; Zhu, M.Z.; Lin, H.X. A QTL for rice grain width and weight encodes a previously unknown RING-type E3 ubiquitin ligase. Nat. Genet. 2007, 39, 623–630. [Google Scholar] [CrossRef] [Scilit]
- Shomura, A.; Izawa, T.; Ebana, K.; Ebitani, T.; Kanegae, H.; Konishi, S.; Yano, M. Deletion in a gene associated with grain size increased yields during rice domestication. Nat. Genet. 2008, 40, 1023–1028. [Google Scholar] [CrossRef] [Scilit] [PubMed]
- Lisle, A.J.; Martin, M.; Fitzgerald, M.A. Chalky and translucent rice grains differ in starch composition and structure. Cereal Chem. 2000, 77, 627–632. [Google Scholar] [CrossRef] [Scilit]
- Fitzgerald, M.A.; McCouch, S.R.; Hall, R.D. Not just a grain of rice: The quest for quality. Trends Plant Sci. 2009, 14, 133–139. [Google Scholar] [CrossRef] [Scilit]
- Shi, W.; Yin, X.; Struik, P.C.; Xie, F.; Schmidt, R.C.; Jagadish, K.S.V. Grain yield and quality responses of tropical hybrid rice to high night-time temperature. Field Crops Res. 2014, 166, 29–38. [Google Scholar] [CrossRef] [Scilit]
- Chen, Z.; Lu, Y.; Feng, L.; Hao, W.; Li, C.; Yang, Y.; Fan, X.; Li, Q.; Zhang, C.; Liu, Q. Genetic dissection and functional differentiation of ALKa and ALKb, two natural alleles of the ALK/SSIIa gene, responding to low gelatinization temperature in rice. Rice 2020, 13, 39. [Google Scholar] [CrossRef] [Scilit]
- Singh, N. Rice chemistry and quality. Int. J. Food Sci. Technol. 2005, 40, 571–572. [Google Scholar] [CrossRef] [Scilit]
- Chen, H.; Chen, D.; He, L.; Wang, T.; Lu, H.; Yang, F.; Deng, F.; Chen, Y.; Tao, Y.; Li, M.; et al. Correlation of taste values with chemical compositions and Rapid Visco Analyser profiles of 36 indica rice (Oryza sativa L.) varieties. Food Chem. 2021, 349, 129176. [Google Scholar] [CrossRef] [Scilit] [PubMed]
- Shoukat, R.; Cappai, M.; Pilia, L.; Pia, G. Rice starch chemistry, functional properties, and industrial applications: A review. Polymers 2025, 17, 110. [Google Scholar] [CrossRef] [Scilit] [PubMed]

Disclaimer/Publisher’s Note: The statements, opinions and data contained in all publications are solely those of the individual author(s) and contributor(s) and not of MDPI and/or the editor(s). MDPI and/or the editor(s) disclaim responsibility for any injury to people or property resulting from any ideas, methods, instructions or products referred to in the content. |
© 2026 by the authors. Licensee MDPI, Basel, Switzerland. This article is an open access article distributed under the terms and conditions of the Creative Commons Attribution (CC BY) license.