


Abstract
While the automobile industry has moved rapidly toward automation, the U.S. public transit industry began investigating automation in bus operations comparatively recently, and adoption pathways differ sharply by community size. This study establishes a national baseline of transit agency perspectives on bus transit automation technologies—ranging from advanced driver assistance systems (ADAS) to fully automated shuttles—captured immediately before the wave of demonstration deployments and the COVID-19 pandemic reshaped the industry. A national survey of U.S. transit agencies conducted through the Small Urban and Rural Transit Center yielded 258 responses (157 rural, 67 small-urban, and 34 urban agencies). The results show a pronounced awareness gradient by community size: 65% of rural agencies were unfamiliar with SAE automation levels, compared with 23% of urban agencies. Agencies across all community sizes believed automation at all SAE levels (1–5) can promote safety, and safety was simultaneously the leading motivation for adoption and the leading identified research need. However, agencies expressed that SAE Level 4–5 vehicles would still require an onboard operator or agent for customer support and environment monitoring—particularly for ADA paratransit and demand-response services. Collision avoidance, curb avoidance, and lane-keep assist emerged as the technologies most favored for near-term adoption, while interest in fully automated shuttles concentrated in circulator, campus, and first-mile/last-mile applications. Rural agencies identified distinct barriers, including state-mediated procurement, missing digital and physical infrastructure, and clientele requiring personalized assistance. The findings provide a benchmark against which post-pandemic shifts in transit automation readiness can be measured and offer guidance for technology developers, planners, and policymakers targeting communities of different sizes. We recommend that outreach and technical assistance be differentiated by community size, that vehicle developers design for attended rather than driverless operation in paratransit and demand-response contexts, and that state departments of transportation be engaged directly as a leverage point for rural adoption, given that rural vehicle procurement is state-mediated.
1. Introduction
Automated-vehicle (AV) and connected vehicle technologies have developed rapidly over the past decade. Consumer automobiles now commonly incorporate partial automation features such as adaptive cruise control, automated emergency braking, self-parking, and lane-keep assist, and multiple manufacturers and technology firms have advanced toward higher levels of driving automation, a transition whose opportunities, barriers, and policy implications have attracted substantial scholarly attention [1]. The public transit industry has followed a distinct trajectory. Rather than pursuing automation as a market differentiator, U.S. transit agencies began experimenting with automation through pilots, demonstrations, and federally supported research programs, applying technologies including lane-keep assist, collision avoidance, precision docking guidance for bus rapid transit (BRT), and low-speed driverless shuttles from suppliers such as Navya and EasyMile [2,3].
The potential benefits of transit vehicle automation identified by the Federal Transit Administration (FTA) include enhanced safety, reduced liability, more efficient operations and maintenance, improved service availability, reduced dependence on qualified vehicle operators, and reduced operator workload through driver-assist features [4]. If successfully implemented, transit automation could substantially enhance mobility and quality of life, and could be particularly transformative in small-urban and rural areas by delivering transportation access more cost-effectively [5], particularly for the non-driving, older, and travel-restricted populations that constitute much of the rural transit clientele [6]. At the same time, early piloting surfaced significant challenges: safety and security concerns, uncertain public acceptance, labor impacts, limited capital funding, and a thin research base on safe automated transit operations [5].
A critical and under-examined dimension of transit automation is heterogeneity across community sizes. The overwhelming majority of U.S. transit agencies are rural or small-urban operators whose service models (predominantly demand-response), fleets, funding mechanisms, infrastructure, and clientele differ fundamentally from those of large urban systems. Technology developers, planners, and policymakers require evidence on how agencies of different sizes perceive, prioritize, and plan for automation in order to design vehicles, programs, and policies that meet actual agency needs. Moreover, while a substantial peer-reviewed literature has examined public and passenger acceptance of automated vehicles and shuttles [7,8,9,10,11,12,13,14] and several scholarly reviews have synthesized the technology and deployment status of automated buses [15,16,17], comparatively few studies capture the perspectives of transit agencies themselves—the organizations that would ultimately procure, operate, and maintain automated fleets—and rural and small-urban operators are almost entirely absent from this literature (Section 2.5).
This paper reports the results of a national survey of U.S. transit agencies in rural, small-urban, and urban areas, conducted in November 2018 through the Small Urban and Rural Transit Center (SURTC) at North Dakota State University in coordination with the FTA, the Center for Urban Transportation Research (CUTR), and the John A. Volpe National Transportation Systems Center. The survey captured agency awareness of automation technologies, interest in and preferred applications for automated shuttles and advanced driver assistance systems (ADAS), adoption and procurement timelines, perceived advantages and concerns by service type, and technical assistance and research needs. With 258 responding agencies—157 rural, 67 small-urban, and 34 urban—the dataset constitutes, to the author’s knowledge, one of the largest cross-community-size assessments of U.S. transit agency perspectives on automation from the period immediately preceding both the major wave of federally funded automated transit demonstrations and the COVID-19 pandemic.
The timing of data collection is a deliberate framing of this paper’s contribution. The 2018–2019 period represents the last observation window of the U.S. transit industry’s “default” disposition toward automation—before the FTA’s Strategic Transit Automation Research (STAR) demonstration program matured, before several high-profile shuttle pilots concluded or were suspended, and before the pandemic simultaneously intensified the transit workforce shortage and disrupted ridership. As such, the results serve as a pre-pandemic national baseline against which subsequent and future measurements of transit automation readiness can be compared. The specific objectives of the study are threefold:
The study accordingly (1) identifies available driver-assist and other transit automation technologies in U.S. bus transit operations and summarizes their implementation status, (2) gathers national survey input from rural, small-urban, and urban transit agencies on these technologies and their implementation, and (3) analyzes the survey data to understand opportunities, advantages, and challenges for implementing automated-bus transit technologies across community sizes.
Developments since data collection underscore the value of such a baseline. The transit workforce shortage that respondents cited as a motivation for automation became acute after the COVID-19 pandemic: in a 2022 American Public Transportation Association (APTA) survey, 96% of agencies reported a workforce shortage and 84% reported that the shortage was affecting their ability to provide service, with bus operators the most difficult position to fill [18]. Federally supported demonstration activity matured, culminating in the June 2025 launch of the first autonomous-vehicle public transit revenue service in the United States by the Jacksonville Transportation Authority [19], while the first large-scale rural automated transit demonstration—the Minnesota Autonomous Rural Transit Initiative (goMARTI) in Grand Rapids, Minnesota—began in October 2022 [20]. Over the same period, the low-speed shuttle segment that dominated the 2018 landscape contracted through regulatory suspension [21] and manufacturer exits [22,23]. Section 2.6 summarizes these developments and Section 5.2 interprets the baseline findings in light of them.
This article is based on data first reported in a 2019 technical report produced by the Small Urban and Rural Transit Center (SURLC Report 19-010), a fact disclosed to the editorial office at submission and stated here directly for readers. Fielding a national, cross-community-size survey of transit agencies—particularly securing meaningful participation from rural agencies, which are chronically under-represented in transportation research relative to their number—required a scale of outreach effort that is difficult to replicate and that we believe justifies renewed, peer-reviewed dissemination of the dataset even though no new data collection accompanies this article. Relative to the technical report, this article makes four contributions that are new: it reframes the 2018 data explicitly as a pre-pandemic baseline rather than a contemporary snapshot (Section 1 and Section 5.2); it situates the findings within the peer-reviewed literature on automated-vehicle and automated-bus acceptance, which had only begun to emerge at the time of the original report (Section 2.5); it identifies and corrects several data-reporting inconsistencies in the original report, including its response-rate calculation, and adds inferential statistical tests of the community-size differences that the original report described only descriptively (Section 3 and Section 4); and it interprets the 2018 baseline against automation-industry, workforce, and deployment developments through 2026, several of which are consistent with, and in some cases sharpen, the study’s original findings (Section 2.6 and Section 5.2).
International experience with bus transit automation both pre- and post-dates the U.S. survey reported here. European deployments were comparatively early and numerous: low-speed automated electric minibuses entered service or pilot operation in cities including Lyon, Helsinki, and Sion (Switzerland) beginning in the mid-2010s, and were the subject of dedicated state-of-the-art and operational reviews [16,17]. Reception in these settings has generally been favorable once services were operating—passenger surveys in Finland and Sweden reported broadly positive experiences, with residual concerns centered on in-vehicle security and the absence of onboard staff rather than the automated driving task itself [10,11,12]—a pattern this study’s U.S. transit agency respondents anticipated from the supply side (Section 4.6). Post-pandemic, international activity has continued to concentrate in similarly constrained, low-speed applications rather than open-road Level 4–5 deployment, consistent with the trajectory documented for the United States in Section 2.6. This international context suggests that the U.S. transit industry’s cautious, demonstration-led posture documented in this baseline was not an idiosyncratic U.S. pattern but part of a broader global trajectory toward attended, constrained-use automation in public transit.
2. Background and Literature Review
2.1. Community-Size Definitions
Consistent with U.S. Census Bureau definitions used by the FTA for its funding programs, this study defines rural communities as those with populations below 50,000; small-urban communities as those with populations between 50,000 and 200,000; and urban communities as those with populations above 200,000.
2.2. SAE Levels of Driving Automation
The National Highway Traffic Safety Administration’s Automated Driving Systems 2.0: A Vision for Safety adopts the Society of Automotive Engineers (SAE) taxonomy of driving automation, ranging from Level 0 (no automation) through Level 5 (full automation) [24]. Levels 1–2 encompass driver assistance and partial automation in which a human operator performs or supervises the driving task; Level 3 permits conditional automation with human fallback; and Levels 4–5 permit high and full automation without a human driver within (Level 4) or without (Level 5) operational design domain restrictions. In transit applications, Levels 1–2 correspond broadly to ADAS features—automated emergency braking, lane-keep assist, precision docking, curb avoidance—while Levels 4–5 correspond to driverless shuttle operations. This taxonomy is used throughout the survey and analysis.
2.3. Federal Transit Administration Initiatives
The FTA’s Office of Research, Demonstration and Innovation initiated a program to promote transit readiness for automation, with goals of conducting research for safe and effective deployments, resolving deployment barriers, leveraging technologies from other sectors, demonstrating market-ready technologies in real-world settings, and transferring knowledge to transit stakeholders [4]. These goals were operationalized in the five-year Strategic Transit Automation Research (STAR) Plan (2017–2022), developed through stakeholder consultation and use-case analysis. The STAR Plan spans collision-avoidance technologies for human-operated buses through full vehicle automation, organized in three inter-related work areas—enabling research, integrated demonstrations, and strategic partnerships—and five use cases: transit bus ADAS, automated shuttles, automated maintenance and yard operations, automated mobility-on-demand, and automated BRT [4].
2.4. Transit Automation Implementations in the United States as of 2018–2019
At the time of the survey, automated technology implementation in U.S. public transportation was advancing through pilot programs, public–private partnerships, FTA-led research, cooperative research programs, and the U.S. Department of Transportation’s automated driving system demonstration grants announced in early 2019. Lower SAE levels were typically deployed as ADAS on operator-driven buses, while Levels 4–5 appeared as low-speed driverless shuttles operating in constrained environments, generally with onboard safety attendants to address public safety concerns, educate riders, and build confidence [2,25]. Notable implementations included:
An FTA-funded ($4.2 million) demonstration of lane-assist technology for the Minnesota Valley Transit Authority BRT system, in which the vehicle alerts the operator to lane drift through visual and haptic (seat vibration) warnings and applies corrective steering if the operator does not respond [26];
An FTA-funded ($1.66 million) Pierce Transit demonstration of camera-based collision warning on 176 buses and automated braking on 30 buses [2];
Contra Costa Transportation Authority testing of two EasyMile EZ10 shuttles, progressing from a closed test facility to parking lots and a mixed-traffic road segment [25];
Jacksonville Transportation Authority plans to modernize the elevated Jacksonville Skyway with automated shuttles connected to street level, beginning with closed-facility testing of Navya and EasyMile vehicles [25];
University of Michigan operation of Navya shuttles at the Mcity test facility and subsequently on a two-mile mixed-traffic round-trip route [25];
A one-year City of Las Vegas pilot operating a Navya Arma shuttle on a downtown loop with mixed traffic and high pedestrian activity [2,3]; and Minnesota DOT testing of an EasyMile shuttle under snow and ice conditions at the MnROAD closed facility (December 2017–January 2018), followed by public demonstrations in Minneapolis ahead of the Super Bowl and in five nearby communities [27].
Collectively, these efforts were demonstrations and pilots rather than permanent revenue-service deployments. Communities piloting low-speed automated shuttles reported that pilots served an important public-education function, increasing comfort and familiarity with AV technology among the general public [3].
2.5. Prior Academic Literature on Automated-Bus Transit
Alongside the federal initiatives and demonstrations described above, the peer-reviewed literature on vehicle and bus transit automation was emerging at the time of the survey and has expanded substantially since. Foundational analyses of vehicle automation identified potential safety, congestion, and mobility benefits alongside cost, liability, licensing, security, and privacy barriers [1]. For the bus transit sector specifically, Ainsalu et al. [16] reviewed the state of the art of automated buses—including the low-speed electric minibuses deployed in European and U.S. pilots—covering automation technology, electrification, and legislation for first- and last-mile service, and Iclodean et al. [17] synthesized the technical characteristics and operational experience of autonomous shuttle buses in public transportation. Reviewing forty studies of fully autonomous buses, Azad et al. [15] found that empirical work concentrated on constrained shuttle deployments in urban and campus environments and identified agency-side adoption considerations among the gaps needing future research.
A second stream of scholarship examines user and public acceptance. Large international surveys found generally receptive attitudes toward higher levels of automation alongside persistent concerns about software reliability, security, and legal responsibility [7,8], and a review of stated-preference and choice studies confirmed that perceived safety, trust, and prior awareness are recurring determinants of intention to use automated vehicles [9]. Studies of passengers in operating driverless shuttle pilots reported broadly positive experiences, with residual concerns centering on in-vehicle security, emergency management, and the absence of onboard staff rather than the automated driving task itself [10,11], and surveys of riders in demonstration settings likewise reported favorable experiences and intentions to use, shaped by trust, perceived usefulness, and service attributes [12,13]. Of particular relevance to the present study, a stated-preference survey of Philadelphia-region transit users found that about two-thirds of respondents were willing to ride a driverless bus when a transit employee remained on board to monitor operations and assist customers, with willingness dropping sharply in the absence of onboard staff [14]. A parallel stream of agency-facing research examined the business case for automation directly: a contemporaneous Transportation Research Record analysis modeled the cost-effectiveness of partial and full bus automation and found that advanced driver assistance systems generally showed a strong business case, while full automation’s very large potential labor-cost savings were offset by considerable uncertainty over whether unstaffed operation is compatible with non-driving tasks such as customer assistance and fare collection—the same staffing question this survey’s respondents answered directly from the agency perspective [28].
A third stream addresses the mobility and accessibility stakes of automation. Full automation could substantially increase travel by non-drivers, older adults, and people with travel-restrictive medical conditions [6]—populations that constitute the core clientele of rural demand-response and ADA paratransit service. At the same time, people with physical disabilities hold significantly more ambivalent attitudes toward automated vehicles than the general population, reflecting concerns that include boarding, securement, and the absence of human assistance [29]. Institutional perspectives are comparatively scarce: planning scholarship documented that metropolitan planning organizations were slow to incorporate automation into long-range plans amid deep uncertainty [30], and reviews of the transit automation literature identify operator- and agency-side factors as underexplored [15]. National evidence on how transit agencies—particularly rural and small-urban operators—perceive, prioritize, and plan for automation therefore remains thin; the present study addresses this gap.
2.6. Developments Since the Survey (2019–2026)
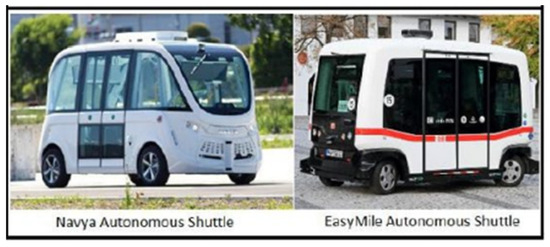
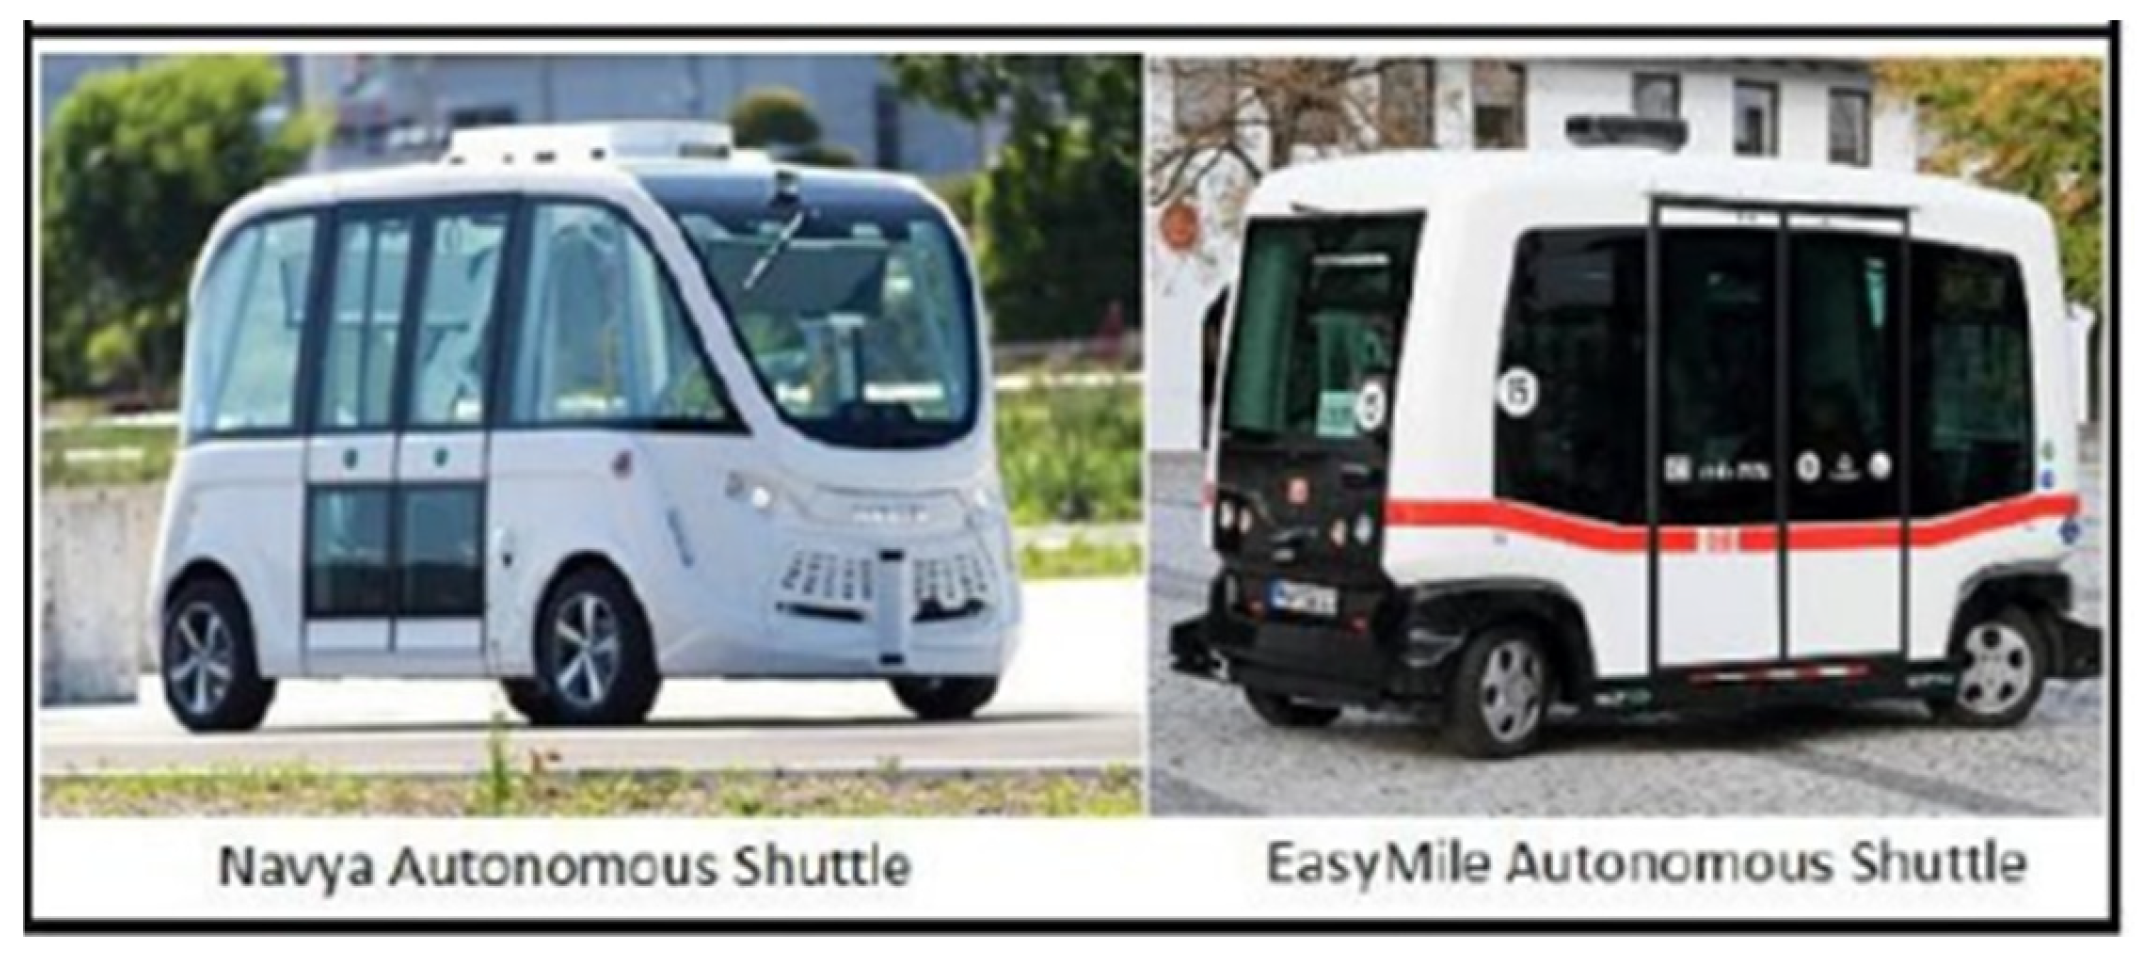
The transit automation landscape has shifted substantially since the survey was fielded, in ways that both are broadly consistent with, and in some cases sharpen, the concerns documented in this study. On the safety and reliability dimension, the National Highway Traffic Safety Administration in February 2020 suspended passenger operations for all sixteen EasyMile shuttles operating across ten U.S. cities after a passenger was injured when a shuttle in Columbus, Ohio’s Linden LEAP pilot braked suddenly at 7.1 mph [21]. The suspension was lifted in May 2020 only under a safety enhancement plan that included seat belts, signage and audio warnings about sudden stops, and safety-operator training. The shuttle manufacturing segment subsequently contracted: Local Motors, developer of the Olli shuttle, ceased operations in January 2022 [22]; Optimus Ride wound down the same year; and Navya, one of the two suppliers most familiar to 2018 respondents, entered receivership in 2023 [23]. Figure 1 shows examples of the autonomous shuttles that were being referenced here.
Figure 1.
Fully autonomous shuttles used in public transit operations. Source: manufacturer product imagery, Navya and EasyMile.
On the demand side, the driver-shortage rationale that rural and small-urban respondents articulated intensified into an industry-wide crisis. APTA’s 2022 workforce study found that 96% of surveyed agencies were experiencing a workforce shortage, 84% reported service impacts, employment offers were rejected at twice the all-industry rate, and bus operators were the hardest position to fill [18]—elevating workforce mitigation from a secondary to a primary motivation for transit automation interest.
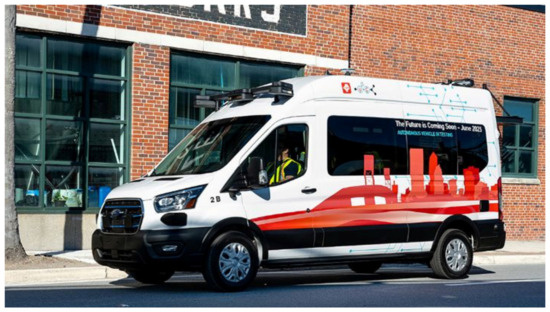
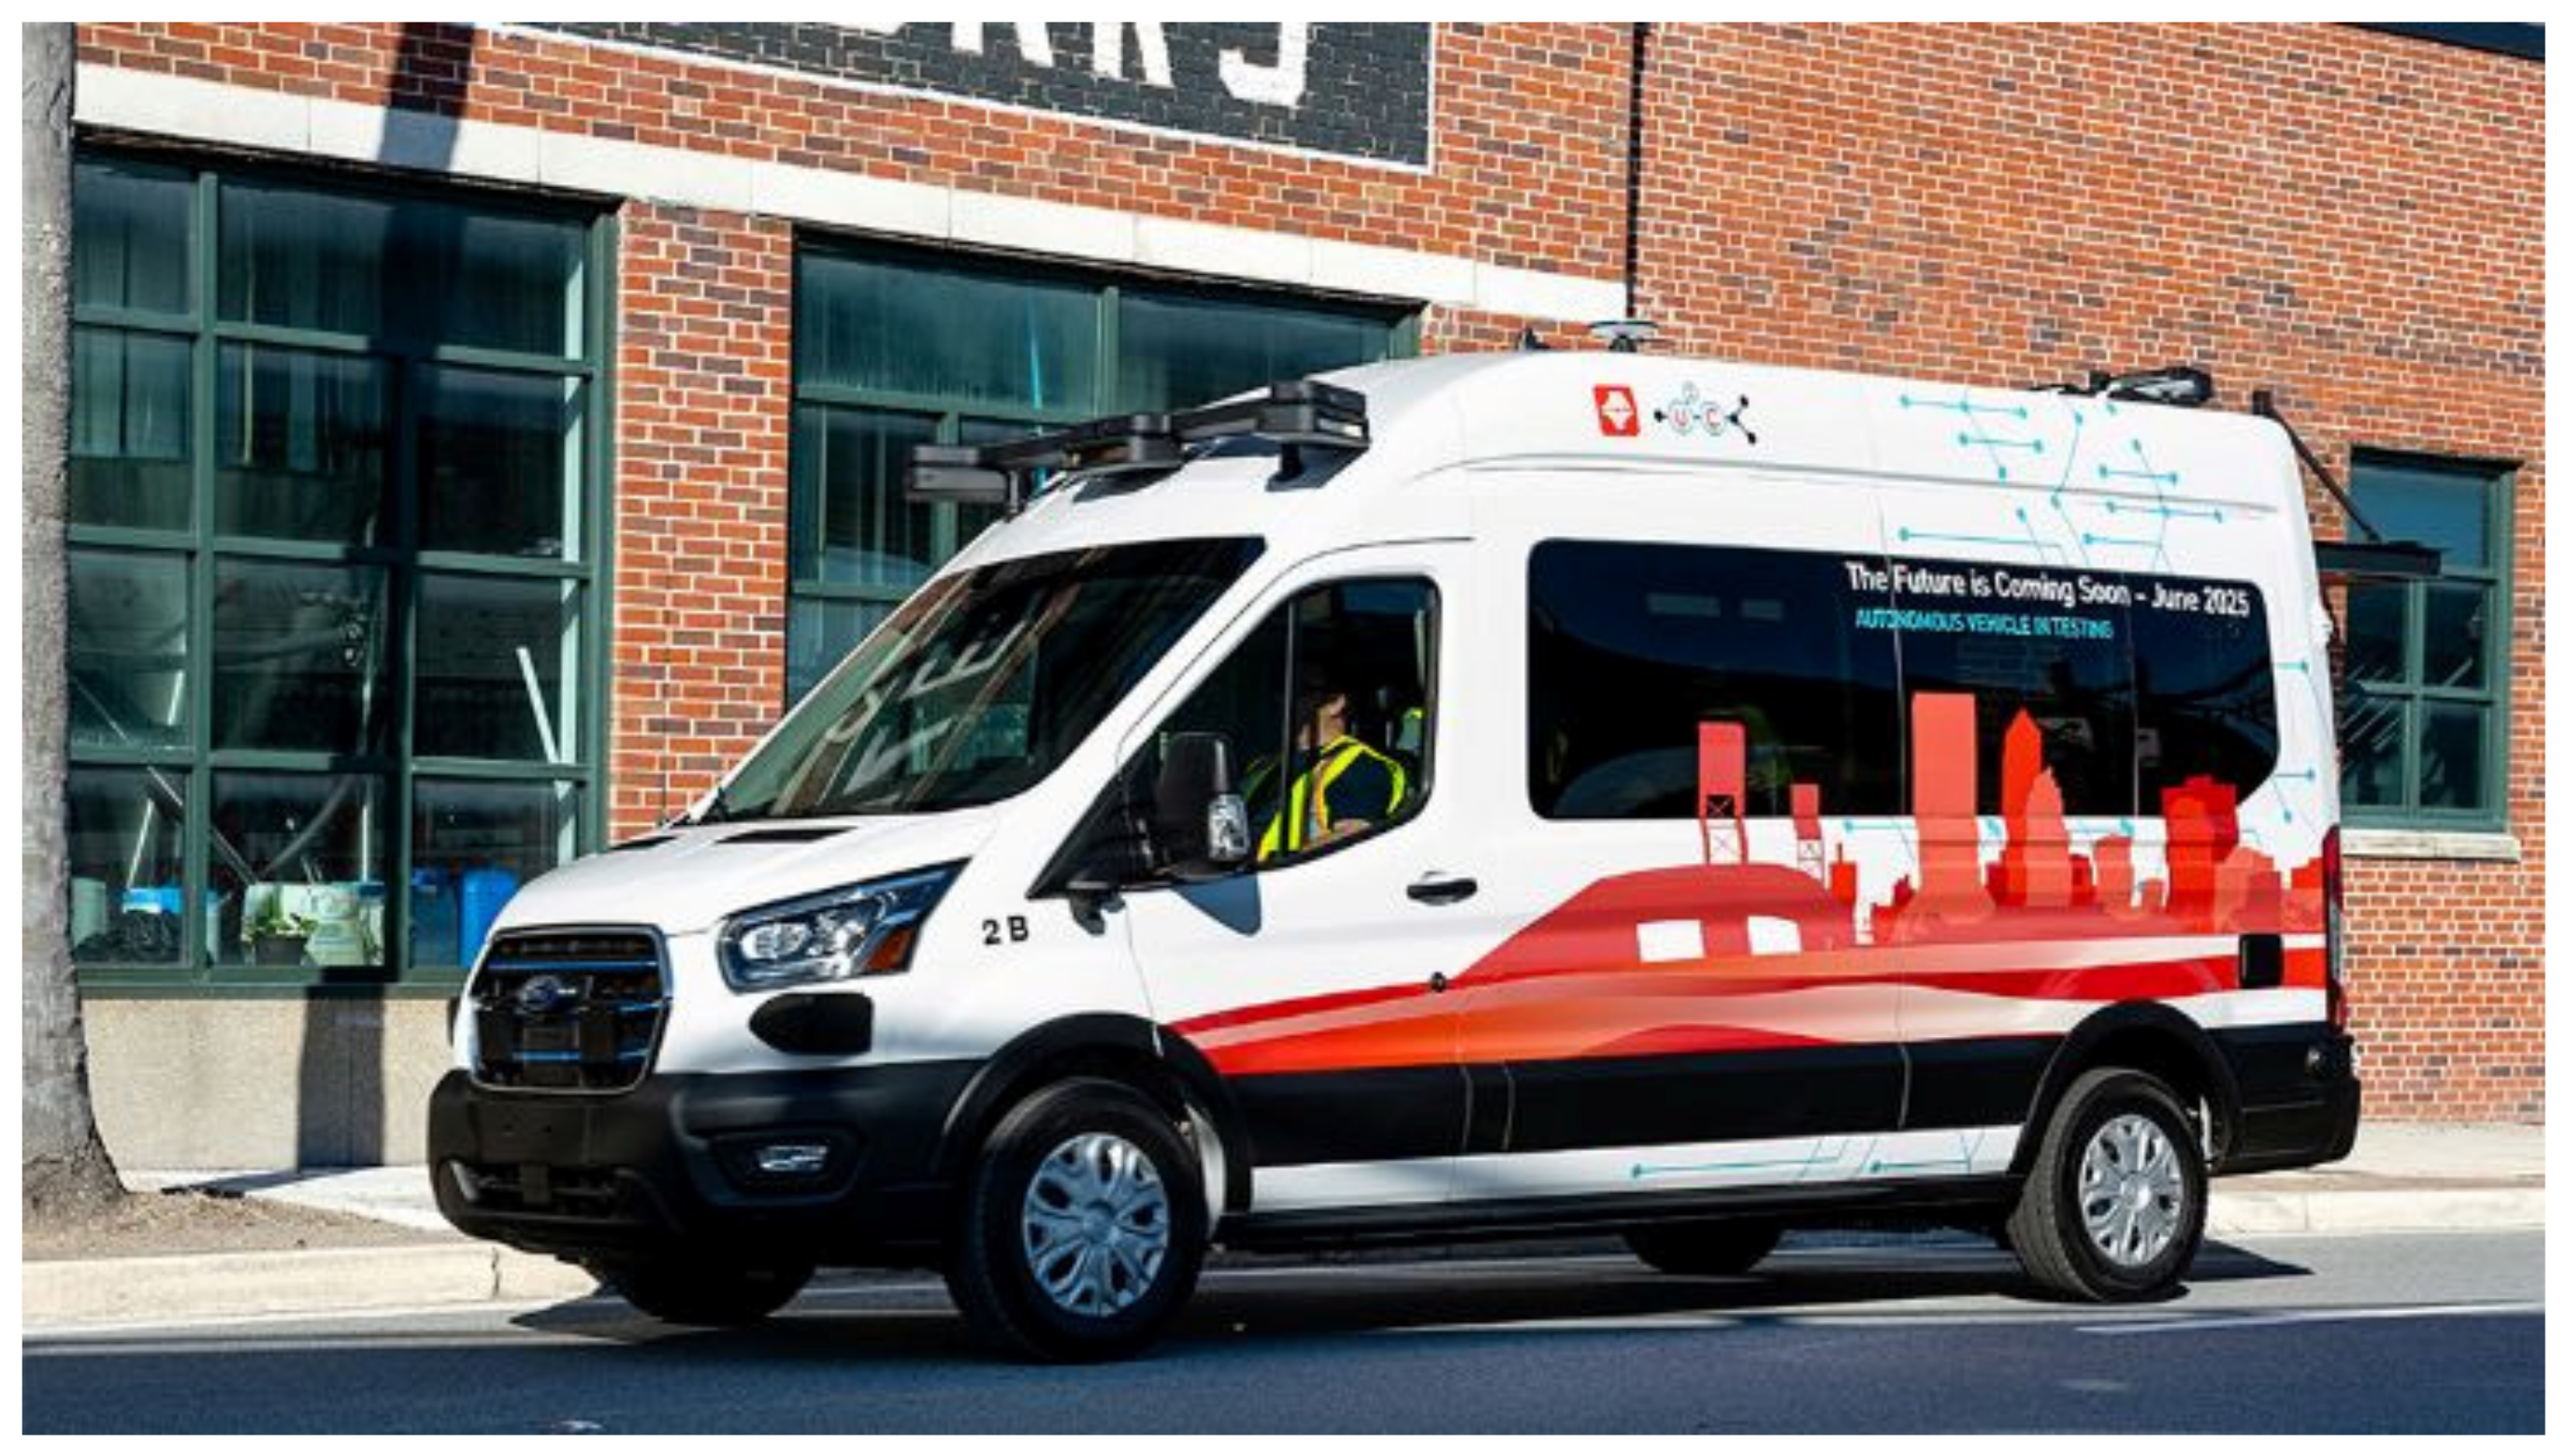
Deployment activity, meanwhile, concentrated in precisely the constrained-use cases this survey identified. The Jacksonville Transportation Authority’s Skyway modernization plans, in early testing at the time of the survey, evolved into the Ultimate Urban Circulator (U2C) program; its first phase, the NAVI service, launched in June 2025 as the first autonomous-vehicle public transit revenue service in the United States, operating fourteen electric, ADA-compliant Ford E-Transit vehicles equipped with an automated driving system (refer Figure 2) on a 3.5-mile downtown circulator corridor under a five-year operations and maintenance contract with a turnkey AV operator, with later phases planned to convert the elevated Skyway into an AV-exclusive corridor [19].
Figure 2.
ADA-compliant Ford e-Transit equipped with an automated driving system used for Ultimate Urban Circulator (U2C) program. Source: Autonomous Vehicle International.
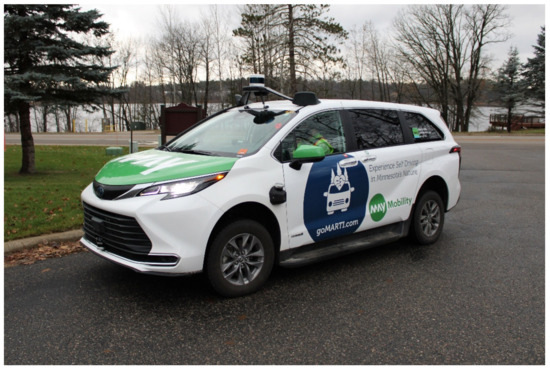
In the rural context—where this survey found the evidence base thinnest and demonstrations most demanded—the goMARTI pilot launched in Grand Rapids, Minnesota, in October 2022 as the first large-scale automated transit demonstration in a rural, harsh-winter environment, providing free on-demand rides with five automated vans (refer Figure 3) (three wheelchair-accessible) across a 17-square-mile area with more than 70 pick-up and drop-off points; the 18-month pilot exceeded 10,000 riders, was extended, and received a $9.3 million Federal Highway Administration grant for expansion [20]. Notably, both deployments retain onboard staff or remote supervision arrangements, and goMARTI vehicles carry an onboard operator to ensure safe operation and assist passengers—directly consistent with the expectation, documented in this survey, that Level 4–5 transit vehicles would continue to carry an operator or agent.
Figure 3.
Automated van used for providing free on-demand rides in rural Minnesota. Source: KFF Health News.
3. Materials and Methods
The study methodology proceeded in three stages. First, a scan of the literature identified bus transit automation technologies available in the United States and gauged industry interest through current implementations and planned projects. The scope was restricted to bus and shuttle transit operations; rail and ferry modes were excluded. Second, informed by the literature scan, a survey questionnaire was developed to gather input from rural, small-urban, and urban transit agencies on: familiarity with transit automation technologies and current industry implementations; interest in adopting automated technologies for different transit service types; potential implementation opportunities within the respondent’s agency; and perceived advantages and disadvantages of automation for fixed-route, demand-response, and Americans with Disabilities Act (ADA) paratransit services, as well as other transit and transportation services. Several instrument items, including the advantages, concerns, and procurement-challenge questions summarized in Section 4.4 and Section 4.6, were open-ended. Open-ended responses were reviewed by the research team and grouped into recurring themes based on the frequency with which similar sentiments were expressed across respondents; this was an informal thematic grouping rather than a formal qualitative content-analysis procedure with predefined codes, intercoder reliability checks, or documented saturation criteria, and the counts and orderings reported for these items (e.g., “most commonly cited”) reflect the relative frequency of the identified themes rather than a formal coding frequency count. We note this limitation explicitly in Section 5.4.
Third, the survey instrument underwent expert review. Seven experts in transit, transit vehicle automation, and related organizations participated in the review, and the study was coordinated with three partner organizations—the FTA, CUTR, and the John A. Volpe National Transportation Systems Center. Because the study’s objectives align with the FTA STAR Plan research aims (refer Table 1), representatives of the FTA’s Office of Research, Demonstration and Innovation reviewed the instrument to ensure the information gathered would be useful to a national transit audience; CUTR, which had been planning a similar study, coordinated its efforts with SURTC; and Volpe researchers assisted with instrument review. The instrument was revised based on this feedback.
Table 1.
The structure of the FTA Strategic Transit Automation Research (STAR) Plan, FY2017–FY2022, adapted from [4].
Table 1 summarizes the three work areas and illustrative milestones; the original graphical roadmap, reproduced from FTA [4], is available in the source document.
The final instrument was hosted on the Qualtrics platform and distributed in November 2018, primarily through SURTC’s national database of rural, small-urban, and some urban transit agencies, and additionally through the Community Transportation Association of America’s (CTAA) bi-weekly FastMail publication. The survey targeted each agency’s director of planning or chief operating officer. Approximately 1700 agencies were contacted; 258 agencies responded, for a response rate of 15.2%. Respondents comprised 157 rural, 67 small-urban, and 34 urban transit agencies. The 1700 figure reflects the size of SURTC’s outreach database and the CTAA distribution list rather than a count of confirmed successful deliveries and should be read as approximate; the response rate above (258/1700) also corrects a computational error in the original 2019 technical report, which had stated the rate as 6.8% despite reporting the same two underlying figures. All the results reported below are descriptive statistics disaggregated by community size; item-level sample sizes vary due to item nonresponse. Most items reflect the full community-size samples (157 rural, 67 small-urban, 34 urban), but a block of items—including agency awareness (Table 3) and fully automated shuttle operating plans (Table 4)—share a smaller, internally consistent effective base (135 rural, 63 small-urban, 30 urban). We identified this shared base by reconciling reported percentages against the one item (Table 4) for which the original report also published raw counts, and confirming that back-calculated counts for other items in the same survey block summed exactly to those totals; the effective base is reported directly in each affected table. Two mutually exclusive-category items with a fully reconciled base (Tables 3 and 4) are additionally tested for association with community size using chi-square tests of independence, reported in Section 4.
Since the preceding round of revision, the original raw survey response file (n = 264 exported rows; 258 with a valid community-size classification, matching the analytic sample) was recovered and used to verify and extend the analysis reported below. Raw data confirmed the exact effective base for every survey item directly, superseding the back-calculation described above, and made it possible to compute chi-square tests of independence for every single-select item comparing community size, not only Tables 3 and 4. Section 4.1, Section 4.2, Section 4.3 and Section 4.4 now report seven such tests in total. Raw data were also used to systematically check every cell of Table 7 (48 cells across three community sizes, eight technologies, and two time horizons) by recomputing each percentage directly from item responses; 47 of 48 cells reproduced the previously reported values to within rounding, and the one exception (rural curb avoidance, ≤5 years) is corrected in Table 7 with the recomputation documented in its footnote. Finally, open-ended responses to the procurement-challenges item (Q20; Section 4.4) were additionally coded using a reproducible keyword-matching procedure across ten a priori themes, reported alongside the informal thematic grouping described above; this supplements rather than replaces that description, since it was applied only to one item and still involves researcher-specified keyword lists rather than independent double-coding.
For full transparency, exact effective bases for every table are as follows. Table 2 (service types), Table 5 (potential shuttle uses), and Table 6 (preferred service for automation) use the full community-size samples (157 rural, 67 small-urban, 34 urban), as these items permitted multiple responses and were not subject to the item-level nonresponse described above. Table 3’s four awareness components have similar but not identical bases: 135/63/30 (SAE levels), 134/63/30 (STAR Plan), 132/63/30 (fully automated shuttles), and 127/57/28 (ADAS), rural/small-urban/urban respectively. Table 4 (shuttle operating/planning status) uses 135/63/30. The belief-in-benefit item (Section 4.3) uses 127/57/28. Table 7 (technology-adoption timeline) has the most granular item-level variation, since respondents could skip individual technology rows within the Q16/Q17 matrix items: effective bases range from 66 to 102 (rural), 42 to 51 (small-urban), and 27 to 28 (urban) at the ≤5-year horizon, and from 79 to 105 (rural), 47 to 52 (small-urban), and 27 to 28 (urban) at the 5–10-year horizon, depending on the specific technology. Table 8 (procurement timeline) uses 120/52/27.
4. Results
A total of 258 transit agencies provided input on bus transit automation technologies, current implementations, and near-term implementation interest. Responding rural agencies predominantly operated demand-response service (72.0%), while responding small-urban and urban agencies predominantly operated traditional fixed-route service (83.6% and 91.2%, respectively, offered fixed-route among their services). (The 79.1% figure given for small-urban agencies in an earlier draft corresponded instead to ADA complementary paratransit, per Table 2, and has been corrected here.) Table 2 summarizes the bus transit service types operated by respondents; agencies could select multiple service types.
Table 2.
Bus transit service types operated by responding agencies (multiple responses permitted).
4.1. Awareness of Transit Automation Technologies
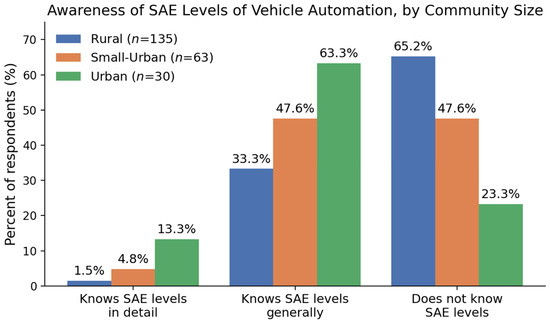
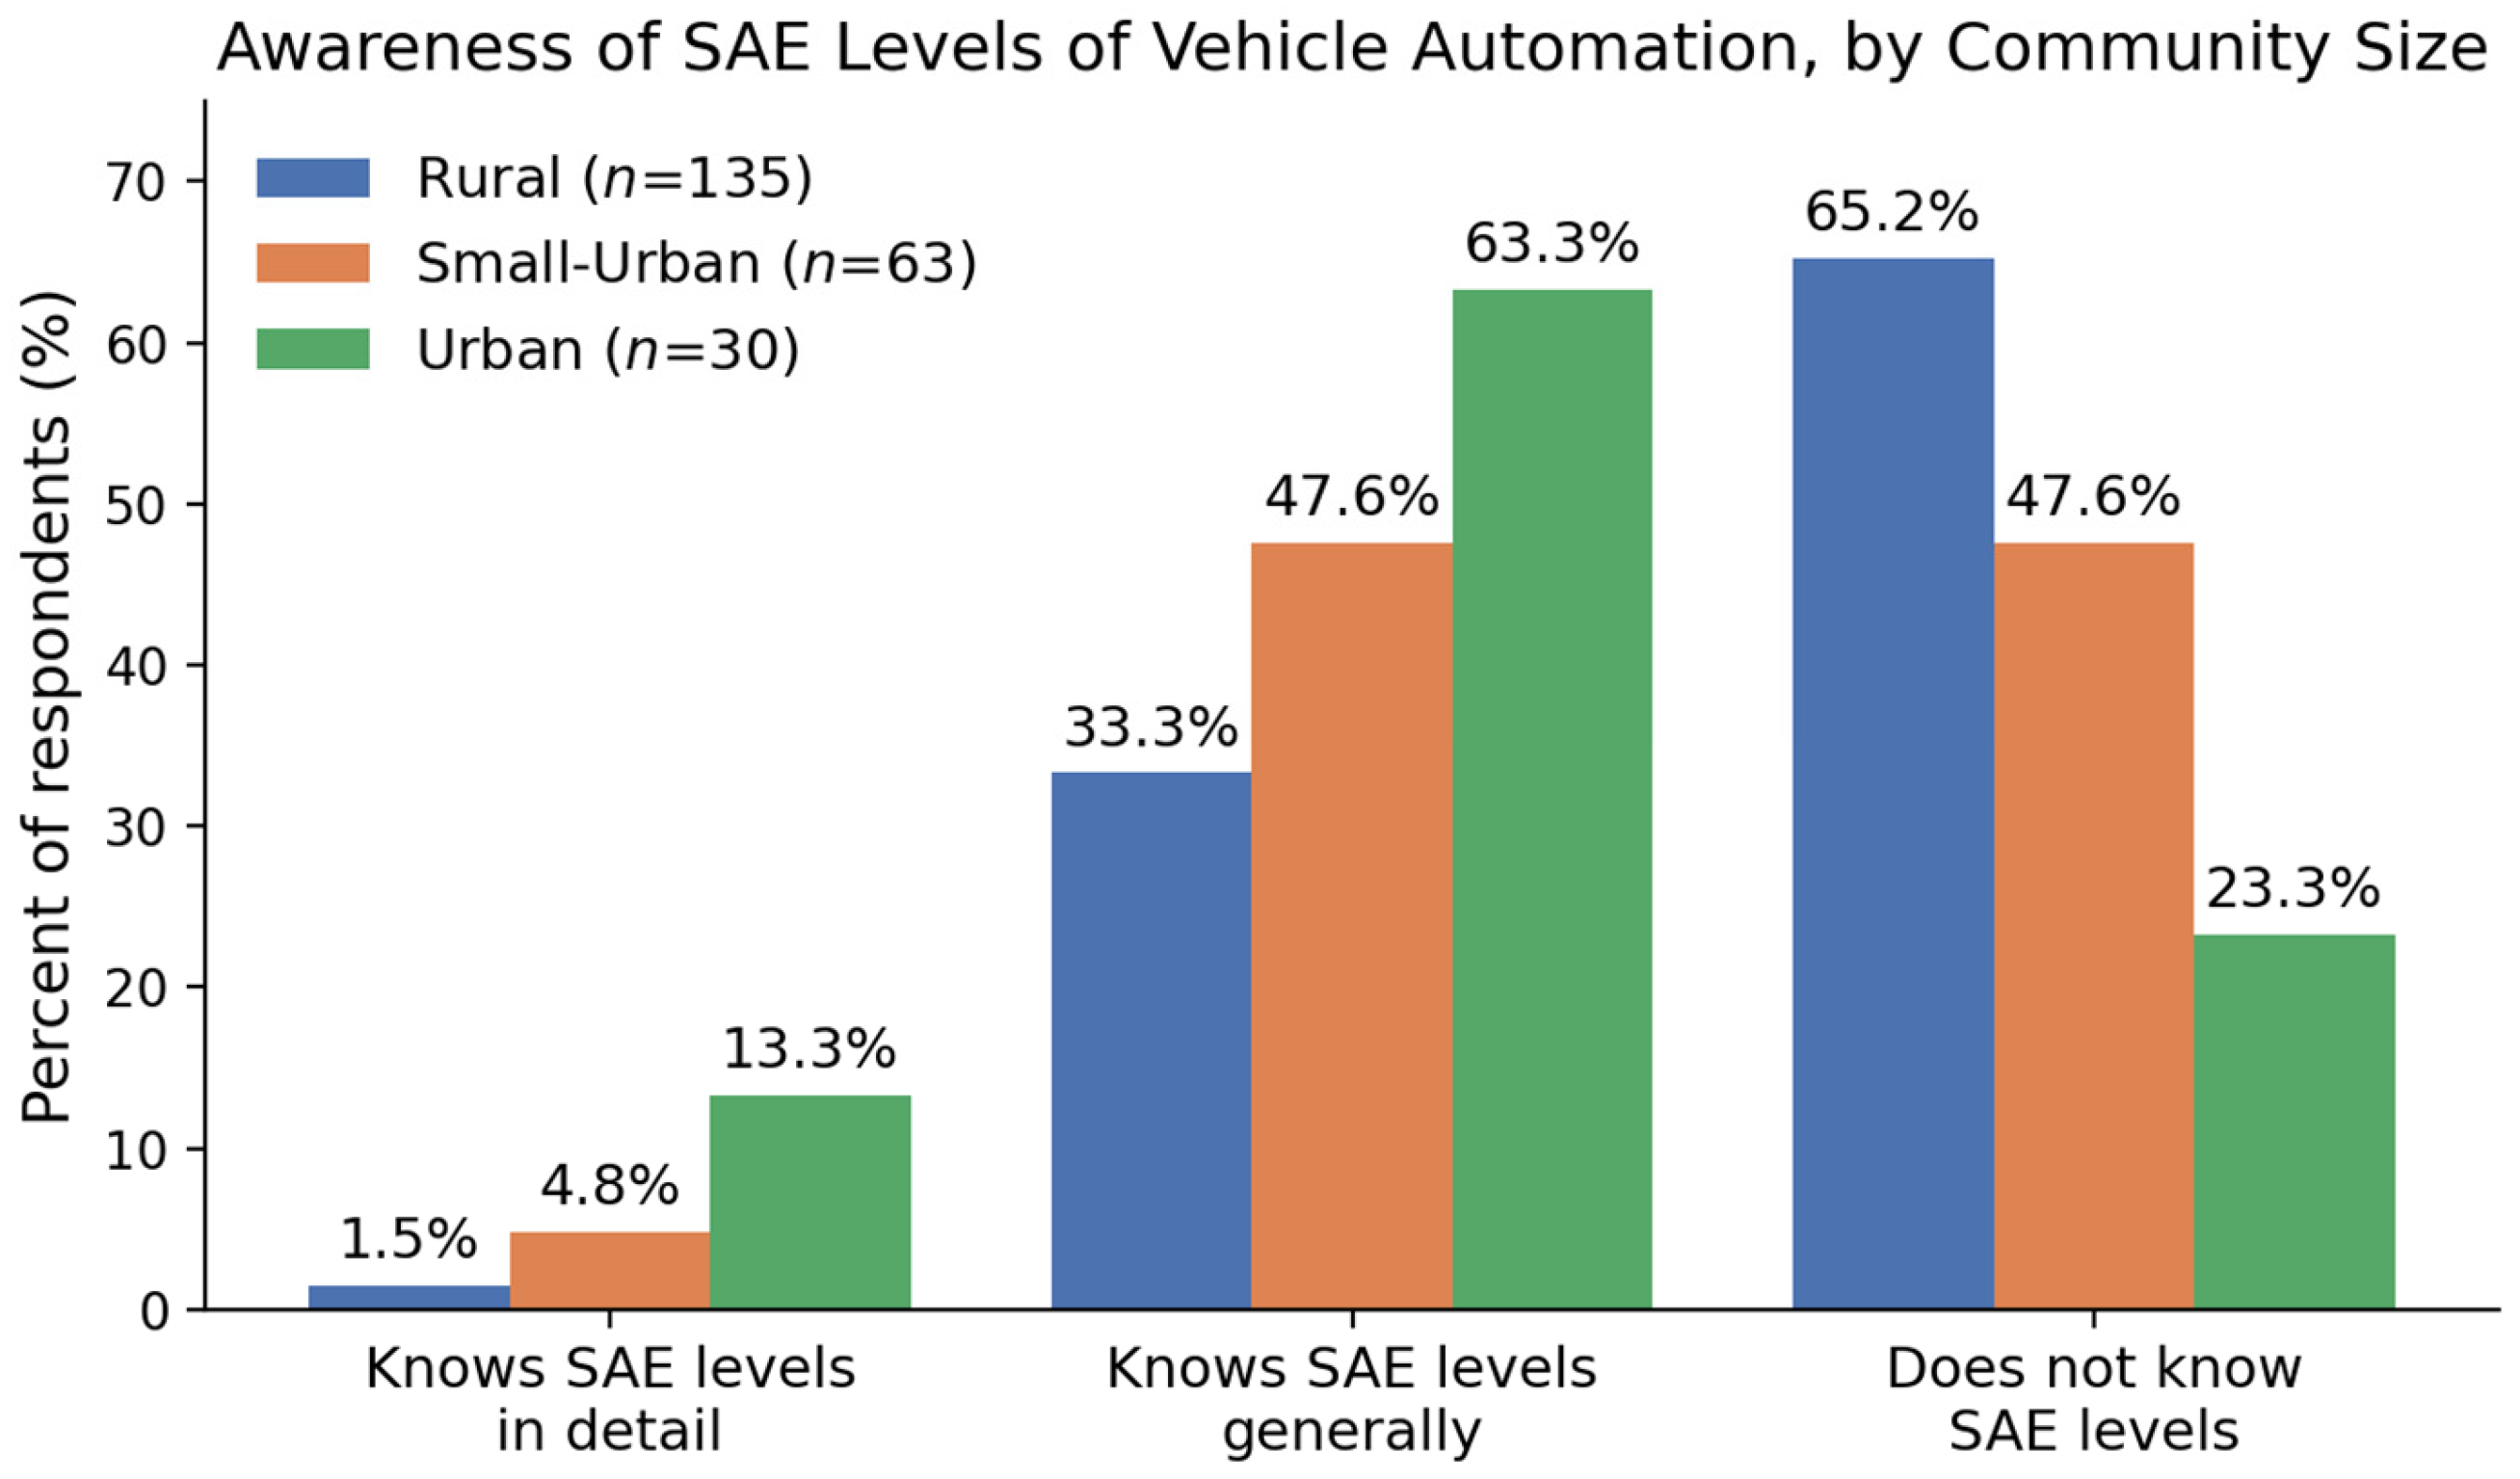
Three items gauged baseline awareness: knowledge of the SAE levels of vehicle automation, familiarity with the FTA STAR Plan, and familiarity with commercially prominent fully automated shuttles and transit ADAS. A consistent awareness gradient by community size was observed (Table 3). Most rural agency respondents (65.2%) did not know the SAE levels, whereas most urban respondents knew them in detail (13.3%) or generally (63.3%). Familiarity with the FTA STAR Plan was low among rural (12.7%) and small-urban (15.9%) agencies but reached 43.3% among urban agencies. This association between community size and STAR Plan familiarity was statistically significant (χ2(2, n = 227) = 16.0, p < 0.001, Cramér’s V = 0.27).
Table 3.
Awareness of transit automation technologies by community size.
Awareness was markedly higher for fully automated shuttles (e.g., Navya, EasyMile), whose launches in Las Vegas, at the University of Michigan, and elsewhere had received substantial media coverage prior to the survey: 31.1% of rural, 55.6% of small-urban, and 83.3% of urban agencies were aware of these shuttles. This association was also statistically significant (χ2(2, n = 225) = 31.0, p < 0.001, Cramér’s V = 0.37). Awareness of transit buses with ADAS features (SAE Levels 1–2; e.g., narrow-lane/shoulder operations, automatic-braking collision avoidance, precision docking, platooning, curb avoidance) followed a similar pattern, and 10.7% of urban agencies reported operating or planning to operate buses with ADAS features. Collapsing the four response categories into any awareness (“yes,” in any of its three forms) versus none, ADAS awareness was also significantly associated with community size (χ2(2, n = 212) = 29.0, p < 0.001, Cramér’s V = 0.37). These results are consistent with market-ready technologies and highly publicized demonstrations being associated with greater awareness among agencies of all sizes; because awareness was not measured before these demonstrations occurred, the survey cannot establish that the demonstrations caused the observed awareness levels. Similarly, successful demonstrations of sophisticated technologies appear associated with greater confidence among operators and potential riders in the qualitative responses discussed below, though this too is an association rather than a tested causal claim.
Because Table 3’s three awareness categories are mutually exclusive and its effective base (135 rural, 63 small-urban, 30 urban; Section 3) is fully reconciled against the original report’s raw counts, awareness of SAE automation levels was tested for association with community size using a chi-square test of independence. The association was statistically significant and moderate in strength (χ2(4, n = 228) = 23.8, p < 0.001, Cramér’s V = 0.23); Figure 4 displays the same data graphically. This result is consistent with the awareness gradient described above and is unlikely to reflect a chance pattern in this sample; as with the other chi-square results reported in this article, it establishes association with, not causation by, community size (Section 5.4).
Figure 4.
Awareness of SAE levels of vehicle automation, by community size (Table 3 data).
4.2. Fully Automated Shuttles: Current Operations and Potential Applications
As of November 2018, one responding small-urban agency and four urban agencies reported operating or planning to operate fully automated shuttles in the near future, including a Toledo Area Regional Transit Authority three-year grant-funded pilot and a Metropolitan Transit Authority of Harris County (Houston METRO) pilot circulator on the Texas Southern University campus with a planned connection to light rail. An additional 10.4% of rural, 12.7% of small-urban, and 30.0% of urban respondents indicated they might operate fully automated shuttles in the near future (Table 4). Most agencies—89.6% rural, 85.7% small-urban, and 56.7% urban—had no near-term plans. This association between community size and operating/planning status was also statistically significant (χ2(4, n = 228) = 30.2, p < 0.001, Cramér’s V = 0.26), using the exact response counts reported in Table 4.
Table 4.
Agency operation or planned operation of fully automated shuttles, by community size.
Rural agencies’ disinterest was grounded in four recurring rationales: insufficient supporting infrastructure in rural communities; systems too small to afford fully automated shuttles; ridership insufficient to support such service; and, importantly, a clientele requiring personalized service—including assistance boarding and alighting—that a driverless vehicle cannot provide. A minority of rural agencies expressed curiosity about automated shuttles’ potential given their communities’ unique constraints, or willingness to explore opportunities contingent on funding. Small-urban agencies exhibited a similar pattern. Urban agencies were comparatively proactive: many had implemented shuttles, secured grants for pilots, or were pursuing funding, and most had at least begun internal discussions on integrating automated shuttles. Urban agencies not actively pursuing shuttles were typically waiting for results from other demonstrations, delayed by funding constraints, or deferring consideration.
When asked where fully automated shuttles could potentially be used, agencies were more favorable toward non-traditional applications—circulators, campus and airport shuttles, and service to low-density areas—than toward traditional bus services, and interest in using shuttles for ADA paratransit was minimal across all community sizes. Table 5 ranks the top five potential applications by community size. Downtown or business park circulators, university campus shuttles, and circulator bus service ranked highly in all community sizes, indicating that constrained, repetitive, lower-conflict route environments were viewed as the natural entry point for SAE Level 4–5 transit vehicles.
Table 5.
Top five potential transit service applications for fully automated shuttles by community size.
4.3. Interest in Transit Automation and Preferred Services for an Automated Fleet
Conditional on the technology being ready to deploy, 30.7% of rural, 54.4% of small-urban, and 89.3% of urban agencies believed transit vehicles with automated functions would benefit some form of their operations; 33.5%, 31.6%, and 10.7%, respectively, were unsure. This association between community size and belief in automation’s benefit was statistically significant (χ2(4, n = 212) = 37.9, p < 0.001, Cramér’s V = 0.30). The leading rationale across all community sizes was the potential safety benefit of features such as emergency braking, curb avoidance, narrow-lane operation, and advanced warning of conflicts with pedestrians, bicyclists, and other vehicles. Rural and small-urban agencies additionally cited: the persistent difficulty of finding qualified drivers, which automation could mitigate; improved curb positioning for easier boarding; more efficient and reliable service; potential for cost-efficient service to low-density and remote areas; and reduced operating costs. Urban agencies additionally cited schedule efficiency, sustainability, and narrow-lane applications.
When asked which service(s) they would choose if introducing some level of automated fleet, small-urban (52.6%) and urban (50.0%) agencies most frequently selected traditional fixed-route service, while rural agencies most frequently selected demand-response for the general public (33.9%)—consistent with rural agencies’ service mix rather than a distinct technology preference (Table 6). The reasons cited for fixed-route’s suitability included service consistency that minimizes conflict exposure, fixed stop locations that simplify planning, the possibility of narrowed or exclusive lanes, the potential to increase service levels with driverless operation, and its status as comparatively the easiest service to automate. Specific service concepts of interest included downtown circulators, hospital and university campus shuttles, airport shuttles, and park-and-ride shuttles.
Table 6.
Preferred service(s) for introducing some level of automated fleet.
4.4. Adoption Timelines and Procurement
Table 7 summarizes the share of agencies anticipating use of each automation technology within 5 years and within 5–10 years. Three ADAS technologies dominated near-term intentions in every community size: collision avoidance (41.9% rural, 61.5% small-urban, and 75.0% urban within 5 years), curb avoidance, and lane-keep assist. Technologies tied to specialized service environments—precision docking, narrow-lane/shoulder operations, platooning, automated maintenance and yard operations, and SAE Level 4/5 vans and buses—attracted lower but non-trivial interest, concentrated among agencies operating the relevant services (e.g., BRT operators for docking and platooning; circulator and campus-shuttle operators for Level 4/5 vehicles). Anticipated adoption increased across all technologies over the 5–10-year horizon, and demand for automation technologies generally increased with community size.
Table 7.
Share of agencies anticipating use of transit automation technologies, by horizon.
Following recovery of the original raw survey file, we recomputed this value directly: among the 97 rural agencies that answered this item, 31 selected “Likely” or “Very likely” (31/97 = 32.0%), the value now reported in the table. This computation uses the identical method (percentage of item respondents selecting “Likely” or “Very likely”) that reproduces all other 47 cells in Table 7 to within rounding error, and is consistent with the original 2.9% figure having been an isolated data-entry error in the 2019 technical report rather than a feature of the underlying responses.
Procurement intentions lagged usage intentions (Table 8). Only 2.5% of rural, 7.7% of small-urban, and 18.5% of urban agencies planned to procure a vehicle with some level of automation within 2 years; the modal rural response was a horizon beyond 15 years (44.2%), while the modal small-urban and urban response was 5–10 years. This association was also statistically significant (χ2(8, n = 199) = 31.3, p < 0.001, Cramér’s V = 0.28), consistent with a shorter procurement horizon among agencies in larger communities.
Table 8.
Timeline for procuring transit vehicle(s) with some level of automation.
Agencies identified eight cross-cutting procurement challenges: (1) funding, given very high early-stage vehicle costs; (2) low public acceptance and perceived safety; (3) uncertain technology reliability; (4) potential objections from transit and local labor unions; (5) difficulty hiring and training qualified operators and maintenance professionals; (6) the absence of fully ADA-compliant vehicles among higher-SAE-level offerings; (7) uncertain insurance and liability requirements; and (8) remaining useful life in existing fleets that forecloses near-term replacement. A keyword-based frequency count across the 169 open-ended responses to this item corroborates funding as the dominant concern by a wide margin: cost- or funding-related language appeared in 55.0% of responses (93/169), compared with 11.8% for safety/reliability, 8.3% each for public acceptance/trust and for labor/union/job-security language, 8.3% for rural- or ridership-specific barriers, 6.5% for physical or digital infrastructure, 5.9% for maintenance/technical-staffing capacity, 4.7% for insurance/liability, 4.1% for ADA/passenger assistance, and 1.8% for regulatory/policy language (responses could match more than one theme). Small-urban agencies additionally reported unwillingness to bear early-adopter risk and the inability to fund even basic service and infrastructure, placing advanced technology out of reach. Rural agencies reported a further distinct set of barriers: state-mediated funding and procurement that requires state agency buy-in before automation can be incorporated; lacking digital infrastructure (Wi-Fi, GPS, cellular service); lacking physical infrastructure (curbs, lane markings); natural barriers such as mountainous terrain, snow, and ice; the absence of successful rural implementation examples; limited options for automating demand-response service; low confidence among older riders; and limited staff knowledge of available automated vehicles.
4.5. Technical Assistance and Research Needs
Agencies indicated substantial need for technical assistance across all offered formats—topical webinars, example requests for proposals, face-to-face assistance, and a one-stop information website—with urban agencies expressing the greatest demand (e.g., 56.7% for webinars and 60.0% for example RFPs). Respondents additionally suggested site visits, user-experience exchanges with successful automated transit systems, and demonstrations at user conferences as mechanisms to build knowledge and confidence.
Safety was the most frequently identified research need in every community size (67.4% rural, 69.8% small-urban, 80.0% urban)—mirroring its role as the leading motivation for adoption. Other priority research areas, in approximate order of importance, were capital and operating costs and cost-effectiveness; human factors (users and operators); barriers (laws, regulations, policies); labor issues; policy; guidelines and standards; ADA operations; rural use; market analysis; and BRT applications. Notably, research on rural use of transit automation was the top-ranked need identified specifically by rural agencies (72.6%), underscoring the thin evidence base for automation outside metropolitan contexts.
4.6. Perceived Advantages and Concerns by Service Type
4.6.1. Fixed-Route Service
For fixed-route buses with automation at any level, agencies most commonly cited: enhanced safety; reduced human error; improved on-time reliability; improved cost efficiency through reduced operating costs (Levels 4–5); increased service levels (Levels 4–5); mitigation of driver shortages (Levels 4–5); and operational efficiency from ADAS features such as narrow-lane operation, curb avoidance, docking, and automatic braking. A consistent qualitative theme was a bifurcated mental model: Levels 1–3 improve safety by assisting the driver, while Levels 4–5 improve cost efficiency by reducing operator expense and enabling extended service spans. Even for Levels 4–5, however, agencies expected that vehicles would still require an onboard operator or agent for focused customer support and monitoring of the operating environment.
Concerns for fixed-route automation included: an unproven safety record; high capital cost; low acceptance among drivers, riders, and the general public; labor union pushback; a scarcity of qualified maintenance technicians; inadequate street design and a lack of dedicated lanes; roadway environment maintenance; uncertain technology reliability, including winter weather performance; job losses; ADA compliance and passenger assistance at Levels 4–5; liability exposure; the inability of Level 4–5 vehicles to respond to sudden detours and road closures; technical glitches leading to injuries and litigation; loss of the human element in service; and cybersecurity threats. Several respondents raised the risk of drivers over-relying on assistance technology at the expense of their skills, while a minority viewed automation as an inevitable trend to be embraced and planned for.
4.6.2. ADA Paratransit and Demand-Response Service
For ADA paratransit and demand-response vehicles, the most commonly cited advantages were enhanced safety, the ability to reach more people and expand demand-response service, and reduced operating costs—several respondents noted that Level 4–5 vehicles could be particularly cost-effective for low-volume demand-response service and for reaching geographically isolated areas if reliable. Concerns centered on safety; the absence of a driver to assist passengers—including riders with cognitive challenges who rely on operators for wayfinding and stop reminders, and situations requiring welfare checks when a rider fails to appear; funding; maintenance knowledge; uncertain applicability in rural areas; and accommodation of wheelchair lifts and securement systems. Concerns about maintaining a human role for passenger assistance—variously described by respondents as the need for hands-on boarding assistance, welfare checks, wayfinding help for riders with cognitive impairments, and “the human element” of service—recurred across these open-ended responses more often for ADA paratransit and demand-response service than for fixed-route service, consistent with the greater personal-assistance demands of these service types; this pattern was identified through the informal thematic grouping described in Section 3 rather than a systematic frequency count, and should be read as a qualitative theme rather than a quantitatively established finding. A substantial share of rural agencies reported being unsure or insufficiently knowledgeable to assess advantages or concerns for any service type, consistent with the awareness gradient in Section 4.1.
5. Discussion
5.1. Principal Findings
Four findings stand out from this pre-pandemic national baseline. First, awareness of transit automation scaled sharply with community size, but publicity closed part of the gap: agencies of all sizes were far more familiar with heavily publicized automated shuttles than with the formal SAE taxonomy or the FTA STAR Plan, suggesting that visible demonstrations are the industry’s dominant channel of technology awareness. Second, safety occupied a dual role—as the leading motivation for adoption and simultaneously the leading identified research gap—indicating that agencies believed in automation’s safety promise in principle while lacking the evidence to act on it, particularly for SAE Levels 4–5 outside large urban environments. Third, agencies exhibited a consistent bifurcated model of automation value: Levels 1–3 as safety-enhancing driver assistance suitable for near-term adoption (led by collision avoidance, curb avoidance, and lane-keep assist), and Levels 4–5 as cost efficiency plays confined to constrained-use cases such as circulators and campus shuttles. Fourth, and perhaps most consequential for vehicle and service design, agencies across community sizes expected Level 4–5 transit vehicles to retain an onboard operator or agent for customer support and environment monitoring—implying that the labor-cost savings central to many automation business cases may be substantially smaller in transit than in other mobility sectors, especially for ADA paratransit and demand-response services where passenger assistance is integral to the service. This agency-side expectation converges with rider-side evidence in the peer-reviewed literature: transit users’ willingness to ride driverless buses rises markedly when an employee remains on board [14], shuttle passengers’ residual concerns center on in-vehicle security and emergency management rather than the driving task [10,11], and people with physical disabilities—core paratransit clientele—hold notably more ambivalent attitudes toward automated vehicles than the general population [29].
The rural results merit particular emphasis given how rarely rural agencies are represented in transit automation research. Rural barriers are not merely scaled-down urban barriers: state-mediated procurement removes adoption authority from the agency itself; missing digital connectivity and physical infrastructure (curbs, lane markings) undermine technical feasibility; and a demand-response service model built around personalized passenger assistance is structurally misaligned with driverless operation. Rural agencies’ top-ranked research need—evidence on rural use—was effectively a request for demonstrations in communities like their own, echoing the finding that most small-community agencies would not consider Level 4–5 vehicles until witnessing successful demonstrations in similarly sized communities.
5.2. The Baseline in Light of Subsequent Developments
The developments summarized in Section 2.6 are broadly consistent with the caution agencies expressed in 2018 while sharpening several of the baseline’s tensions. As a small, non-representative set of illustrative developments rather than a systematic follow-up survey, these examples should be read as suggestive of continuity with the 2018 findings rather than as formal validation of them. The demonstration-led adoption pathway agencies said they were waiting on materialized through the FTA STAR demonstration program and numerous state and local pilots, yet the low-speed shuttle segment that dominated 2018-era awareness contracted sharply: NHTSA’s February 2020 nationwide suspension of EasyMile passenger operations following the Columbus injury [21] was followed by the exits of Local Motors [22] and Optimus Ride in 2022 and Navya’s receivership in 2023 [23]. These events reinforce precisely the reliability and safety-evidence concerns that survey respondents ranked highest, and they help explain why the survivors of this consolidation shifted toward road-legal, FMVSS-compliant vehicle platforms retrofitted with automated driving systems—as in Jacksonville’s use of modified Ford E-Transit vans [19]—rather than the purpose-built pods of the 2018 era.
Conversely, two of the baseline’s forward-looking signals are consistent with subsequent developments. First, the driver-shortage rationale that rural and small-urban agencies cited intensified dramatically after the COVID-19 pandemic: with 96% of agencies reporting workforce shortages and 84% reporting service impacts by 2022 [18], workforce mitigation moved from a secondary to a primary industry motivation for automation—suggesting that a replication of this survey would likely find adoption interest driven less by cost efficiency in the abstract and more by the concrete inability to staff service. Second, the constrained-use-case pattern agencies anticipated—circulators, campus shuttles, and first-mile/last-mile connections—is exactly where Level 4 transit deployment concentrated, most visibly in the Jacksonville NAVI downtown circulator [19]. It is striking that respondents in 2018 ranked downtown circulators among the top applications in every community size, and the first U.S. autonomous transit revenue service seven years later was a downtown circulator.
The rural evidence gap—rural respondents’ single most demanded research area—has begun to be addressed. The goMARTI demonstration [20] operates in a rural, harsh-winter environment with on-demand, wheelchair-accessible service and an onboard operator who assists passengers, a configuration that maps almost exactly onto the service model rural respondents described as necessary: demand-responsive, ADA-capable, and staffed for passenger assistance even when the vehicle drives itself. Its strong uptake and community acceptance suggest that the rural skepticism documented in this baseline reflected an absence of relevant demonstrations rather than an intrinsic rejection of the technology, consistent with respondents’ own statements that they would reconsider after witnessing success in similarly sized communities. Meanwhile, ADAS features that respondents favored for near-term adoption—collision avoidance and lane-keep assist—have continued diffusing into standard transit bus procurement, consistent with the baseline’s prediction that Levels 1–2 would lead adoption. Collectively, these developments define the comparison axes for a follow-up survey: awareness levels, the relative weight of workforce versus cost motivations, tolerance for attended automation, and whether rural demonstration evidence has shifted rural adoption intent.
5.3. Implications for Practice and Policy
Three implications follow for technology developers, planners, and policymakers. First, outreach and technical assistance should be differentiated by community size: rural agencies need foundational education and, above all, demonstrations in peer communities, while urban agencies need procurement templates, standards, and cost-effectiveness evidence. Second, vehicle developers targeting the transit market—particularly paratransit and demand-response—should design for attended automation (an onboard agent focused on passengers rather than driving) and for full ADA compliance, the absence of which was itself a named procurement barrier—a design direction consistent with both documented rider preferences and the concerns of travelers with disabilities [14,29]. Third, because rural vehicle procurement flows through state agencies, state departments of transportation are a leverage point for rural automation adoption; federal programs aiming to reach small communities should engage states directly rather than relying on agency-initiated adoption.
5.4. Limitations
Several limitations warrant note. The 15.2% response rate, while yielding a large absolute sample, raises the possibility of self-selection toward agencies with pre-existing interest in (or strong opinions about) automation; the results should be interpreted as the perspectives of engaged respondents rather than population estimates. A second limitation concerns the interpretation of the chi-square results reported in Section 4: community size is correlated with service mix and other agency characteristics in this sample—rural agencies predominantly operate demand-response service, while small-urban and urban agencies predominantly operate fixed-route service (Table 2)—so the reported associations between community size and awareness, interest, or adoption plans cannot be attributed to community size independent of these correlated characteristics, and should not be read as evidence of a causal or isolated community-size effect. Testing for these confounds directly would require a multivariable analysis that this cross-sectional dataset was not powered or designed to support; we flag the limitation explicitly here rather than attempting such an analysis post hoc. The sampling frame—SURTC’s agency database supplemented by CTAA distribution—over-represents rural and small-urban agencies relative to a census of all transit agencies, which is intentional given the study’s focus but limits urban-sector generalizability given the modest urban subsample (n = 34). Third, as detailed in Section 3, item-level effective bases are consistently smaller than the full community-size samples for a specific block of items (awareness, shuttle plans, benefit belief, and the technology-adoption timeline), and this pattern is systematic—concentrated in later, more technical survey items—rather than randomly distributed across the instrument. We were not able to test directly whether this nonresponse is informative (for example, whether agencies with lower automation awareness were more likely to skip later technical items); if so, the reported percentages for these items could be biased relative to the full respondent pool in ways this dataset cannot resolve. Responses reflect the judgment of a single senior respondent per agency and are perceptual rather than behavioral. Finally, the data were collected in November 2018 and are presented explicitly as a historical baseline; they should not be read as current agency positions, which the discussion in Section 5.2 addresses. These limitations notwithstanding, the dataset’s breadth across community sizes and its timing immediately before major industry shocks give it durable value as a benchmark.
6. Conclusions
This study established a national, pre-pandemic baseline of U.S. transit agency perspectives on bus transit automation across rural, small-urban, and urban communities, based on 258 agency responses collected in November 2018. Agencies of all sizes believed transit vehicles at all SAE levels can promote safety, but concerns about the effectiveness, reliability, and performance of Level 4–5 vehicles—unstudied at the time across community sizes and operating environments—left most agencies unwilling to adopt without further evidence. Agencies converged on a bifurcated value model (Levels 1–3 for safety; Levels 4–5 for cost efficiency in constrained-use cases) and on a recurring qualitative theme that even driverless vehicles would carry an onboard operator or agent, a theme that recurred more often in responses concerning ADA paratransit and demand-response service than fixed-route service, based on informally grouped open-ended responses rather than a systematic frequency count (Section 4.6.2). Awareness and demand rose with community size, and near-term adoption intent concentrated in collision avoidance, curb avoidance, and lane-keep assist. Agencies viewed fixed-route service as the best entry point for automation, particularly on simple, lower-conflict routes such as downtown circulators, university and hospital shuttles, and airport and parking connections; most rural and small-urban agencies, however, said they would not adopt Level 4–5 vehicles until they had seen successful demonstrations in communities of a similar size.
These findings point to four concrete recommendations. First, the FTA and state departments of transportation should fund rural- and small-urban-specific demonstration projects rather than relying on urban pilot results to build confidence in smaller communities, since respondents in this survey explicitly conditioned their own adoption on seeing peer-community success. Second, because rural vehicle procurement is state-mediated, federal outreach and funding programs aimed at rural automation adoption should engage state DOTs directly as an intermediary, rather than assuming agencies can independently pursue federal opportunities. Third, vehicle and software developers targeting the paratransit and demand-response markets should design for attended automation—retaining a staffed role focused on passenger assistance rather than driving—and for full ADA compliance from the outset, both of which this survey identified as preconditions for agency acceptance rather than optional features. Fourth, given the persistent research gaps this survey identified in rural use cases, cost-effectiveness, and human factors, we recommend that FTA-funded research programs and the transportation research community prioritize replicating elements of this survey at the current time, so that the pre-pandemic baseline reported here can be paired with a contemporary comparison rather than standing alone.
As transit automation demonstrations, workforce pressures, and vehicle markets have evolved substantially since these data were collected, the baseline reported here enables a research agenda the authors intends to pursue: replicating the survey to measure how a half-decade of demonstrations, market exits, and pandemic-era workforce shocks have shifted agency awareness, intent, and perceived barriers—particularly in the rural communities whose evidence needs were, and likely remain, the least addressed.
Author Contributions
Conceptualization, R.G. and J.H.; methodology, R.G. and J.H.; software, R.G.; validation, R.G. and J.H.; formal analysis, R.G. and J.H.; investigation, R.G. and J.H.; resources, R.G. and J.H.; data curation, R.G.; writing—original draft preparation, R.G.; writing—review and editing, R.G. and J.H.; visualization, R.G. and J.H.; supervision, J.H.; project administration, R.G. and J.H.; funding acquisition, R.G. and J.H. All authors have read and agreed to the published version of the manuscript.
Funding
Funds for the underlying study were provided by the Small Urban and Rural Livability Center (SURLC), a partnership between the Western Transportation Institute at Montana State University and the Upper Great Plains Transportation Institute at North Dakota State University, funded as a University Transportation Center through the U.S. Department of Transportation’s Office of the Assistant Secretary for Research and Technology.
Data Availability Statement
The full technical report on which this article is based, including the survey instrument and selected open-ended responses, is available from the Upper Great Plains Transportation Institute (Report SURLC 19-010). Aggregated survey data are available from the author on reasonable request.
Acknowledgments
The author thanks the expert reviewers of the survey instrument and the partner organizations—the Federal Transit Administration, the Center for Urban Transportation Research, and the John A. Volpe National Transportation Systems Center—for their input on survey design and coordination. During the preparation of this manuscript, the authors used an AI-based language model (Claude, Anthropic, Sonnet 5) to assist with editing for language, flow, and clarity. The original study design, data collection, core statistical modeling, and drafting of journal article were developed independently by the research team. The authors carefully reviewed all AI-assisted suggestions for accuracy, relevance, and consistency, and take full responsibility for the content of this publication.
Conflicts of Interest
The authors declare no conflicts of interest.
References
- Fagnant, D.J.; Kockelman, K. Preparing a Nation for Autonomous Vehicles: Opportunities, Barriers and Policy Recommendations. Transp. Res. Part A Policy Pract. 2015, 77, 167–181. [Google Scholar] [CrossRef] [Scilit]
- American Public Transportation Association (APTA). Public Transit Increases Exposure to Automated Vehicle Technology; APTA: Washington, DC, USA, 2019. [Google Scholar]
- Teale, C. How Autonomous Shuttles Are Changing City Transportation. Smart Cities Dive, 3 April 2019.
- Federal Transit Administration (FTA). Strategic Transit Automation Research Plan; U.S. Department of Transportation: Washington, DC, USA, 2018.
- U.S. Department of Transportation. Transit Bus Automation Overview; U.S. Department of Transportation: Washington, DC, USA, 2018.
- Harper, C.D.; Hendrickson, C.T.; Mangones, S.; Samaras, C. Estimating Potential Increases in Travel with Autonomous Vehicles for the Non-Driving, Elderly and People with Travel-Restrictive Medical Conditions. Transp. Res. Part C Emerg. Technol. 2016, 72, 1–9. [Google Scholar] [CrossRef] [Scilit]
- Kyriakidis, M.; Happee, R.; de Winter, J.C.F. Public Opinion on Automated Driving: Results of an International Questionnaire among 5000 Respondents. Transp. Res. Part F Traffic Psychol. Behav. 2015, 32, 127–140. [Google Scholar] [CrossRef] [Scilit]
- Nordhoff, S.; de Winter, J.; Kyriakidis, M.; van Arem, B.; Happee, R. Acceptance of Driverless Vehicles: Results from a Large Cross-National Questionnaire Study. J. Adv. Transp. 2018, 2018, 5382192. [Google Scholar] [CrossRef] [Scilit]
- Gkartzonikas, C.; Gkritza, K. What Have We Learned? A Review of Stated Preference and Choice Studies on Autonomous Vehicles. Transp. Res. Part C Emerg. Technol. 2019, 98, 323–337. [Google Scholar] [CrossRef] [Scilit]
- Salonen, A.O. Passenger’s Subjective Traffic Safety, In-Vehicle Security and Emergency Management in the Driverless Shuttle Bus in Finland. Transp. Policy 2018, 61, 106–110. [Google Scholar] [CrossRef] [Scilit]
- Salonen, A.O.; Haavisto, N. Towards Autonomous Transportation. Passengers’ Experiences, Perceptions and Feelings in a Driverless Shuttle Bus in Finland. Sustainability 2019, 11, 588. [Google Scholar] [CrossRef] [Scilit]
- Mouratidis, K.; Cobeña Serrano, V. Autonomous Buses: Intentions to Use, Passenger Experiences, and Suggestions for Improvement. Transp. Res. Part F Traffic Psychol. Behav. 2021, 76, 321–335. [Google Scholar] [CrossRef] [Scilit]
- Rosell, J.; Allen, J. Test-Riding the Driverless Bus: Determinants of Satisfaction and Reuse Intention in Eight Test-Track Locations. Transp. Res. Part A Policy Pract. 2020, 140, 166–189. [Google Scholar] [CrossRef] [Scilit]
- Dong, X.; DiScenna, M.; Guerra, E. Transit User Perceptions of Driverless Buses. Transportation 2019, 46, 35–50. [Google Scholar] [CrossRef] [Scilit]
- Azad, M.; Hoseinzadeh, N.; Brakewood, C.; Cherry, C.R.; Han, L.D. Fully Autonomous Buses: A Literature Review and Future Research Directions. J. Adv. Transp. 2019, 2019, 4603548. [Google Scholar] [CrossRef] [Scilit]
- Ainsalu, J.; Arffman, V.; Bellone, M.; Ellner, M.; Haapamäki, T.; Haavisto, N.; Josefson, E.; Ismailogullari, A.; Lee, B.; Madland, O.; et al. State of the Art of Automated Buses. Sustainability 2018, 10, 3118. [Google Scholar] [CrossRef] [Scilit]
- Iclodean, C.; Cordos, N.; Varga, B.O. Autonomous Shuttle Bus for Public Transportation: A Review. Energies 2020, 13, 2917. [Google Scholar] [CrossRef] [Scilit]
- American Public Transportation Association (APTA). Transit Workforce Shortage: Root Causes, Potential Solutions, and the Road Ahead; APTA: Washington, DC, USA, 2022. [Google Scholar]
- Jacksonville Transportation Authority (JTA). JTA Launches Nation’s First Public Transportation Autonomous Vehicle Revenue Service. Press Release. 27 June 2025. Available online: https://www.jtafla.com (accessed on 2 August 2026).
- Douma, F.; Weiner, E. Grand Rapids goMARTI Self-Driving Shuttle Pilot Program; Minnesota Department of Transportation: St. Paul, MN, USA, 2024.
- Shepardson, D. U.S. Agency Slams Brakes on Self-Driving EasyMile Shuttles After Passenger Injury. Reuters, 25 February 2020.
- Bellan, R. Local Motors, the Startup Behind the Olli Autonomous Shuttle, Has Shut Down. TechCrunch, 13 January 2022.
- Navya Announces the Partial Takeover of Its Activities by Gaussin and Its Delisting as a Result of Its Judicial Liquidation. Businesswire, 18 April 2023.
- U.S. Department of Transportation. Automated Driving Systems 2.0: A Vision for Safety; NHTSA: Washington, DC, USA, 2017.
- Cregger, J.; Dawes, M.; Fischer, S.; Lowenthal, C.; Machek, E.; Perlman, D. Low-Speed Automated Shuttles: State of the Practice; U.S. Department of Transportation: Washington, DC, USA, 2018.
- Pessaro, B.; Van Nostrand, C. Cedar Avenue Driver Assist System Evaluation Report; Federal Transit Administration: Washington, DC, USA, 2011.
- WSB; AECOM. MnDOT Autonomous Bus Pilot Project Testing and Demonstration Summary; Minnesota Department of Transportation: St. Paul, MN, USA, 2018.
- Peirce, S.; Cregger, J.; Burkman, E.; Richardson, H.; Machek, E.; Mortensen, S.; Mahavier, K. Assessing the Transit Agency Business Case for Partial and Full Automation of Bus Services. Transp. Res. Rec. 2019, 2673, 271–281. [Google Scholar] [CrossRef] [Scilit]
- Bennett, R.; Vijaygopal, R.; Kottasz, R. Attitudes towards Autonomous Vehicles among People with Physical Disabilities. Transp. Res. Part A Policy Pract. 2019, 127, 1–17. [Google Scholar] [CrossRef] [Scilit]
- Guerra, E. Planning for Cars That Drive Themselves. J. Plan. Educ. Res. 2016, 36, 210–224. [Google Scholar] [CrossRef] [Scilit]

Disclaimer/Publisher’s Note: The statements, opinions and data contained in all publications are solely those of the individual author(s) and contributor(s) and not of MDPI and/or the editor(s). MDPI and/or the editor(s) disclaim responsibility for any injury to people or property resulting from any ideas, methods, instructions or products referred to in the content. |
© 2026 by the authors. Licensee MDPI, Basel, Switzerland. This article is an open access article distributed under the terms and conditions of the Creative Commons Attribution (CC BY) license.