


Abstract
Dynamic freight transportation systems are critical for improving logistics performance in developing economies where multimodal integration remains limited. Despite Lao People’s Democratic Republic (Lao PDR)’s substantial investments to transition from a landlocked to a land-linked hub, quantitative assessments capturing heterogeneous cargo behavior across its multimodal networks are scarce. This study develops a cargo-specific, multi-source, multi-sink minimum-cost flow (MCF) framework to evaluate freight transport performance in Lao PDR. The framework integrates road, railway, inland waterway, and air transport into a unified directed network, capturing heterogeneous behaviors across six cargo categories. Testing under three demand scenarios (Q500, Q1000, and Q2000 tons/day) across both export and import systems, the results from 99 feasible solutions indicate that railway transport consistently dominates long-distance corridors within the assumptions of the proposed framework, reflecting its structural cost advantages. Conversely, road transport primarily serves first- and last-mile connectivity, while inland waterways and air transport serve as supplementary modes. Ultimately, these findings provide scenario-based insights to support policy decision-making for cross-border infrastructure investments, regional dry port integration, and synchronized rail-road connectivity across the Greater Mekong Subregion (GMS).
1. Introduction
Efficient freight transport systems are essential for economic development, regional integration, and supply chain connectivity, particularly in developing countries where infrastructure integration and transport redundancy remain limited [1]. Within the Greater Mekong Subregion (GMS), increasing cross-border trade and infrastructure expansion have intensified the importance of multimodal freight transport systems capable of supporting both domestic and international logistics activities [2]. The Lao People’s Democratic Republic (Lao PDR) occupies a strategically important geographic position connecting China, Thailand, Vietnam, Cambodia, and Myanmar through regional transport corridors and international trade routes [3]. In recent years, national development strategies have emphasized transforming Lao PDR from a “landlocked” to a “land-linked” economy through investment in highways, railway systems, inland waterway transport, logistics hubs, dry ports, and airport infrastructure [4].
Despite recent developments, freight transport operations in the Lao PDR continue to face significant logistics and infrastructure challenges. Freight movement relies mainly on road transport. Integration of railway, inland waterway, and air transport systems is still developing [5]. Mountainous terrain, dispersed production areas, limited intermodal transfer facilities, and uneven infrastructure quality all contribute to high transport costs and longer travel times when compared with neighboring countries [6]. These conditions reduce transport efficiency and increase logistics costs, especially in central and northern Lao PDR, where freight distribution depends on long-distance corridors and multimodal connections.
Another important limitation in existing freight transport studies is the treatment of freight demand as a homogeneous commodity. In practice, different cargo categories exhibit distinct logistics characteristics, transport priorities, and modal preferences [7]. Bulk commodities such as minerals and forest products often prioritize lower transport costs, whereas perishable and high-value goods require faster, more reliable transport services. Failure to account for these heterogeneous freight characteristics may reduce the realism and applicability of freight allocation models, particularly within multimodal logistics systems.
Based on the background above, this study develops a multi-source, multi-sink minimum-cost flow framework for the assessment of multimodal freight transport in the Lao PDR. The framework integrates road, rail, inland waterway, and air transport systems into a unified directed freight network and incorporates commodity-specific transport cost adjustment factors to better capture heterogeneous logistics behavior. It is evaluated across multiple freight demand scenarios for both export and import freight systems. The aim of this study is to develop and evaluate a cargo-specific, multi-source, multi-sink minimum-cost flow (MCF) framework for assessing multimodal freight transport performance in Lao PDR under data-limited conditions. Specifically, the study aims to evaluate freight flow allocation, transport costs, travel times, transport distances, and modal utilization across cargo categories, demand scenarios, and transport objectives. The key contributions of this study are: (1) applying a cargo-specific, multi-source, multi-sink minimum-cost flow framework for multimodal freight transport assessment in Lao PDR; (2) evaluating freight flow allocation, transport cost, travel time, transport distance, and modal utilization across multiple demand scenarios; and (3) analyzing commodity-specific freight behavior and multimodal interaction patterns within the logistics network. Figure 1 illustrates the conceptual framework of this research.
Figure 1.
Conceptual research framework for cargo-specific multimodal freight transport performance assessment in Lao PDR.
This paper contributes to the freight transportation literature by developing a cargo-specific, multi-source/multi-sink minimum-cost flow framework for the analysis of multimodal freight networks in Lao PDR. Unlike conventional approaches that often treat freight demand as homogeneous, the proposed framework explicitly incorporates differences in cargo characteristics, transport mode interactions, and directional trade flows. The model provides a practical decision-support tool for evaluating freight transport performance, identifying cost-efficient routing strategies, and assessing modal utilization under varying demand conditions. Furthermore, the framework supports scenario-based transportation planning, logistics system assessment, and infrastructure investment prioritization. By integrating road, railway, inland waterway, and air transport networks within a unified analytical platform, the proposed approach contributes to improving freight system efficiency, strengthening multimodal connectivity, and enhancing regional trade competitiveness in developing economies.
2. Literature Review
2.1. Multimodal Freight Transport Systems
Multimodal freight transport systems are increasingly important for regional logistics integration and supply chain performance. The integration of multiple transport modes allows freight systems to improve operational flexibility, reduce logistics costs, and support sustainable transport planning. Previous studies have shown that multimodal transport systems can enhance freight efficiency by combining the advantages of road, railway, inland waterway, and air transport within integrated logistics networks [8]. Road transport remains the dominant freight mode in many developing countries because of its extensive spatial coverage and operational flexibility. However, heavy reliance on road transport can increase logistics costs, congestion, and environmental impacts [9]. Railway transport is generally more efficient for long-distance and bulk freight, whereas inland waterway transport offers relatively low-cost options for large-volume cargo [10]. Air transport supports high-value and time-sensitive freight despite relatively high transport costs.
Although multimodal transport systems have been widely discussed in logistics research, integrated quantitative frameworks that can simultaneously evaluate multiple transport modes remain scarce in developing-country contexts. The challenge is particularly acute in landlocked Southeast Asian nations such as Lao PDR, where geographic constraints, infrastructure gaps, and institutional fragmentation collectively hinder the efficient integration of transport modes [5]. In such settings, freight systems must contend not only with physical infrastructure limitations but also with regulatory heterogeneity across borders, which further complicates multimodal coordination and planning [10].
2.2. Minimum-Cost Flow Representation of Freight Movement
Optimization approaches have been used in logistics research to improve freight allocation efficiency and transport network performance [7]. Among these approaches, the minimum-cost flow (MCF) model is often used in freight transportation and network optimization studies for its ability to determine the least-cost freight allocation subject to supply–demand and capacity constraints [11,12,13]. Previous studies have applied MCF models to freight routing, service network design, multimodal transport planning, and logistics optimization [14,15,16,17]. However, many existing studies focus primarily on single-mode transport systems or simplified origin–destination structures that may not adequately represent realistic freight distribution systems characterized by multiple supply locations, demand centers, and intermodal transfer operations [18,19].
Also, such optimization models require complete input information on freight transport, including origin, destination, and commodity type. These conditions, however, differ substantially from those in developing-country contexts such as Lao PDR, where freight production and consumption are spatially dispersed, and detailed shipment information remains limited. In this study, rather than estimating exact freight movements, the present framework uses MCF to approximate freight allocation patterns and evaluate transport system performance under data-constrained conditions. Cargo-specific characteristics are incorporated to better represent differences in transport requirements, modal compatibility, and freight movement behavior within the multimodal transport system.
Recent studies have increasingly emphasized that efficient multimodal freight transport depends not only on the optimization algorithm itself but also on the representation of transport network topology and intermodal transfer operations. Crainic and Kim [17] highlighted that multimodal freight transportation requires the coordinated integration of different transport modes through interconnected networks and efficient terminal operations. Similarly, Wieberneit [15] demonstrated that freight transport optimization should simultaneously consider routing decisions, modal selection, and transfer processes to improve overall logistics performance. These concepts have been further extended in more recent studies, where optimization techniques have been applied to support strategic freight planning, service network design, and multimodal transport assessment under practical operational constraints [13,14,16].
2.3. Cargo-Specific Characteristics in Multimodal Freight Transport
The importance of cargo-specific differentiation in multimodal freight planning has been increasingly recognized in recent studies in the literature. Different cargo categories, including bulk commodities, perishable goods, and high-value products, exhibit distinct transport requirements in terms of cost sensitivity, time constraints, and modal compatibility [15]. Ignoring such differentiation may lead to simplified freight allocation structures and reduced representational accuracy of freight movement patterns. Previous studies have further suggested that incorporating freight demand heterogeneity can improve the representation of freight assignment behavior within multimodal transport systems [20,21]. Building on this foundation, the present study adopts an MCF framework to explicitly represent cargo-specific transport characteristics within the multimodal freight network of Lao PDR, thereby addressing a methodological gap in freight transport assessment under data-limited developing-country contexts.
2.4. Research Gaps
Despite the growing body of literature on multimodal freight transport, MCF applications, and multicommodity freight analysis, several important research gaps remain. First, multimodal freight studies rarely integrate all four major transport modes: road, rail, inland waterway, and air within a unified network representation. Most studies focus on one or two modes independently, limiting their ability to capture modal interactions and substitution effects that characterize real-world freight systems. Second, quantitative freight assessment in developing-country contexts remains constrained by limited freight origin–destination (OD) information and incomplete logistics datasets. In countries such as the Lao PDR, freight production and consumption activities are geographically dispersed, whereas detailed shipment records are often unavailable. Consequently, system-level freight movement patterns and multimodal interactions remain insufficiently understood under limited-data conditions. Third, freight is often treated as a homogeneous commodity in transport assessment and modeling studies. Such assumptions may overlook differences among commodity groups in transport requirements, cost sensitivity, handling conditions, modal compatibility, and delivery urgency, all of which influence freight allocation patterns and network performance. Fourth, empirical freight transport studies focused specifically on the Lao PDR remain limited despite the country’s growing strategic importance as a land-linked logistics corridor connecting China, Thailand, Vietnam, and Cambodia within the Greater Mekong Subregion. Recent advances in multimodal freight transport research have also focused on integrating network optimization techniques with practical decision-support frameworks. For example, Rahimi et al. [18] developed a multi-objective hub network design model incorporating uncertainty and congestion constraints. Beresford et al. [14] emphasized integrated multimodal transport assessment by considering interactions among transport modes and door-to-door logistics characteristics, while Archetti et al. [13] reviewed optimization approaches for multimodal freight transportation and highlighted the methodological diversity of multimodal freight planning problems. Nevertheless, most existing studies assume data-rich environments with detailed origin–destination information and operational datasets. Such assumptions remain difficult to satisfy in developing countries, where freight data are often fragmented and incomplete. Consequently, there remains a need for practical optimization frameworks capable of supporting freight transport assessment under limited-data conditions. To address these gaps, this study develops a cargo-specific multimodal freight transport assessment framework using an MCF-based representation for Lao PDR. The proposed framework incorporates cargo-specific transport characteristics and multimodal network representation to evaluate freight transport performance under limited-data conditions.
3. Methodology
The proposed framework follows seven sequential stages for multimodal freight transport assessment in Lao PDR: (1) study area and network definition; (2) multimodal network construction; (3) MCF formulation; (4) cargo demand disaggregation under multiple demand scenarios; (5) assignment of mode-specific transport attributes; (6) export and import freight flow representation; and (7) network performance assessment. The MCF-based framework was implemented and solved in Python (version 3.13.9) using the NetworkX package (version 3.5).
3.1. Study Area
The study area encompasses eleven provinces in central and northern Lao PDR: Vientiane Capital, Vientiane Province, Luang Prabang, Xayaboury, Oudomxay, Luang Namtha, Bokeo, Phongsaly, Saisomboun, Xiengkhouang, and Huaphan (Figure 2). The region covers approximately 5109 administrative villages with a combined population of approximately four million [22] and constitutes a strategically significant freight corridor within the Greater Mekong Subregion (GMS), supporting both domestic distribution and cross-border logistics connectivity [1,3,23]. Multimodal transport network data were compiled for road, railway, inland waterway, and air systems, incorporating link-level cost, capacity, and travel time attributes derived from official statistics, field surveys, and infrastructure records [17,18,24,25,26,27,28,29].
Figure 2.
Study area and regional connectivity within the Greater Mekong Subregion (GMS): (a) location of Lao PDR in Southeast Asia; (b) GMS economic corridors; and (c) spatial distribution of village points and population across central and northern Lao PDR.
3.2. Multimodal Freight Transport Network Topology Model
The multimodal freight transport system is represented as a directed network (G = (N, A)), where (N) denotes the set of nodes and (A) denotes the set of directed arcs connecting them. In this study, the terms link and arc are used interchangeably to denote a single directed network connection between two adjacent nodes. By contrast, a route refers to a complete freight path consisting of one or more consecutive links (arcs) connecting an origin to a destination. The network was developed from field surveys, government transportation databases, and operational freight infrastructure records collected throughout the Lao PDR. The surveyed freight transportation system comprises approximately 60 logistics-related facilities, including road logistics centers, railway freight stations, inland waterway ports, airports, dry ports, and international border gateways.
Specifically, a facility was included in the network only when the following criteria were satisfied: (1) its geographic location could be accurately identified; (2) at least one operational transport connection to another network node was available; (3) transport attributes, including travel distance, travel time, transport cost, and mode-specific capacity, could be obtained from official databases, field surveys, or published sources; and (4) the facility was operational during the study period. Facilities that did not satisfy these criteria or lacked sufficient operational information were excluded to ensure data consistency and model reliability. However, only facilities with sufficient operational and connectivity data were incorporated into the network optimization model.
The final network used for minimum-cost flow analysis consists of 45 nodes and 69 directed arcs, including both modal links and intermodal transfer connections. The road sub-network constitutes the primary freight transport backbone and consists of 16 nodes connected by 29 directed arcs. Road infrastructure is categorized into three axle-load classes: 11 t/axle (1154 km), 9.1 t/axle (2969 km), and 8.1 t/axle (320 km), providing access to 325 logistics company locations across the country. The railway sub-network comprises 9 freight stations connected by 8 directed arcs along the Laos–China Railway corridor. The inland waterway sub-network includes 11 nodes and 10 directed arcs located along the Mekong River and its major tributaries, facilitating low-cost bulk cargo movement. The air transport sub-network consists of 9 airport nodes connected by 8 directed arcs linking domestic and international aviation gateways.
Intermodal integration is represented through 14 connector arcs that enable cargo transfers among the modal subsystems, including road–rail, rail–waterway, and road–air connections. These transfer facilities enhance network connectivity and support efficient freight distribution across multiple transport modes. In addition, five cargo hubs and dry ports function as major intermodal logistics centers, while eleven international border-crossing nodes serve as gateway interfaces connecting the national freight transport network with regional and international trade corridors in both export and import directions. Consequently, the modeled network represents the operationally significant components of the national freight transport system while maintaining computational tractability for multimodal minimum-cost flow analysis.
Each arc is characterized by a set of attributes including transport cost (USD/ton), capacity (ton/day), and travel time (hours), derived from a combination of official statistics, field surveys, and infrastructure data sources. The network structure enables the representation of both intramodal and intermodal connections, allowing freight to be transferred between different transport modes at designated transshipment nodes. To capture real-world logistics behavior, the network is modeled as a multi-source, multi-sink system, with multiple origins (supply nodes) and destinations (demand nodes) coexisting simultaneously. This structure reflects the distributed nature of freight production and consumption across the study region. As illustrated in Figure 3, the structure and operational characteristics of the proposed multimodal freight transport system in Lao PDR. Figure 3a presents the integrated transport network consisting of road, railway, inland waterway, and air transport systems connected through border crossings, logistics hubs, dry ports, and intermodal transfer nodes. The network incorporates multiple origins and destinations to reflect the distributed structure of freight production and consumption. Figure 3b illustrates the conceptual freight movement process, showing the interaction among production centers, logistics facilities, transfer terminals, and domestic and international markets. Together, these components provide the basis for representing freight flow allocation and multimodal interactions within the proposed MCF framework.
Figure 3.
(a) Multimodal freight transport network of Lao PDR, showing transport infrastructure, intermodal connections, border crossings, and dry ports (inland logistics hubs). (b) Conceptual freight flow framework illustrating cargo movements from production and import sources to domestic and international markets through multimodal transport facilities. In panel (b), black arrows indicate the physical movement and transfer of freight between transport modes and logistics facilities, whereas red arrows indicate customs-related data and information flows through the Automated System for Customs Data (ASYCUDA). In this framework, dry ports function as inland logistics hubs for cargo consolidation, intermodal transfer, container handling, and customs services, whereas Special Economic Zones (SEZs) represent industrial and commercial areas that generate or attract freight demand rather than freight transshipment facilities.
3.3. Representation of Freight Movement
Since detailed origin–destination (OD) freight data are unavailable, freight movement patterns are represented using an MCF framework as a proxy for current freight allocation behavior. The MCF approach is assumed to approximate logistics company routing strategies and generate feasible freight flow patterns within the multimodal transport network. Let denote the freight flow assigned to the link . The MCF can be formulated as follows:
Subject to
where is positive for supply nodes, negative for demand nodes, and zero for transshipment nodes. This formulation follows classical network flow theory for cost-minimizing freight allocation, subject to capacity and flow-balance constraints [7,30]. In this study, a link (or arc) refers to a single directed network connection between two adjacent nodes, representing a road, railway, inland waterway, air transport, or intermodal transfer connection. In contrast, a route refers to a complete freight path comprising one or more consecutive links connecting an origin to a destination. These definitions are used consistently throughout the remainder of this manuscript. The notation used in the proposed MCF model is defined as follows:
| : | total transport cost of the network; | |
| : | set of nodes (origins, destinations, and transshipment nodes); | |
| : | set of directed links (arcs), including road, railway, inland waterway, air, and intermodal transfer links; | |
| : | freight flow on the link ; | |
| : | unit transport cost on the link | |
| : | maximum capacity of the link ; | |
| : | travel time on the link ; | |
| : | net supply/demand at node (supply , demand , transshipment ); | |
| : | set of predecessor nodes with directed arcs entering the node ; | |
| out() | : | set of successor nodes with directed arcs leaving the node . |
Commodity demand was defined using statistical data on import and export activities for 2024, collected in April 2025 by the Departments of Industry and Commerce and Chambers of Commerce across eleven provinces in the study area. Based on official export statistics, export commodities were initially classified into three major groups: industrial products (79.10%), agricultural products (15.84%), and forest products (5.06%) [26]. To better capture heterogeneous freight transport characteristics, these categories were further disaggregated into six cargo groups. Industrial products were divided into general industrial goods (60.00%) and bulk commodities (19.10%), representing both manufactured and resource-based exports. Agricultural products were separated into non-perishable agricultural goods (10.00%) and perishable goods (5.84%) to reflect differences in time sensitivity and logistics requirements. Forest products were retained at 5.06% because of their distinct transport and handling characteristics. High-value goods were implicitly included within industrial products. This hierarchical cargo structure preserves consistency with observed freight composition while enabling differentiation of transport behavior across cargo types [6,26]. Import freight was defined based on the structure of goods commonly imported into Lao PDR, reflecting domestic consumption demand and industrial input requirements. The proposed framework considers only cross-border freight movements, including export freight from Lao PDR to neighboring countries and import freight from neighboring countries into Lao PDR. Transit cargo flows passing through Lao PDR were not included because comprehensive origin–destination data for transit freight were not available for the study area. The import composition was categorized into six groups: industrial products (45.00%), bulk commodities (25.00%), agricultural products (8.00%), perishable goods (7.00%), forest products (5.00%), and high-value goods (10.00%) [26]. Industrial imports include machinery and manufactured goods, whereas bulk commodities consist primarily of fuel and construction materials. Agricultural and perishable goods represent food-related imports, while high-value goods include electronics and precision equipment. This classification captures the consumption-oriented structure of import freight and enables the model to represent heterogeneous transport requirements, particularly in terms of transport cost, delivery time sensitivity, and modal preference [6,31].
The proposed framework evaluates multimodal freight transport performance at the cargo-category level rather than the intermodal transport-unit level. Accordingly, individual loading units, such as containers or other intermodal transport units, are not explicitly represented. Instead, intermodal transfers are modeled using transfer links with their associated transport cost, travel time, and distance.
Although the six cargo categories adopted in this study were derived from the official import and export commodity statistics of Lao PDR, they are broadly consistent with internationally recognized freight groups, including industrial products, agricultural products, mineral products, forest products, perishable goods, and high-value goods. The present classification was intentionally simplified to reflect the structure of the available national freight statistics under data-limited conditions while maintaining broad compatibility with internationally recognized freight classification systems, such as the Harmonized System (HS) and the NST 2007 classification.
3.4. Demand Scenarios and Commodity Classification
To capture heterogeneous logistics characteristics, the total freight demand is disaggregated into multiple commodity types using commodity-share coefficients. Let denote the proportion of the commodity type , subject to the following condition:
The disaggregated supply–demand at the node for commodity type , denoted as , is defined as:
This formulation preserves flow consistently across all commodity categories:
In the export model, freight originates at internal production nodes within the region and flows toward external demand points at the region’s boundary. Conversely, in the import model, the flow direction is reversed: goods enter through external gateways and are distributed to internal demand nodes within the region. This dual modeling framework enables a consistent, detailed assessment of network performance across varying demand scenarios while accounting for commodity-specific transport behavior.
3.4.1. Export and Import Demand Allocation
To evaluate system performance under varying levels of freight demand, three demand scenarios are defined as and tons per day. These scenarios represent low, medium, and high freight-demand conditions, respectively, and are consistently applied across both export and import models. For each commodity category the scaled node balance was calculated as:
where denotes the scaled supply–demand value at node and is the total demand associated with the commodity type . To ensure the feasibility of the minimum cost flow formulation, node balances were adjusted to satisfy
This procedure preserved the proportional structure of the observed freight distributions while ensuring numerical consistency within the optimization process.
The freight demand scenarios (Q500, Q1000, and Q2000 tons/day) represent comparative loading conditions rather than empirical forecasts of commodity-specific freight demand. The proportional scaling approach was adopted to provide a consistent basis for evaluating multimodal network performance under data-limited conditions in Lao PDR, where spatially disaggregated freight demand and industrial structure data are currently unavailable. Consequently, the proposed demand scenarios should be interpreted as comparative structural simulations for network performance assessment rather than exact representations of observed regional freight demand.
In this study, each commodity category is solved independently using a single-commodity minimum-cost flow formulation. Consequently, commodities do not compete for shared network capacity during optimization. This simplification was intentionally adopted to reflect the current availability of freight data in Lao PDR, where comprehensive simultaneous commodity demand and shared-capacity information are not yet available. Therefore, the proposed framework should be interpreted as a commodity-specific freight assessment model rather than a strict multicommodity network flow formulation. Consequently, direct capacity competition among commodity categories is not explicitly modeled, and network capacities are applied independently for each model run. Although this assumption facilitates the interpretation of commodity-specific freight allocation patterns, it may oversimplify interactions among freight categories and consequently overestimate the utilization of high-capacity transport modes, particularly railways, under real-world operating conditions. Future research will extend the proposed framework to a true multicommodity network flow formulation with shared network capacity constraints to explicitly represent inter-commodity competition and system-level freight interactions [12,32].
3.4.2. Commodity–Mode-Specific Transport Cost Adjustment
Commodity-specific transport cost adjustment factors were applied to represent differences in transport requirements across commodity categories. Mode availability was incorporated by assigning very high transport costs to infeasible commodity–mode combinations, thereby discouraging unrealistic allocations within the MCF framework. The transport cost for the commodity type was calculated as:
where denotes the transport cost of the cargo type on link , represents the base modal transport cost, and is the commodity-mode-specific cost adjustment factor for transport mode m. The cost adjustment factors for different commodity types are derived from commodity characteristics, literature sources, and expert-based assumptions regarding transport requirements and modal suitability [6,8,10]. The resulting adjustment factors are summarized in Table 1.
Table 1.
Commodity–mode-specific transport cost adjustment factors under normal conditions.
3.5. Capacity, Time, and Cost Estimation
For integration into the MCF formulation, each directed link is assigned a unit transport cost and a maximum daily capacity . Unit costs are expressed in USD/ton or derived from USD/ton·km multiplied by link distance. Capacity constraints are expressed uniformly in tons/day. Because uniform technical design capacity data are not available across all transport modes in Lao PDR, a hybrid capacity estimation framework is adopted. Capacity parameters are derived from mode-specific operational or statistical data to ensure empirical consistency and comparability within the unified network optimization model [7,10], as shown in Table 2. Although the original capacity indicators differ among transport modes (e.g., railway freight throughput, road freight operator capacity, inland waterway vessel-based carrying capacity, and airport cargo throughput), all capacity values were standardized as effective operational freight capacities expressed in tons/day before model implementation. This standardization provides a common operational basis for multimodal comparison while reflecting the operational characteristics of each transport mode. This approach provides a conservative and operationally grounded representation of multimodal carrying capability [8,10,11]. The transport cost, travel time, and capacity parameters used in this study were derived from official government statistics, field surveys conducted in Lao PDR during 2024, and operational records obtained from relevant transport agencies. Therefore, the adopted network parameters reflect the observed operational characteristics of the existing freight transport system rather than hypothetical assumptions.
Table 2.
Summary of unit transport costs, travel times, and daily capacities by transport mode in the multimodal freight network of Lao PDR.
Although the transport cost values are presented by transport mode, they are not represented by a single fixed value for each mode. Instead, different unit transport costs are assigned to individual transport links according to their operational characteristics. These variations reflect differences in infrastructure conditions, terrain characteristics, route accessibility, operational difficulty, and service quality along each transport corridor. The assigned transport costs were determined based on freight market information obtained from the Ministry of Public Works and Transport (MPWT), logistics operators, and field surveys [24,25]. In addition, transport costs are influenced by fluctuations in fuel prices, labor costs, and inflation during the data collection period [15,31,33]. Consequently, transport costs within the same transport mode vary across individual network links.
3.5.1. Road Capacity
Road transport capacity was estimated using field survey data collected in 2024, in collaboration with the provincial Departments of Public Works and Transport (DPWT), across the central and northern Lao PDR [25]. Each logistics firm was assumed to operate two 12-wheel trucks, each with an average payload of 15.2 tons per trip, making one trip per day, resulting in an estimated capacity of 30.4 tons/day per firm. Provincial road freight capacity was estimated by multiplying the number of active logistics firms registered with the DPWT by the estimated capacity per firm. Although the study covers 11 provinces, Vientiane Province and Xaysomboun Province were excluded from the capacity estimation because no registered road logistics firms were identified in the DPWT records during the survey period [25]. These provinces primarily function as transit corridors rather than major freight logistics service centers. Consequently, the provincial capacities of the remaining nine provinces were aggregated, yielding an estimated total road transport capacity of approximately 9637 tons/day. The reported total was calculated using unrounded provincial capacity values; therefore, minor differences may occur when rounding the provincial values. Road travel time was estimated from network distance and average operating speeds under mountainous conditions, ranging from 30 to 40 km/h. Consequently, estimated travel times ranged from approximately 0.05 to 20.4 h, depending on route distance and terrain characteristics.
3.5.2. Railway Capacity
Railway freight capacity was estimated using operational data from direct consultation with Laos National Railways in January 2025, indicating an average freight throughput of approximately 2800–3000 tons/day [28]. For computational implementation, the midpoint value of 2900 tons/day was adopted as the representative railway capacity in the network model under normal operating conditions. Railway tariff data were derived from official railway presentation materials published in 2023 and originally reported per 40-ft container [27]. Container-based tariffs were converted to unit transport cost (USD/ton) using an average payload capacity of 25 tons per container [32]. Railway travel time was estimated from the distance of each railway network link (arc) and freight train operating characteristics along the Lao–China Railway corridor. Based on operational characteristics and regional railway benchmarks, freight train speeds were assumed to range between 60 and 80 km/h [28]. Consequently, the estimated travel time of each railway link ranged from approximately 0.14 to 1.2 h, depending on the link distance. For example, the travel time between Na Teuy Railway Station (N59) and Boten Railway Station (N60) was approximately 0.14 h, whereas the travel time between Luang Prabang Railway Station (N55) and Muangxai Railway Station (N58) was approximately 1.2 h [28]. The total travel time for a complete railway route was obtained by summing the travel times of all consecutive railway links along the selected path.
3.5.3. Inland Waterway Capacity
Inland waterway capacity was estimated from vessel fleet statistics reported in the Annual Ministry of Public Works and Transport Statistic Book 2023 [24]. Vessels were classified into four payload groups (0.05–5, 6–50, 51–100, and 101–300 tons). In the absence of vessel-specific payload data, midpoint values for each category (2.525, 28, 75.5, and 200.5 tons, respectively) were used to represent typical carrying capacity. These payload values represent the carrying capacity of inland waterway vessels rather than freight containers. Inland waterway transport in the study area is primarily carried out by conventional cargo vessels that transport bulk and general cargo along the Mekong River; therefore, containerized transport and empty container movements were not considered in the capacity estimation. Under normal hydrological conditions, each vessel was assumed to complete one trip per day [17,18]. Provincial inland waterway capacity was then estimated by multiplying the number of vessels in each payload category by the corresponding midpoint payload and aggregating across all vessel classes. Travel time for inland waterway transport was estimated using network-based river distances and assumed vessel operating speeds under typical Mekong River conditions. Average vessel speeds were assumed to range from 10 to 25 km/h [17,18], yielding estimated travel times of approximately 0.5–16 h across the study network. The wide variation reflects differences in river morphology, flow conditions, and navigation constraints between upstream and downstream sections.
3.5.4. Aviation Capacity
Air freight capacity was estimated to be using official domestic cargo throughput statistics from the Department of Civil Aviation. Ministry of Public Works and Transport. Lao PDR, for 2023 [34]. Annual departure and arrival cargo volumes from major domestic airports were aggregated and converted to average daily throughput (tons/day) to estimate operational air freight capacity for each air corridor. Air freight operations were represented by ATR 72-600 aircraft [29,35], which constitute the primary domestic fleet operated by Lao Airlines. This throughput-based approach provides an operationally grounded representation of air cargo capacity because it reflects actual handling performance rather than theoretical aircraft payload or terminal design capacity. Travel time for air transport was estimated using network-based flight distances and assumed cruising speeds of approximately 450–500 km/h [29,35], yielding airborne travel times of approximately 0.5–1.2 h across the study network. An additional ground-handling and turnaround time of 0.25–0.5 h per movement was assumed in the model to account for ground operations and to better represent door-to-door logistics performance, yielding total effective travel times of approximately 0.75–1.5 h.
3.5.5. Intermodal Transfer Links
Intermodal transfer links were incorporated to represent connectivity among road, railway, inland waterway, and air transport systems within the multimodal freight network. These links enable cargo transshipment at designated logistics hubs, dry ports, river ports, airport cargo terminals, and other transfer facilities. Intermodal transfer times were represented through these dedicated transfer links. Because detailed operational data on loading and unloading operations, terminal handling, customs clearance, and queuing delays were not consistently available, the attributes of these transfer links were approximated using the characteristics of the connecting road links, which serve as the primary access infrastructure for freight transshipment in Lao PDR. Consequently, the transfer times represent generalized cargo-transfer operations rather than detailed terminal processing times. The resulting transfer times ranged from 0.03 to 1.14 h, depending on the type and location of the intermodal facility. Typical transfer times were approximately 0.03–0.12 h for road–rail transfers, 0.05–0.80 h for rail–waterway transfers, and 0.20–1.14 h for road–air transfers. These values were incorporated into the corresponding connector arcs to represent cargo-handling and modal-transfer operations within the multimodal freight transport network.
3.6. Performance Indicators
The performance of the multimodal freight transport network was evaluated using several transport and logistics indicators, including total transport cost, average transport cost, travel time, transport distance, modal utilization, and freight flow allocation [10,11,26]. First, total transport cost, , can be defined as the result of the MCF model by summing up the values of the objective function for all commodity types:
Travel time () and distance () are also used to evaluate operational efficiency and route performance across the multimodal system [11,26] and are defined as follows.
where and are travel time and distance of the link , respectively. The average transport cost, , reflects transport efficiency per unit of freight movement, and is defined as:
Modal utilization, (%), is defined for each mode as the total share of mode m for all commodities, and it examines the relative contribution of road, railway, inland waterway, and air transport under different freight demand scenarios:
where stands for a set of links corresponding to a mode . Finally, freight flow allocation, (%), is further evaluated to identify cargo distribution patterns and multimodal routing behavior [12,13]:
The three optimization objectives—minimum cost, minimum time, and minimum distance—were evaluated independently to provide objective-specific comparisons of network performance. The present framework does not combine these dimensions into a unified generalized cost function or a multi-objective trade-off framework. Therefore, reliability, operational risk, and service-level attributes are not explicitly represented in the objective functions and remain outside the current analytical scope.
4. Results and Discussion
Calculation results are organized into four analytical sections that mirror the comparative framework: model feasibility and network overview (Section 4.1), cargo-specific freight cost performance (Section 4.2), head-to-head directional comparison across all key performance indicators (Section 4.3), and key structural findings with policy implications (Section 4.4). All performance metrics are reported as average values per cargo ton to enable cross-scenario and cross-directional comparability.
4.1. Model Overview: Feasibility and Modal Network Utilization
4.1.1. Solution Feasibility
The model was applied to 108 instances, 54 per direction across six commodity types, three demand scenarios (Q500, Q1000, and Q2000 tons/day), and three optimization objectives (minimum cost, minimum time, and minimum distance). Globally, 99 of the 108 instances represented active freight demand scenarios, yielding a 100% solution feasibility rate within active scenarios (which represent 91.7% of the total theoretical matrix). This comprises all 54 import cases (100%) and 45 active export cases (100% of active export scenarios), as summarized in Table 3. Commodity-specific flow quantities Q (ton/day) are proportionally disaggregated from the aggregate scenario quantity Q through a fixed commodity-share structure [6,31]; the MCF flow-balance condition requires only that cargo-specific supply equals cargo-specific demand within each instance, independent of Q [7,12].
Table 3.
Comparative feasibility overview of export and import MCF models.
The evaluation of network performance is strictly based on the 99 feasible operational instances. Feasibility in a single-commodity MCF problem is theoretically guaranteed whenever total supply equals total demand on a connected network [7]; both conditions were satisfied across all active instances, these conditions were satisfied across all active instances, indicating that the modeled network could accommodate the designated commodity-specific demand levels under the independently applied capacity constraints. The computational feasibility of the active scenarios is further supported by the successful solution of all 18 high-value import cases under identical physical network parameters.
Both models incorporate four transport modes: railway, road, inland waterway, and air, and six cargo categories, with network data sourced from field surveys and official statistics [24,25,26,27,28,34]. Import arcs were constructed by reversing unimodal edges while retaining bidirectional intermodal connectors, a standard procedure for constructing directional MCF networks [7,12]. Under cost-based assignment, average transport distances were 301.69 km/ton (export) and 429.36 km/ton (import), a 42.4% disparity reflecting the greater inland penetration required from import gateway nodes N72, N33, and N60 to dispersed demand centers, consistent with transport distance asymmetries documented in landlocked freight corridor studies [1]. Railway was the dominant mode in all 99 feasible solutions across both directions, every cargo type, and all objectives. This dominance should be interpreted within the assumptions of the commodity-specific optimization framework, where individual commodity categories do not compete for shared network capacity during model execution. Consequently, railway utilization may be higher than would be expected under a fully coupled multicommodity network flow model with shared capacity constraints.
4.1.2. Modal Network Link Utilization and Capacity Headroom
Under cost-based assignment, maximum link utilization in the export direction ranged from 2.26% (forest, Q500) to 100% (industrial, Q2000), reflecting progressive capacity saturation as demand scales (Table 4). The import direction exhibited a substantially narrower range of 1.15% (forest, Q500) to 41.64% (industrial, Q2000), with no import commodity reaching saturation under cost-based routing at any demand level. The import network’s cost-efficient corridors therefore retain significant capacity headroom throughout the modeled demand range, indicating that, within the evaluated demand range up to Q2000, the cost-based import network retained substantial capacity headroom on the most heavily utilized links.
Table 4.
Maximum link utilization (%) under cost-based assignment by cargo type and demand scenario.
Under time- and distance-based assignment, 100% link utilization was observed in all non-cost solutions across both directions, confirming that the fastest and shortest corridors are universally capacity-constrained. Active network links expanded from 28 to 35 under the minimum-cost objective to 38–41 under the minimum-time objective and 39–40 under the minimum-distance objective in the export direction. In the import direction, active links increased from 32 to 34 under the minimum-cost objective to 34–38 under both the minimum-time and minimum-distance objectives, as summarized in Table 5. This network-wide expansion under non-cost objectives reflects progressive freight redistribution across secondary corridors to bypass saturated primary links, a pattern that simultaneously increases network engagement and eliminates the capacity resilience buffers maintained under cost-based routing [7,36].
Table 5.
Active network links and routes by optimization objective (range across all cargo types and demand scenarios).
- Railway Transport Utilization
Railway transport within the multimodal freight network was the most operationally important and served as the principal freight backbone throughout the analysis. The railway system in this study comprises 11 stations along the Laos–China Railway (LCR) corridor, of which nine provide integrated cargo and passenger services (Figure 4a), while the remaining stations function primarily as passenger-only facilities [27,28]. The nine freight-capable stations serve as key logistics nodes for cargo loading and unloading, with a daily cargo handling capacity ranging from 2800 to 3000 tons/day [27,28], and are therefore incorporated into the freight transport network model. These railway freight nodes connect to road, waterway, and air transport facilities, dry ports, and logistics-company nodes via intermodal transfer links, enabling cargo movement across modes based on cost, travel time, distance, and capacity constraints. Railway transport was the dominant mode in all 99 feasible model solutions, consistently across all cargo types, demand scenarios, and optimization objectives in both export and import directions. Under cost-based freight assignment, railway dominance reflects the LCR’s structural cost advantage in long-haul transport segments, which account for a large share of total ton-kilometer movement. Under time- and distance-based assignment, railway dominance persisted because the railway network provided the most direct and efficient connectivity between supply and demand nodes throughout the study area [8,29]. However, railway links reached 100% utilization, indicating that railway capacity is a binding constraint in time-optimal and distance-optimal freight allocation scenarios. This finding highlights the strategic role of freight-capable railway stations as critical multimodal hubs that influence overall system performance and future transport resilience under increasing freight demand [1,3,36].
Figure 4.
Spatial distribution and network structure of railway and road transport systems integrated into the multimodal freight transport framework in central and northern Lao PDR: (a) railway freight network and intermodal connections; (b) road logistics network and company-based transport connectivity.
- Road Transport Utilization
Road transport utilization played a complementary yet indispensable role within the multimodal freight transport network. The broader road freight inventory used for network parameterization comprises records from 325 logistics companies distributed across central and northern Lao PDR. Based on their spatial distribution and operational connectivity, 16 representative road nodes were incorporated into the final MCF network and connected through major national and provincial transport corridors (Figure 4b). These logistics nodes represent freight operators, distribution centers, and local transport service points that provide spatial accessibility between production zones, logistics hubs, dry ports, railway stations, and international border crossings. Compared with other transport modes, the road system possesses the most extensive spatial coverage and serves as the principal accessibility layer connecting dispersed freight origins and destinations throughout the study area [4,26]. Within the network structure, road transport functioned primarily as a first-mile and last-mile connector in all feasible solutions, providing access links between supply and demand locations and the nearest railway transshipment points [8,37]. No solution identified road transport as the dominant freight mode for any cargo type, transport direction, or optimization objective. This finding indicates that while railway transport handled long-distance freight movement, road transport remained essential for local accessibility and intermodal integration. The approximation of intermodal transfer-link costs using road transport parameters, reflecting the road-dominant nature of freight logistics in Lao PDR, is consistent with field survey observations and is reflected by the minimum-cost flow (MCF) allocation results across all scenarios [4,25,26]. The road network, therefore, acts as a critical supporting component within the multimodal transport system rather than an independent long-haul freight backbone. Its strategic role in this research is to facilitate cargo transfers among road, railway, air, and inland waterway systems, thereby improving multimodal connectivity and increasing network flexibility under different demand and operational conditions. These findings further demonstrate that road infrastructure remains fundamental to maintaining freight accessibility and enhancing transport resilience, even though it is not the dominant mode in optimized freight allocation solutions [1,36].
- Inland Waterway Transport Utilization
Inland waterway transport played a supplementary rather than dominant role within the multimodal freight transport network. The broader inland waterway infrastructure inventory comprised 20 identified port locations (N61–N80) distributed along the Mekong River and its major tributaries. Of these, 11 operationally connected port nodes with sufficient transport and connectivity data were incorporated into the final MCF network (Figure 5a). These nodes relate to roads, railways, dry ports, and logistics facilities through intermodal transfer links, thereby supporting regional freight accessibility and cross-modal cargo movement [8,17,18]. Historically, the Mekong River corridor served as an important freight and trade route due to its relatively low transport costs and its role in regional and cross-border connectivity [17,18]. However, field observations conducted after the COVID-19 period indicated substantial operational changes across several inland port areas. Conventional freight activity declined at multiple ports in Vientiane Capital, Vientiane Province, Xayaboury Province, and Luang Prabang Province, as vessel operations increasingly shifted toward sand and stone extraction. In contrast, ports such as Pak Beng, Tonpheung, Mom, and Xiengkok continued to support freight movement under both wet- and dry-season conditions and remained strategically important along the upper Mekong corridor. Despite continued operation at selected ports, inland waterway transport was not identified as either a dominant mode or a best-route configuration in any of the 99 feasible model solutions. The Mekong corridor was represented using vessel operating speeds of approximately 10–25 km/h [17] and payload capacities derived from MPWT fleet statistics [24]. Under these transport conditions, inland waterway services remained less competitive than railway transport across the central and northern Lao PDR freight corridors. In addition, river transport performance remains sensitive to seasonal navigability conditions and hydrological variability associated with Mekong basin development, including hydropower regulation and fluctuating water levels [17,18]. These operational limitations help explain the limited competitiveness of inland waterway transport within the minimum-cost flow allocation results.
Figure 5.
Spatial distribution and network structure of inland waterway and air transport systems integrated into the multimodal freight transport framework in central and northern Lao PDR: (a) inland waterway network and river–port connectivity; (b) airport network and domestic air transport connectivity.
- Air Transport Utilization
Air transport played a specialized and complementary role within the multimodal freight transport network, but did not emerge as either a dominant mode or a best route configuration in any feasible model solution. The broader aviation infrastructure inventory comprised 10 airports across the central and northern Lao PDR. Of these, nine airport nodes with sufficient cargo-throughput and network-connectivity data were incorporated into the final MCF network (Figure 5b). These airport nodes are integrated with road, railway, dry port, and logistics systems via intermodal transfer links, thereby improving regional accessibility and multimodal network connectivity [1,8,11]. The absence of air transport utilization within the optimized routing solutions is primarily attributable to the relatively high generalized transport cost assigned within the freight allocation framework. Air transport cost adjustment factors ranged from 2.00 to 2.50 for industrial and agricultural cargo, while mineral and forest cargo were effectively excluded from air routing due to prohibitive penalty values. Air freight operations were represented using domestic airport throughput statistics and ATR 72–600 operational characteristics, reflecting the comparatively high unit transport cost associated with domestic air cargo services relative to railway and road alternatives [25,29,35]. From an operational perspective, air transport remains more suitable for low-volume, high-value, and time-sensitive freight categories requiring rapid delivery and high service reliability [6,38]. However, these commodity categories account for only a limited share of total freight movement within the modeled corridors of central and northern Lao PDR. Consequently, the minimum-cost flow allocation process consistently favored railway and road transport due to their lower transport costs and broader corridor accessibility. Although air transport was not selected under normal cost-efficient operating conditions, its inclusion improves network completeness and provides additional routing flexibility in the event of future emergencies, disruptions, or time-critical logistics scenarios [14,39]. The incorporation of airport nodes therefore enhances multimodal accessibility and long-term transport system resilience in remote, geographically constrained regions of Lao PDR.
- Multimodal Interaction and System-Level Implications
The coexistence of rail-centered freight allocation and multimodal best-route structures demonstrates that intermodal interoperability improves both economic and operational efficiency within the Lao PDR freight network. The results indicate that railway corridor expansion and intermodal connector development should be treated as complementary investment priorities rather than competing infrastructure strategies [8,11,20]. Under the minimum-distance objective, export freight favored pure rail routing, whereas import freight continued to depend on multimodal routing structures. This directional contrast reflects the structural dependence of the import system on gateway transfer accessibility. The persistent requirement for gateway connectors at import access nodes represents a critical first-mile constraint that affects import freight efficiency and overall logistics performance [1,37].
4.2. Cargo-Specific Freight Cost Performance
4.2.1. Export Direction: Cost-Based Freight Assignment
Under cost-based assignment, export unit costs were nearly invariant across demand scenarios for all commodity types (Table 6), consistent with constant returns to scale in rail freight cost functions. Perishable cargo recorded the highest unit cost (34.16–34.18 USD/ton), reflecting penalties for cold-chain infrastructure and restricted link eligibility. Forest and mineral cargoes were the least costly (24.04–24.17 USD/ton), benefiting from broad access to bulk rail corridors. Shifting to time- or distance-based objectives induced severe unit cost escalation for bulk commodities: minerals reached 35,361 USD/ton and forest 133,298 USD/ton at Q500 under minimum-time routing (Table 7), arising from binding capacity constraints on high-performance corridors [7]. An inverse demand-scale effect was evident across all types; escalation severity diminished with increasing Q, consistent with the volume-spreading mechanism in congested networks.
Table 6.
Export unit freight cost below the minimum cost objective.
Table 7.
Export unit cost under minimum-time objective and escalation relative to minimum-cost baseline.
The limited variation in unit transport cost across the Q500–Q2000 demand scenarios reflects the assumptions of the proposed minimum-cost flow framework. Link transport costs (USD/ton) were treated as fixed parameters and did not vary with freight volume. Moreover, the simulated demand levels remained within the available capacity of the preferred low-cost corridors for most commodity groups. Consequently, the optimal routing pattern remained essentially unchanged across demand scenarios, resulting in nearly constant unit transport costs. Only when freight demand approaches or exceeds the capacity of the least-cost links would the model be forced to utilize higher-cost alternative routes, leading to noticeable increases in average transport cost.
4.2.2. Import Direction: Cost-Based Freight Assignment
Import unit costs showed stronger demand than export unit costs (Table 8). Industrial and mineral costs were exactly invariant across all Q levels (64.72 and 51.69 USD/ton, respectively), consistent with maximum arc utilization remaining below 42% at Q2000. This indicates that the least-cost corridors retained sufficient spare capacity even under the highest demand scenario (Q2000). Because the capacity constraints were not binding, the optimal routing pattern remained essentially unchanged, eliminating the need to reroute freight to more expensive alternative links. Consequently, the average unit transport costs remained nearly constant across the evaluated demand scenarios. Noticeable increases in average unit transport cost would be expected only if freight demand exceeded the capacity of the least-cost corridors, forcing freight to be reassigned to higher-cost alternative routes—well below the shadow-price activation threshold [7]. Perishable cargo again recorded the highest average cost (139.64 USD/ton), compounded by cold-chain link restrictions and longer gateway distribution paths. High-value cargo occupied an intermediate tier (93.73 USD/ton) due to security and handling constraints [37,38]. Under speed- and distance-based assignment, bulk categories experienced severe cost escalation (mineral: 36,574 USD/ton; forest: 108,783 USD/ton at Q500), with a pronounced inverse demand-scale effect confirming the role of freight consolidation as a cost-reduction mechanism.
Table 8.
Import unit freight cost under the minimum-cost objective.
4.2.3. Cross-Directional Cost, Time, and Distance Summary
Table 6, Table 8, Table 9, Table 10 and Table 11 collectively demonstrate that import unit costs, transit times, and route distances exceed those for exports across all comparable cargo types. Under cost-based routing, import distances average ~420 km versus ~302 km in the export direction; import transit times average ~17.7 h versus ~7.1 h. Under time- and distance-based routing, the import network exhibits a unique structural property: minimum-time and minimum-distance solutions are numerically identical for all cargo types and demand scenarios, implying path collinearity between speed-optimal and distance-optimal corridors (discussed further in Section 4.3.3).
Table 9.
Cross-directional cost comparison under minimum-cost objective (USD/ton).
Table 10.
Average travel time (h/ton) by objective and direction.
Table 11.
Average route distance (km/ton) by objective and direction.
4.3. Head-to-Head Directional Comparison
4.3.1. Cost, Distance, and Transit Time Asymmetry
Import unit costs exceeded export costs by 2.14–4.09 times under cost-based assignment (Table 12). This disparity exceeded the corresponding distance ratio (1.39–1.57×), reflecting longer transport distances, gateway transfer requirements, reversed arc-cost structures, and cargo-specific handling characteristics. Import transit times were also 1.94–2.78 times longer than export transit times.
Table 12.
Cross-directional transport performance under cost-based routing at Q500.
4.3.2. Best-Route Mode: A Directional Structural Contrast
The optimization objective and flow direction jointly determined the best-route mode selection (Table 13; Figure 6 and Figure 7). The six representative network graphs, three for the export direction (Figure 6a–c) and three for the import direction (Figure 7a–c), illustrate how routing structure varies systematically across objectives and directions, providing direct visual evidence for the structural findings discussed below.
Table 13.
Best-route mode and gateway connector characteristics by objective and direction—all cargo types, Q500–Q2000.
Figure 6.
Representative export freight allocation patterns under (a) cost-based optimization. Agricultural cargo, Q500, minimum cost; (b) time-based optimization. Perishable cargo, Q1000, minimum time; and (c) distance-based optimization. Industrial cargo, Q2000, minimum distance. Colored routes indicate the five best-performing paths under each objective. Multimodal routing dominates under cost- and time-based objectives (a,b), while pure-rail routing yields the best route under minimum-distance optimization (c), reflecting the presence of shorter direct rail corridors in the export network.
Figure 7.
Representative import freight allocation patterns under (a) cost-based optimization. Mineral cargo, Q500, minimum cost; (b) time-based optimization. High-value cargo, Q500, minimum time, and (c) distance-based optimization. Industrial cargo, Q1000, minimum distance. In contrast to the export direction, multimodal routing yields the best route across all three objectives in the import direction (a–c), attributable to the structurally unavoidable 17.0 km gateway connector at border nodes N72, N33, and N60, present on every import path regardless of the optimization objective.
Under minimum-cost and minimum-time objectives, multimodal routing constitutes the best individual route in both directions across all cargo types and demand scenarios (Figure 6a,b and Figure 7a,b), consistent with the cost advantage of intermodal transfer through intermediate transshipment nodes. As shown in Figure 6a,b, export freight under both cost- and time-based assignments follows multimodal paths that combine road connector segments with railway mainline corridors, accessing lower unit-cost or faster links through intermediate dry-port and gateway transfer nodes. The same multimodal structure is evident in Figure 7a,b for the import direction, where freight entering through gateway nodes N72, N33, and N60 is distributed inland via multimodal paths regardless of whether cost or time is being minimized. These results indicate that multimodal integration improves overall network performance by allowing freight to exploit the complementary strengths of different transport modes. Road transport primarily provides first- and last-mile accessibility, whereas railway transport offers efficient long-distance freight movement. Consequently, combining these transport modes enables the routing algorithm to achieve lower transport costs or shorter travel times than would be possible using any single transport mode independently. This finding highlights the importance of well-connected intermodal transfer facilities, dry ports, and gateway nodes in facilitating efficient freight movement across the multimodal network.
At the minimum-distance objective, a clear directional contrast emerged, which is directly visible in the network figures. Figure 6c shows that export freight under distance minimization follows pure-rail paths; colored routes are confined to the Railway Network layer, bypassing road connector segments entirely, confirming that direct rail mainlines offer spatially shorter connections than any multimodal alternative in the export direction. By contrast, Figure 7c shows that, under distance minimization, import freight retains multimodal routing, with routes traversing the 17.0 km gateway connector segment (0.26 h) at border nodes before accessing the rail mainline. This connector is structurally unavoidable on every import path regardless of objective, as confirmed by its uniform presence across all 54 import solutions (Table 13, connector columns). This directional difference reflects the underlying topology of the freight transport network rather than differences in optimization performance. Export freight originates within the domestic network and can directly access the railway system through existing freight stations, allowing pure railway routes to provide the shortest feasible paths. In contrast, import freight must first enter the domestic network through international border gateways before reaching inland railway corridors. As a result, an initial intermodal transfer is unavoidable, making multimodal routing structurally necessary even when transport distance alone is minimized. From a transport planning perspective, these findings emphasize that improving gateway accessibility and intermodal connectivity may produce greater improvements in import logistics performance than railway expansion alone.
The objective-dependent mode switch in the export direction, multimodal under minimum-cost and minimum-time (Figure 6a,b) and rail under minimum-distance (Figure 6c), illustrates the tension between economic efficiency and spatial efficiency in intermodal network design [8,19]. The structural necessity of the import gateway connector, evident in Figure 7a–c, implies that gateway quality and throughput capacity are binding constraints on import logistics performance that rail mainline investment alone cannot relax [8,11]. In practical terms, any policy targeting import freight performance improvement must address gateway connector capacity and reliability as a primary lever, rather than treating the mainline and the connector as independent investment priorities.
4.3.3. Time Objective vs. Distance Objective: A Unique Import Network Property
Minimum-time and minimum-distance solutions were numerically identical across all 54 import cases, unit cost, transit time, route distance, arc utilization, arc count, and route count, while remaining distinct in the export direction (e.g., industrial cargo: 254.87 km/ton min-time vs. 250.31 km/ton min-distance at Q500). This equivalence reflects the convergence of speed-optimal and distance-optimal paths onto the same reversed rail corridors in the import network, consistent with shortest-path duality in symmetric link-cost networks [7]. The property has a direct policy implication: in the import direction, any corridor intervention that reduces transit time simultaneously and proportionally reduces transport distance, indicating that the independently evaluated time- and distance-based assignments converge to the same routing pattern and thereby simplify import corridor prioritization and investment prioritization for import logistics.
4.4. Key Structural Findings and Policy Implications
4.4.1. Rail Dominance Requires Intermodal Integration to Realize System-Level Gains
Rail accounted for most of the freight allocation across all 99 solutions. However, multimodal routing constituted the best individual route under cost and time objectives in both directions, confirming that system performance depends on intermodal integration rather than railway capacity alone [8,10,11]. The observed railway dominance should be interpreted within the assumptions of the proposed commodity-specific optimization framework. Because each commodity category was optimized independently, railway capacity was not simultaneously shared among different commodity categories during optimization. Consequently, railway utilization may be overestimated compared with that expected under a fully coupled multicommodity network flow model with shared capacity constraints [7,13]. Therefore, the railway dominance reported in this study reflects the assumptions adopted in the proposed commodity-specific optimization framework rather than actual competition among commodity categories and should be interpreted accordingly.
Consistent with this interpretation, the freight demand scenarios adopted in this study should be interpreted as comparative structural simulations rather than empirical forecasts of actual regional freight demand. Because the proportional demand scaling approach does not explicitly account for spatial economic heterogeneity or differences in industrial structure among provinces, the policy implications derived from the results should be interpreted within the assumptions of the proposed framework. Furthermore, the transport cost and capacity parameters were parameterized using field survey data and official operational statistics collected during 2024 [24,25,26,27,28]. Therefore, the observed railway dominance reflects the current operational characteristics of the Lao freight transport system together with the assumptions and parameter structure of the proposed optimization framework.
The 17.0 km import gateway connector, present on every import path regardless of objective, establishes gateway quality as a binding constraint on import logistics performance. Rail mainline expansion without concurrent investment in gateways and connectors will not fully translate into improvements in import performance [3,8,11]. From a practical management and policy perspective, the proposed framework provides a decision-support tool for multiple stakeholders. Government agencies can use the framework to prioritize investments in critical transport corridors, intermodal transfer facilities, and border gateway infrastructure based on corridor utilization and routing performance. Transport planners can evaluate alternative routing strategies under different freight demand scenarios to improve network efficiency, while logistics operators can compare transport costs, travel times, transport distances, and modal utilization across cargo categories to support commodity-specific routing and resource allocation. These applications are particularly valuable in developing countries, where detailed freight origin–destination data remain limited.
The model results were not externally validated against observed route-level freight flows because comprehensive historical origin–destination shipment records and commodity-specific railway traffic data are not consistently available for Lao PDR. Although model parameters were derived from official statistics, the 2024 field survey, and available operational records, these data support parameterization rather than independent external validation of the optimized freight allocation results. Therefore, the findings should be interpreted as scenario-based network performance assessments rather than empirically validated reproductions of actual freight routing behavior.
4.4.2. Bulk Cargo Speed–Cost Trade-Off Requires Targeted Capacity Investment and Consolidation
Mineral and forest cargoes exhibited the most extreme speed–cost trade-offs in both directions (Table 14), confirming a directionally invariant capacity gap on high-performance bulk corridors [7,10]. Two policy levers follow. First, targeted capacity investment on specific bottleneck links identified at 100% arc utilization under speed-based assignment [11,18]. Second, freight consolidation to exploit the inverse demand-scale effect: mineral import unit costs halved with each doubling of demand (36,574 → 18,309 → 9182 USD/ton, Q500–Q2000), providing an economic rationale for shipper collaboration and hub consolidation as interim measures [8,18].
Table 14.
Unit cost escalation under minimum-time objective relative to minimum-cost baseline (Q500).
4.4.3. Import–Export Cost Asymmetry Exceeds Geographic Distance Asymmetry
Import costs were 2.14–4.09× higher than export costs while import distances were only 1.39–1.57× longer, leaving a residual cost premium of 1.52–2.61× driven by gateway transfer inefficiencies, reversed arc-cost structures, and directional handling differentials [7,15,20]. Reducing this asymmetry requires: (a) improving gateway transfer efficiency at major import nodes [1,8]; (b) developing reverse-direction rail tariff structures reflecting cost parity with export services [27,28]; and (c) targeted support for high-premium cargo types, particularly perishable goods (cost ratio 4.09× vs. distance ratio 1.57×) [6,31].
4.4.4. Perishable Cargo Requires Dedicated Cold-Chain and Gateway Interventions
Perishable cargo was simultaneously the highest-cost type in both directions (export: 34.17 USD/ton; import: 139.67 USD/ton), the sole outlier in import route distance (~475 km vs. ~420 km for all other types), and the cargo type with the largest import-to-export cost ratio (4.09×), all traceable to cold-chain link-eligibility constraints that exclude direct, cost-efficient corridors. Direct corridors are network-available: perishable import routes converge to ~380 km under time minimization, matching other cargo types. The gap between current and achievable performance is operational rather than structural and can be reduced through: (a) temperature-controlled intermodal facilities at import gateway nodes to eliminate transfer-related eligibility penalties [6,8]; and (b) consolidated shipment strategies to capture demand-scale cost reductions on constrained corridors [8,18].
5. Conclusions
This study developed and implemented a cargo-specific, multi-source, multi-sink minimum-cost flow (MCF) framework to conduct a comprehensive performance assessment of the multimodal freight transport network in central and northern Lao PDR. By evaluating link-level logistics costs, transit times, operational distances, and modal utilization rates across six distinct commodity categories, three demand scenarios (Q500, Q1000, and Q2000 tons/day), and three independently evaluated objectives (minimum cost, minimum time, and minimum distance), this research generated a scenario-based decision-support matrix. Of the 108 theoretical scenario combinations, 99 represented active freight demand instances and were successfully solved, corresponding to 91.7% of the full scenario matrix. The single-commodity algorithmic design approximated localized routing behaviors and macro-level distribution patterns, providing a structured basis for infrastructure planning in data-constrained developing economies where detailed historical origin–destination shipment logs are rarely accessible.
Three core structural insights emerge from the model results:
First, the railway network emerged as the principal long-haul mode within the evaluated scenarios. Railway transport accounted for the largest share of freight allocation across the 99 active demand instances, reflecting its structural tariff advantages and high operational capacity along primary long-distance corridors. However, the preferred routing configurations under both cost- and time-minimization objectives remained inherently multimodal. This structural coexistence indicates that macro-level network efficiency is not merely a function of rail line capacity but also relies heavily on intermodal integration, particularly localized road feeder networks, dry port access points, and gateway transshipment processes. Notably, the 17.0 km gateway connector arc present at international border nodes (N72, N33, and N60) emerged as a common structural constraint across import operations. This implies that standalone railway expansion may not fully improve international logistics performance unless concurrent investments address gateway transfer constraints.
Second, cargo-type heterogeneity substantially influenced network routing dynamics. Bulk commodities, particularly minerals and forest products, showed lower cost-based routing outcomes associated with economies of scale but experienced greater penalties under time-sensitive objectives. Conversely, perishable cargo represented the most economically sensitive category, exhibiting the highest unit costs, an anomalous cost-minimizing routing distance of approximately 475 km, and the largest import-to-export cost disparity (4.09 times). High-value commodities occupied a specialized tier, remaining highly dependent on secure, time-sensitive logistics corridors.
Third, a pronounced directional asymmetry emerged between export and import freight systems. Import costs exceeded export costs by 2.14–4.09 times, whereas the corresponding distance differences were substantially smaller. This contrast indicates that import logistics performance is influenced not only by transport distance but also by gateway transfer requirements and directional network structure. Moreover, under the independently evaluated minimum-time and minimum-distance objectives, the import network produced identical path topologies across all cargo categories, indicating a strong structural convergence in import routing patterns.
The proposed framework can support evidence-based transport planning, infrastructure investment prioritization, and commodity-specific logistics decision-making under data-limited conditions. By providing a consistent, scenario-based evaluation of transport costs, travel times, transport distances, freight allocation, and modal utilization, the framework offers practical decision support for government agencies, transport planners, and logistics operators in developing multimodal freight transport systems.
Several limitations bound the scope and interpretation of these scenario-based findings and concurrently define important avenues for future research. Most notably, the current single-commodity MCF formulation evaluates each cargo category independently; consequently, it does not capture direct inter-cargo competition for shared network capacity, which remains a primary limitation to be addressed through a true multicommodity flow extension with coupled capacity constraints. Additionally, intermodal transfer costs and terminal handling delays were approximated using standardized road transport parameters, which may underrepresent the specialized equipment requirements and complex handling rates characteristic of distinct cargo types. Lastly, the analytical boundary was restricted to normal operating conditions; thus, the network’s vulnerability, redundancy, and cascading failure characteristics under acute disruption scenarios such as climate-induced landslides, sudden infrastructure failures, or border closures were not explicitly modeled.
Although the proposed framework evaluates multimodal freight transport performance across multiple commodity categories under data-limited conditions in the Lao PDR, each category is currently optimized independently, without shared network capacity constraints. Therefore, the framework should be interpreted as a commodity-specific freight assessment model rather than a fully coupled multicommodity network flow model. To address these methodological limitations, future research will extend the current framework to a true multicommodity network flow model with shared network capacity constraints, enabling explicit competition among commodity groups and a more realistic representation of multimodal freight allocation. Furthermore, spatially disaggregated freight demand, derived from regional production statistics, industrial structure, and observed freight movements, will be incorporated to improve the empirical representation of freight demand. Future research will extend the proposed framework by incorporating transit cargo flows to enable a more comprehensive assessment of regional multimodal freight transport systems. Further methodological development will consider internationally standardized freight classification systems, such as the Harmonized System (HS) and NST 2007, to improve the comparability and transferability of cargo-specific analyses across different contexts. In addition, future extensions will explicitly represent intermodal transport units and terminal-handling operations to better capture transfer processes and operational characteristics within multimodal freight networks. Collectively, these developments are expected to enhance the realism, transferability, and international applicability of the proposed framework. Multimodal capacity estimation will also be further harmonized using a unified capacity assessment framework across all transport modes. In addition, external empirical validation against observed freight operations will be prioritized using observed origin–destination freight flows, official commodity-specific freight statistics, and actual railway freight traffic data as such datasets become available. A generalized-cost or multi-objective framework incorporating reliability, operational risk, and service-level attributes will also be developed to better represent real-world freight decision-making. The immediate subsequent steps will include empirical calibration of cargo-specific terminal-handling metrics and comprehensive network-disruption simulations. These advancements will refine the resilience profiles of transit corridors, ultimately strengthening multimodal connectivity and regional trade competitiveness across the Greater Mekong Subregion.
Author Contributions
Conceptualization, S.T. and F.K.; methodology, S.T. and F.K.; software, S.T.; validation, S.T. and F.K.; formal analysis, S.T.; investigation, S.T.; data curation, S.T.; writing—original draft preparation, S.T.; writing—review and editing, F.K. and T.N.; visualization, S.T.; supervision, F.K. and T.N. All authors have read and agreed to the published version of the manuscript.
Funding
This research was funded by the Japan International Cooperation Agency (JICA) under the Road Asset Management Program Scholarship (2024–2027).
Institutional Review Board Statement
Not applicable.
Informed Consent Statement
Not applicable.
Data Availability Statement
The data presented in this study are available from the corresponding author upon reasonable request. Some data are not publicly available due to institutional and governmental data-sharing restrictions.
Acknowledgments
The authors would like to express their sincere gratitude to the Public Works and Transport Institute, Ministry of Public Works and Transport, Lao PDR, for providing technical support and relevant data for this study. The authors also gratefully acknowledge the support of the Japan International Cooperation Agency (JICA) and Gifu University. Special thanks are extended to Fumitaka Kurauchi and Toshiyuki Nakamura for their academic guidance and valuable comments throughout the research process. During the preparation of this manuscript, the authors used ChatGPT (https://chatgpt.com/) (OpenAI) for language editing and to improve the clarity of the English text. The authors reviewed and edited all AI-assisted content and took full responsibility for the final content of the manuscript.
Conflicts of Interest
The authors declare no conflicts of interest.
References
- World Bank. Transforming Lao PDR from a Land-Locked to a Land-Linked Economy; World Bank: Washington, DC, USA, 2020; pp. 18–24. Available online: https://www.worldbank.org/en/country/lao/publication/transforming-lao-pdr-from-a-land-locked-to-a-land-linked-economy (accessed on 2 March 2026).
- Government of the Lao People’s Democratic Republic. The 9th Five-Year National Socio-Economic Development Plan (2021–2025); Ministry of Planning and Investment: Vientiane, Laos, 2021; pp. 45–52. Available online: https://rtm.org.la/wp-content/uploads/2024/10/ENG-9th-NSEDP-2021-2025.pdf (accessed on 18 June 2025).
- Asian Development Bank (ADB). Lao PDR Transport Sector Assessment, Strategy, and Road Map; ADB: Manila, Philippines, 2020; pp. 43–47. [Google Scholar]
- Gál, J.; Phoymany, S. The Situation of Freight Transport and Other Logistics Tasks in Laos. Analecta Tech. Szeged. 2024, 18, 1–6. [Google Scholar] [CrossRef] [Scilit]
- European Institute for Asian Studies (EIAS). From Landlocked to Landlinked: Transport Connectivity Development in Lao PDR; EIAS Policy Brief: Brussels, Belgium, 2024; Available online: https://eias.org/wp-content/uploads/2024/08/From-Landlocked-to-Landlinked-Transport-Connectivity-Development-in-Laos-Final.pdf (accessed on 26 December 2025).
- Mommens, K.; Van Lier, T.; Macharis, C. Multimodal Choice Possibilities for Different Cargo Types: Application to Belgium. Res. Transp. Bus. Manag. 2020, 37, 100528. [Google Scholar] [CrossRef] [Scilit]
- Ahuja, R.K.; Magnanti, T.L.; Orlin, J.B. Network Flows: Theory, Algorithms, and Applications; Prentice Hall: Englewood Cliffs, NJ, USA, 1993; pp. 35–41, 57–140, 272–275, 309–315. [Google Scholar]
- Crainic, T.G.; Kim, K.H. Intermodal Transportation. In Handbooks in Operations Research and Management Science; Barnhart, C., Laporte, G., Eds.; Elsevier: Amsterdam, The Netherlands, 2007; Volume 14, pp. 467–537. [Google Scholar] [CrossRef] [Scilit]
- Wieberneit, N. Service Network Design for Freight Transportation: A Review. OR Spectr. 2008, 30, 77–112. [Google Scholar] [CrossRef] [Scilit]
- Archetti, C.; Peirano, L.; Speranza, M.G. Optimization in Multimodal Freight Transportation Problems: A Survey. Eur. J. Oper. Res. 2022, 299, 1–20. [Google Scholar] [CrossRef] [Scilit]
- Beresford, A.K.C.; Banomyong, R.; Pettit, S. A Critical Review of a Holistic Model Used for Assessing Multimodal Transport Systems. Logistics 2021, 5, 11. [Google Scholar] [CrossRef] [Scilit]
- Guélat, J.; Florian, M.; Crainic, T.G. A Multimode Multiproduct Network Assignment Model for Strategic Planning of Freight Flows. Transp. Sci. 1990, 24, 25–39. [Google Scholar] [CrossRef] [Scilit]
- Gédéon, C.; Florian, M.; Crainic, T.G. Determining Origin-Destination Matrices and Optimal Multiproduct Flows for Freight Transportation over Multimodal Networks. Transp. Res. Part B Methodol. 1993, 27, 351–368. [Google Scholar] [CrossRef] [Scilit]
- Kaewfak, K.; Ammarapala, V.; Huynh, V.-N. Multi-objective Optimization of Freight Route Choices in Multimodal Transportation. Int. J. Comput. Intell. Syst. 2021, 14, 794–807. [Google Scholar] [CrossRef] [Scilit]
- Izadi, A.; Nabipour, M.; Titidezh, O. Cost Models and Cost Factors of Road Freight Transportation: A Literature Review and Model Structure. Fuzzy Inf. Eng. 2019, 11, 257–278. [Google Scholar] [CrossRef]
- Fahmiasari, H. Analysis of the China–Lao PDR Railway: Opportunities and Challenges of Mekong Logistics; Mekong Institute: Khon Kaen, Thailand, 2023; Available online: https://mekonginstitute.org/wp-content/uploads/2023/08/B3-Analysis-of-the-China-Lao-PDR-Railway-Opportunities-and-Challenges-of-Mekong-Logistics.pdf?utm_source=chatgpt.com (accessed on 3 April 2025).
- Mekong River Commission (MRC). Design of a Master Plan for Regional Waterborne Transport in the Mekong River Basin, Volume 1; MRC Secretariat: Vientiane, Laos, 2018; pp. 1–150. Available online: https://www.mrcmekong.org/?download_document=1&document_id=01FKR5T6PNH7CLP36NE5DJC7JHUDXWPVCG&name=Design-of-a-Master-Plan-for-Regional-Waterborne-Transport-in-the-Mekong-River-Basin-(Volume-1).pdf (accessed on 6 December 2024).
- Mekong River Commission (MRC). Design of a Master Plan for Regional Waterborne Transport in the Mekong River Basin, Volume 2; MRC Secretariat: Vientiane, Laos, 2018; pp. 1–200. Available online: https://www.mrcmekong.org/wp-content/uploads/2018/09/Design-of-a-Master-Plan-for-Regional-Waterborne-Transport-in-the-Mekong-River-Basin-Volume-2.pdf (accessed on 15 December 2024).
- Daganzo, C.F. Logistics Systems Analysis, 4th ed.; Springer: Berlin, Germany, 2005; pp. 145–165. Available online: https://link.springer.com/book/10.1007/3-540-27516-9 (accessed on 2 March 2026).
- Okyere, S.; Yang, J.; Adams, C.A. Optimizing the Sustainable Multimodal Freight Transport and Logistics System Based on the Genetic Algorithm. Sustainability 2022, 14, 11577. [Google Scholar] [CrossRef] [Scilit]
- Andersen, J.; Crainic, T.G.; Christiansen, M. Service Network Design with Management and Coordination of Multiple Fleets. Eur. J. Oper. Res. 2009, 193, 377–389. [Google Scholar] [CrossRef] [Scilit]
- Lao Statistics Bureau (LSB). Statistical Yearbook 2023; Ministry of Planning and Investment: Vientiane, Laos, 2024. Available online: https://seadelt.net/Asset/Source/Document_ID-564_No-01.pdf (accessed on 27 August 2025).
- Yamaguchi, T.; Shibasaki, R.; Samizo, H.; Ushirooka, H. Impact on Myanmar’s Logistics Flow of the East–West and Southern Corridor Development of the Greater Mekong Subregion—A Global Logistics Intermodal Network Simulation. Sustainability 2021, 13, 668. [Google Scholar] [CrossRef] [Scilit]
- Ministry of Public Works and Transport (MPWT). Annual Ministry of Public Works and Transport Statistic Book 2023; Ministry of Public Works and Transport: Vientiane, Laos, 2023; pp. 1–62.
- Department of Public Works and Transport (DPWT). Records of Active Logistics Firms and Road Freight Operations in Central and Northern Lao PDR; Field Survey Data Collected August–September 2024; Provincial Departments of Public Works and Transport: Vientiane, Laos, 2024.
- Department of Industry and Commerce (DIC); Provincial Chambers of Commerce. Provincial Import and Export Trade Statistics 2024: Central and Northern Lao PDR; Field Survey Data Collected January 2025; Department of Industry and Commerce: Vientiane, Laos, 2025.
- Laos National Railways (LNR). Railway Freight Tariff Rate Schedule: Domestic and Cross-Border Container Transport; Official Presentation Materials; Laos National Railways: Vientiane, Laos, 2023; pp. 1–20. [Google Scholar]
- Laos National Railways (LNR). Freight Throughput and Operational Data Along the Lao–China Railway Corridor; Laos National Railways: Vientiane, Laos, 2025. [Google Scholar]
- ATR Aircraft. ATR 72-600 Aircraft Characteristics—Airport and Maintenance Planning; ATR: Toulouse, France, 2020; pp. 12–18. Available online: https://www.atr-aircraft.com (accessed on 2 March 2026).
- Cruz-Mejía, O.; Letchford, A.N. A Survey on Exact Algorithms for the Maximum Flow and Minimum-Cost Flow Problems. Networks 2023, 82, 167–176. [Google Scholar] [CrossRef] [Scilit]
- Button, K. Transport Economics, 4th ed.; Edward Elgar Publishing: Northampton, MA, USA, 2022; pp. 1–544. [Google Scholar]
- Salimifard, K.; Bigharaz, S. The Multicommodity Network Flow Problem: State of the Art Classification, Applications, and Solution Methods. Oper. Res. Int. J. 2022, 22, 1–47. [Google Scholar] [CrossRef] [Scilit]
- Panteia; Netherlands Ministry of Infrastructure and Water Management. Cost Figures for Freight Transport; Rijkswaterstaat: Utrecht, The Netherlands, 2023; pp. 1–120. Available online: https://www.kimnet.nl/site/binaries/site-content/collections/documents/2023/03/30/kostenkengetallen-voor-het-goederenvervoer/Cost%2Bfigures%2Bfor%2Bfreight%2Btransport_def.pdf (accessed on 24 November 2025).
- Department of Civil Aviation (DCA). Domestic Airport Cargo Throughput Statistics 2023; Ministry of Public Works and Transport: Vientiane, Laos, 2025.
- Jane’s All the World’s Aircraft. ATR 72-600 Performance and Specifications; Jane’s Information Group: London, UK, 2022; pp. 245–248. [Google Scholar]
- Kurniawan, D.A. Multimodal Logistics for Resilient and Sustainable Global Supply Chains: Strategic Insights from Integrated Transport Systems. Sinergi Int. J. Logist. 2024, 2, 213–224. [Google Scholar] [CrossRef] [Scilit]
- Karam, A.; Jensen, A.J.K.; Hussein, M. Analysis of the Barriers to Multimodal Freight Transport and Their Mitigation Strategies. Eur. Transp. Res. Rev. 2023, 15, 43. [Google Scholar] [CrossRef] [Scilit]
- United Nations Conference on Trade and Development (UNCTAD). Global Transport Costs Dataset in International Trade (GTCDIT); UNCTAD Research Paper No. 85; UNCTAD: Geneva, Switzerland, 2022; pp. 1–30. Available online: https://unctad.org/system/files/official-document/ser-rp-2022d5_en.pdf (accessed on 16 January 2026).
- UIC (International Union of Railways). UIC Code 571-4: Wagons—Loads on Wagons; UIC: Paris, France, 2012; pp. 14–18. [Google Scholar]
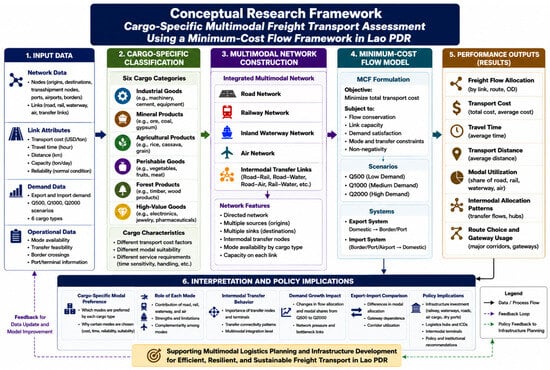
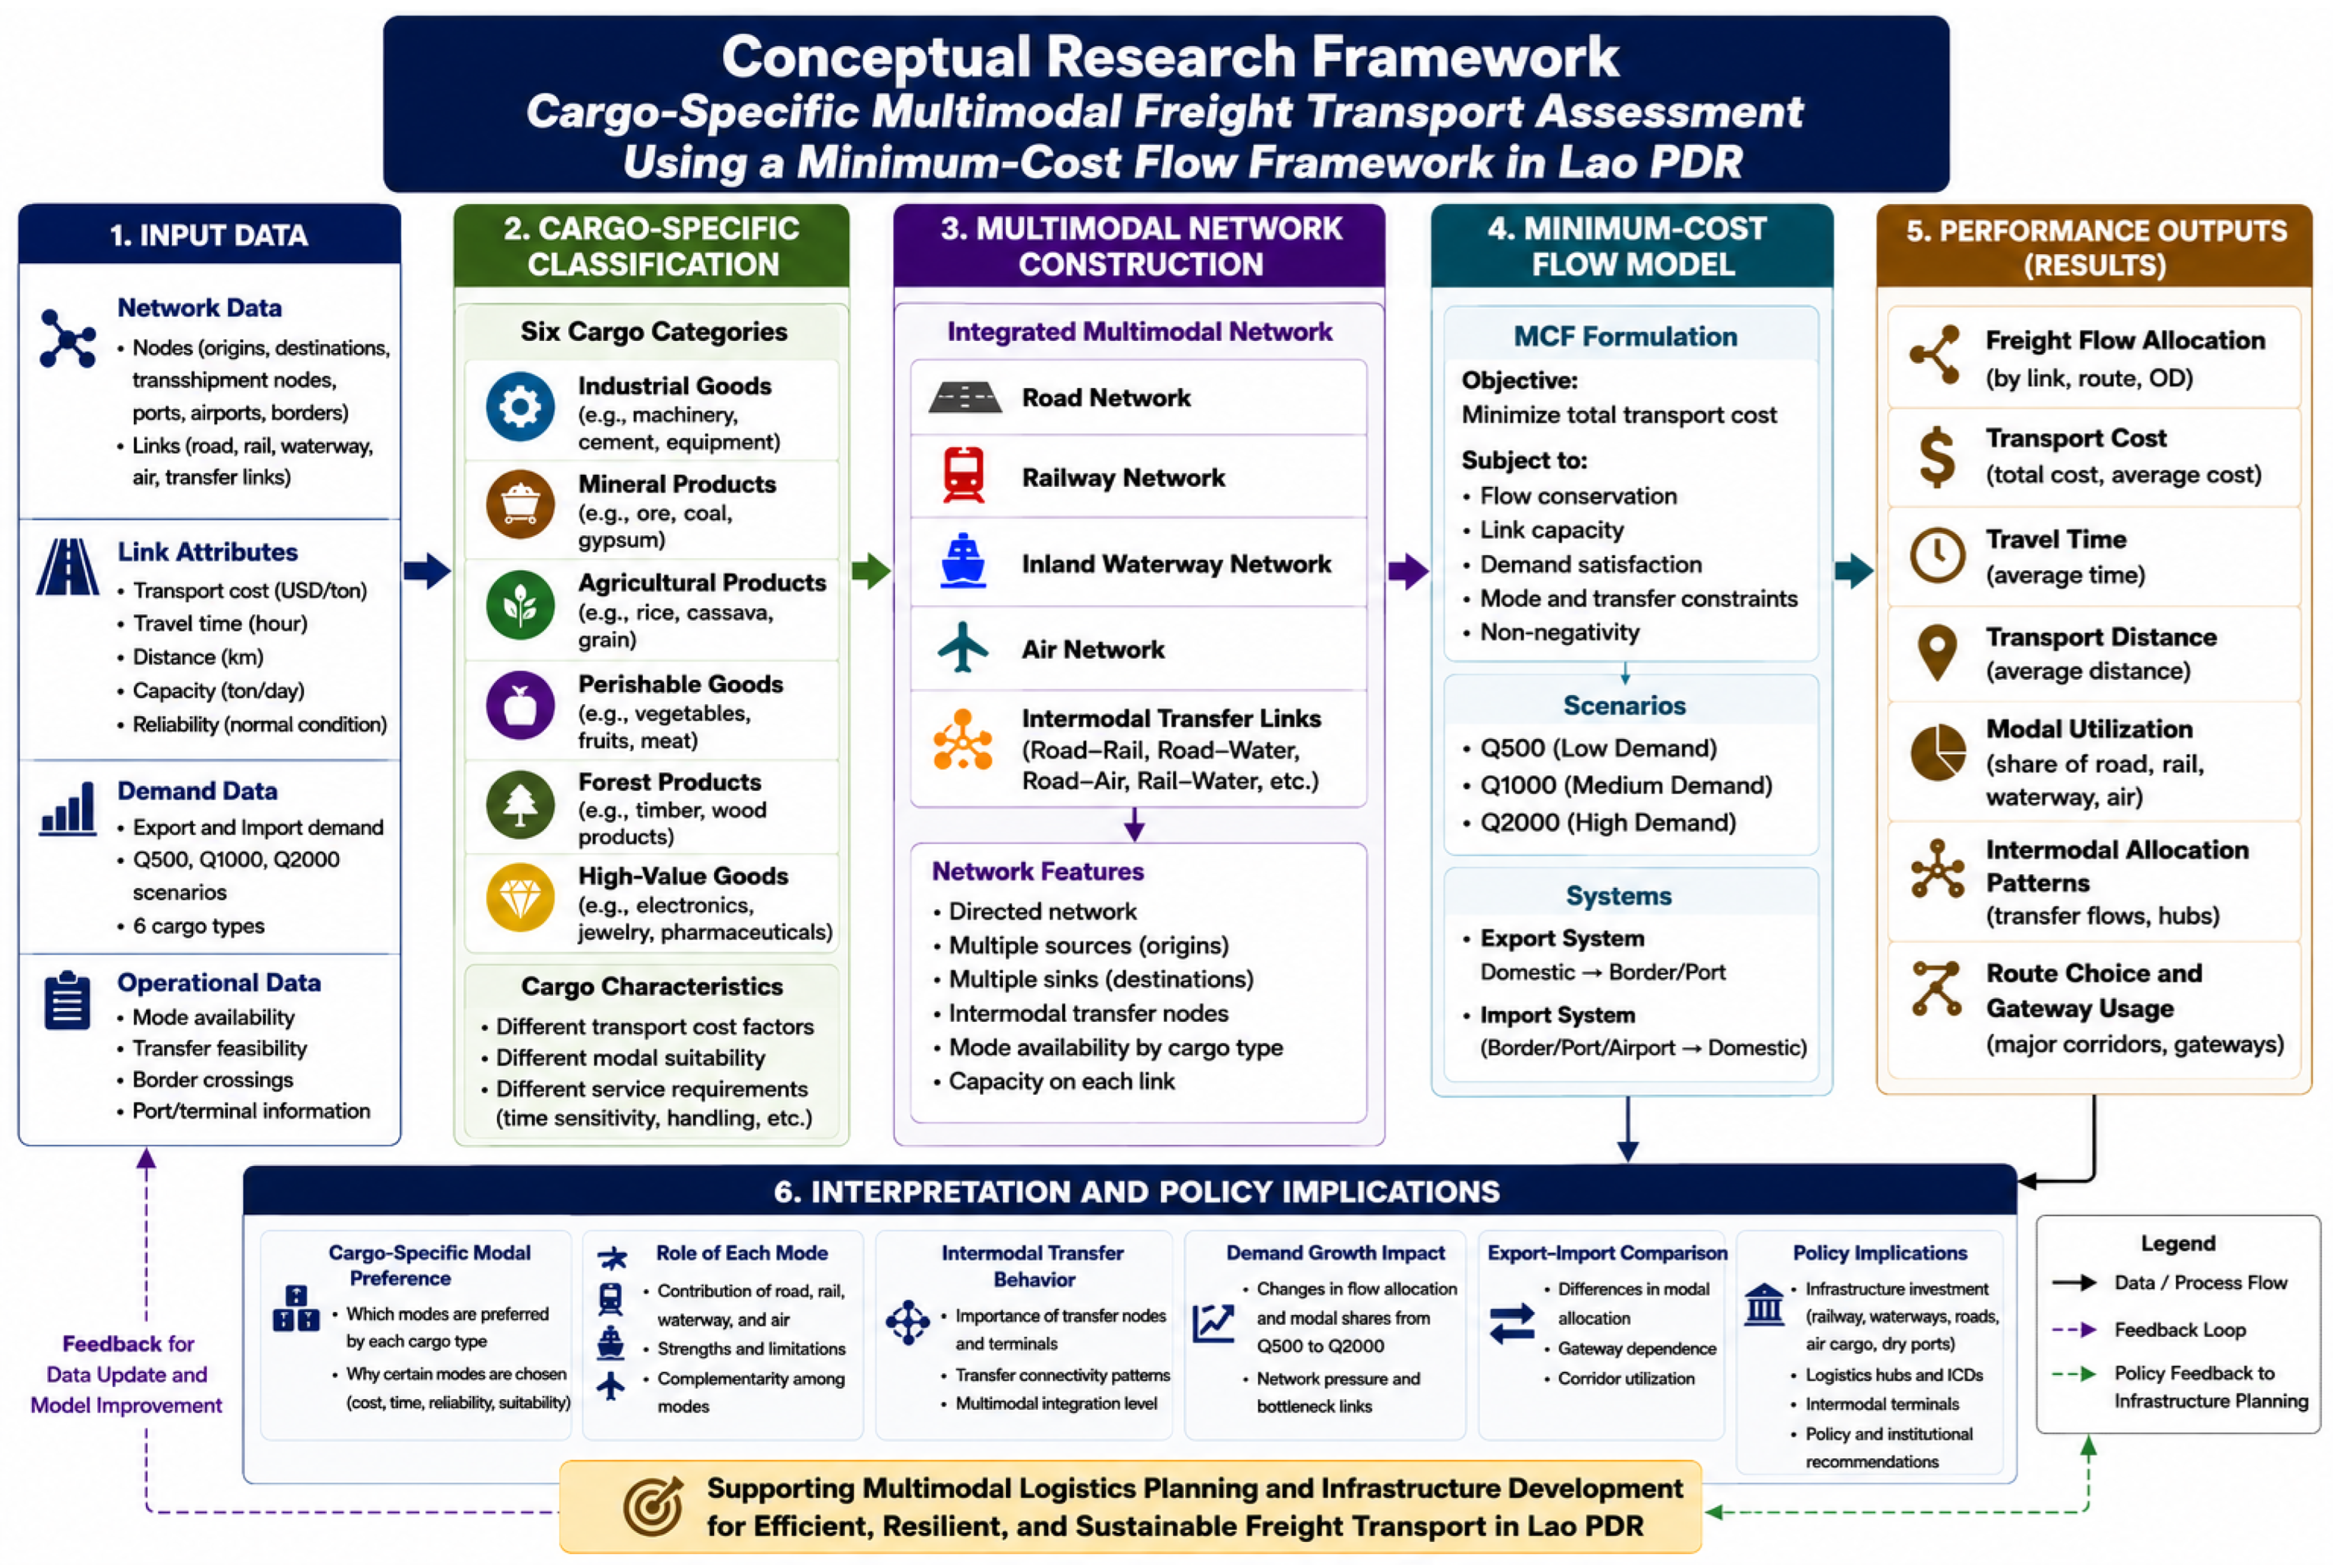
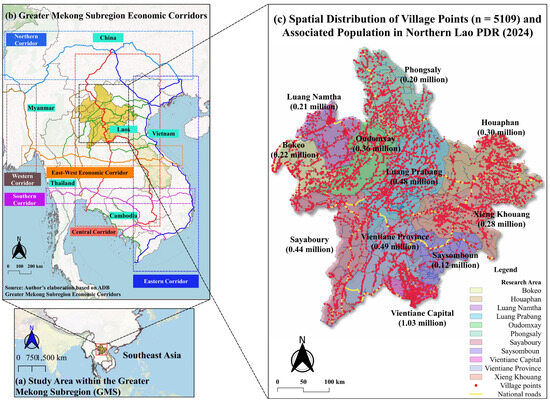
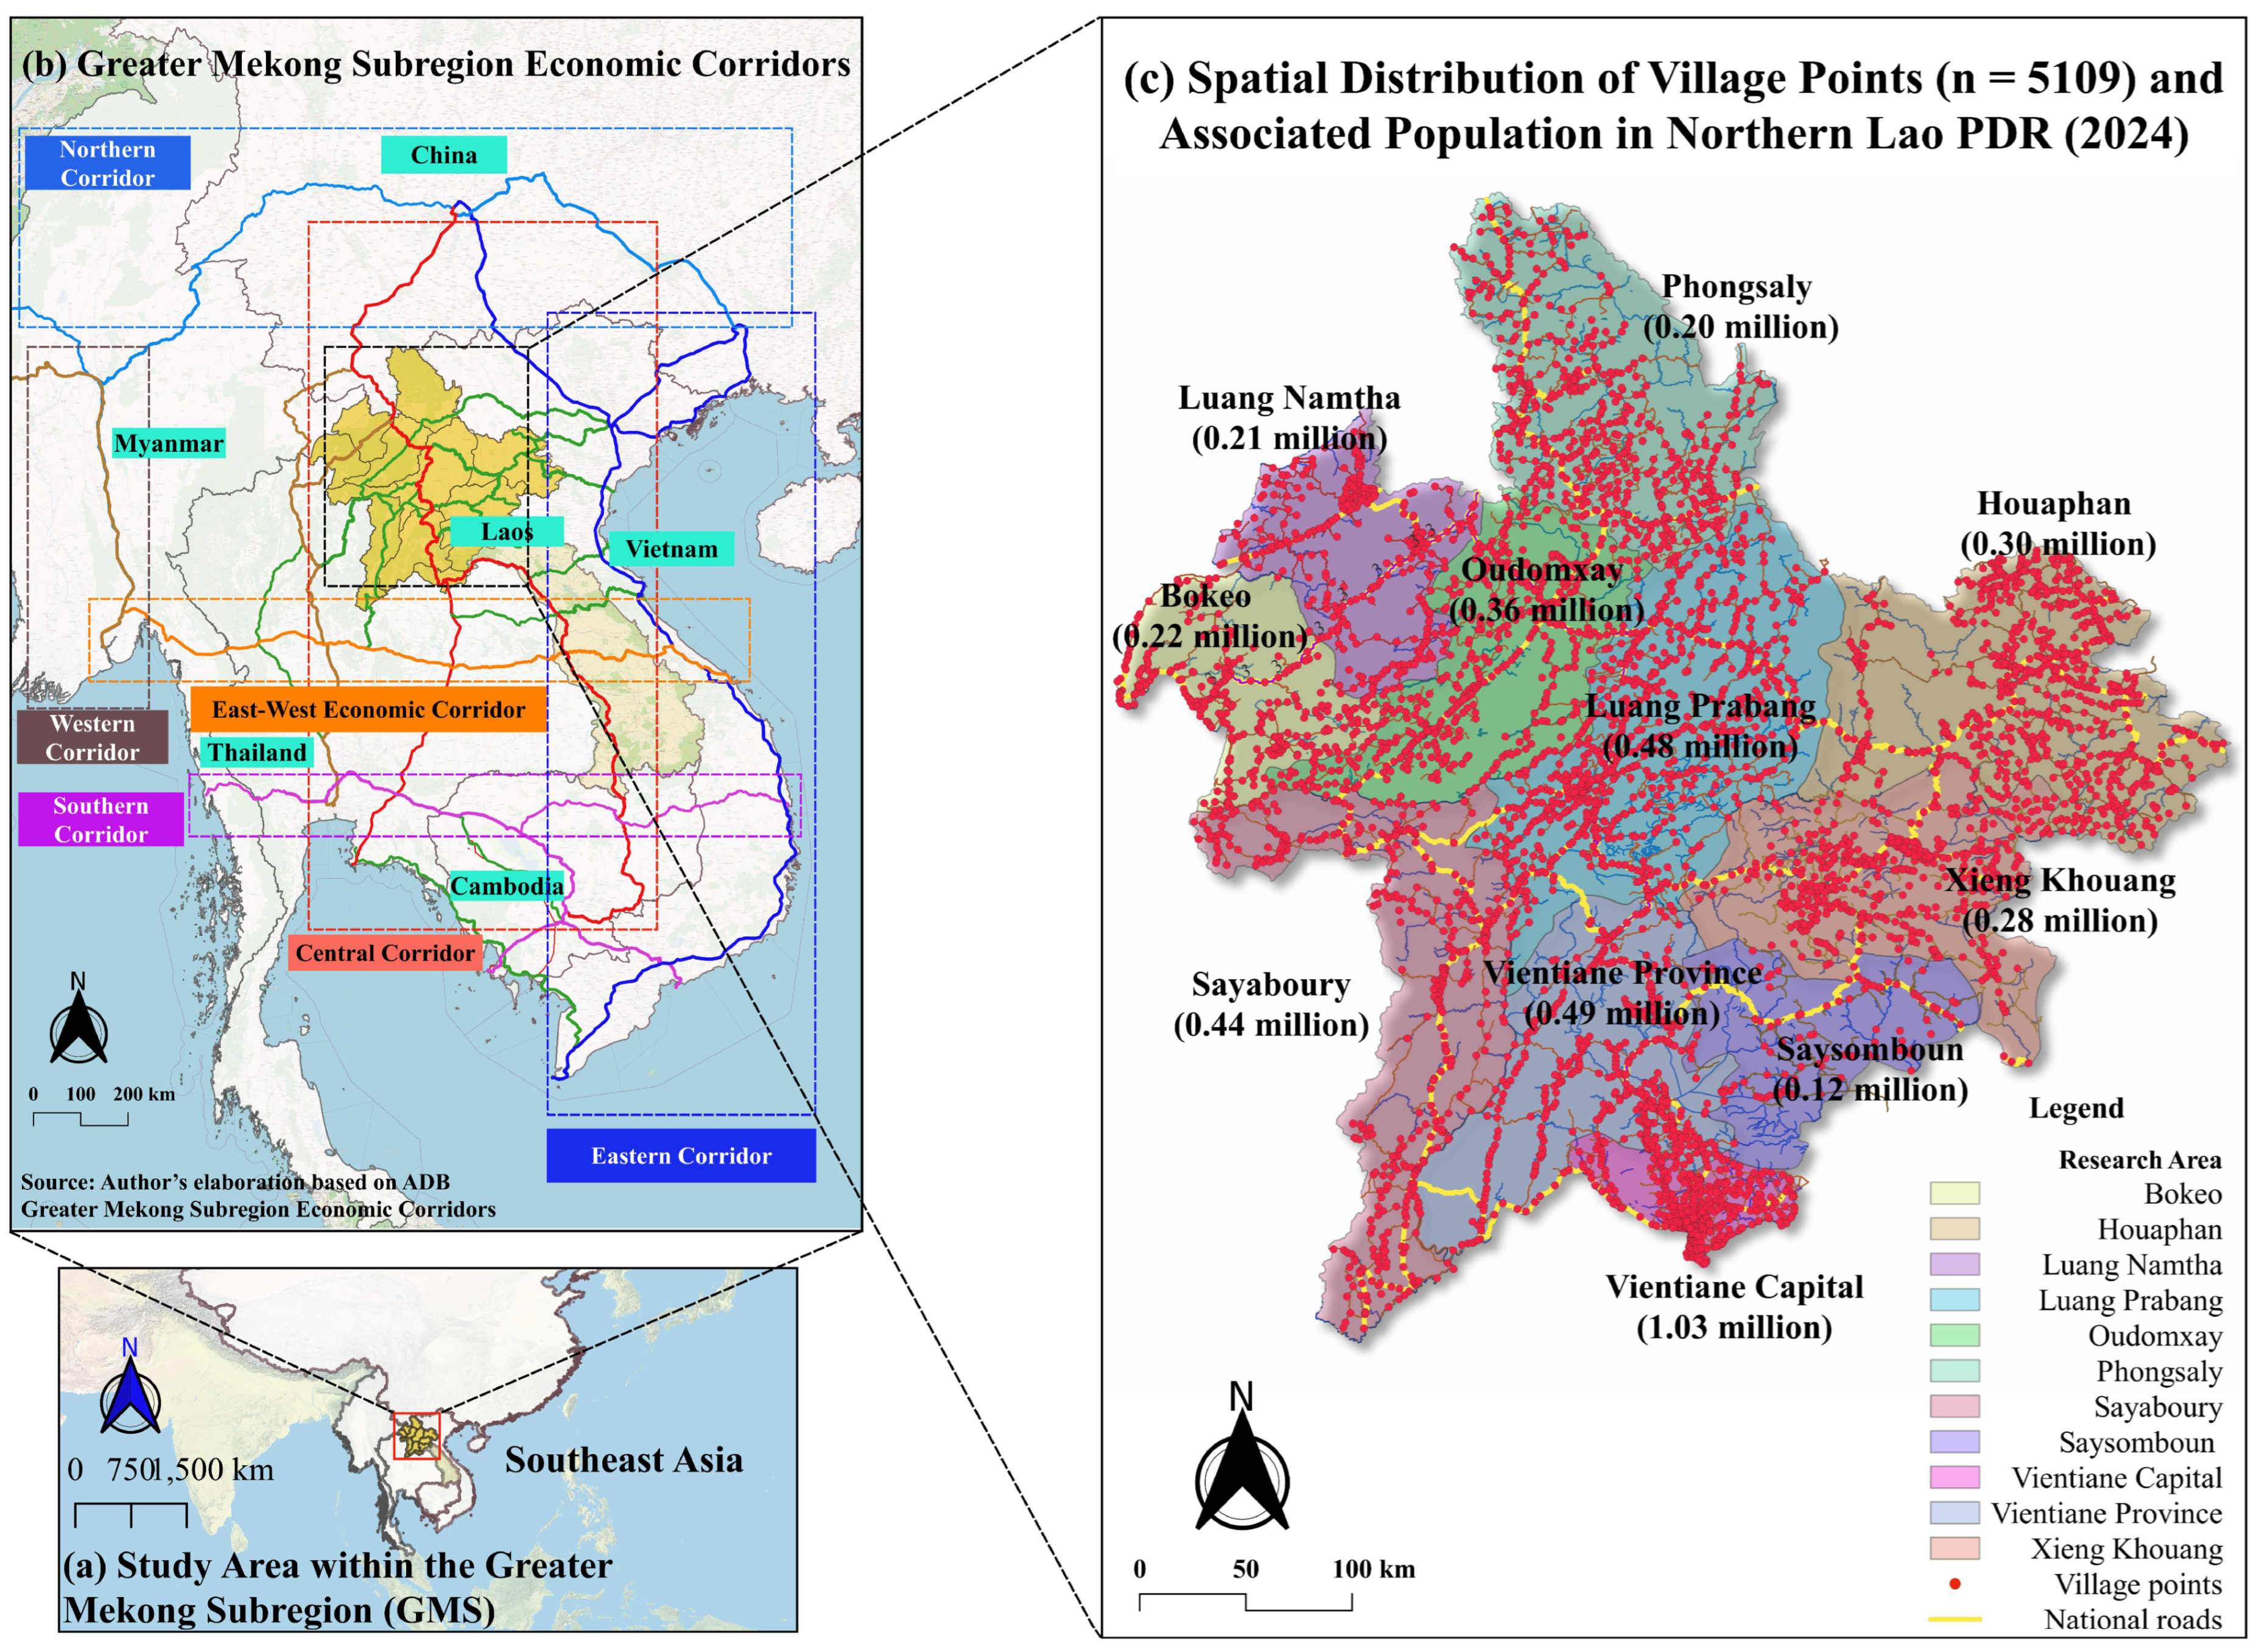
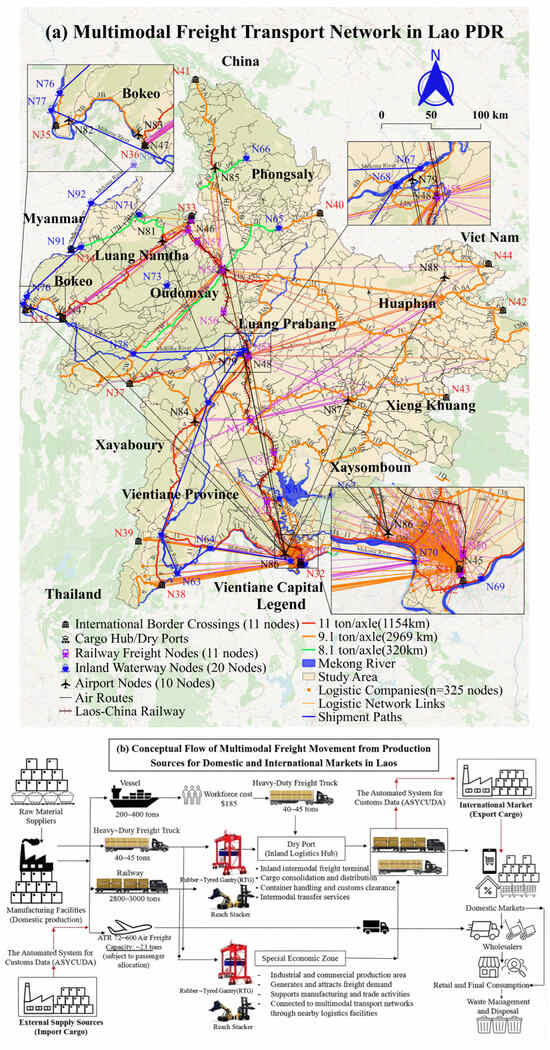
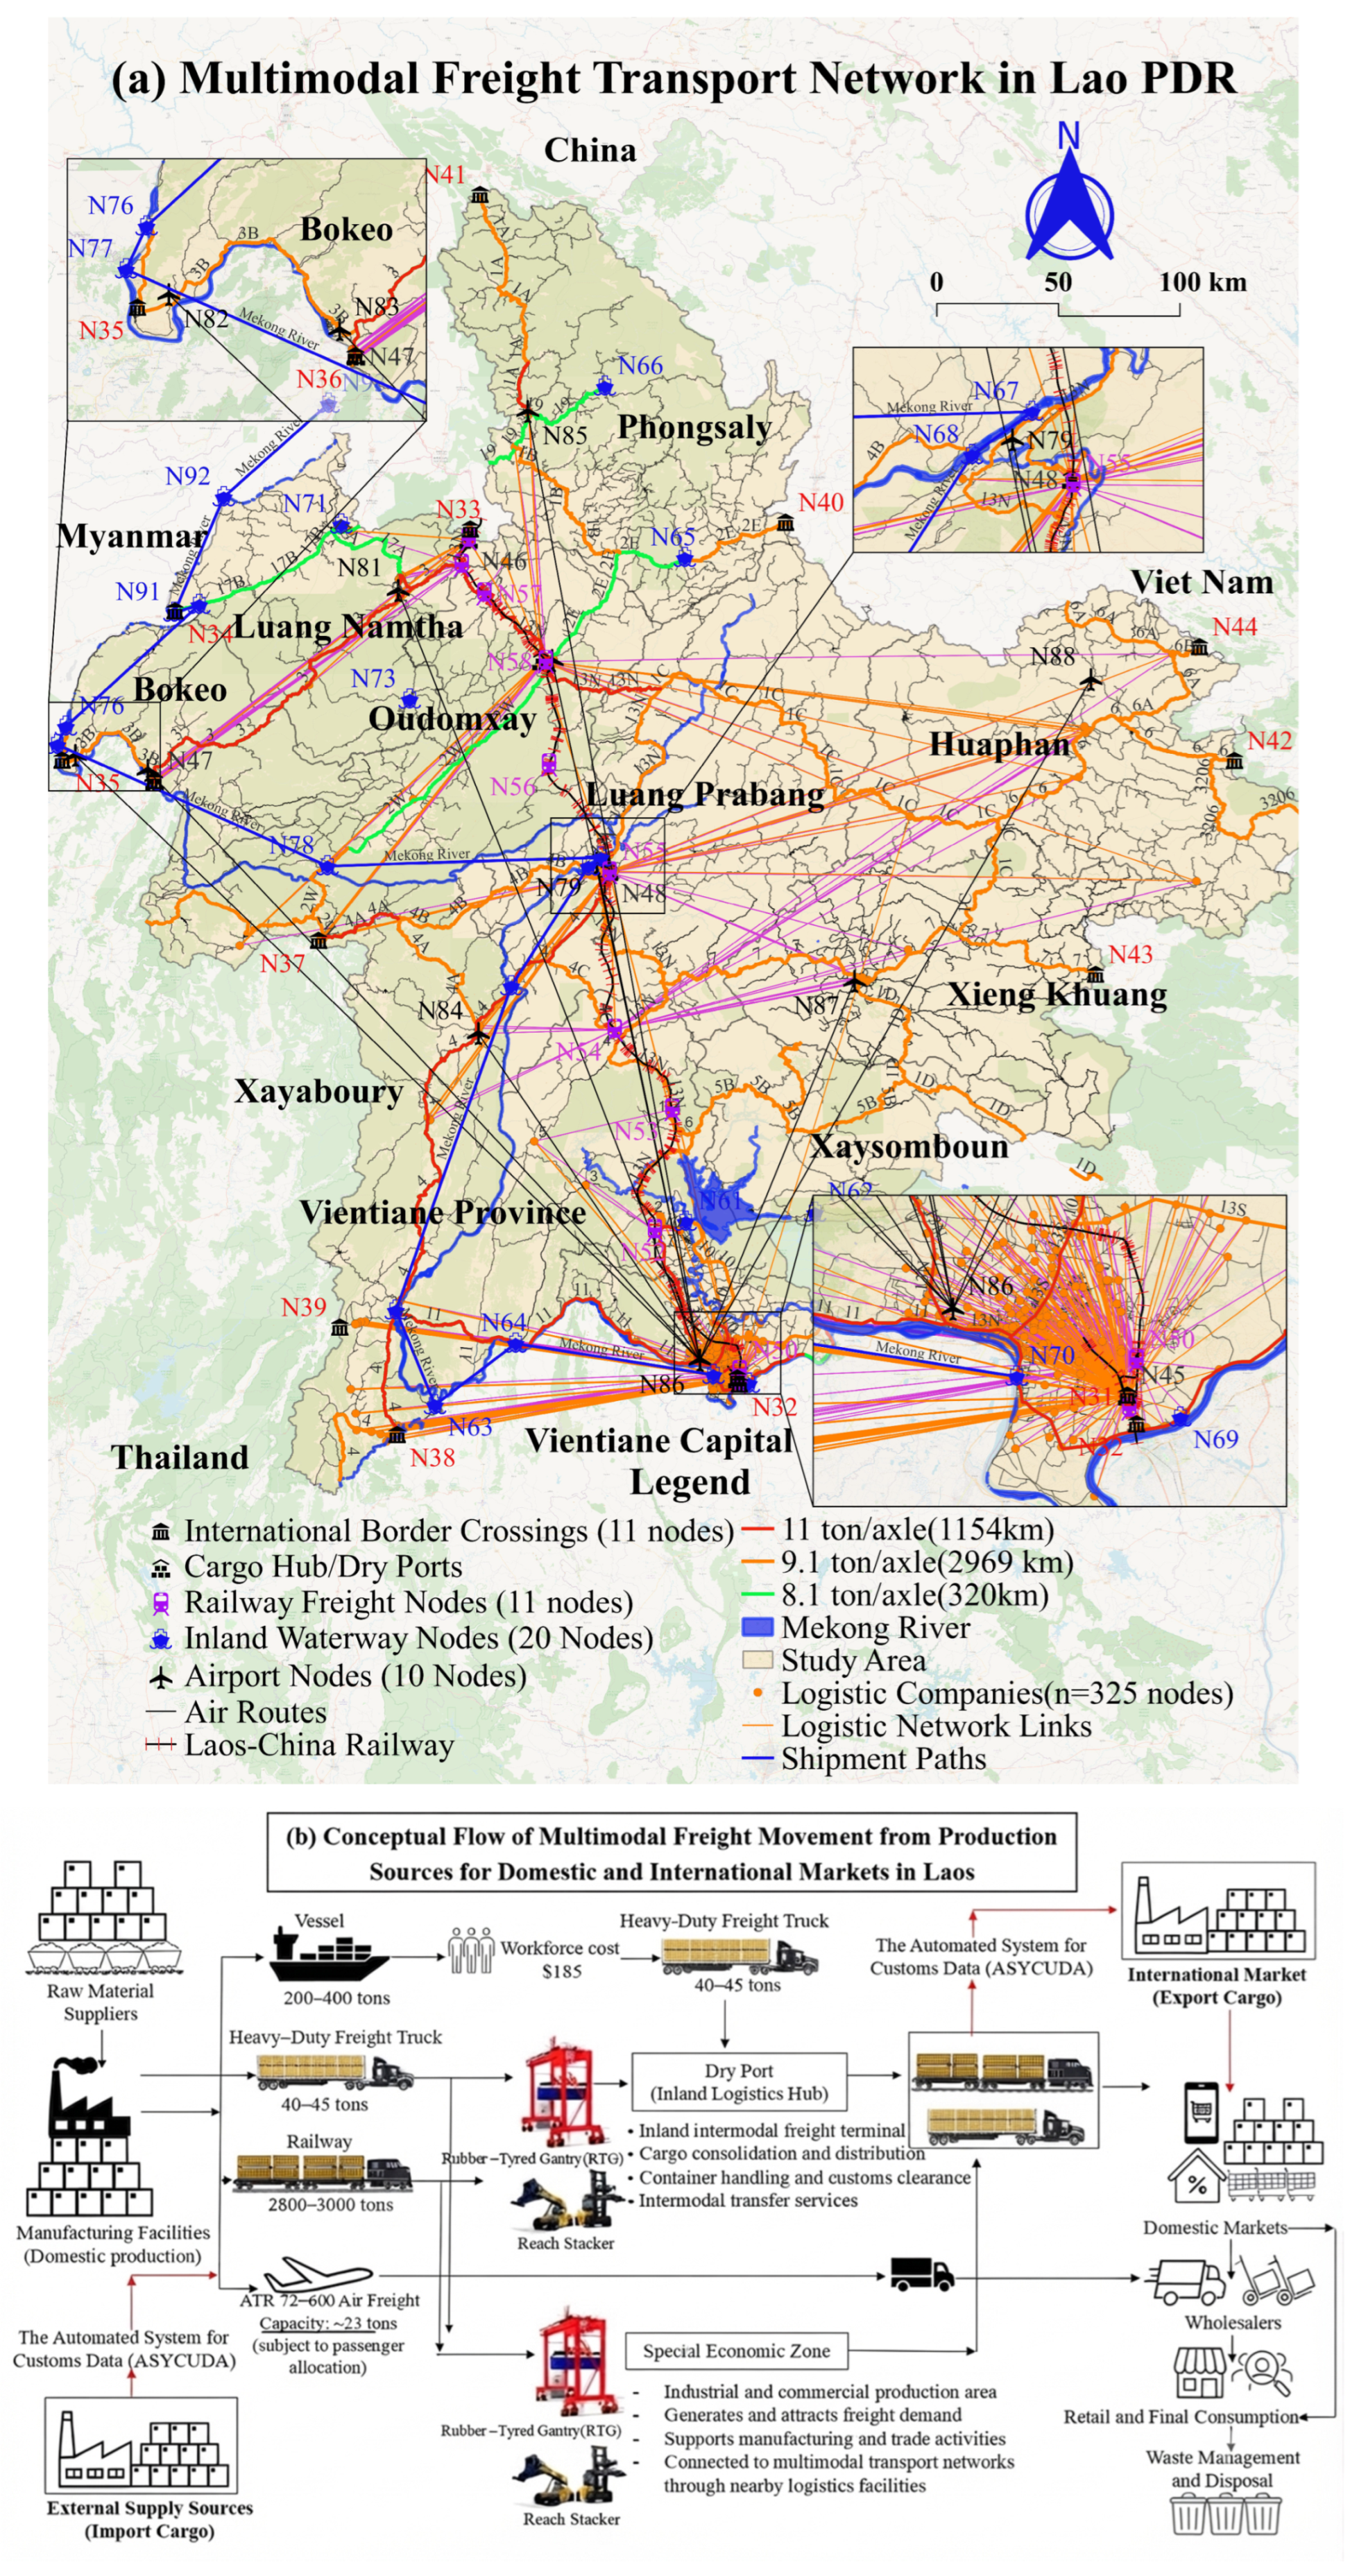
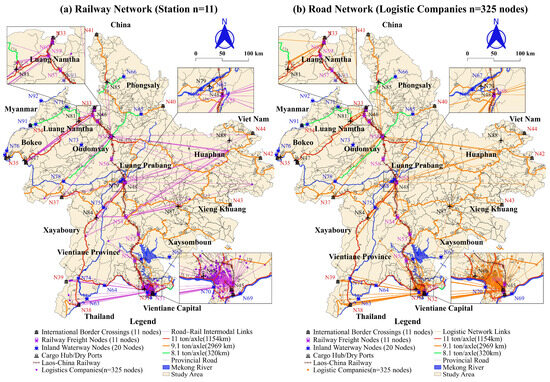
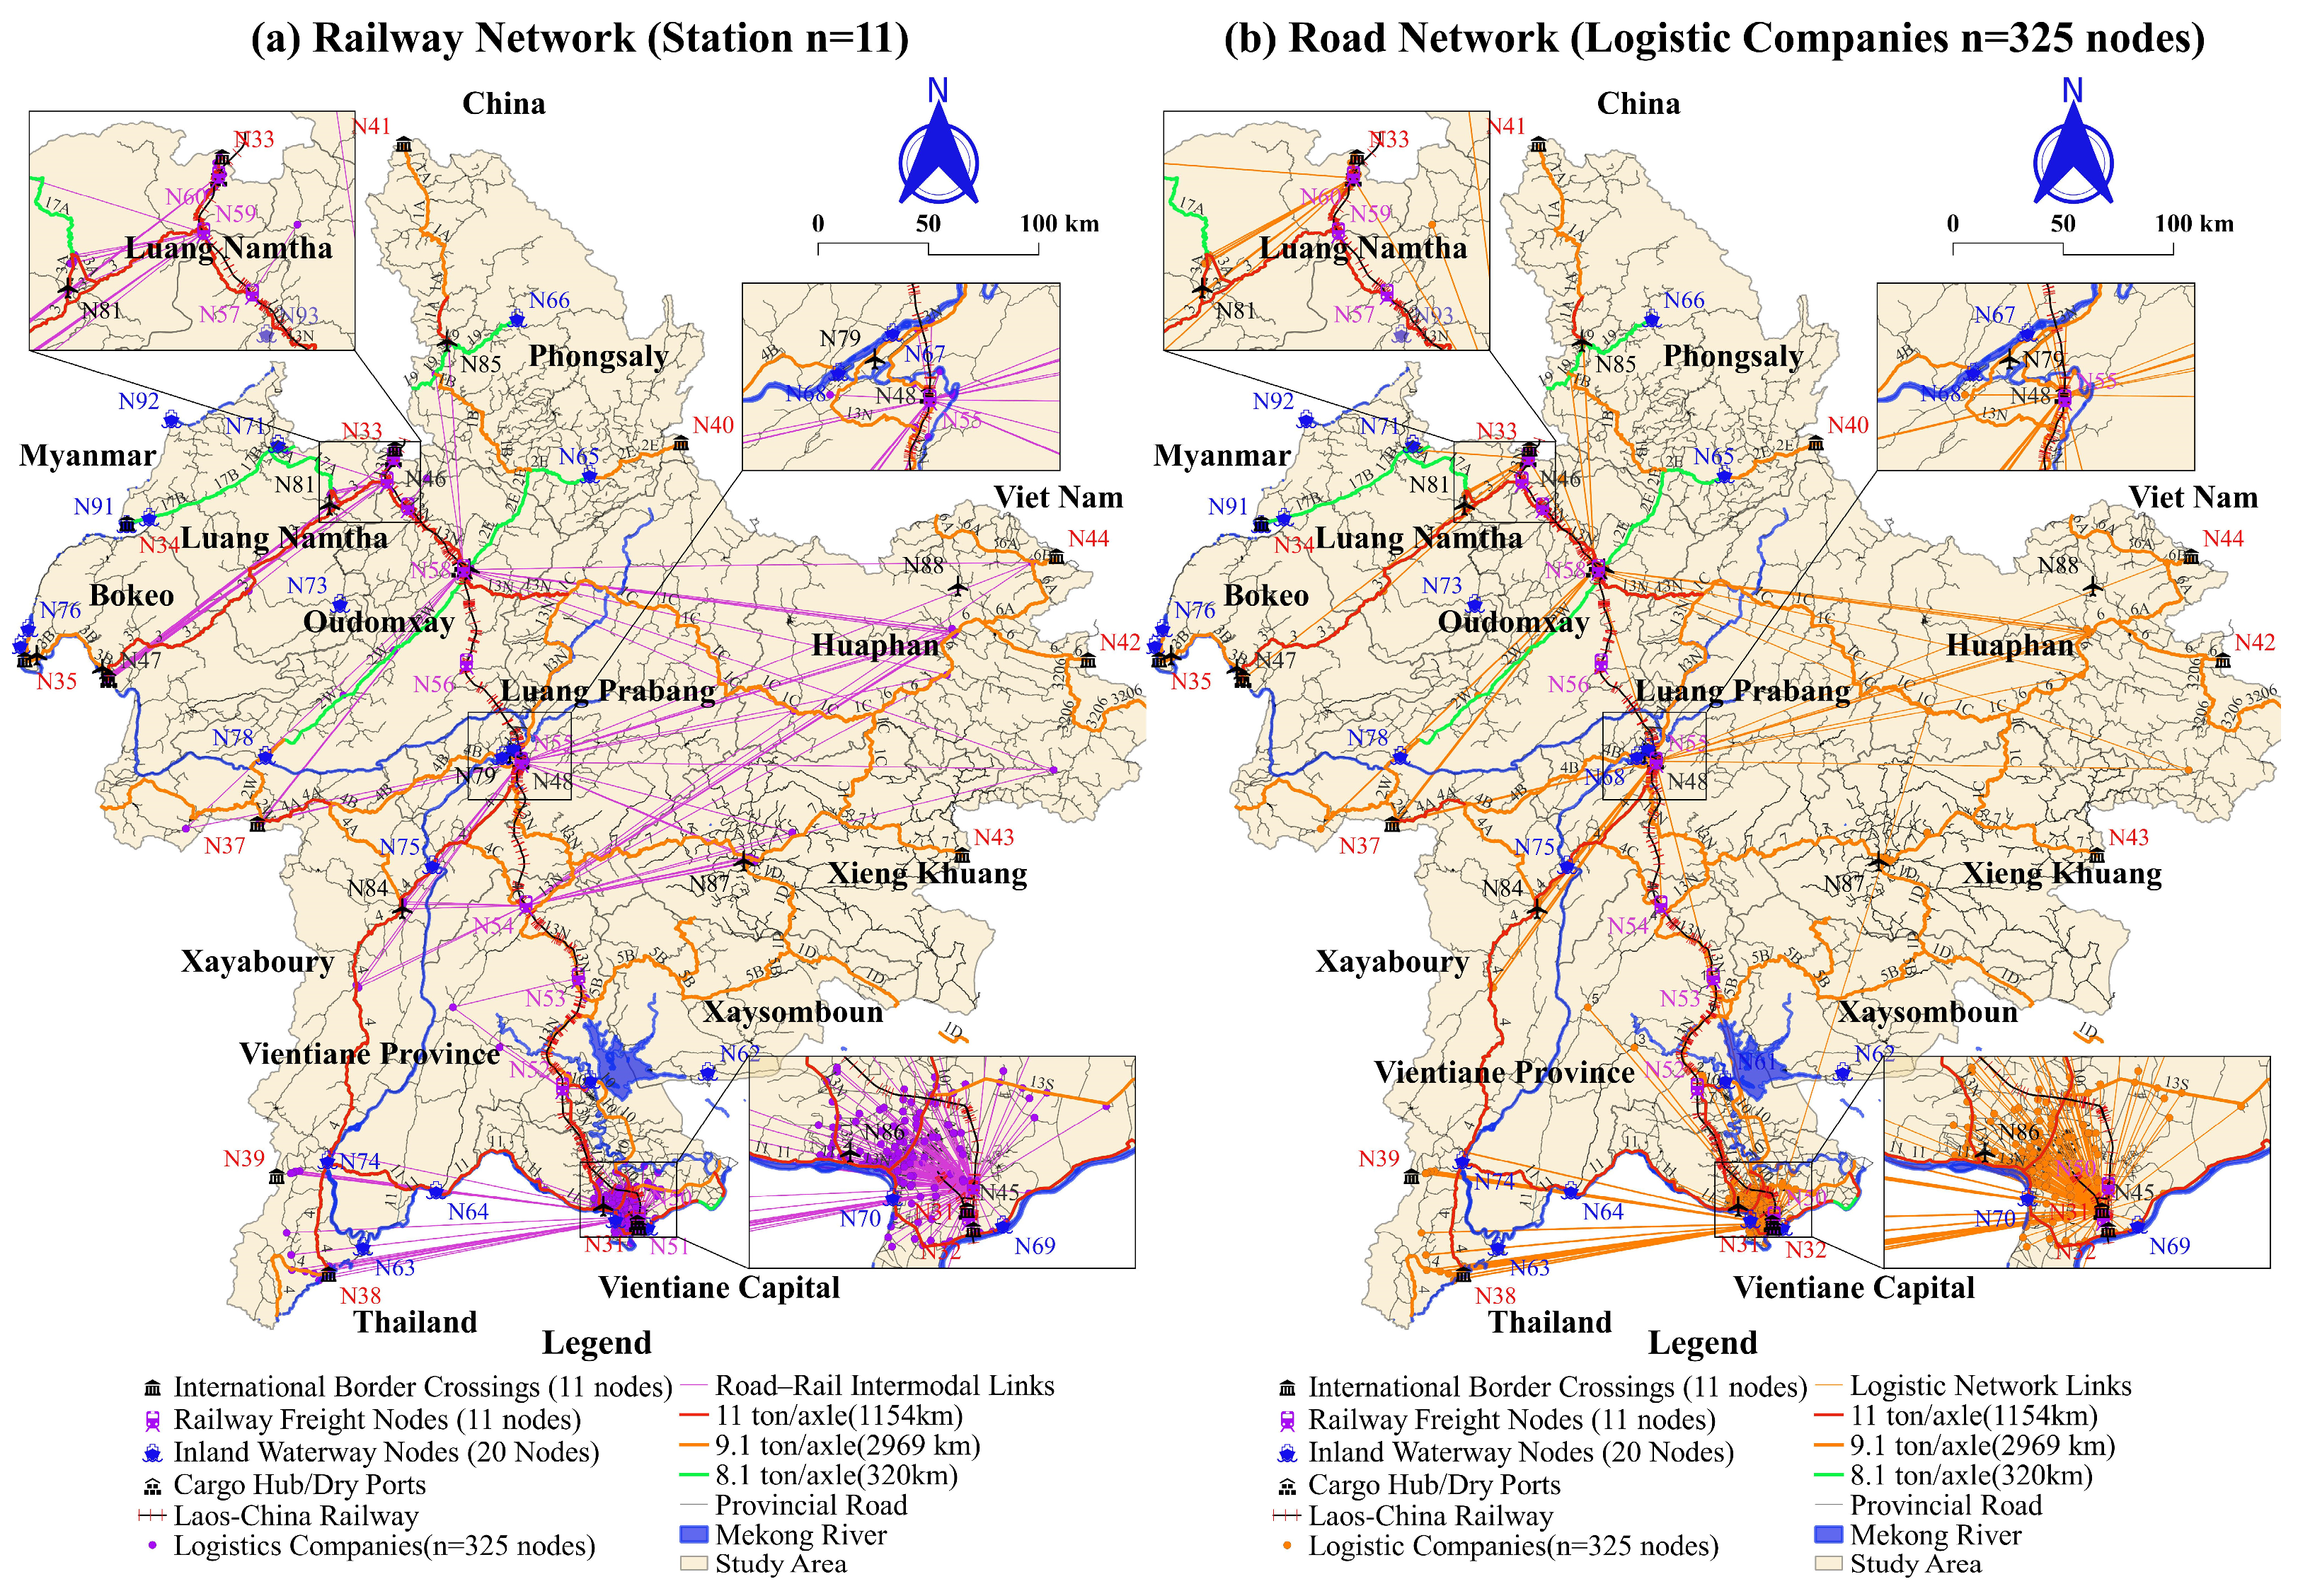
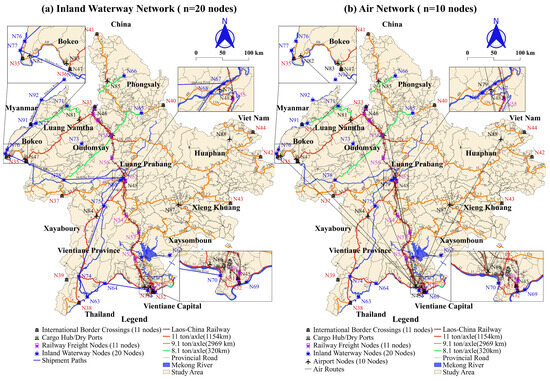
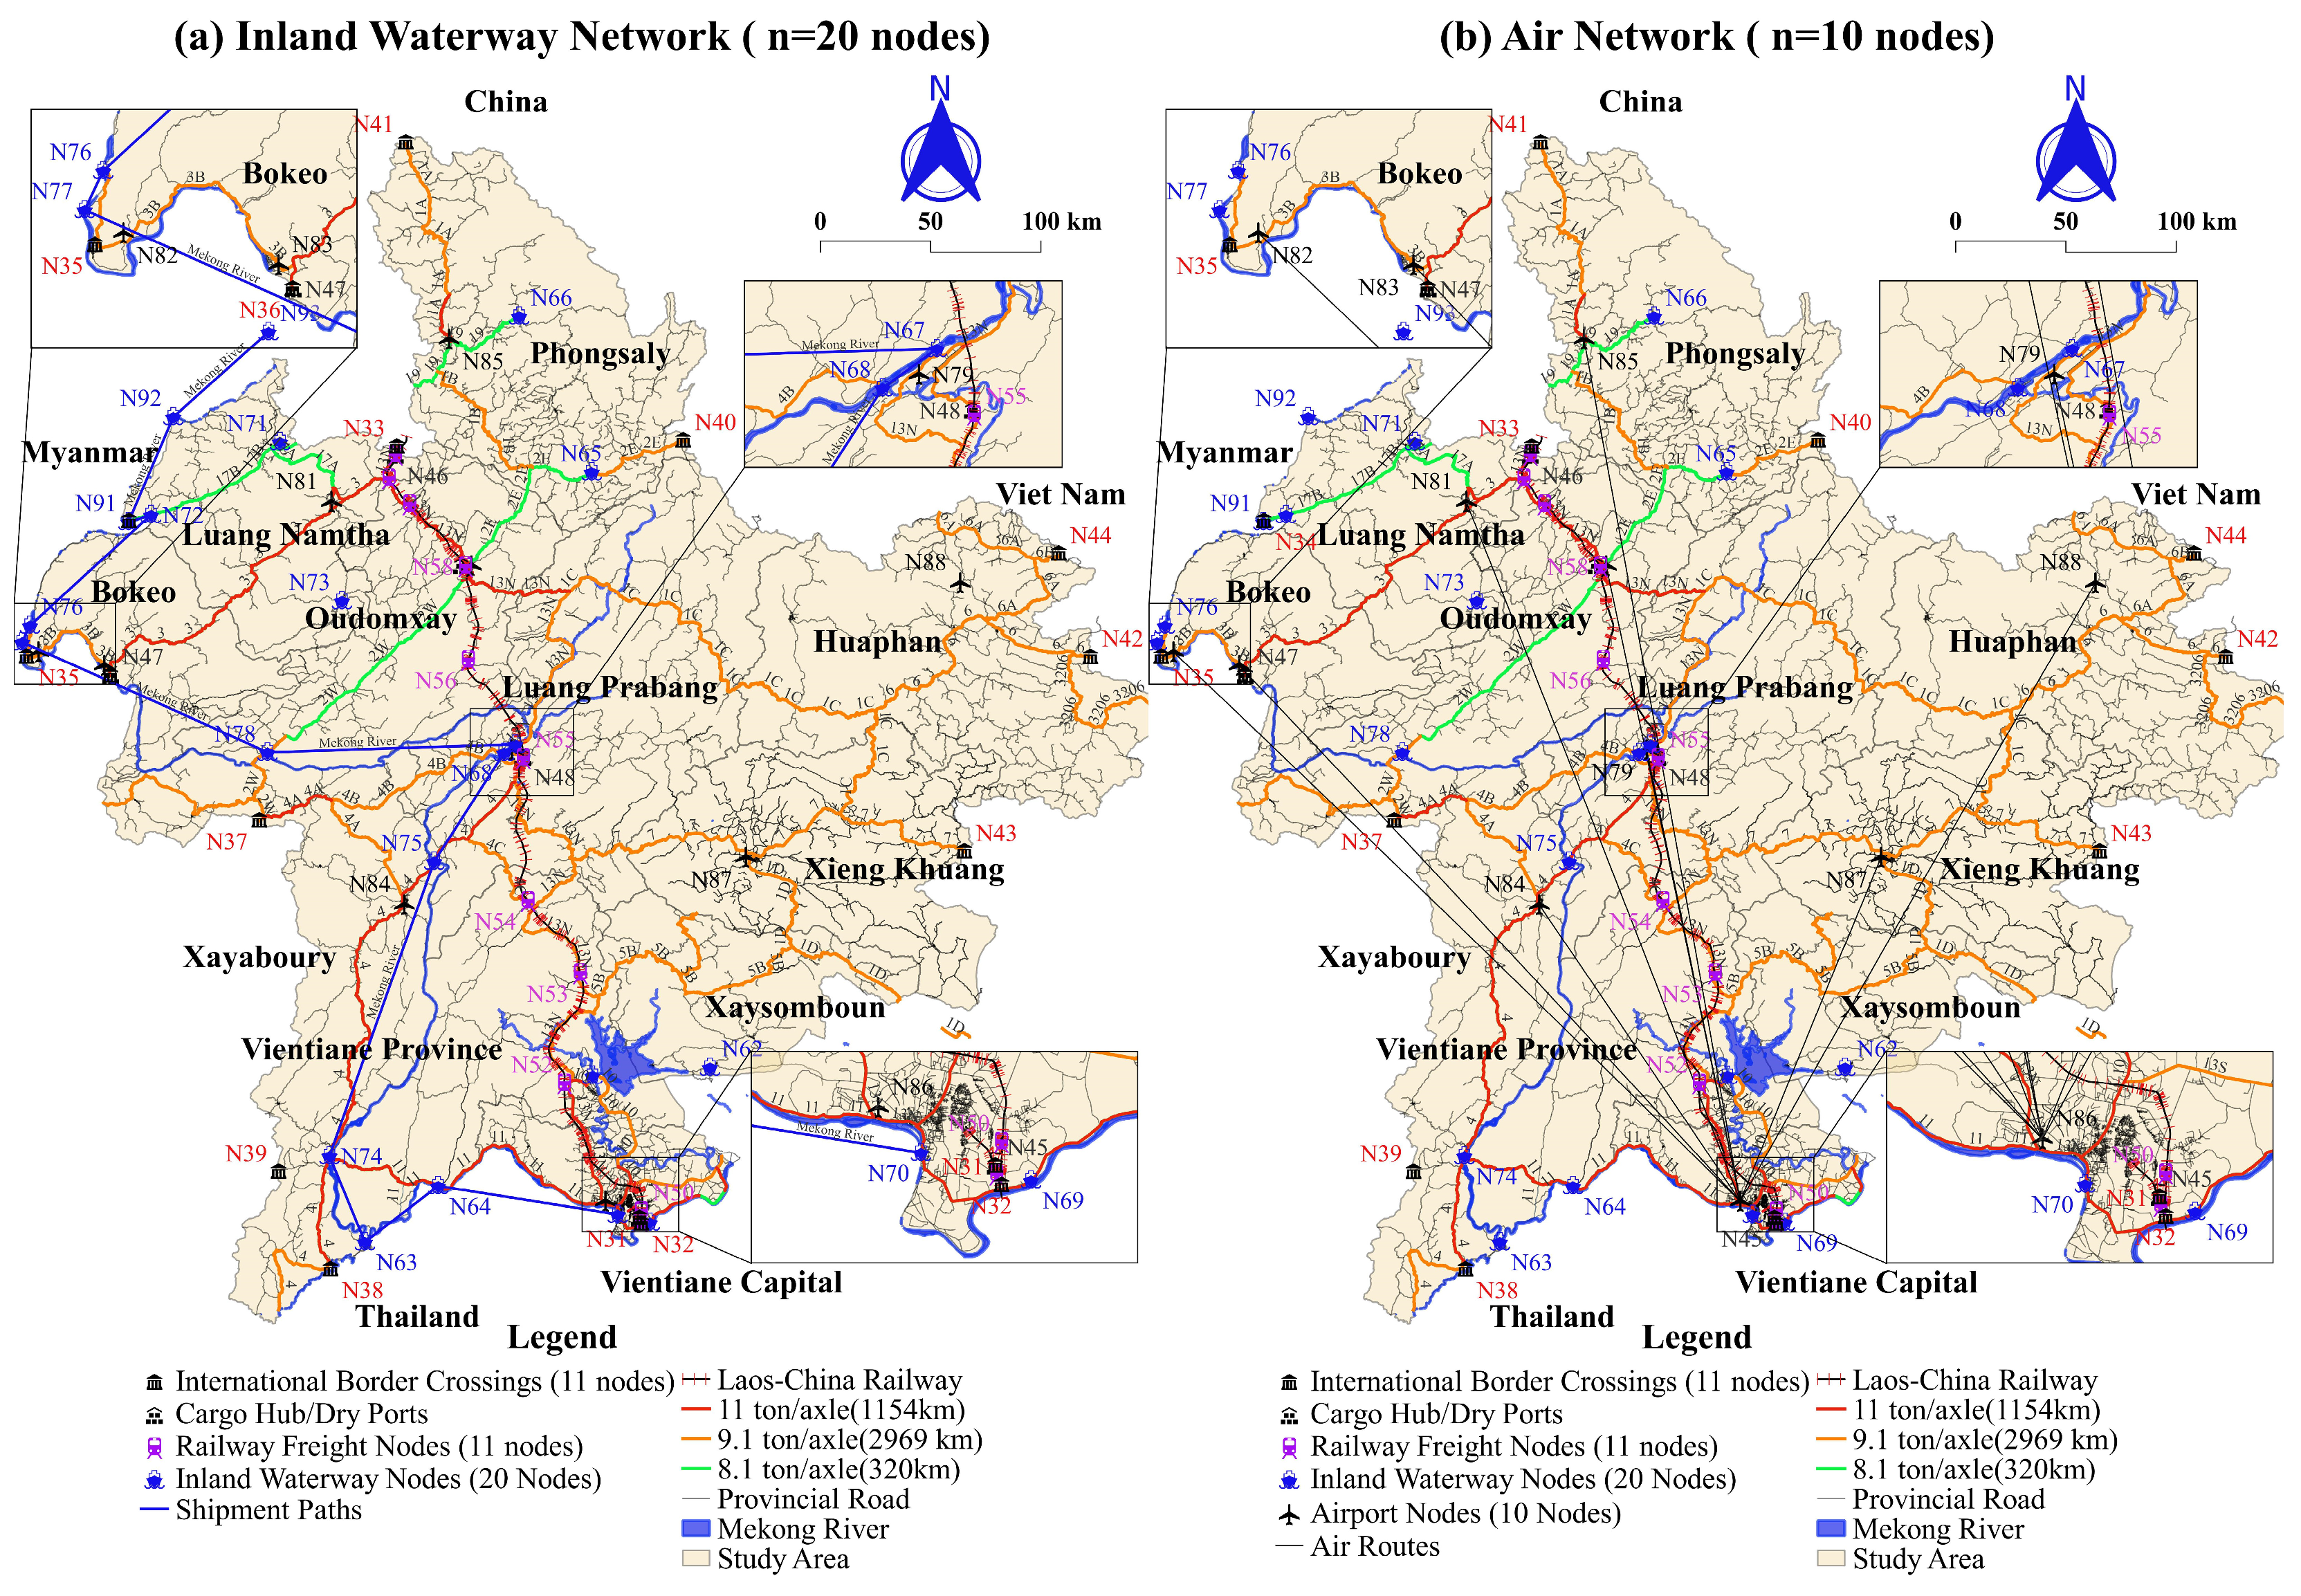
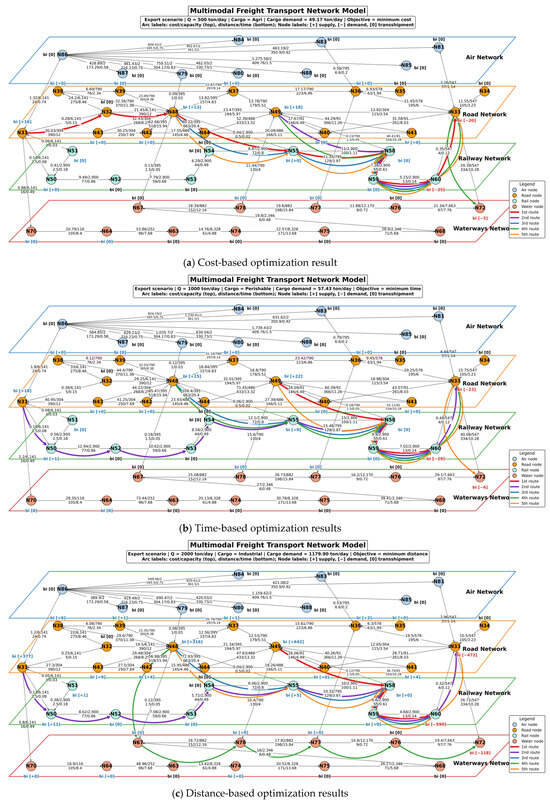
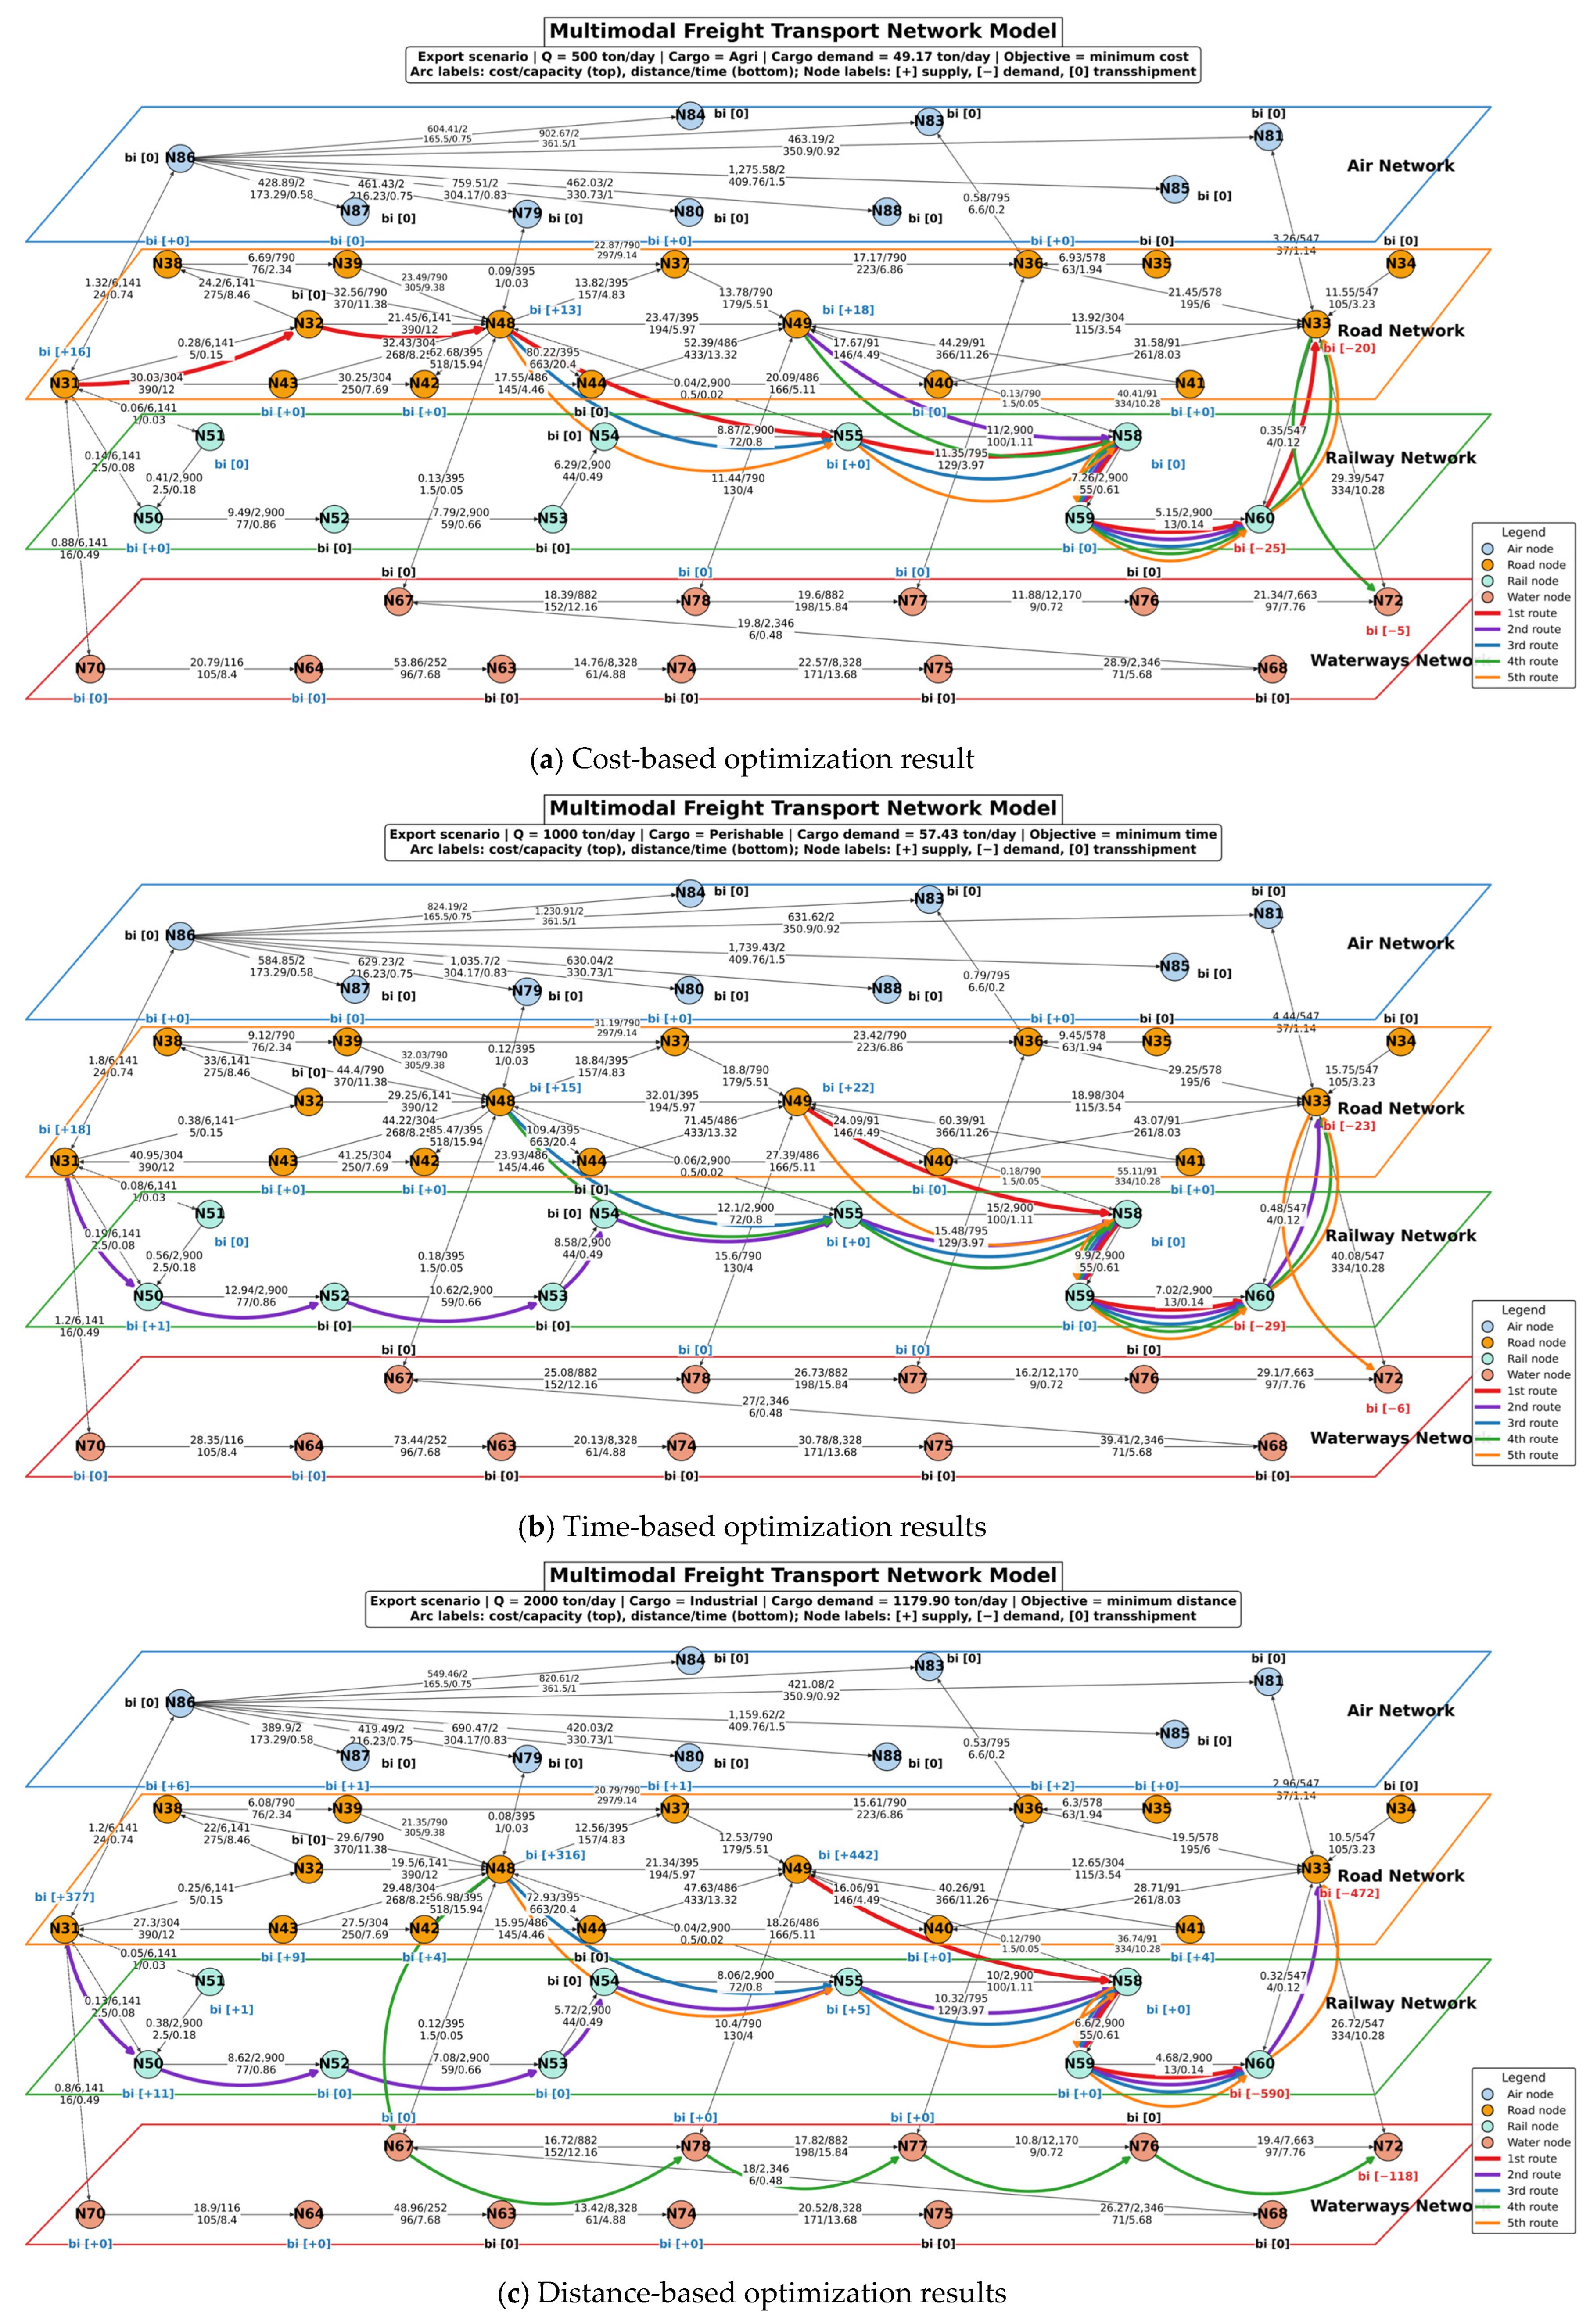
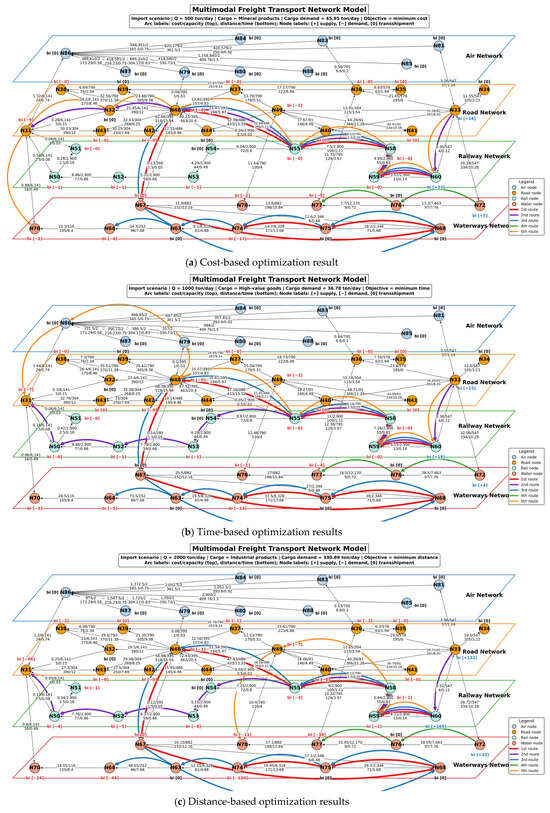
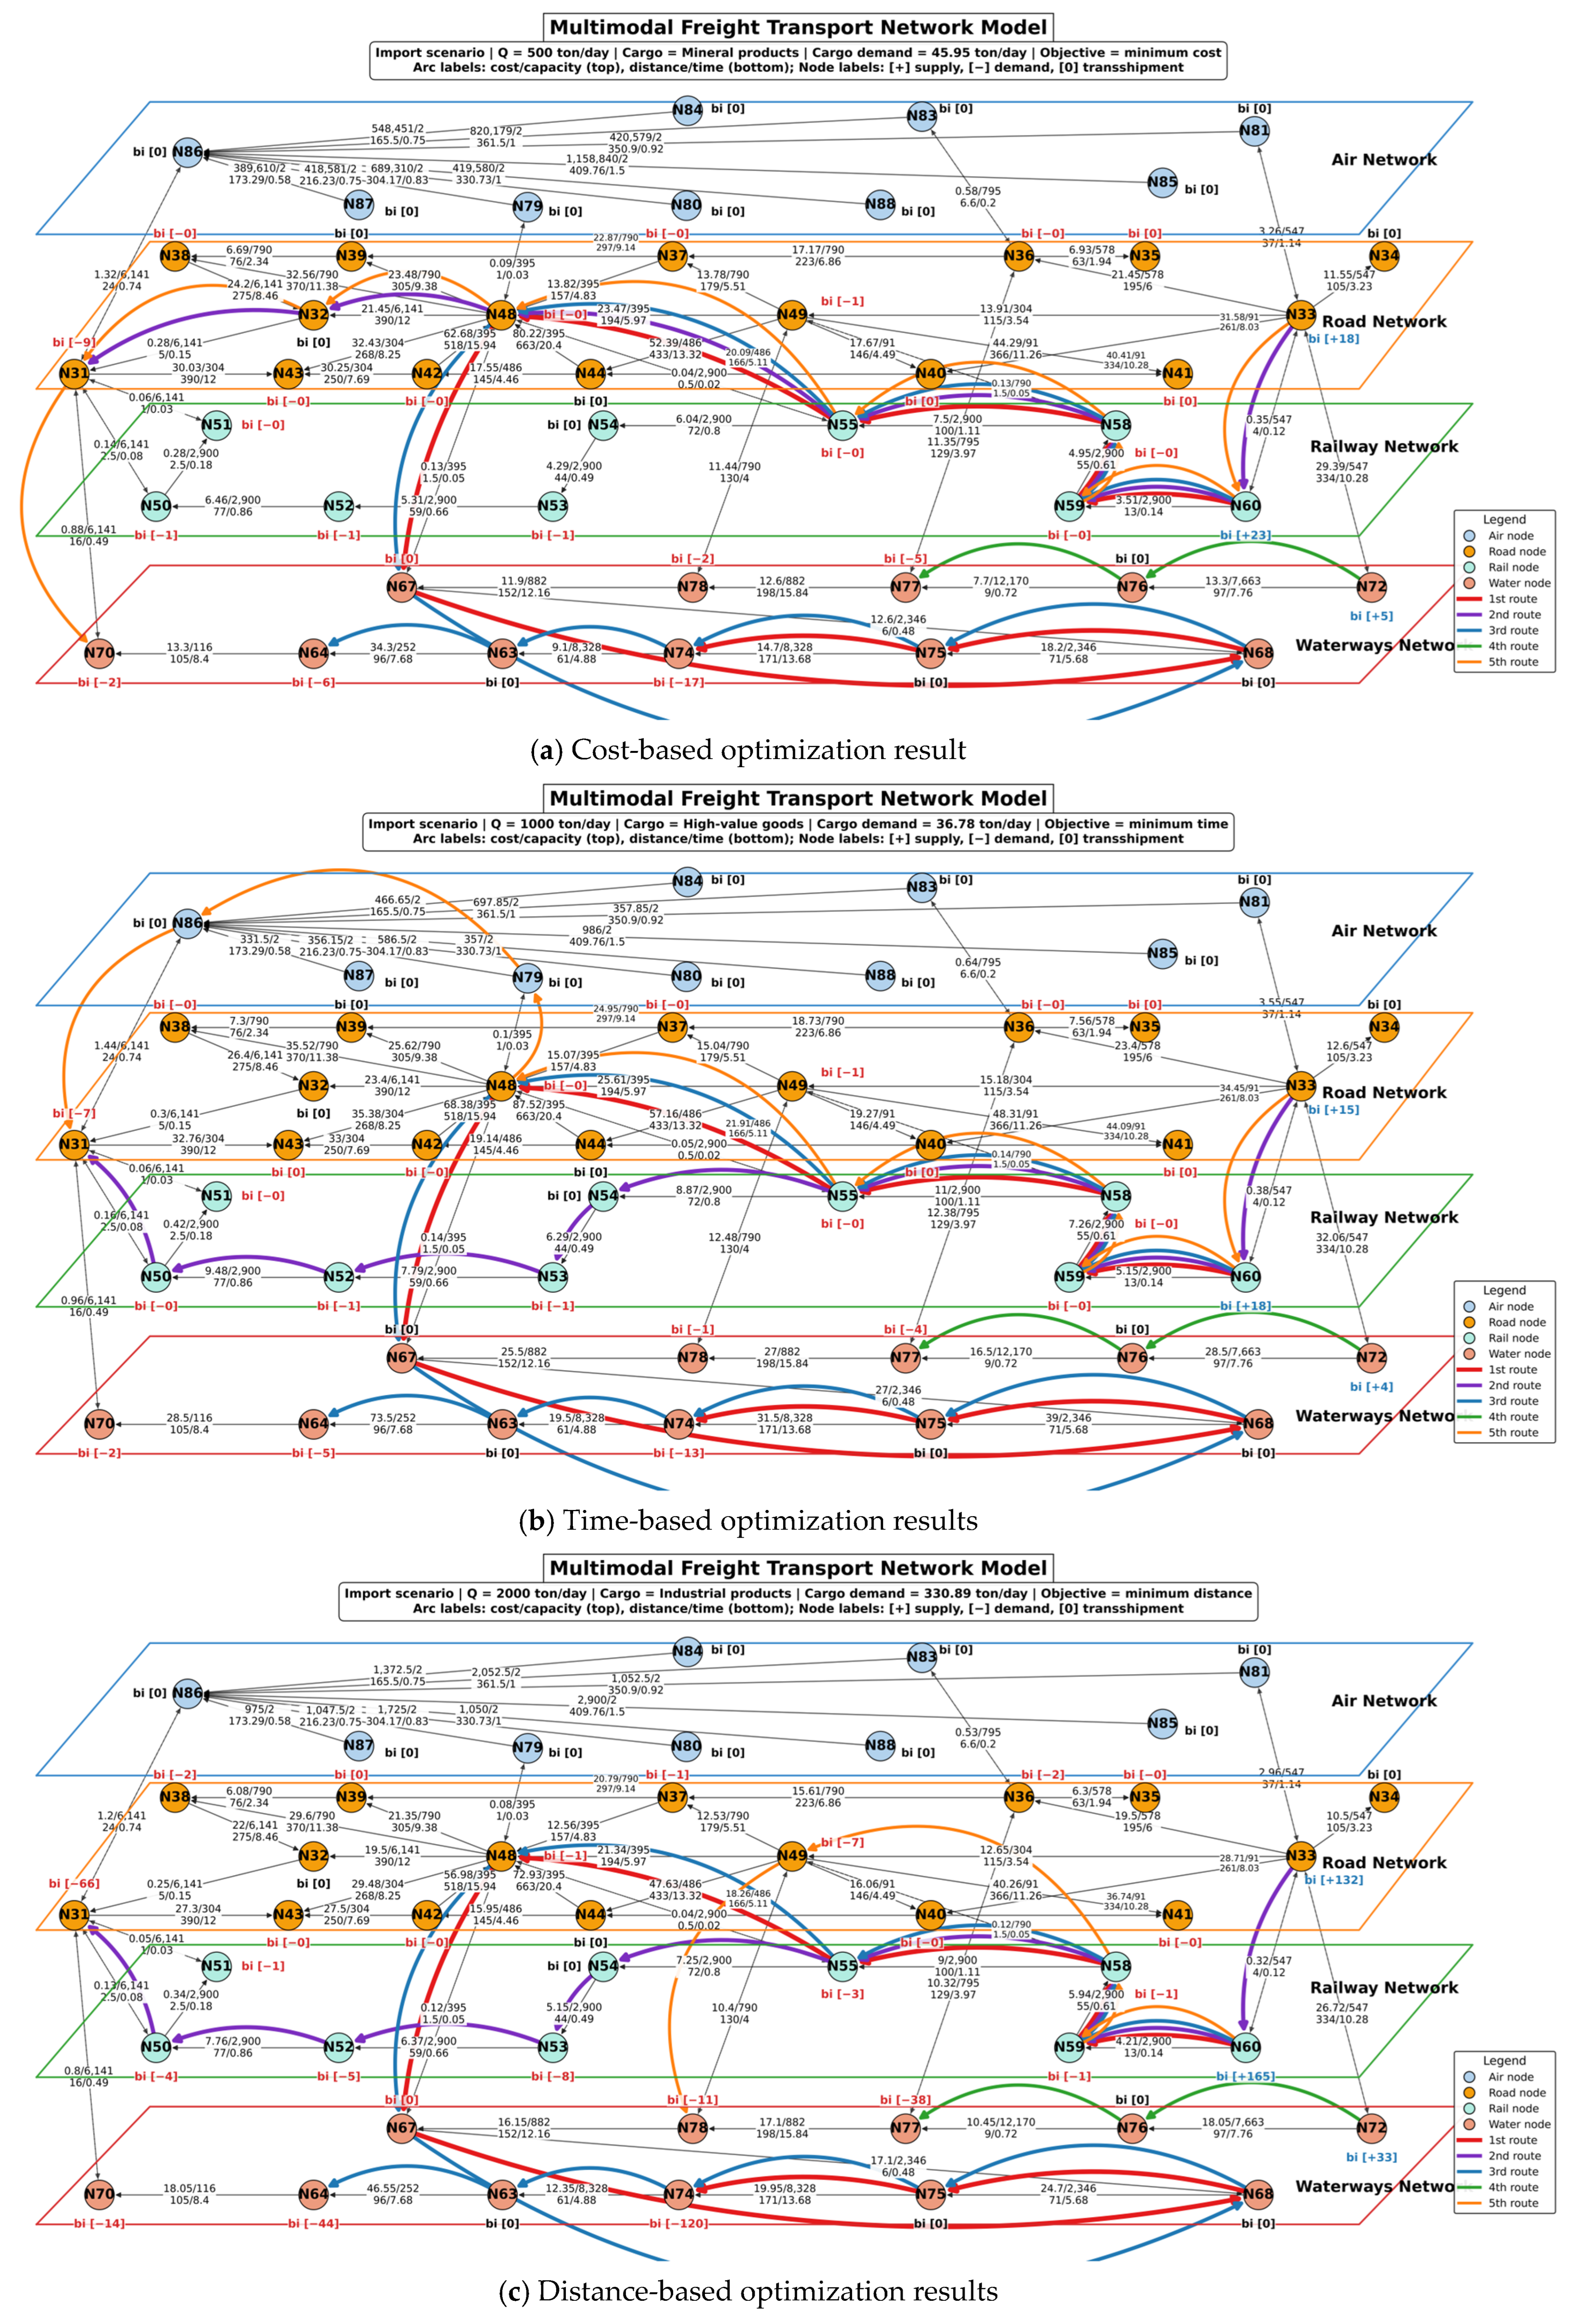

Disclaimer/Publisher’s Note: The statements, opinions and data contained in all publications are solely those of the individual author(s) and contributor(s) and not of MDPI and/or the editor(s). MDPI and/or the editor(s) disclaim responsibility for any injury to people or property resulting from any ideas, methods, instructions or products referred to in the content. |
© 2026 by the authors. Licensee MDPI, Basel, Switzerland. This article is an open access article distributed under the terms and conditions of the Creative Commons Attribution (CC BY) license.