
Article

Data-Driven Refueling Strategies and Infrastructure Design for H2 Cargo Bike Fleets via H2 Tank Swapping

by
Stavros Skarlis
1,
Andreas Nikiforiadis
2,3,*,
George Barboutidis
2,
Josep Maria Salanova Grau
2 and
Georgia Ayfantopoulou
2
1
e-Kinesis PC, 11 Redestou Str., 16232 Vyronas, Greece
2
Centre for Research and Technology Hellas (CERTH), Hellenic Institute of Transport, 57001 Thermi, Greece
3
School of Civil Engineering, Democritus University of Thrace, 67100 Xanthi, Greece
*
Author to whom correspondence should be addressed.
Future Transp. 2026, 6(4), 163; https://doi.org/10.3390/futuretransp6040163
Submission received: 3 July 2026 / Revised: 29 July 2026 / Accepted: 30 July 2026 / Published: 30 July 2026

Abstract

Hydrogen-powered cargo bikes are gaining increasing attention in the framework of urban logistics, thanks to their enhanced agility to travel and park in congested areas, low carbon footprint, and extended traveling range. Nevertheless, deploying a fleet of hydrogen-powered cargo bikes can be challenging, necessitating the parallel assessment of the operation of the fleet, the H2 refueling strategy, and eventually the design of the respective refueling infrastructure. The objective of this article is to demonstrate a systematic methodological framework for deriving strategic insights into the deployment of a fleet of cargo bikes equipped with a hydrogen fuel cell unit. Employing advanced longitudinal-based vehicle mathematical modeling, coupled with statistical techniques, the energy consumption of the vehicle was analyzed under a broad spectrum of operating conditions. Moreover, the refueling strategy was analyzed for different ranges of vehicle fleets, and enhanced options for designing the respective hydrogen stations were charted. Ultimately, this work provides strategic insights that could be used by cargo bike fleet operators and H2 refueling infrastructure designers.

1. Introduction

Urban logistics systems are experiencing substantial transformation, with the aim to alleviate congestion, emissions, and energy consumption while maintaining efficient goods distribution. A growing body of empirical evidence attributes a substantial share of urban congestion and local environmental burdens to freight transport activities, particularly within dense metropolitan areas [1]. The surge in e-commerce has further intensified freight activity in urban areas, placing additional strain on already constrained transport networks and urban environments [2,3].
In response to these challenges, cargo bikes have emerged as a promising solution for last-mile logistics in densely populated urban environments. These vehicles are specially designed bicycles, intended for the transportation of goods, with variations in both carrying capacity and cost. Electrically assisted cargo bikes (e-cargo bikes) can enhance operational capabilities, allowing for heavier loads, longer traveling distances, and reduced rider fatigue, which makes them suitable for a wider range of urban freight tasks. Compared with conventional light commercial vehicles, e-cargo bikes are smaller and more maneuverable, making them an effective solution for distributing smaller shipments across dense city areas [4]. Additionally, these vehicles can contribute towards mitigating congestion by reducing the space needed for parking and loading activities [5]. Furthermore, they can reduce carbon emissions and operational costs relative to light commercial vehicles [6]. Focusing on the carbon footprint, a recent analysis published by Ljubotina et al. has shown that cargo bikes could potentially reduce CO2 emissions by approximately 40% and shorten operational cycle times by about 23.5 min per delivery compared to van-based logistics [7].
Besides battery electric cargo bikes, hydrogen fuel cell-based cargo bikes have been discussed in the recent literature [8]. Oguz and Capkin reported increased delivery rates in the order of 15% under Rome-specific operational conditions, largely attributable to the extended traveling range and shorter refueling sessions compared to battery electric cargo bikes [9]. On the other hand, Damer et al. have explained that, under real-world conditions, hydrogen-powered cargo bikes may offer limited practical benefits over conventional electric models, as their theoretical advantages in range and refueling may not be frequently needed, while technical, operational–organizational, and infrastructural challenges need to be overcome [10].
To efficiently address the aforementioned barriers and eventually allow for the wider adoption of hydrogen cargo bikes, cost-effective and time-efficient approaches should be explored. Among others, Abouelrous et al. have presented the application of digital twin technology for mitigating congestion and air pollution while improving energy efficiency in modern logistics systems [11]. Specifically focusing on battery electric cargo bikes, there are several studies focusing on vehicle routing optimization problems. Indicatively, Papaioannou et al. [12] and Galkin et al. [13] have demonstrated optimization methods relevant to the capacitated vehicle routing problem. The computation of optimal routing schedules can enhance the operational–organizational efficiency of fleets of cargo bikes through the enhancement of the delivery rate and the limitation of the fleet’s energy consumption.
As far as hydrogen cargo bikes are concerned, there are only a few publicly available works on respective digital twins. Maria Modesti [14] and Sergio Gennaro [15] demonstrated mathematical models of hydrogen-powered cargo bikes, which were based on vehicle longitudinal dynamics. Employing such models, one can generate predictions of the vehicle’s hydrogen consumption, which can potentially allow for optimizing the H2 refueling strategy, along with the design of the respective refueling infrastructure. In another work, Ock Taeck Lim employed deep learning to depict the optimal operational range of a hydrogen-powered bicycle with respect to the vehicle’s energy consumption [16]. Nevertheless, the individual impacts of a cargo bike’s operational parameters (e.g., speed, cargo mass, driver style, etc.) on the vehicle’s energy consumption have not been fully represented in the literature. Moreover, given that cargo bikes’ operation can be highly stochastic, since routing patterns, speed profiles, and loads can be significantly variable, a statistical analysis may be required to fully comprehend and enhance the energy efficiency of fleets of cargo bikes. The recent literature also lacks relevant results and methodological frameworks.
Focusing on refueling infrastructure design optimization, Isaac and Saha have published a comprehensive review of optimization models for locating hydrogen refueling stations [17]. Moreover, Chen et al. have presented an optimization framework relevant to the hydrogen refueling strategy, considering the minimization of energy consumption while meeting the H2 refueling demand for a specific hydrogen refueling station [18]. Kang and Recker have also reported a model-based approach for defining optimal locations of H2 refueling stations, factoring in vehicles’ scheduling and routing information [19]. Following an economics-oriented approach, Wang et al. have optimally located hydrogen refueling stations considering the H2 supply chain expenditure [20]. Nevertheless, there are no publicly available sources relevant to the model-based assessment–optimization of the refueling strategy and the respective infrastructure for hydrogen-powered cargo bikes.
Extending the boundaries of the existing literature, this work presents a comprehensive methodological framework for deriving strategic insights into the energy consumption and refueling strategies of a battery electric e-cargo bike equipped with a hydrogen fuel cell unit. The proposed approach employs state-of-the-art longitudinal dynamics-based vehicle modeling, seamlessly integrated with advanced statistical techniques, including sensitivity analysis and Monte Carlo simulation. The study aims to capture the stochastic nature of the operational characteristics of hydrogen cargo bikes and to quantify their impacts on vehicle energy consumption and driving range. As explained above, both the contributions of individual operational parameters to the cargo bike’s energy consumption and statistical methods to capture the stochasticity of the operational conditions of such vehicles, as well as the respective impacts on energy consumption, are not fully represented in the literature. In more detail, sensitivity analysis was used to quantify the individual impacts of cargo mass and driving style on the cargo bike’s energy consumption, which has not been adequately discussed in the literature. Complementarily to the deterministic sensitivity analysis, Monte Carlo simulations are presented in this work to assess the stochastic variation in the abovementioned operational parameters on the vehicle’s energy consumption. This is another topic that has not been covered in the literature. In this respect, these aspects are considered novelties, introduced in the context of this work.
Building on these findings, actionable insights are provided for hydrogen refueling infrastructure stakeholders, supporting informed decision-making related to the design of hydrogen-refueled cargo bike fleets and the associated H2 supply chain. To do so, a data-driven methodological framework is used, which incorporates the energy consumption simulations described above. This is also regarded as an innovation brought by the present study, given that the literature lacks relevant model-based concepts for hydrogen infrastructure design. Ultimately, the presented methodological framework can enable stakeholders involved in cargo bikes’ infrastructure operation to make informed decisions, not only in defining suitable refueling strategies and safeguarding the uninterrupted operation of a cargo bike fleet but also in designing and planning the expansion of hydrogen refueling stations. The methodology accounts for key factors, namely the refueling frequency, fleet size expansion, and different routing requirements. Addressing such aspects would be significantly more challenging without model-based concepts, underscoring the innovation of the presented work.
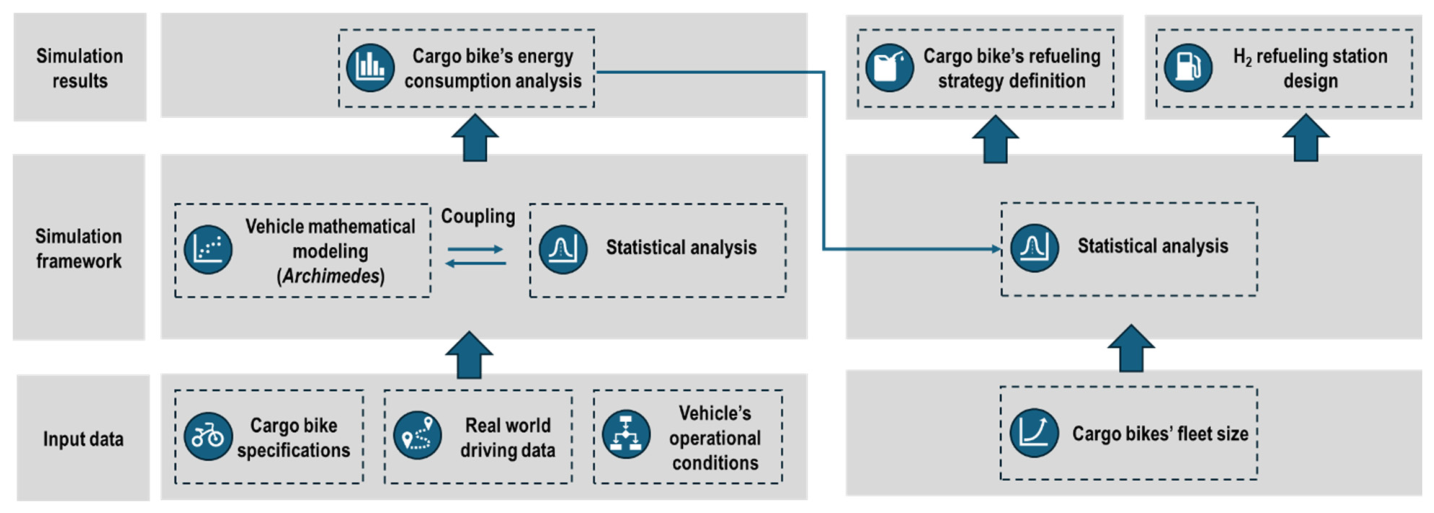
The scope of the work is organized into three areas. The respective methodological framework is presented in Figure 1. The first area is dedicated to the energy consumption analysis of the studied hydrogen cargo bike. Employing state-of-the-art longitudinal-based vehicle mathematical modeling, a digital twin of the H2-powered bike was developed. The model was then used to assess the vehicle’s energy consumption under a broad range of operational conditions, including different carrying loads and driver behaviors. Papaioannou et al. have focused on the effects of the road grade on the optimization of the vehicle routing of an e-cargo bike [12]. Moreover, Oguz and Capkin have studied the performance of electric and hydrogen-powered cargo bikes by means of real driving data recorded in the city of Rome [9]. To depict the energy consumption of the studied cargo bike under real-world operating conditions, real driving data (i.e., speed profiles and road grades) were also used in the context of this work. Moreover, to account for the stochastic variation in the vehicle’s carrying load and the driver’s behavior, sensitivity analysis and Monte Carlo simulations were coupled with the vehicle’s mathematical model, which represents a significant aspect of this study. While Papaioannou et al. have previously studied the effects of the road grade on electric cargo bikes’ energy consumption [12], the impacts related to the stochastic variation in the cargo mass and/or the driver’s behavior have not been reported in the literature, constituting a key contribution of the present work.
The second part of the article focuses on the cargo bike’s refueling strategy. Employing the simulated energy consumption under various scenarios relevant to the vehicle’s operational conditions, we have computed the frequency of hydrogen refueling for various sizes of cargo fleets and various levels of traveling range. This mapping constitutes a methodological framework for defining the H2 refueling strategy for fleets of cargo bikes, which can potentially address organizational challenges faced by the respective fleet operators and has not been reported in the literature.
The third and last part of this work is relevant to hydrogen refueling infrastructure design assessment. The studied cargo bike is refueled by means of swappable hydrogen tanks, stored in a “dispenser”-style H2 station. Employing the simulated data from the first two parts of the work, and applying sensitivity analysis, it was possible to chart the number of hydrogen dispensers to be deployed while identifying H2 supply chain challenges. Hao et al. have recently published one of the few relevant works on the financial feasibility of swappable hydrogen tanks, focusing on heavy-duty trucks [21]. To the best of our knowledge, the respective topic has not been widely covered in the literature with respect to hydrogen-powered cargo bikes; hence, the data-driven analysis presented in this article constitutes another important addition to the existing literature.

2. Driving Data Collection

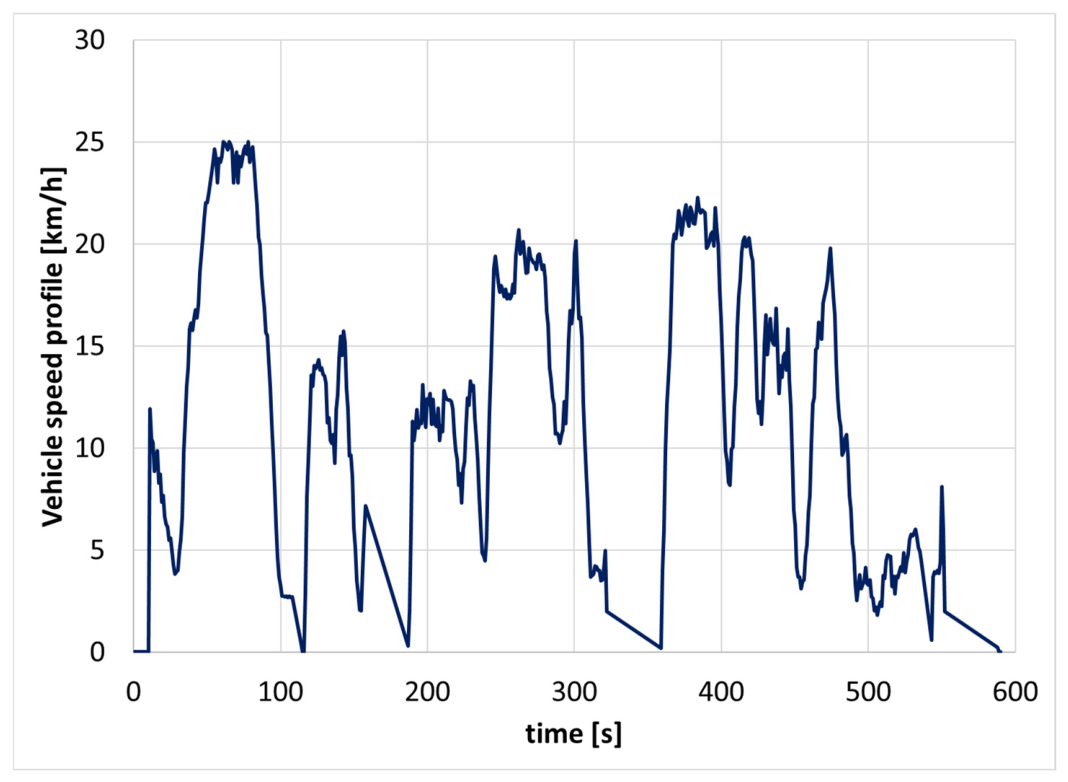
Real driving data, corresponding to a battery electric bicycle, were collected first. A total of 4 routes were considered, which were recorded in an urban city environment. The respective driving data were processed using commercial software that primarily utilizes map data from OpenStreetMap, along with built-in elevation maps. These data constituted timeseries of the bike’s velocity and position, recorded at a 1 Hz acquisition rate. Positioning was obtained using a single-frequency GNSS (L1/E1) receiver. By processing thisdata, timeseries of the speed, acceleration, and road grade were created, intended to be used as input for simulating the studied cargo bike’s energy consumption and H2 refueling frequency. Information related to the collected driving data is summarized in Table 1. Indicatively, the driving profile recorded during the driving cycle “Route 1” is shown in Figure 2.

3. Methodology

3.1. Mathematical Modeling Framework for a Hydrogen-Powered Cargo Bike

In the context of this work, a mathematical model of a battery electric cargo bike equipped with a hydrogen fuel cell was developed. For this purpose, the state-of-the-art electric vehicle simulator Archimedes version 2024Q4 (e-Kinesis P.C., Athens, Greece) was used, which is engineered by e-Kinesis. The software can depict the cargo bike’s performance by analyzing the vehicle’s longitudinal dynamics and has already been successfully applied to analyze the H2 refueling strategy of a battery electric light commercial vehicle, which was equipped with a hydrogen fuel cell range extender [22].
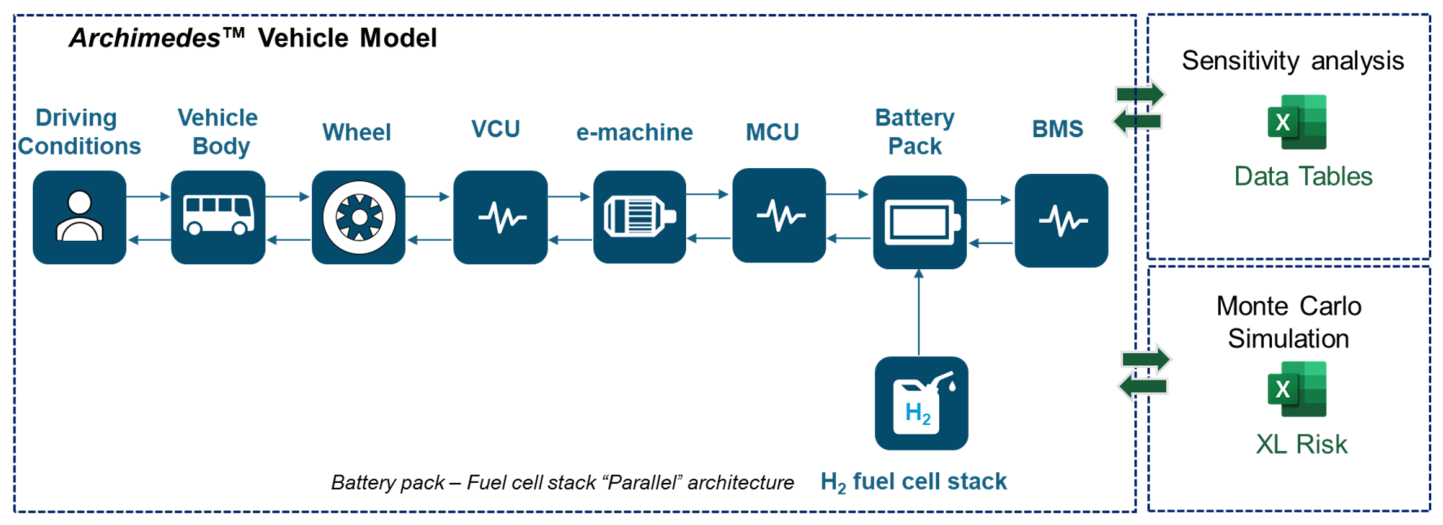
The studied vehicle is equipped with two batteries. One battery is connected to the electric machine, whereas the second one is charged by the fuel cell stack. The driver can switch between the two batteries through onboard automation. Additionally, the vehicle’s electric motor is instrumented with a torque sensor, allowing the driver to manually boost the cargo bike through pedaling. In this respect, the respective driver-generated torque can be added to that of the electric motor. This powertrain configuration was depicted in the Archimedes model, as shown in Figure 3.
In more detail, the vehicle model was developed using a modular, model component-based approach to comprehensively represent vehicle operation. The model integrates driving conditions to generate speed and road grade profiles and simulate driver behavior (“driving conditions” component), a “vehicle body” component to capture mass and chassis characteristics, and a “wheel” component representing the transmission system. In addition, it includes an “e-machine” component describing electric motor/generator operation, a “battery pack” component for energy storage modeling, and an “H2 fuel stack” component that represents both the hydrogen tank and fuel cell stack. The overall system is managed through dedicated control components, namely the “Vehicle Control Unit” (VCU), “Motor Control Unit” (MCU), and “Battery Management System” (BMS), which simulate the corresponding control strategies. To model torque boosting through driver pedaling, the Archimedes software incorporates a modeling feature, which allows for simulating the instantaneous torque generation by the driver. The driver-generated torque is activated as a function of the vehicle’s acceleration, and the respective torque level is simulated according to a statistical distribution. Computations are based on a combined “forward/backward” approach [23]. The respective parameters of each model component are shown in Table 2, whereas the “driving cycle” model component was parametrized employing the real driving data compiled in Table 1.
The respective governing equations have been demonstrated in the earlier publications of Skarlis et al. [24,25,26] and are briefly presented below.
The tractive force required for the cargo bike’s acceleration is calculated through Equation (1), taking into account the vehicle’s rolling resistance (Equation (3)), aerodynamic drag force (Equation (4)), and climbing force (Equation (5)):
F t r a c t i v e F r e s i s t i v e = m v e h a v e h + I i t o t R w h e e l 2 a v e h
F r e s i s t i v e = F f + F a e r o + F C
F f = m v e h g ( f + k u v e h ) cos φ
F a e r o = 1 2 A f r o n t a l ρ a i r C D u v e h u a i r 2
F C = m v e h g sin φ
The bike’s mass (mveh) is broken down into the vehicle carb weight and the cargo mass and is considered in Equations (1), (3), and (5). Variations in the vehicle’s mass can impact the inertial forces, rolling resistance, and climbing forces, which can affect the vehicle’s energy consumption. As far as rolling resistance calculation is concerned, the coefficient of rolling resistance (f) and the velocity-dependent resistance (k) are also factored in. The drag force coefficient (CD) and the vehicle’s frontal area (Afrontal) are design parameters of the cargo bike and linearly affect drag forces (Equation (4)).
The power (Pwheel) and torque (Twheel) at vehicle’s wheels are computed through Equations (6) and (7), respectively, by factoring in tractive forces (Ftractive), the bike’s speed (uveh), and the wheel rolling radius (Rwheel):
P w h e e l = F t r a c t i v e u v e h
T w h e e l = F t r a c t i v e R w h e e l
The revolution speed (Nmachine), power (Pmotor_out and Pgenerator_in), and torque (Tmotor) of the electric motor are simulated through Equations (8)–(11):
N m a c h i n e = u v e h i t o t 2 π R w h e e l
P m o t o r _ o u t = P w h e e l η t r a n s m i s s i o n
P g e n e r a t o r _ i n = P w h e e l η t r a n s m i s s i o n
T m o t o r = P m o t o r 2 π N m o t o r
The energy efficiency of the electric machine is derived through a stationary efficiency map, which provides the energy efficiency as a function of the machine’s speed and torque.
The final gear ratio (itot) of the cargo bike is simulated according to Equation (12), where the gear box ratio (igb) and the differential gear ratio (idiff) are factored in:
i t o t = i g b · i d i f f
Energy losses relevant to the transmission system are depicted through Equation (13), where the thermal efficiencies of the gear box (ηgb) and the differential (ηdiff) are included:
η t r a n s m i s s i o n = η g b · η d i f f
At this stage, it should be noted that the studied cargo bike is not equipped with a gear box, so torque is transmitted from the electric machine to the vehicle’s differential.
As far as the cargo bike’s battery pack’s electrical performance is concerned, it is modeled through the “equivalent circuit” model approach [27]. The respective power removed/supplied from/to the battery pack is equal to the power consumed/harvested by the electric motor (Pmotor_in) (Equation (14)):
P b a t = P m o t o r _ i n
Under braking and/or deceleration circumstances, the studied cargo bike can harvest energy and supply it back to the battery pack through regenerative braking. A serial braking strategy is employed to depict the distribution of the braking torque between the electric machine and the friction brakes [28].

3.2. Statistical Analysis

To simulate the cargo bike’s energy consumption and autonomy under a broad range of operating conditions, sensitivity analyses and Monte Carlo simulations were conducted. For this purpose, the Archimedes vehicle model was seamlessly coupled with the “data tables” and “XL risk” functionalities embedded in the Microsoft Excel® software. Detailed information regarding this coupling can be found in our previous work [22].
Sensitivity analyses were conducted by varying the cargo mass and the driving style, as shown in Table 3.
To study the driver behavior’s effect on the cargo bike’s performance, three driving modes were considered: (i) a “neutral driving” style, according to which the driver follows the speed profile of each of the studied driving cycles, without any deviation; (ii) “eco-driving”, which includes the e-cargo bike’s driving at lower acceleration rates than those prescribed in each driving cycle; and (iii) “aggressive driving”, which includes driving at higher acceleration rates than those prescribed in each driving cycle.
The ensemble of the aforementioned sensitivities was studied under the speed profiles presented in Table 1. First, each of the aforementioned sensitivities was individually simulated for each speed profile in order to quantify the effect of each of the aforementioned operational factors on the vehicle’s energy consumption. Variations in the vehicle’s mass (mveh) affect the inertial forces (Equation (1)), the rolling resistance (Equation (3)), and the climbing forces (Equation (5)). Therefore, an increase in the cargo’s mass can result in higher energy consumption. Similarly, driving profile and driver behavior variations can affect resistive forces (Equation (1)) and the electric motor’s power output (Equations (9) and (10)). Focusing on the latter, depending on the velocity of the bike, the electric machine is operated under different energy efficiency regimes, which impacts the bike’s energy consumption.
Then, the sensitivities shown in Table 3 were simultaneously simulated for each of the speed profiles compiled in Table 1. For this purpose, Monte Carlo simulations were employed, and the outcome was a probabilistic assessment of the e-cargo bike’s energy consumption under stochastic operating conditions. Given the absence of historical data relevant to the variation in the aforementioned operational parameters, the triangular distribution was used as a suitable continuous statistical distribution to assess the range of possible outcomes of these variables. According to a publication by Pakyuz-Charrier et al., in the absence of sufficient empirical information to define input distributions, probability distributions were assigned based on the available data and uncertainty bounds. The triangular distribution was also considered appropriate due to its ability to represent bounded uncertainty using minimum, most probable, and maximum values [29]. To build this distribution, three-point estimates were used—minimum, most likely, and maximum values—which were generated by considering the parameter ranges shown in Table 3. While the cargo mass is a continuous model variable, the driving style can be considered a categorial parameter. In this respect, in the context of this work, Monte Carlo simulations relevant to the latter were conducted by continuously varying the acceleration profile of each driving cycle within the boundaries of the “eco-driving”, “neutral driving”, and “aggressive driving” styles described above.
In total, a set of 5000 Monte Carlo simulations were repeated for each of the driving cycles (Table 1). Upon pre-testing, 5000 simulations was considered an optimal tradeoff between computational time and simulation accuracy.

4. Results

4.1. Assessment of the Speed Profile and Road Grade Effects on the Cargo Bike Energy Consumption and Autonomy

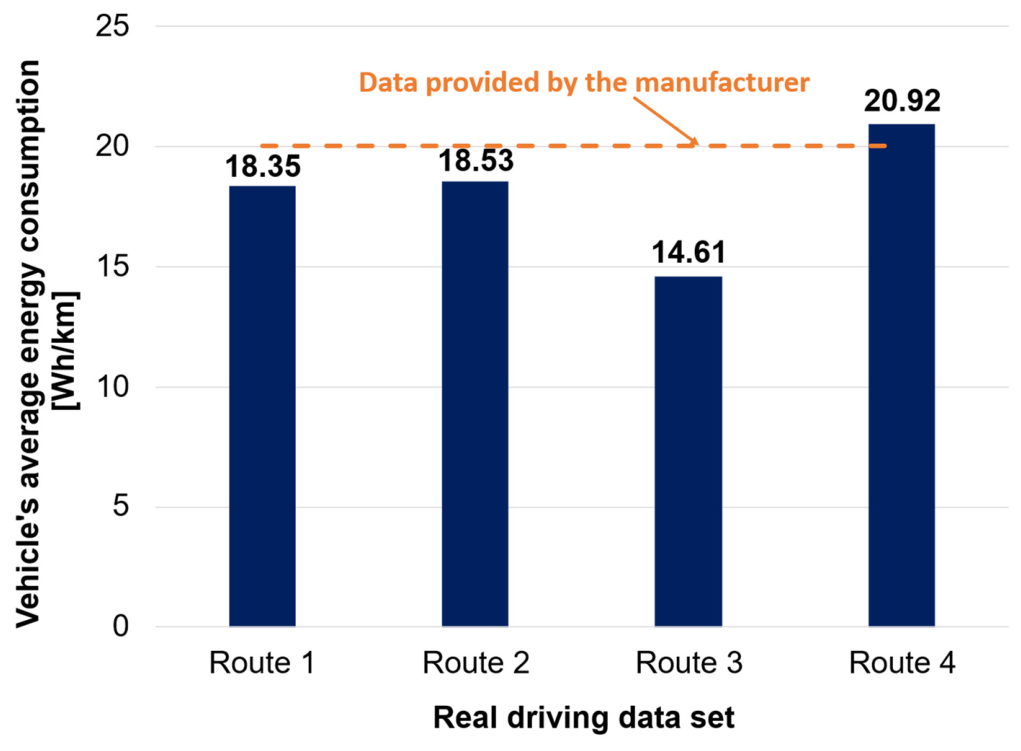
First, the cargo bike’s average energy consumption was simulated for each of the driving cycles (Table 1). For these simulations, the vehicle’s mass was assumed to be equal to the cargo bike’s gross vehicle weight (i.e., 360 kg). The respective results are illustrated in Figure 4. For comparison purposes, energy consumption data corresponding to field testing conditions and recorded by the manufacturer are included in the same graph.
The average energy consumption of the studied vehicle ranges between 14.61 and 20.92 Wh/km, which is in reasonable agreement with the respective experimental data provided by the manufacturer (ca. 20 Wh/km). While the latter tends to support the capability of the mathematical model to depict the vehicle’s energy consumption under real-world driving conditions, the limited availability of experimental data can allow for only limited model validation. Still, the application of the model to a wider range of speed profiles and road gradients could be supported by recent developments in digital twin and vehicle energy consumption modeling. Zhang et al. concluded that digitally twinned energy models, when appropriately calibrated using experimental and operational data, can offer reliable predictions of electric vehicle consumption across varying driving conditions [30]. Furthermore, Xie et al. reported that microsimulation-based physics-driven models retain high predictability accuracy across different driving patterns and speed regimes, underscoring their robustness beyond the initial validation domain [31]. Moreover, recent multi-physics digital twin frameworks have been demonstrated to accurately reproduce energy consumption and state-of-charge behavioral patterns under realistic urban conditions [32]. Such findings collectively substantiate the reliability of the present longitudinal dynamics model for examining relative energy performance trends under alternative operational scenarios.
Given that the aim of this study is to provide a methodological framework for assessing–optimizing the hydrogen refueling strategy and the design of the hydrogen infrastructure, the detailed validation of the mathematical model, through comparisons of the simulated energy consumption with a broad range of measurements, was considered to be beyond the scope of the work. Such aspects could be further studied as future work.
The energy consumption range of 14.61–20.92 Wh/km constitutes an almost 43% variation and demonstrates a material effect of the e-cargo bike’s speed and acceleration profiles on its energy consumption.
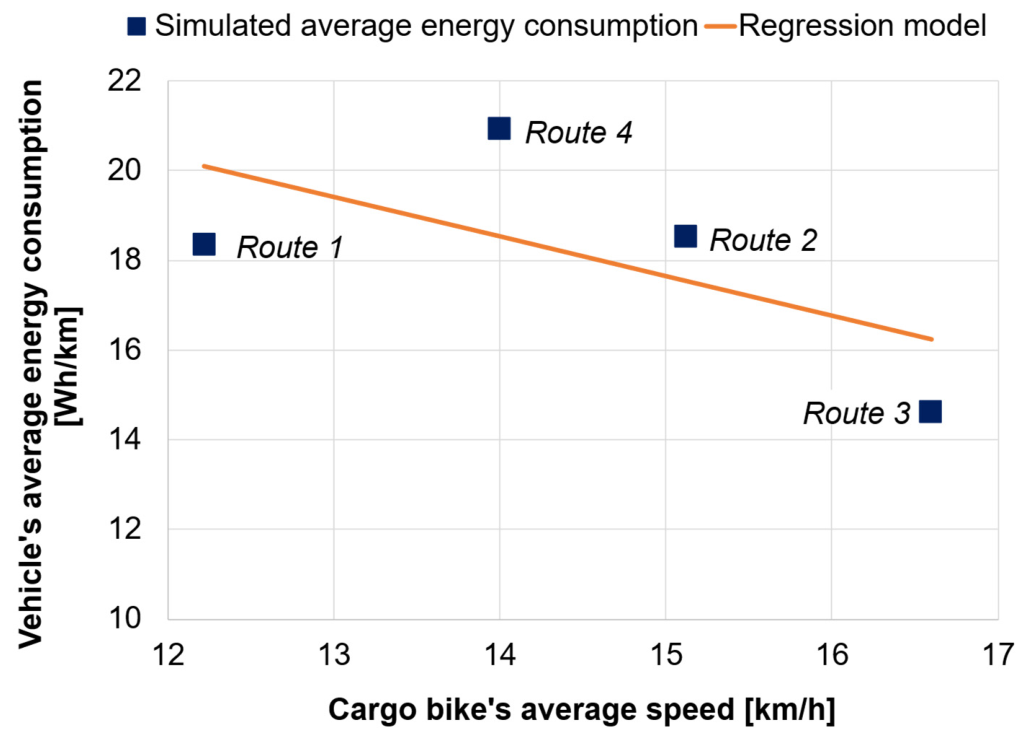
To further quantify the effects of the speed profile on the e-cargo bike’s energy consumption, regression analysis was conducted. First, the simulated energy consumption was plotted as a function of the average speed of each of the studied real driving cycles (Figure 5). The derived regression model was also plotted in the same graph and relates the mean energy consumption to the average vehicle speed through the equation 30.89 − 0.88∙uveh (R2 is ca. 40%). uveh stands for the cargo bike’s mean velocity in km/h. The results show that the cargo bike’s energy consumption decreases when increasing the vehicle’s average speed. As commented in earlier publications by Skarlis et al. [25,26], driving an electric vehicle at higher speeds results in operating the electric motor at higher revolutions. In such a case, the electric motor’s energy efficiency is enhanced, and the overall vehicle’s energy consumption decreases.
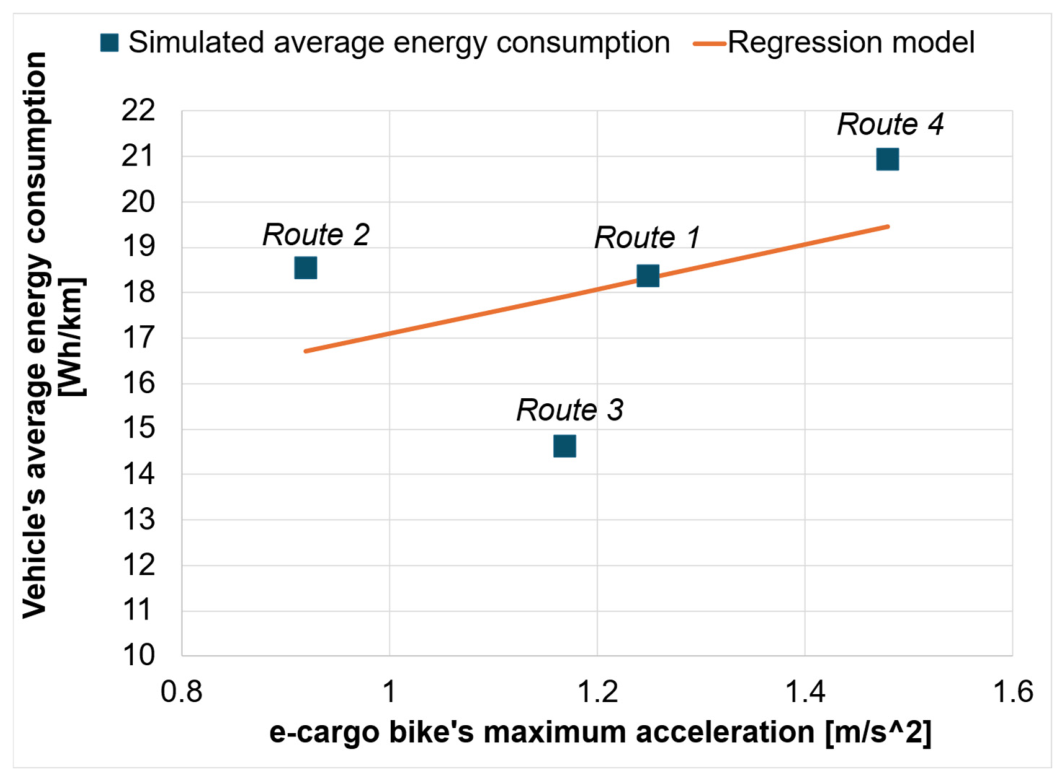
The effect of the vehicle’s acceleration on its average energy consumption was studied next through regression analysis. In Figure 6, the simulated energy consumption is presented as a function of the cargo bike’s maximum acceleration, and the regression model is also included in the same graph for comparison purposes. The respective regression model equation is 4.91∙amax + 12.18, where amax (m/s2) is the maximum vehicle acceleration (R2 = 19%). When increasing the vehicle’s maximum acceleration, the average energy consumption reasonably increases due to the fact that the inertial forces applied to the vehicle are also enhanced.
The demonstrated regression analysis tends to provide useful interpretations with regard to the effects of the driving profile (speed and acceleration) on the e-cargo bike’s energy consumption and ultimately allow for defining optimal driving conditions to extend the vehicle’s traveling range. Nevertheless, given that a relatively limited number of driving cycles was studied in this work and that the respective traveling distance ranged between 1.5 and 2.5 km, the proposed regression models may not be suitable to fully depict the impacts of the driving cycle on the vehicle’s energy consumption. In this respect, the inferred relationship between the average vehicle speed and acceleration and energy consumption should be viewed as preliminary and indicative of a potential trend rather than a robust statistical association.
Focusing on the driving cycle, Route 3 appears to have the lowest energy consumption. In this case, not only is the average driving speed 14.6 km/h, but the maximum acceleration is below 1.2 m/s2 as well. Interestingly, for this driving cycle, the mean road slope is also negative (Table 1). In this respect, one may consider that the road grade may also contribute to the minimization of the e-cargo bike’s energy consumption. To examine this assumption, the energy consumption was simulated again, considering that the road slope was equal to 0% for all studied driving cycles. As shown in Table 4, the road grade may only marginally affect the studied vehicle’s average energy consumption (less than 1% for the studied driving conditions). In fact, the variation in the road grade recorded through the studied routes is quite narrow, which may explain the minimal impact of this operating parameter on the vehicle’s energy consumption. In their study, Papaioannou et al. incorporated the road grade as part of the cost function in e-cargo bike routing, illustrating that, while a gradient is considered in operational modeling, its influence is generally overshadowed by other factors, such as speed and travel distance, in the majority of urban delivery scenarios [12]. Such findings may highlight technical difficulties in isolating the impact of the road grade on cargo bikes’ energy consumption. A more detailed analysis of this topic is beyond the scope of the present work and could be included in future studies.

4.2. Cargo Effect on the Cargo Bike’s Energy Consumption

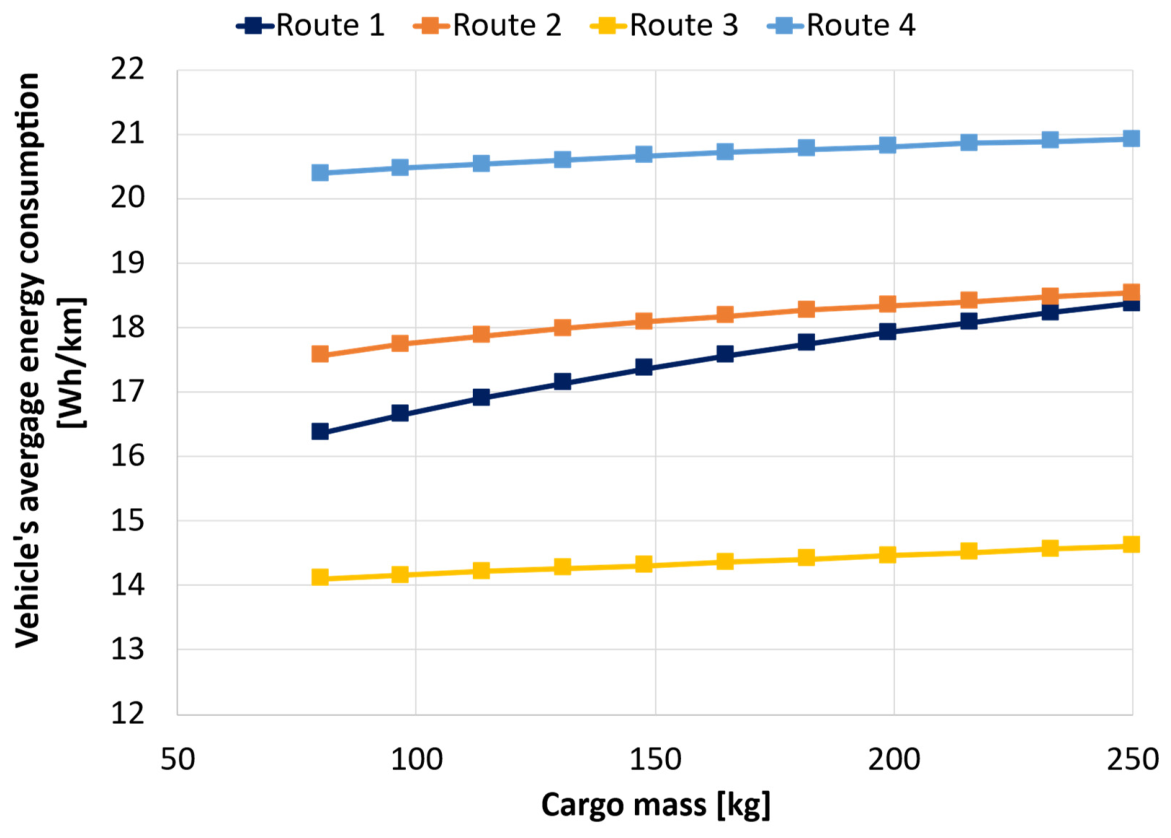
The effect of the cargo mass on the e-cargo bike’s average energy consumption was studied next. The respective simulation results for each driving cycle are presented in Figure 7. Naturally, when increasing the vehicle’s cargo and hence the overall vehicle mass, the energy consumption also increases. As discussed by Skarlis et al., an increase in the vehicle’s total mass can result in an increase in the cargo bike’s rolling resistance and the inertial forces acting on the vehicle, which eventually triggers higher energy consumption [22,24]. The average energy consumption might increase by up to 2–12% as a function of the vehicle’s cargo mass for the studied driving conditions. Despite the fact that the simulated increase in the vehicle’s energy consumption is material, it is lower than that observed under different speed profiles. As discussed above, the latter not only affects the forces applied on the vehicle but impacts the energy efficiency of the electric motor as well, which explains the results presented in this work.
The above findings also align with recent experimental evidence presented by Cieślik and Antczak, who explored the impact of the cargo mass on the energy consumption and driving ranges of electric light-duty delivery vehicles under realistic operating circumstances [33]. Their results showed that increased cargo loads significantly raise the energy demand and cause a noticeable reduction in driving range, with the most significant effects noticed in urban stop-and-go driving patterns, where frequent acceleration instances aggravate inertial energy losses. In addition, the authors highlighted that route-related factors, which include road gradients and hilly terrain, further intensify energy consumption and range reduction when combined with higher payload levels. However, the study also indicated that the negative effect of the cargo mass on range can be partially mitigated by optimizing the driving strategy and appropriately matching the vehicle specifications to daily operational needs. Such topics are further discussed in Section 5 of this article.
At this stage, it should be mentioned that, in the works of Skarlis et al., it was shown that the energy consumption of a battery electric vehicle should be studied considering both the vehicle’s speed and mass [24,26]. In the context of this work, the studied vehicle’s average speed ranges between 12.2 and 16.6 km/h, which is a rather narrow window. In this respect, such aspects could not be depicted in this study and can be considered as future work.

4.3. Driver’s Behavior Effect on the Cargo Bike’s Energy Consumption

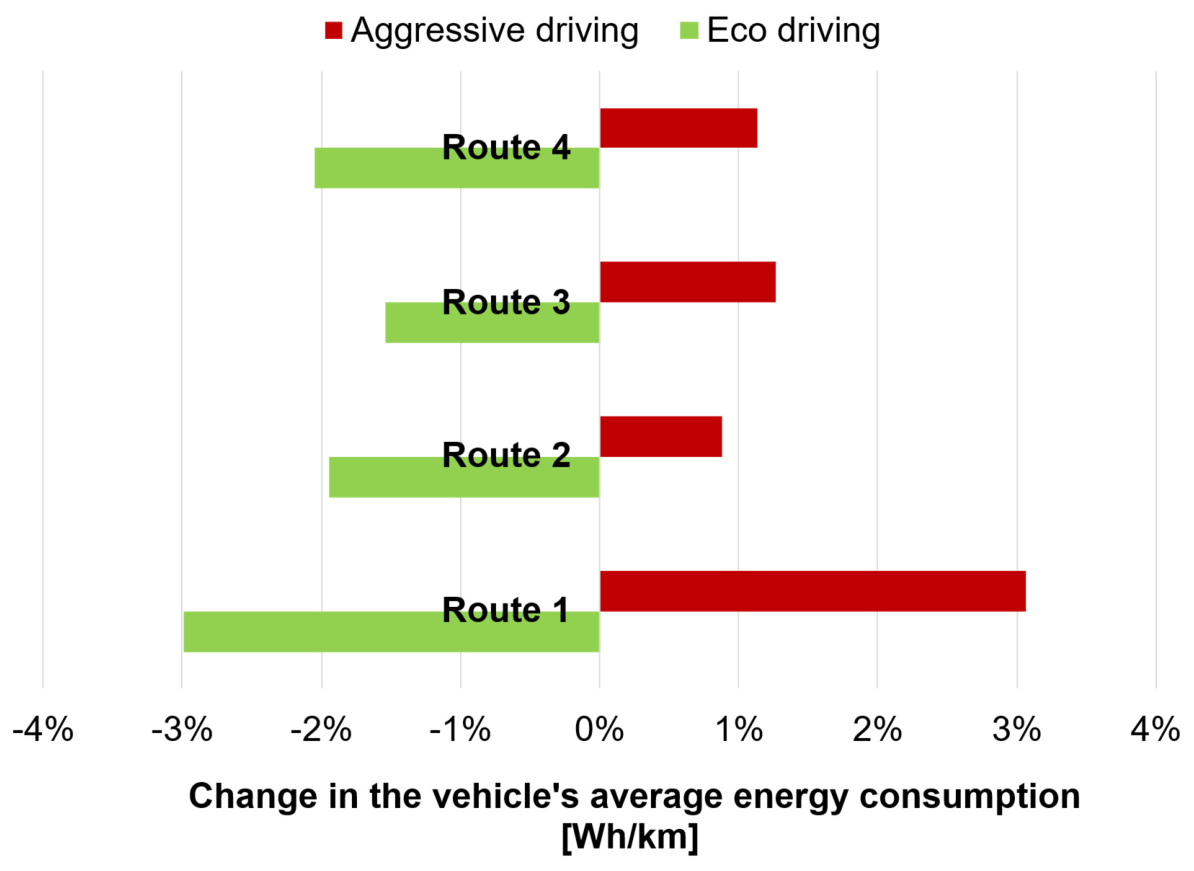
The effect of the driver’s behavior on the cargo bike’s energy consumption is discussed in this section. The respective simulation results (Figure 8) show that the driver’s behavior can affect the vehicle’s average energy consumption from 2.8% (Routes 2 and 3) to 6.1% (Route 1), depending on the speed profile. In the case of Route 1, energy savings of up to 3% may be achieved through eco-driving. On the other hand, an aggressive driving style could result in an increase in energy consumption of up to 3.1%. The results provided in this study seem to be in reasonable agreement with the work of Varga et al. [34] and Skarlis et al. [22], who reported that a light-duty electric vehicle’s range may be affected by up to 10% by the driver’s style. In the context of this study, the studied cargo bike’s powertrain system includes a functionality that allows the driver-generated torque to be added to that of the electric motor, which is also considered in the Archimedes model. In this respect, under aggressive driving conditions, the driver contribution tends to reduce the energy consumption by the electric motor.
In addition, Al-Wreikat et al. found that driving behavior can significantly affect energy consumption in electric vehicles under real-life driving conditions, with aggressive driving behavior increasing energy consumption by up to 16% when compared to passive driving styles [35]. Simultaneously, another study on eco-driving strategies suggested that smoother acceleration and deceleration patterns can lead to significant energy savings; in particular, their study showed that eco-driving strategies can reduce EV energy consumption by more than 30% when driving in cities, as compared with conventional driving behavior [36].

4.4. Probabilistic Analysis of the Vehicle’s Autonomy

Under real operating conditions, the cargo bike’s speed profile, cargo, and driver behavior may stochastically vary. For this purpose, a probabilistic analysis of the studied vehicle’s energy consumption was conducted through coupling the Archimedes mathematical model with Monte Carlo simulation.
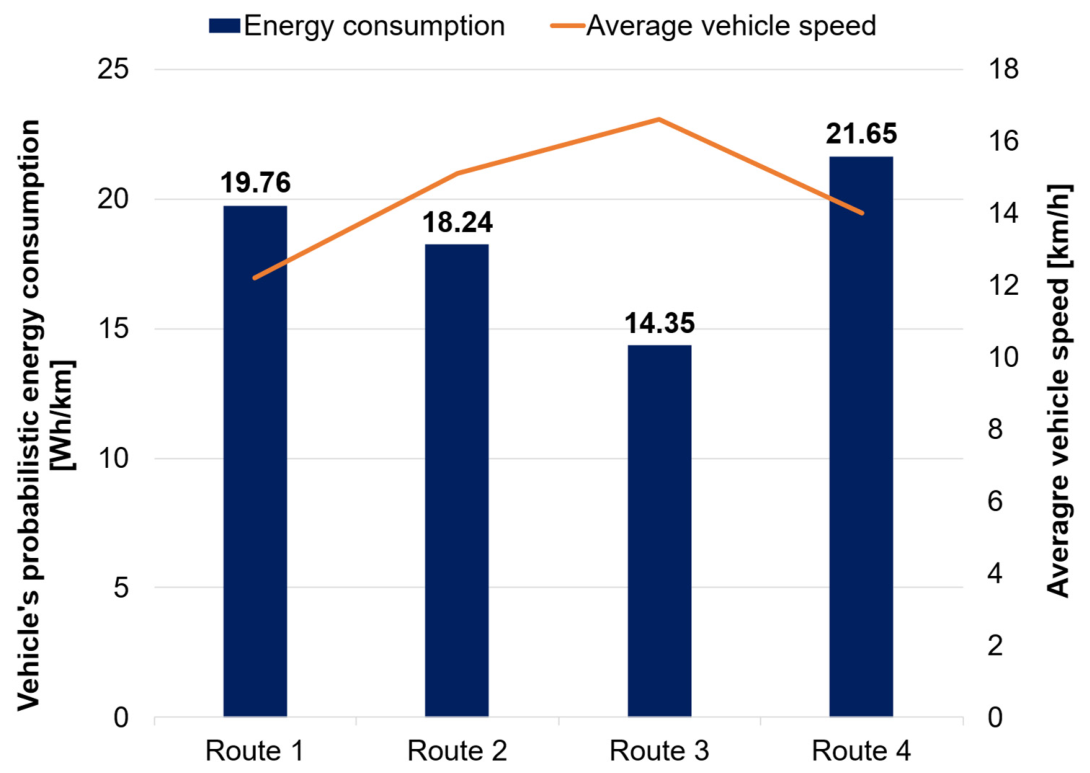
The respective results are presented in Figure 9. By simultaneously varying the vehicle’s cargo and the driver’s behavior, the vehicle energy consumption can range between 14.35 Wh/km (Route 3) and 21.65 Wh/km (Route 4). At 95% confidence, the predicted energy consumption is accurate within an average range of ±0.004 Wh/km for the ensemble of the four studied routes. Moreover, 10% and 90% percentiles have been computed to depict the most optimistic and pessimistic energy consumption levels for each route. For Routes 2 to 4, the delta between the maximum (P90) and minimum (P10) energy consumption was limited to 0.6 Wh/km, whereas, for the case of Route 1, the respective delta was in the order of 1 Wh/km. Ultimately, the Monte Carlo analysis results indicate that the probabilistic energy consumption of the cargo bike may vary by an average of ±3.5% (maximum−minimum energy consumption) vis-à-vis the most probabilistic value, as shown in Figure 9.
It is worth noting that, under stochastic operating conditions, the effect of the cargo bike’s speed profile on the vehicle’s average energy consumption is dominant, and the trend of the Monte Carlo simulation results converges to that presented in Figure 4. In this respect, the Monte Carlo simulation analysis tends to confirm that the cargo bike’s speed and acceleration may be the most important determinants of the vehicle’s energy consumption.
Similar results have been reported by Niu et al., who developed a stochastic model comprising seven parameters to simulate random driving behaviors’ effects on electric vehicles’ energy autonomy [37]. Their research showed that stochastic driving patterns can significantly affect energy autonomy while having a marginal influence on economic or CO2 emission outcomes, pointing out the significance of modeling operational uncertainty. In a similar manner, Maity and Sarkar demonstrated that driving behavior, captured through acceleration and deceleration patterns, is a significant contributor to electric vehicle energy consumption variability, with their probabilistic model predicting full consumption distributions in a more accurate manner compared with deterministic practices [38].

4.5. H2 Refueling Strategy Definition

The studied cargo bike’s refueling strategy is discussed in this section. Employing the vehicle’s energy consumption and the fuel cell stack efficiency, the weekly consumption of hydrogen of the vehicle was simulated by the Archimedes model. Subsequently, the respective refueling sessions for the same time horizon were assessed. Each refueling event is counted as a session, irrespective of whether the tank is fully or partially refilled. The aforementioned analysis was expanded to various cases of daily mileage and cargo bike fleet sizes, as shown in Table 5.
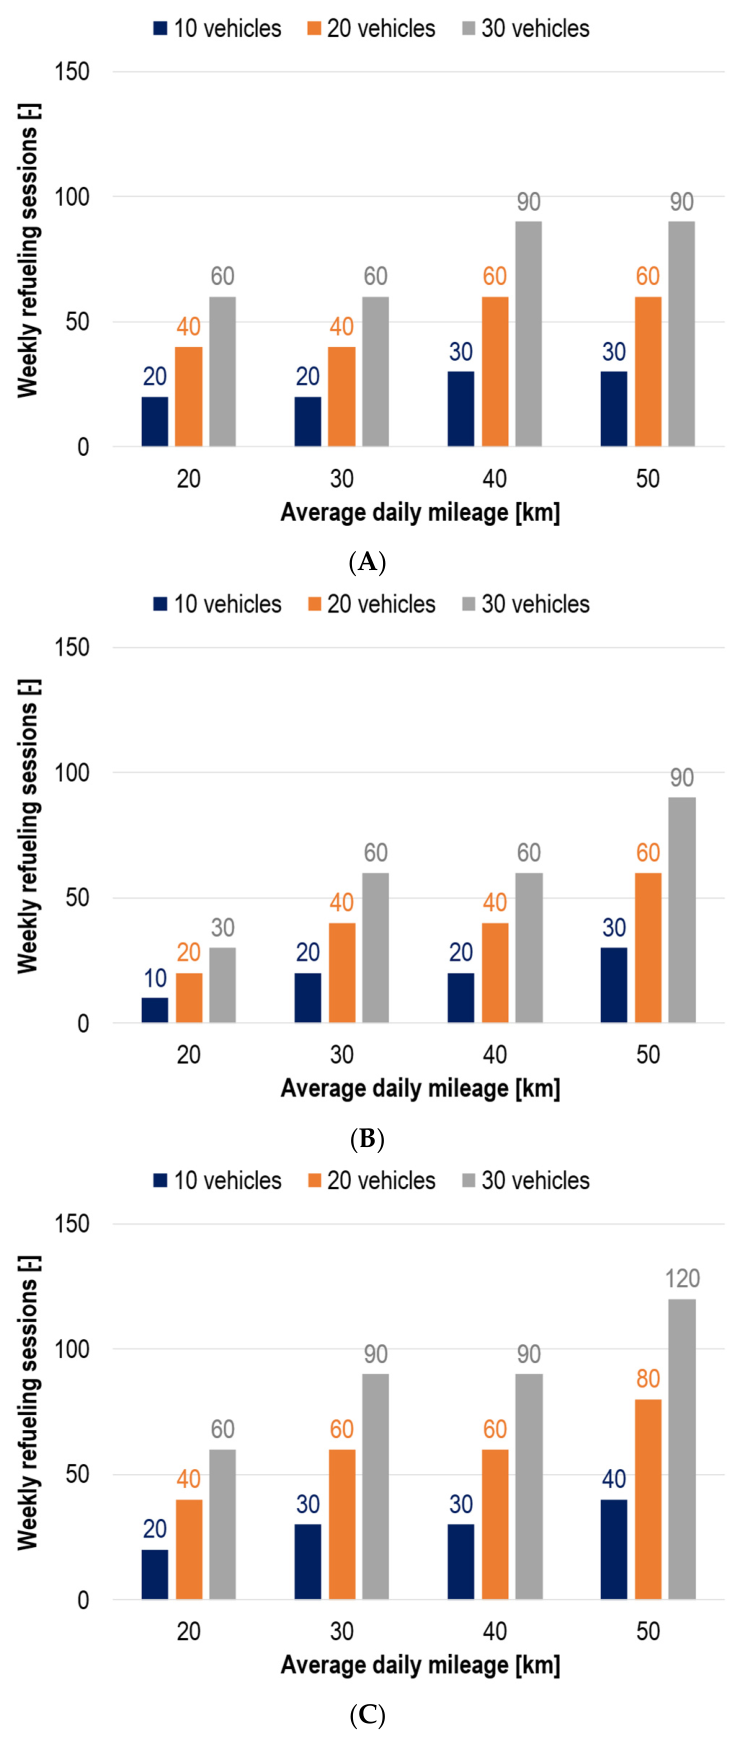
According to the results presented in Section 4.2 and Section 4.3, the cargo bike’s operational parameters can significantly affect the average vehicle energy consumption. For this purpose, three energy consumption scenarios were considered, which are summarized in Table 6. The “base” energy consumption scenario corresponds to the average probabilistic energy consumption calculated across Routes 1–4, as presented in Section 4.3. The “low” energy consumption scenario corresponds to a case of optimized energy savings and includes driving under the speed profile of Route 3, with a half-loaded vehicle (i.e., total cargo mass equal to 165 kg, which comprises an 80 kg driver mass and 85 kg cargo mass) and eco-driving. Finally, the “high” energy consumption scenario is used to simulate the energy consumption under worst-case conditions, namely a speed profile in line with Route 4, a fully loaded vehicle, and aggressive driver behavior.
The suggested methodological framework to define the fleet-level refueling strategy is aligned with recent studies on hydrogen refueling operation strategies. Indicatively, Kuby et al. showed that including vehicle travel demand patterns and refueling behavior in hydrogen infrastructure planning allows the more realistic projection of refueling demands and supports effective infrastructure capacity design [39].
The calculated refueling sessions for the aforementioned energy consumption scenarios are presented in Figure 10 as a function of the average daily mileage and fleet size. According to the “base” energy consumption scenario (Figure 10A), for a fleet size of 10 cargo bikes, the number of weekly H2 refueling sessions is computed to increase from 20 to 30 when the daily route ranges from 20 to 50 km, respectively. For a fleet comprising 20 cargo bikes, the analysis tends to support that the respective number of hydrogen refueling sessions may range from 40 to 60 per week. Further increasing the fleet size to 30 vehicles, the number of weekly refueling sessions may increase to up to 90 in the case of 40 km and 50 km daily traveling. Optimizing the energy efficiency of the studied e-cargo bike (“low” energy consumption scenario—Figure 10B) can lead to the minimization of the weekly refueling sessions, particularly for the 20 km and 40 km daily mileage cases. On the other hand, the required H2 refueling sessions for the fleets with 30 km and 50 km daily driving distances remain unchanged.
When examining the “high” energy consumption scenario (Figure 10C), the weekly refueling sessions naturally increase compared to the “base” energy consumption scenario. The number of refueling sessions for the fleet of 30 e-cargo bikes (the largest fleet considered in this study) is maximized and varies between 60 and 120 for 20–50 km daily routes accordingly.

4.6. Design of the H2 Refueling Infrastructure

The studied cargo bike is planned to be refueled with hydrogen by means of H2 dispenser stations. Each dispenser comprises storage spaces, which can accommodate up to four hydrogen tanks. Each H2 tank contains 2040 Nl of hydrogen, pressurized at 300 bar, and is identical to the respective hydrogen tank installed on the cargo bike (Table 2). Once the H2 tank that is installed on the cargo bike is depleted, the vehicle can refuel by swapping the empty hydrogen tank with a refilled tank available at the H2 dispenser station. “Green” hydrogen, generated through electrolyzers powered by photovoltaic arrays, is used to refill the H2 tanks. Based on the data provided by the dispenser system manufacturer, a total of 14 hydrogen tanks (of 2040 Nl H2 capacity each) can be refilled on a weekly basis.
Taking into consideration the size of the H2 dispenser (the number of tanks that can be accommodated at each dispenser), the size of the hydrogen tanks, the hydrogen tank refilling rate, and the e-cargo bike’s refueling frequency, the number of H2 dispensers required for smoothly refueling a fleet of e-cargo bikes on a weekly basis is discussed below. For this analysis, the average daily mileages and e-cargo bike fleet sizes described in Table 5 are considered. Moreover, weekly replenishment of the empty H2 tanks with refilled ones in the H2 dispensers is assumed. Finally, the exercise was repeated under the vehicle energy consumption scenarios described in Table 6.
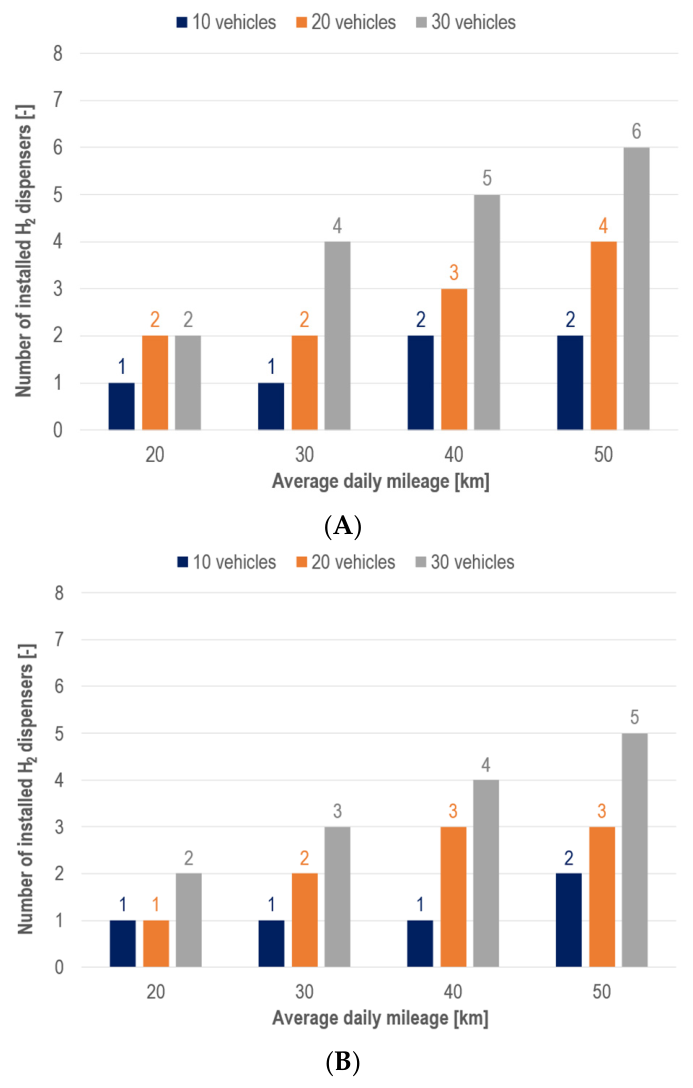
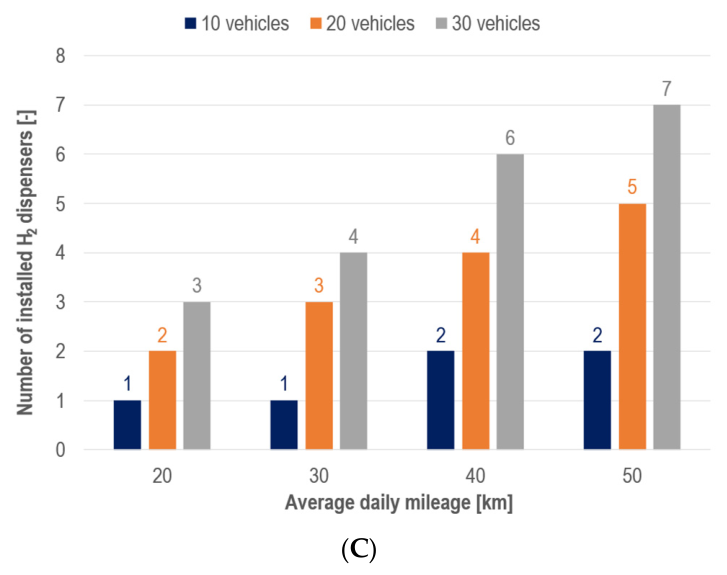
The respective results are presented in Figure 11A–C. Under the aforementioned hypotheses, the simulated results demonstrate that the daily mileage, the fleet size, and the vehicle average energy consumption affect the required number of H2 dispensers. For fleet sizes comprising 10 vehicles, up to two dispensers are required under the “base” energy consumption scenario in order to maximize the vehicles’ daily traveling range to 50 km. The fleet size is also an important determinant of the number of hydrogen dispensers to be deployed. The simulation results demonstrate that, in the case of a fleet of 30 vehicles, the number of required H2 dispensers may be more than double compared to that required for a fleet of 10 cargo bikes, irrespective of the energy consumption scenario.

5. Discussion

In this section, the implications of the obtained results for the operation of a fleet of the studied cargo bikes are discussed. According to the simulation results presented in Section 4, the vehicle’s speed profile may be the most important determinant of the studied vehicle’s energy consumption, followed by the cargo mass and the driver’s behavior. Focusing on the former, this study shows that the average speed and acceleration may be the most crucial determinants of the electric motor energy efficiency and the inertial forces applied to the vehicle accordingly. Despite the fact that this conclusion is based on a limited number of four routes, the importance of the speed profile, and particularly the average/maximum acceleration, regarding the cargo bike’s energy consumption is further supported by the analysis of the effect of the driver’s behavior on the vehicle’s energy consumption. Aggressive driving may lead to an up to 3.1% increase in the vehicle’s energy consumption. In this respect, defining a recommended average speed profile in the order of 15–16 km/h and minimizing the frequency of abrupt accelerations might allow for optimized energy savings for the studied cargo bike.
To achieve “eco-driving” and ultimately optimal energy consumption, the implementation of driver assistance control systems and drivers’ guidance and/or the adoption of gamification techniques may be considered. Regarding the former, Jayson et al. have proposed a detailed EV energy consumption model to derive a low-computational-cost eco-driving control strategy optimized for urban driving conditions [40]. Relevant control strategies have also been reported by Hamednia et al., where the co-optimization of EV eco-driving, battery thermal management, and charging has been demonstrated in the framework of a hilly route with intermediate charging stations [41]. Driver guidance/education can be an additional method towards minimizing energy consumption in electrified vehicles. Literature findings tend to suggest that eco-driving guidance should be adaptive to individual driver habits to enhance effectiveness and acceptance, while the alignment of eco-driving guidance with in-vehicle driving assistance is also recommended [42]. Regarding the latter, adopting game techniques to motivate eco-driving can be another solution towards mitigating EV energy consumption. A thorough review of gamification systems, which can be provided in the format of smartphone applications and/or in-car feedback displays, has also been presented elsewhere [43].
Routing optimization could also be combined with “eco-driving” to further enhance the energy efficiency of cargo bikes. Thibault et al. [44] and Xie et al. [45] have demonstrated that the co-optimization of “eco-routing” and “eco-driving”, enabled by advanced driving assistance systems, can allow for identifying optimal routes and providing assistance to the driver to opt for certain speed profiles, ultimately minimizing the energy consumption of electric vehicles. Such strategies could also be applied to the cargo bike sector, particularly in fleet operations involving long-distance routes and congested urban environments. However, it should be acknowledged that, within the scope of the present work, the effects of routing conditions, as well as the road grade (and/or surface quality), have not been fully represented. Incorporating these factors into future optimization frameworks could provide further insight into the interactions between route characteristics, driving behavior, and the energy consumption of cargo bikes. Hence, an accurate assessment of operational strategies for cargo bikes could be achieved.
At this stage, it should be noted that he impact of the road grade and/or the type of surface has also not been adequately depicted in this study. Uphill driving and/or driving on rough terrain could negatively affect the cargo’s energy consumption and hence provide useful insights for the optimization of the vehicle’s operating conditions.
Naturally, the studied cargo bike’s energy consumption can affect the respective hydrogen refueling strategy. The simulation analysis presented in Section 4 shows that, if the average energy consumption of the vehicle can be maintained below 20 Wh/km (“low” and “base” energy consumption scenarios), the number of weekly refueling sessions may range from 10 to 30 for a fleet of 10 vehicles and 20 to 60 for a fleet of 20 vehicles. Moreover, the required number of H2 dispensers may be limited to four in order to serve e-cargo bike fleets of up to 20 vehicles traveling up to 50 km/day. These results also confirm that optimizing the vehicle’s energy consumption below the aforementioned threshold can allow for maintaining the design of the hydrogen refueling infrastructure and the refueling scheduling of the vehicles without any changes in the case of upgrading the fleet size from 10 to 20 vehicles, which can be translated into lower upfront investments and smoother fleet management for the fleet owner/operator. Additionally, the results of this study tend to highlight that energy efficiency and the fleet size may need to be co-optimized to allow for the minimization of the weekly refueling sessions. The combined assessment of hydrogen refueling infrastructure design and vehicle fleet operation is discussed in a recent work by Talebi et al. [46]. The authors utilize a mathematical modeling framework to define a strategy for the progressive deployment of hydrogen-powered buses, alongside adjustments to fleet operations, with the objective of minimizing capital expenditures associated with refueling infrastructure.
On the other hand, if the vehicle’s average energy consumption exceeds 20 Wh/km (“high” energy consumption scenario), the respective frequency of refueling with hydrogen increases significantly, especially for the case of a fleet comprising 30 vehicles. This result further highlights the importance of optimizing energy savings through the development of driving guidelines, especially in the case of large fleets of cargo bikes. At this stage, it should be noted that the presented analysis was based on four routes recorded in a specific city. To obtain deeper insights into such aspects, additional driving data should be collected and analyzed, which may be considered as future work.
Finally, the number of required H2 dispensers for smoothly refueling a fleet of e-cargo bikes is discussed in this work. This work shows that the daily mileage, the size of the fleet, and the vehicles’ energy consumption affect the required number of dispensers to be deployed. Increasing the number of installed dispensers would result in the incurrence of increased capital expenditures, while mandating the occupation of additional space for deploying the respective infrastructure. In an earlier study by Maurer et al., the authors reported the variability in the H2 refueling station cost under different H2 storage configurations and compressor capacities [47]. The study tends to support that there is an optimal cost–benefit tradeoff when increasing the installed H2 storage capacity, which is in agreement with the findings of the present study.
To mitigate this issue, the optimization of the hydrogen production process can play a key role in minimizing the number of required hydrogen dispensers. In more detail, according to the analysis conducted by the refueling system’s manufacturer, the addition of a hydrogen storage tank downstream of the electrolyzer can increase the rate of refilling the H2 tanks of the vehicle from two to four on a daily basis. In this respect, the weekly replenishment sessions of the dispenser system can be also enhanced, resulting in a reduction in the requirement for deploying additional refueling stations. Such a strategy, however, would lead to increased capital expenditures, supply chain costs, and relevant complexity to be handled by the infrastructure operator. Similar conclusions have also been drawn by Damer et al., who raised concerns regarding the advantages of hydrogen-powered cargo bikes over battery electric ones due to the aforementioned organizational and technical constraints related to H2 refueling [10]. Consequently, a balance between the upfront investment for deploying hydrogen dispensers and the cost of replacing empty H2 tanks is deemed necessary.
Although the analysis was conducted using a specific cargo bike configuration and a limited set of urban routes, the main findings of the study can provide transferable insights for the operation and management of cargo bike fleets beyond the presented case study. In particular, the identified relationship between driving speed, driving behavior, and energy consumption can support the development of operational guidelines, “eco-driving” strategies, and fleet management approaches for a broad range of cargo bike applications. Moreover, the proposed integration of energy consumption assessment with H2 refueling infrastructure design provides a useful framework for evaluating the interaction between vehicle operation and infrastructure requirements under different fleet sizes and usage scenarios. Consequently, the presented methodology can serve as a foundation for future research and practical implementations targeting energy consumption reduction along with optimized hydrogen refueling infrastructure design for scalable fleets of cargo bikes.

6. Conclusions and Future Work

This study presented a data-driven framework for analyzing and optimizing hydrogen refueling strategies and H2 refueling station design for hydrogen-powered cargo bike fleets. The performed analysis enabled a comprehensive assessment of the e-cargo bike’s energy consumption across a broad range of operating conditions, capturing the influence of key parameters such as payload, driver behavior, speed profiles, and route characteristics. This level of detail provides a robust basis for understanding real-world operational behavior and its implications for hydrogen usage.
The proposed methodology systematically quantifies the relationships between the cargo bike’s operational parameters and its energy consumption, thereby offering actionable insights into hydrogen refueling and tank swapping strategies. In addition, sensitivity analysis was employed as a valuable tool to systematically explore and compare different hydrogen refueling strategies and operational requirements relevant to the design of hydrogen refueling stations. This approach enabled the detailed mapping of feasible refueling options and provides a strong foundation for supporting the scalable deployment of hydrogen cargo bike fleets.
At this stage, it should be noted that, in the present work, a single H2 refueling station is considered. The optimized deployment of multiple hydrogen dispenser units could potentially allow for the further extension of the cargo bike’s traveling range, while minimizing the number of dispensers used at each refueling point. Moreover, an analysis of capital expenditures relevant to H2 dispensers and a potential comparison vis-à-vis competing technologies could be of interest. Such aspects go beyond the scope of this study and could be considered as future work.
Furthermore, the limitations of the present analysis point to directions for future research. The studied vehicle’s operation is characterized by a relatively narrow average speed range (12.2–16.6 km/h), which limits the ability to capture the effects of more diverse driving conditions; extending the analysis to a wider range of operating speeds would therefore be valuable. More specifically, studying cargo bike speed levels as high as 20–25 km/h could provide useful insights into the tradeoff between enhanced e-motor energy efficiency and increased resistive forces, as discussed in Section 4.1 of this manuscript. Moreover, the effect of the road grade on the vehicle’s energy consumption was not fully depicted in this work due to the range of available routing data and/or the interference of other operational factors (e.g., the speed profile). A more detailed analysis of this topic could be included in a future study. Assessing cargo bikes’ operation on various types of terrain and/or surfaces (e.g., flat urban, hilly, rough dirt) could allow for the more detailed parametrization of the Archimedes model, with regard to the vehicle’s rolling resistance and velocity-related resistance (Equation (3)), ultimately providing useful information about the impact of the topography (road grade and surface quality) on the vehicle’s energy consumption.
In addition, while the primary objective of this study was to establish a methodological framework for optimizing hydrogen refueling strategies and infrastructure design, more extensive validation of the mathematical model, through detailed comparisons between the simulated energy consumption and a broader set of measurement data, remains an important area for future investigation. In this respect, future work could entail experimental data collection under various levels of cargo mass and driving conditions (e.g., heavy traffic, urban/rural driving, etc.). Finally, the analysis was based on four routes recorded in a single city; collecting and analyzing additional driving data from a wider range of routes and urban contexts would enhance the robustness and generalizability of the findings.
Interestingly, within the scope of this work, more than 15,000 simulations were completed overnight, corresponding to over 3600 km of virtual driving. This demonstrates the high computational efficiency and scalability of the approach. Such time-efficient and cost-effective simulations are well suited for supporting early-stage decision-making in the design and sizing of hydrogen refueling stations. In particular, they enable infrastructure planning as a function of the fleet size prior to deployment, with the potential to significantly optimize capital expenditures while ensuring reliable fleet operation.

Author Contributions

Conceptualization, S.S., A.N., G.B., J.M.S.G. and G.A.; data curation, S.S., A.N. and G.B.; methodology, S.S.; software, S.S.; formal analysis, S.S.; writing—original draft, S.S., A.N. and J.M.S.G.; project administration, A.N. and G.B.; supervision, G.A. All authors have read and agreed to the published version of the manuscript.

Funding

This research was funded by EIT Urban Mobility, an initiative of the European Institute of Innovation and Technology (EIT), a body of the European Union.

Institutional Review Board Statement

Not applicable.

Informed Consent Statement

Not applicable.

Data Availability Statement

The data presented in this study are available on request from the corresponding author due to the requirement of further approvals from commercial partners (please specify the reason for restriction, e.g., the data are not publicly available due to privacy or ethical restrictions).

Conflicts of Interest

Author Stavros Skarlis was employed by the company E-KINESIS P.C. The remaining authors declare that the research was conducted in the absence of any commercial or financial relationships that could be construed as a potential conflict of interest.

References

  1. Ma, Y.; Ampong, D.K.; Mészáros, F. Access restrictions in urban logistics: A systematic review of policy effectiveness and sustainability. Future Bus. J. 2025, 11, 259. [Google Scholar] [CrossRef] [Scilit]
  2. Bachofner, M.; Lemardelé, C.; Estrada, M.; Pagès, L. City logistics: Challenges and opportunities for technology providers. J. Urban Mobil. 2022, 2, 100020. [Google Scholar] [CrossRef] [Scilit]
  3. Gonzalez, J.N.; Garrido, L.; Vassallo, J.M. Exploring stakeholders’ perspectives to improve the sustainability of last mile logistics for e-commerce in urban areas. Res. Transp. Bus. Manag. 2023, 49, 101005. [Google Scholar] [CrossRef] [Scilit]
  4. Shramenko, N.; Hupfer, C.; Shramenko, V. Cargo Bikes for Sustainable City Logistics Systems: Optimizing Distribution Routes in a Dynamic Environment. In Central European Conference on Logistics; Springer Nature: Cham, Switzerland, 2024; pp. 58–71. Available online: https://link.springer.com/chapter/10.1007/978-3-031-70977-7_4 (accessed on 20 June 2026).
  5. Klatte, M.; Kuhnimhof, T. Improving urban delivery with extended cargo bikes: A simulation-based study on the impact of double-parking on urban traffic flow. Eur. Transp. Res. Rev. 2025, 17, 19. [Google Scholar] [CrossRef] [Scilit]
  6. Shramenko, N.; Hupfer, C.; Shramenko, V.; Trojanowski, P. Electric Cargo Bikes in Urban Logistics: Scenarios and Their Contribution to Sustainable Mobility. In EAI International Conference on Management of Manufacturing Systems; Springer Nature: Cham, Switzerland, 2024; pp. 3–17. Available online: https://link.springer.com/chapter/10.1007/978-3-031-80881-4_1 (accessed on 20 June 2026).
  7. Ljubotina, L.; Ševrović, M.; Pirdavani, A.; Jovanović, B. Evaluating Cargo Bike Delivery Applications in Urban Logistics: The Case of Zagreb. Transp. Res. Procedia 2025, 91, 235–242. [Google Scholar] [CrossRef] [Scilit]
  8. Melnik, D.; Heckert, F.; Bürger, I.; Mitzel, J.; Knöri, T. Fuel Cell Cargo Pedelec with Fast-start Capabilities. In 2024 Third International Conference on Sustainable Mobility Applications, Renewables and Technology (SMART); IEEE: Piscataway, NJ, USA, 2024; pp. 1–5. [Google Scholar] [CrossRef] [Scilit]
  9. Capkin, S.O.K. Hydrogen cargo bikes as a data-driven solution for last-mile decarbonization. Transp. Res. Part D Transp. Environ. 2025, 149, 105046. [Google Scholar] [CrossRef] [Scilit]
  10. Damer, L.; Weiss, D.; Gruber, J. Barriers to Fuel Cell Cargo Bike Adoption in Urban Logistics: A Multi-Level Transition Analysis. Front. Sustain. Cities 2026, 7, 1701390. [Google Scholar] [CrossRef] [Scilit]
  11. Abouelrous, A.; Bliek, L.; Zhang, Y. Digital twin applications in urban logistics: An overview. Urban Plan. Transp. Res. 2023, 11, 2216768. [Google Scholar] [CrossRef] [Scilit]
  12. Papaioannou, E.; Iliopoulou, C.; Kepaptsoglou, K. Last-mile logistics network design under e-cargo bikes. Future Transp. 2023, 3, 403–416. [Google Scholar] [CrossRef] [Scilit]
  13. Galkin, A.; Samchuk, G.; Kopytkov, D.; Thompson, R.G. Digital twins in logistics: A comprehensive bibliometric analysis for advancing smart cities and sustainable development. Discov. Sustain. 2025, 6, 853. [Google Scholar] [CrossRef] [Scilit]
  14. Modesti, D.M. Design and Modeling of a Fuel Cell Hybrid eCargo Bike Prototype. Ph.D. Thesis, Politecnico di Torino, Torino, Italy, 2022. [Google Scholar]
  15. Di Gennaro, S. Modelling and Experimental Analysis of a Thermal Management System for a Hydrogen Cargo-Bike. Ph.D. Thesis, Politecnico di Torino, Torino, Italy, 2023. [Google Scholar]
  16. Hieu, L.T.; Lim, O.T. Deep learning application in fuel cell electric bicycle to optimize bicycle performance and energy consumption under the effect of key input parameters. Appl. Energy 2024, 369, 123588. [Google Scholar] [CrossRef] [Scilit]
  17. Isaac, N.; Saha, A.K. A review of the optimization strategies and methods used to locate hydrogen fuel refueling stations. Energies 2023, 16, 2171. [Google Scholar] [CrossRef] [Scilit]
  18. Chen, G.; Su, S.; Xu, Q.; Lv, H.; Zhao, Y.; Xia, L.; Zhang, G.; Hu, K. Optimization of hydrogen refueling strategy: Based on energy consumption and refueling demand. Int. J. Hydrogen Energy 2024, 71, 625–636. [Google Scholar] [CrossRef] [Scilit]
  19. Kang, J.E.; Recker, W. Strategic hydrogen refueling station locations with scheduling and routing considerations of individual vehicles. Transp. Sci. 2015, 49, 767–783. [Google Scholar] [CrossRef] [Scilit]
  20. Wang, D.; Wang, Z.; Han, F.; Zhao, F.; Ji, Y. Location optimization of hydrogen refueling stations in hydrogen expressway based on hydrogen supply chain cost. Front. Artif. Intell. Appl. 2021, 341, 368–374. [Google Scholar] [CrossRef] [Scilit]
  21. Hao, X.; Nishibu, S.; Mei, X.; Li, S.; Du, S.; Gong, F.; Li, Y.; Wang, H.; Manabe, K.; Yang, F. Tank swapping for fuel cell heavy-duty trucks: Economic feasibility analysis. Sustain. Energy Technol. Assess. 2025, 84, 104729. [Google Scholar] [CrossRef] [Scilit]
  22. Skarlis, S.; Molos, T.; Ayfantopoulou, G.; Nikiforiadis, A.; Bakouros, L. Light commercial electric vehicles with hydrogen fuel-cell range extender: Refueling strategy evaluation. Res. Transp. Bus. Manag. 2023, 50, 101040. [Google Scholar] [CrossRef] [Scilit]
  23. Wipke, K.; Cuddy, M.; Burch, S. ADVISOR 2.1: A user-friendly advanced powertrain simulation using a combined backward/forward approach. IEEE Trans. Veh. Technol. 1994, 48, 1751–1761. [Google Scholar] [CrossRef] [Scilit]
  24. Skarlis, S.; Molos, T.; Skarlis, M.; Karvountzis-Kontakiotis, A.; Bernatchez, O.; Pronovost, C. Towards Electrification of Urban Buses Using Model Based Analysis. In SAE Technical Paper; No. 2018-01-0408; SAE International: Warrendale, PA, USA, 2018. [Google Scholar] [CrossRef] [Scilit]
  25. Skarlis, S.; Molos, T. A novel model-based approach for evaluating multi-speed transmission systems for BEVs. In SAE Technical Paper; No. 2023-01-0444; SAE International: Warrendale, PA, USA, 2023. [Google Scholar] [CrossRef] [Scilit]
  26. Skarlis, S.; Nikiforiadis, A.; Kortsari, A.; Grau, J.M.S.; Ayfantopoulou, G. Mathematical modeling using real driving data for decision making in city buses electrification. Case Stud. Transp. Policy 2025, 22, 101633. [Google Scholar] [CrossRef] [Scilit]
  27. Hu, X.; Li, S.; Peng, H. A comparative study of equivalent circuit models for Li-ion batteries. J. Power Sources 2012, 198, 359–367. [Google Scholar] [CrossRef] [Scilit]
  28. Oleksowicz, S.A.; Burnham, K.J.; Southgate, A.; McCoy, C.; Waite, G.; Hardwick, G.; Harrington, C.; McMurran, R. Regenerative braking strategies, vehicle safety and stability control systems: Critical use-case proposals. Veh. Syst. Dyn. 2013, 51, 684–699. [Google Scholar] [CrossRef] [Scilit]
  29. Pakyuz-Charrier, E.; Lindsay, M.; Ogarko, V.; Giraud, J.; Jessell, M. Monte Carlo simulation for uncertainty estimation on structural data in implicit 3-D geological modeling, a guide for disturbance distribution selection and parameterization. Solid Earth 2018, 9, 385. [Google Scholar] [CrossRef] [Scilit]
  30. Zhang, Z.; Zou, Y.; Zhou, T.; Zhang, X.; Xu, Z. Energy Consumption Prediction of Electric Vehicles based on Digital Twin Technology. World Electr. Veh. J. 2021, 12, 160. [Google Scholar] [CrossRef] [Scilit]
  31. Xie, Y.; Li, Y.; Zhao, Z.; Dong, H.; Wang, S.; Liu, J.; Guan, J.; Duan, X. Microsimulation of electric vehicle energy consumption and driving range. Appl. Energy 2020, 267, 115081. [Google Scholar] [CrossRef] [Scilit]
  32. Costa, M.; Del Papa, G. Digital Twins for Intelligent Vehicle-to-Grid Systems: A Multi-Physics EV Model for AI-Based Energy Management. Appl. Sci. 2025, 15, 8214. [Google Scholar] [CrossRef] [Scilit]
  33. Cieslik, W.; Antczak, W. Research of load impact on energy consumption in an electric delivery vehicle based on real driving conditions: Guidance for electrification of light-duty vehicle fleet. Energies 2023, 16, 775. [Google Scholar] [CrossRef] [Scilit]
  34. Varga, B.O.; Sagoian, A.; Mariasiu, F. Prediction of electric vehicle range: A comprehensive review of current issues and challenges. Energies 2019, 12, 946. [Google Scholar] [CrossRef] [Scilit]
  35. Al-Wreikat, Y.; Serrano, C.; Sodre, J. Driving behaviour and trip condition effects on the energy consumption of an electric vehicle under real-world driving. Appl. Energy 2021, 297, 117096. [Google Scholar] [CrossRef] [Scilit]
  36. Miqdady, T.; Benavente, J.; Coloma, J.; Garcia, F. Driving Sustainability: Analyzing eco-driving efficiency across urban and interurban roads with electric and combustion vehicles. World Electr. Veh. J. 2025, 16, 143. [Google Scholar] [CrossRef] [Scilit]
  37. Niu, J.; Li, X.; Tian, Z.; Yang, H. Uncertainty analysis of the electric vehicle potential for a household to enhance robustness in decision on the EV/V2H technologies. Appl. Energy 2024, 365, 123294. [Google Scholar] [CrossRef] [Scilit]
  38. Maity, A.; Sarkar, S. Data-driven probabilistic energy consumption estimation for battery electric vehicles with model uncertainty. Int. J. Green Energy 2023, 21, 1986–2003. [Google Scholar] [CrossRef] [Scilit]
  39. Kuby, M.; Lines, L.; Schultz, R.; Xie, Z.; Kim, J.-G.; Lim, S. Optimization of hydrogen stations in Florida using the flow-refueling location model. Int. J. Hydrogen Energy 2009, 34, 6045–6064. [Google Scholar] [CrossRef] [Scilit]
  40. Jayson, T.; Bakibillah, A.S.M.; Tan, C.P.; Kamal, M.A.S.; Monn, V.; Imura, J.I. Electric vehicle eco-driving strategy at signalized intersections based on optimal energy consumption. J. Environ. Manag. 2024, 368, 122245. [Google Scholar] [CrossRef] [Scilit] [PubMed]
  41. Hamednia, A.; Murgovski, N.; Fredriksson, J.; Forsman, J.; Pourabdollah, M.; Larsson, V. Optimal thermal management, charging, and eco-driving of battery electric vehicles. IEEE Trans. Veh. Technol. 2023, 72, 7265–7278. [Google Scholar] [CrossRef] [Scilit]
  42. Tu, R.; Xu, J.; Li, T.; Chen, H. Effective and acceptable eco-driving guidance for human-driving vehicles: A review. Int. J. Environ. Res. Public Health 2022, 19, 7310. [Google Scholar] [CrossRef] [Scilit] [PubMed]
  43. Stephens, R. A review of gamified approaches to encouraging eco-driving. Front. Psychol. 2022, 13, 970851. [Google Scholar] [CrossRef] [Scilit] [PubMed]
  44. Thibault, L.; De Nunzio, G.; Sciarretta, A. A unified approach for electric vehicles range maximization via eco-routing, eco-driving, and energy consumption prediction. IEEE Trans. Intell. Veh. 2018, 3, 463–475. [Google Scholar] [CrossRef] [Scilit]
  45. Xie, D.; Guo, J.; Jiang, Y.; Hou, Z.; Deng, J. Energy-efficient route and velocity planning for electric vehicles: A hierarchical eco-driving framework integrating traffic and road information. IEEE Open J. Veh. Technol. 2025, 6, 1317–1332. [Google Scholar] [CrossRef] [Scilit]
  46. Talebi, P.; Singh, H.; Shehzad, M.F.; Layzell, D.; Khan, M.A. Strategic deployment of hydrogen fuel cell buses and fueling stations: Insights from fleet transition models. Int. J. Hydrogen Energy 2025, 138, 1201–1212. [Google Scholar] [CrossRef] [Scilit]
  47. Maurer, W.; Justl, M.; Keuschnigg, R. Improving hydrogen refueling stations to achieve minimum refueling costs for small bus fleets. Int. J. Hydrogen Energy 2023, 48, 29821–29834. [Google Scholar] [CrossRef] [Scilit]
Figure 1. Illustration of the methodological framework for analyzing the energy consumption, hydrogen refueling strategy definition, and H2 refueling station design for hydrogen-powered cargo bikes.
Futuretransp 06 00163 g001
Figure 2. Recorded speed profile corresponding to the “Route 1” driving cycle.
Futuretransp 06 00163 g002
Figure 3. Archimedes (e-Kinesis) electric vehicle model configuration.
Futuretransp 06 00163 g003
Figure 4. Simulated average energy consumption of the studied e-cargo bike under 4 real driving cycles. The vehicle’s mass was assumed to be equal to 380 kg.
Futuretransp 06 00163 g004
Figure 5. Regression analysis between the studied vehicle’s average energy consumption and the mean driving speed.
Futuretransp 06 00163 g005
Figure 6. Regression analysis between the studied vehicle’s average energy consumption and its maximum acceleration.
Futuretransp 06 00163 g006
Figure 7. Simulated average energy consumption of the studied cargo bike as a function of the vehicle’s cargo mass.
Futuretransp 06 00163 g007
Figure 8. Variation in the studied cargo bike’s energy consumption as a function of the driving style.
Futuretransp 06 00163 g008
Figure 9. Probabilistic analysis of the studied e-cargo bike’s energy consumption based on Monte Carlo–Archimedes co-simulation. Results correspond to the most probable energy consumption level simulated for each driving cycle.
Futuretransp 06 00163 g009
Figure 10. Calculated refueling sessions corresponding to the (A) base, (B) low, and (C) high energy consumption scenarios. Results are presented as a function of the average daily mileage and the fleet size.
Futuretransp 06 00163 g010
Figure 11. Number of H2 dispenser stations under a (A) base, (B) low, and (C) high energy consumption scenarios.
Futuretransp 06 00163 g011aFuturetransp 06 00163 g011b
Table 1. Compilation of the collected real driving data.
Driving CycleMileage
[km]
Average Speed
[km/h]
Average|Max. Acceleration
[m/s2]
Average Road Grade
[°]
Route 11.6412.220.25|1.250.017
Route 21.615.120.20|0.920.019
Route 31.4316.60.25|1.17−0.016
Route 42.4613.990.3|1.480.0052
Table 2. Technical specifications of the studied cargo bike.
Vehicle frontal area [m2]1.65
Vehicle mass 1 [kg]110
Cargo mass [kg]80–250
Drag force coefficient [-]0.8
Wheel rolling radius [m]0.263
Coefficient of rolling resistance [kg/kg]0.01
Velocity-dependent resistance [s/m]0.68 × 10−4
Gear ratio [-]1:2.5
Max. motor torque output [Nm]90
Max. motor power output [W]250
Nominal operation voltage [V]36
Max. open-circuit voltage [V]36
H2 tank capacity [Nl]2040
Tank pressure [bar]300
1 Including the H2 fuel cell and the cargo box.
Table 3. Variation ranges of the cargo bike’s operational parameters, which were studied in the framework of the sensitivity analyses.
Parameter StudiedRange of Parameter
Cargo mass80 kg (average driver’s mass)–250 kg (max. allowable mass)
Driving styleEco driving, neutral driving, and aggressive driving
Driving speed profileThe driving cycles presented in Table 1 were considered
Table 4. Effects of the road grade on the studied e-cargo bike’s energy consumption.
RouteSimulated energy Consumption Using the Measured Road Grade
[Wh/km]
Simulate Energy Consumption by Assuming Road Grade Equal to Zero
[Wh/km]
Route 118.3518.23
Route 218.5318.46
Route 314.6114.63
Route 420.9220.9
Table 5. Cases of average daily mileage and fleet sizes considered to define the H2 refueling strategy.
Average daily mileage [km]10, 20, 30, 40, 50
Number of weekly trips per vehicle5
Fleet size [number of vehicles]10, 20, 30
Table 6. Energy consumption scenarios considered to define the H2 refueling strategy.
Energy Consumption ScenarioAverage Vehicle Energy Consumption
[Wh/km]
Base18.5
Low14.57
High21.17
Disclaimer/Publisher’s Note: The statements, opinions and data contained in all publications are solely those of the individual author(s) and contributor(s) and not of MDPI and/or the editor(s). MDPI and/or the editor(s) disclaim responsibility for any injury to people or property resulting from any ideas, methods, instructions or products referred to in the content.