


Abstract
Electric scooters (e-scooters) have rapidly integrated into university transportation networks; however, there is limited empirical understanding of users’ and non-users’ perceptions, which is essential for developing effective and inclusive policies. This study addresses this gap by analyzing the differential perceptions of e-scooter adoption, safety, and policy preferences at Louisiana State University (LSU). A quantitative, cross-sectional survey was administered to 1036 respondents (592 users and 444 non-users). Statistical analyses, including Chi-square tests and Binary Logistic Regression, were used to identify key perceptual differences and behavioral predictors of e-scooter usage. Results show that users were predominantly male undergraduates, with speed (90%) and convenience (61%) as the primary motivators. Users were over 12 times more likely to perceive e-scooters as safer than walking. In contrast, non-users cited frequent scooter misplacement (84%) as their top barrier to adoption. Logistic regression confirmed that concern about misplacement (Odds Ratio = 0.076) and support for restrictive policies were strong negative predictors of use, while belief in safety and low cost were positive predictors. These findings may help inform campus micromobility policy discussions. The strong negative perceptions associated with scooter misplacement suggest that designated parking hubs and geofencing strategies could help improve campus operations and pedestrian accessibility. In addition, because safety perception was identified as an important predictor of e-scooter use, targeted safety awareness and educational initiatives may help improve rider behavior and address perceived operational safety concerns. This strategy ensures a balance between user adoption incentives and the safety/accessibility needs of the entire university community.
Keywords:
E-scooters; micromobility; campus; risk perception; policy; adoption; statistical analysis 1. Introduction
Electric scooters (e-scooters) are a popular way to travel short distances. They are small, lightweight vehicles driven by electric motors. Users can rent them through smartphone apps and ride them without requiring a fixed docking station. This makes them an adaptable and economical solution, particularly in congested areas. In recent years, e-scooters have become popular in cities worldwide. They allow students to move between destinations swiftly, alleviate traffic congestion, and save travel time. E-scooters are also less expensive than other modes of transportation, which appeals to students on limited finances [1].Many universities are promoting sustainable transportation initiatives, and e-scooters contribute to these goals by providing a low-emission micromobility option that can reduce dependence on private automobiles and help mitigate environmental impacts [2].Their popularity has increased rapidly, particularly among younger populations and university students who are generally more receptive to new transportation technologies. Students often perceive e-scooters as convenient, enjoyable, and time-saving for traveling across large university campuses [3].
Despite their growing popularity, e-scooters pose several operational and safety challenges. Improper parking, obstruction of pedestrian pathways, and unsafe riding behaviors have raised public concerns about their integration into urban environments [4]. Safety remains a key issue, not only for riders but also for pedestrians [5]. Additionally, barriers such as limited accessibility, unfamiliarity with usage, and perceived inconvenience contribute to lower adoption rates among certain populations. These issues underscore the need for more effective management and regulatory strategies [4,6]. While existing research predominantly emphasizes the experience and behavior of e-scooter users, there is a noticeable gap in understanding the perspectives of non-users. Gaining insights from both groups is essential to identifying factors that hinder adoption and to inform strategies to enhance safety, usability, and equitable access. Comparing user and non-user perceptions can reveal distinct needs and expectations, offering valuable input for developing more inclusive and effective e-scooter programs [4,6].
Louisiana State University (LSU) provides an ideal environment for investigating e-scooter use in a university setting. The campus is geographically expansive, requiring students to travel efficiently between buildings, and the institution actively promotes sustainability and innovation. The recent introduction of shared e-scooter services on campus offers a timely opportunity to examine how students are adapting to this emerging mode of transportation. This study contributes to a broader understanding of e-scooter integration in higher education contexts by assessing usage patterns and user perceptions during the early stages of implementation [7].
While prior research has primarily focused on e-scooter user behaviors, such as trip frequency, travel distance, and demographic profiles, few studies have directly compared the perspectives of users and non-users. Such comparisons are critical, as individuals may choose alternative modes of transportation (e.g., walking or bicycling) for various reasons, including safety concerns, physical discomfort, or personal preference. By examining the differences between these groups, researchers can pinpoint barriers to adoption and evaluate the inclusivity and effectiveness of micromobility programs [8,9].
In recent years, micromobility adoption has expanded rapidly across U.S. cities and campuses. According to NACTO’s shared micromobility reports, shared e-scooter trips increased from approximately 38.5 million in 2018 to 69 million in 2023 in the United States and Canada, reflecting substantial growth in micromobility adoption over recent years [10]. Many universities have integrated these services to reduce congestion and promote sustainability. However, injury data reveal growing safety concerns. Studies report that e-scooter-related injuries have increased sharply, particularly in dense pedestrian areas such as campuses [9,11]. This trend of accelerating adoption alongside elevated injury risk creates an urgent need to understand perceptions, barriers, and policy preferences among both users and non-users within campus environments.
This study employs a range of statistical methods to compare e-scooter users and non-users using survey data collected from the LSU community. Analytical methods include descriptive statistics, independent samples t-tests, chi-square tests, and binary logistic regression. The analysis evaluated factors such as perceived safety, satisfaction, convenience, environmental impact, and comparative comfort between e-scooters and bicycles. These methods allow for the identification of statistically significant differences between the two groups and highlight key demographic and behavioral predictors (e.g., age, gender, and travel habits) associated with e-scooter use.
This study addresses a notable gap in micromobility literature by incorporating the perspectives of both users and non-users. Through robust statistical analysis, it provides insight into e-scooter adoption and offers evidence-based recommendations to support the development of safe, effective, and inclusive micromobility programs in university environments. The remainder of this paper is organized as follows. Section 2 presents the background and literature review on e-scooter usage, safety, and policy issues. Section 3 describes the study methodology, survey design, and statistical analysis procedures. Section 4 presents the results and discussion. Section 5 summarizes the study conclusions. Finally, Section 6 describes the study limitations and future research directions.
Study Objectives
The objectives of this study were as follows:
- Analyze the perspectives of e-scooter users versus non-users with respect to factors such as speed, convenience, cost, environmental impact, safety, and social attractiveness, employing chi-square tests and binary logistic regression.
- Assess the comfort and satisfaction levels of e-scooter users via descriptive statistical analysis, emphasizing usage experiences and attitudes regarding the service.
- Assess comparative perceptions of safety, comfort, and transportation preferences associated with e-scooter use among users and non-users.
2. Background
Table 1 summarizes key studies examining e-scooter use across various urban contexts and geographic settings [11]. These studies examined various aspects of e-scooter systems, including user behavior, parking practices, land-use correlations, and travel patterns.
Table 1.
Overview of Research on E-scooters’ Use.
As shown in Table 1, Smith and Schwieterman [12] found that e-scooters have the potential to replace private vehicles for short trips in densely urban environments, such as Chicago. Building on this, Heineke et al. [13] concluded that e-scooters are particularly suitable for short-distance commuting in cities like Munich. McKenzie [14] and Jiao and Bai [15] examined how and when people use e-scooters, finding that trips are highly concentrated in downtown areas and university campuses. James et al. [16] highlighted several operational challenges, particularly improper parking that blocks sidewalks and poses hazards to pedestrians. Caspi et al. [17] noted that adoption rates are often higher in low-income and student-heavy neighborhoods, suggesting that e-scooters could help promote transportation equity. Chang et al. [18] also provided valuable insights into usage behavior in shared micromobility systems. Finally, Lazarus et al. [19] assessed the broader impact of dockless e-scooter services, emphasizing their growing role in the expanding ecosystem of shared urban mobility.
Collectively, these studies underscore the dual nature of e-scooter systems: they offer substantial benefits in accessibility and travel efficiency, but they also introduce operational and regulatory challenges. The findings underscore the need for context-sensitive policies that account for the unique spatial, social, and behavioral characteristics of local user populations, thereby ensuring the effective and sustainable integration of e-scooters into urban transportation networks.
2.1. Global Scope and Helmet Use
Research on e-scooter usage spans 23 countries, with the highest usage in the United States (33.3%), followed by Germany (12%), the United Kingdom (6%), and Australia (5.3%), highlighting the platform’s global relevance [20]. Helmet use rates vary significantly by region and ride type. In Australia, 94.3% of private e-scooter users wear helmets, compared with 66.8% of shared-e-scooter riders, indicating a disparity in adherence to safety practices [21]. A study in Western Australia found that only 43% of injured riders wore helmets during crashes, highlighting persistent vulnerabilities in injury prevention [20].
Male riders are consistently overrepresented in crash statistics, likely because they are the predominant user group [21]. Shared-ride users often exhibit behaviors that raise safety concerns, particularly regarding interactions with pedestrians, path selection, and riding speed in mixed-traffic environments [22]. These findings highlight the need for targeted policy measures, including mandatory helmet use, safety education, and infrastructure improvements tailored to user groups.
2.2. Environmental Sustainability and Adoption Motivations
E-scooters are often promoted as environmentally sustainable transportation alternatives [25]. Life cycle assessments (LCAs) estimate emissions of approximately 202 g CO2-equivalent per passenger-mile for shared dockless e-scooters, with roughly 50% attributed to manufacturing and 43% to logistics activities such as charging and redistribution [23]. Even under optimized conditions, such as improved collection efficiency and lifespans of up to 2 years, emissions decrease only to 141 g CO2-eq, underscoring the considerable environmental impact relative to traditional modes of transportation. These emissions matter because CO2 is a major contributor to global warming and climate change. To understand the environmental trade-offs, it is essential to compare e-scooters with other common modes of transportation. For example, urban diesel buses emit approximately 82 g CO2-eq per passenger-mile. Private vehicles generate about 414 g CO2-eq per passenger-mile, nearly double that of e-scooters. This suggests that e-scooters are substantially cleaner than cars. This nuanced comparison underscores the importance of targeted policy and planning to ensure e-scooters genuinely contribute to climate goals [23].
Motivations for e-scooter adoption vary among populations. Seventy percent of urban residents in the United States view e-scooters favorably [8]. While 51.8% report using them for recreational purposes, only 30.4% use them for first- or last-mile connectivity to public transit, revealing a stronger recreational usage trend than commuting-oriented travel [8]. Additional research indicates that e-scooter users tend to be younger than e-bike users, reflecting a distinct demographic profile in adoption patterns [8].
2.3. E-Scooters as Last-Mile and Intermodal Transportation
Recent studies have examined e-scooters as first-mile and last-mile transportation solutions within multimodal travel systems. Nikiforiadis et al. [3] investigated university students’ potential for trip-chaining behavior, particularly in combination with public transportation and private cars [3]. Their findings highlighted that while there is currently limited interest in such intermodal trips, e-scooters could improve connectivity and reduce private vehicle dependence if they offer significant travel time savings. Wincent et al. [26] characterized shared e-scooters as a ‘last-minute’ mode of transportation used primarily in hurried situations [26]. They found that these trips often serve as a ‘last-mile’ solution, improving accessibility by bridging gaps between public transit and final destinations, particularly when users risk arriving late. Huang et al. [27] further reported that shared e-scooters can enhance first-mile and last-mile transit accessibility in metropolitan areas such as Los Angeles and Washington, D.C. [27]. These findings demonstrate the increasing role of e-scooters in integrated transportation systems and suggest that university campuses may particularly benefit from improved coordination between micromobility services, pedestrian infrastructure, and public transit operations.
2.4. Travel Patterns, Infrastructure, and Rider Comfort
Only 15% of daily e-scooter trips last more than an hour, suggesting they are used for short urban errands or commuting [9]. In a study of 30 European cities, median trip distances ranged from 0.91 to 1.79 km, with durations of 5.67 to 13.77 min, exhibiting right-skewed distributions indicating occasional longer rides but predominantly short excursions [24]. These statistics align with broader global patterns, suggesting consistent travel characteristics across various contexts.
The quality of infrastructure significantly impacts user safety and comfort. Forty-four percent of injuries occurred on sidewalks, indicating that conflict zones and inadequate riding surfaces pose significant safety risks [9]. Their investigation, using mobile vibration sensors and LiDAR mapping, revealed that concrete pavements generated higher vibration levels than asphalt pavements, potentially causing discomfort and increasing the risk of control loss, particularly at higher speeds. These findings underscore the need for surface-specific guidelines that account for micromobility vehicles in urban infrastructure planning.
2.5. Social Behavior and Interaction in Public Spaces
E-scooter riding involves both transportation functions and complex social interactions within public spaces. Another study employed ethnomethodological methods, including video observations and qualitative interviews, to examine how riders navigate complex urban environments. E-scooter users frequently adjust their riding behavior, including changes in speed and movement patterns, to navigate congested pedestrian environments and shared urban spaces. These behaviors illustrate implicit spatial negotiation, in which riders respond contextually rather than strictly adhere to formal traffic rules [28]. The study further highlighted the challenges of integrating e-scooters into mixed pedestrian–vehicle environments, underscoring the need for urban policies and infrastructure that better accommodate emerging micromobility modes.
2.6. Public Health Risks and Injury Patterns
A Norwegian study conducted in Oslo reported an incidence rate of 120 per 100,000 among e-scooter riders, compared with 340 per 100,000 among bicyclists [29]. This comprehensive study, spanning from 1 January 2019 to 31 March 2020, analyzed 3191 users and included data on demographics, intoxication status, helmet use, injury location, and severity, enabling robust cross-modal comparisons [29]. Although e-scooters appear less hazardous per capita, the findings caution that risk levels vary with rider behavior and infrastructure conditions.
Public health surveillance has identified concerning trends. NEISS-based cross-sectional research in the United States reported an increase in injury rates from 1.53 to 9.22 per 100,000 individuals between 2014 and 2019, with individuals aged 15 to 39 at the highest risk [30]. Emergency department data indicate that pedestrians account for 8.4% of e-scooter-related injuries, underscoring the need to mitigate risks in shared spaces [31].
One study documented the growing public health impact, noting increased strain on local healthcare systems alongside rising e-scooter usage [32]. Retrospective trauma center data revealed an increase in monthly injuries from 26.9 to 152.6 over a 34-month period following the introduction of shared services. These findings were derived from electronic medical records, with limitations due to potential documentation errors [33]. Nevertheless, the upward trend highlights the potential burden of adopting micromobility.
2.7. Operational Behavior, Parking, and Modal Replacement
Parking practices and modal substitution represent key aspects of e-scooter usage behavior. In Rosslyn, VA, observational data showed that 16% of dockless scooters were improperly parked, including 6% that obstructed pedestrian pathways, highlighting spatial management issues in mixed-use urban settings. Survey responses from 181 participants, including both users and non-users, expressed concerns regarding safety and blocked walkways, supporting the implementation of designated parking zones and enforcement measures [16].
Large-scale data from 30 European cities confirmed prevalent short-distance usage, while also capturing longer trips of up to 13.77 min or 1.79 km [24]. Previous studies reviewed by Bozzi and Aguilera [34] indicated that peak e-scooter usage was observed in the afternoon for both recreational and commuting purposes [34]. In Tampa, econometric analysis identified gender, helmet use, and trip purpose as significant predictors of e-scooter usage and automobile substitution [35]. Although some car trips were displaced, many e-scooter trips substituted for walking or public transit.
A national study in Germany found that only 11% of shared e-scooter trips substituted automobile travel, with most riders shifting from walking or transit modes [36]. These findings challenge the environmental benefit argument and emphasize the need to consider modal displacement effects, as replacing already sustainable modes may reduce net sustainability gains.
At Virginia Tech, researchers employed recursive logit modeling and GPS tracking to analyze user behavior on campus. They found that 45% of participants used e-scooters weekly, with 29% for academic commuting and 20% for recreational use [37]. Riders demonstrated a preference for bikeways and multi-use paths, even when these routes were longer, underscoring the demand for safe, dedicated infrastructure.
2.8. Environmental and Technical Performance of E-Scooters
Life cycle assessments (LCAs) were used to assess the environmental impacts of e-scooters. A study in Brussels reported that shared e-scooters have an average daily usage of 6.39 km and emit approximately 131 g CO2-eq per passenger-km, emphasizing short e-scooter lifespans as a key environmental concern [38]. Enhancing durability and optimizing logistics are essential for achieving greater greenhouse gas (GHG) mitigation.
Performance simulations conducted in MATLAB Simulink have explored technical strategies to enhance efficiency. One study identified scooter mass, rider weight, wind resistance, wheel radius, and road slope as significant factors influencing energy consumption. Optimizing these variables, alongside advancements in battery and propulsion systems, can substantially improve range and rider performance [39]. Experimental validation supported these findings and contributed to improved electric scooter design.
Paris market data showed €110 million in e-scooter sales in 2018, representing a 76% increase in monetary value and a 129% rise in unit sales compared to 2017. Additionally, a survey of 459 e-scooter users found that 72% had shifted from walking or public transportation, highlighting substantial modal substitution effects associated with e-scooter adoption [40].
A comprehensive review of 47 peer-reviewed and 23 gray literature sources from the United States and Europe revealed consumption patterns, safety issues, user behavior, and regulatory challenges [34]. This research identified a critical need for standardized reporting, consistent impact assessments, and evidence-based policy frameworks to support the sustainable integration of e-scooters.
2.9. Research Gap and Study Contributions
Despite the growing integration of shared e-scooters into university transportation networks, there remains a limited empirical understanding of how users and non-users perceive the safety, benefits, and policy implications of e-scooters within campus environments. National studies have reported a sharp rise in e-scooter-related injuries and emergency department visits [12,23], yet little is known about how such safety concerns translate to perceptions and behavioral choices in campus settings, where pedestrian density, infrastructure design, and regulatory control differ markedly from urban streets. Moreover, universities across the United States are actively exploring adopting micromobility to reduce vehicle dependency and promote sustainable travel; however, evidence-based guidance for campus policy remains scarce.
This study addresses these gaps through a comprehensive comparative analysis of e-scooter users and non-users at LSU. Previous LSU-based research by Chowdhury et al. [41] primarily focused on user readiness, trip characteristics, experiential intention, and adoption-related behavioral factors associated with the implementation of shared e-scooters on campus. In contrast, the present study expands the analysis by incorporating both users and non-users to comparatively evaluate safety perceptions, operational concerns, policy preferences, and adoption barriers within the same campus environment. Unlike many previous campus-focused e-scooter studies that primarily examined user behavior, ridership frequency, operational trends, or injury statistics independently, the present study simultaneously evaluates both user and non-user perspectives within the same university environment using comparative statistical and predictive modeling approaches. In addition to descriptive comparisons, this study uses chi-square tests, independent-samples t-tests, and binary logistic regression to identify independent perceptual and behavioral predictors of e-scooter adoption. The inclusion of non-user perspectives provides additional insight into barriers to adoption, perceived operational challenges, and campus policy preferences that are often underrepresented in existing micromobility literature.
This study contributes to the state of knowledge in three key ways:
- Empirical differentiation by quantifying demographic, perceptual, and behavioral differences between users and non-users on a large campus sample.
- Predictive modeling by applying binary logistic regression to identify independent predictors of e-scooter usage, controlling for demographic factors and perception variables.
- Policy relevance by translating the findings into actionable recommendations for campus planners and administrators regarding safety interventions, parking management, and awareness campaigns.
Together, these contributions provide timely insights for universities seeking to strike a balance between the convenience and sustainability of micromobility and the safety and accessibility of their campuses.
3. Methodology
3.1. Study Context
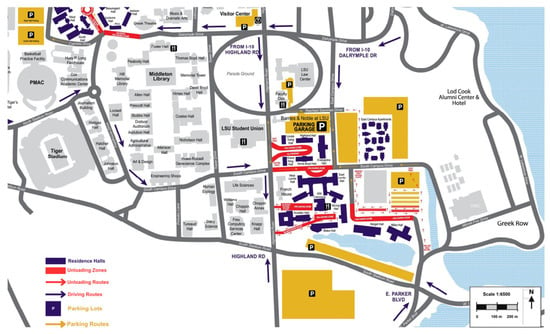
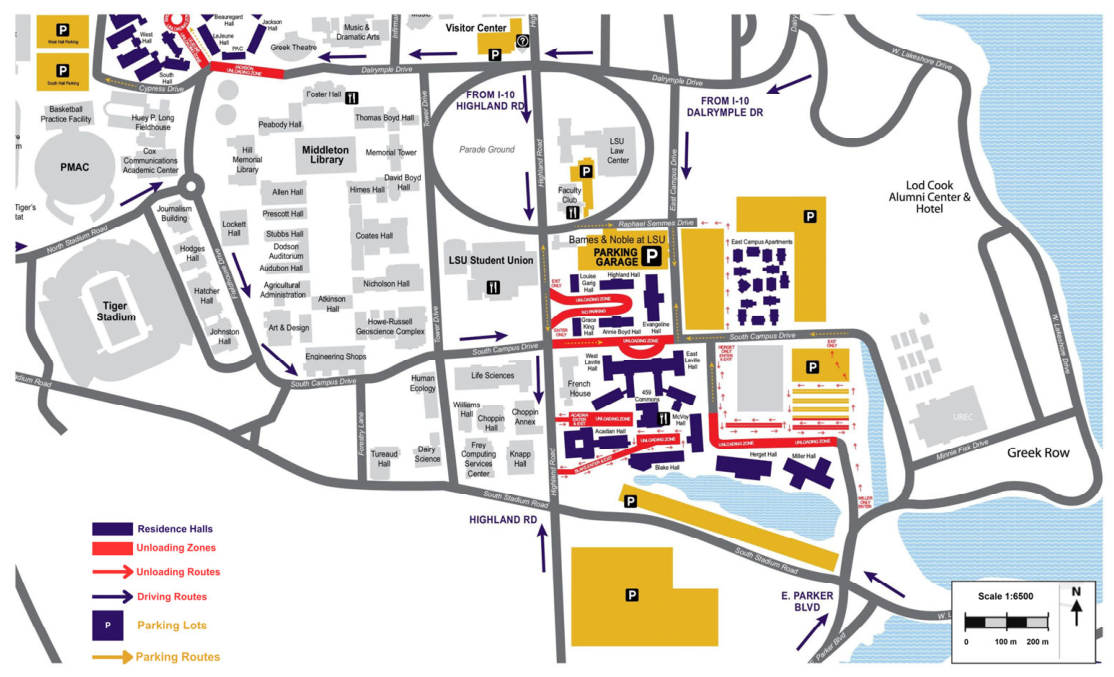
Figure 1 illustrates the LSU campus transportation environment, including major shuttle routes, campus circulation patterns, and key mobility corridors relevant to e-scooter operations. The campus is divided into dispersed academic, residential, and activity zones, creating substantial demand for short-distance micromobility trips.
Figure 1.
Louisiana State University (LSU) campus map [42].
As shown in Figure 1, this study employed a quantitative, cross-sectional survey design to assess perceptions, experiences, and behavioral patterns associated with e-scooter use on the LSU campus. The objective was to identify key differences between users and non-users, and to examine the factors influencing their satisfaction, perceived safety, and support for e-scooter policies.
3.2. Survey Design and Participants
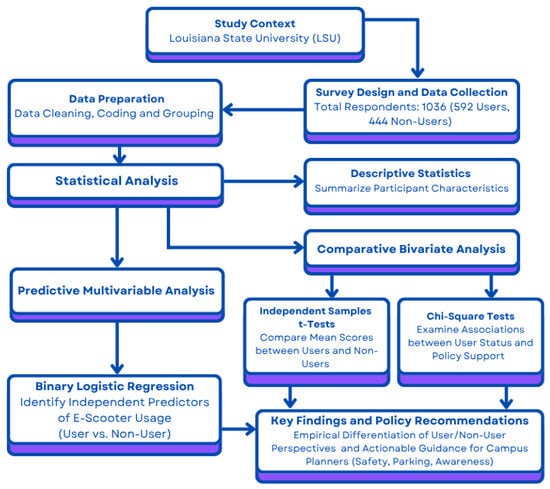
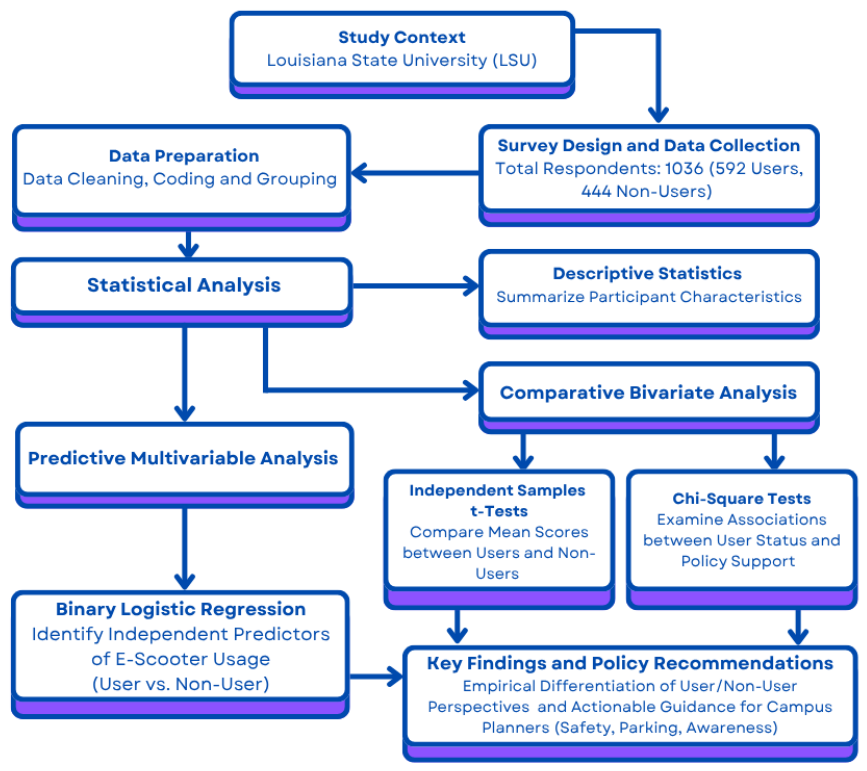
Two structured questionnaires were developed to evaluate the study's framework (Figure 2): one targeting e-scooter users and the other for non-users. Both instruments included multiple-choice, Likert-scale, and short-answer items. Survey topics addressed travel behavior, perceptions of safety, comfort, convenience, environmental impact, and transportation mode preferences. Participants were also asked to evaluate potential university policies regarding e-scooter use. The questionnaires were distributed electronically through university communication channels, student networks, email distribution, and online platforms between March and May 2025, with participation being voluntary and responses kept confidential. Participation was limited to individuals affiliated with Louisiana State University (LSU), including undergraduate students, graduate students, faculty, and staff. Screening questions were included to ensure participants received the appropriate survey version based on their prior e-scooter usage status. Individuals who reported prior e-scooter use completed the user questionnaire, while those without prior experience completed the non-user questionnaire. Example survey items included perceptions related to safety, convenience, cost, comfort, environmental impact, scooter misplacement, accident concerns, and campus policy preferences regarding e-scooter operations. Because the survey was distributed online and participation was voluntary, the study may be subject to self-selection bias. Individuals with strong positive or negative opinions regarding e-scooters may have been more likely to participate, while some groups with lower digital engagement or limited interest in micromobility may have been underrepresented. In addition, nonresponse bias may have affected the sample’s demographic composition. However, anonymous participation and the relatively large sample size helped improve response diversity and reduce response pressure. Therefore, the findings should be interpreted with these potential sampling limitations in mind. Participation was anonymous, and no identifiable personal information was collected. This study was reviewed and approved on 13 April 2023 by the Institutional Review Board (IRB) at Louisiana State University under protocol number IRBAM-23-0030.
Figure 2.
Methodology Flow Chart.
The target sample size was estimated using Cochran’s sample size formulation for large populations [43]:
where represents the standard normal deviate at a 95% confidence level (1.96), is the estimated proportion of the population possessing the attribute of interest (0.5), = 1 − , and is the acceptable margin of error (0.05). Based on this calculation, the minimum recommended sample size was approximately 385 respondents. The final dataset included 1036 valid responses, substantially exceeding the minimum recommended sample size and improving the statistical reliability of the analysis.
Survey Validity and Reliability
Prior to survey distribution, the questionnaire was reviewed by faculty researchers with experience in transportation and survey-based studies to improve question clarity, structure, and relevance. Minor revisions were implemented following preliminary review to reduce ambiguity and improve readability. In addition, reliability assessment was conducted for grouped Likert-scale perception items, with conceptually related constructs, which were evaluated for internal consistency reliability using Cronbach’s alpha. The primary construct evaluated was a positive perception construct consisting of eight items related to convenience, environmental benefits, travel efficiency, and usability, which demonstrated acceptable internal consistency (Cronbach’s alpha = 0.751). Negatively framed items and single-item policy preference questions were not grouped into composite scales and were therefore analyzed individually rather than assessed for internal consistency. These results indicate acceptable measurement consistency for the grouped perception construct included in the analysis.
3.3. Research Hypotheses
Guided by prior literature and the objectives of this study, the following hypotheses were formulated:
H1.
E-scooter users perceive e-scooters as safer than non-users.
H2.
E-scooter users place greater importance on convenience and travel time compared with non-users.
H3.
Non-users will express stronger concern about improper parking, pedestrian safety, and rule violations than users.
H4.
Non-users are more supportive of restrictive policies (e.g., mandatory helmet use, designated parking zones), whereas users are more supportive of expansion-oriented policies (e.g., increasing scooter availability).
H5.
Positive perceptions of safety, affordability, and convenience are significant predictors of e-scooter usage in the logistic regression model.
These hypotheses guided the analytical design, interpretation, and subsequent discussion of results.
3.4. Data Collection and Preparation
Survey responses were collected through an online platform. The raw data were exported to Microsoft Excel for preliminary cleaning, during which incomplete or inconsistent entries were removed. Categorical responses were coded into numerical values to enable statistical analysis. The cleaned dataset was subsequently imported into IBM SPSS Statistics for Windows, Version 27.0 (IBM Corp., Armonk, NY, USA) for advanced analysis. Participants were categorized as users or non-users based on their responses to questions about e-scooter usage. Categorical variables were analyzed using chi-square tests, while continuous variables and rating scale responses were analyzed using t-tests and logistic regression.
3.5. Analytical Methods
3.5.1. Descriptive Statistics
Descriptive statistics were used to summarize participants’ general characteristics, including age, gender, academic level, and travel frequency. The analysis also assessed levels of satisfaction, comfort, and perceptions related to e-scooter use. Results were reported as frequencies and percentages.
3.5.2. Independent Samples t-Tests
Independent-samples t-tests were conducted to compare mean scores between users and non-users, including variables such as safety perceptions and the frequency of accidents. Levene’s test for equality of variances was performed for each comparison. When variance inequality was detected, adjusted values were reported using Welch’s correction. A 95% Confidence Interval (CI) for the difference in means was calculated and reported alongside the test statistic.
3.5.3. Chi-Square Tests
Chi-square tests were conducted to evaluate differences in perceptions, preferences, safety concerns, and policy suggestions between users and non-users. Eight key items were selected to evaluate whether user status was associated with differing viewpoints. The Chi-square test was used to determine the statistical significance of these associations. Phi coefficients and Cramér’s V were reported to measure the strength of association, and odds ratios with corresponding 95% confidence intervals were calculated, where applicable, to assess the likelihood and precision of agreement between groups. Because multiple chi-square comparisons were conducted, the potential for inflated Type I error was evaluated using a Bonferroni-adjusted significance threshold. The adjusted alpha level was calculated as α = 0.05/8 = 0.00625.
3.5.4. Binary Logistic Regression
A binary logistic regression model was employed to examine the likelihood that a respondent would be classified as a user or non-user. The dependent variable was dichotomous (1 = user, 0 = non-user). Predictor variables were coded as binary, with 1 indicating agreement/support for a given perception or policy statement and 0 indicating disagreement with the characteristic. Predictor variables included perceptions of safety, cost, convenience, and infrastructure support, as well as negative beliefs such as misplacement or discomfort. While t-tests and chi-square analyses provided useful bivariate comparisons, logistic regression enabled simultaneous evaluation of multiple predictors (i.e., demographic and perceptual) while controlling confounding effects. This multivariable approach yields odds ratios that quantify the magnitude and direction of each predictor’s influence on the likelihood of being an e-scooter user, providing deeper behavioral insights and stronger policy implications than bivariate tests alone. Similar modeling strategies have been successfully applied in prior micromobility studies to examine determinants of e-scooter adoption and perceptions [13,14,18]. Model robustness was verified by testing for multicollinearity (Variance Inflation Factors < 3 for all variables), and overall fit was confirmed using the Hosmer–Lemeshow test (p > 0.05). Odds ratios with 95% confidence intervals were reported for each significant predictor. Classification accuracy and Receiver Operating Characteristic (ROC) curve analyses were additionally performed to evaluate model predictive and discrimination performance.
4. Results and Discussion
This section presents the findings from a total of 1036 survey responses, which included 592 e-scooter users and 444 non-users. The results are organized into descriptive findings and statistical analyses to highlight differences in experiences, safety, perceptions, and policy preferences between the two groups.
4.1. Profiles of E-Scooter Users and Non-Users
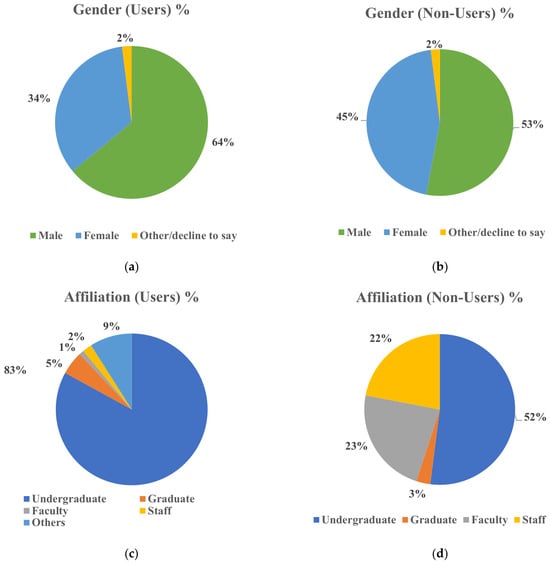
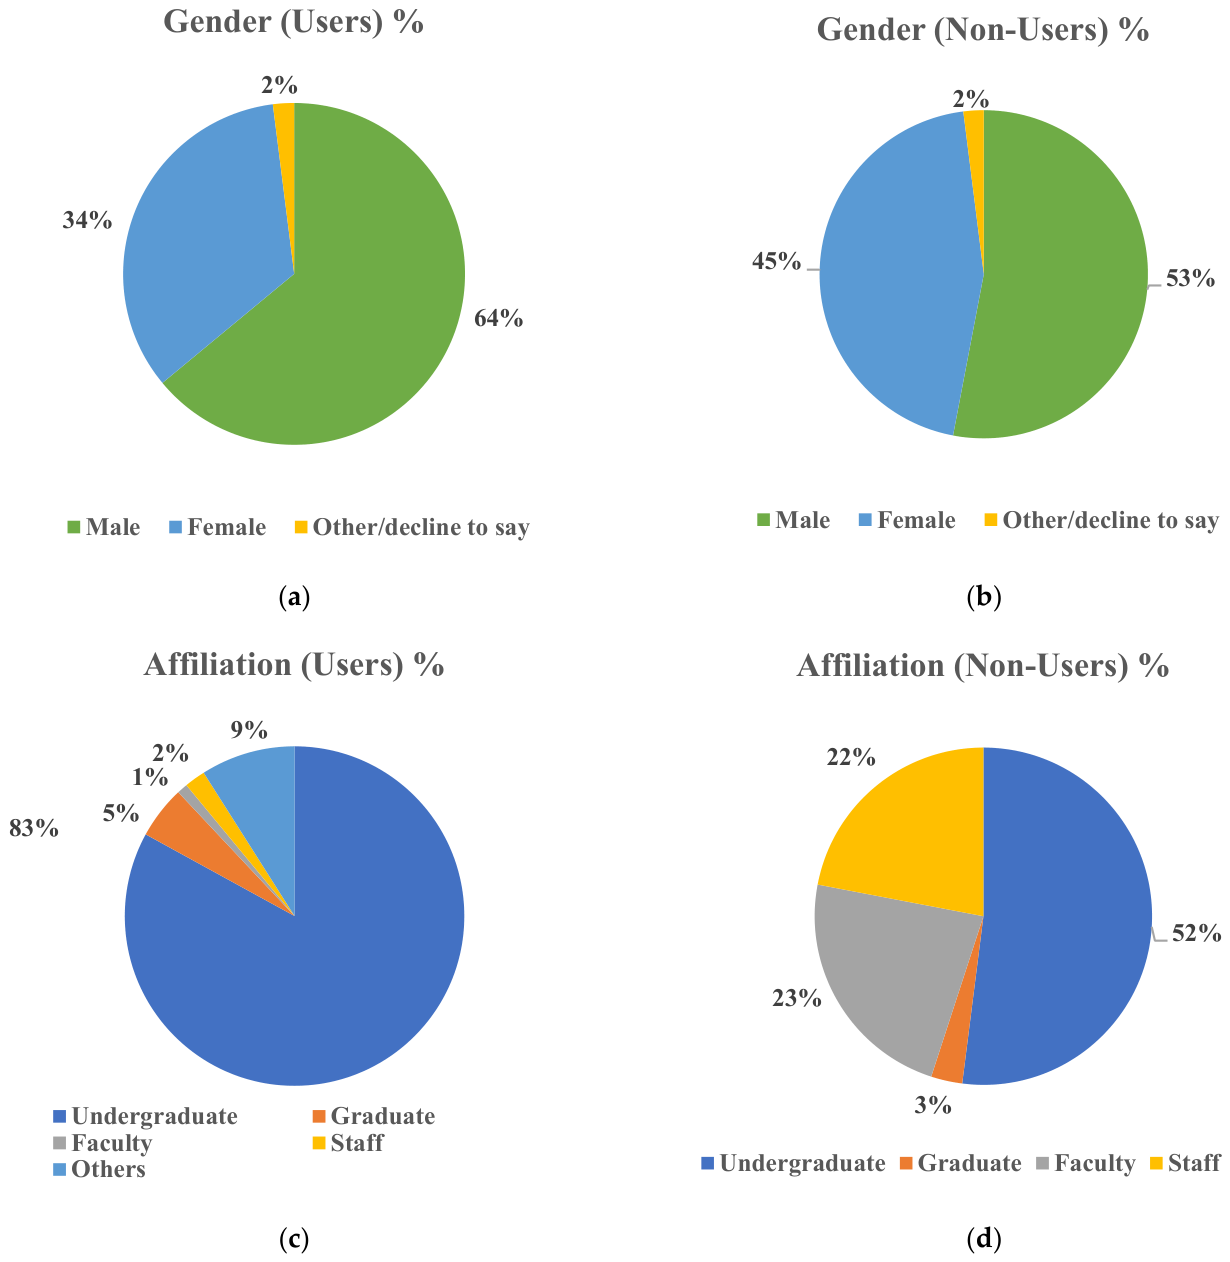
Figure 3 presents a demographic profile comparing e-scooter users and non-users. The data indicate that e-scooter usage is predominantly concentrated among undergraduate students. A significant majority of users (83%) were undergraduates, while only 5% were graduate students. Very few users identified as faculty, staff, or other campus affiliates. These results suggest that e-scooter usage is largely student-driven, particularly among younger campus populations.
Figure 3.
Gender and Affiliation (Users vs. Non-Users): (a) gender distribution of e-scooter users; (b) gender distribution of non-users; (c) university affiliation of e-scooter users; (d) university affiliation of non-users.
As shown in Figure 3, non-users exhibited a more diverse demographic distribution. While 52% were undergraduates, the remaining respondents included a substantial proportion of faculty (23%) and staff (22%). This pattern suggests that faculty and staff are less likely to use e-scooters, possibly because of differing travel needs, safety concerns, or limited familiarity with shared mobility systems. Gender disparities were also evident. Among users, 64% identified as male and 34% as female, with 2% either undisclosed or identifying differently. Among non-users, the distribution was more balanced: 53% male and 45% female. These findings suggest that male undergraduates are more likely to use e-scooters, consistent with broader micromobility trends, where men are more frequent adopters of emerging transportation technologies [44].
The high concentration of use within the student body, particularly undergraduates, further aligns with the spatial studies of Bai and Jiao, who confirmed the dominance of university-centered activity patterns in cities like Austin and Minneapolis [15]. Targeted outreach to underrepresented groups, such as faculty, staff, and female students, may enhance adoption and support a more inclusive approach to shared mobility initiatives.
4.2. Satisfaction and Comfort Among Users
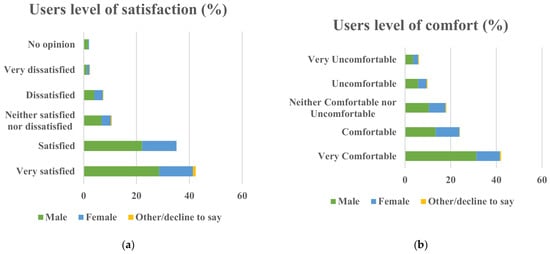
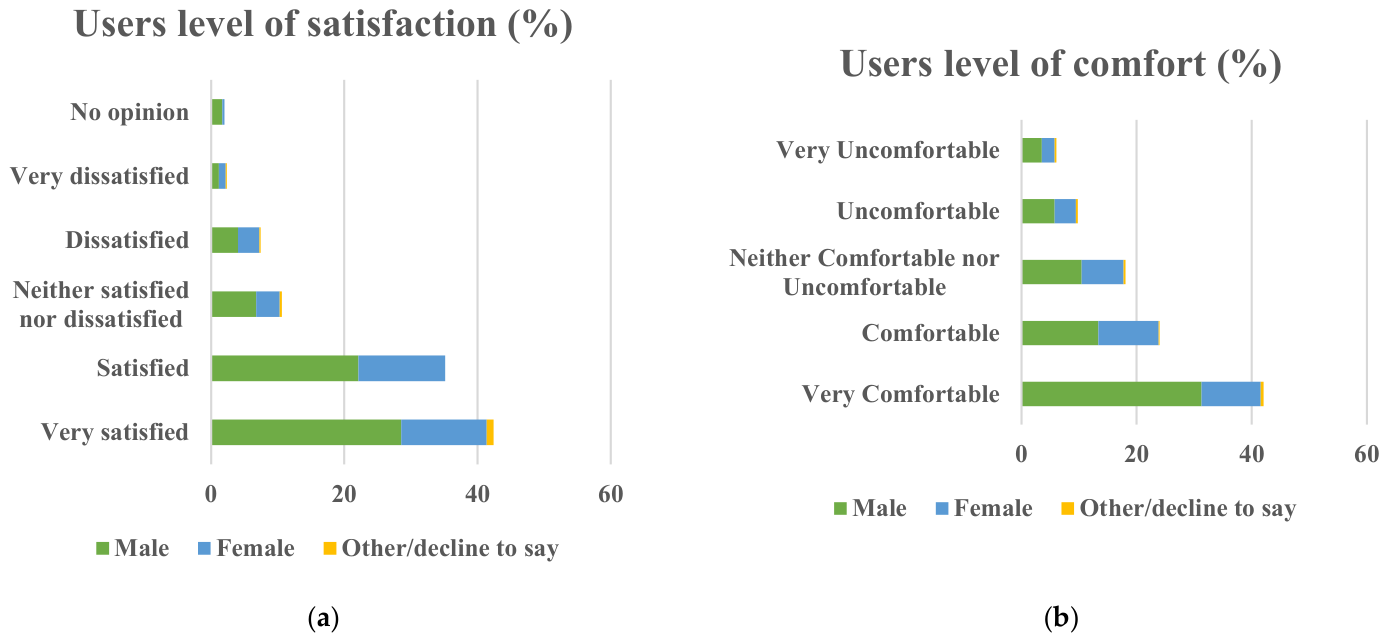
Figure 4a illustrates users’ satisfaction with the e-scooter experience. The results indicate a predominantly positive response: 43% of users reported being “very satisfied,” and an additional 33% reported being “satisfied,” resulting in over 75% expressing overall satisfaction. A small proportion of users reported dissatisfaction, while approximately 15% indicated a neutral stance. High satisfaction levels are likely attributable to perceived convenience, travel speed, ease of use, and availability. Positive user experiences may contribute to continued usage, peer endorsement, and increased confidence in the service.
Figure 4.
(a) Satisfaction Level (%) and (b) Comfort Level (%) (Users of E-scooter).
Comfort is also a critical determinant in mode choice. Figure 4b assesses physical comfort while riding. Half of all users (50%) reported feeling “very comfortable,” with 33% indicating they were “comfortable.” Approximately 10% reported a neutral experience, and only a small percentage expressed discomfort. This sense of comfort may contribute to the high satisfaction levels reported in Figure 4a. When riders feel physically at ease, such as steady while standing, secure while turning, and confident navigating shared paths, they are more likely to continue using the service. Comfort also implies a well-designed user experience, which can lead to increased long-term adoption.
4.3. Campus Commuting Patterns Among Non-Users
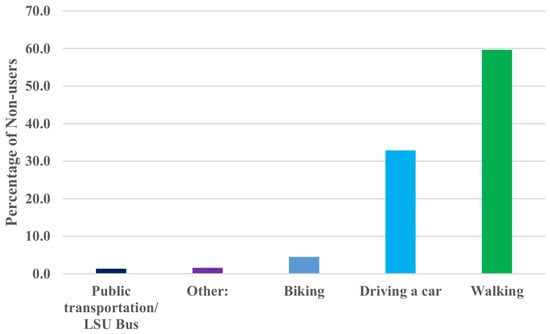
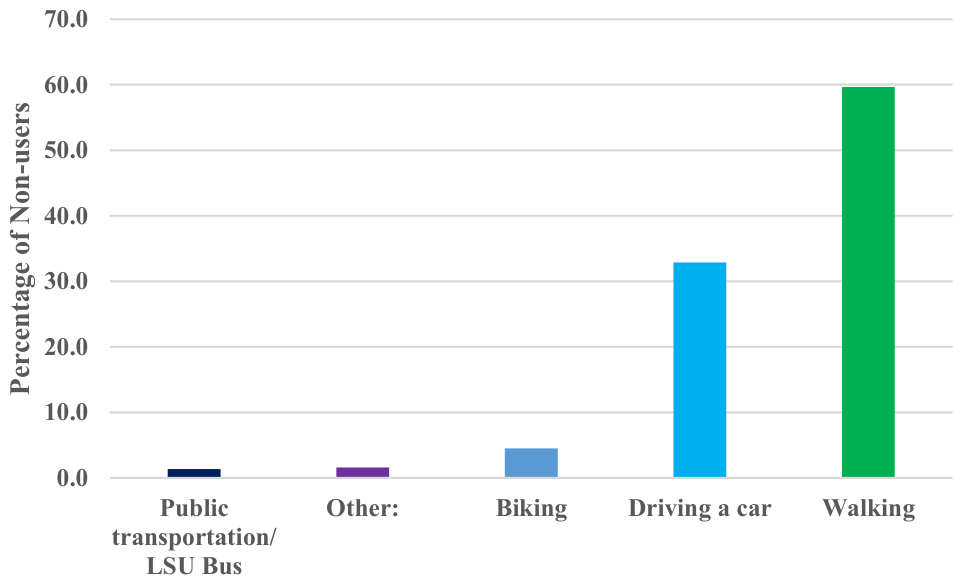
Figure 5 presents the primary modes of transportation used by non-users for campus travel. Walking was the most frequently reported method, with 60% of non-users reporting walking. The second most common mode was driving, utilized by 33% of non-users. Other options, such as biking and buses, were cited at significantly lower rates.
Figure 5.
Primary Commute on or around the LSU campus (non-users of e-scooters).
Results presented in Figure 5 suggest that non-users primarily rely on conventional and personal transportation modes such as walking for shorter distances and driving for longer commutes. The preference for walking may be influenced by factors such as campus layout, health considerations, or perceptions of safety and reliability. In contrast, car usage may reflect longer travel distances, time constraints, or the need to transport items not easily accommodated by e-scooters. Understanding these commuting patterns provides insight into potential reasons for non-adoption, including established routines or limitations that e-scooters do not effectively address.
4.4. Perceived Benefits of E-Scooter Use
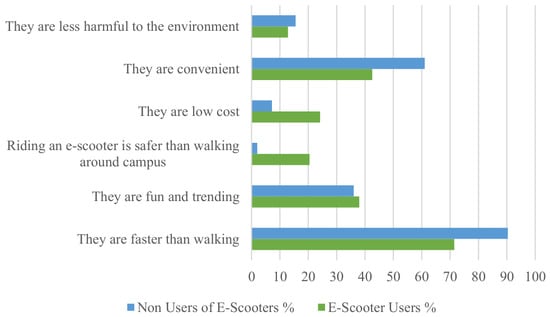
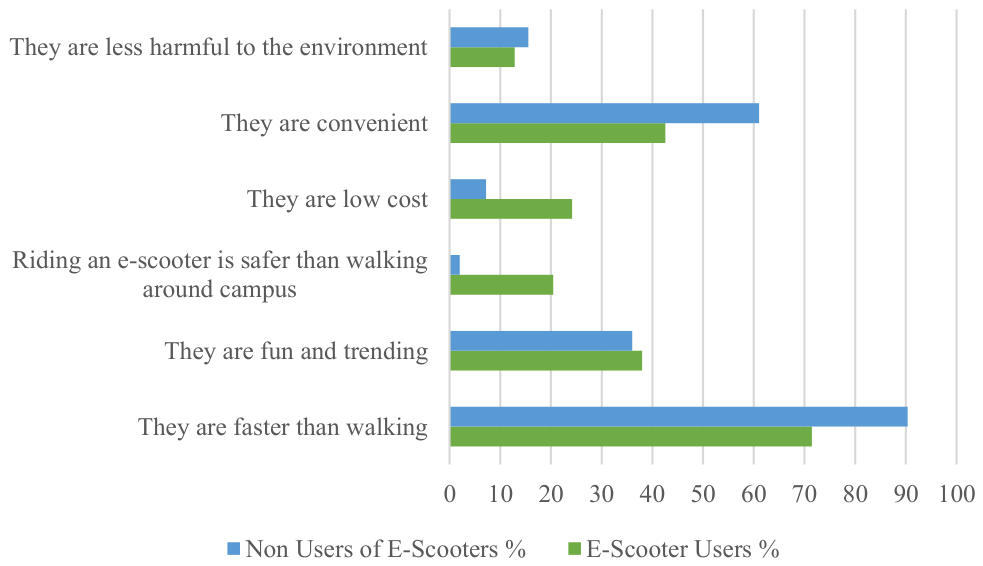
Figure 6 evaluates the motivations behind e-scooter use among users and how non-users perceive the same benefits. Among users, speed emerged as the primary motivator, with 90% agreeing that e-scooters are faster than walking. This perception of speed is a key factor in their appeal, particularly on large campuses with widely spaced buildings. Convenience was the second-most-cited benefit, cited by 61% of users. Additionally, 43% identified low cost as an advantage, and 36% cited enjoyment or trendiness. Notably, environmental benefits were selected less frequently, with only 16% of users identifying sustainability as a motivating factor.
Figure 6.
Perceptions of E-Scooters: Users vs. Non-Users.
Non-users recognized several of these advantages, albeit at lower rates. For example, 71% agreed that e-scooters are faster than walking, and 43% considered them convenient. However, fewer non-users viewed them as affordable or enjoyable, and only 13% considered them environmentally friendly. The strong emphasis on speed (90%) and convenience (61%) as primary motivators, with environmental benefits cited by only 16% of users, aligns with previous findings that e-scooters are frequently used for leisure and recreational purposes rather than primarily for commuting or first/last-mile connectivity [8]. This leisure-oriented use challenges the notion that e-scooters primarily serve as sustainable transportation alternatives. These findings are consistent with prior studies indicating that many e-scooter trips substitute walking, biking, or public transit trips rather than private vehicle travel, while lifecycle assessments have questioned the net sustainability benefits of shared e-scooter systems due to manufacturing and operational emissions [4].
Chi-square analysis supported these trends. A significant association was found between user status and the perception of low cost, χ2(1) = 52.713, p < 0.001. Users were over four times more likely to perceive e-scooters as cost-effective (Odds Ratio = 4.138), indicating that direct usage experience was significantly associated with more favorable cost perceptions. These findings further support H2, indicating that e-scooter users place greater importance on convenience, travel efficiency, and favorable operational characteristics compared with non-users.
4.5. Safety Perceptions
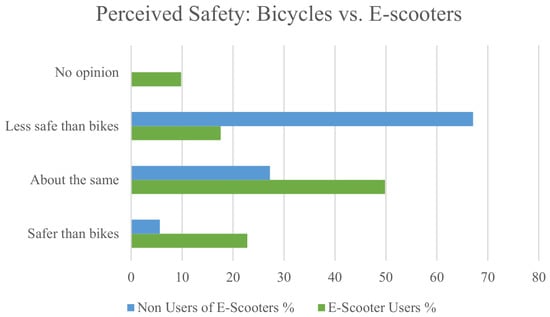
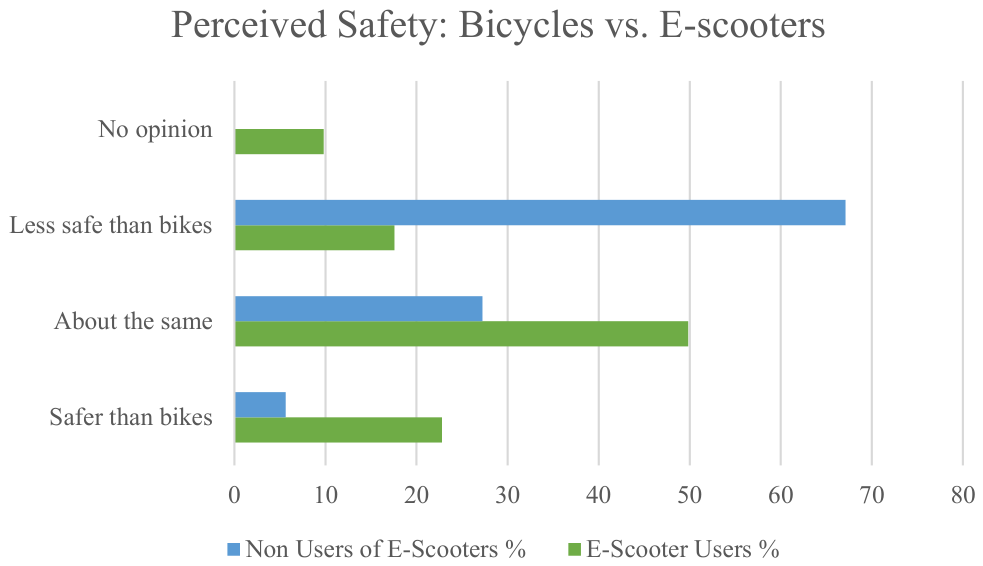
Figure 7 compares users’ and non-users’ perceptions of e-scooter safety relative to bicycles. Among users, 67% believed that e-scooters are about as safe as bicycles, while 27% perceived them to be safer. Notably, the non-users group indicated that e-scooters were less safe than bicycles. As shown in Figure 6, 50% of non-users considered e-scooters less safe than bicycles. Only a small proportion viewed them as safer, and many expressed no definitive opinion. This divergence highlights the impact of direct riding experience on perceived safety.
Figure 7.
Perceived safety: bicycles vs. e-scooters.
An independent t-test confirmed this difference, showing that users rated e-scooters as significantly safer than non-users did, t(997) = 14.38, p < 0.001. The effect size was moderate to large (Cohen’s d = 0.63), indicating that the difference is not only statistically significant but also practically meaningful. Table 2 summarizes the results of the independent samples t-tests conducted to compare mean safety perceptions and accident experiences between e-scooter users and non-users.
Table 2.
Independent Samples T-Test Summary.
Chi-square analysis revealed a strong association between user status and the belief that e-scooters are safer than walking, χ2 (1) = 79.302, p < 0.001. The odds ratio (Odds Ratio = 12.546) indicated that users were over 12 times more likely to believe e-scooters are safer than walking. These results suggest that user experience is associated with increased confidence and differences in personal risk assessment. This divergence highlights the impact of direct riding experience on perceived safety, which can often be misaligned with objective risk. While users were over 12 times more likely to believe e-scooters are safer than walking, national injury data indicate that e-scooter-related injuries have increased sharply, particularly in dense pedestrian areas like campuses, where collision and fall rates can exceed those in urban street contexts [9,11]. This gap between user confidence and elevated risk highlights the need for educational interventions and infrastructure improvements. These findings support H1, indicating that e-scooter users generally perceive e-scooters as safer than non-users.
4.6. Pedestrian Concerns About E-Scooters
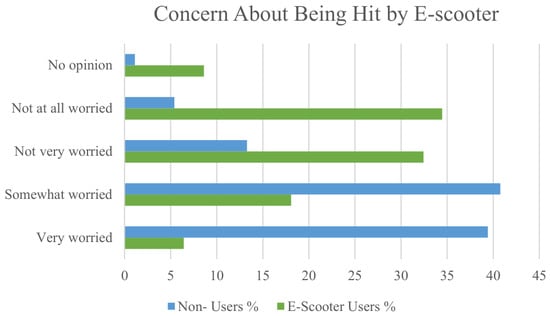
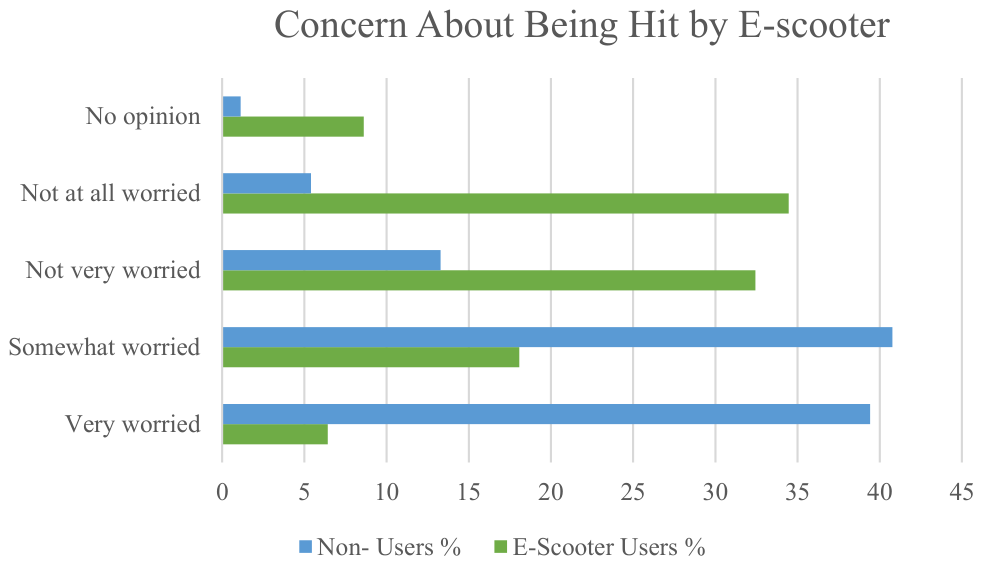
Figure 8 evaluates the level of concern individuals have about the risk of being struck by an e-scooter while walking. Among users, only 6% reported being very concerned, and 18% were somewhat concerned. In contrast, 18% of non-users indicated they were very concerned, and 32% were somewhat concerned, resulting in 50% of non-users expressing concern regarding pedestrian safety around e-scooters. This disparity is consistent with differing perspectives: users typically feel more in control and familiar with scooter dynamics, whereas non-users, with less direct experience, may perceive greater vulnerability or uncertainty. Addressing these concerns may require infrastructure improvements, targeted rider education, and clearly defined regulations for operating scooters in areas with high pedestrian traffic.
Figure 8.
Concern About Being Hit by an E-Scooter.
4.7. Experience with Accidents
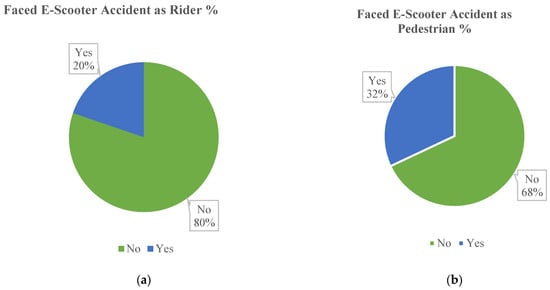
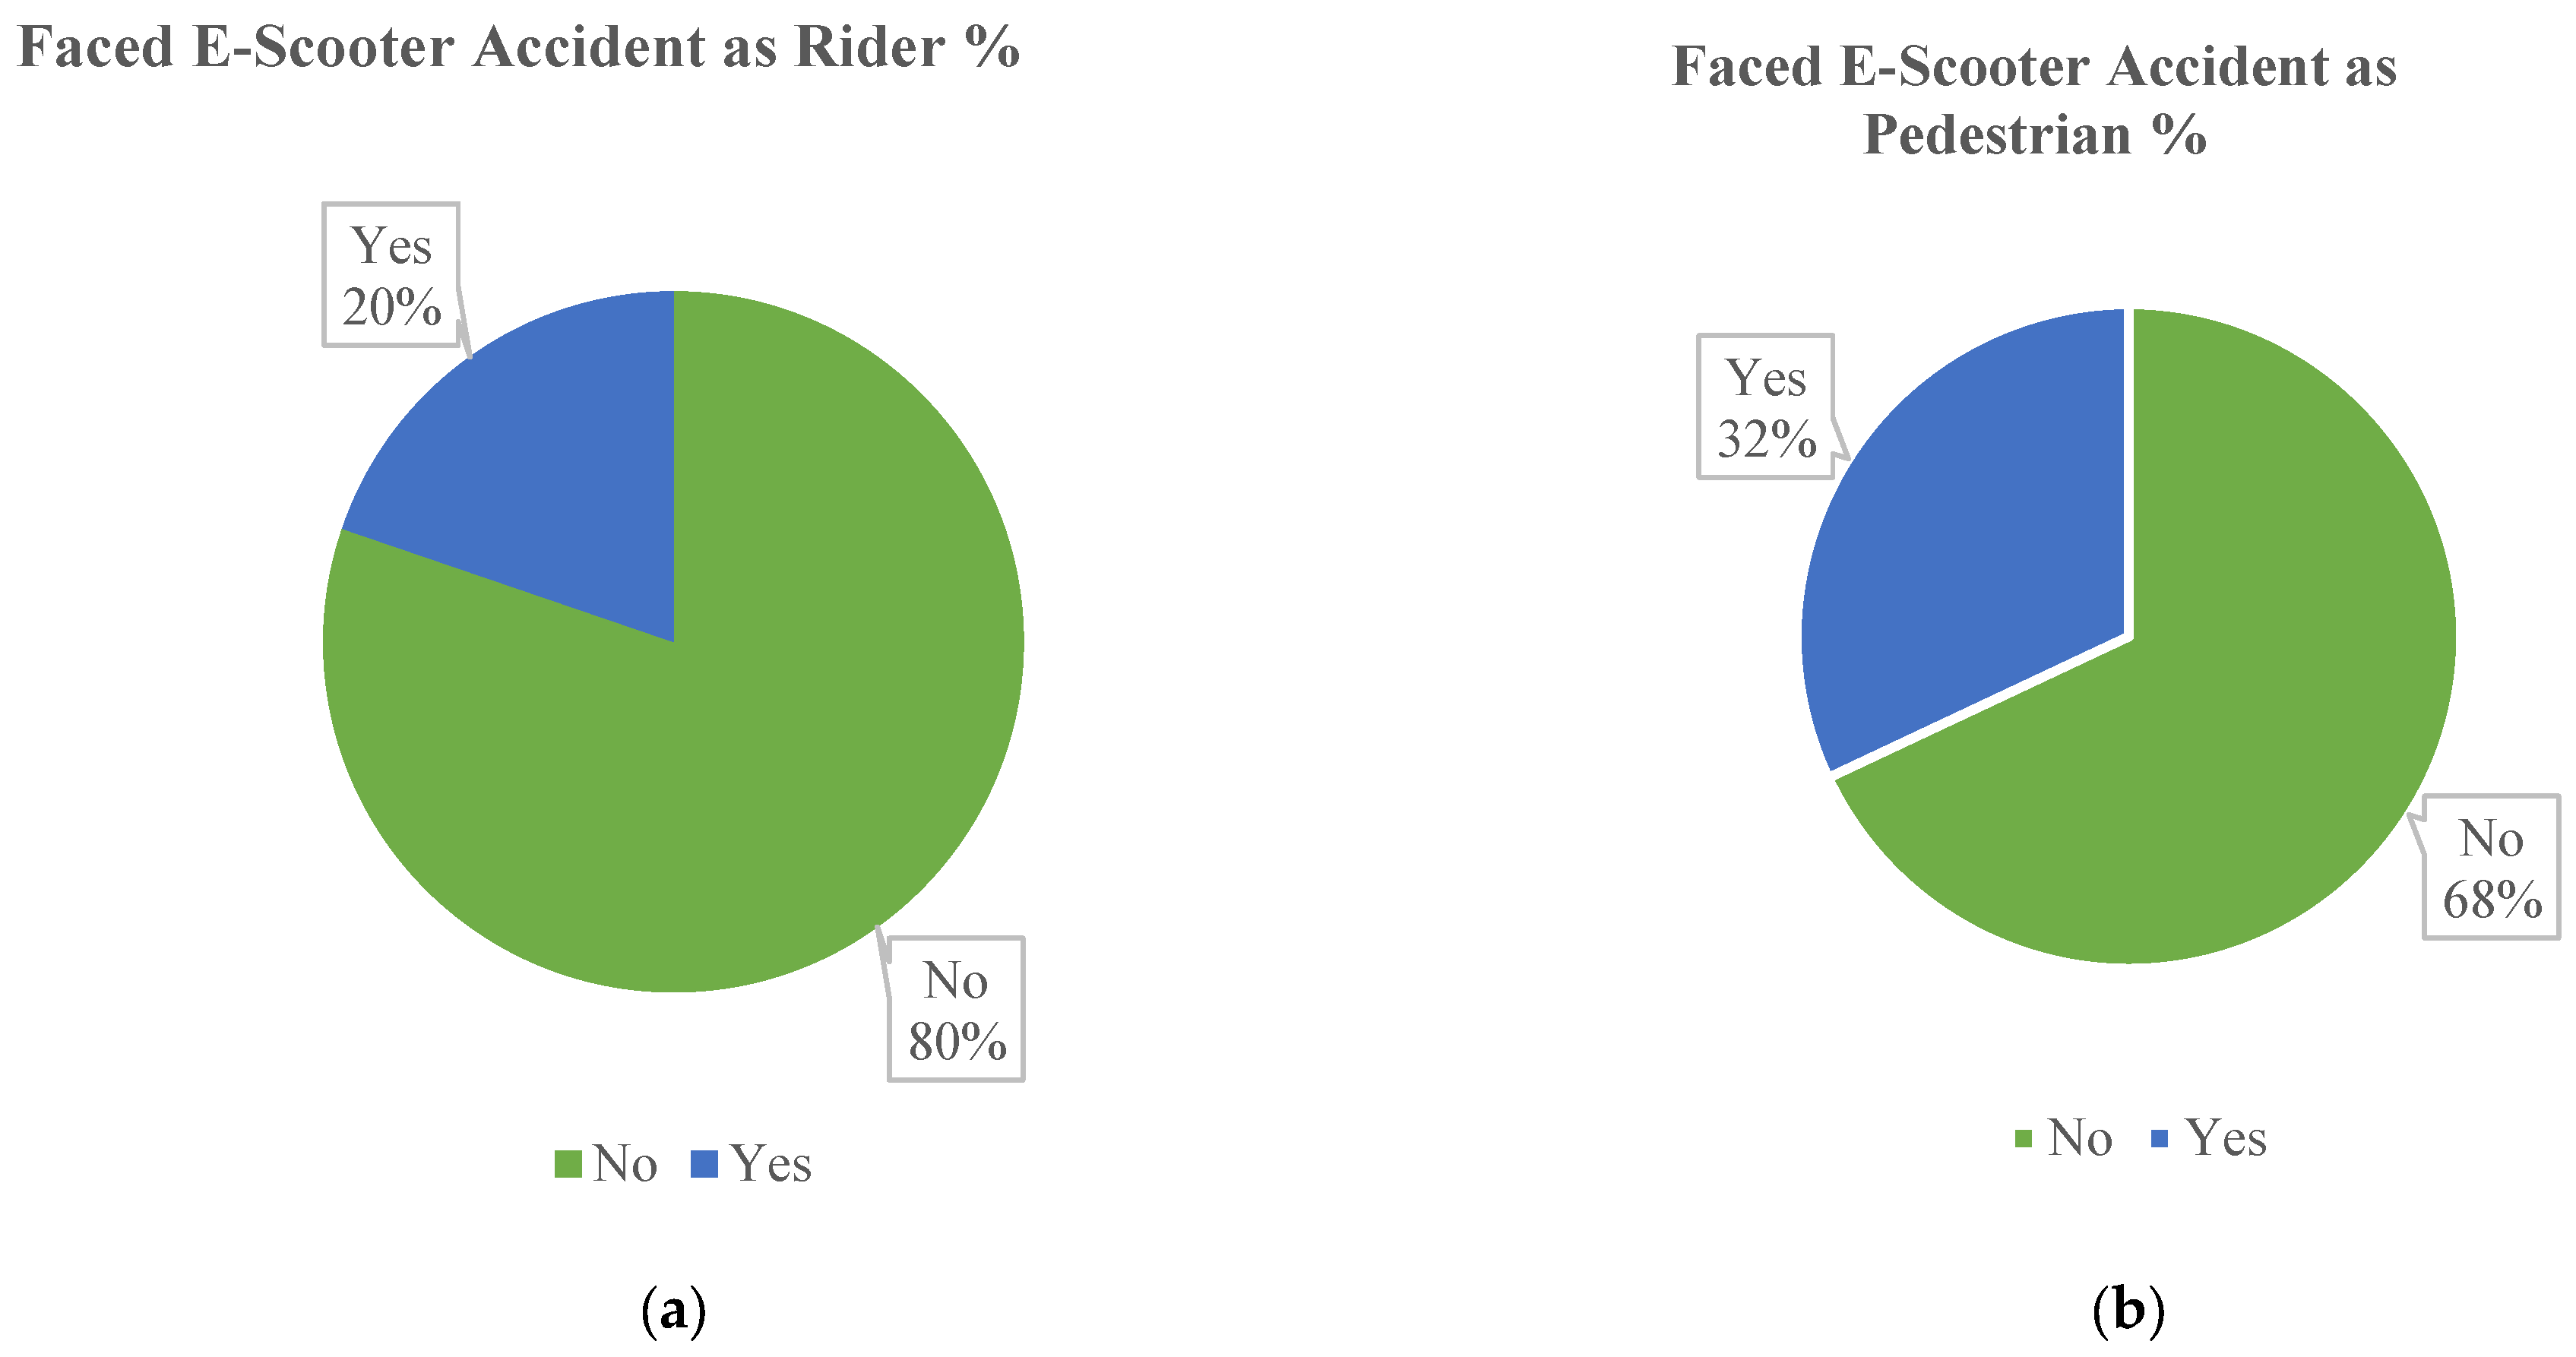
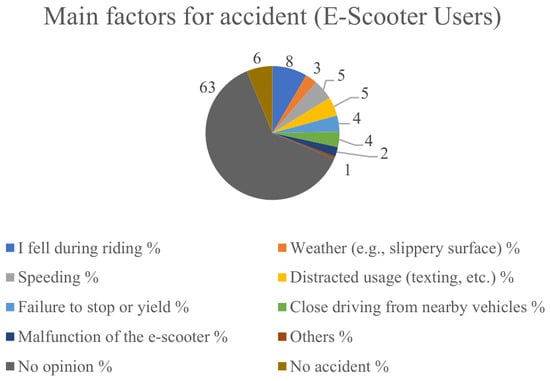
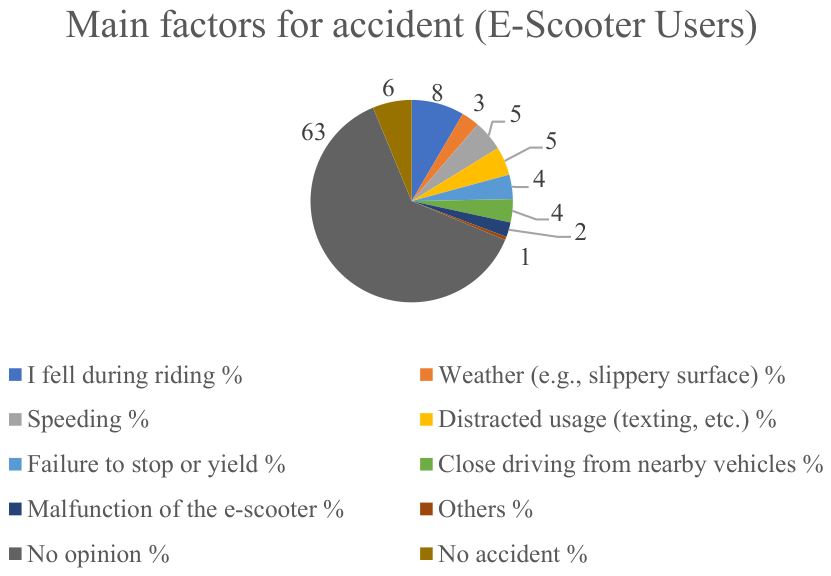
Figure 9 and Figure 10 indicate that 80% of users have never experienced an accident while riding an e-scooter. Among the 20% who had, the most frequently reported cause was falling during a ride (8%). Additional causes included excessive speed (5%), distractions such as texting (5%), and environmental factors, such as slippery surfaces or braking difficulties. Very few incidents were attributed to mechanical issues with the scooters themselves. Beyond rider-related incidents, approximately 32% of participants, both users and non-users, reported either being involved in or witnessing an e-scooter accident as pedestrians.
Figure 9.
Experience with E-scooter Accidents: (a) percentage of respondents who faced an E-scooter accident as a rider; (b) percentage of respondents who faced an E-scooter.
Figure 10.
Main factors for e-scooter-related accidents. (Note: Percentages may not sum to 100% due to rounding).
These findings were supported by statistical analyses. An independent-samples t-test showed that users, on average, reported significantly more direct riding-related accidents than non-users, t(865.66) = 4.434, p < 0.001, with a moderate effect size (Cohen’s d = 0.429). This result is expected because users had direct riding exposure to e-scooters, whereas non-users did not actively operate them. Chi-square analysis also revealed a significant association between user status and accident experience, χ2 (1) = 20.201, p < 0.001. In contrast, non-users more frequently reported indirect involvement in accidents or pedestrian-related encounters associated with e-scooter operations on campus. Therefore, while users experienced more riding-related incidents, non-users expressed stronger concerns about pedestrian interactions and operational safety risks in shared campus spaces.
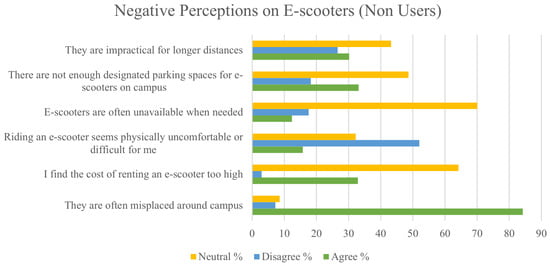
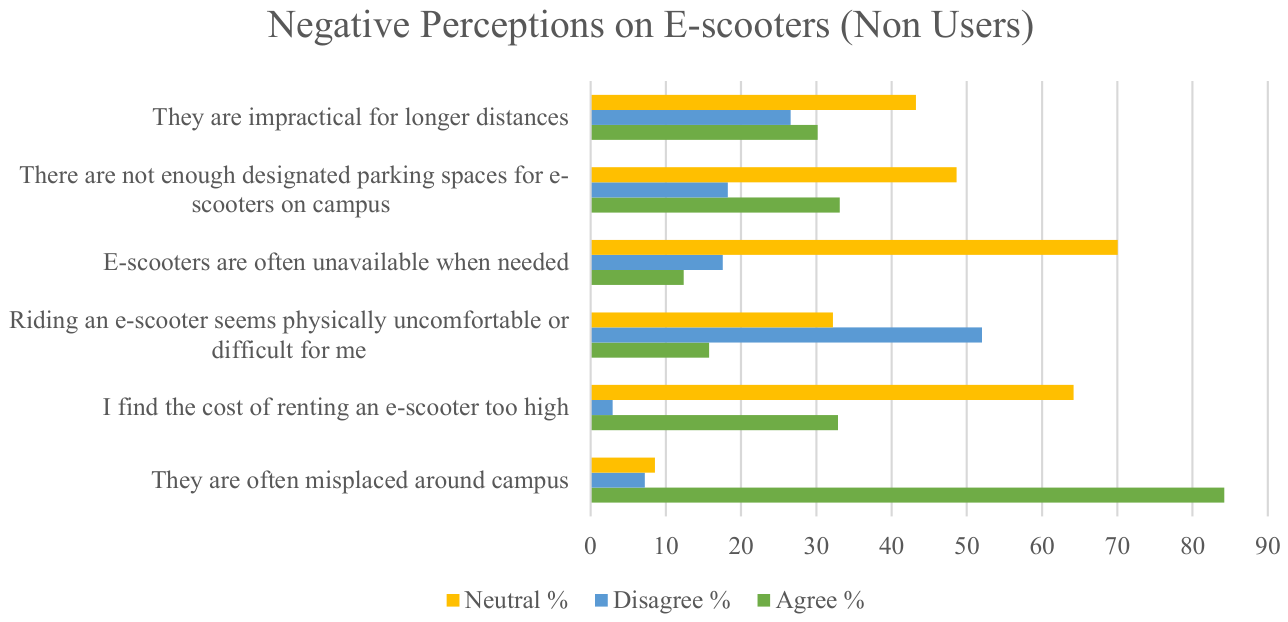
4.8. Barriers to Use Among Non-Users
Figure 11 examines the reasons non-users choose not to ride e-scooters. The most frequently cited concern, reported by 84% of respondents, was the frequent misplacement of scooters on campus. This likely reflects frustration with scooters obstructing walkways, being left on grassy areas, or contributing to visual clutter. Cost was identified as a barrier by 33% of non-users, as was the lack of designated parking (33%). Additional deterrents included physical discomfort while riding, limited scooter availability, and perceptions of ineffectiveness for longer travel distances. These responses were backed by statistical analysis. A chi-square test showed a strong relationship between user status and the belief that scooters are often misplaced, χ2(1) = 334.373, p < 0.001. The odds ratio was 0.069, indicating that non-users were approximately 14.5 times more likely to hold this view. Addressing these concerns may be critical for expanding adoption. The overwhelming finding that 84% of non-users cited frequent scooter misplacement as the top barrier is a significantly higher rate of perceived obstruction than the 16% to 22% of scooters observed as improperly parked in observational studies in other urban settings [16]. The highly negative Odds Ratio (0.069) confirms that this frustration is a major deterrent to adoption. Addressing this concern by implementing designated parking hubs and geofencing enforcement is critical, directly supporting the policy recommendations derived from prior studies on operational challenges and sidewalk obstruction [16].
Figure 11.
Negative perceptions of e-scooters.
4.9. Opinions on Policy and Regulation
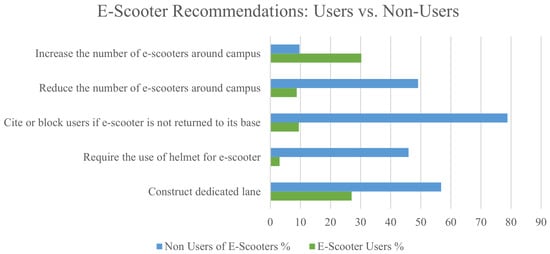
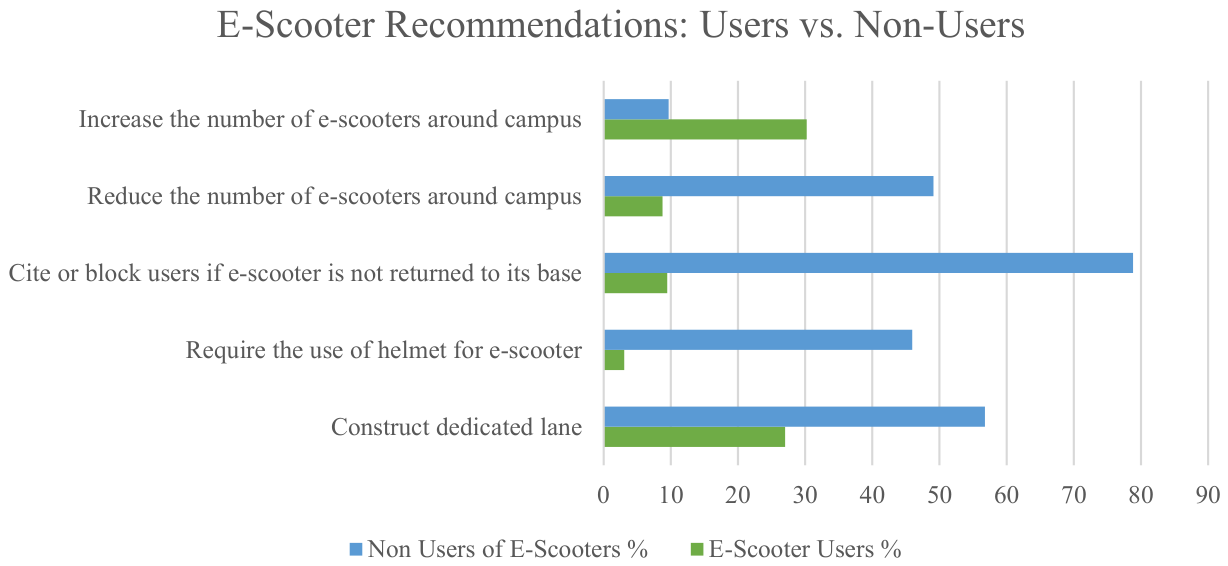
Figure 12 presents participant recommendations for improving the use of e-scooters around campus. Among non-users, the most widely supported measure was enforcing proper parking, with 79% agreeing that individuals should be held accountable for returning scooters appropriately. Additional non-users’ supported suggestions included the construction of dedicated lanes (57%) and the implementation of helmet requirements (46%). Notably, 49% of non-users supported reducing the number of scooters on campus, potentially to address concerns related to clutter or oversupply. Users expressed different priorities. Approximately 30% supported increasing the number of available scooters, while 27% favored the development of dedicated lanes. However, relatively few users endorsed strict enforcement measures or helmet mandates.
Figure 12.
E-Scooter recommendations: users vs. non-users.
Chi-square tests showed significant differences across these policy areas:
- Dedicated Lanes: χ2(1) = 93.619, p < 0.001. Users were more likely to oppose them.
- Mandatory Helmet Use: χ2(1) = 277.403, p < 0.001. Users were strongly against it.
- Reducing Scooters: χ2(1) = 286.721, p < 0.001. Non-users favored the reduction more than users.
- Increasing Scooters: χ2(1) = 63.648, p < 0.001. Users were more supportive of growth.
Table 3 presents the significant associations identified by Chi-square tests, detailing the relationships between e-scooter user status and key categorical variables, including cost perception, safety beliefs, and policy support.
Table 3.
Chi-Square () Test Summary.
These results reveal differing expectations between the two groups; users prioritize improving rider behavior and convenience, while non-users seek better regulation and reduced environmental impact. The clear differences in policy support (i.e., users favoring growth (30% support increasing scooters) and non-users favoring restrictions (79% support parking enforcement, 46% support helmet mandates)) mirror the operational challenge identified in the literature: integrating micromobility safely while ensuring user convenience. These conflicting expectations demonstrate the need for context-sensitive policies. For instance, strong support for dedicated lanes among non-users is consistent with findings at Virginia Tech, where e-scooter users showed a strong preference for bikeways and multi-use paths even when longer [37], underscoring the broader demand for dedicated infrastructure to mitigate perceived risks across all campus populations. These findings support H3 and H4, indicating that non-users express stronger concerns regarding scooter misplacement, pedestrian interaction, and regulatory measures, whereas users show greater support for convenience-oriented and expansion-focused policies.
While the findings support designated parking hubs, geofencing enforcement, and safety-oriented interventions, practical implementation requires consideration of operational feasibility and campus management constraints. Dedicated parking infrastructure may require additional campus space allocation, signage, maintenance, and implementation costs. Similarly, geofencing and parking compliance systems depend on coordination between universities and shared mobility providers, including GPS monitoring accuracy and enforcement mechanisms. User compliance also remains an important challenge, particularly in high-demand campus areas where improper parking behavior may persist despite regulations. Therefore, universities should consider phased implementation strategies that combine infrastructure improvements, rider education, digital enforcement tools, and periodic monitoring to balance operational cost, user convenience, and pedestrian safety.
Table 4 summarizes the chi-square test results evaluated using a Bonferroni-adjusted significance threshold. The primary statistically significant findings remained below the adjusted threshold, indicating that the overall conclusions remained robust after correction for multiple comparisons.
Table 4.
Bonferroni Correction Summary for Chi-Square Tests.
4.10. Predictors of E-Scooter Use
A binary logistic regression was conducted to identify which beliefs and perceptions significantly predicted e-scooter use. The model was statistically significant, χ2(17) = 932.313, p < 0.001, and accounted for between 59.3% (Cox & Snell R2) and 79.7% (Nagelkerke R2) of the variance. The logistic regression model demonstrated strong predictive performance, achieving an overall classification accuracy of 88.9%, correctly classifying 85.8% of non-users and 91.2% of users. In addition, ROC curve analysis yielded an Area Under the Curve (AUC) of 0.956, indicating excellent discrimination between users and non-users. The logistic regression results support H5 by demonstrating that perceptions of safety, affordability, and convenience significantly influence e-scooter usage behavior.
Table 5 presents the odds ratios (OR) and confidence intervals from the binary logistic regression model, identifying independent predictors of e-scooter usage.
Table 5.
Binary Logistic Regression Summary.
The strongest positive predictor of e-scooter use was support for increasing the number of e-scooters on campus, where participants were nearly 30 times more likely to be users (Odds Ratio = 29.753, 95% CI: 12.727–69.556). Other significant positive predictors included the belief that e-scooters are safer than walking (Odds Ratio = 5.623, 95% CI: 1.971–16.043) and the perception that they are low cost (Odds Ratio = 2.070, p = 0.047, 95% CI: 1.010–4.243).
In contrast, three variables were strong negative predictors of use: belief that scooters are frequently misplaced (Odds Ratio = 0.076, 95% CI: 0.045–0.128), support for mandatory helmet use (Odds Ratio = 0.063, 95% CI: 0.028–0.146), and favor for the construction of dedicated lanes (Odds Ratio = 0.061, 95% CI: 0.029–0.131). Furthermore, negative safety perceptions, such as viewing scooters as less safe than bicycles or slower than walking, also decreased the likelihood of adoption.
These regression results yield distinct and actionable policy implications for campus planners by identifying specific beliefs that are predictive of usage likelihood:
- Parking Management: The finding that concern about misplacement was a strong negative predictor of use (Odds Ratio = 0.076) provides empirical support for the implementation of designated parking hubs and geofencing enforcement, consistent with prior recommendations to improve campus-level micromobility management [4].
- Safety Interventions: The strong negative prediction from supporting mandatory helmet use (Odds Ratio = 0.063) and the positive prediction from believing scooters are safer than walking (Odds Ratio = 5.623) suggest that targeted safety training and helmet-loan programs are recommended. This aligns with findings from prior studies emphasizing safety education and protective behavior as key factors in adoption [13,14].
- Adoption Incentives: The strong positive influence of low-cost perception (Odds Ratio = 2.070) suggests that improving scooter availability (the strongest positive predictor, Odds Ratio = 29.753) and cost transparency can enhance mode acceptance, consistent with broader micromobility adoption trends observed in urban contexts.
The strong negative prediction associated with favoring dedicated lanes (Odds Ratio = 0.061) highlights a key policy conflict: while non-users often support dedicated lanes to mitigate perceived pedestrian risk, the statistically validated opposition from users suggests they prioritize the flexibility and efficiency of current riding patterns over dedicated, potentially restrictive, infrastructure. This finding underscores the complex trade-offs inherent in developing equitable micromobility infrastructure.
5. Summary and Conclusions
This study examined differences in perceptions, preferences, and behaviors between e-scooter users and non-users at Louisiana State University. Using survey data and statistical analyses, including descriptive statistics, independent-samples t-tests, chi-square tests, and binary logistic regression, the study provides a comprehensive overview of campus micromobility attitudes. Results reveal clear distinctions between users and non-users across demographics, satisfaction, safety perceptions, and policy preferences:
- E-scooter users were predominantly male undergraduates, suggesting greater adoption among younger students.
- Over 75% of users reported satisfaction, and 83% felt physically comfortable while riding.
- Speed (90%) and convenience (61%) were the most valued features, followed by cost-effectiveness (43%).
- Environmental benefits were cited less frequently, noted by only 16% of users.
In contrast, non-users showed different patterns and concerns:
- Most relied on traditional modes; 60% walked, and 33% drove on campus.
- Half perceived e-scooters as less safe than bicycles.
- Misplacement was the top concern, reported by 84% of non-users.
- Statistical analyses supported these differences:
- Independent samples t-tests showed significant differences in safety perception (p < 0.001, Cohen’s d = 0.63).
- Chi-square tests revealed strong associations between user status and key variables such as cost perception, safety, environmental values, and policy support (p < 0.001).
- Binary logistic regression identified key predictors of user status:
- ○
- Support for increasing scooter numbers (Odds Ratio = 29.753)
- ○
- Belief that scooters are safer than walking (Odds Ratio = 5.623)
- ○
- Perception of low cost (Odds Ratio = 2.070)
Negative predictors included:
- Concern about misplacement (Odds Ratio = 0.076)
- Support for mandatory helmet rules (Odds Ratio = 0.063)
- Belief in the need for dedicated lanes (Odds Ratio = 0.061)
Collectively, these findings translate the empirical patterns from this study into implementable campus policies, directly addressing the need for targeted, evidence-based interventions. First, the high proportion of non-users citing improper parking as a major issue (84%) supports the implementation of designated parking hubs and geofencing enforcement, consistent with previous recommendations to improve campus-level micromobility management. Second, because logistic regression identified safety perceptions and support for restrictive policies as negative predictors of use, targeted safety training and helmet loan programs are advisable, aligning with prior studies that emphasize safety education and protective behavior as key factors in adoption. Third, the strong predictive power of perceived convenience and affordability suggests that improving scooter availability and cost transparency can enhance mode acceptance, consistent with broader trends in micromobility adoption observed in urban contexts. These strategies ensure that campus efforts balance user convenience with the safety and accessibility needs of the entire university community.
6. Limitations and Future Research
Several limitations should be considered when interpreting the findings of this study, as detailed below.
- The survey was conducted at a single university campus (LSU), which may limit the generalizability of the findings to institutions with different campus layouts, transportation infrastructure, micromobility policies, demographic compositions, or travel cultures. LSU represents a large public university with a predominantly student-centered travel environment, which may differ from commuter campuses, highly urban universities, or international settings. Therefore, the findings should be interpreted cautiously when applied to other populations or geographic contexts. However, several observed trends, including concerns regarding scooter misplacement, pedestrian safety, convenience, and travel speed, may still provide useful insights for campuses with similar shared micromobility systems. Future studies should employ multi-campus or regional samples to evaluate the consistency and transferability of these findings across diverse environments.
- The cross-sectional design restricts the ability to infer causality between perceptions and e-scooter adoption. Therefore, the findings should be interpreted as statistical associations observed at a single point in time rather than direct cause-and-effect relationships. Longitudinal or experimental research designs could better capture behavioral changes over time and evaluate the effects of future policy interventions.
- Although logistic regression identified perceptual predictors of use, it did not include economic and contextual variables such as cost, access to alternative modes, or parking convenience. Incorporating these in future models may provide a more complete understanding of adoption behavior.
- While the study distinguishes between users and non-users, it did not explicitly ask non-users about the conditions under which they might consider using e-scooters. Future surveys should include such items to guide targeted interventions and incentive design.
- Faculty and staff respondents may have different travel needs than students, potentially influencing aggregated results. Stratified analyses were conducted to mitigate this effect; however, future work could employ weighting or segmentation to better reflect subpopulation dynamics.
- The study relies primarily on self-reported perceptions and experiences without integrating objective operational safety measurements such as actual crash or injury records, riding speed data, pedestrian–scooter conflict observations, or infrastructure-based exposure assessments. Therefore, the findings should be interpreted as perception-based evaluations rather than definitive measures of real-world operational safety. Future research should integrate perception surveys with campus safety databases, hospital injury records, observational conflict analysis, and measures of riding behavior to evaluate whether perceived risks align with actual safety outcomes.
Despite these limitations, the present study lays an essential foundation for understanding perceptions of e-scooters in university environments and provides actionable guidance for campus planners and policymakers.
Author Contributions
The authors confirm contribution to the paper as follows: study conception and design: M.H.J., M.A.E. and M.A.R.C.; data collection: M.H.J. and M.A.E.; analysis and interpretation of results: M.H.J.; draft manuscript preparation: M.H.J.; supervision: M.A.E. All authors have read and agreed to the published version of the manuscript.
Funding
This research was funded by SPIN, Inc. under award number AWD-006482.
Institutional Review Board Statement
This study was reviewed and approved on 13 April 2023 by the Institutional Review Board (IRB) at Louisiana State University under protocol number IRBAM-23-0030. All procedures involving human participants were conducted in accordance with institutional and ethical standards.
Informed Consent Statement
Informed consent was obtained from all subjects involved in the study.
Data Availability Statement
The data that support the findings of this study are available from the corresponding author upon reasonable request.
Acknowledgments
The researchers of this study are grateful for the financial support from Spin, Inc. Furthermore, the authors would like to acknowledge the assistance of Bruno Lopes of Spin, Inc.
Conflicts of Interest
The authors declare no conflicts of interest.
References
- Mitropoulos, L.; Stavropoulou, E.; Tzouras, P.; Karolemeas, C.; Kepaptsoglou, K. E-scooter Micromobility Systems: Review of Attributes and Impacts. Transp. Res. Interdiscip. Perspect. 2023, 21, 100888. [Google Scholar] [CrossRef] [Scilit]
- Elseifi, M.; Chowdhury, M.A.R. Economic, Environmental, and Social Characteristics of E-Scooters on LSU Campus; Report No. Tran-SET Project 22-001-ITS; Louisiana State University, Transportation Research Center: Baton Rouge, LA, USA, 2024; Available online: https://repository.lsu.edu/transet_pubs/157/ (accessed on 15 May 2026).
- Nikiforiadis, A.; Paschalidis, E.; Stamatiadis, N.; Paloka, N.; Tsekoura, E.; Basbas, S. E-scooters and other mode trip chaining: Preferences and attitudes of university students. Transp. Res. Part A Policy Pract. 2023, 170, 103636. [Google Scholar] [CrossRef] [Scilit]
- Badia, H.; Jenelius, E. Shared E-Scooter Micromobility: Review of Use Patterns, Perceptions, and Environmental Impacts. Transp. Rev. 2023, 43, 811–837. [Google Scholar] [CrossRef] [Scilit]
- Trivedi, T.K.; Liu, C.; Antonio, A.L.M.; Wheaton, N.; Kreger, V.; Yap, A.; Schriger, D.; Elmore, J.G. Injuries Associated with Standing Electric Scooter Use. JAMA Netw. Open 2019, 2, e187381. [Google Scholar] [CrossRef] [Scilit] [PubMed]
- Laa, B.; Leth, U. Survey of E-Scooter Users in Vienna: Who They Are and How They Ride. J. Transp. Geogr. 2020, 89, 102874. [Google Scholar] [CrossRef] [Scilit]
- Kazemzadeh, K.; Sprei, F. Towards an Electric Scooter Level of Service: A Review and Framework. Travel Behav. Soc. 2022, 29, 149–164. [Google Scholar] [CrossRef] [Scilit]
- Bieliński, T.; Ważna, A. Electric Scooter Sharing and Bike Sharing User Behaviour and Characteristics. Sustainability 2020, 12, 9640. [Google Scholar] [CrossRef] [Scilit]
- Ma, Q.; Yang, H.; Mayhue, A.; Sun, Y.; Huang, Z.; Ma, Y. E-Scooter Safety: The Riding Risk Analysis Based on Mobile Sensing Data. Accid. Anal. Prev. 2021, 151, 105954. [Google Scholar] [CrossRef] [Scilit]
- National Association of City Transportation Officials (NACTO). Shared Micromobility Report: 2023; National Association of City Transportation Officials: New York, NY, USA, 2023; Available online: https://nacto.org/publication/shared-micromobility-report-2023/ (accessed on 15 May 2026).
- Hosseinzadeh, A.; Algomaiah, M.; Kluger, R.; Li, Z. E-Scooters and Sustainability: Investigating the Relationship between the Density of E-Scooter Trips and Characteristics of Sustainable Urban Development. Sustain. Cities Soc. 2021, 66, 102624. [Google Scholar] [CrossRef] [Scilit]
- Smith, C.S.; Schwieterman, J.P. E-Scooter Scenarios: Evaluating the Potential Mobility Benefits of Shared Dockless Scooters in Chicago. Available online: https://scholars.depaul.edu/en/publications/e-scooter-scenarios-evaluating-the-potential-mobility-benefits-of/ (accessed on 15 May 2026).
- Heineke, K.; Kloss, B.; Scurtu, D.; Weig, F. Micromobility’s 15,000-Mile Checkup. McKinsey & Company. 2019. Available online: https://www.mckinsey.com/industries/automotive-and-assembly/our-insights/micromobilitys-15000-mile-checkup (accessed on 15 May 2026).
- McKenzie, G. Spatiotemporal Comparative Analysis of Scooter-Share and Bike-Share Usage Patterns in Washington, D.C. J. Transp. Geogr. 2019, 78, 19–28. [Google Scholar] [CrossRef] [Scilit]
- Jiao, J.; Bai, S. Understanding the Shared E-Scooter Travels in Austin, TX. ISPRS Int. J. Geo-Inf. 2020, 9, 135. [Google Scholar] [CrossRef] [Scilit]
- James, O.; Swiderski, J.I.; Hicks, J.; Teoman, D.; Buehler, R. Pedestrians and e-scooters: An initial look at e-scooter parking and perceptions by riders and non-riders. Sustainability 2019, 11, 5591. [Google Scholar] [CrossRef] [Scilit]
- Caspi, O.; Smart, M.J.; Noland, R.B. Spatial Associations of Dockless Shared E-Scooter Usage. Transp. Res. Part D Transp. Environ. 2020, 86, 102396. [Google Scholar] [CrossRef] [Scilit] [PubMed]
- Chang, A.Y.; Miranda-Moreno, L.; Clewlow, R.; Sun, L. Trend or Fad? Deciphering the Enablers of Micromobility in the U.S. Available online: https://www.sae.org/binaries/content/assets/cm/content/topics/micromobility/sae-micromobility-trend-or-fad-report.pdf (accessed on 17 May 2026).
- Lazarus, J.; Pourquier, J.C.; Feng, F.; Hammel, H.; Shaheen, S. Micromobility Evolution and Expansion: Understanding How Docked and Dockless Bikesharing Models Complement and Compete—A Case Study of San Francisco. J. Transp. Geogr. 2020, 84, 102620. [Google Scholar] [CrossRef] [Scilit]
- Mehranfar, V.; Jones, C. Exploring Implications and Current Practices in E-Scooter Safety: A Systematic Review. Transp. Res. Part F Traffic Psychol. Behav. 2024, 107, 321–382. [Google Scholar] [CrossRef] [Scilit]
- Kazemzadeh, K.; Haghani, M.; Sprei, F. Electric scooter safety: An integrative review of evidence from transport and medical research domains. Sustain. Cities Soc. 2023, 89, 104313. [Google Scholar] [CrossRef] [Scilit]
- Pazzini, M.; Cameli, L.; Lantieri, C.; Vignali, V.; Dondi, G.; Jonsson, T. New Micromobility Means of Transport: An Analysis of E-Scooter Users’ Behaviour in Trondheim. Int. J. Environ. Res. Public Health 2022, 19, 7374. [Google Scholar] [CrossRef] [Scilit] [PubMed]
- Hollingsworth, J.; Copeland, B.; Johnson, J.X. Are E-Scooters Polluters? The Environmental Impacts of Shared Dockless Electric Scooters. Environ. Res. Lett. 2019, 14, 084031. [Google Scholar] [CrossRef] [Scilit]
- Li, A.; Zhao, P.; Liu, X.; Mansourian, A.; Axhausen, K.W.; Qu, X. Comprehensive Comparison of E-Scooter Sharing Mobility: Evidence from 30 European Cities. Transp. Res. Part D Transp. Environ. 2022, 105, 103229. [Google Scholar] [CrossRef] [Scilit]
- Button, K.; Frye, H.; Reaves, D. Economic Regulation and E-Scooter Networks in the USA. Res. Transp. Econ. 2020, 84, 100973. [Google Scholar] [CrossRef] [Scilit]
- Wincent, B.B.; Jenelius, E.; Burghout, W. Shared E-Scooters: A Last-Minute Mode? Travel Behav. Soc. 2024, 37, 100864. [Google Scholar] [CrossRef] [Scilit]
- Huang, E.; Yin, Z.; Broaddus, A.; Yan, X. Shared E-Scooters as a Last-Mile Transit Solution? Travel Behavior Insights from Los Angeles and Washington, D.C. Travel Behav. Soc. 2024, 34, 100663. [Google Scholar] [CrossRef] [Scilit]
- Tuncer, S.; Laurier, E.; Brown, B.; Licoppe, C. Notes on the practices and appearances of e-scooter users in public space. J. Transp. Geogr. 2020, 85, 102702. [Google Scholar] [CrossRef] [Scilit]
- Stray, A.V.; Siverts, H.; Melhuus, K.; Enger, M.; Galteland, P.; Næss, I.; Helseth, E.; Ramm-Pettersen, J. Characteristics of Electric Scooter and Bicycle Injuries after Introduction of Electric Scooter Rentals in Oslo, Norway. JAMA Netw. Open 2022, 5, e2226701. [Google Scholar] [CrossRef] [Scilit]
- Farley, K.X.; Aizpuru, M.; Wilson, J.M.; Daly, C.A.; Xerogeanes, J.; Gottschalk, M.B.; Wagner, E.R. Estimated Incidence of Electric Scooter Injuries in the US from 2014 to 2019. JAMA Netw. Open 2020, 3, e2014500. [Google Scholar] [CrossRef] [Scilit] [PubMed]
- Sikka, N.; Vila, C.; Stratton, M.; Ghassemi, M.; Pourmand, A. Sharing the sidewalk: A case of e-scooter related pedestrian injury. Am. J. Emerg. Med. 2019, 37, 1807.e5–1807.e7. [Google Scholar] [CrossRef] [Scilit]
- Beck, S.; Barker, L.; Chan, A.; Stanbridge, S. Emergency Department Impact Following the Introduction of an Electric Scooter Sharing Service. Emerg. Med. Australas. 2020, 32, 409–415. [Google Scholar] [CrossRef] [Scilit]
- Shichman, I.; Shaked, O.; Factor, S.; Weiss-Meilik, A.; Khoury, A. Emergency Department Electric Scooter Injuries after the Introduction of Shared E-Scooter Services: A Retrospective Review of 3331 Cases. World J. Emerg. Med. 2022, 13, 5–10. [Google Scholar] [CrossRef] [Scilit]
- Bozzi, A.D.; Aguilera, A. Shared E-Scooters: A Review of Uses, Health and Environmental Impacts, and Policy Implications of a New Micro-Mobility Service. Sustainability 2021, 13, 8676. [Google Scholar] [CrossRef] [Scilit]
- Guo, Y.; Zhang, Y. Understanding Factors Influencing Shared E-Scooter Usage and Its Impact on Auto Mode Substitution. Transp. Res. Part D Transp. Environ. 2021, 99, 102991. [Google Scholar] [CrossRef] [Scilit]
- Weschke, J.; Oostendorp, R.; Hardinghaus, M. Mode Shift, Motivational Reasons, and Impact on Emissions of Shared E-Scooter Usage. Transp. Res. Part D Transp. Environ. 2022, 112, 103468. [Google Scholar] [CrossRef] [Scilit]
- Zhang, W.; Buehler, R.; Broaddus, A.; Sweeney, T. What Type of Infrastructures Do E-Scooter Riders Prefer? A Route Choice Model. Transp. Res. Part D Transp. Environ. 2021, 94, 102761. [Google Scholar] [CrossRef] [Scilit]
- Moreau, H.; de Jamblinne de Meux, L.; Zeller, V.; D’Ans, P.; Ruwet, C.; Achten, W.M.J. Dockless E-Scooter: A Green Solution for Mobility? Sustainability 2020, 12, 1803. [Google Scholar] [CrossRef] [Scilit]
- Hieu, L.T.; Lim, O.T. Effects of the Structure and Operating Parameters on the Performance of an Electric Scooter. Sustainability 2023, 15, 8976. [Google Scholar] [CrossRef] [Scilit]
- Christoforou, Z.; de Bortoli, A.; Gioldasis, C.; Seidowsky, R. Who Is Using E-Scooters and How? Evidence from Paris. Transp. Res. Part D Transp. Environ. 2021, 92, 102708. [Google Scholar] [CrossRef] [Scilit]
- Chowdhury, M.A.R.; Elseifi, M.A.; Jamil, M.H. User readiness and implementation of shared electric scooters on a university campus: User characteristics, perceptions, challenges, and predictive analysis. J. Transp. Eng. Part A Syst. 2026, 152, 04025144. [Google Scholar] [CrossRef] [Scilit]
- Louisiana State University TransLoc Shuttle System. Available online: https://lsu.transloc.com/routes (accessed on 15 May 2026).
- Cochran, W.G. Sampling Techniques, 3rd ed.; John Wiley & Sons: New York, NY, USA, 1977. [Google Scholar]
- Verma, P.; McKenzie, G. Regional Comparison of Socio-Demographic Variation in Urban E-Scooter Usage. Environ. Plan. B Urban Anal. City Sci. 2024, 51, 1548–1562. [Google Scholar] [CrossRef] [Scilit]

Disclaimer/Publisher’s Note: The statements, opinions and data contained in all publications are solely those of the individual author(s) and contributor(s) and not of MDPI and/or the editor(s). MDPI and/or the editor(s) disclaim responsibility for any injury to people or property resulting from any ideas, methods, instructions or products referred to in the content. |
© 2026 by the authors. Licensee MDPI, Basel, Switzerland. This article is an open access article distributed under the terms and conditions of the Creative Commons Attribution (CC BY) license.