


Abstract
The transformation of transport is necessary not only for climate change mitigation, but also for increasing competitiveness, developing modern technologies in transport, and improving the well-being and quality of life of the population. This article discusses the current state of the transformation of transport and infrastructure to low/zero emission within EU member states and, in particular, their smart cities. This article discusses the challenges, modern technologies, disadvantaged groups and overall concept of transformation with the aim of designing the most effective strategy for transport transformation in the EU, potentially at the smart cities level. The potential relationship between the position of EU member states in the Climate Change Performance Index (CCPI) ranking and different environmental and non-environmental indicators in the EU is identified and analyzed. Regression and ordered logit models are calculated. The results show that only minimum indicators are not correlated, and greenhouse gas emission (GHG), urbanization rate in the EU member state and the ratio of private car ownership to public transport usage have a significant impact on the potential transformation of transportation and a country’s ranking in the CCPI. The odds ratio for urbanization rate is 3.18 (+1 means better ranking 24 times greater) and 4.68 for the ratio of private car ownership to public transport usage (+1 means better ranking 108 times greater). The discussion of the article defines research trends aimed at improving the level of transport transformation and challenges related to successful transformation.
1. Introduction
While transforming transportation and the necessary infrastructure in and outside of cities can contribute to climate change protection, smart city (defined as the cities that utilize modern information systems, their integration, innovation, and collaboration, and learning for future development, with the aim of improving residents’ quality of life, increasing competitiveness, and supporting technological development within a comprehensive urban system) governance often overlooks key environmental and technological considerations. European Union (EU) leaders, businesses and ordinary citizens agree that the transformation of transport is one of the biggest changes that is absolutely necessary. However, the long-term neglect of this issue is evident in the differences in the views of people and businesses on smart transport in cities. Although the European Green Deal (EGD) is supposed to be environmentally friendly, more accessible and sustainable transport, these ideals are often not fulfilled. With a few exceptions (see e.g., [1,2]), only a limited number of large-scale studies and surveys have been conducted on the perception of the need for a more sustainable transport transformation for citizens. In a systematic analysis, EU authorities [1,2] found that the willingness to make a change in transport depends on the approach of the leadership of individual member states and city governments. More progressive and proactive states have a higher level of need and willingness of citizens and companies to change compared with states that are not proactive, which do not promote change in transport and do not provide information to citizens. Given the absence of channels for expressing passive dissatisfaction (which is typical of non-proactive and non-progressive states), it is difficult for government entities, if they exist at all, to monitor, evaluate and improve the functioning of smart transport in cities. In essence, this issue represents a fundamental environmental issue in a democratic society that needs to be addressed accordingly.
EU policy has been concerned with sustainability since the first publication of the Brundtland Report in 1987 [3]. Research and policy have generally focused primarily on economic sustainability, but not on technological, environmental and social sustainability [4,5,6,7,8,9]. This discrepancy is also evident in the development of smart transport in cities, where technological, environmental and social aspects have not yet been sufficiently explored. Economic development, not only in transport, has received much attention in recent decades, while environmental and technological aspects have not. More than 94% of all studies on smart cities are devoted to economic or social aspects [10], while only less than 6% of studies deal with environmental aspects, and almost no research is devoted to technological aspects [10].
With the necessity of changes in the field of environmental protection and climate change mitigation, including the EGD, the need to monitor and investigate the sustainable, low-emission and technological transformation of transport in cities is one of the key aspects of success. Given the research and development of new technologies, it is essential for cities and society as a whole to monitor governing bodies with a legal mandate and take responsibility for the successful implementation of this progress [9].
The development of sustainable transport infrastructure and modern transport is influenced by the technological sophistication of a given state, its attitude towards environmental protection and climate change mitigation, but also by the social status of its inhabitants [11,12,13,14]. While technological sophistication is defined by the types of vehicles used, fuels and the necessary infrastructure, the level of the environment is assessed on the basis of immissions and emissions [11,12]. Social inequality is the most elusive variable, as it is characterized by social exclusion and marginalization of disadvantaged groups. Both of these indicators are very difficult to measure. Social exclusion is influenced by several factors, such as lack of resources and services, insufficient or zero social capital or externalities in the neighborhood [15,16].
The issue of sustainable transport is so urgent, given the hard data, that it is also addressed in the EGD. Greenhouse gas emissions (GHGs) from transport in the EU reached 794 metric tons (Mt) of carbon dioxide (CO2) in 2023 [17]. For 2024, the estimate is 800 MtCO2. When looking at individual transport sectors, the most polluting type of transport is international aviation, which has increased by 230% compared with 1990 (base year). GHG emissions from road transport in 2023 were at 122% of 1990 levels (the EGD plan is to reach 100% by 2030—that is, the same level of GHG emissions as in 1990—and to continue reducing these emissions). Rail transport is currently the least polluting mode of transport, with GHG emissions in 2023 at 26% of 1990 levels. Norway and Sweden are currently leading the way in the adoption of electric vehicles, thanks to high adoption rates, strong government policies and incentives [18]. In the context of sustainable transportation, it is also necessary to build the appropriate infrastructure. In 2024, there were 1 million public charging points available (a 35% increase compared with 2023) [19]. A total of 61% of EU charging points are located in three countries: the Netherlands, Germany and France. The target by 2030 is 2.6 million additional charging points. Leaders in electromobility (Sweden and Norway) do not have as many public charging points because most charging points are private (at homes and businesses). In the context of sustainable transportation, attention is now also being paid to food transportation. For example, a study by Lee and Stoeltje [20] aims to more accurately estimate food miles and related CO2 emissions. The results indicate total annual food miles of 2,719,898 kt-km and CO2 emissions of 274 kt.
While the concept and solution of transforming transport to be lower emission and sustainable lacks consensus and clarity, as the solution depends on individual member states [1,21,22], there is a large group of scientists who agree on the need to develop and transform transport, especially in cities, with an effort to transform cities if they are not yet transformed into smart cities [23,24,25]. Smart city platform architects often promise to improve urban life through innovative technologies with the aim of creating an efficient and fulfilling life for all groups of citizens and businesses [14]. However, this goal usually fails due to a misunderstanding of the smart city concept, different expectations of citizens and businesses and a failure to connect technologies into a functional whole. For the transformation process in smart cities to be effective, it is necessary to understand the sustainability and climate change mitigation initiative, its goals and the transport technologies that can achieve these goals. Another necessary and indispensable factor is the human factor. It is necessary to include the adaptation of governments, citizens and businesses to the changes. The smart cities initiative is important because it has been demonstrated [26] that smart city policies promote sustainable and low-carbon urban development by increasing the level of technological innovation in cities, modernizing the construction of smart infrastructure and optimizing the quality of smart management and services.
From the perspective of the successful implementation of low-emission smart transport in smart cities, the participation of citizens and businesses is a vital aspect of civic, democratic and sustainable societies [27], and it is necessary that people living in smart cities fully use all the possibilities offered by modern technologies, have access to information and be a part of decision-making processes in cities.
The issue of transport in smart cities has received a lot of attention in recent years, not only because of EGD [2,28,29,30]. Several key policy documents are represented by the EU, e.g., Sustainable and Smart Mobility Strategy or New EU Urban Mobility Framework [21,22]. The successful implementation of public private partnership (PPP) is studied in different aspects these days by scholars [29,30]. Transport in smart cities is so complex that it goes beyond the area of so-called Industry 4.0 and smart transport, but it is necessary to develop it into Industry 5.0 with the inclusion of human, sustainability and environmental actors [3]. Smart elements in transport are already visible today; for example, Reddy et al. [28] in their research use intelligent elements for pedestrian crossings based on detection algorithms and real-time data.
Paper Objectives
This article assesses the current progress of the transition to low-emission and zero-emission transport within individual EU member states, with a focus on the regional level (if the regional datasets are available). This article analyzes the relationship between the level of transport transformation in the EU and the performance of individual member states. This article systematically assesses the challenges of transforming transport and infrastructure in smart cities, highlights the opportunities of new technologies, justifies the importance and relevance of managing these digitalization processes and outlines potential directions for future research in transport management in smart cities that would ensure improved sustainable and low-emission transport for all citizens and businesses without social exclusion. The transformation of transport, infrastructure and technologies is a key factor of competitive advantage for smart cities, enabling them to effectively respond to the needs of sustainable low-emission transport for all.
2. Background of Climate Change Mitigation in the EU and Transport Transformation
Although the potential of modern transport technologies in the fight against climate change seems enormous, the availability of this technology is paramount. Currently, almost 100% of the EU population has access to electricity, but 10% of the population is in energy poverty (e.g., they cannot heat their homes in winter or use electrical appliances), and 5% of the working-age population (16–74) has never used the Internet. This situation varies from region to region [31], e.g., almost all residents of the Nordic countries use the Internet, while almost 14% of Croatia’s population did not have access to the Internet in 2024 (data for 2025 is not yet available). This inequality is also evident in other countries, such as Greece, Portugal and Bulgaria. In the EU, light goods vehicles (LGVs) are 83% diesel and 14% partially sustainable fuel (compressed natural gas—CNG, liquefied petroleum gas—LPG, liquefied natural gas—LNG, full electric and hybrid) [2]. Not everyone can therefore fully enjoy all the benefits offered by the transformation of transport into modern, sustainable and low-emission transport; there are still significant differences between countries and within countries in terms of access to information and communication technologies (ICT), modern transport technologies, infrastructure and their use. At the same time, there are huge differences in the potential for transport electrification between developed and developing countries and megacities [32].
Some groups of people also have greater difficulty accessing not only ICT but also transportation than other groups, which is reflected in technological gaps related to gender, geographic location and income. EU research [33] has found that a quarter of EU residents of working age have only basic education. The term “technology gap” or “technology capital value” [34] is commonly used to describe inequalities in access to and/or use of technology between households, regions, and countries. This issue has been discussed since the 1990s. The term is often used in academic articles and transnational discussions on differences in access to technology, highlighting the uneven distribution of technology, its resources, and skills among different populations [35]. The most frequently mentioned differences are those between the first and second levels, with the first level concerning access to the technology in question, which in the context of low-emission transport means access to sustainable and low-emission transport vehicles—cars, planes and trains, but also public transport. The second level concerns the skills, participation and effectiveness of users in handling transport technologies, such as electric cars in combination with smartphones, e.g., for navigation to the nearest available parking space at the destination. Gender inequality related to information, communication and transport technologies is a significant challenge, not only in developing countries [36]. The gender–technology gap is defined as unequal access to and use of ICT and transport technologies between the genders. Among other things, this inequality results in the exclusion of women from education [37]. Women in the EU who have a Master’s degree mainly study education, arts and humanities, social sciences, journalism and information [38]. The consequences of technological exclusion are further exacerbated by the fact that education is perceived in the EU as a fundamental requirement for personal fulfilment, social engagement, political representation and employment opportunities [3]. Given that technological skills are essential for both the professional and academic spheres (the share of female professors in the EU was 29% in 2022, with the vast majority of female professors teaching behaviural sciences, humanities, other or law studies [39]), any systematic inequality in these skills becomes a question of social sustainability—a problem that also affects developing countries [9].
Reducing commuting and promoting alternative low-emission vehicles are currently considered key factors in climate change mitigation [40]. The key transport documents in the EU (Sustainable and Smart Mobility Strategy and New EU Urban Mobility Framework) outline specific measures and proposals for achieving the EGD’s objectives. These include, e.g., promoting low-emission transport to work (in case the “home office” is not possible), integrating AI into urban smart systems and establishing a functional charging infrastructure for alternative-fuel vehicles [21,22]. The possibility of working from home (“home office”) is limited by the nature of employees’ work. According to research [41], only 10% of employees can work from home, and only part-time, not every day. The greatest boom in working from home has been seen in the public sector, where administrative staff were forced to work remotely during the COVID-19 pandemic. This trend in administration continues today.
When focusing on the regional level (smart cities), specific challenges and differences in approaches to transport transformation among individual member states become apparent. The link between climate justice and smart cities is unclear [42], and further research, particularly in the area of smart cities in relation to digital equity and sustainability, is needed. The aim of the study [42] is to highlight the impact of technological gaps on climate justice within smart city societies, including transport in smart cities. Addressing these gaps is important for several reasons: First, in order to create sustainable, low-emission transport in a smart city that is accessible to all, it is essential to clarify the various constraints that citizens and businesses face when travelling in a smart city environment. Second, planning and designing infrastructure and transport in smart cities is not feasible without overcoming these specific constraints within a smart city society. Third, it is essential to address issues related to disadvantaged residents of smart cities; otherwise, the transformation of transport will lead to greater social exclusion of this group of residents [43,44]. Fourth, the limitations and transformations of citizens’ transport and technological capabilities often have consequences within the entire smart city. The actions of residents are conditioned by social, political and economic conditions and resources. Opportunities, in this case technological, are available to the private sector in the position of a producer and to public administration in the position of a creator of legal norms, conditions and subsidy programs for these technologies. For these reasons, the public administration’s approach to the given issue is key for society.
Although it is difficult to assess the environmental impact of transport and transport infrastructure at the city level, it is often argued that they have key value for climate change mitigation [29,44,45,46]. For example, modern transport technologies and the Internet of Things can help reduce GHGs by reducing energy consumption by replacing resource-intensive activities, such as travel to conferences with virtual means, or by streamlining existing services [47]. Energy savings through to transport technologies and infrastructure and ICT in smart cities have been demonstrated, for example, in the synergy and energy distribution of the transport system in smart cities [48], in energy savings from buildings used to operate nearby infrastructure [49] or by creating an intelligent transport system that focuses only on city trips and saves per km energy, finance and nature [50].
Assessing the full impact and potential of ICT and modern technologies in transport and infrastructure in the development of smart cities remains a challenge and is likely to remain so in the future, as new technologies based on artificial intelligence (AI), for example, are emerging, leading to relatively high electricity consumption [22,51].
In conclusion, it is important to mention that some residents and companies do not want to use modern, sustainable and low-emission transport and infrastructure. The reasons vary, but most often they include a negative attitude towards modern technologies, fear of information collection by modern technologies, or nostalgia for the use of existing technologies [52,53,54,55].
2.1. Technological Divides
Differences in technological skills, known as the digital divide, have far-reaching implications for the entire EU. This phenomenon is caused by a combination of the constant use of cognitive abilities (e.g., memory, critical thinking, decision-making), which decline with age, and the technological level of the country [56,57,58,59]. Smartphones and their applications, cars with automatic transmission and other mother vehicles currently improve human cognitive functions, but physical abilities decline with age [60,61].
The boom in modern technologies and infrastructure, not only in transport, brings with it technological challenges to which consumers respond with a delay. Young people, who are flexible and experiencing cognitive growth are the quickest to develop new skills, while the older generation lags behind in adopting new technologies and infrastructure for many reasons. The most common reasons are fear of new technology, loss of skills, cognitive decline and the need for constant updating. For these reasons, there is an increase in the number of people who find it difficult to use new technologies or refuse to use them altogether [9].
The transition to climate-friendly transport in Europe has been agreed upon as part of EGD, but individual member states are approaching this issue individually. In the EU, a large-scale study conducted in 2024 [62] found that renewable sources account for 12% of total transport. There is huge variation between member states, with Croatia having less than 1% renewable energy in transport and Greece having 4%, while in Sweden, renewable energy accounts for 40%.
2.2. Approach of EU Member States
Transport emissions represent around 25% of the EU’s total GHG. The emissions increased every year; the regulation is necessary. This is the reason why one of the key parts of EGD is transport. EGD priority is sustainable and environmental transport. The EGD proposals cover all modes of transport, whether they be passenger or freight. The main goal in the field of transport is to become a climate-neutral continent by 2050. Given that in some areas modern low-emission transport accounts for less than 1% (e.g., Croatia [62]), a major transformation will be necessary. This should be achieved by reducing transport emissions by 90% compared with current levels. To reach this goal, it is important to let people know that some countries are so progressive that they will be able to hit this target way earlier (like Sweden and Finland [62]). The area that European cities can influence is road transport. The high-speed railway is being planned at the national and EU levels (e.g., EU NUTS regions), but it will have an impact on transportation in the affected smart cities. According to the EGD, by 2035, emissions from cars must be reduced by 55% and from vans by 50%, and from 2035 onwards, new cars must be fully emission-free (i.e., they must be electric or hydrogen-powered using currently available technologies) [63]. In order to achieve this change, it is necessary to prioritize the construction of infrastructure for this type of transport. Individual cities and regions can only create this within their administrative territory. Outside the above-mentioned administrative units, this issue is the responsibility of the state and its administration. In 2024, low-emission vehicles accounted for 12% of all vehicles in the EU [62]. According to EU research, the infrastructure for charging these vehicles, the speed of charging and the inability of apartment dwellers to charge their vehicles in parking spaces in front of their homes appear to be problematic. This trend, i.e., not buying a car with an alternative drive system due to its charging, especially among people living in apartments, is already evident from a study from 2024 [1], which confirmed that the vast majority of owners of alternative fuel vehicles own their own homes, where they charge their cars.
As mentioned above, 12% of alternative sources were used in transport in 2024. There are significant differences between countries; for example, the Czech Republic had a 6% share of energy from renewable sources used in transport in 2024, while Sweden had 35% [62]. Detailed information is provided in Table 1. It is necessary to mention the methodology used to determine the monitored values; CO2 monitoring is usually the most commonly used indicator. Road transport accounts for 77% of CO2 emissions from transport in the EU. Nitrogen dioxide (NO2), particulate matter 10 (PM10) emissions and carbon monoxide (CO) concentrations are also monitored [2]. In connection with EGD, the Climate Change Performance Index (CCPI) ranking is often mentioned [64]. The CCPI is an international country rating system that includes several indicators used to assess a country’s approach to climate protection. The indicators cover renewable energy, emissions, energy use, and climate policy. Not only are current indicators evaluated, but also the ability of countries to adapt to low-emission and zero-emission processes, technological innovation and integration into the everyday lives of citizens.
Table 1.
Share of energy from renewable sources used in transport by country. Source: own research, modified according to [62].
3. Data and Methods
To investigate the relationship between a country’s level of transport and infrastructure transformation and its position in the CCPI ranking, this study used data from the CCPI ranking for EU member states and the Transport and Environment Indicators for 2023 (most actual available dataset distributed via the European Environment Agency (EEA) [65]) calculated by the EU [66].
Effective governance ensures that all processes are consistently integrated and aligned with the overall EGD objectives. By implementing effective management decisions, EU member states can create a more conducive environment for transformation, helping to improve the satisfaction of residents and businesses, reduce the level of fear and misinformation about alternative vehicle propulsion and encourage active participation in the transport transformation process. In this way, properly managing the transport transformation not only increases the efficiency of transport and its infrastructure but also contributes to its sustainability and competitiveness in the long term, and potentially ensures a higher ranking in the CCPI ranking.
This study adopted a mixed methodological approach, combining empirical and theoretical analyses, with the aim of providing a comprehensive assessment of the impact of the level of transport transformation in the EU on the environmental performance of individual EU member states and their position in international rankings, which present the perceived level of transport innovation and the level of environmental protection of a given unit on the international stage.
The empirical analysis included correlation analysis and an ordered logit model to identify statistically significant correlations between the level of transformation in a country’s transport (measured by the EEA’s Transport and Environment indicators) and the countries’ position in the CCPI ranking. The following indicators were used to assess the level of transformation of the country: GHG (% consisting of GHG per capita and GHG 2030 target, 2023); renewable energy (% of total energy consumption, 2023); alternative vehicle propulsion (% of total passenger transport, 2023); and CO2 (% emissions from production in the EU economy, 2023). Furthermore, population size was included in the analysis as a control factor to assess how demographic aspects could influence the level of transformation of a country’s transport and infrastructure to low emission [67]. Rankings do not imply equal intervals between countries, which limits the interpretation of linear regression coefficients. An ordered logit model is also estimated to obtain more robust results. The indicators examined in the ordered logit model were population (2023), gross domestic product (GDP) per capita (2023), vehicle ownership (% of population who owns vehicles, 2023), public transport mode share (% of population using public transport, 2023), renewable energy generation share (% of total energy consumption, 2023), fuel prices (% of average change of fuel prices against previous year, 2023), government subsidy levels (% of public expends on subsidy programs, 2023), alternative vehicle propulsion (% of total passenger transport, 2023) and urbanization rate (% of population living in urbanized areas, 2023).
Data for this study was collected from the latest available sources to analyze the relationship between the level of transport transformation in the EU and the performance of individual member states. Specifically, the study uses the CCPI 2023 index, which provides insights into GHG, renewable energy and alternative vehicle propulsion. In addition, data on transport and environment were obtained from the EEA, focusing on the latest rankings of EU member states in the areas of transport and environmental protection. These datasets allow a comprehensive assessment of how transformation indicators correlate with the ranking of EU member states and their environmental status.
4. Results and Discussion
The regression analysis showed that the position of EU member states in the CCPI ranking is significantly related to certain EEA transport and environmental indicators, in particular the use of alternative fuels and CO2 emissions. These indicators have a significant impact on the transformation rate of EU member states, but the coefficient of determination (adjusted R-squared) of the regression analysis showed that these factors only explain part of the differences in the transformation rate, while other important factors such as proactive government action, quality of research and subsidy programs for residents may also be significant.
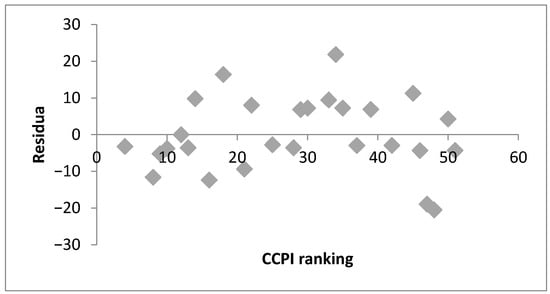
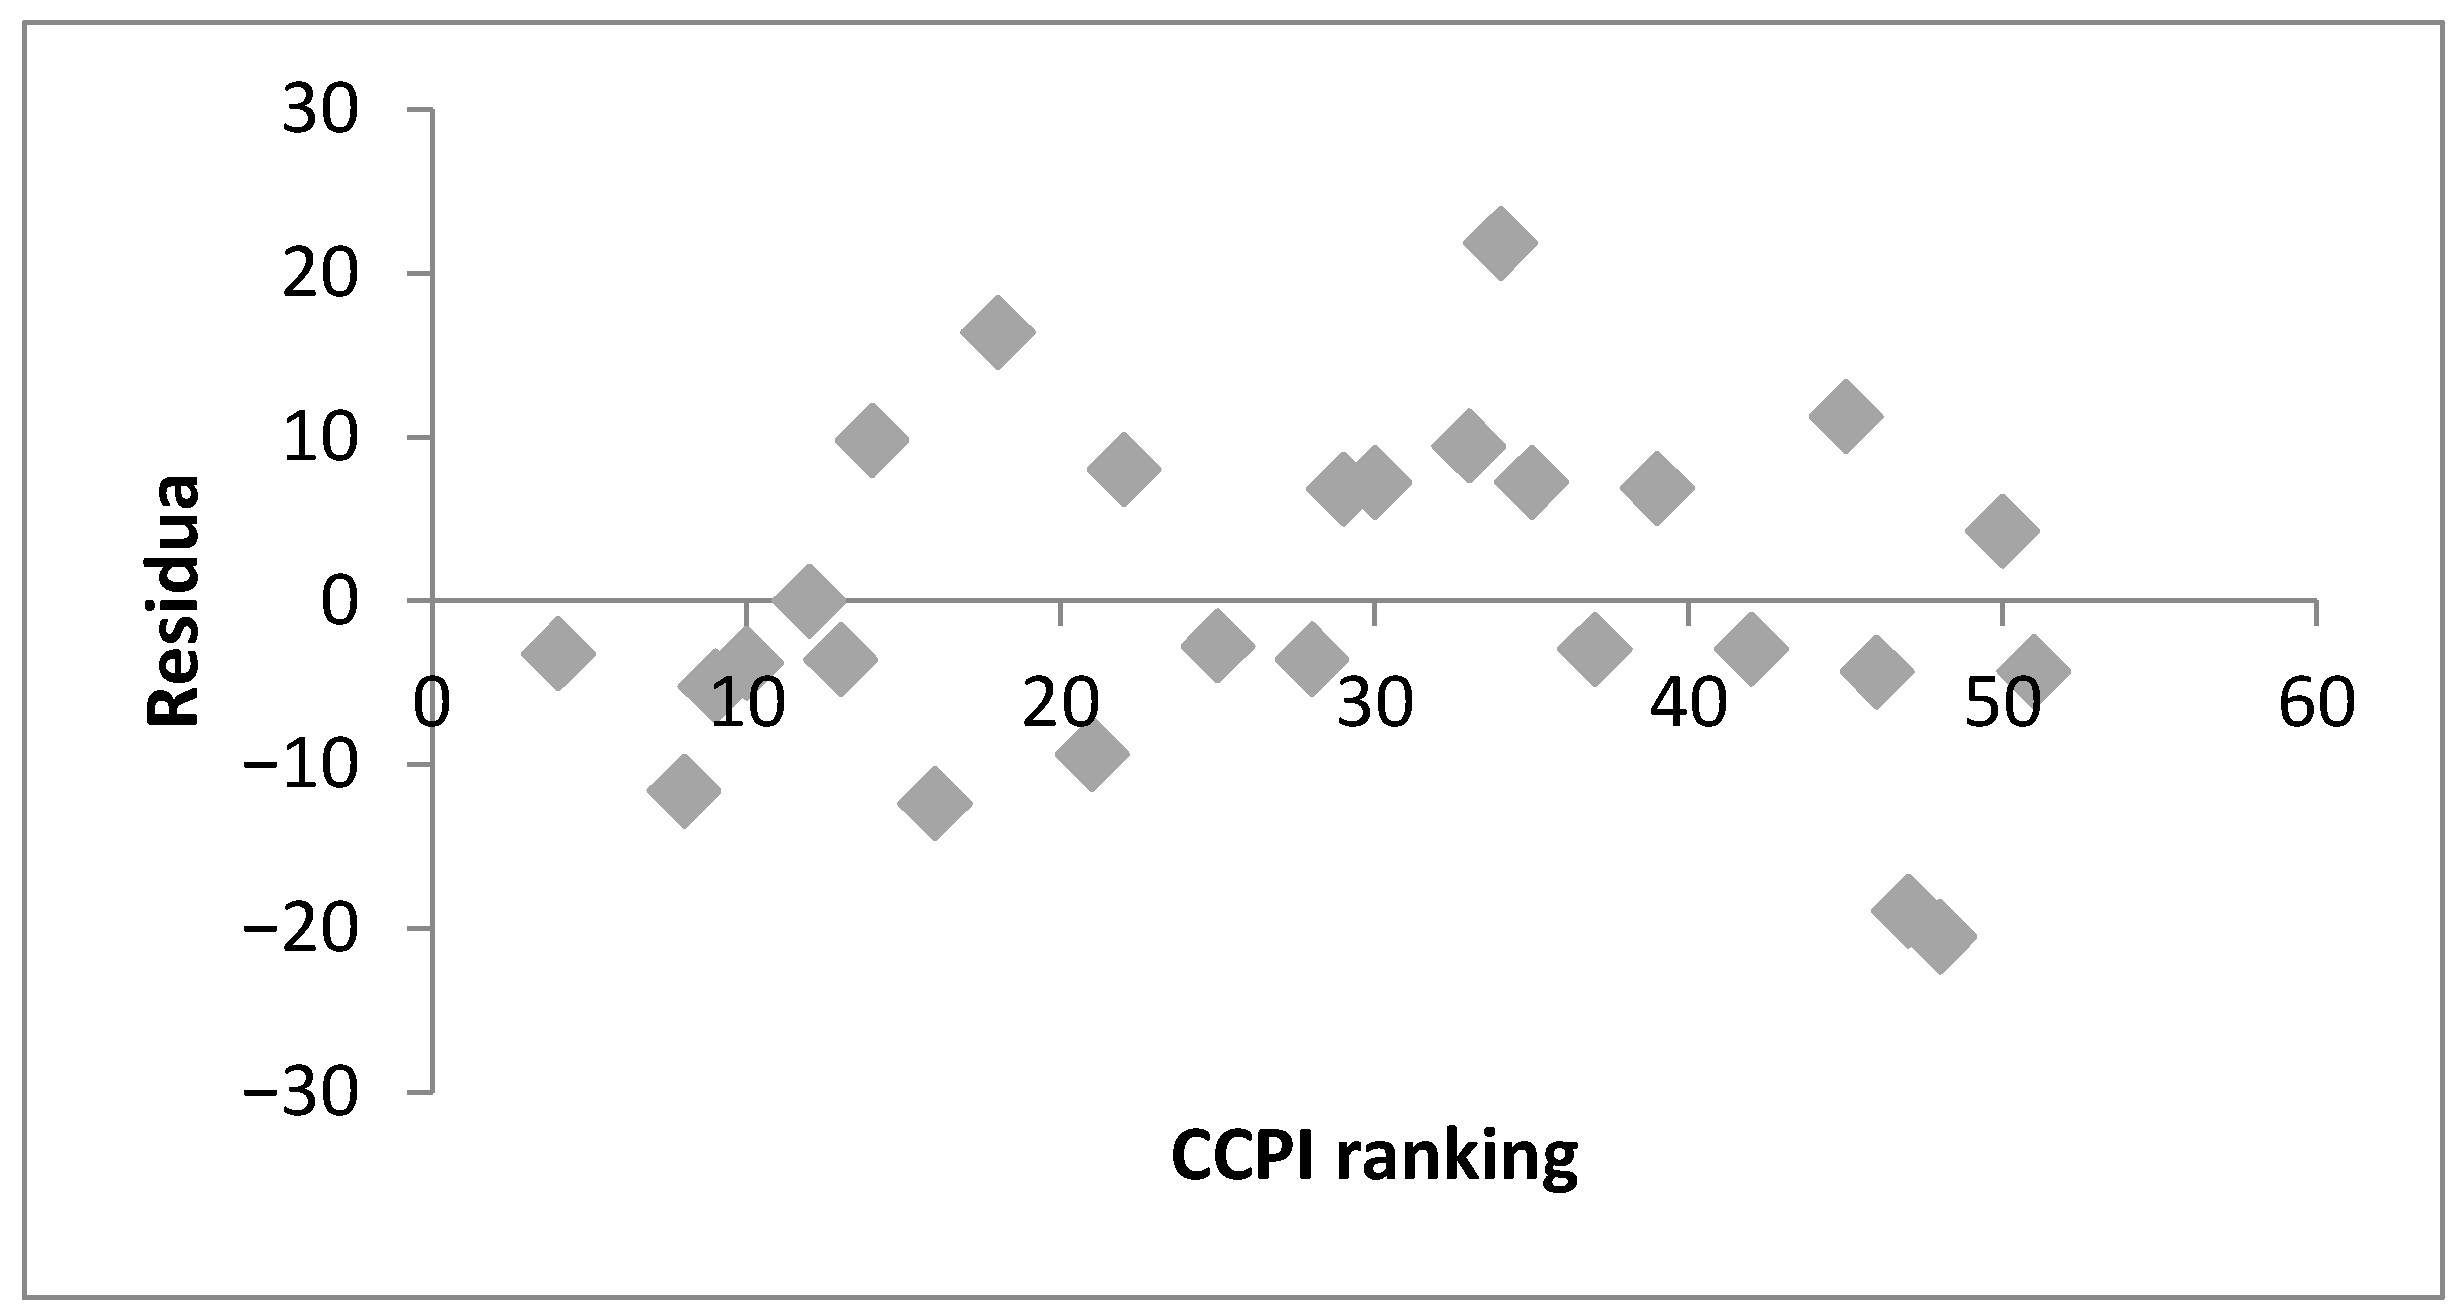
The results of the study were presented in figures (see Figure 1) and tables (see Table 2, Table 3, Table 4 and Table 5), which visually display the results of the correlation and regression analysis, as well as a brief summary of the data. These data show that the positions of EU member states in international rankings are closely related to the level of EU transport and infrastructure transformation. This suggests that investments in infrastructure transformation and technological accessibility are important for strengthening the competitiveness of individual member states and for ensuring an improvement in the state of the environment in a global context.
Figure 1.
Residual plot of CCPI ranking. Source: Compiled by author.
Table 2.
Correlation analysis results no. 1. Compiled by author.
Table 3.
Correlation analysis results no. 2. Compiled by author.
Table 4.
Summary of the results of the ordered logit model. Compiled by author.
Table 5.
Summary of the results of the regression analysis and ordered logit model. Compiled by author.
The multicollinearity check reveals a high correlation between CO2 and population (r = 0.94) and moderate correlations between the CCPI and GHG (r = 0.66) and between the CCPI and renewable energy (r = 0.54). The values of the variance inflation factor (VIF) indicate multicollinearity between CO2 (VIF = 10) and population (VIF = 10.08). The residual plots (example in Figure 1) show heteroscedasticity and outliers; as a result, the model underestimates the mean and overestimates the outliers. Since the adjusted R-squared value of 0.430 is not entirely low, the position of EU member states in the CCPI ranking depends on other factors that were not included in this analysis. Therefore, an ordered logit model was also estimated. After performing the regression analysis, the following results were obtained.
The ordered logit model (Table 4) contains variables: b0 = intercept (base without influence), b1 = urbanization rate, b2 = alternative vehicle propulsion, b3 = natural logarithm of government subsidy levels divided by GDP per capita and b4 = natural logarithm of vehicle ownership divided by public transport mode share. The other indicators proposed above could not be used due to high correlation and heteroscedasticity.
The results show that coefficients b1 and b4 have a strong positive effect on the model. The impact of these indicators is also evident in the last row of the table, where their p-values are statistically significant at the 95% confidence level (b1 = 2.08% and b4 = 4.98%). The coefficients mentioned above were converted into odds ratios, which indicate the probability of a given event occurring (in this case, an improvement in the CCPI ranking). The odds ratio for b1 is 3.18, which means that if variable b1 increases by 1, the chances of a better ranking are 24 times greater. For variable b4, the odds ratio is 4.68, which means that if variable b4 increases by 1, the chances of a better ranking are 108 times greater. The model results clearly show that variables b1 and b4 are significant, as they substantially increase the probability of the observed event (i.e., an improvement in the CCPI ranking), while the other variables have no statistically significant effect. A summary of the results from the regression analysis and ordered logit model is provided in Table 5.
Based on the research results, it was found that the position of EU member states in the CCPI ranking is related to the EU transport and environmental indices. The position in the CCPI ranking can be predicted based on the GHG indicator, urbanization rate and ratio of vehicle ownership divided by public transport mode share. These indicators have a moderate impact on the ranking of EU member states. Managing the transformation processes of transport and infrastructure to reduce emissions is therefore a relevant and important research direction that affects environmental protection in the global assessment system. Flexible management allows member states to adapt to constantly evolving technologies and ensures that individual member states cooperate to achieve a common goal: the “European Green Deal”. The views of scientists on managing the transformation of transport and infrastructure highlight different but interrelated aspects.
A key part of transport transformation is understanding the transport behavior of citizens and businesses, to which public authorities should then respond proactively so that the shift to low-emission transport is desired and positively perceived by society. EU research [1] has found that the average distance traveled by an active person (aged 15–84) is 34.8 km per day. As a rule, the average resident makes more than two trips per day. Only 10% of journeys are made by public transport and 18% on foot (usually within 2 km).
Proactive EU countries have noticed this trend and supported the transition to low-emission transport, public transport and walking or cycling (in some cities also in the form of bike sharing). Sweden is a typical leader in climate change mitigation in the EU. In addition to transforming its means of transport, it also pays great attention to the infrastructure itself. In 2025, Sweden reduced its emissions by 66% compared with 2010 [68]. Swedish public transport is completely emission-free [56]. In the field of passenger and freight transport, the road network is currently being transformed into the eRoadArland system, which charges electric vehicles directly while driving. Sweden wants to be fully climate neutral by 2045. Helsinki is expected to be climate neutral much sooner, given the rapid development of technology and support from public authorities. Sweden prides itself on keeping its citizens informed and involved in the smart cities concept, including partial decision-making in various areas. Thanks to this approach, citizens are more receptive to change and more proactive in their actions. Environmental protection is part of their identity; they perceive it as a necessity and are informed about it in all aspects of life, which is why they are quick to accept the transformation of transport with the aim of climate change mitigation.
At the opposite end of the EEA [62] ranking are Croatia, Lithuania and Greece. According to the European Commission [18], the factors common to the above-mentioned countries that are slowing down the transformation of transport are high purchase prices, lower purchasing power, insufficient charging infrastructure, lack of or weak government incentives, preference for used gasoline and diesel cars and high electricity prices. The strongest factor, although not perceived as such by the public, is the unresponsive approach of the government and public administration to the transformation of transport and infrastructure to low emission. In the countries mentioned above, the government provides little or no information to citizens about the need for change in transportation, climate change mitigation and the benefits that alternative transportation will bring. Incentives, subsidy programs, electricity price reductions and other mechanisms that could help with the transformation of transport are minimal or non-existent. Citizens, who generally do not have sufficient financial resources, therefore do not see the possibility of purchasing an alternative vehicle, or they see the cost of such a vehicle as too high in relation to the benefits for citizens.
4.1. Application of Low-Emission Transport in EU SMART Cities
Digital inequalities, i.e., denying access to technology to disadvantaged groups, make it difficult to navigate smart cities and pose a challenge for all smart city groups [9]. This orientation also includes the process of moving effectively through the urban landscape with the help of digital tools (e.g., individuals can use a comprehensive smart city system to access public transportation schedules, find real-time transportation information, or locate nearby healthcare services through mobile technology [9]).
From the perspective of transport sustainability and climate change mitigation, not only in cities, the task of balancing differences and achieving social justice in smart cities involves creating conditions that motivate all citizens of a given city to actively change, support and participate. Otherwise, the prefix “smart” before the name of cities loses any meaningful purpose [9].
The transformation of transport and infrastructure to low-emission modes often requires not only a proactive approach by the state, but also by individual smart cities (this applies in particular to areas with progressive city leadership and the involvement of citizens and businesses in decision-making in various areas within the smart city). A typical representative of this group is the city of Ostrava in the Czech Republic (approx. 300,000 inhabitants, 65% share of sustainable transport—the total percentage of public transportation, walking and cycling; carbon reduction performance—55% (Ostrava has high rate of heavy industry)). Although the Czech Republic ranks fourth worst in the EU in terms of the transition to low-emission transport, Ostrava is one of Europe’s leaders in low-emission public transport linked to the smart city concept (e.g., the option to pay fares by payment card directly at terminals in vehicles or navigation via the transport company’s app [69]. Ostrava is also expanding the electrification and development of tram transport to other areas of the city, has a very strong charging network for electric cars, as well as several charging stations for hydrogen cars. Using the municipal authority app, it is also possible to find the nearest parking space in the destination area.
Sweden is currently a leader in sustainable transport and the creation of infrastructure in smart cities for alternative propulsion systems. The capital city of Stockholm (980,000 inhabitants, 75% share of sustainable, carbon reduction performance—80%) is the most progressive. Swedish public transport there is almost completely emission-free and will be fully emission-free by 2030 [56]. In the area of passenger and freight transport, a wider network of electrified roads is being built, which will recharge electric vehicles while driving (eRoadArlanda). As a rule, this is the right-hand lane on these roads. From 2025, only fully electric or gas-powered vehicles will be allowed to drive in the city center [70]. With the introduction of this measure, there has been a massive increase in the number of cycle paths and charging stations for alternative fuels in the city center. Stockholm is now investing in the Stockholm Local Transition (STOLT) urban project, which is building zero-emission microcars that will be used by ordinary citizens for travel around the city [71].
In addition to shared bicycles, shared electric scooters are currently among the modern, fast, and low-emission modes of transport in smart cities. However, not all residents can use these modes of transport. For disadvantaged groups, such as people without smartphones who cannot unlock a scooter or bike, or mothers with children in strollers, this type of transport is impossible.
Studies [72,73] agree that the key aspect of the successful transformation of transport to low-emission transport in European smart cities is functional legislation and proactive behavior on the part of city leaders. In the case of the top five cleanest cities in the EU (in 2024—Stockholm, Amsterdam, Vienna, Berlin and Helsinki), this mainly involves the introduction of zones in wider city centers that only low-emission cars can enter, the development of smart applications to help ordinary citizens get around the city, the development of cycle paths in city centers and transportation for disadvantaged groups of residents in city centers. In this case, disadvantaged residents include not only those with health and mental disabilities, but also those who are economically and socially disadvantaged (e.g., mothers with small children who cannot use bicycles for transportation). In these cases, smart cities are developing their own means of zero-emission transport (outside of traditional public transport). These include shared cars (usually electric cars), autonomous cars, or zero-emission microcars, such as those being developed in Stockholm.
4.2. Limitation of the Models
Several limitations should be considered when interpreting the results of the regression and ordered logit model. First, the issue of multicollinearity is present in the model. Some explanatory variables (notably CO2 and population) exhibit high VIF values, indicating strong correlations among predictors. This can lead to unstable coefficient estimates and reduces the reliability of individual variable interpretations. Second, the model includes variables that are statistically insignificant, as indicated by high p-values. This suggests that certain predictors may not have a meaningful impact on the dependent variable and could introduce noise into the model rather than explanatory power. Third, the model may suffer from omitted variable bias, as not all relevant factors influencing the dependent variable are necessarily included. Missing important variables can distort the estimated relationships and lead to biased coefficients. Another limitation is the assumption of a linear relationship between the dependent and independent variables. In reality, relationships may be nonlinear or more complex, which the current model does not capture. The ordered logit model was chosen for solving this problem. Measurement errors, limited sample size (only 27—EU member states), or lack of representativeness may reduce the generalizability of the findings. Overall, while the model provides useful insights, these limitations should be taken into account when interpreting the results and drawing conclusions.
4.3. Challenges of Transformation of Transport and Infrastructure
Transport transformation is such a complex issue that it must be viewed in context and at various levels of governance. First, it is necessary to define the key areas that need to be addressed at the EU and the member state level (Table 6) and, at the same time or subsequently, after the successful implementation of the relevant challenges, it is necessary to address local/regional challenges at the smart cities level (Table 7).
Table 6.
Challenges of transformation of transport and infrastructure to low/zero-emission and direction for future research. Compiled by author.
Table 7.
Challenges of transformation of transport and infrastructure to low/zero-emission at the regional level (smart cities). Compiled by author.
The following table, which evaluates the opinions of academics, scholars and the results obtained from research, presents the challenges associated with the transformation of transport and directions for further research (see Table 6).
Ensuring the transformation of transport and infrastructure to a low-emission one is one of the key challenges and priorities of the EGD. In this context, the quality of transport does not only relate to climate change mitigation, but also to the competitiveness of EU member states, energy efficiency and sustainable transport management in EU member states. Transport transformation affects quality through several interconnected dimensions: enabling more sustainable and low-emission travel, increasing the availability and diversity of public transport and supporting innovative technologies that reduce emissions but are affordable. Moreover, quality is closely linked to the technological competences of residents and businesses, the adaptability of legal norms and the strategic integration of technologies into transport processes. Successful management of transport transformation must therefore ensure that technological tools are not implemented in isolation, but rather are aligned with transport objectives and supported by systemic institutional changes. This integrated approach is essential to achieving improvements in transport quality in a technologically evolving environment.
Studies conducted in other European and global contexts reveal similar patterns and confirm the importance of transport transformation for improving environmental performance and strengthening EU competitiveness. For example, Tromaras et al. [74] emphasized that European transport must be optimized by 2035; without adopting the necessary transformations, including low-emission transport and infrastructure development, the EU will be uncompetitive according to the authors, and the resulting emissions from transport will cause an acceleration of global warming. Similarly, Pyra [75] emphasized that the decarbonization process of the road transport sector is necessary for EU member states not only for the EGD, but also for competitiveness and the inclusion of innovations and new technologies in the transport sector. In his research, he focuses on simulating the decarbonization process for Poland. These findings are consistent with this study, where indicators such as GHG and partly CO2 showed a significant correlation with the position of EU member states in the CCPI ranking.
Furthermore, Ortega et al. [76] and Amadori et al. [77] argue that countries with strong digital policies and transport transformation investments outperform others in terms of competitiveness, research, innovation and international cooperation. This supports the conclusion that transport transformation is not just a local challenge, but also a global strategic imperative for efficient and sustainable transport.
In order to effectively manage the transformation of transport processes, it is essential to further explore the related issues and opportunities at the regional level (smart cities). These studies will not only help to optimize the transport transformation processes, but also ensure that the transport system in the EU is ready to face the current challenges and opportunities. Only by thoroughly analyzing the management aspects can the successful transformation of transport and infrastructure through technology and innovation be achieved.
In the area of regional transport, especially in smart cities, different aspects are necessary than at the national level, since it is precisely in smart cities and their surroundings that the actual transformation of transport and infrastructure will take place, while at the EU and member state level, only framework measures are being implemented. The challenges of transforming transport to low-emission or zero-emission modes are listed in Table 7.
Transport in smart cities and their surroundings should be one of the priorities not only for city authorities, but also for national and EU governments, as without transport transformation, there will be a permanent decline in quality of life, worsening of air quality and greater climate change in a shorter time frame. At the same time, it is important to realize that transport not only affects the environment, but also the competitiveness of the economy and technological progress, which is why the transformation of transport should be carried out quickly, efficiently and functionally across the EU as a whole, and not just in certain countries.
5. Conclusions
The article examines the current state of the transformation of transportation and infrastructure toward low-carbon and carbon-neutral solutions in EU member states, particularly in their smart cities. Using regression analysis and an ordered logit model, it was found that GHG emissions, the degree of urbanization, and the ratio of car ownership to public transport use have a key influence on a city’s ranking in the CCPI. The ordered logit model is not commonly used in research focused on the transformation of transportation in the EU; however, the value of this model—particularly when combined with other methods such as regression analysis—lies in the depth and coherence of the findings. Thanks to these findings, it is possible to better understand the factors influencing the transition to low-emission transport, including the success of their implementation. At the same time, it is possible to develop concrete proposals that will lead to successful implementation at both the national and regional levels. From a policy perspective, the findings highlight the importance of focusing on key measures leading to low-emission transport.
Funding
This research received no external funding.
Institutional Review Board Statement
Not applicable.
Informed Consent Statement
Not applicable.
Data Availability Statement
The data presented in this study are openly available in Eurostat at https://www.eea.europa.eu/en/analysis/indicators/use-of-renewable-energy-for (accessed 28 December 2025).
Acknowledgments
The author wishes to thank the University of Pardubice for the support of this article.
Conflicts of Interest
The author declares no conflicts of interest.
Abbreviations
The following abbreviations are used in this manuscript:
| EU | European Union |
| EGD | European Green Deal |
| PPP | Public private partnership |
| ICT | Information and communication technologies |
| LGVs | Light goods vehicles |
| CNG | Compressed natural gas |
| LPG | Liquefied petroleum gas |
| LNG | Liquefied natural gas |
| CO2 | Carbon dioxide |
| NO2 | Nitrogen dioxide |
| PM10 | Particulate matter 10 |
| CO | Carbon monoxide |
| CCPI | Climate Change Performance Index |
| EEA | European Environment Agency |
| GHG | Greenhouse gas emission |
| GDP | Gross domestic product |
| VIF | Variance inflation factor |
| Mt | Metric tons |
References
- European Union. Study on New Mobility Patterns in European Cities: Final Report. Task A, EU Wide Passenger Mobility Survey. 2025. Available online: https://transport.ec.europa.eu/system/files/2022-12/2022%20New%20Mobility%20Patterns%20in%20European%20Cities%20Task%20A%20Executive%20summary.pdf (accessed on 30 December 2025).
- European Union. Study on New Mobility Patterns in European Cities: Final Report. Task B, Targeted Survey on Urban Logistics. 2025. Available online: https://transport.ec.europa.eu/system/files/2022-12/2022%20New%20Mobility%20Patterns%20in%20European%20Cities%20Task%20B%20Executive%20summary.pdf (accessed on 30 December 2025).
- Åhman, H. Social Sustainability—Society at the Intersection of Development and Maintenance. Local Environ. 2013, 18, 1153–1166. [Google Scholar] [CrossRef] [Scilit]
- Boström, M. A Missing Pillar? Challenges in Theorizing and Practicing Social Sustainability: Introduction to the Special Issue. Sustain. Sci. Pract. Policy 2012, 8, 3–14. [Google Scholar] [CrossRef] [Scilit]
- Colantonio, A. Urban Social Sustainability Themes and Assessment Methods. Proc. Inst. Civ. Eng. Urban Des. Plan. 2010, 163, 79–88. [Google Scholar] [CrossRef] [Scilit]
- Cuthill, M. Strengthening the ‘Social’ in Sustainable Development: Developing a Conceptual Framework for Social Sustainability in a Rapid Urban Growth Region in Australia. Sustain. Dev. 2010, 18, 362–373. [Google Scholar] [CrossRef] [Scilit]
- Nilipour, A. Introduction to Social Sustainability. In Social Sustainability in the Global Wine Industry: Concepts and Cases; Forbes, S.L., De Silva, T.-A., Gilinsky, A., Jr., Eds.; Springer International Publishing: Cham, Switzerland, 2020; pp. 1–14. ISBN 978-3-030-30413-3. [Google Scholar] [CrossRef] [Scilit]
- Vallance, S.; Perkins, H.C.; Dixon, J.E. What Is Social Sustainability? A Clarification of Concepts. Geoforum 2011, 42, 342–348. [Google Scholar] [CrossRef] [Scilit]
- Colding, J.; Nilsson, C.; Sjoberg, S. Smart Cities for All? Bridging Digital Divides for Socially Sustainable and Inclusive Cities. Smart Cities 2024, 7, 1044–1059. [Google Scholar] [CrossRef] [Scilit]
- Chen, T.; Ramon Gil-Garcia, J.; Gasco-Hernandez, M. Understanding Social Sustainability for Smart Cities: The Importance of Inclusion, Equity, and Citizen Participation as Both Inputs and Long-Term Outcomes. J. Smart Cities Soc. 2022, 1, 135–148. [Google Scholar] [CrossRef] [Scilit]
- Steininger, K.W.; Posch, A.; Thaller, A.; Romirer, C.; Maier, R.; Flei, E.; Ja, G.; Nabernegg, S.; Plakolb, S.; Heinfellner, H.; et al. Knowledge integration in policy development and assessment for sustainable passenger transport transformation. Transp. Res. Part D Transp. Environ. 2024, 128, 104081. [Google Scholar] [CrossRef] [Scilit]
- Tsakalidis, A.; Gkoumas, K.; Pekar, F. Digital Transformation Supporting Transport Decarbonisation: Technological Developments in EU-Funded Research and Innovation. Sustainability 2020, 12, 3762. [Google Scholar] [CrossRef] [Scilit]
- Nilsson, C.; Levin, T.; Colding, J.; Sjöberg, S.; Barthel, S. Navigating Complexity with the Four Pillars of Social Sustainability. Sustain. Dev. 2024, 32, 5929–5947. [Google Scholar] [CrossRef] [Scilit]
- Pasolini, G.; Buratti, C.; Feltrin, L.; Zabini, F.; De Castro, C.; Verdone, R.; Andrisano, O. Smart City Pilot Projects Using LoRa and IEEE802.15.4 Technologies. Sensors 2018, 18, 1118. [Google Scholar] [CrossRef] [Scilit] [PubMed]
- McKenzie, K.B.; Scheurich, J.J. Equity Traps: A Useful Construct for Preparing Principals to Lead Schools That Are Successful With Racially Diverse Students. Educ. Adm. Q. 2004, 40, 601–632. [Google Scholar] [CrossRef] [Scilit]
- Dempsey, N.; Bramley, G.; Power, S.; Brown, C. The Social Dimension of Sustainable Development: Defining Urban Social Sustainability. Sustain. Dev. 2011, 19, 289–300. [Google Scholar] [CrossRef] [Scilit]
- European Environmental Agency. Greenhouse Gas Emissions from Transport in Europe. 2025. Available online: https://www.eea.europa.eu/en/analysis/indicators/greenhouse-gas-emissions-from-transport (accessed on 24 April 2026).
- European Commission. Regional Insights into Electric Vehicle Adoption Across Europe: New Data from Eurostat. 2024. Available online: https://alternative-fuels-observatory.ec.europa.eu/general-information/news/regional-insights-electric-vehicle-adoption-across-europe-new-data (accessed on 24 April 2026).
- European Institute of Innovation and Technology. Boosting Electric Vehicles Charging Infrastructure Network in Europe. 2025. Available online: https://www.eit.europa.eu/news-events/news/boosting-electric-vehicles-charging-infrastructure-network-europe (accessed on 24 April 2026).
- Lee, E.H.; Stoeltje, G. How far does your food travel on the highway? Food miles and carbon footprint. J. Clean. Prod. 2025, 518, 145915. [Google Scholar] [CrossRef] [Scilit]
- European Commission. Sustainable & Smart Mobility. 2024. Available online: https://transport.ec.europa.eu/transport-themes/eu-mobility-transport-achievements-2019-2024/sustainable-smart-mobility_en (accessed on 24 April 2026).
- European Commission. Communication from the Commission to the European Parliament, the Council, the European Economic and Social Committee and the Committee of the Regions. 2021. Available online: https://transport.ec.europa.eu/system/files/2021-12/com_2021_811_the-new-eu-urban-mobility.pdf (accessed on 24 April 2026).
- Puzio, E.; Drozdz, W.; Kolon, M. The Role of Intelligent Transport Systems and Smart Technologies in Urban Traffic Management in Polish Smart Cities. Energies 2025, 18, 2580. [Google Scholar] [CrossRef] [Scilit]
- Mehta, V.; Mapp, G.; Gandhi, V. The Investigation of Queuing Models to Calculate Journey Times to Develop an Intelligent Transport System for Smart Cities. Future Internet 2025, 17, 302. [Google Scholar] [CrossRef] [Scilit]
- Venes, H.; Rosa Rde, A.; Siman, R.R. The Impacts of Municipal Solid Waste Collection and Transport Technologies in Smart Cities: Trends and Challenges. Int. J. Environ. Sustain. Dev. 2025, 24, 163–200. [Google Scholar] [CrossRef] [Scilit]
- Cheng, Z.; Wang, L.; Zhang, Y. Does smart city policy promote urban green and low-carbon development? J. Clean. Prod. 2022, 371, 134780. [Google Scholar] [CrossRef] [Scilit]
- Rashidfarokhi, A.; Yrjänä, L.; Wallenius, M.; Toivonen, S.; Ekroos, A.; Viitanen, K. Social Sustainability Tool for Assessing Land Use Planning Processes. Eur. Plan. Stud. 2018, 26, 1269–1296. [Google Scholar] [CrossRef] [Scilit]
- Reddy, K.H.K.; Singh, R.K.B.; Ray, T.G. An Intelligent Edge-AI Assisted Smart Pedestrian Crossings Framework for Smart Transport System of Smart Cities. In 2025 IEEE International Conference on Advanced Visual and Signal-Based Systems, AVSS; IEEE Conference on Advanced Video and Signal Based Surveillance-AVSS; IEEE: New York, NY, USA, 2025. [Google Scholar] [CrossRef] [Scilit]
- Gunawan, I.; Tiep, N.; Hallo, L. Public-Private Partnerships (PPPs) for Smart Transport Infrastructure Development: A Promising Approach and Potential Risks. In Proceedings of the 8th International Conference on Sustainable Urban Development, ICSUD 2022; Ha, V.T., Nguyen, H.N., Linke, H.J., Eds.; Advances in 21st Century Human Settlements; Springer Pte Ltd.: Singapore, 2024; pp. 19–36. [Google Scholar] [CrossRef] [Scilit]
- Hoang, L.N.; Tiep, N.; Anh, T.N. Public-Private Partnership Models for Smart Transport Infrastructure Development. In Proceedings of the 8th International Conference on Sustainable Urban Development, ICSUD 2022; Ha, V.T., Nguyen, H.N., Linke, H.J., Eds.; Advances in 21st Century Human Settlements; Springer Pte Ltd.: Singapore, 2024; pp. 37–50. [Google Scholar] [CrossRef] [Scilit]
- Eurostat. Individuals Who Have Never Used the Internet. 2026. Available online: https://ec.europa.eu/eurostat/databrowser/view/tin00093/default/table?lang=en (accessed on 13 February 2026).
- Fan, J.-L.; Wang, J.-X.; Li, F.; Yu, H.; Zhang, X. Energy Demand and Greenhouse Gas Emissions of Urban Passenger Transport in the Internet Era: A Case Study of Beijing. J. Clean. Prod. 2017, 165, 177–189. [Google Scholar] [CrossRef] [Scilit]
- Eurostat. Educational Attainment Statistics. 2026. Available online: https://ec.europa.eu/eurostat/statistics-explained/index.php?title=Educational_attainment_statistics (accessed on 13 February 2026).
- Carlson, A.; Isaacs, A.M. Technological Capital: An Alternative to the Digital Divide. J. Appl. Commun. Res. 2018, 46, 243–265. [Google Scholar] [CrossRef] [Scilit]
- Comim, F.; Qizilbash, M.; Alkire, S. The Capability Approach: Concepts, Measures and Applications; Cambridge University Press: Cambridge, UK, 2008; ISBN 978-1-139-46986-9. [Google Scholar]
- Acilar, A.; Sæbø, Ø. Towards Understanding the Gender Digital Divide: A Systematic Literature Review. Glob. Knowl. Mem. Commun. 2021, 72, 233–249. [Google Scholar] [CrossRef] [Scilit]
- Cooper, J. The Digital Divide: The Special Case of Gender. J. Comput. Assist. Learn. 2006, 22, 320–334. [Google Scholar] [CrossRef] [Scilit]
- Eurostat. In Focus: Women in Master’s and Ph.D. Studies in the EU. 2025. Available online: https://ec.europa.eu/eurostat/web/products-eurostat-news/w/edn-20250303-2 (accessed on 13 February 2026).
- Rathenau Instituut. Share of Female Professors, in the Netherlands and EU Countries. 2025. Available online: https://www.rathenau.nl/en/science-figures/personnel/women-science/share-female-professors-netherlands-and-eu-countries (accessed on 13 February 2026).
- Colding, J.; Barthel, S.; Ljung, R.; Eriksson, F.; Sjöberg, S. Urban Commons and Collective Action to Address Climate Change. Soc. Incl. 2022, 10, 103–114. [Google Scholar] [CrossRef] [Scilit]
- Seo, J. Deriving Comparable Energy Consumption Factors for Battery Electric and Internal Combustion Engine Vehicles Using Propulsion and Braking Phase Analysis. Int. J. Automot. Technol. 2025, 27, 803–817. [Google Scholar] [CrossRef] [Scilit]
- Rose, E.; Witten, K.; MccCreanor, T. Transport Related Social Exclusion in New Zealand: Evidence and Challenges. Kotuitui 2009, 4, 191–203. [Google Scholar] [CrossRef] [Scilit]
- Hildebrand, M. Urban Mobility in a Social Justice Approach: An invitation to an Alternative Perspective. Rev. INVI 2021, 36, 20–53. [Google Scholar] [CrossRef] [Scilit]
- Wang, X.; Valenzuela, E.A.; You, C.; Nguyen, V.-T.-V.; Sun, L.; Miranda-Moreno, L.F. The Future of Urban Cycling: A Predictive Framework for Climate Change. Transp. Res. Part D Transp. Environ. 2025, 143, 104722. [Google Scholar] [CrossRef] [Scilit]
- Grundel, I.; Trygg, K. Transformative Planning Capacities in the Transformative Change of Mobility Systems. Raumforsch. Raumordn. 2025, 83, 493–505. [Google Scholar] [CrossRef] [Scilit]
- Mahadevia, D.; Mukhopadhyay, C.; Lathia, S.; Gounder, K. The Role of Urban Transport in Delivering Sustainable Development Goal 11: Learning from Two Indian Cities. Heliyon 2023, 9, e19453. [Google Scholar] [CrossRef] [Scilit]
- Coroamă, V.C.; Bergmark, P.; Höjer, M.; Malmodin, J. A Methodology for Assessing the Environmental Effects Induced by ICT Services: Part I: Single Services. In Proceedings of the 7th International Conference on ICT for Sustainability, Bristol, UK, 21–26 June 2020; Association for Computing Machinery: New York, NY, USA, 2020; pp. 36–45. [Google Scholar] [CrossRef] [Scilit]
- Calvillo, C.F.; Sanchez-Miralles, A.; Villar, J. Synergies of Electric Urban Transport Systems and Distributed Energy Resources in Smart Cities. IEEE Trans. Intell. Transp. Syst. 2018, 19, 2445–2453. [Google Scholar] [CrossRef] [Scilit]
- Wang, S.J.; Moriarty, P. Energy Savings from Smart Cities: A Critical Analysis. In Innovative Solutions for Energy Transitions; Yan, J., Yang, H.X., Li, H., Chen, X., Eds.; Energy Procedia; Elsevier Science Bv: Amsterdam, The Netherlands, 2019; Volume 158, pp. 3271–3276. [Google Scholar] [CrossRef] [Scilit]
- Chen, Y.; Ardila-Gomez, A.; Frame, G. Achieving Energy Savings by Intelligent Transportation Systems Investments in the Context of Smart Cities. Transp. Res. Part D Transp. Environ. 2017, 54, 381–396. [Google Scholar] [CrossRef] [Scilit]
- Fast, S.; McLeman, R. Attitudes Towards New Renewable Energy Technologies in the Eastern Ontario Highlands. J. Rural Community Dev. 2012, 7, 106–122. [Google Scholar]
- Breder, M.S.; Hofmann, A.; Bucksteeg, M.; Weber, C. Economic Analysis of Behavioral Aspects of Electromobility with a Focus on Consumers—A Review. Energy Strategy Rev. 2025, 62, 101953. [Google Scholar] [CrossRef] [Scilit]
- Quezada, C.R.; Vecchio, G.; Waintrub, N. Women’s attitudes towards electromobility. Rev. Urban. 2024, 51, 75881. [Google Scholar] [CrossRef] [Scilit]
- Kehagia, F.; Karagiotas, I.; Giotaki, S. Evaluating Preferences towards Electromobility in Greece. Future Transp. 2024, 4, 856–873. [Google Scholar] [CrossRef] [Scilit]
- Smart City Sweden. Public Transport. 2025. Available online: https://smartcitysweden.com/focus-areas/mobility/public-transport/ (accessed on 27 December 2025).
- Lapa, T.; Martinho, T.; Reis, C. First and Second-Level Digital Divides and Cultural Capital: Framing Digital Lives of Seniors in Portugal and Europe. In Human Aspects of IT for the Aged Population, ITAP 2023, Pt II; Gao, Q., Zhou, J., Eds.; Lecture Notes in Computer Science; Springer International Publishing AG: Cham, Switzerland, 2023; Volume 14043, pp. 489–504. [Google Scholar] [CrossRef] [Scilit]
- Schmoelz, A.; Geppert, C.; Schwarz, S.; Svecnik, E.; Koch, J.; Bieg, T.; Freund, L. Assessing the Second-Level Digital Divide in Austria: A Representative Study on Demographic Differences in Digital Competences. Digit. Educ. Rev. 2023, 44, 61–75. [Google Scholar] [CrossRef] [Scilit]
- Mishra, S.; Smoreda, Z.; Fiore, M. Second-Level Digital Divide: A Longitudinal Study of Mobile Traffic Consumption Imbalance in France. In Proceedings of the ACM Web Conference 2022 (WWW’22); Assoc Computing Machinery: New York, NY, USA, 2022; pp. 2532–2540. [Google Scholar] [CrossRef] [Scilit]
- Vicente, M.R.; Alvarez-Rodriguez, C.; Suarez-Alvarez, A. An Old Familiar Song? Assessing the Artificial Intelligence Divide among the Regions of the European Union and Its Connections with Digital Divides. Telecommun. Policy 2025, 49, 103030. [Google Scholar] [CrossRef] [Scilit]
- Cao, J.; Zhou, Z.; Zhou, J. Older Adults’ Disorientation in Smartphones: Exploring the Role of Spatial Ability and Quantifying Cognitive Similarity Between Perceived and Physical Information Structure. Int. J. Hum.-Comput. Interact. 2025, 41, 10980–10995. [Google Scholar] [CrossRef] [Scilit]
- Coni, A.; Van Ancum, J.M.; Bergquist, R.; Mikolaizak, A.S.; Mellone, S.; Chiari, L.; Maier, A.B.; Pijnappels, M. Comparison of Standard Clinical and Instrumented Physical Performance Tests in Discriminating Functional Status of High-Functioning People Aged 61–70 Years Old. Sensors 2019, 19, 449. [Google Scholar] [CrossRef] [Scilit]
- European Environment Agency. Use of Renewable Energy for Transport in Europe. 2025. Available online: https://www.eea.europa.eu/en/analysis/indicators/use-of-renewable-energy-for (accessed on 27 December 2025).
- European Commission. Delivering the European Green Deal. 2025. Available online: https://commission.europa.eu/topics/climate-action/delivering-european-green-deal_en (accessed on 27 December 2025).
- Climate Change Performance Index. European Union—Climate Performance Ranking. 2025. Available online: https://ccpi.org/country/eu/ (accessed on 26 December 2025).
- European Environment Agency. EEA Greenhouse Gases—Data Viewer. 2025. Available online: https://www.eea.europa.eu/en/analysis/maps-and-charts/greenhouse-gases-viewer-data-viewers (accessed on 28 December 2025).
- Eurostat. Emissions of Greenhouse Gases and Air Pollutants. 2025. Available online: https://ec.europa.eu/eurostat/web/environment/information-data/emissions-greenhouse-gases-air-pollutants (accessed on 28 December 2025).
- Eurostat. Demography of Europe—2023 Edition. 2025. Available online: https://ec.europa.eu/eurostat/web/interactive-publications/demography-2023 (accessed on 28 December 2025).
- 2030 Sekretariatet. Green Mobility—Can Sweden Take the Lead? 2020. Available online: https://www.2030sekretariatet.se/greening-mobility-can-sweden-take-the-lead/ (accessed on 27 December 2025).
- Dopravní Podnik Ostrava. 2025. Available online: https://www.dpo.cz/ (accessed on 26 December 2025).
- Stockholm. Stockholm—Zóna s Nulovými Emisemi. 2025. Available online: https://urbanaccessregulations.eu/countries-mainmenu-147/sweden-mainmenu-248/stockholm-zero-emission-zone (accessed on 25 February 2026).
- Closer. Stockholm Invests in Small, Emission-Free Light Electric Vehicles—Another Step Towards the Clean Air Zone. Available online: https://closer.lindholmen.se/en/news/stockholm-invests-small-emission-free-light-electric-vehicles-another-step-towards-clean-air (accessed on 25 February 2026).
- Smart City Expo World Congress. The Top European Cities with the Greenest Transportation. 2024. Available online: https://www.smartcityexpo.com/the-top-european-cities-with-the-greenest-transportation/ (accessed on 25 February 2026).
- Kowalska-Pyzalska, A. Perspectives of Development of Low Emission Zones in Poland: A Short Review. Front. Energy Res. 2022, 10, 898391. [Google Scholar] [CrossRef] [Scilit]
- Tromaras, A.; Aggelakakis, A.; Hoppe, M.; Trachsel, T.; Anoyrkati, E. Future Technologies in the EU Transport Sector and Beyond: An Outlook of 2020–2035. In Data Analytics: Paving the Way to Sustainable Urban Mobility; Springer International Publishing AG: Berlin/Heidelberg, Germany, 2019; Volume 879, pp. 722–729. [Google Scholar] [CrossRef] [Scilit]
- Pyra, M. Simulation of the Progress of the Decarbonization Process in Poland’s Road Transport Sector. Energies 2023, 16, 4635. [Google Scholar] [CrossRef] [Scilit]
- Ortega, A.; Gkoumas, K.; Tsakalidis, A.; Pekar, F. Low-Emission Alternative Energy for Transport in the EU: State of Play of Research and Innovation. Energies 2021, 14, 7764. [Google Scholar] [CrossRef] [Scilit]
- Amadori, K.; Jouannet, C.; Zhao, X. Towards Zero-Emission in Air Transportation in Scandinavia. In Proceedings of the AIAA SCITECH 2023 Forum, AIAA 2023, Orlando, FA, USA, 23–27 January 2023. [Google Scholar] [CrossRef] [Scilit]

Disclaimer/Publisher’s Note: The statements, opinions and data contained in all publications are solely those of the individual author(s) and contributor(s) and not of MDPI and/or the editor(s). MDPI and/or the editor(s) disclaim responsibility for any injury to people or property resulting from any ideas, methods, instructions or products referred to in the content. |
© 2026 by the author. Licensee MDPI, Basel, Switzerland. This article is an open access article distributed under the terms and conditions of the Creative Commons Attribution (CC BY) license.