


Abstract
Global greenhouse gas emissions must be reduced to meet the targets of the Paris Climate Accords. This study quantifies the potential energy cost savings of a holistic disposition approach for mixed-electrified heavy-duty truck fleets. Electrifying heavy-duty trucks reduces energy costs compared to traditional diesel-powered baselines. On-site energy generation further decreases electrification expenses. Bidirectional vehicle-to-grid participation also contributes to lowering energy costs. A mixed-integer linear programming optimization algorithm has been developed to incorporate these three approaches into the fleet’s disposition decisions. Real-world data have been utilized, including commercial order datasets, diesel prices, on-site-generated electrical energy prices, and vehicle-to-grid prices. Cost savings start at an average of 17% for small fleets with limited electrification and unfavorable price scenarios. However, they can reach net revenue generation for large fleets with high electrification and favorable price scenarios. A daily surplus of fleet energy costs can be achieved, with vehicle-to-grid revenues surpassing the costs of energy consumed. Ensuring battery electric heavy-duty trucks are available during high-revenue periods and operating during low-revenue times can lower overall fleet energy costs for commercial operators and improve power grid stability. By turning energy costs into net surpluses, this approach provides a financial incentive that could accelerate the transition to greenhouse-gas-neutral transport.
1. Introduction
Road freight transport accounts for 6% of global greenhouse gas emissions [1]. In some countries, such as Germany, these emissions can reach as high as 22% [1,2]. Battery-electric heavy-duty trucks (BE-HDTs) are chosen by the Paris Climate Accords to further decarbonize this sector [3]. They exhibit high energy efficiencies and the absence of operating emissions compared to their widespread counterparts, internal-combustion-engine heavy-duty trucks (ICE-HDTs). However, their adoption in the logistics chain lags behind the set goals [3,4,5]. The high acquisition costs of BE-HDTs, which are two to three times those of comparable ICE-HDTs, are the main reason for the low market penetration and the slow market ramp-up [6]. To compensate for these high initial costs, an approach is to minimize the operating costs of the vehicles. A key novelty of BE-HDTs is the vehicle-to-grid (V2G) technology, which can generate revenue while the BE-HDT is connected to the power grid via a bidirectional charging station. This offers benefits such as grid stabilization, peak load shaving, and additional revenue streams [7,8,9]. These V2G use cases, in combination with the high idle times of heavy-duty trucks (HDTs) at the freight forwarder’s home depot, provide a promising lever to lower the operating costs of fleet operators [10]. At the same time, this increases the availability of responsive energy storage and sources in the public power grid. This is crucial for grid operators to integrate emerging, yet highly volatile, renewable energy sources to decarbonize the global energy sector. To maximize the potential of the BE-HDT idle times, their fleet disposition must consider this new optimizing parameter. The disposition—sometimes also called dispatch—refers hereby to the strategic process of allocating a truck to a logistics order at a specific time. Another phenomenon to consider is that the market ramp-up of BE-HDTs within existing ICE-HDT fleets is resulting in a period of mixed-electrified HDT fleets, until all fleets have transitioned to fully electrified BE-HDT fleets.
1.1. Research Gap and Objectives
Early research on fleet disposition primarily addressed internal-combustion-engine vehicle (ICEV) fleets, where the degrees of freedom are limited due to the maturity of technologies and fewer energy-related variables. These studies often framed disposition as variants of the “Vehicle Routing Problem” (VRP) or assignment problem (AP). This emphasizes fuel costs, driver disposition, and route optimization. For instance, Golden et al. [11] introduced foundational heuristics for the capacitated VRP. This influenced subsequent ICEV fleet disposition models by incorporating real-time adjustments for dynamic orders. Similarly, Savelsbergh and Sol [12] developed exact methods for the “Pickup and Delivery Problem with Time Windows” (PDP-TW). They are applicable to freight forwarding, where trucks are assigned to orders while minimizing travel distance and idle times. More recent ICEV-specific work has incorporated stochastic elements. Pillac et al. [13] reviewed dynamic VRP variants for large-scale fleets, proposing metaheuristics to handle uncertainties like traffic or order variations in ICE-HDT operations. In the context of commercial trucking, Taillard et al. [14] presented tabu search algorithms for heterogeneous fleet VRPs, optimizing disposition in ICEV fleets based on cost and capacity. These approaches, while robust, do not account for electrification-related complexities or bidirectional energy flows, limiting their applicability to modern fleets.
The advent of battery electric vehicles (BEV) introduced new constraints, including limited range, charging times, and energy consumption variability, prompting a shift toward specialized disposition models. Much of this work employs mixed-integer linear programming (MILP) to balance driving and charging schedules. Betz et al. [15] proposed an MILP-based disposition algorithm for pure BEV fleets, optimizing depot-based charging to minimize energy costs. Similarly, Sassi et al. [16] developed an MILP framework for light-duty BEV fleet disposition, focusing on range anxiety and charger availability. Zou et al. [17] extended this to HDT with an MILP model for fleet disposition under time-of-use electricity pricing, ensuring vehicles are dispatched only when sufficiently charged. Abid et al. [18] introduced a dynamic programming approach for BEV fleet disposition, incorporating real-time energy monitoring but without mixed-fleet considerations. Peng et al. [19] and Wang et al. [20] further refined MILP techniques for BE-HDT routing, emphasizing energy-efficient path planning and depot charging optimization. These studies demonstrate effective handling of electrification challenges but assume homogeneous BEV fleets and unidirectional charging. Hence, they are overlooking the complexity of BEV integration in a mixed-electrified fleet and V2G use-case revenues. Additional contributions include Lin et al. [21], who formulated the “Electric Vehicle Scheduling Problem” (EVSP) as an MILP to assign trips while managing battery state-of-charge (SoC). And Pelletier et al. [22], who reviewed goods distribution with BEV, highlighted MILP’s role in disposition for urban freight but noted scalability issues for large BEV fleets.
As fleets transition gradually, mixed-electrified fleets—comprising both ICE-HDTs and BE-HDTs—have become a focal point, requiring algorithms that differentiate vehicle types in disposition decisions. Goeke and Schneider [23] introduced the “Electric Vehicle Routing Problem with Time Windows and Mixed Fleet” (E-VRP-TWMF), an MILP-based model that optimizes routing and assignment for heterogeneous fleets, accounting for energy consumption differences but excluding V2G. Schneider et al. [24] extended this with adaptive large neighborhood search heuristics for practical implementation in mixed HDT operations. Dönmez et al. [25] proposed a branch-and-price algorithm for the mixed-fleet VRP, focusing on cost minimization in freight transport with partial electrification. Hiermann et al. [26] developed a similar MILP framework for the “Electric Fleet Size and Mix VRP with Time Windows” (E-FSMVRP-TW). He determined optimal fleet composition and disposition for mixed BEV and ICEV. These works advance mixed-fleet disposition but generally ignore V2G, treating BE-HDTs as passive consumers rather than active grid participants.
V2G technology, enabling local and public energy grid integration via bidirectional charging capabilities, adds a revenue dimension to disposition by allowing idle BE-HDTs to provide grid services like energy redistribution or frequency regulation. However, integration into disposition models remains nascent, especially for HDTs. Sortomme and El-Sharkawi [27] pioneered MILP-based optimal bidding for BEV aggregators in V2G markets, focusing on fleet-level energy disposition but not routing. Han et al. [28] proposed a game-theoretic approach for V2G scheduling in parking lots, treating fleets as dispatchable resources for grid balancing.
Hence, a gap persists in the literature: no state-of-the-art algorithm comprehensively addresses the disposition of commercial mixed-electrified HDT fleets while simultaneously considering the integration of V2G revenue potential offered by bidirectional charging technologies and using locally on-site produced energy. This research aims to address this gap by proposing an analysis of a new disposition approach that combines mixed-electrified HDT fleets and V2G revenues. Recorded data from a German freight forwarder will be used to improve practical transferability and applicability. The goal is to reduce energy costs and thereby lower the overall operating costs for commercial fleet operators. This increase in the economic rentability of electrified HDTs can lead to two indirect effects: Firstly, accelerating the electrification of the transport sector, hence reducing its share of global greenhouse gas emissions. And secondly, supporting the integration of emerging volatile renewable energies by providing necessary stabilizing capabilities in the public power grid.
1.2. Structure of This Work
This work is structured as follows: Section 2 introduces the methodology for the potential analysis, including the optimization approach and the developed disposition model. Section 3 presents the results using three categories: First, a scenario analysis demonstrating the key aspects of the novel approach by analyzing its effects using the fleet’s disposition schedule and cost composition. Second, a parameter sensitivity analysis will be conducted to investigate the impact of the main disposition parameters on the fleet’s energy costs. Finally, the monetary potential of the techno-economic analysis is quantified, and the state-of-the-art is compared with this novel disposition approach. In conclusion, Section 4 summarizes the key findings and implications.
2. Methods
This section provides a detailed description of the methodology used for this HDT fleet disposition optimization potential analysis. The fundamental model concept is shown in Section 2.1, the assumptions and simplifications made within the model are described in Section 2.2, and the single sub-modules are explained in Section 2.3.
2.1. Model Concept
The simplified overall model concept is shown in Figure 1. The model consists of three input datasets, the main disposition algorithm, and three output datasets.
Figure 1.
Concept overview of the mixed-electrified HDT fleet disposition optimization model using bidirectional V2G integration with the used input datasets of real-world disposition data (a1), HDT energy costs (a2), HDT technical parameter (a3), the disposition optimization algorithm with price and year scenario generation (b1), HDT cost parameter calculation from the HDT energy costs and technical parameter datasets (b2), final HDT energy cost function (b3), trip dataset generation from the real-world disposition dataset (b4), Gurobi MILP optimizer (b5), HDT fleet generation from the HDT technical parameter dataset (b6), all model assumptions (b7), optimization problem variables and constraints (b8), and the generated output datasets with the optimal fleet disposition (c1) and the energy cost composition of this optimal fleet (c2).
The overall concept is the following: The trip dataset generation sub-module (b4) generates trips from the recorded disposition dataset of a German freight forwarder (a1). This dataset was obtained during the SPIRIT-E research project and will be published separately. The HDT cost parameter sub-module (b2) normalizes the HDT energy costs dataset (a2). This dataset covers the period from 2025 to 2045. It comprises yearly costs for public HDT diesel and on-site generated electrical power used for the driving energy of the HDT fleet, as well as hourly prices for V2G services (b2). The developed cost function for BE- and ICE-HDT (b3) uses the previously calculated cost parameters as an input. The HDT fleet technical parameter dataset (a3) is used for the mixed-electrified HDT fleet generation sub-module (b6), which can generate a fictitious or an imitation of an existing HDT fleet. The scenario generation sub-module (b1), using the same former generated HDT cost parameters (b2), generates the scenarios to be investigated. The specific scenarios used in this work are described in Section 2.2. As a result, the daily disposition schedule for the fleet (c1) is generated, along with the corresponding fleet’s energy cost composition (c2), comprising diesel costs, electricity costs, and V2G revenue shares, for one operating day.
This Python-based (version 3.13.1) model formulates fleet disposition as a generalized assignment problem variant with time-discretized states, using an MILP approach by minimizing the total energy cost of the simulated HDT fleet (b5). The implemented model assumptions (b7) are presented in Section 2.2, and the optimization variables and constraints (b8) are presented in Section 2.3.2.
This work will focus only on the energy cost aspect of operating an HDT fleet. Hence, no total-cost-of-ownership (TCO) will be conducted and other cost parameters from the capital expenditures and the operating expenses are deliberately not considered. This modular approach is more robust and can be integrated more easily into other HDT fleet cost models. These sub-modules are briefly described in more detail in Section 2.3.
2.2. System Modeling
The assumptions and simplifications implemented to enhance computational efficiency and focus on the core scope of this work are introduced in the following. Future work based on the model presented here should carefully re-evaluate these simplifications.
The HDT operational day within the daily optimization timeframes is defined from 08:00 to 18:00, spanning 10 h to reflect typical logistics and freight operations [10]. To balance disposition precision with computational efficiency in the used MILP optimization, the full day from 00:00 to 24:00 is discretized into 30 min intervals, yielding 48 time steps. Finer resolutions, such as 15 min, were avoided to prevent excessive model complexity.
To narrow down the vehicle technologies to be considered, only BE-HDTs and ICE-HDTs are used for the generated HDT fleets. This excludes hybrid and alternative fuel vehicles, due to their low significance in current and future HDT market trends, according to existing technological evaluations [4,29]. The HDTs are assigned a fixed driving consumption rate for the calculation of the necessary driving consumption energy cost. BE-HDTs are assigned 110 kWh per 100 km [30,31,32,33,34] and ICE-HDTs with 30 L of diesel per 100 km [30,32,35,36]. These values are consistent with average fuel efficiencies under real conditions. For energy storage, BE-HDTs are equipped with an average battery capacity of 540 kWh, drawn from the market survey in Appendix A Table A1, while ICE-HDTs feature a standard 1500 L fuel tank [35,36,37]. Charging and refueling dynamics further differentiate the HDT types: BE-HDTs recharge at 375 kW, aligned with modern high-power direct-current charging stations [38,39,40,41,42]. Whereas ICE-HDTs assume an effectively unlimited rate of 9999 L/h. This simplification omits intra-day refueling for diesel vehicles, as it typically occurs in minutes at the end of the workday.
The BE-HDT energy source is a locally installed photovoltaic system with an additional battery storage, presumed sufficiently sized to supply energy at the constant costs detailed in Section 2.3.1 throughout the fleet’s operating day. No external grid charging is modeled, emphasizing the economic advantages of on-site generation. Hence, no grid connection power limitation needs to be assessed, as the local battery storage is used to buffer the peak loads of simultaneous charging processes. Relatedly, the charging infrastructure at the freight forwarder’s home depot is taken as pre-existing and excluded from financial assessments.
To mitigate battery degradation from high and low cell voltages, respectively deep discharge cycles, the used battery capacity is capped at 80% by enforcing a state-of-charge (SoC) range of 10% to 90% [43,44]. These SoC boundaries also apply to all V2G activities. The SoC management starts each day at 90% SoC for all BE-HDT batteries. They are immediately recharged to 90% after each trip. A detailed SoC modeling was omitted.
Among the V2G applications suitable for BE-HDT integration, this study selects the automatic Frequency Restoration Reserve (aFRR) for its high revenue potential in V2G use-cases [7,9]. This approach provides the quantification of the economic benefits achievable through an exemplary integration of a high-potential real-world V2G use case. This methodological choice serves two purposes: Firstly, it defines a realistic upper bound on economic opportunity for the stakeholders. The primary stakeholders are the fleet operator, and the secondary stakeholders are policymakers and BE-HDV manufacturers. Second, it establishes a benchmark against which future real-world implementations can be evaluated. They will face additional practical constraints, such as regulatory requirements and operational variability. By characterizing this best-case potential, the study clarifies the order of magnitude of economic benefits that justify further technological development and precise institutional support.
Four scenarios explore a broad outcome spectrum, combining years (2025 or 2045) to set price ranges with electrification favorability levels (“best-case” or “worst-case”). Best-case conditions favor HDT electrification through low electrical energy prices, high V2G remuneration, and elevated diesel costs, while worst-case scenarios reverse these with high electricity, low V2G, and low diesel prices. Specific levels are introduced in Section 2.3.1. For instance, the “2045 worst-case” scenario applies the highest BE-HDT prices and the lowest ICE-HDT prices from the 2045 range.
2.3. Model Description
2.3.1. Input Data
The model relies on three input datasets, each of which is preprocessed before being passed to disposition optimization.
An ICE-HDT disposition dataset of a German freight forwarder recorded in 2024 is being used. It was procured within the research project “SPIRIT-E”. This dataset consists of the following parameters: date and time of the delivery appointment, the start location, the delivery location, and the trip distance. A trip generation extracts single trips from the disposition dataset, generating real driving jobs for one specific day. One of these days is called a trip set, containing multiple unique trips that have taken place in the real world. A total of 1 month of real disposition data, hence 20 working days (only working days are present in the dataset), are used as an input for the simulation. The trips are filtered for being longer than 15 km due to insignificance regarding the minimum simulation time step of 30 min, and shorter than 540 km due to the maximum drive time limitation in Germany of 9 h per day. A trip dataset analysis providing an overview of the trip dataset is shown in Figure A1 in Appendix B. A short statistical characterization of the whole trip dataset is provided in Table 1.
Table 1.
Statistical characterization of the implemented and used daily trip dataset generated from the real-world disposition dataset provided through the SPIEIT-E research project.
An energy cost dataset is used, created from today’s values for 2025, as well as price forecast data sources. The relevant energy prices that are interpolated using the following sources are the HDT diesel prices [45,46,47,48], on-site electricity generation [49,50,51], and V2G prices for aFRR participation [52]. The resulting dataset contains annual prices with minimum, mean, and maximum values for every year from 2025 to 2045. The HDT consumption prices are normalized to €/100 km based on the vehicles’ declared consumption rates in Section 2.2, enabling direct cost comparisons between BE- and ICE-HDTs. The resulting energy cost dataset is shown in Figure 2.
Figure 2.
Yearly heavy-duty truck energy and vehicle-to-grid price parameters with historical and extrapolated outlook values for public diesel, private charging, and aFRR vehicle-to-grid participation for the years 2025 to 2045 in Germany [45,46,47,48,49,50,51,52].
The hourly V2G participation price data is derived from historical positive aFRR capacity market data of 2024, aggregated into averaged four-hour periods per day, with minimum and maximum prices [52]. It is shown in Figure 3.
Figure 3.
Hourly vehicle-to-grid revenues in the form of historical minimum and maximum positive aFRR prices in Germany averaged over the year 2024 [52].
These energy cost parameters vary by scenario (best-case and worst-case as per minimum and maximum price level, and analysis year 2025 till 2045), enabling the analysis of different price level trends.
An HDT technical parameter dataset is being used to define the main technical characteristics of the HDT under review. This includes its type (BE-HDT or ICE-HDT), energy consumption rates (as defined in Section 2.2), energy storage capacity (as defined in Section 2.2), and charging/refueling power (as defined in Section 2.2). Every BE-HDT battery capacity is the usable—also called net—battery capacity, as explained in Section 2.2. These technical parameters are used along with the fleet’s macroscopic characteristics (fleet size, fleet electrification degree) to establish a fleet generation process. The total fleet size represents the number of vehicles available for disposition, while the electrification degree determines the proportion of BE-HDTs within the fleet. This modular approach enables the simulation to construct virtual fleets as needed to be analyzed.
2.3.2. Disposition Algorithm
The allocation of trips to vehicles under combination-specific costs constitutes a variant of the generalized assignment problem [53]. However, the trips in the scope of this new disposition approach require completion within specific time windows to map the input trips, restricting assignments to available vehicles. This work introduces a discrete time scale spanning 24 h, divided into 48 steps of 30 min. Rather than assigning trips directly to vehicles, the algorithm allocates each time step t for vehicle m to a state matrix xm,t, represented by binary variables indicating the three possible states: “driving”, “parking”, or “charging”. This formulation enables an MILP model, comprising a cost vector c, a variable vector x, integer variables xint ∈ ℤ, inequality constraints A‧x ≤ b, equality constraints Aeq‧x ≤ beq, and bounds lb ≤ x ≤ ub [54].
This basic disposition algorithm forms the computational core of the model, utilizing MILP to determine the optimal assignment of vehicles to trips and activities across the operational day. Optimality is hereby defined by the minimal cost of the fleet during the operation day. The MILP problem is solved using the Gurobi optimizer, a state-of-the-art solver known for its efficiency in handling large-scale linear programming problems [55,56]. The formulation includes decision variables, constraints, and an objective function. The following main decision variables with their corresponding bounds and constraints are being used:
to determine if a vehicle m from the fleet M is assigned to a trip f from the trip set F at a specific time step t. Each trip f can only be assigned to exactly one vehicle m at a timestep t to determine which vehicle m of the fleet M is located at one of the possible locations l, “parking lot” or “charging station”, and if a vehicle is performing V2G at a specific time step. A vehicle m can perform only one activity per time step.
V2G is permitted only for BE-HDT assigned to no trip and at the “charging station” location to determine the SoC for BE-HDT.
The SoC evolves based on charging and trip consumption but is only considered at the end of a trip during the recharge time as defined in Section 2.2. BE-HDTs must charge after completing a trip.
The disposition optimization uses two separate cost functions for the BE- and ICE-HDT due to the V2G-term only applying for BE-HDTs, along with a charging penalty term to simulate the overhead cost of initializing and ending a charging session. The energy cost function for an ICE-HDT fleet is shown in the following equation, with all variables described in Table 2.
Table 2.
Abbreviations and parameters along with their descriptions used in the methodology section and Equations (1)–(12).
The equivalent energy cost function for a BE-HDT fleet is shown in the following equation, with all used variables defined in Table 2.
It must be mentioned that cV2G,t is negative because it is a revenue which reduces the total cost. The total mixed-electrified HDT fleet energy cost function results from the sum of the two former cost equations, as shown in the following Equation (12).
The single cost function cost parameters are described in the following table:
By minimizing this combined mixed-electrified HDT fleet cost function, the optimal disposition of the energy cost of the fleet is performed.
The used Gurobi optimizer (version 12.0.2) [57] was configured with the following parameters: optimality gap tolerance (MIPGap) of 0.1% (1 × 10⁻³), a feasibility tolerance (FeasibilityTol) of 1 × 10⁻⁶ for constraint satisfaction, an optimality tolerance (OptimalityTol) of 1× 10⁻⁹ for dual feasibility, a conservative presolve level, and a time limit of 900 s per optimization run. The solver uses a branch-and-cut algorithm with convergence achieved when the relative gap between the best integer solution and the best bound falls below the specified MIPGap threshold. All optimizations successfully converged within the computational time limit.
2.3.3. Output Data
Upon completion of the optimization, the model generates a comprehensive set of outputs that summarizes the operational and economic outcomes of the simulated fleet disposition.
Firstly, a fleet disposition schedule as a time-resolved timetable detailing each vehicle’s activities across the 48 time steps. This schedule is shown in Figure 4. Secondly, a cost composition including the total operational costs and trip metrics. The total costs, as the sum of all energy consumptions, V2G revenues, and charging overhead costs, are directly derived from the optimization problem result and along with the operational metrics of the total kilometers driven, the percentage of electrified kilometers driven by BE-HDTs, the median trip distance as a statistical measure of the trip set, a detailed cost composition for BE-HDT energy consumption and V2G revenues, and ICE-HDT energy consumption.
Figure 4.
Optimized daily disposition schedule for a fleet of 10 vehicles, 50% electrification (5 ICE-HDTs, 5 BE-HDTs), day 1 trip set, 2025 costs, and the worst-case scenario using state-of-the-art disposition (a) and the novel V2G-integrating disposition (b) with a visible shift in the driving activities towards V2G-low-revenue times within the novel V2G-integrating disposition approach of this work.
3. Results
This section quantifies the potential analysis of the introduced novel disposition approach accounting for V2G compared to the state-of-the-art approach. Due to the numerous simplifications (introduced in Section 2.2), it must be pointed out once again that the results presented in the following represent a theoretical maximum upper-bound potential rather than realistic near-term outcomes. Firstly, the effect of the algorithm is demonstrated via a scenario analysis approach, provided in Section 3.1. Secondly, the impact of the main techno-economic parameters is analyzed via a parameter sensitivity analysis, provided in Section 3.2. Lastly, the overall flexibility potential is being quantified in Section 3.3.
3.1. Scenario Analysis
The scenario analysis is conducted by analyzing the effects of the V2G integration. Firstly, on the disposition schedule, provided in Section 3.1.1, and secondly, on the fleet operating cost composition, provided in Section 3.1.2.
3.1.1. Disposition Schedule Effects
The effect of the novel disposition approach is demonstrated in the following example. The disposition schedule of the whole fleet is analyzed using two different scenarios for the year 2025. The schedule of the state-of-the-art disposition approach without V2G implementation, functioning as the baseline for the comparison, and the schedule of this novel disposition approach using V2G implementation are shown in Figure 4 for the worst-case price level, represented by the worst-case scenario.
Figure 4 shows the visible shift in the disposition schedule towards the end (b) of the day for the novel disposition approach. This proves the impact of this new disposition strategy on the daily disposition schedule. All trips assigned to ICE-HDTs are irrelevant to this analysis because the impact of the V2G implementation only affects BE-HDTs. The optimized disposition using the state-of-the-art approach (a) schedules the trips assigned to a BE-HDT approximately evenly throughout the day. With the now introduced V2G integration and its varying revenue cost over the course of the day, the targeted disposition of every trip assigned to a BE-HDT improves the overall fleet energy costs and hence leads to a more favorable optimization solution. The lower price level for V2G revenue has a higher course at the beginning of the day, illustrated in Figure 3. Hence, it is more cost-efficient to let every available BE-HDT participate in the aFRR capacity market using V2G during the higher revenue times in the morning and perform the trips, if possible, during the low revenue times in the evening. This V2G implementation results in a fleet energy cost reduction of 10.3% due to V2G revenues of 54.60 €.
3.1.2. Cost Composition Effects
The effect of the novel disposition approach on the fleet’s energy cost composition, defined as the sum of the energy costs required for driving the HDT along with the V2G revenues, is shown in the following. The driving energy costs are composed of the ICE-HDT driving energy costs (fuel costs in the form of diesel costs) and the BE-HDT driving energy costs (the charged electrical power costs). The V2G costs are the generated V2G revenues, which are deducted from the driving energy costs. The resulting total energy costs represent the total costs necessary for operating the HDT fleet energetically for one operating day for a given trip set and given energy costs.
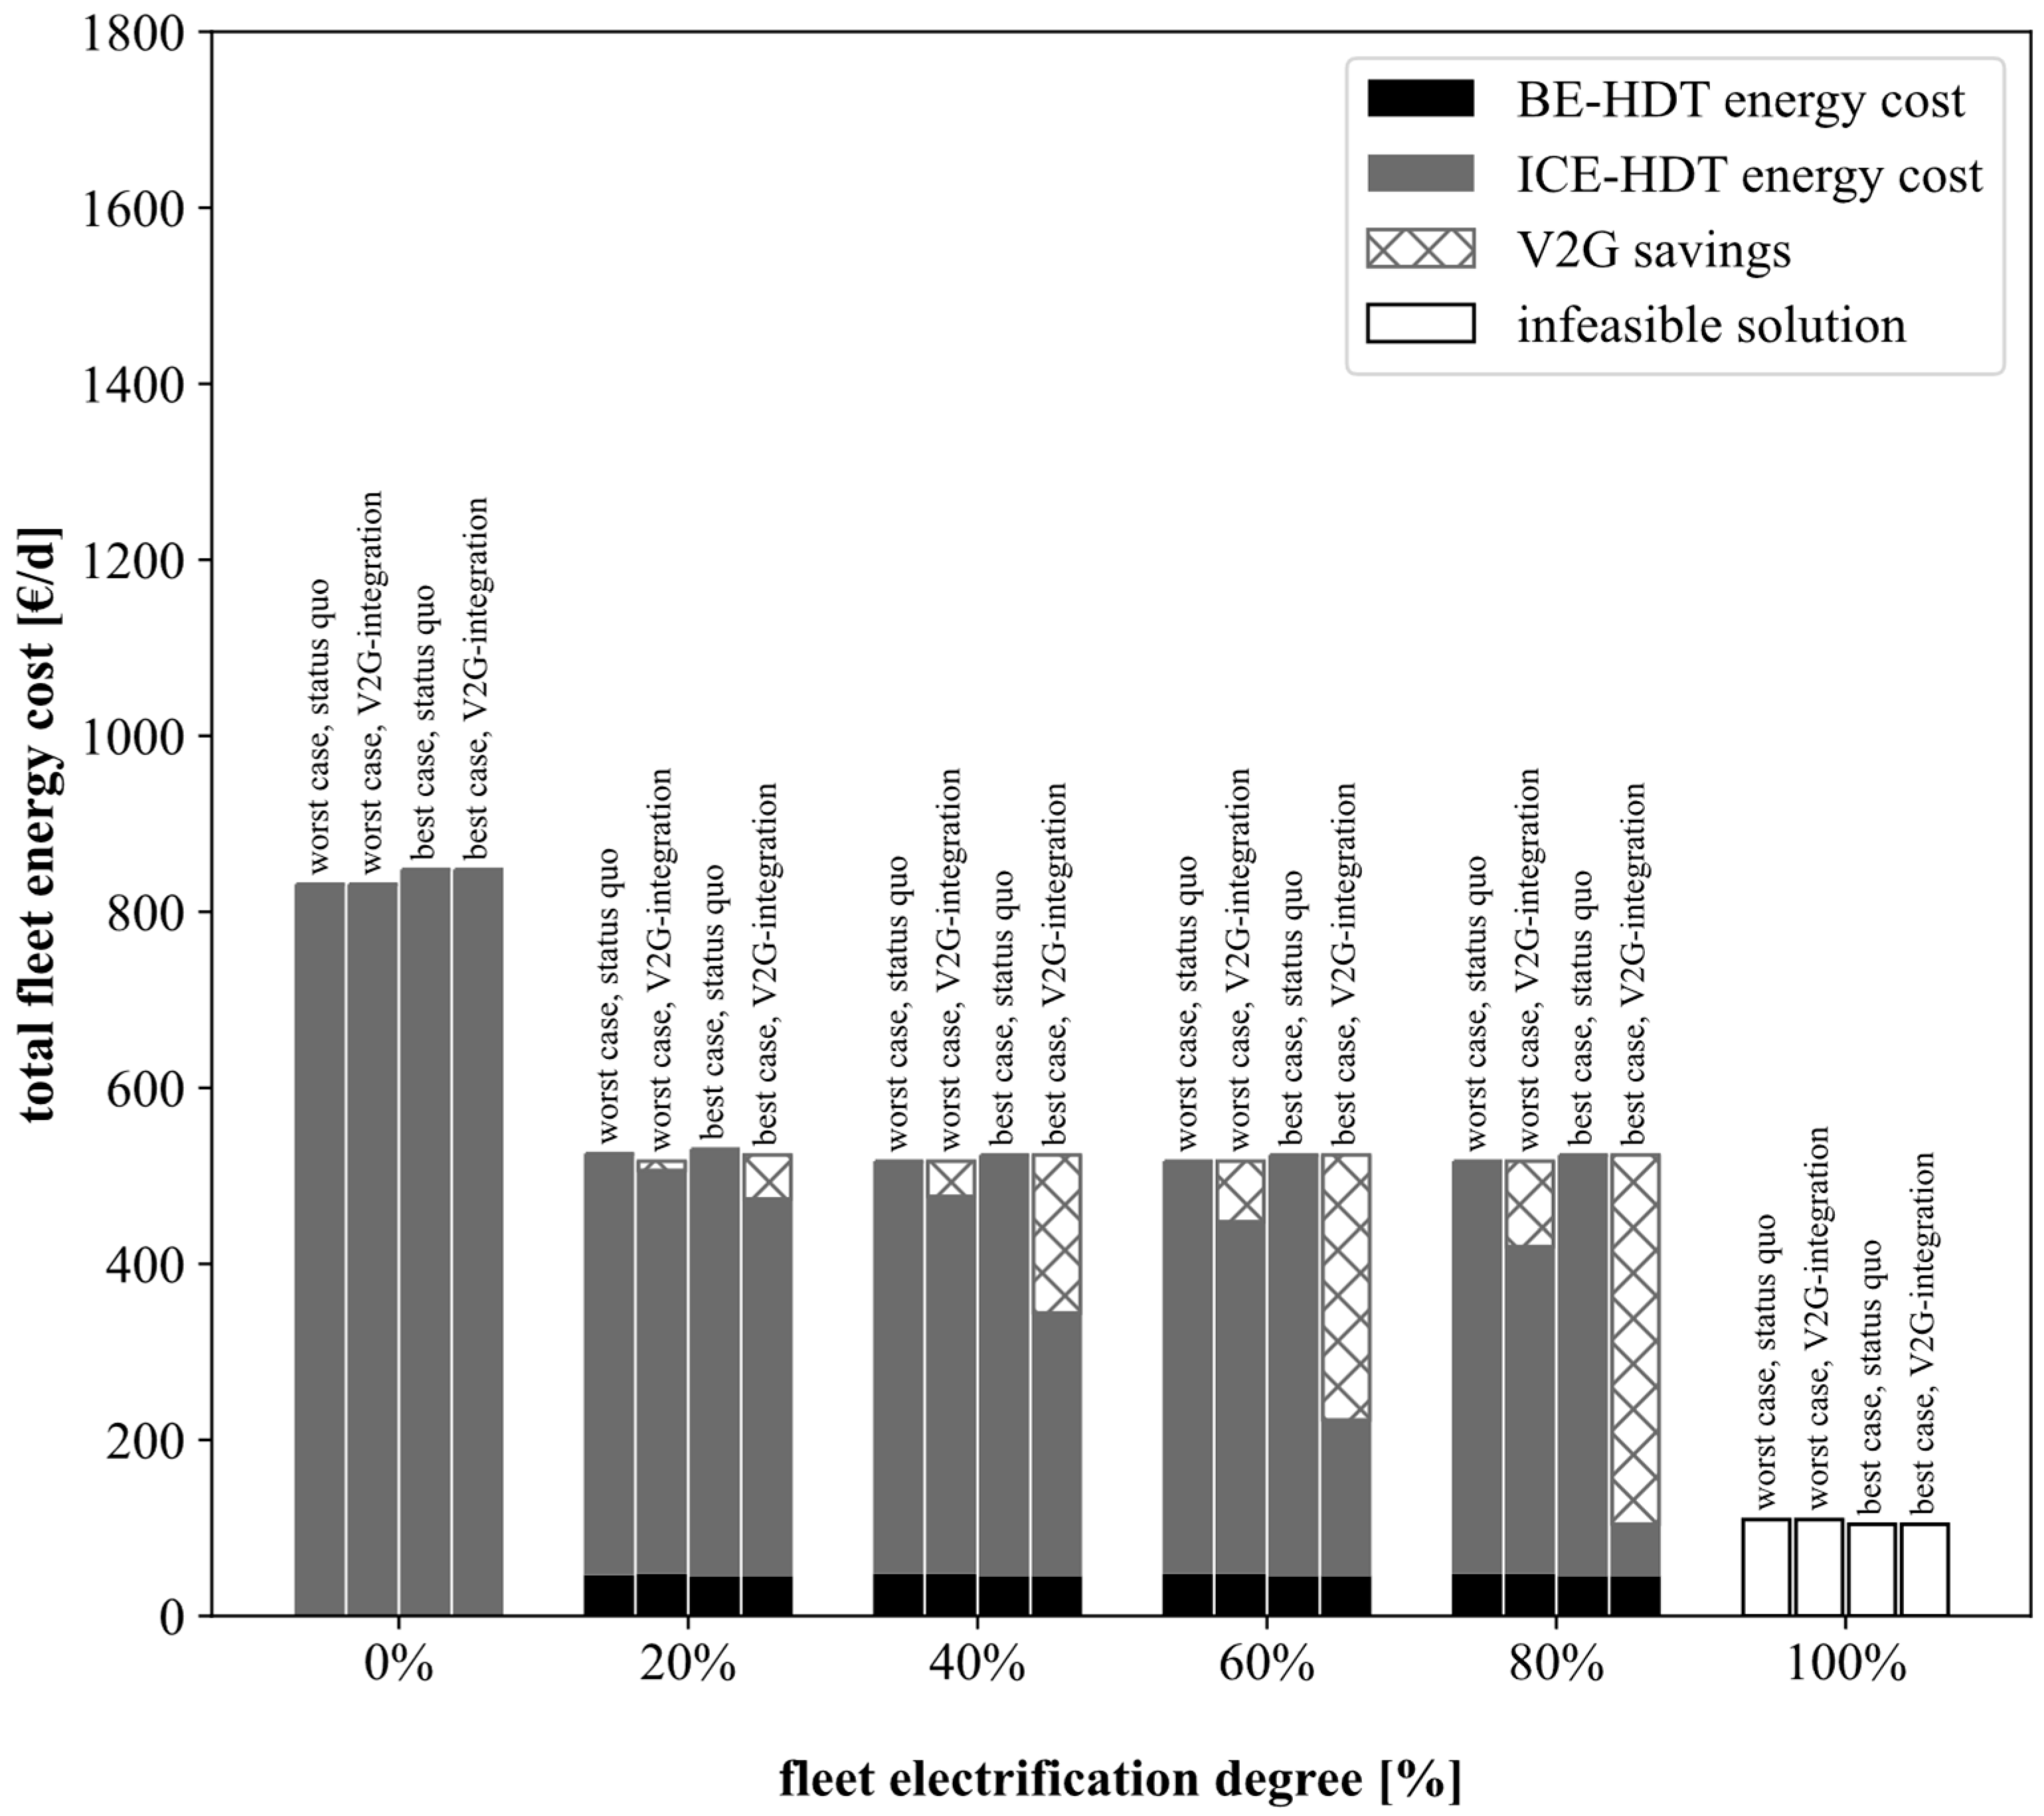
The fleet cost composition effects are analyzed using an exemplary fleet of 10 vehicles with an electrification degree variation from 0% to 100% in 20% steps. Four scenarios are evaluated, two years under review with each best- and worst-case price level for electrification. The years under review are 2025, representing the current optimization potential, and 2045, representing the future optimization potential. To compare the effect of the novel V2G-integrating approach to the state-of-the-art disposition method, each scenario is optimized without V2G integration to act as a baseline.
For the 2025 price level, shown in Figure A2 in Appendix B, the total fleet energy costs show a drop of 32.7% to 42.6% (depending on the scenario) by introducing a 20% fleet electrification (2 out of the 10 HDT electrified). This cost reduction continues for both the best and worst-case, price levels and a rising electrification level, but is much higher for the best-case price level due to the higher V2G revenues: −26.5% from 20% to 40% fleet electrification, −34.0% from 40% to 60% fleet electrification, and −50.1% from 60% to 80% fleet electrification. This cost reduction effect only occurs for the novel disposition approach. However, for the state-of-the-art disposition approach, no further fleet energy cost reduction can be observed for a rising fleet electrification beyond 20%. This is due to the stagnating electrification of the actual driven trip distance due to the range limitation of the BE-HDT. The two longest trips of the day (day 1 trip dataset) of 429 km and 511 km are assigned to ICE-HDT for every fleet electrification. This is also the reason for an infeasible solution for a fleet electrification of 100% under the modeling assumptions. A fully electrified fleet cannot perform this historical trip set under the applied restriction of only using on-site generated electrical energy. The direct comparison between the baseline scenario (the state-of-the-art disposition approach) and the novel approach shows the high potential of the V2G implementation: for 2 out of the 10 HDT electrified, a total energy cost reduction of 10.2% (best-case)/3.4% (worst-case) can be achieved, rising to 33.3% (best-case)/7.5% (worst-case) for 4 electrified HDT, 55.9% (best-case)/12.9% (worst-case) for 6 electrified HDT, and 77.9% (best-case)/18.3% (worst-case) for 8 electrified HDT. The cost savings are directly proportional to the fleet electrification due to the duration of aFRR participation being dependent on the available time of BE-HDT, which in turn directly depends on the amount of BE-HDT in the fleet. The same analysis for the future scenario with price levels of 2045 is shown in Figure 5.
Figure 5.
Fleet cost composition comparison for six variations in the fleet electrification degrees (0–100%) for a fleet of 10 vehicles, day 1 trip set, cost levels of 2045 and a comparison of four scenarios as a combination of best vs. worst energy costs and state-of-the-art disposition vs. novel V2G-integrating disposition.
Figure 5 displays the same effects as today’s scenario with 2025 price levels can be observed. However, due to the higher and wider spread in energy costs, as shown in Figure 2, a much higher difference between the best and worst price levels results. The same high impact of the novel V2G implementing approach is shown; the total impact however is lower due to the higher price levels resulting from the higher energy cost levels: for two electrified HDT, a total energy cost reduction of 7.6% (best-case)/0.7% (worst-case) can be achieved, rising to 21.6% (best-case)/6.6% (worst-case) for four electrified HDT, 36.2% (best-case)/11.4% (worst-case) for six electrified HDT, and 51.7% (best-case)/16.0% (worst-case) for eight electrified HDT. The detailed results are provided in Table A2 in Appendix A.
3.2. Parameter Sensitivity Analysis
This section presents a parameter sensitivity analysis using a combination of the one-at-a-time (OAT-SA) sensitivity analysis and the global sensitivity analysis (G-SA) approaches to assess the impact of individual input parameters. In general, every input parameter should be assessed for its parameter sensitivity on the simulation results. The input parameters of this simulation are of a techno-economic nature: The economic input parameters, being the energy and V2G prices, are already assessed using the input parameter variation in price level (worst-case, best-case) and price level year (2025, 2045) within the scenario analysis in Section 3.1. The remaining technical input parameters are the fleet electrification degree, the fleet size, and the trip dataset characteristic. The sensitivity analysis is hence conducted using these technical input parameters and the same Python-based MILP model described in Section 2 of this work. The output metric remains the optimized daily fleet energy cost (€/day), as it encapsulates the economic impact of the disposition strategy.
The combined G-OTA sensitivity analysis is conducted using the following approach: Each parameter-under-review is varied across its full parameter range with a fixed step size, as defined in the subsequent sub-sections. For each combination, the MILP model is run to compute the daily fleet energy cost. Meanwhile, every other input parameter, including both economic and technical ones, will be varied over its full range with a fixed step size for every assessed parameter-under-review step. A full-factorial analysis was not conducted due to the computational limitations of the high-parameter MILP model in combination with a total combination count of 40,640,000 variations. To quantify the variance of each assessed parameter, the Sobol’ method is used [58,59]. This method calculates Sobol’ indices to specify the variance and impact of the input parameter on the result parameter. A Sobol’ index of >0.5 indicates a high impact, <0.2 indicates a low impact. Finally, the practical impact on the daily fleet energy cost is calculated by comparing the final energy cost result of the state-of-the-art disposition approach without V2G integration and the V2G-integrating approach of this work. The results are presented as box-plot diagrams to visualize the relative impact of each parameter. Each single parameter’s sensitivity analysis is provided in the following Section 3.2.1, Section 3.2.2 and Section 3.2.3.
3.2.1. Fleet Electrification Impact
The fleet electrification parameter is one of the main input parameters for the disposition of a mixed-electrified HDT fleet due to its description of the fleet’s composition and hence, the vehicles available for the disposition. The following fleet electrifications were chosen as examples to represent a broad and meaningful range: 0%, 25%, 50%, 75%, 100%. These steps were analyzed for the parameter variations in the price level scenarios of “best-case”/“worst-case”, the price level years 2025/2045, a fleet size between 10 and 100 in 10-vehicle steps, as well as the state-of-the-art disposition algorithm (without V2G integration) and the novel disposition approach presented (with V2G integration). The results of this sensitivity analysis are presented in Figure 6.
Figure 6.
Parameter sensitivity analysis for the assessed fleet electrification variations (0%, 25%, 50%, 75%, 100%) depending on the scenario (2025 vs. 2045, best-case vs. worst-case price level), the optimization approach (state-of-the-art vs. this work using V2G), and the optimized daily fleet energy costs.
Across the tested combinations, higher electrification is associated with lower typical (median) daily fleet energy costs, but Figure 6 also shows wide spreads and substantial interquartile range (IQR) overlap between electrification levels, meaning the electrification effect is not separable from scenario and fleet-size effects in many cases.
The following effects can be observed: no electrification (0.0%) generates the highest fleet energy costs, followed by a trend of declining fleet energy costs with rising electrification level. For a fully electrified fleet (100.0%), no feasible solution for every parameter combination could be provided due to the present modeling assumptions and range limitation of the available BE-HDT.
The solution space for the state-of-the-art approach without V2G considerations ranges from 516.27 € up to 4409.59 €. For this new disposition approach, the solution space ranges from −1114.63 € to 4409.59 €. Hence, the solution space could be reduced, even enabling the negative solution space. This can be explained by V2G revenues exceeding the total consumed energy costs of the fleet, generating a total surplus of the daily fleet energy costs.
However, the spread within one fleet electrification constellation is extensive, resulting in broad overlaps between different fleet electrification levels. As an example illustrating the overlap effect, using the novel disposition approach and comparing the total fleet energy costs for a fleet with only 25% electrification in the 2025 best-case scenario (486.54 €) with a fleet of 75% electrification in the 2045 worst-case scenario (509.95 €), a reverse dependency effect can be observed. Such cross-scenario comparisons highlight that parameter interactions can partially mask or reverse the median trends.
The analysis shows that substituting only one-quarter of the conventional ICE-HDT fleet with BE-HDTs can reduce daily energy costs in most scenarios, even in the worst-case price levels of 2025, without necessitating structural changes in operations. Fleet operators can start with 2–3 BE-HDTs in a 10-truck fleet to harvest clear savings and V2G revenue while still relying on ICE-HDTs for long and irregular trips. With higher electrification shares of two-to-three-quarters of the fleet, the cost distribution begins to include negative daily net energy costs in favorable price years, meaning V2G revenues can outweigh energy expenses on some days. The practical conclusion can be: Once the depot, charging processes, and scheduling routines are stable, expanding to roughly two- or three-quarters of BE-HDT enables systematic use of high-revenue V2G hours without compromising service quality. Upgrading the fleet’s electrification degree even further to a fully electrified fleet, however, is not suitable due to the driving range infeasibility of all currently available BE-HDT. This is not a model artifact but a signal: without public charging or modified trip portfolios, today’s long-haul tasks remain a hard constraint. This implies the following practical conclusion: A complete fleet electrification only becomes viable if at least one of the following changes: (i) the trip structure towards shorter trips and fewer very long direct trips, (ii) advanced vehicle technology with higher BE-HDT ranges, or (iii) a cheaper public charging concept with en-route or destination charging at a price level of on-site private charging.
With a first-order Sobol’ index of 0.45, fleet electrification stands out as the main variation parameter. It accounts for 45% of the variance in energy cost saving results. The total-order Sobol’ index of 0.60 indicates even greater effects when considering interactions among all input parameters. Both Sobol’ indices are nearly above 0.5, showing an overall high impact. This is due to its direct role in V2G revenue potential and energy cost structure of the correlated BE-HDT amount. In the 2045 worst-case scenario, the sensitivity to the electrification degree decreases to 0.31, as higher baseline electricity prices reduce the cost benefits.
Overall, this sensitivity behavior suggests that fleet operators should focus on determining the optimal electrification level before expanding their fleet size or optimizing detailed route designs.
3.2.2. Fleet Size Impact
The fleet size parameter is one of the main input parameters for the disposition of a mixed-electrified HDT fleet due to its description of the fleet’s composition and hence, the vehicles available for the disposition. The following fleet sizes were chosen as examples to represent a broad and meaningful range: 10, 20, 30, 40. Each of these were analyzed for the parameter variation in the price level scenarios of “best-case” and “worst-case”, the price level years 2025 and 2045, a fleet electrification degree between 0 and 100% in 10% steps, a fleet size between 10 and 100 in 10 vehicle steps, as well as the state-of-the-art disposition algorithm and this novel disposition approach. This sensitivity analysis is shown in the following Figure 7.
Figure 7.
Parameter sensitivity analysis for the assessed fleet sizes (10, 20, 30, 40 vehicles) depending on the scenario (2025 vs. 2045, best-case vs. worst-case price level), the optimization approach (state-of-the-art vs. this work using V2G), and the optimized daily fleet energy costs.
Across all fleet sizes, Figure 7 exhibits wide spreads, outliers, and substantial overlap of the IQRs between parameter combinations. While a tendency toward lower (more favorable) results for larger fleets can be observed within the median result distribution, this should be interpreted cautiously because the median shifts are small relative to the IQR overlap and the presence of extreme outliers. Consistent with this, the overall solution spaces by fleet size overlap strongly: 10 vehicles span roughly 117.78 € to 3491.89 €, 20 vehicles −296.36 € to 3765.63 €, 30 vehicles −710.51 € to 4409.59 €, and 40 vehicles −1114.63 € to 3001.20 €.
For smaller fleets (10 vehicles), every vehicle is utilized more for performing trips of the same trip set as in bigger fleets. This leads to fewer idle hours for V2G in smaller fleets, hence less V2G revenue, and hence higher fleet energy costs. These small fleets can use V2G only for filling the time gaps between the main trip task and leave less degree of freedom for V2G disposition optimization. Growing fleets (20–40 vehicles and beyond) performing the same trip set can use more BE-HDTs, which are parked and grid-connected during high-revenue windows. This enables these larger fleets to optimize V2G revenues by shifting trips to more favorable times. The sizing of the fleet relative to the daily trip demand becomes an energy-portfolio decision. Keeping a small fraction of vehicles “energy-focused” can be economically attractive when V2G prices are favorable.
The Sobol’ index of the first order is 0.15, the total-order index is 0.25. Hence, the fleet size falls into the medium impact range within the >0.2 and <0.5 Sobol’ scale. Only 15% of the energy cost variation can be explained solely by the variation in fleet size, and only 25% considering interactions between all input parameters. Hence, fleet size alone is not a primary driver compared to the degree of electrification. In practical terms, this supports a staged strategy for the fleet operator: First, deciding on an economically sensible electrification of the already present fleet. Only then, evaluating whether additional vehicles are justified to unlock more V2G potential or to buffer peak trip days. An important scenario insight is that additional vehicles improve feasibility margins for high BE-HDT shares: larger fleets reduce the risk that trips and V2G revenues compete for the same BE-HDT in tight schedules.
3.2.3. Trip Distance Impact
The daily trip set characteristics, represented by its median trip distance, is one of the main input parameters for the disposition of a mixed-electrified HDT fleet due to its description of the trips to be driven and hence the distance requirements to be performed by the fleet. The following median trip distances were chosen as examples to represent a broad and meaningful range: 33 km, 108 km, 208 km, 307 km. These were analyzed for the parameter variation in the price level scenarios of “best-case” and “worst-case”, the price level years 2025 and 2045, a fleet size between 10 and 100 in 10-vehicle steps, as well as the state-of-the-art V2G-neglecting disposition algorithm and this novel V2G-integrating disposition approach. This parameter sensitivity analysis is illustrated in Figure 8.
Figure 8.
Parameter sensitivity analysis for the median trip distances (33, 108, 208, 307 km) of the assessed daily trip datasets depending on the scenario (2025 vs. 2045, best-case vs. worst-case price level), the optimization approach (state-of-the-art vs. this work using V2G), and the optimized daily fleet energy costs.
For the median trip distance, the following effects can be observed: Every trip set (corresponding to the median trip distance of the set) leads to infeasible solutions, resulting again from the modeling assumptions and range limitations of the BE-HDT.
While the median of the boxplots suggests some tendency toward lower daily fleet energy costs for shorter-median trip sets, Figure 8 also shows large IQRs, substantial whisker lengths, and outliers. Importantly, the IQRs for different median-distance categories overlap strongly, meaning that differences between the medians are often small relative to within-group variability. Therefore, the median trip distance alone does not provide a statistically clean separation of the results. This overlap is consistent with the fact that two trip sets with identical medians can still have very different tails (e.g., a small number of very long trips), which can dominate feasibility and constrain BE-HDT assignment/V2G availability. This can be explained by the fact that a trip set with a low median trip distance can still consist of a high number of BE-HDT range-exceeding trips, compensated by a high number of short trips, and vice versa.
The Sobol’ index of the first order is only 0.05, explaining only 5% individual effect on the fleet energy cost output. The total-order index is 0.10, also explaining only 10% effect when considering interactions between all varied input parameters. With both Sobol’ indices far below 0.2, their overall effect is considered to be low according to the Sobol’ scale. This indicates that the median trip distance has a weak impact on the fleet energy cost output within the analysis. The operational interpretation is the following: Two trip sets with the same median distance can have completely different shares of very short and very long tours. In the disposition planning, using “typical distance” as a single description to judge BE-HDT suitability is misleading. A detailed trip set description, including individual trip lengths, dominates feasibility and V2G potential. Trip portfolios with many short and medium trips and only a few long hauls are naturally suited for higher electrification and intensive V2G use, because many BE-HDT can complete their jobs and still be available during high-revenue aFRR windows. Portfolios with frequent long-distance tours continuously bind BE-HDTs to driving tasks. This limits grid participation and makes very high electrification degrees operationally fragile unless complemented by public charging or additional ICE-HDTs. From a scenario-building perspective, the results suggest that future work and practitioner tools should cluster trip sets by pattern (e.g., “distribution-like” vs. “long-haul-dominated”) instead of relying on single distance statistics. Fleet operators should first segment their order book into patterns (short-haul, regional, long-haul) and deploy BE-HDTs and V2G primarily in the short- and regional-haul clusters. Overall, these results show that the median trip distance is unsuitable to function as a trip set describing parameter.
3.3. Techno-Economic Potential Quantification
The total daily fleet energy cost difference between this novel disposition algorithm and the state-of-the-art disposition without V2G integration is being compared. This yields a quantification of the monetary potential of the new disposition approach with a V2G revenue integration developed within this work. The resulting fleet energy cost savings, as the difference in the fleet energy costs of both disposition algorithms applied to one specific fleet, scenario, and trip set configuration, are shown in Figure 9.
Figure 9.
Fleet energy cost savings comparison between the state-of-the-art disposition algorithm and this novel disposition algorithm using V2G integration (aFRR) for (a) four increasing fleet sizes, (b) four increasing fleet electrification degrees, (c) four price scenarios, and (d) four trip datasets represented by their median trip distance (positive values indicate a cost advantage of the novel disposition algorithm).
The fleet energy cost savings using the novel disposition algorithm introduced in this work show a wide spread across the four relevant parameters (the two fleet composition parameters of fleet size and fleet electrification, the energy price scenario, and the trip set characteristics). However, not a single combination shows a disadvantage of the novel disposition algorithm in comparison to the state-of-the-art approach. The energy cost savings range from non-existent for no fleet electrification due to the lack of integration potential of V2G without BE-HDTs in the fleet. And range up to net revenues equivalent to 202% of baseline energy costs for the shortest trip set, the largest fleet, a high fleet electrification, and the best-case price scenario.
Given the wide spreads and the visible overlaps between the boxplot diagrams in Figure 9, the following interpretations focus on distributional tendencies rather than implying strict dominance of individual parameters. Hence, only the median results are discussed in the following section. Table 3 states not only means but also interquartile ranges (Q1–Q3) and extrema to make the wide overlaps explicit.
Table 3.
Detailed relative energy cost changes between the state-of-the-art disposition algorithm and this novel disposition algorithm using V2G integration for different fleet composition parameters, trip sets, and scenarios (positive values indicate a cost advantage of the novel disposition algorithm, negative values indicate a cost advantage of the state-of-the-art disposition algorithm) with minimum (min), 25th percentile (Q1), mean, 75th percentile (Q3), and maximum (max) values.
The energy cost savings increase with a higher fleet size. They vary from 17% for the smallest fleet to 81% for the largest fleet. This effect can be explained by the increasing total fleet’s battery capacity as the number of BE-HDTs rises. A positive trend is also evident in the degree of fleet electrification, starting with an almost equivalent ratio of 24% energy cost savings for a quarterly electrified fleet. The quadratic trend continues, with 58% cost savings achieved through half-electrification. The maximum feasible electrification of three-quarters results in net revenue equivalent to 8% of baseline energy costs. This direct correlation can also be explained by the increasing total fleet battery capacity as the number of BE-HDTs within the fleet rises. A full electrification does not lead to a feasible simulation solution due to the range limitations of a BE-HDT-only fleet. The practical impact of both effects, based on the increasing accumulated fleet battery capacity, must be mitigated and diminishing returns are likely when the model assumptions (introduced in Section 2.2) and additional practical operational coupling effects are taken into account. These coupling effects arise due to the system being subject to operational interdependencies, including the resource contention between transport logistics and V2G services, non-linear charging rates at high SoC, and aFRR market availability limitations. However, aFRR market limitations regarding minimum bid sizes do not have to be mentioned here due to easy resolution by forming a participation pool with other participants.
In the best-case scenarios for 2025 and 2045, the cost savings are higher than for the worst-case scenarios. The step is +60% for the 2025 scenarios, and +50% for the 2045 scenario. The median-trip distance parameter is the only parameter with no explicit dependency, which again highlights its poor performance as a trip set characterization indicator. This was already elaborated in Section 3.2.3. The detailed numerical results are summarized in Table 3.
The quantified cost changes in this techno-economic analysis, particularly the up to 108% reductions for large, highly electrified fleets under favorable price conditions, underscore the transformative role of V2G-integrated disposition in not only minimizing operational expenses but also generating net surpluses that offset initial BE-HDT acquisition costs over time. This linkage highlights a novel insight: by prioritizing BE-HDT availability during peak V2G revenue periods, fleet operators can achieve grid-stabilizing contributions equivalent to 70% of the BE-HDT’s battery capacity with mitigated degradation risks. Overall, best-case price scenarios, combined with larger fleet sizes and higher electrification rates, yield the most positive differences. This is particularly valid at longer median trip distances. The detailed numerical results are provided in Appendix A in Table A2. It is worth reiterating that, due to the sole integration of aFRR as a V2G use-case, all results must be understood as the maximum potential and upper boundary of the practical real-world application’s solution space.
4. Discussion
4.1. Summary and Discussion
This work introduces a novel disposition algorithm for mixed-electrified heavy-duty truck fleets, incorporating V2G capabilities to optimize the fleet’s energy costs. Using real disposition data from the SPIRIT-E project and a mixed-integer linear programming approach, the model minimizes energy costs while integrating bidirectional charging revenues.
The potential analysis shows a reduction in the total fleet’s energy costs by adding the automatic Frequency Restoration Reserve (aFRR) as a V2G use case into the disposition process. The resulting cost changes range from 17% for small fleets to 81% for larger fleets. Similar effects are observed for the fleet’s electrification level: energy cost changes range from −24% at lower electrification to −108% at higher electrification. The total solution space varies from 0% to −302% under certain conditions. Therefore, a total surplus of daily fleet energy costs is possible, with V2G revenues exceeding energy expenses. The minimum average savings in small, low-electrification fleets, under the 2025 worst-case price scenario, result from aFRR V2G participation during an average idle time of 20 h per vehicle, offsetting 20% of total diesel and electricity costs. Conversely, the highest average energy cost savings in large, highly electrified fleets under the 2045 best-case price scenario also assume 20 h of idle time, but with much higher aFRR V2G revenues due to favorable prices. This demonstrates how V2G integration can turn operational costs into surpluses, providing new insights into the scalability of such systems for broader grid resilience. Furthermore, the wide range of savings under optimal conditions emphasizes the potential for policy frameworks to prioritize incentives that reduce barriers to fleet size and electrification. This can indirectly accelerate emission reduction and renewable energy integration. Additional emissions and grid-impact analyses are required to substantiate these implications.
However, a fully electrified fleet results in infeasible disposition due to the chosen model assumptions and range limits of BE-HDTs. Applying the most favorable energy prices compared to the least favorable ones, savings in the 2025 scenario increase by 84%, and by 71% in the 2045 scenario. While savings grow with fleet size and electrification, the median trip distance shows no clear effect. Overall, the best-case price scenarios, combined with larger fleets and higher electrification rates, lead to the greatest savings in fleet energy costs. Even in worst-case price scenarios, smaller fleets with low electrification can still achieve reductions. However, increasing fleet battery capacities will likely face diminishing returns in real-world implementations due to operational constraints like resource conflict between logistics and V2G services, non-linear charging rates, and market availability limits. Minimum market bid size issues can be ignored as pooling resolves them.
Sensitivity analyses indicate that fleet electrification and energy prices are the most critical factors driving cost savings. Notably, V2G revenues can fully cover energy costs in high-electrification scenarios, potentially resulting in negative total costs. This could enable daily surpluses of 500–2000 € for a 40-vehicle HDT fleet, encouraging investments in bidirectional infrastructure. These findings emphasize the techno-economic potential of V2G-based disposition strategies to accelerate the electrification of commercial HDT fleets, supporting the decarbonization goals of the Paris Climate Accords.
The key findings are summarized in the following:
- A novel disposition algorithm for mixed-electrified heavy-duty truck (HDT) fleets with vehicle-to-grid (V2G) capability is developed, using a mixed-integer linear program (MILP) to optimize fleet energy costs.
- Total fleet energy costs can be reduced when automatic Frequency Restoration Reserve (aFRR) participation is integrated as a V2G use case.
- Cost reductions are estimated to range on average from 17% for small low-electrified fleets to 81% for large high-electrified fleets.
- Net daily energy-cost surpluses are shown to be achievable, as V2G revenues can exceed diesel and electricity expenses in favorable cases.
- With increasing fleet electrification, energy cost savings can increase further to −24% (lower electrification), even enabling net revenue generation equivalent to 8% of baseline energy costs (higher electrification), and can reach a net revenue generation equivalent to 202% of baseline energy costs under specific conditions.
- In small, low-electrification fleets under a 2025 worst-case price scenario, 20% of total diesel and electricity costs can on average be offset via aFRR participation during an average idle time of 20 h per vehicle.
- In large, highly electrified fleets under a 2045 best-case price scenario, the same 20 h idle times can on average offset the entire diesel and electricity costs and additionally yield net revenues equivalent to 75% of baseline energy costs due to higher aFRR revenues under favorable prices.
- Fully electrified fleet operation is found to be infeasible under the selected modeling assumptions and BE-HDT range constraints.
- When the most favorable energy prices are applied instead of the least favorable ones, savings can be increased by 84% (2025 scenario) and 71% (2045 scenario).
- Energy cost savings are found to increase with fleet size and electrification, while median trip distance cannot be associated with a clear effect.
- Sensitivity analyses can identify electrification level and energy prices as the dominant cost drivers. In high-electrification cases, V2G revenues are shown to fully cover energy costs, enabling estimated daily surpluses of 500–2000€ for a 40-vehicle fleet.
4.2. Limitations and Future Work
While this study offers valuable insights, it relies on simplifying assumptions that highlight areas for future research. The model currently overlooks battery degradation and assumes a full recharge after every trip. Future work should include detailed battery aging models in the cost function and allow for dynamic, partial charging optimization. This would produce more realistic cost estimates, though at the expense of higher computational demands.
The model also assumes an unconstrained charging infrastructure and a constant cost for on-site generated electricity. An important extension would be to incorporate practical real-world constraints, such as limited grid connection capacity, available chargers, and stochastic profiles for renewable energy and volatile electricity prices. The model indicated that 100% electrification was often unfeasible due to long-haul trips exceeding the BE-HDT range. Future research should explore public charging options.
The analysis was limited to the aFRR market. Its practical potential could be much greater if extended to include revenue stacking from multiple grid services, like peak shaving, demand response, and ancillary services.
Another limitation is reliance on the median trip distance as the main descriptor of trip data. As shown by our results, this metric is insufficient to capture the full diversity of operational patterns, potentially mischaracterizing fleet performance. This shortfall could be addressed by using advanced techniques, such as clustering trip patterns or probabilistic demand distributions, to better reflect the variability in real-world logistics.
The adopted specific scenarios limit generalizability by relying on only four deterministic best- and worst-case price extremes for 2025 and 2045, spanning energy prices and aFRR V2G revenues. These bounds quantify maximum potentials (e.g., 17–81% cost reductions scaling with fleet size/electrification) but ignore probabilistic distributions, intermediate market states, or uncertainties like volatile renewables or policy changes. This deterministic perspective may reduce the model’s relevance in volatile conditions. Future extensions should incorporate stochastic optimization or Monte Carlo simulations to capture realistic variance, enhancing robustness for fleet operators.
The MILP approach guarantees optimal solutions but may face scalability issues with very large fleets or finer time resolutions. Exploring heuristics, metaheuristics, or decomposition methods would be necessary for real-time, large-scale applications. Incorporating stochastic or robust optimization methods in future work would improve the reliability of results and support more resilient decision-making amid market fluctuations.
This study primarily focused on operational energy costs. The goal for practical use is to integrate these energy costs into a comprehensive fleet cost analysis that includes vehicle and infrastructure capital costs, maintenance expenses, and potential subsidies. This would provide a complete perspective on fleet investment choices.
These limitations are summarized in the following:
- Battery degradation is neglected by assuming full recharge per trip. Aging models and partial charging optimization are required.
- Unlimited charging infrastructure and constant on-site electricity costs are assumed. Real-world constraints (e.g., grid capacity, charger availability, stochastic energy prices) are needed.
- Infeasibility of 100% electrification for long-haul trips results from the given model assumption. Inclusion of public charging options is warranted.
- V2G use cases are limited to the aFRR market. Extension to revenue stacking across grid services (e.g., peak shaving, demand response) is recommended.
- Reliance on median trip distance is used, inadequately capturing operational variability. Clustering or probabilistic trip distributions are suggested.
- Deterministic price scenarios (four scenarios with price extremes for 2025/2045) are employed, limiting generalizability. Stochastic optimization or Monte Carlo simulations are recommended.
- Scalability issues for large fleets or fine resolutions are faced by the MILP solver. Heuristics, metaheuristics, decomposition, and robust/stochastic methods are proposed.
- Focus is placed solely on operational energy costs. Integration of capital, maintenance, and subsidy costs is required for comprehensive fleet analysis.
Author Contributions
Conceptualization, T.W.; methodology, M.B. and T.W.; software, T.W.; validation, M.B. and T.W.; formal analysis, T.W.; investigation, T.W.; resources, M.L.; data curation, M.B., N.K., A.P. and T.W.; writing—original draft preparation, T.W.; writing—review and editing, M.B., N.K., M.L., A.P. and T.W.; visualization, T.W.; supervision, T.W.; project administration, M.L.; funding acquisition, M.L. All authors have read and agreed to the published version of the manuscript.
Funding
This research was funded by the German Federal Ministry for Economic Affairs and Energy, grant number 01MV23015A. The APC was funded by Technical University of Munich.
Institutional Review Board Statement
Not applicable.
Informed Consent Statement
Not applicable.
Data Availability Statement
To facilitate reproducibility and further research by the scientific community, the Python (version 3.13.1) code of the developed disposition algorithm is accessible on GitHub via the following address. We encourage other researchers to enhance the method further and apply it to a wide range of price levels, fleets, and scenarios “https://github.com/TUMFTM/potential_analysis_mixed_electrified_hdv_fleet_disposition_using_V2G” (accessed on 6 January 2026).
Acknowledgments
We would like to thank the German Federal Ministry for Economic Affairs and Energy for funding the research project SPIRIT-E (01MV23015A). The work described in this paper was conducted with basic research funds from the Institute of Automotive Technology at the Technical University of Munich.
Conflicts of Interest
The authors declare no conflicts of interest.
Abbreviations
The following abbreviations are used in this manuscript:
| A | inequality constraints matrix |
| Aeq | equality constraints matrix |
| aFRR | automatic frequency restoration reserve |
| AP | Assignment Problem |
| b | inequality constraints vector |
| BE | battery electric |
| BE-HDT | battery electric heavy-duty truck |
| beq | equality constraints vector |
| BEV | battery electric vehicle |
| c | cost vector |
| cCO | charging overhead cost |
| cE,fleet,BE | BE-HDT fleet energy cost |
| cE,fleet,HDT | mixed-electrified HDT fleet energy cost |
| cE,fleet,ICE | ICE-HDT fleet energy cost |
| cm | vehicle driving energy consumption cost |
| cV2G,t | V2G aFRR price at time step t |
| Ea,m | available vehicle energy storage capacity for vehicle m |
| E-FSMVRP-TW | electric fleet size and mix vehicle routing problem with time windows |
| E-VRP-TWMF | electric vehicle routing problem with time windows and mixed fleet |
| E-VSP | electric vehicle scheduling problem |
| F | set of trips |
| G-SA | global sensitivity analysis |
| HDT | heavy-duty truck |
| ICE | internal combustion engine |
| ICE-HDT | internal combustion engine heavy-duty truck |
| ICEV | internal combustion engine vehicle |
| IQR | interquartile range |
| L | set of locations |
| m | vehicle |
| M | set of vehicles |
| MBE | set of BE-HDT vehicles |
| MICE | set of ICE-HDT vehicles |
| MILP | mixed-integer linear programming |
| OAT-SA | one-at-a-time sensitivity analysis |
| Pcharge | charging power |
| PDP-TW | pickup and delivery problem with time windows |
| sf | trip distance per time step |
| SoC | state of charge |
| SoCm,t | state of charge for vehicle m at time t |
| t | time step |
| T | set of time steps |
| TCO | total-cost-of-ownership |
| tf | trip duration per time step |
| V2G | vehicle-to-grid |
| VRP | vehicle routing problem |
| xm,SoC,t | vehicle’s state-of-charge at time step t state vector |
| xm,t | vehicle per time step state vector |
| xm,t,charging | vehicle’s charging state at time step t state vector |
| xm,t,f | vehicle’s trip alocation at time step t state vector |
| xm,t,l | vehicle’s location at time step t state vector |
| xm,t,rl | vehicle’s relocation at time step t state vector |
Appendix A
Table A1.
Installed battery capacities of currently available battery electric heavy-duty trucks.
Table A2.
Detailed optimization results for a fleet size of 10, price scenarios with years 2025 and 2045, best and worst-case price scenarios, fleet electrification of 0% to 100% in 20% steps, activated and deactivated V2G, and the day 1 trip dataset.
Appendix B
Figure A1.
Overview of the ICE-HDT fleet disposition dataset provided by the research project SPIRIT-E. containing 127 days with a total of 8585 unique trips filtered for trips longer than 15 km and shorter than 540 km dispositioned in the year 2024 in Germany. shown as a violin plot for the distance of every unique trip and the median distance of every day.
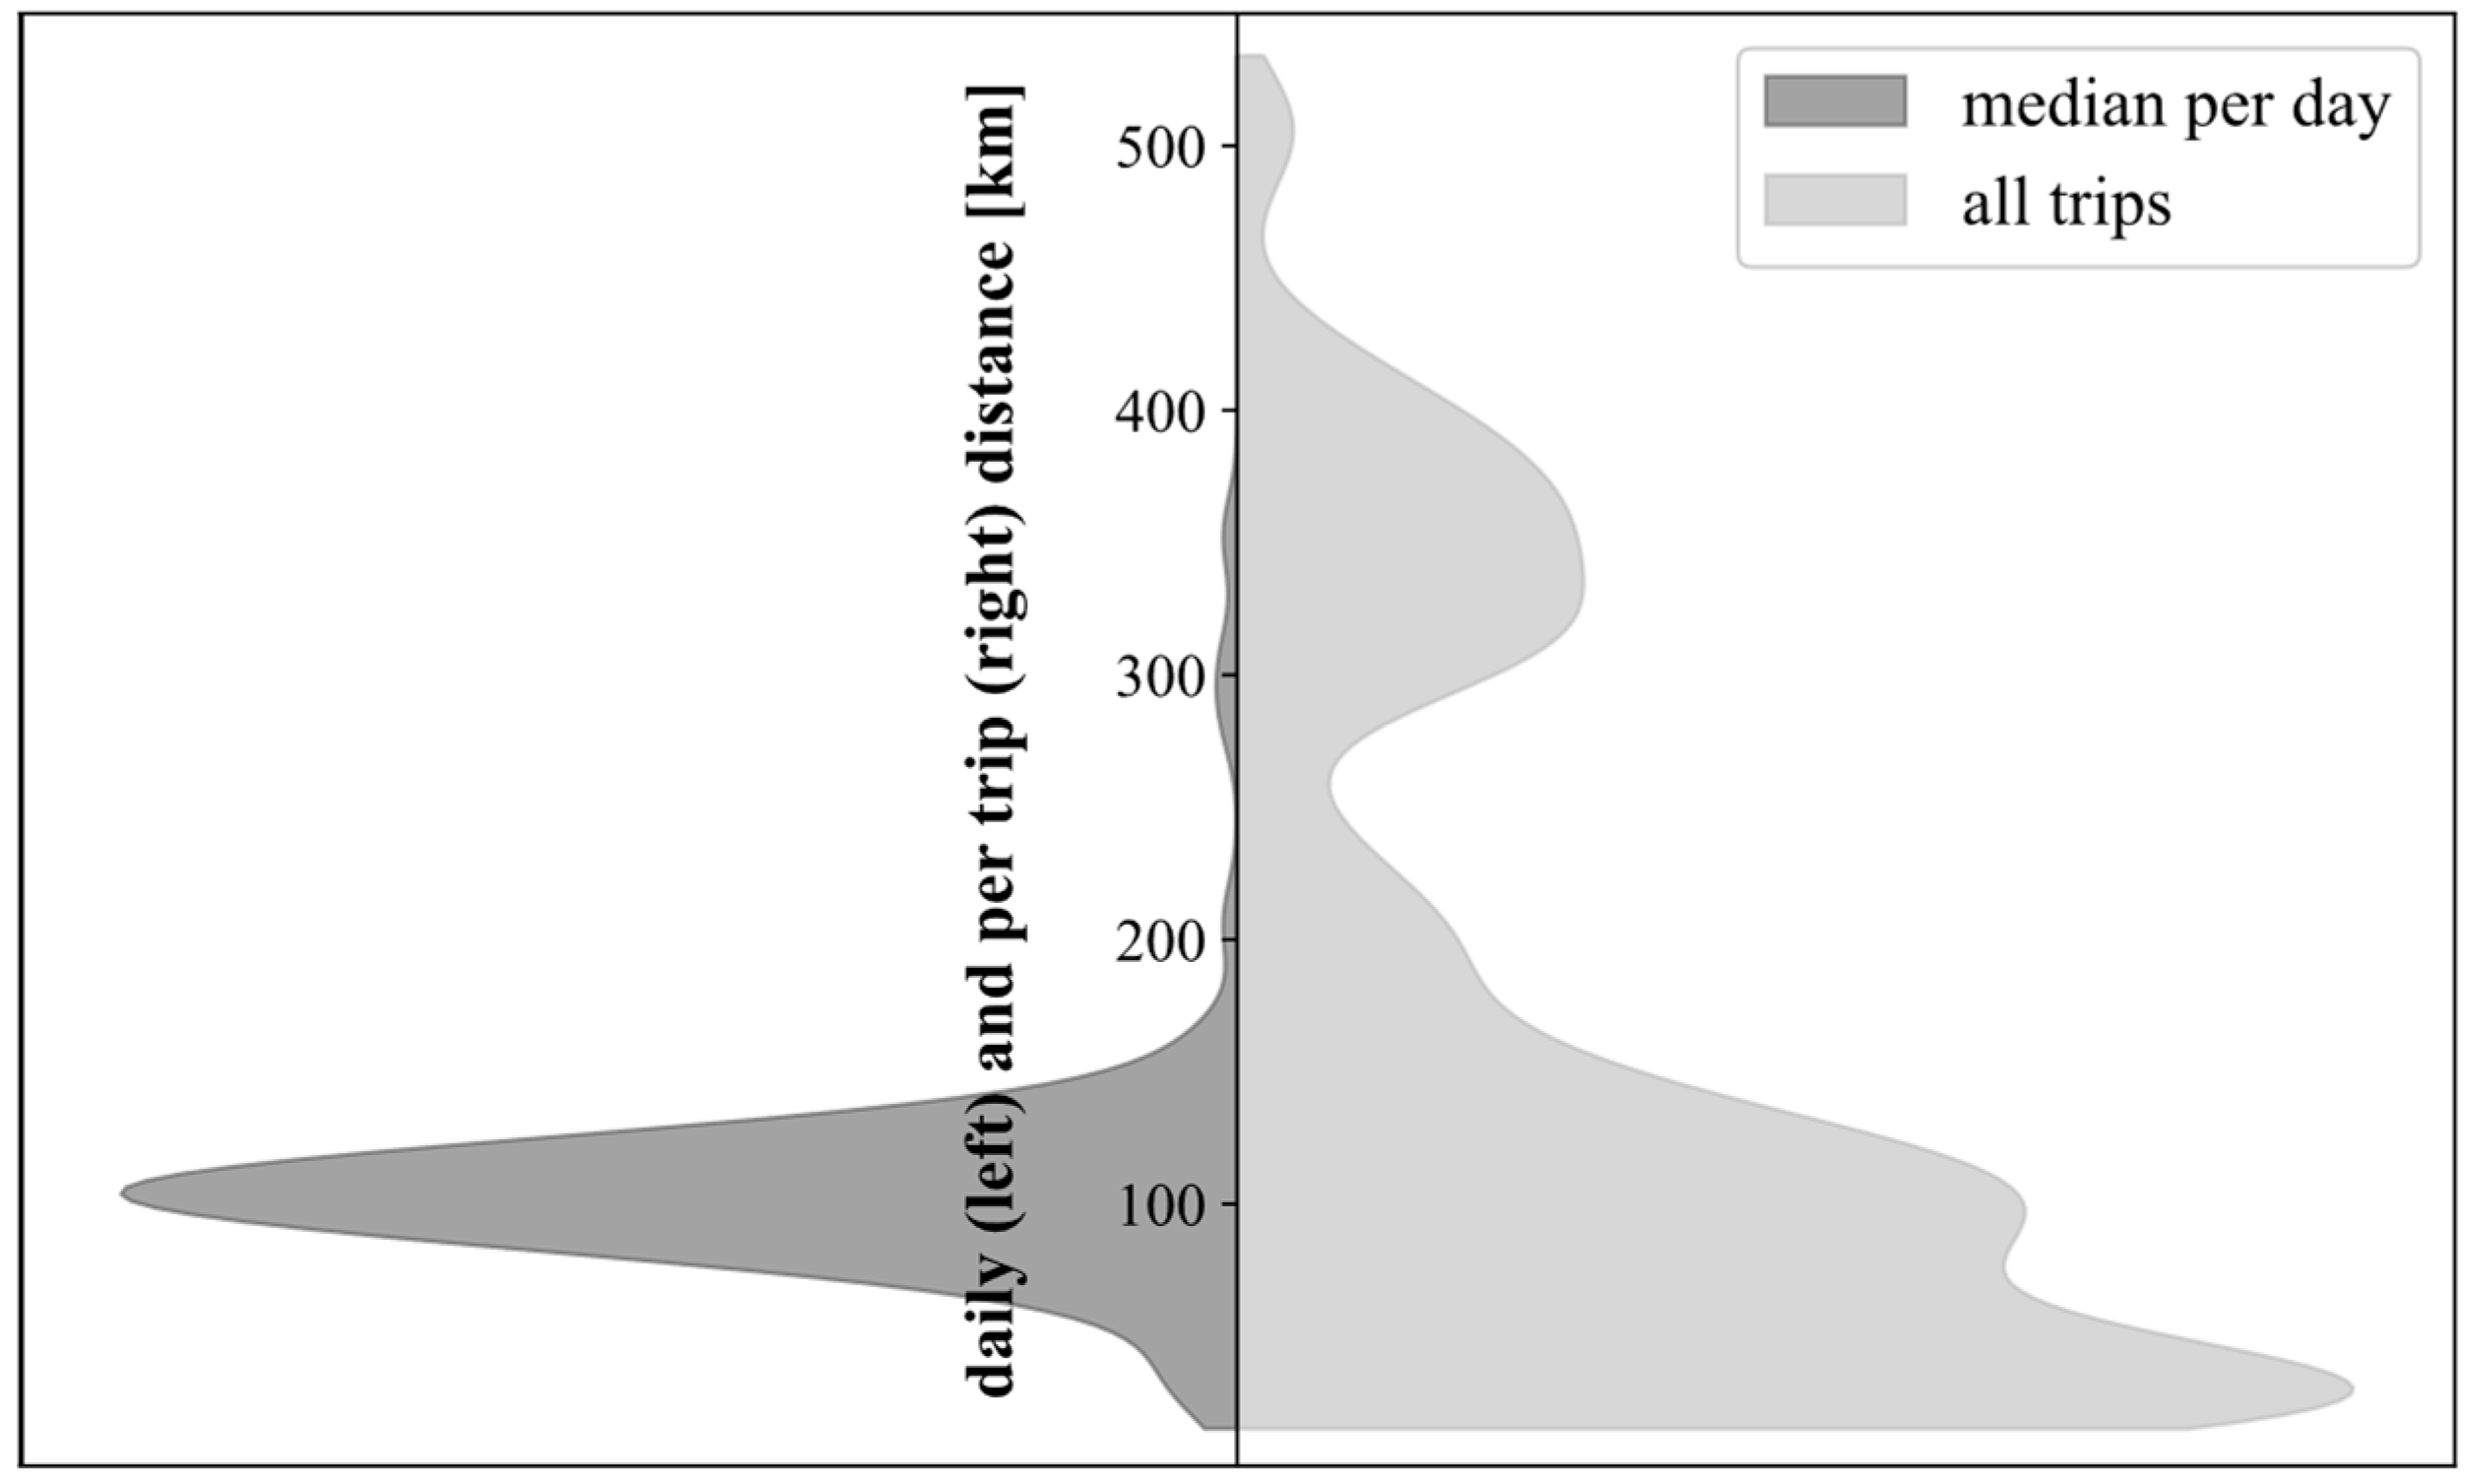
Figure A2.
Fleet cost composition comparison for six variations in the fleet electrification degrees (0–100%) for a fleet of 10 vehicles, day 1 trip set, cost levels of 2025 and a comparison of four scenarios as a combination of best vs. worst energy costs and state-of-the-art disposition vs. novel V2G-integrating disposition.
References
- International Energy Agency (IEA). CO2 Emissions from Fuel Combustion 2019: Highlights. Paris. November 2019. Available online: https://www.oecd.org/en/publications/co2-emissions-from-fuel-combustion-2019_2a701673-en.html (accessed on 28 November 2025).
- International Energy Agency (IEA). Global Energy Review 2025. Paris. March 2025. Available online: https://www.iea.org/reports/global-energy-review-2025 (accessed on 28 November 2025).
- European Commission. European Green Deal: Commission Proposes 2030 Zero-Emissions Target for New City Buses and 90% Emissions Reductions for New Trucks by 2040. Strasbourg. 2023. Available online: https://ec.europa.eu/commission/presscorner/detail/en/ip_23_762 (accessed on 1 December 2025).
- ACEA. New Commercial Vehicle Registrations. European Union: New Commercial Vehicle Registrations: Vans −12.2%. Trucks −16%. Buses −1.8% in Q1 2025: European Automobile Manufacturers’ Association (ACEA). 2025. Available online: https://www.acea.auto/cv-registrations/new-commercial-vehicle-registrations-vans-12-2-trucks-16-buses-1-8-in-q1-2025/ (accessed on 27 November 2025).
- Earl, T.; Mathieu, L.; Cornelis, S.; Kenny, S.; Calvo Ambel, C.; Nix, J. Analysis of long haul battery electric trucks in EU: Marketplace and technology. economic. environmental. and policy perspectives. In Proceedings of the 8th Commercial Vehicle Workshop, Graz, Austria, 17–18 May 2018. [Google Scholar]
- al Irsyad, M.I.; Inayah, I.; Nugraheni, R.D.; Pandyaswargo, A.H.; Supriatna, N.K.; Purwanto, A.J.; Firmansyah, A.I.; Harisetyawan, V.T.F.; Gunawan, Y.; Gusti Ngurah Agung Surya Pradipta Negara, I.; et al. Research trends in the total cost of ownership for electric vehicles: A systematic literature review. Energy Sustain. Dev. 2025, 87, 101746. [Google Scholar] [CrossRef] [Scilit]
- Kempton, W.; Tomic, J.; Letendre, S.; Brooks, A.; Lipman, T. Vehicle-to-Grid Power: Battery. Hybrid. and Fuel Cell Vehicles as Resources for Distributed Electric Power in California. 2001. Available online: https://www1.udel.edu/V2G/docs/V2G-Cal-2001.pdf (accessed on 27 November 2025).
- Vagropoulos, S.I.; Bakirtzis, A.G. Optimal Bidding Strategy for Electric Vehicle Aggregators in Electricity Markets. IEEE Trans. Power Syst. 2013, 28, 4031–4041. [Google Scholar] [CrossRef] [Scilit]
- Brödel, M.; Rosner, P.; Lienkamp, M. Monetizing Electric Vehicle Flexibility in Europe: A Comprehensive Economic Assessment of Intelligent On-Site and Off-Site Energy System Integration. In Proceedings of the Transportation Research Symposium 2025, Rotterdam, The Netherlands, 25–28 May 2025. [Google Scholar]
- Balke, G.; Adenaw, L. Heavy commercial vehicles’ mobility: Dataset of trucks’ anonymized recorded driving and operation (DT-CARGO). Data Brief 2023, 48, 109246. [Google Scholar] [CrossRef] [Scilit] [PubMed]
- Golden, B.; Assad, A.; Levy, L.; Gheysens, F. The fleet size and mix vehicle routing problem. Comput. Oper. Res. 1984, 11, 49–66. [Google Scholar] [CrossRef] [Scilit]
- Savelsbergh, M.W.P.; Sol, M. The General Pickup and Delivery Problem. Transp. Sci. 1995, 29, 17–29. [Google Scholar] [CrossRef] [Scilit]
- Pillac, V.; Gendreau, M.; Guéret, C.; Medaglia, A.L. A review of dynamic vehicle routing problems. Eur. J. Oper. Res. 2013, 225, 1–11. [Google Scholar] [CrossRef] [Scilit]
- Taillard, É.; Badeau, P.; Gendreau, M.; Guertin, F.; Potvin, J.-Y. A Tabu Search Heuristic for the Vehicle Routing Problem with Soft Time Windows. Transp. Sci. 1997, 31, 170–186. [Google Scholar] [CrossRef] [Scilit]
- Betz, J.; Werner, D.; Lienkamp, M. Fleet Disposition Modeling to Maximize Utilization of Battery Electric Vehicles in Companies with On-Site Energy Generation. Transp. Res. Procedia 2016, 19, 241–257. [Google Scholar] [CrossRef] [Scilit]
- Sassi, O.; Oulamara, A. Electric vehicle scheduling and optimal charging problem: Complexity. exact and heuristic approaches. Int. J. Prod. Res. 2016, 55, 519–535. [Google Scholar] [CrossRef] [Scilit]
- Wu, Z.; Zou, Y.; Zheng, F.; Liang, N. Research on Optimal Scheduling Strategy of Microgrid Considering Electric Vehicle Access. Symmetry 2023, 15, 1993. [Google Scholar] [CrossRef] [Scilit]
- Abid, M.; Tabaa, M.; Chakir, A.; Hachimi, H. Routing and charging of electric vehicles: Literature review. Energy Rep. 2022, 8, 556–578. [Google Scholar] [CrossRef] [Scilit]
- Peng, D.; Zhao, Z.; Wu, G.; Boriboonsomsin, K. Bi-Level Fleet Dispatching Strategy for Battery-Electric Trucks: A Real-World Case Study. Sustainability 2023, 15, 925. [Google Scholar] [CrossRef] [Scilit]
- Wang, R.; Zeng, T.; Keyantuo, P.; Sandoval, J.; Vishwanath, A.; Borhan, H.; Moura, S. Optimal Dispatch and Routing of Electrified Heavy-Duty Truck Fleets: A Case Study with Fleet Data. In Proceedings of the 2023 American Control Conference (ACC), San Diego, CA, USA, 31 May 2023–2 June 2023; pp. 1729–1734. [Google Scholar]
- Lin, J.; Zhou, W.; Wolfson, O. Electric Vehicle Routing Problem. Transp. Res. Procedia 2016, 12, 508–521. [Google Scholar] [CrossRef] [Scilit]
- Pelletier, S.; Jabali, O.; Mendoza, J.E.; Laporte, G. The electric bus fleet transition problem. Transp. Res. Part C Emerg. Technol. 2019, 109, 174–193. [Google Scholar] [CrossRef] [Scilit]
- Goeke, D.; Schneider, M. Routing a mixed fleet of electric and conventional vehicles. Eur. J. Oper. Res. 2015, 245, 81–99. [Google Scholar] [CrossRef] [Scilit]
- Schneider, M.; Stenger, A.; Goeke, D. The Electric Vehicle-Routing Problem with Time Windows and Recharging Stations. Transp. Sci. 2014, 48, 500–520. [Google Scholar] [CrossRef] [Scilit]
- Dönmez, S.; Koç, Ç.; Altıparmak, F. The mixed fleet vehicle routing problem with partial recharging by multiple chargers: Mathematical model and adaptive large neighborhood search. Transp. Res. Part E Logist. Transp. Rev. 2022, 167, 102917. [Google Scholar] [CrossRef] [Scilit]
- Hiermann, G.; Puchinger, J.; Ropke, S.; Hartl, R.F. The Electric Fleet Size and Mix Vehicle Routing Problem with Time Windows and Recharging Stations. Eur. J. Oper. Res. 2016, 252, 995–1018. [Google Scholar] [CrossRef] [Scilit]
- Sortomme, E.; El-Sharkawi, M.A. Optimal Scheduling of Vehicle-to-Grid Energy and Ancillary Services. IEEE Trans. Smart Grid 2012, 3, 351–359. [Google Scholar] [CrossRef] [Scilit]
- Han, S.; Han, S.; Sezaki, K. Development of an Optimal Vehicle-to-Grid Aggregator for Frequency Regulation. IEEE Trans. Smart Grid 2010, 1, 65–72. [Google Scholar] [CrossRef] [Scilit]
- Schöder, D. Technisch-Wirtschaftliche Bewertung des Einsatzes von Batterieelektrischen Nutzfahrzeugen in der Distribution von Konsumgütern. Ph.D. Thesis, Technische Universität Berlin, Berlin, Germany, 2017. [Google Scholar]
- Cheng, X.; Lin, J. Is electric truck a viable alternative to diesel truck in long-haul operation? Transp. Res. Part D Transp. Environ. 2024, 129, 104119. [Google Scholar] [CrossRef] [Scilit]
- Gao, Z.; Lin, Z.; Franzese, O. Energy Consumption and Cost Savings of Truck Electrification for Heavy-Duty Vehicle Applications. Transp. Res. Rec. J. Transp. Res. Board 2017, 2628, 99–109. [Google Scholar] [CrossRef] [Scilit]
- Cenex. BETT—Battery Electric Truck Trial—Final Report. January 2024. Available online: https://www.cenex.co.uk/resources/bett-battery-electric-truck-trial-final-report/ (accessed on 1 December 2025).
- Le Corguillé, J.; Hacker, F. Real-World Data Analysis of Battery Electric Trucks Operating in Germany. June 2025. Available online: https://www.oeko.de/fileadmin/oekodoc/Real-world-data-analysis-of-battery-electric-trucks-operating-in-Germany.pdf (accessed on 27 November 2025).
- Mao, S.; Zhang, Y.; Rodriguez, F.; Wang, S.; Hao, C. Real-World Performance of Battery Electric Heavy-Duty Vehicles in China: Energy Consumption. Range. And Charging Patterns. April 2023. Available online: https://theicct.org/wp-content/uploads/2023/04/HDV-BEVs-real-world_final2.pdf (accessed on 1 December 2025).
- Fan, P.; Song, G.; Zhai, Z.; Wu, Y.; Yu, L. Fuel consumption estimation in heavy-duty trucks: Integrating vehicle weight into deep-learning frameworks. Transp. Res. Part D Transp. Environ. 2024, 130, 104157. [Google Scholar] [CrossRef] [Scilit]
- Todts, W. Comparing US and EU Truck Fuel Economy. Brussel, June 2015. Available online: https://www.transportenvironment.org/uploads/files/2015_06_Comparing_US_EU_truck_fuel_economy_explantory_note_Final.pdf (accessed on 1 December 2025).
- NOW GmbH. Environmentally-Friendly Commercial Vehicles: Vehicle Database. Available online: https://www.klimafreundliche-nutzfahrzeuge.de/fahrzeugdatenbank/?_sft_fahrzeugtyp=sattelzugmaschine (accessed on 1 December 2025).
- 38. DAF Trucks. New Generation DAF XF Electric. Available online: https://www.daf.co.uk/en-gb/trucks/new-generation-daf-xf-electric (accessed on 7 August 2025).
- MAN Trucks. The New MAN eTGX: The eTruck for Long Distances. Available online: https://www.man.eu/global/en/truck/all-models/the-man-tgx/the-man-etgx/overview.html (accessed on 7 August 2025).
- Renault Trucks. Renault Trucks E-Tech T. Available online: https://www.renault-trucks.de/product/etech-t (accessed on 7 August 2025).
- Scania. Stronger. Longer. and Even More Efficient: Meet Scania’s New Battery—999 Electric Trucks. Available online: https://www.scania.com/group/en/home/electrification/e-mobility-hub/stronger-longer-and-even-more-efficient-meet-scanias-new-batter-electric-trucks.html (accessed on 7 August 2025).
- Volvo Trucks. Volvo FH Electric. Available online: http://volvotrucks.com/en-en/trucks/fh-electric.html (accessed on 7 August 2025).
- Vennam, G.; Sahoo, A.; Ahmed, S. A survey on lithium-ion battery internal and external degradation modeling and state of health estimation. J. Energy Storage 2022, 52, 104720. [Google Scholar] [CrossRef] [Scilit]
- Sordi, G.; Stecchini, A.; Evangelista, R.; Luder, D.; Li, W.; Sauer, D.; Casalegno, A.; Rabissi, C. Degradation of lithium-ion batteries under automotive-like conditions: P2D model-based understanding and ex-situ validation. eTransportation 2025, 24, 100410. [Google Scholar] [CrossRef] [Scilit]
- Frontier Economics. Scenarios for the Market Ramp-Up of e-Fuels in Road Transportation: Updated Version. Convenience Translation. Original in German. January 2025. Available online: https://www.efuel-alliance.eu/fileadmin/Downloads/Scenarios_for_the_market_ramp-up_of_e-fuels_in_road_transport_-_Update_January_2025.pdf (accessed on 1 December 2025).
- Tol, D.; Frateur, T.; Verbeek, M.; Riemersma, I.; Mulder, H. Techno-Economic Uptake Potential of Zeroemission Trucks in Europe: TNO Report TNO 2022 R11862; The Hague 2022-STL-REP-100346496; TNO: Hague, The Netherlands, 2022. [Google Scholar]
- Duić, N. UNIZAG FSB Nedeljko Štefanić. UNIZAG FSB Zoran Lulić. UNIZAG FSB Goran Krajačić. UNIZAG FSB Tomislav Pukšec. UNIZAG FSB Tomislav Novosel. UNIZAG FSB. “EU28 Fuel Prices for 2015. 2030 and 2050: Deliverable 6.1: Future Fuel Price Review.”. November 2017. Available online: https://heatroadmap.eu/wp-content/uploads/2020/01/HRE4_D6.1-Future-fuel-price-review.pdf (accessed on 28 November 2025).
- Eurostat. Diesel. EUR per 1000 Litre. EuroGeographics. UN–FAO. Turkstat. January 2025. Available online: https://ec.europa.eu/newsroom/ener/redirection/document/111530 (accessed on 1 December 2025).
- Fraunhofer ISE. Current and Future Cost of Photovoltaics: Long-Term Scenarios for Market Development. System Prices and LCOE of Utility-Scale PV Systems: Study on Behalf of Agora Energiewende. Freiburg. Germany 059/01-S-2015/En. February 2015. Available online: https://www.ise.fraunhofer.de/content/dam/ise/de/documents/publications/studies/AgoraEnergiewende_Current_and_Future_Cost_of_PV_Feb2015_web.pdf (accessed on 28 November 2025).
- Fraunhofer ISE. Study: Levelized Cost of Electricity Renewable Energy Technologies. Freiburg. Germany. July 2024. Available online: https://www.ise.fraunhofer.de/en/publications/studies/cost-of-electricity.html (accessed on 28 November 2025).
- International Renewable Energy Agency (IRENA). Renewable Power Generation Costs in 2021; International Renewable Energy Agency (IRENA): Abu Dhabi, United Arab Emirates, 2022. [Google Scholar]
- 50Hertz Transmission GmbH. Regelleistung.net—Data Center: aFRR Energy Market D1. Available online: https://www.regelleistung.net/en-us/apps/datacenter/tendering-files/?productTypes=aFRR&markets=CAPACITY%2CENERGY&fileTypes=RESULTS%2CMAXIMUM_EXCHANGE_LIMIT&dateRange=2024-01-01%2C2024-12-31 (accessed on 1 December 2025).
- Martello, S.; Toth, P. An exact algorithm for large unbounded knapsack problems. Oper. Res. Lett. 1990, 9, 15–20. [Google Scholar] [CrossRef] [Scilit]
- Bixby, R.E. A brief history of linear and mixed-integer programming computation. Optim. Stories 2012, 6, 107–121. [Google Scholar] [CrossRef] [Scilit]
- Brendtmann, C.; Kellermann, J.; Moser, A. Vergleich kommerzieller und freier Solver bei der Durchführung von Netzbetriebssimulationen. Symp. Energieinnovation 2018, 1–10. [Google Scholar] [CrossRef]
- Keil, B.V. Gurobi vs. Google OR-Tools: Benchmarking in Tour Optimization. Bachelor Thesis, Department of Applied Computer Science, University of Applied Sciences Joanneum, Kapfenberg, Austria, 2022. Available online: https://epub.fh-joanneum.at/urn/urn:nbn:at:at-fhj:1-10091 (accessed on 1 December 2025).
- Gurobi Optimization, L.L. Release Notes for Gurobi 12.0. Available online: https://docs.gurobi.com/projects/optimizer/en/12.0/reference/releasenotes.html (accessed on 16 October 2020).
- Saltelli, A.; Ratto, M.; Andres, T.; Campolongo, F.; Cariboni, J.; Gatelli, D.; Saisana, M.; Tarantola, S. Global Sensitivity Analysis. The Primer; John Wiley & Sons: Hoboken, NJ, USA, 2008. [Google Scholar]
- Sobol′, I.M. Global sensitivity indices for nonlinear mathematical models and their Monte Carlo estimates. Math. Comput. Simul. 2001, 55, 271–280. [Google Scholar] [CrossRef] [Scilit]
- Mercedes-Benz Trucks. Technical Information eActros 600. Available online: https://www.mercedes-benz-trucks.com/int/en/trucks/eactros-600.html (accessed on 7 August 2025).
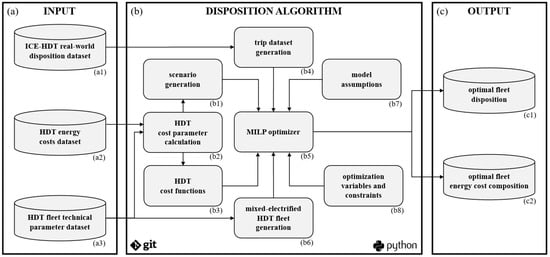
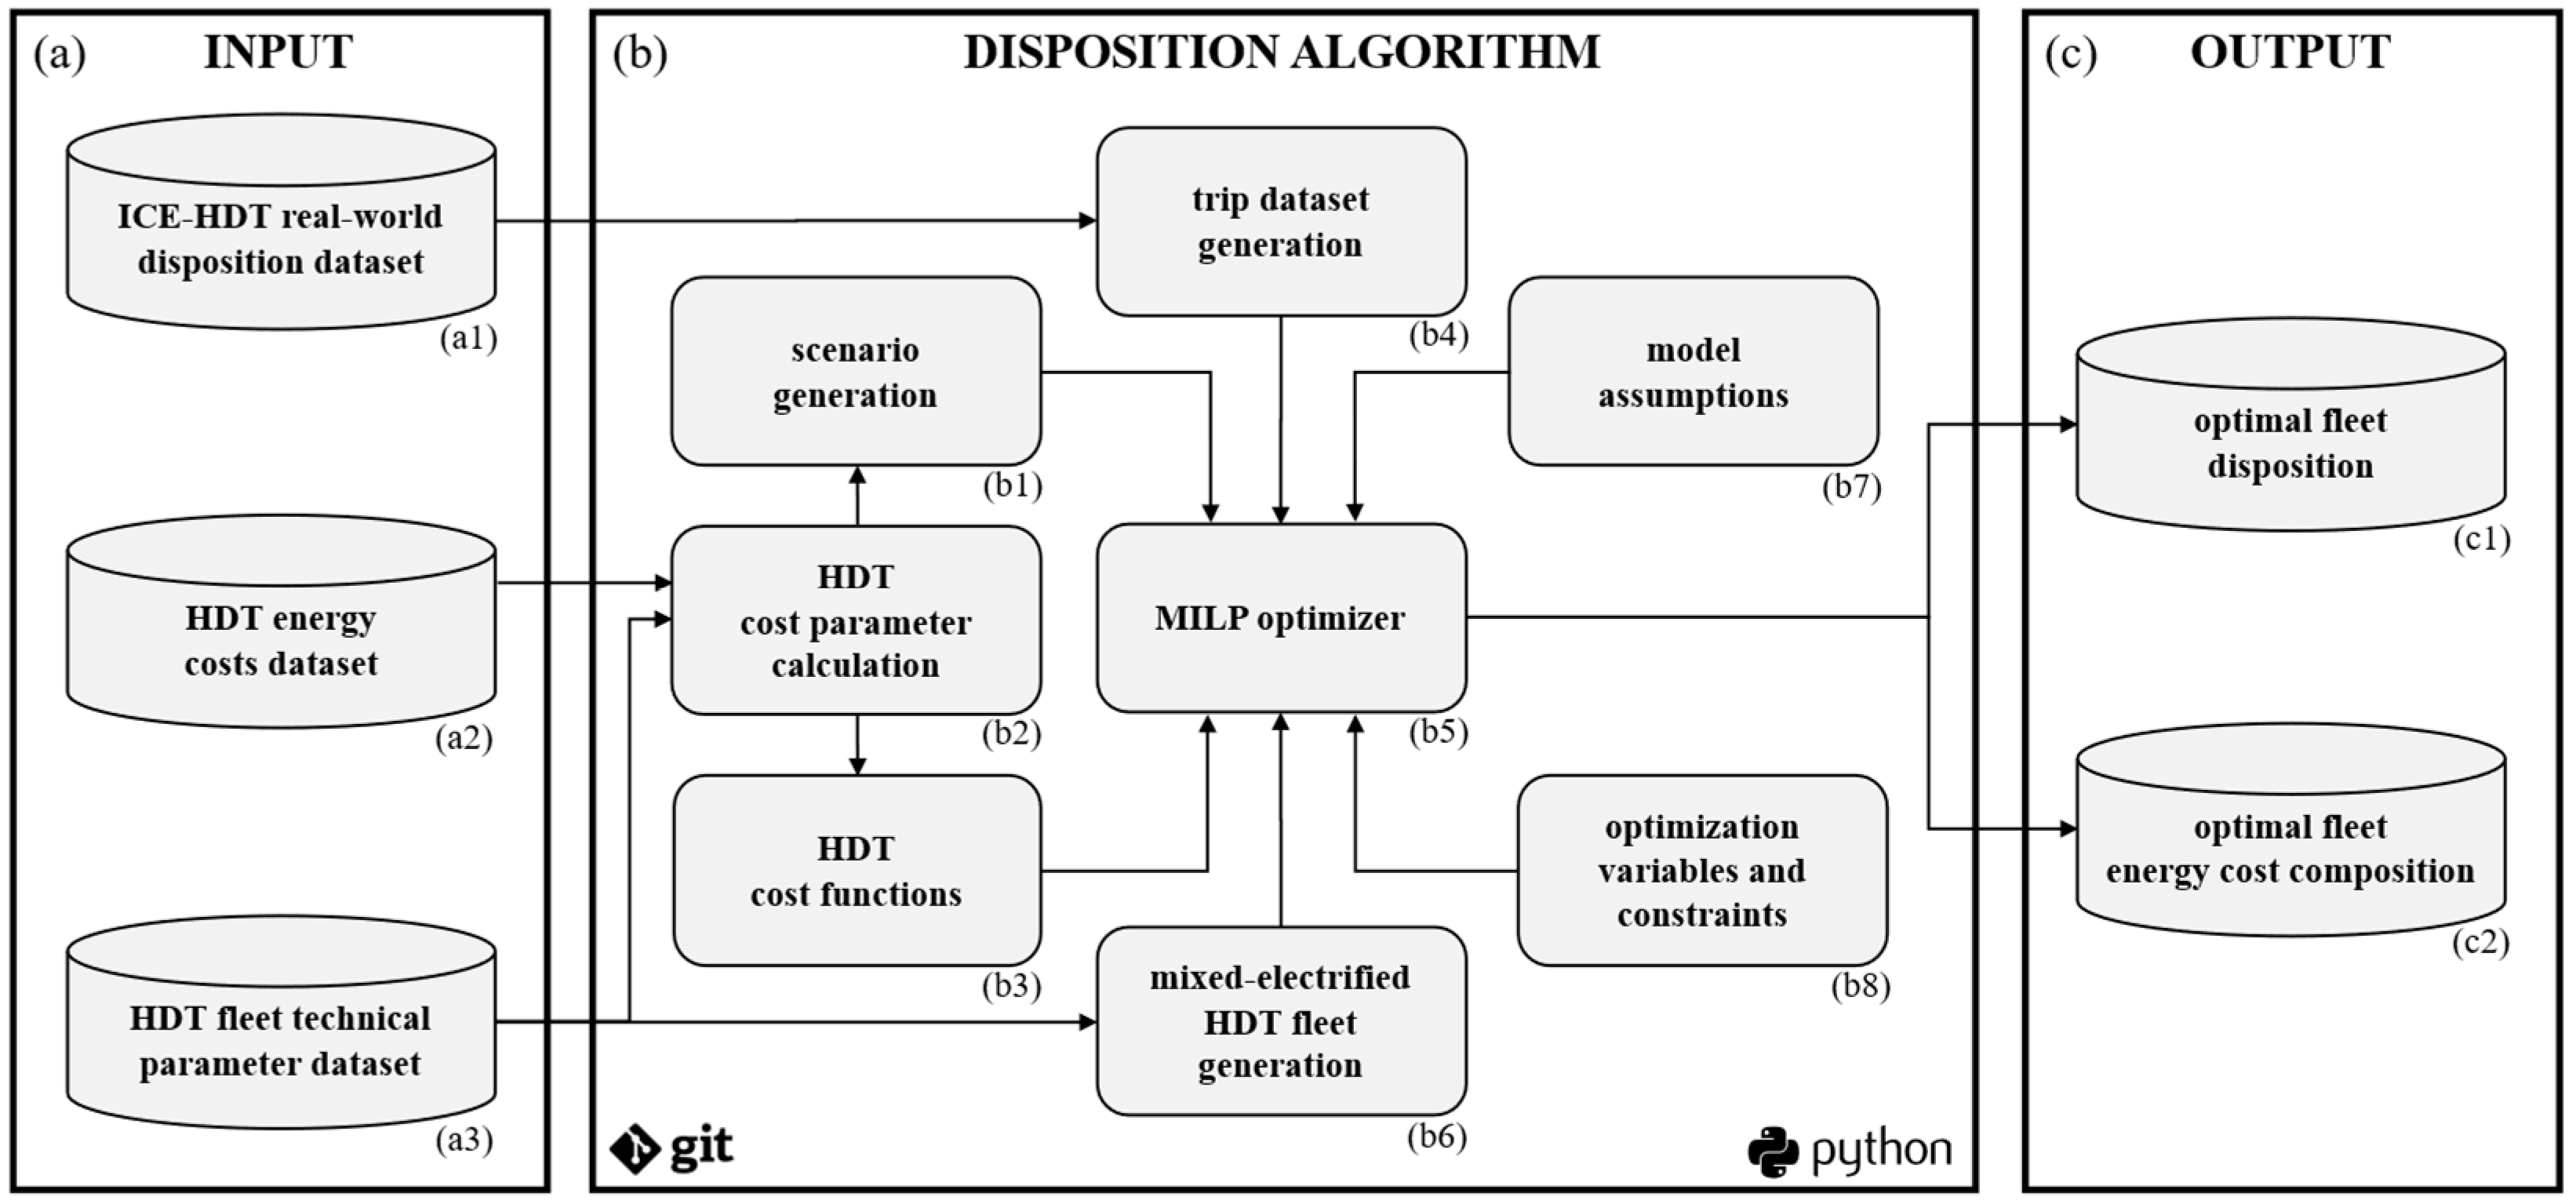
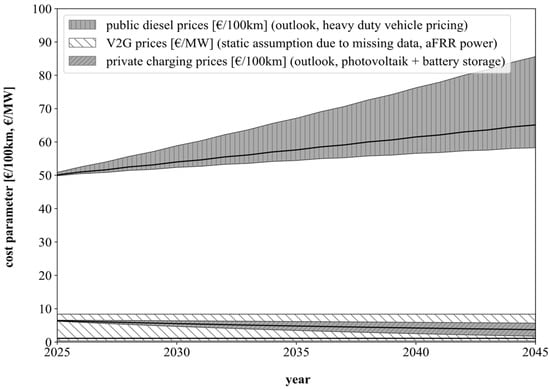
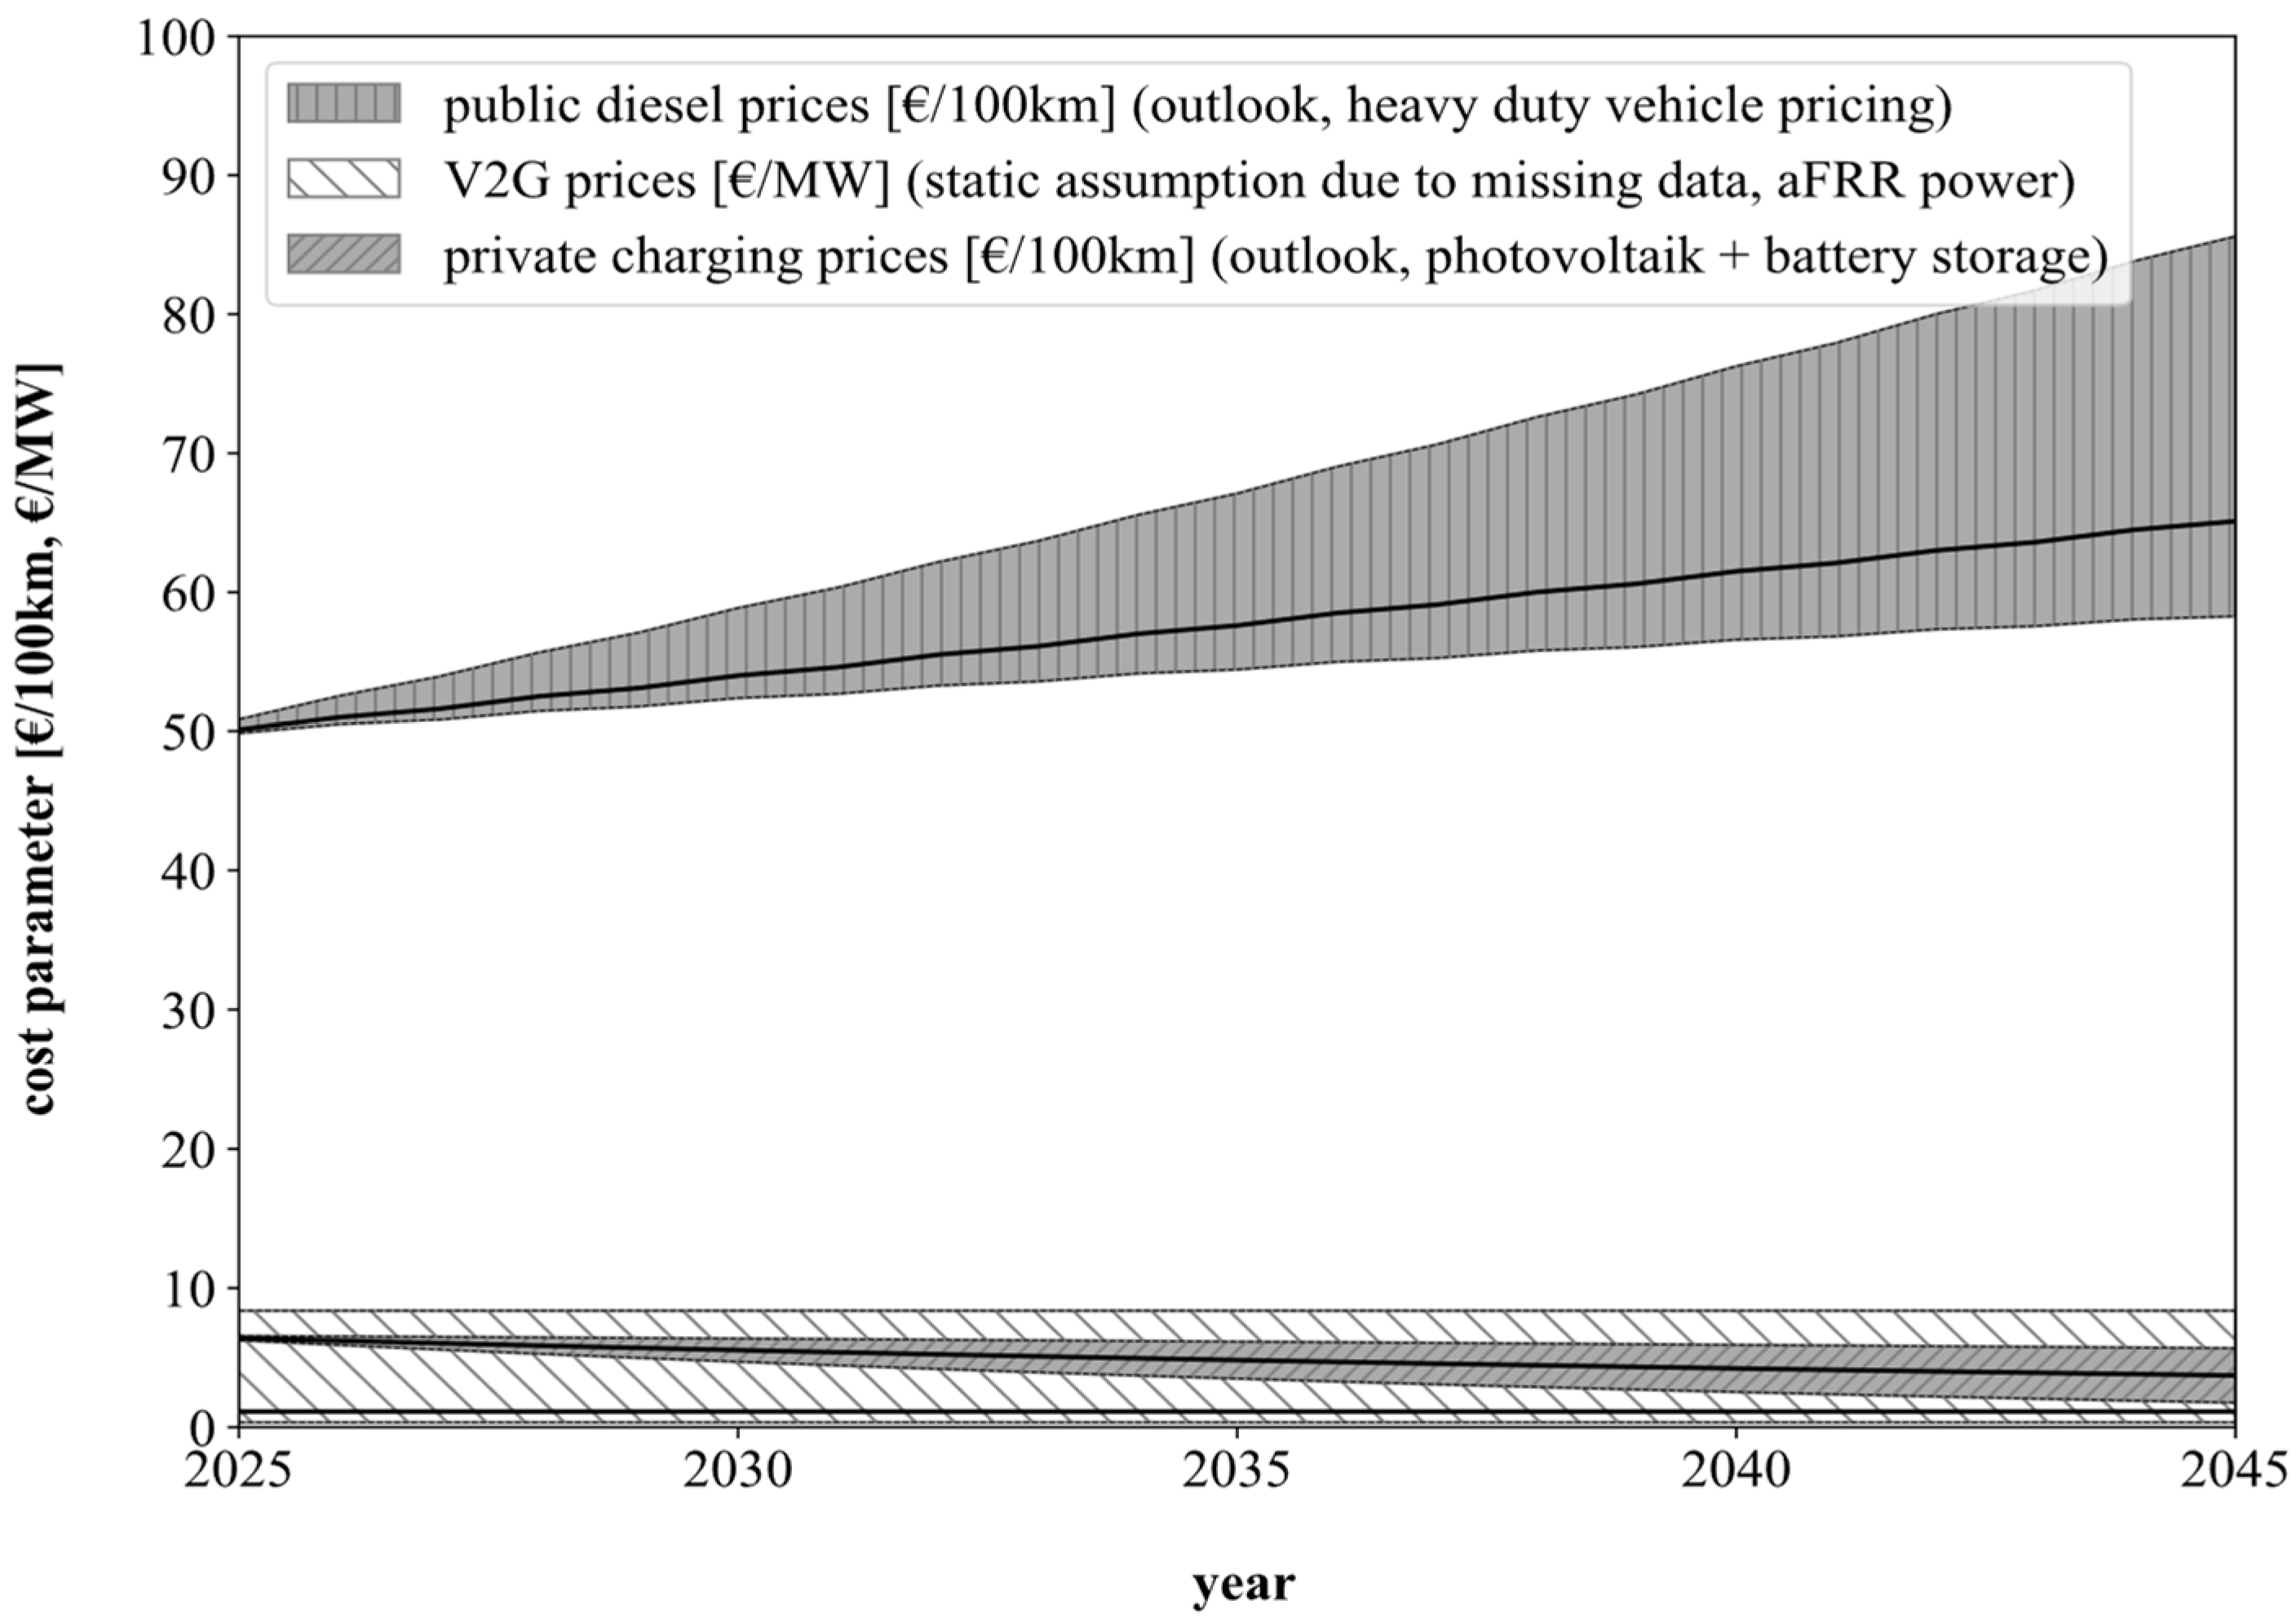
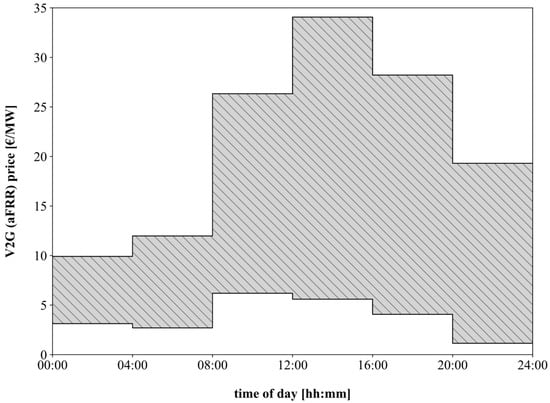
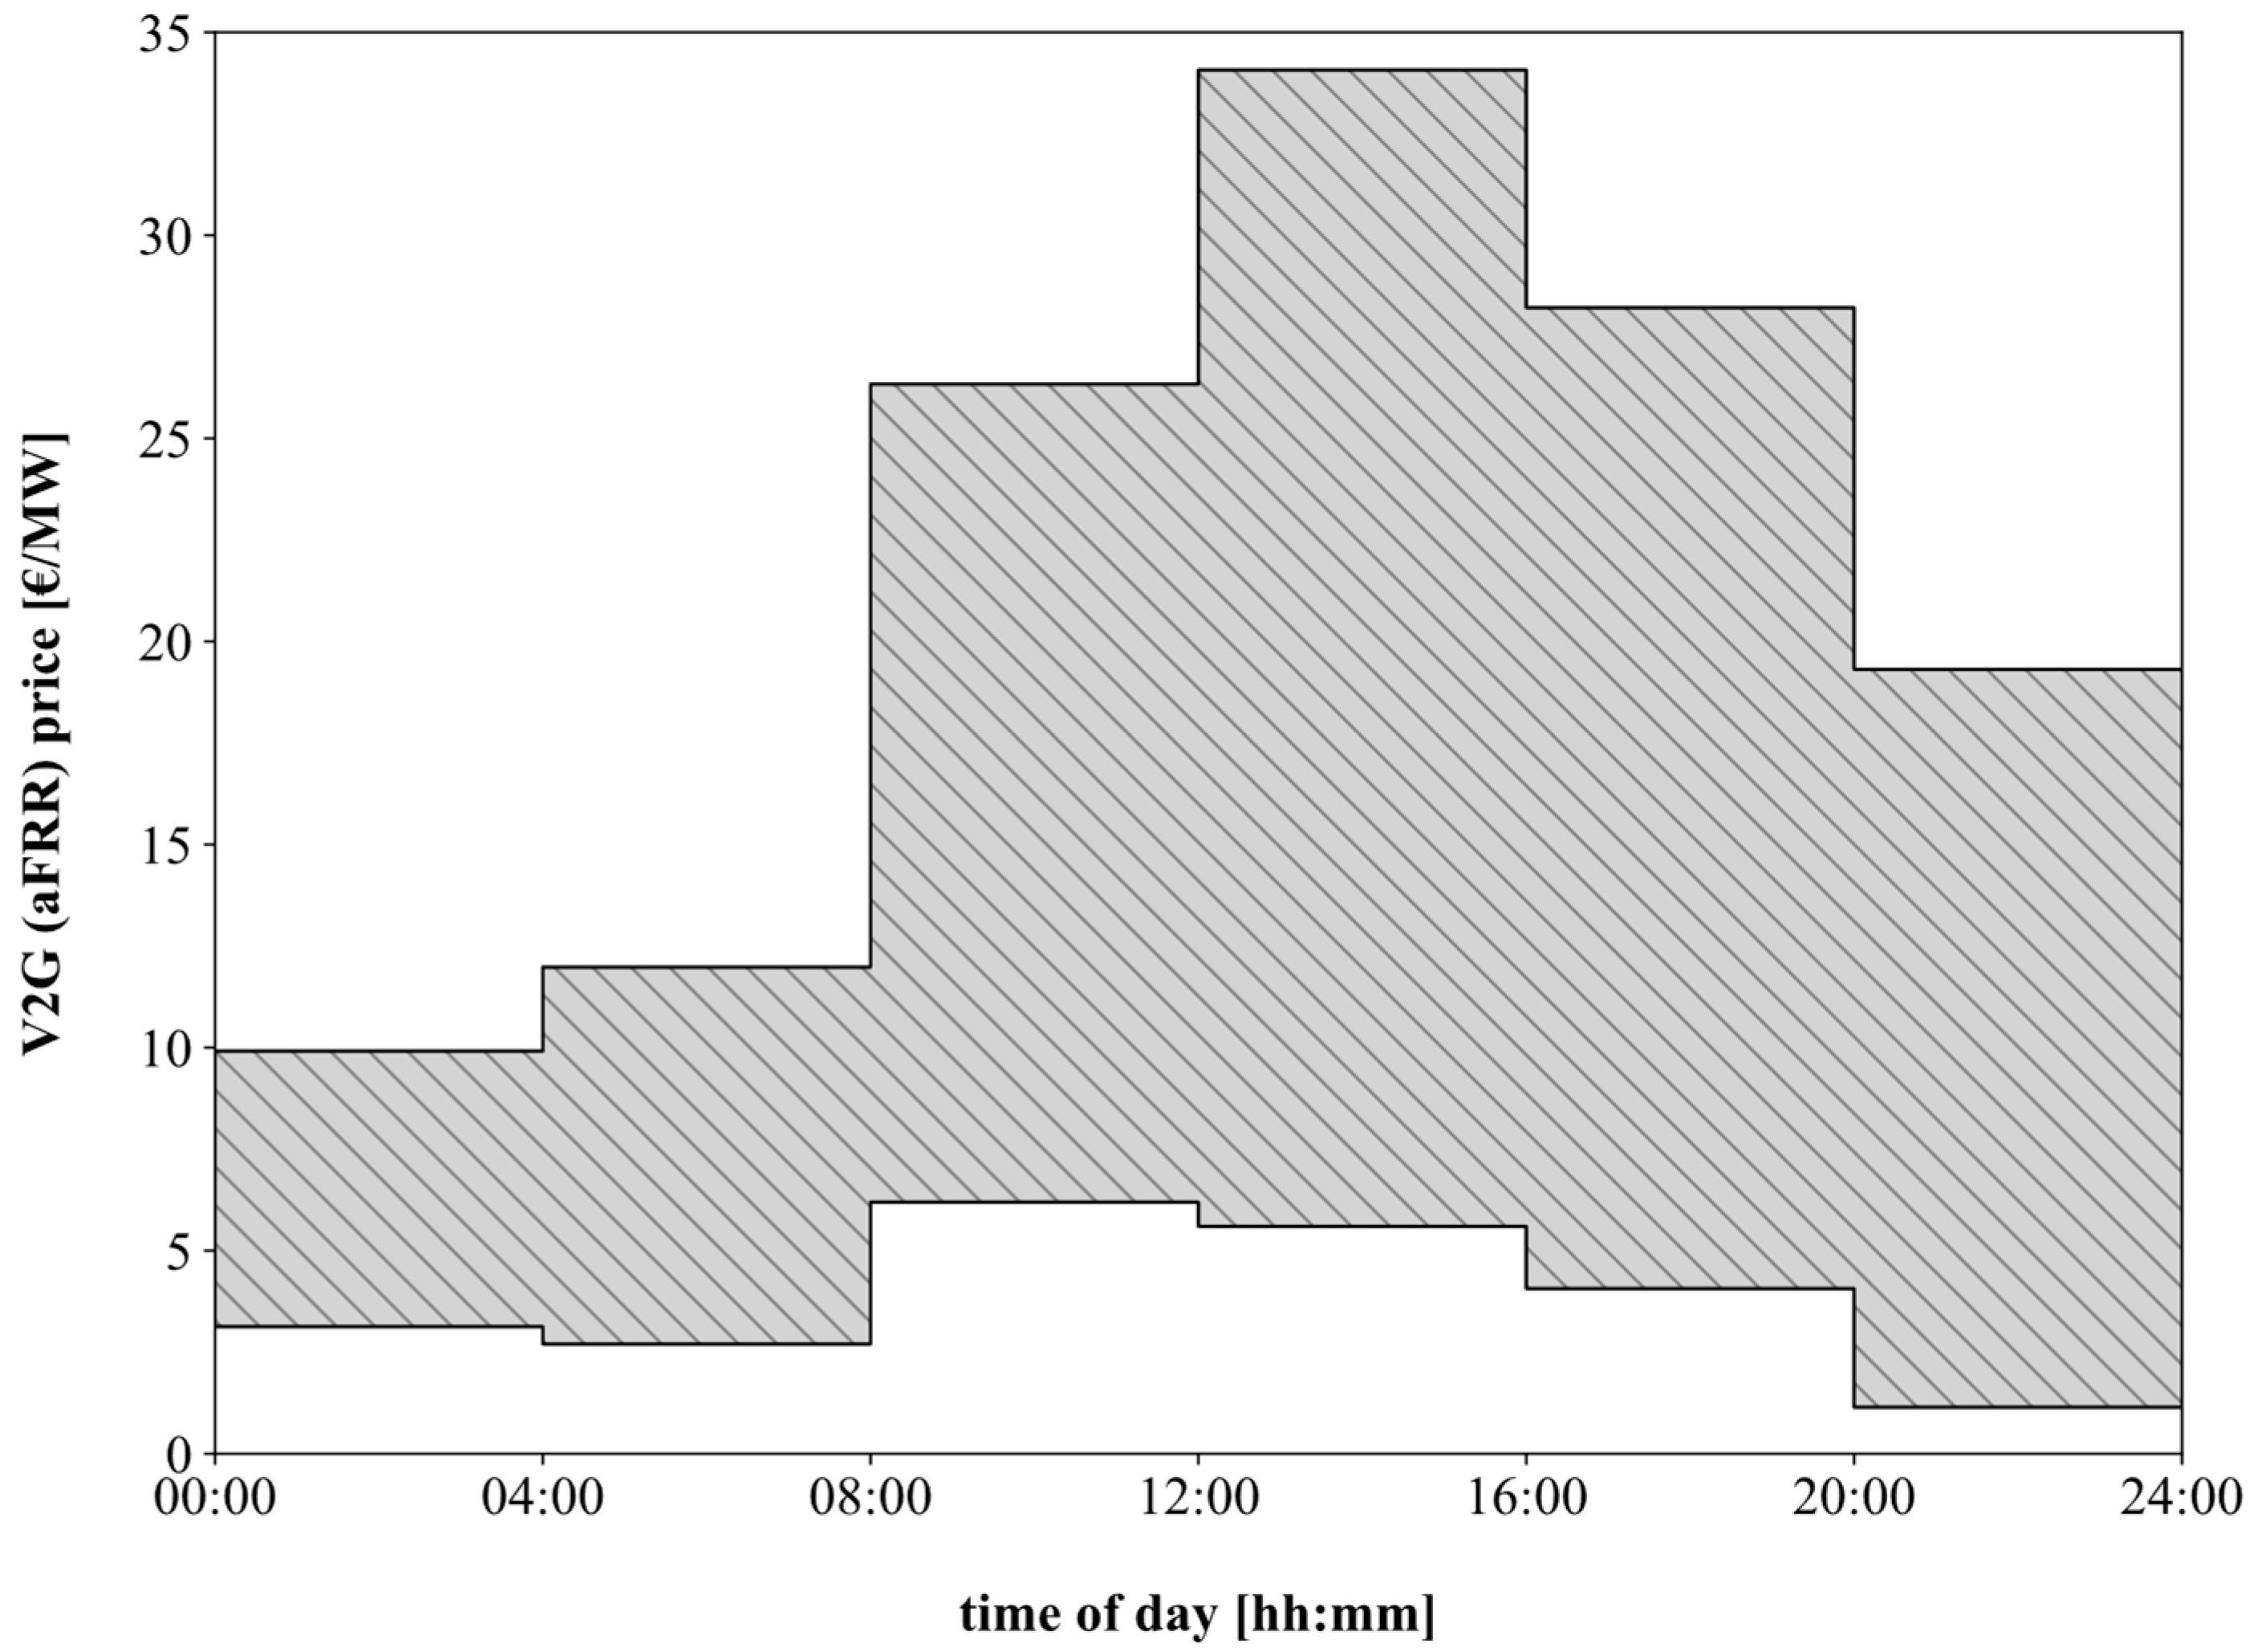
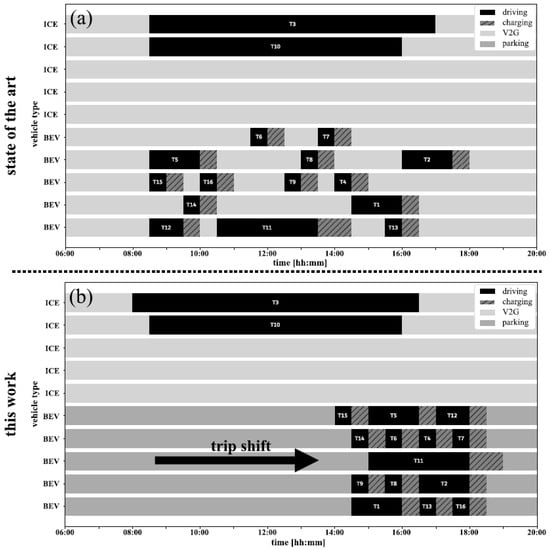
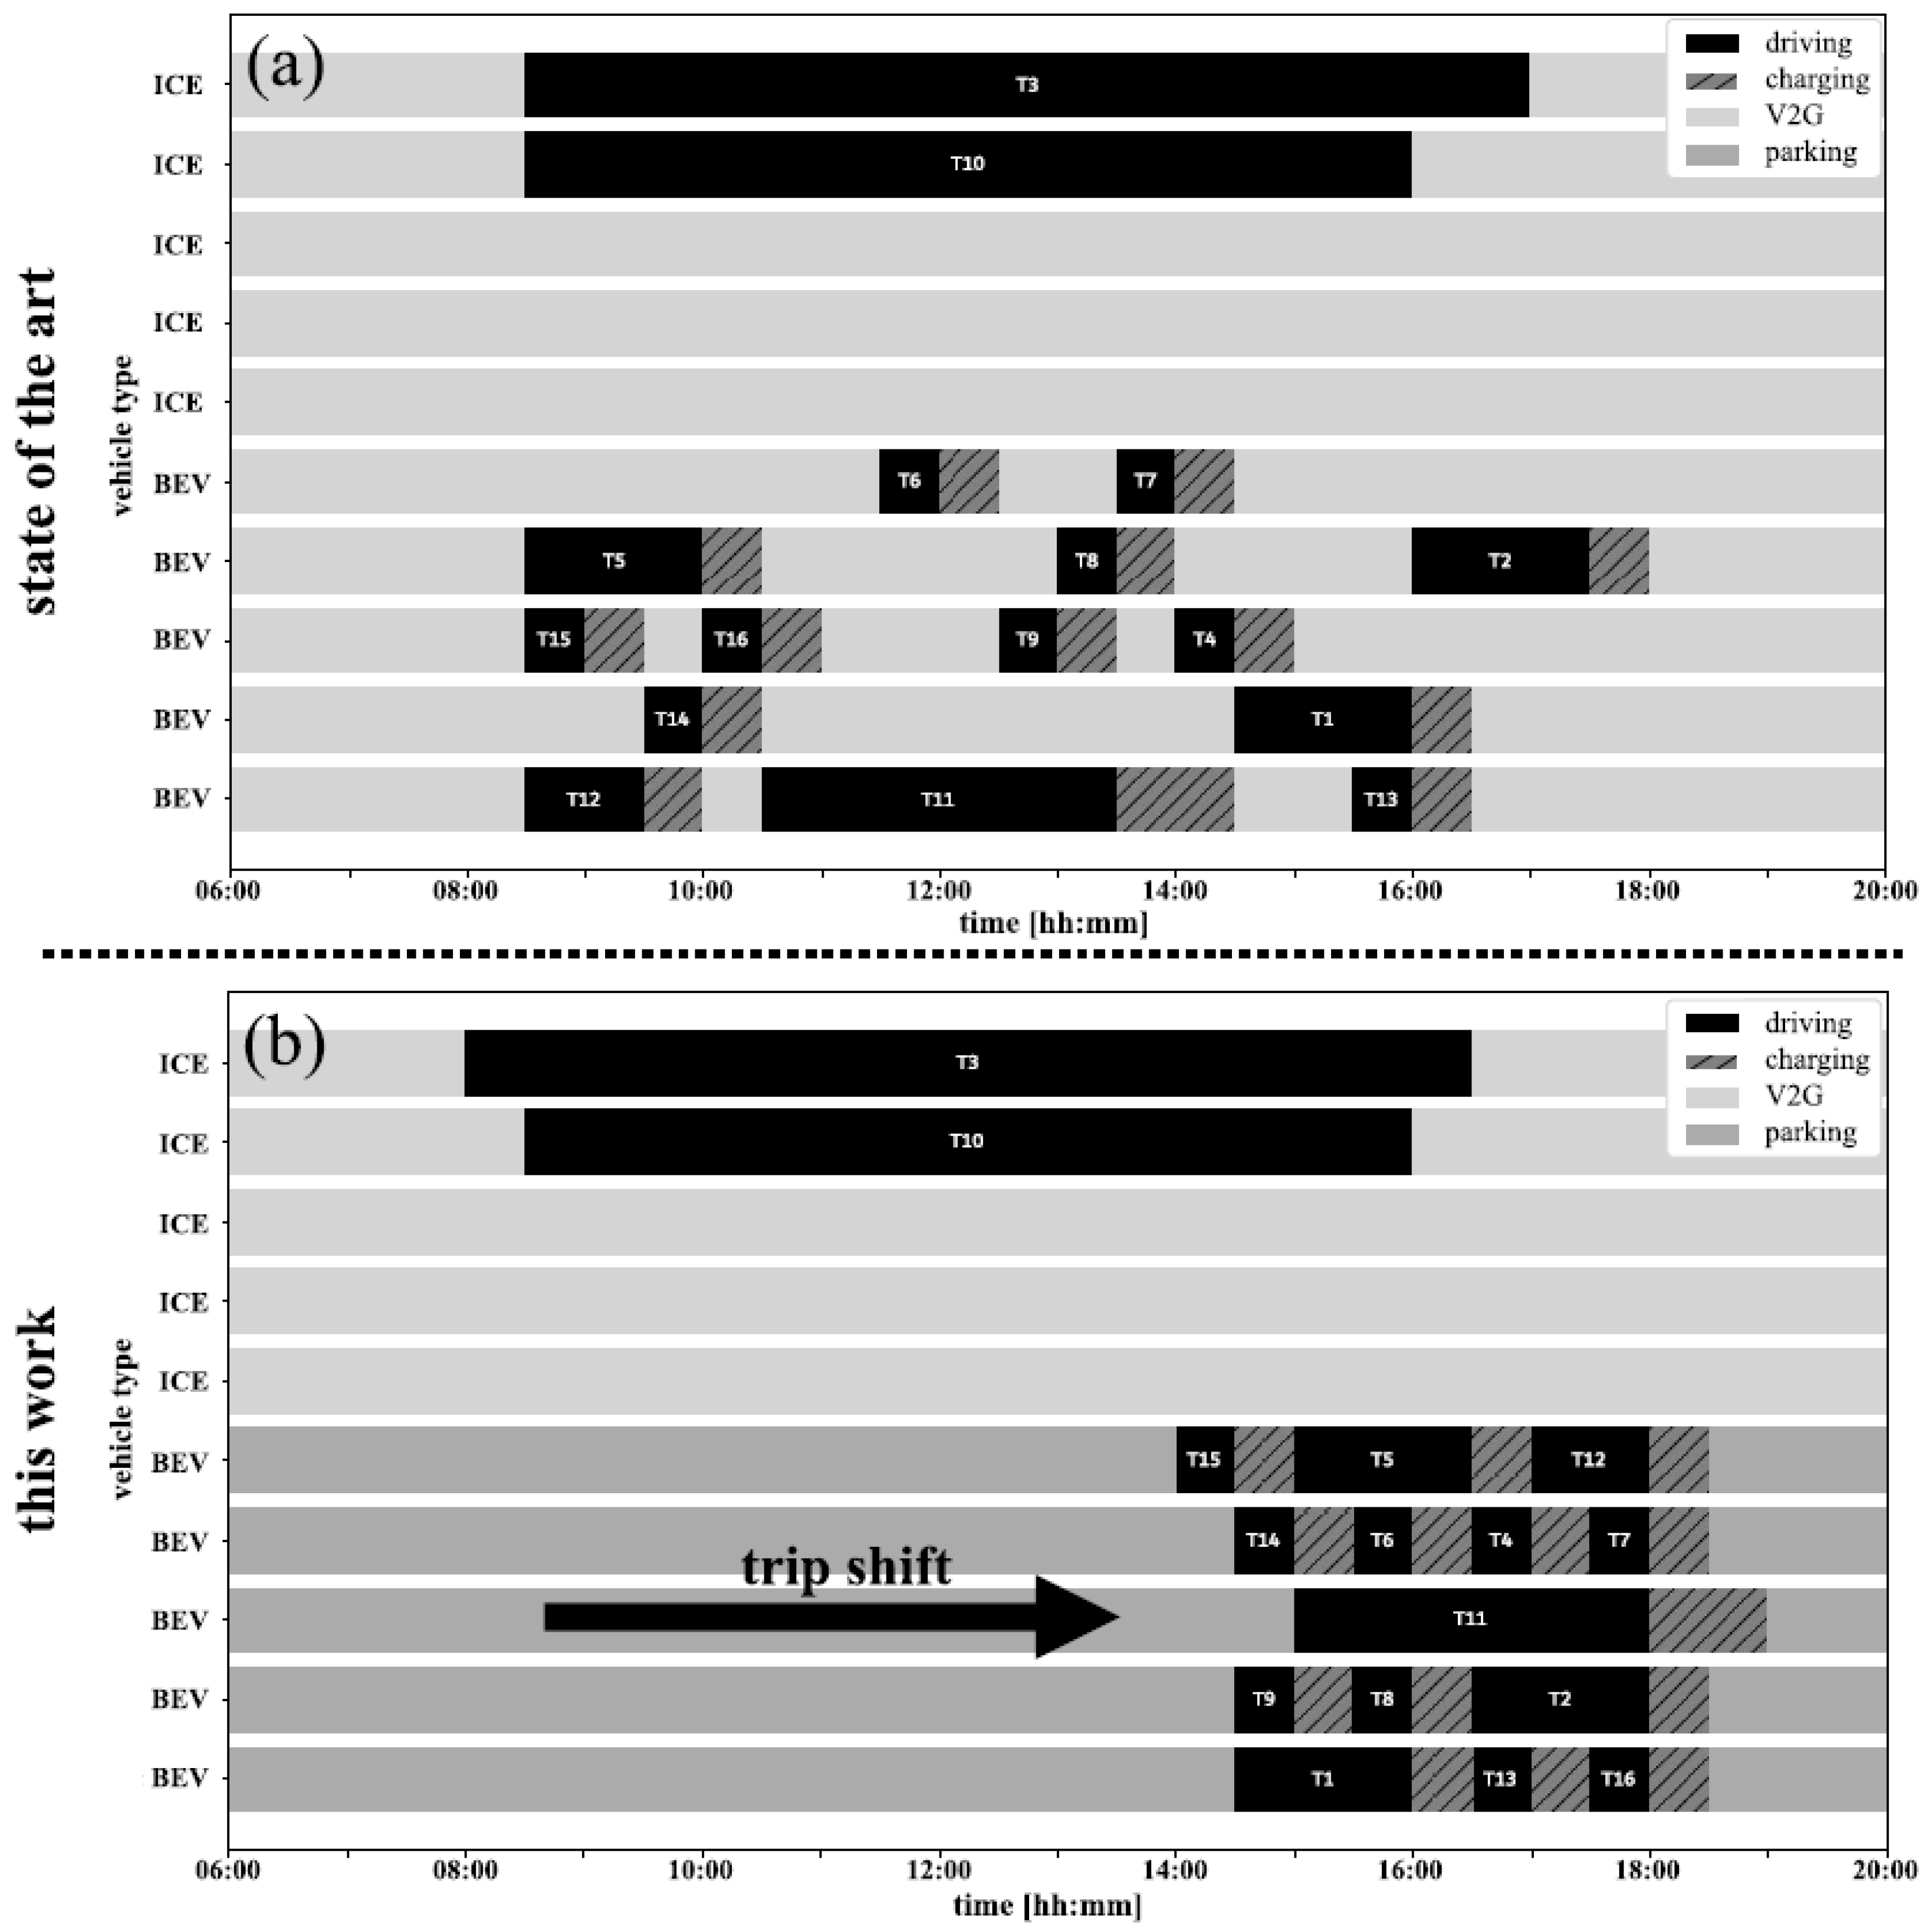
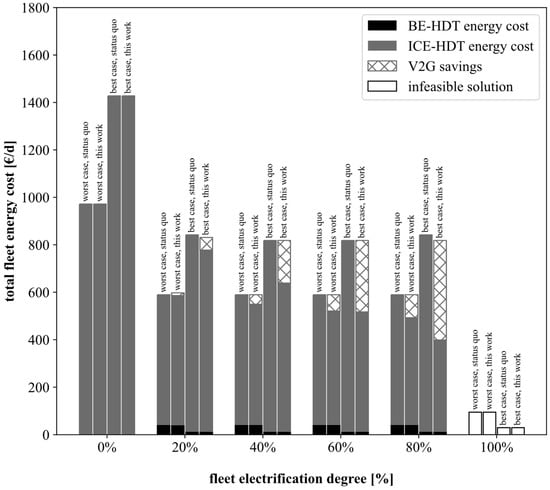
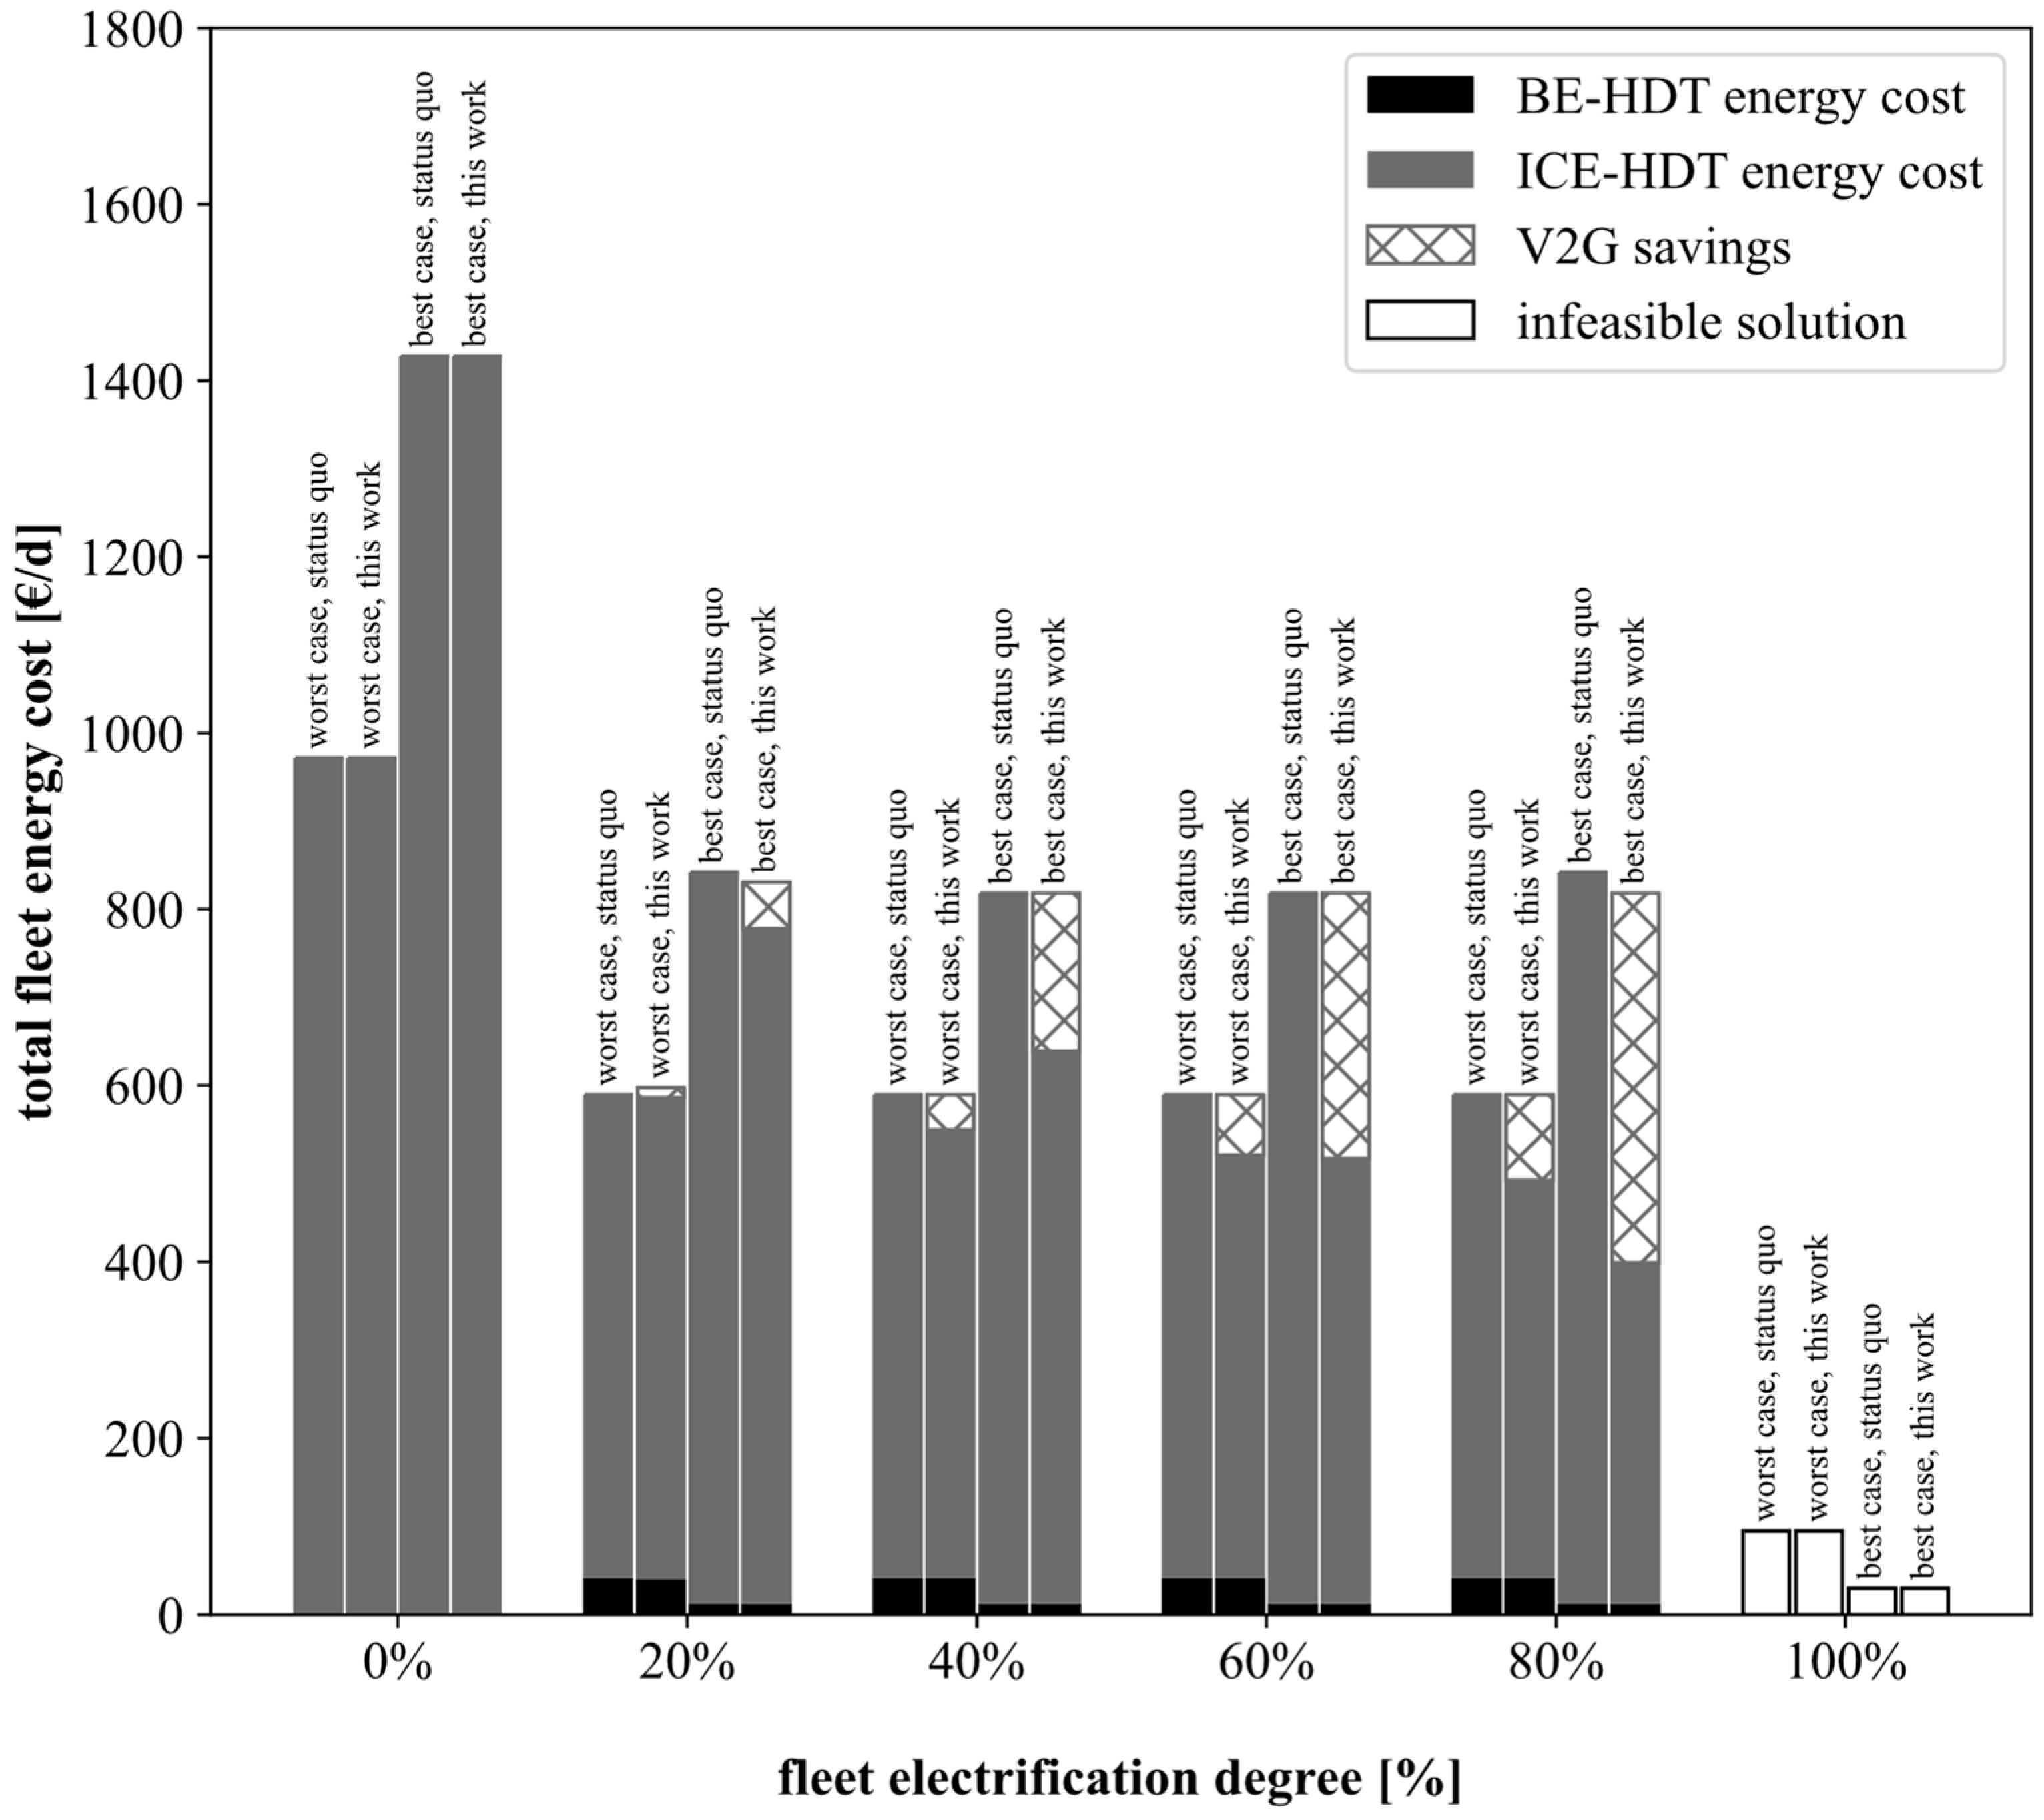
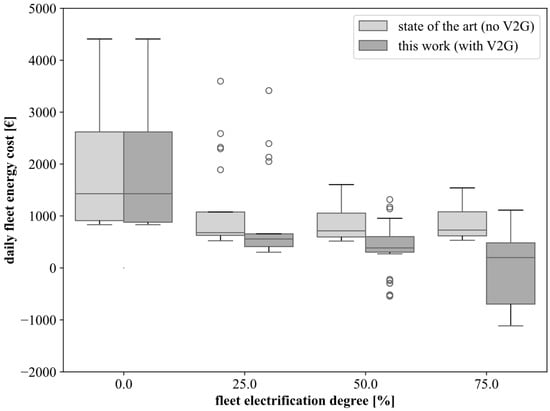
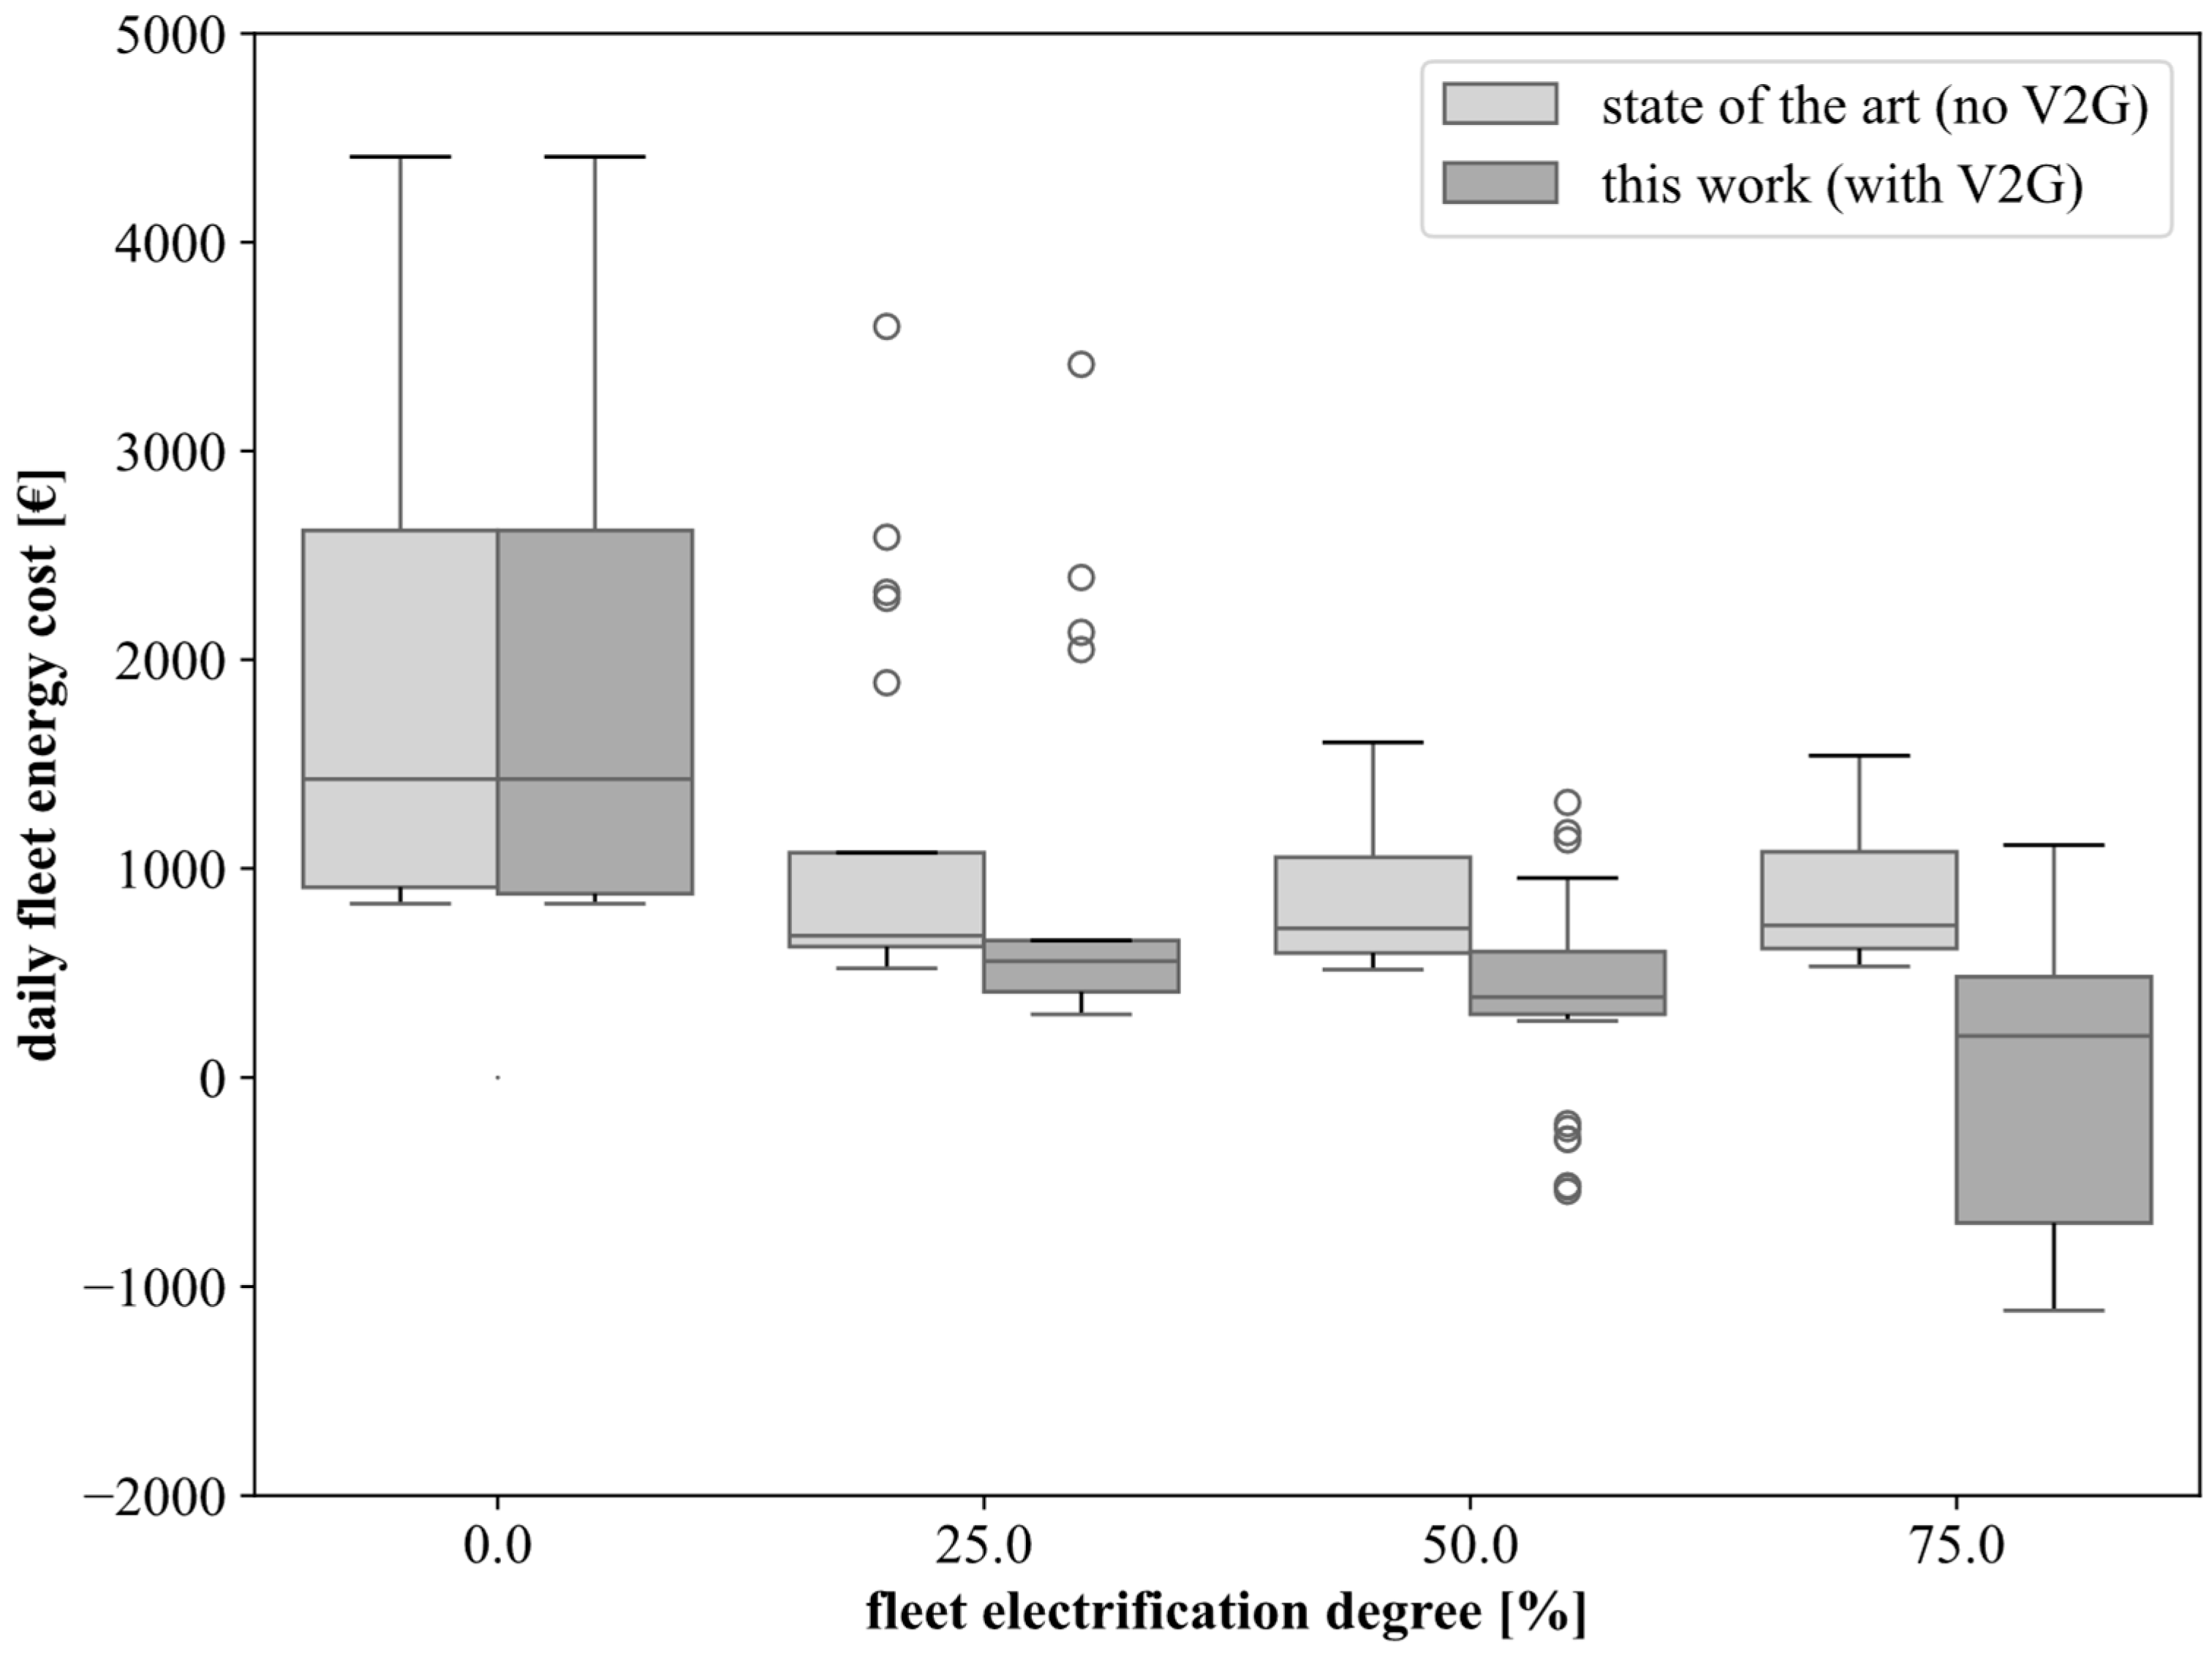
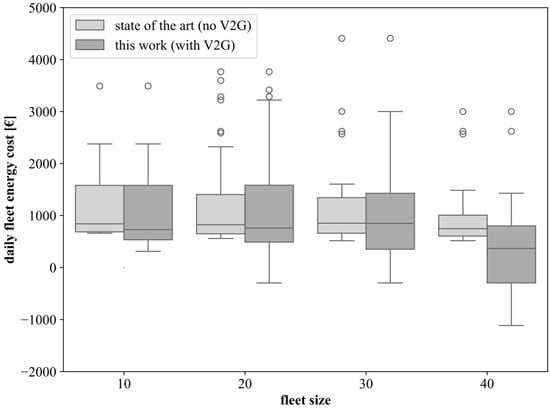
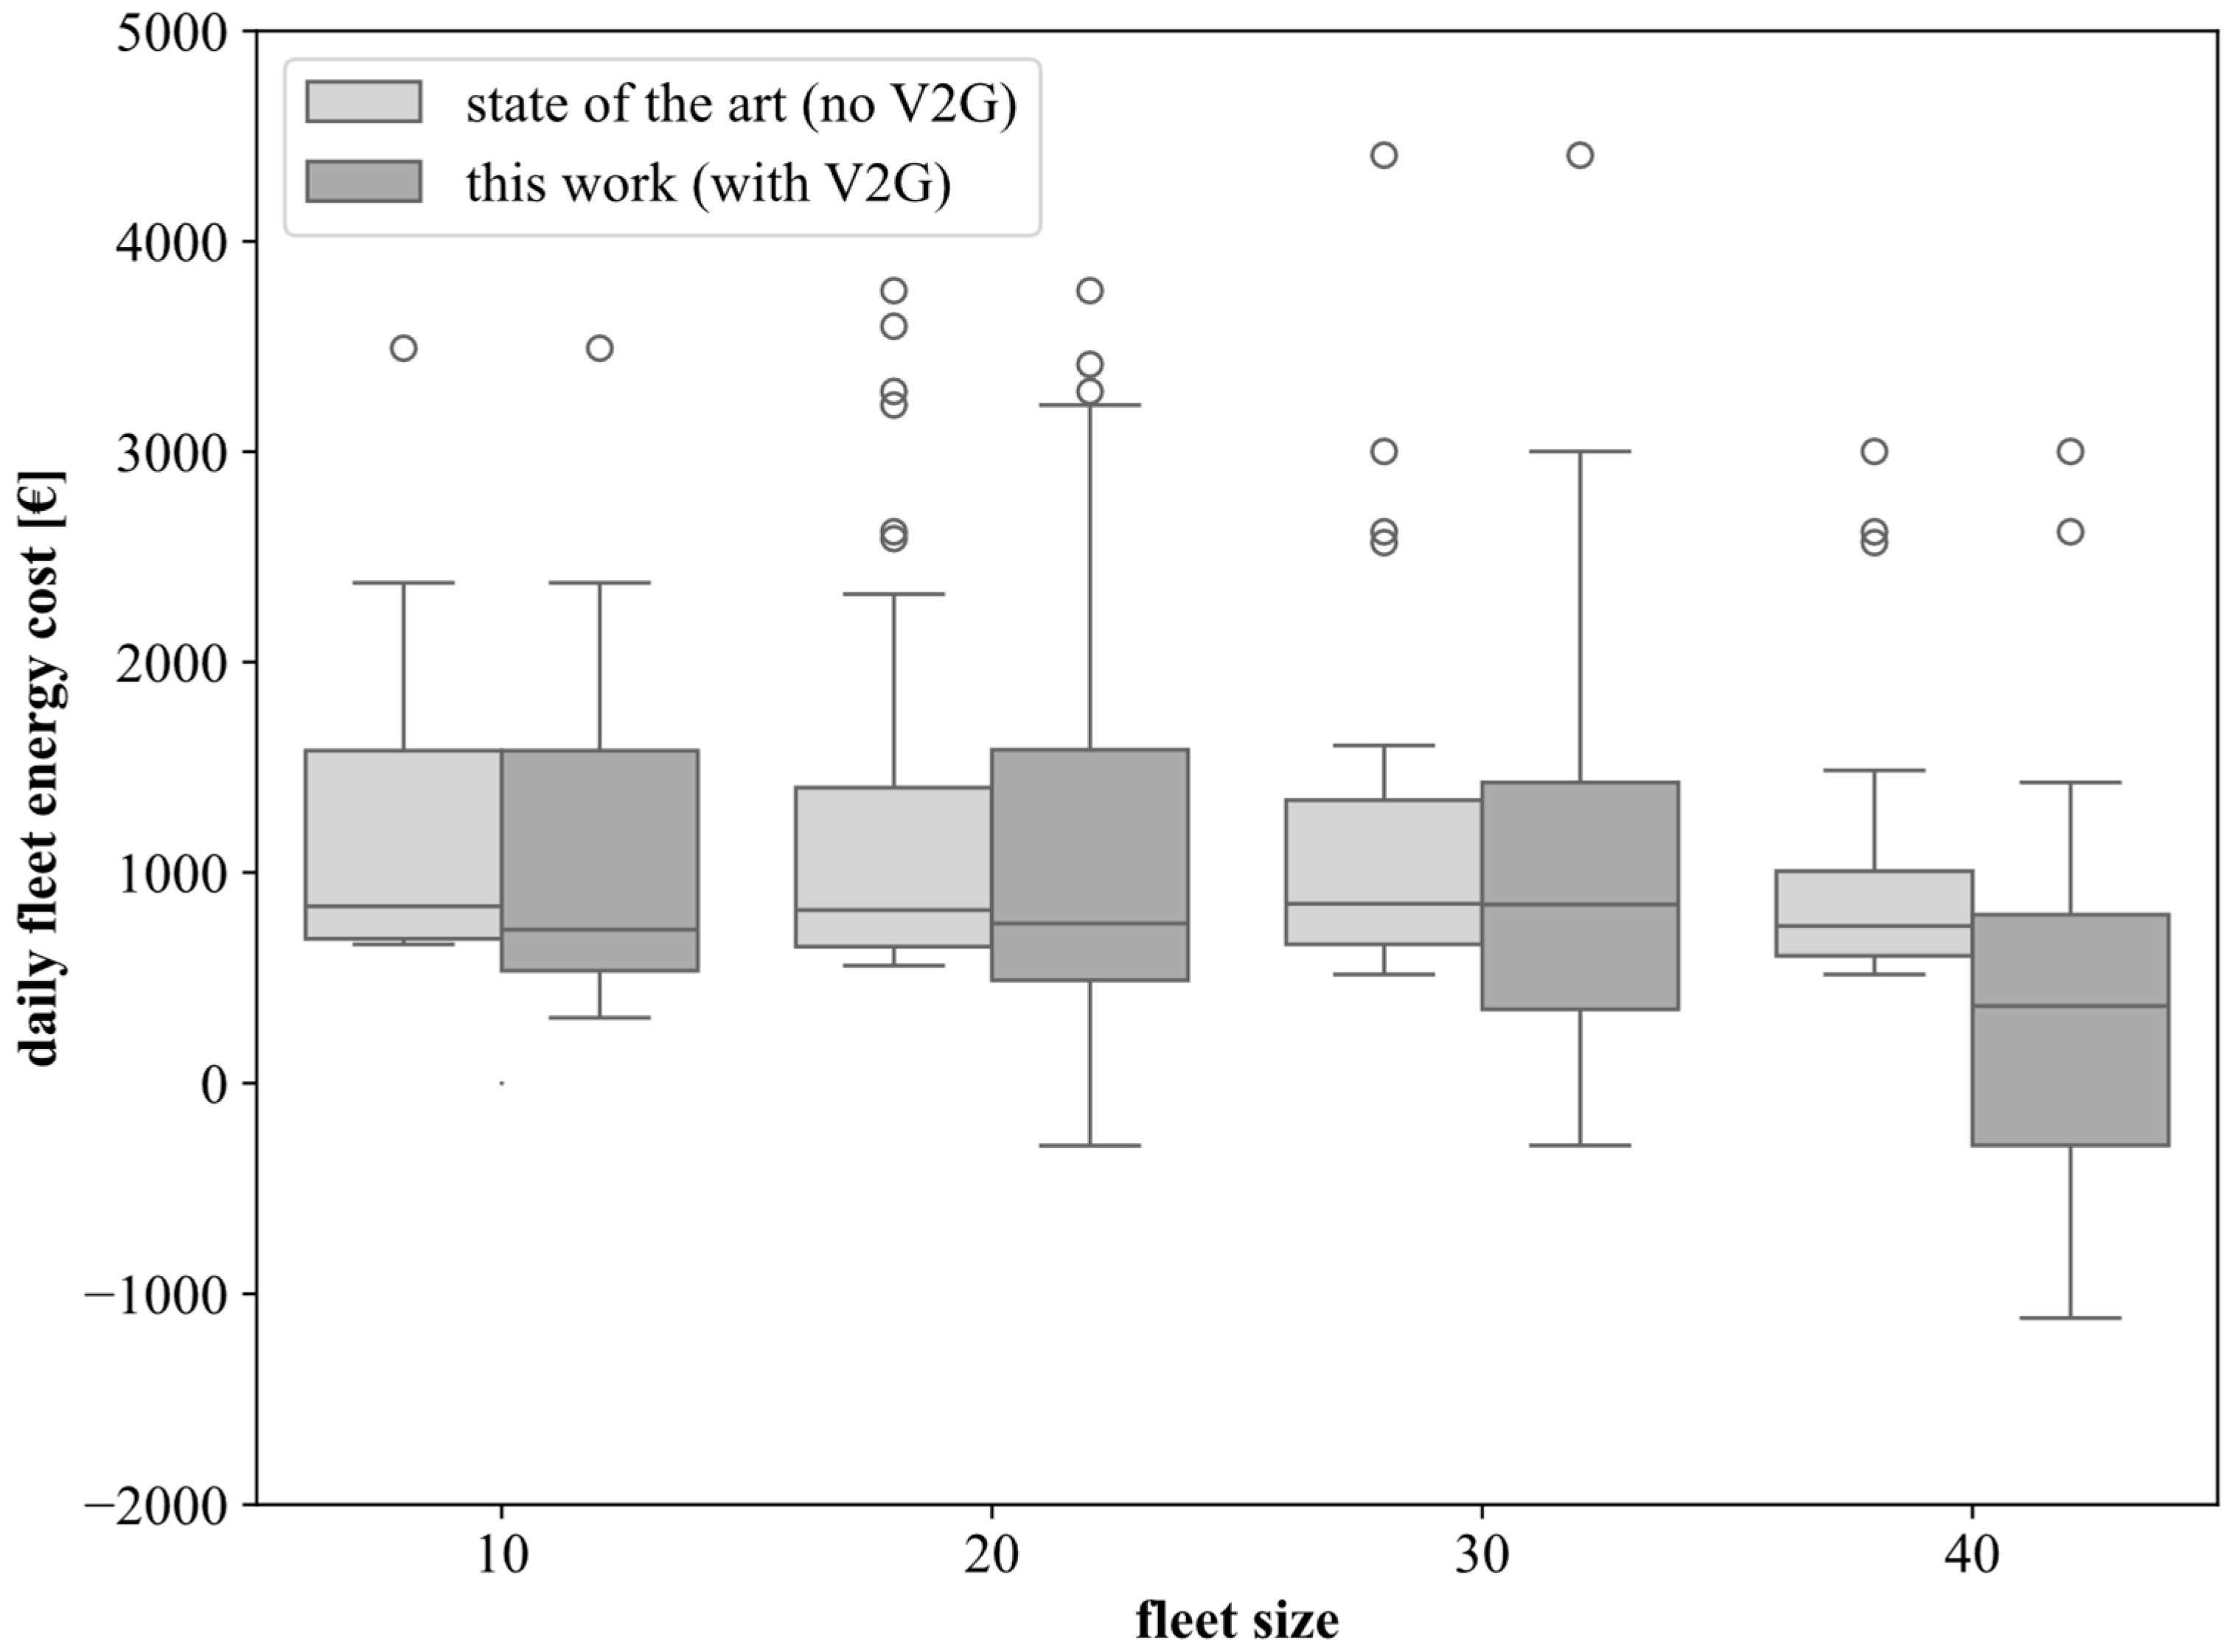
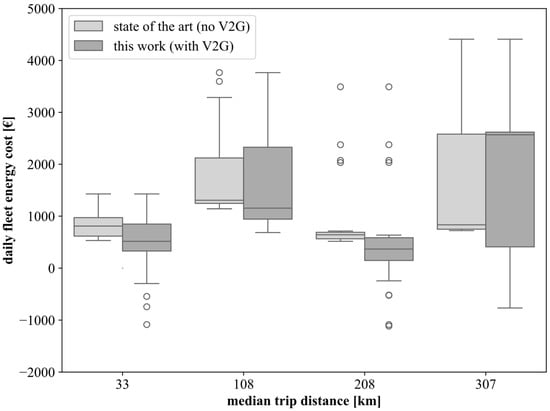
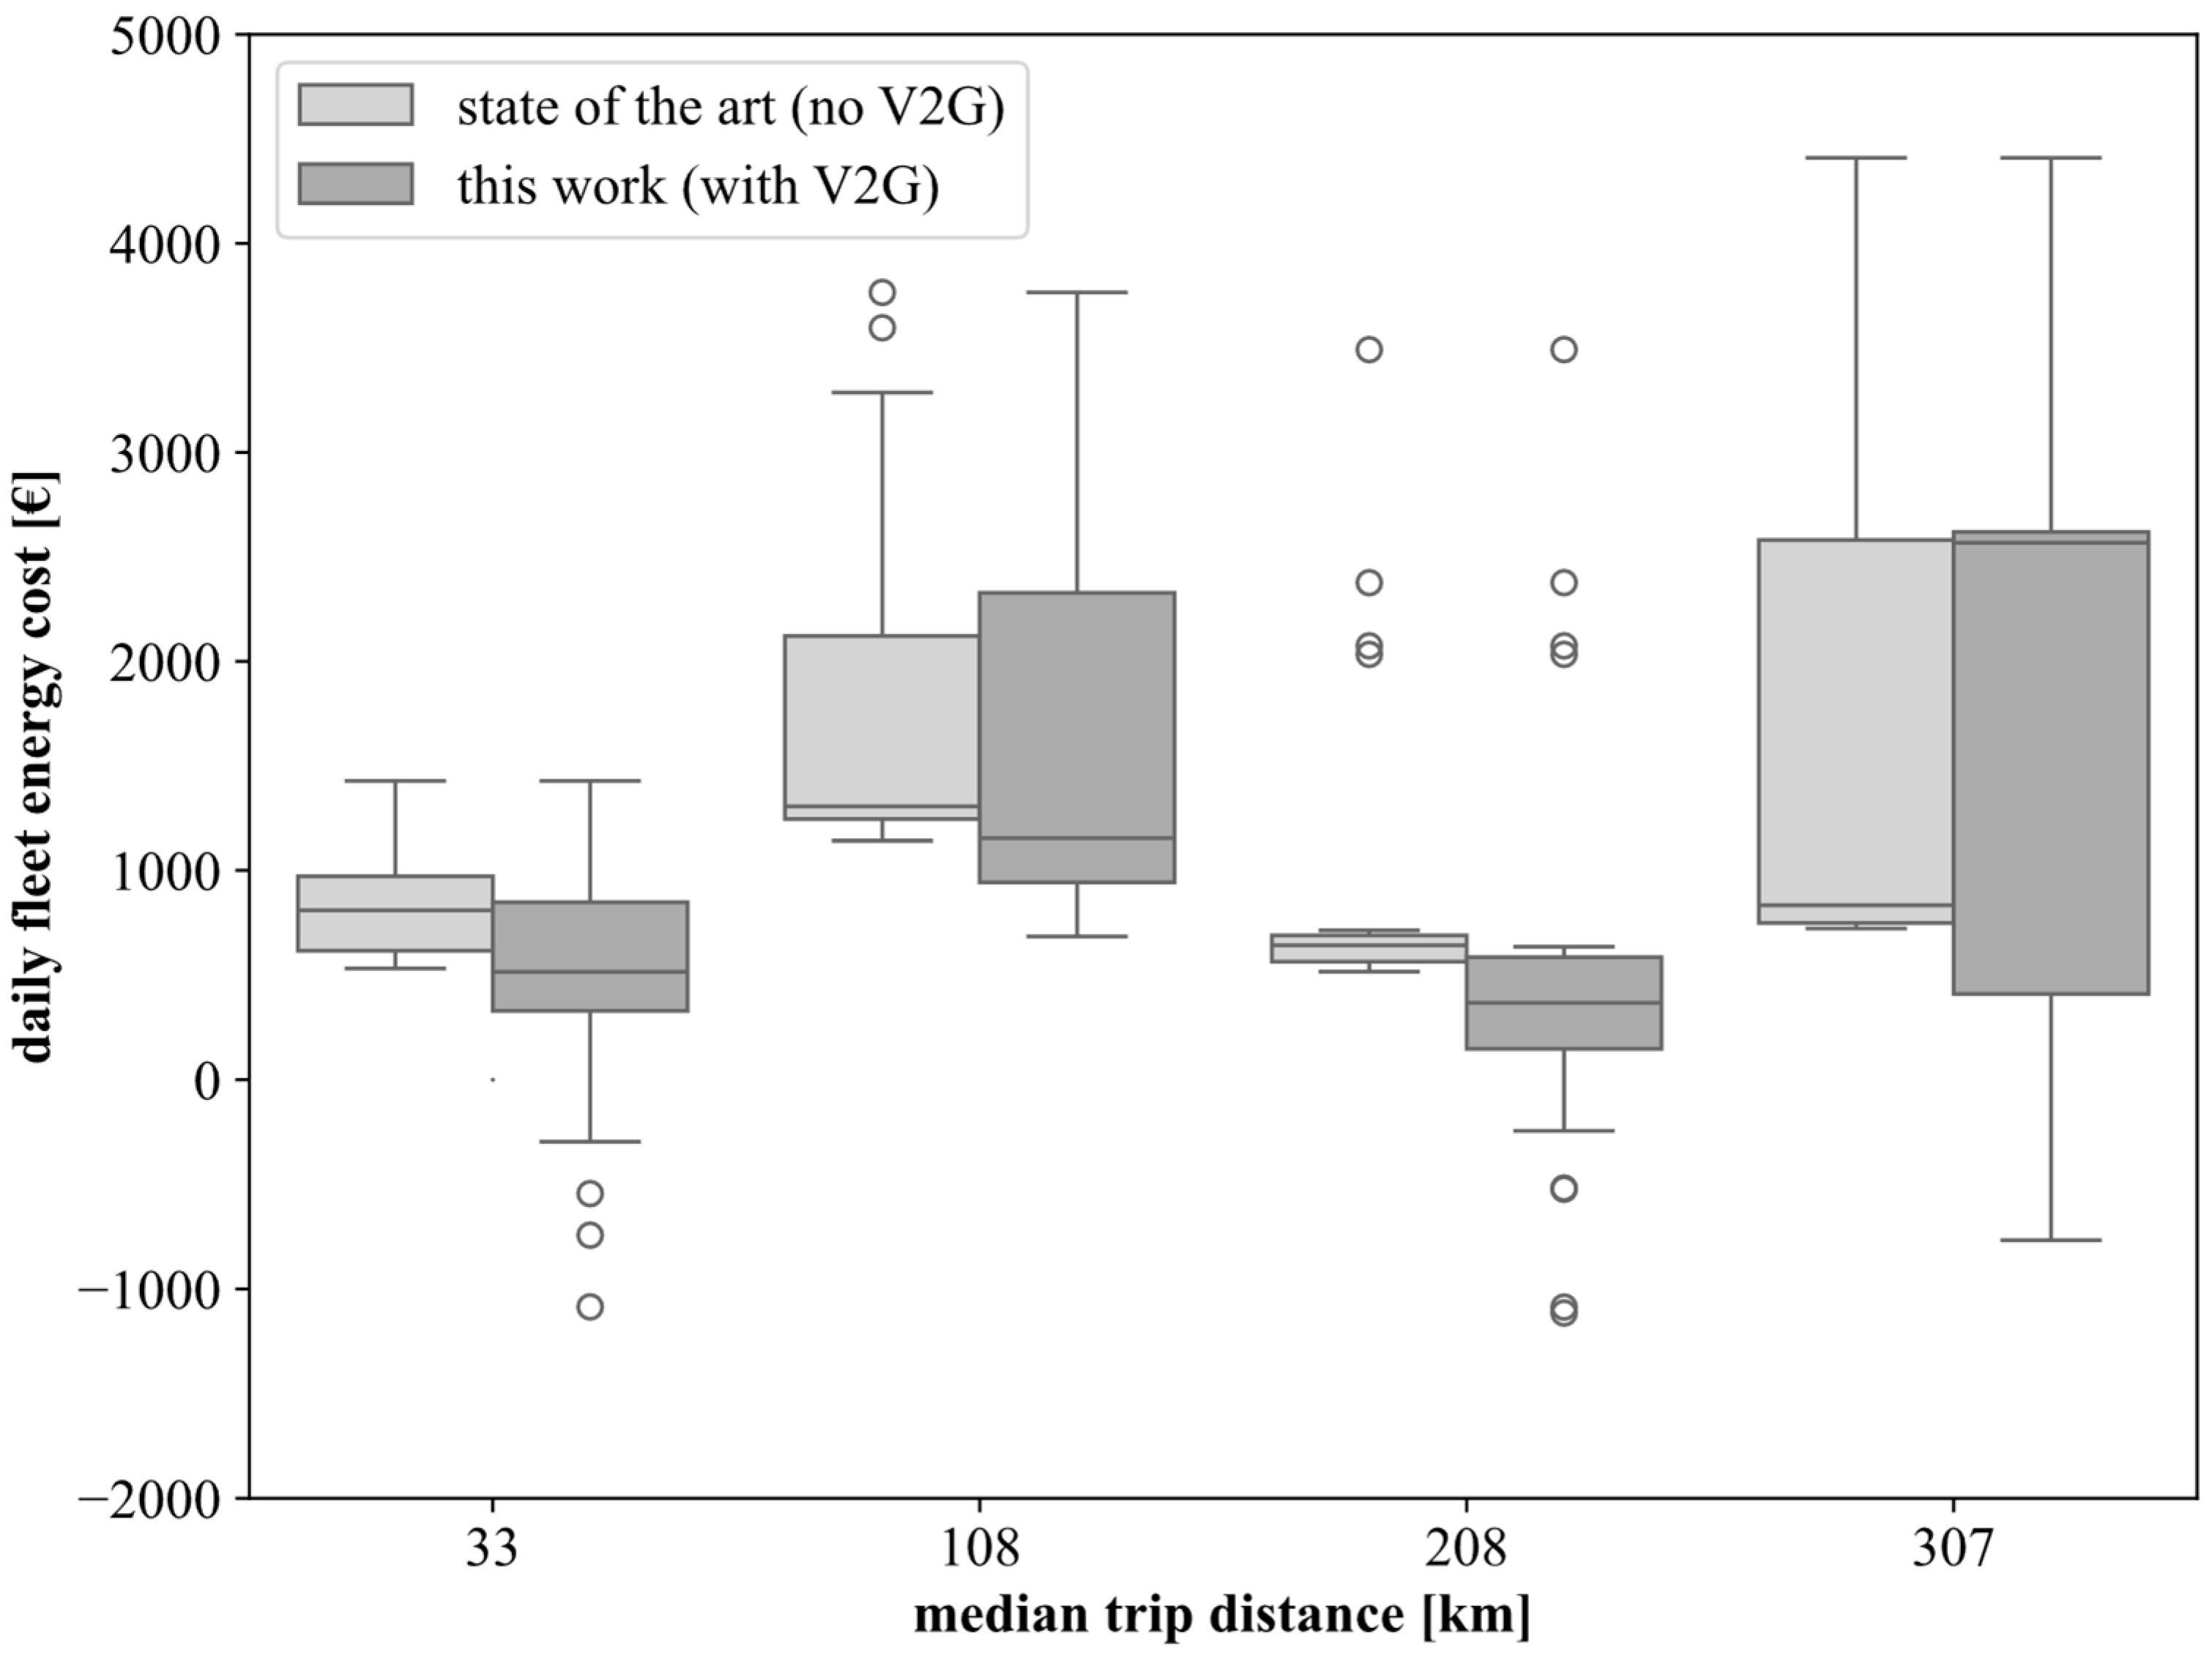
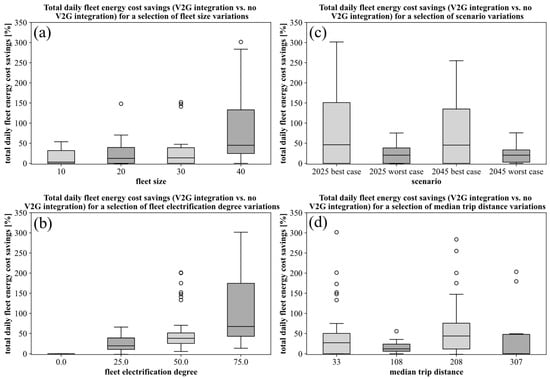
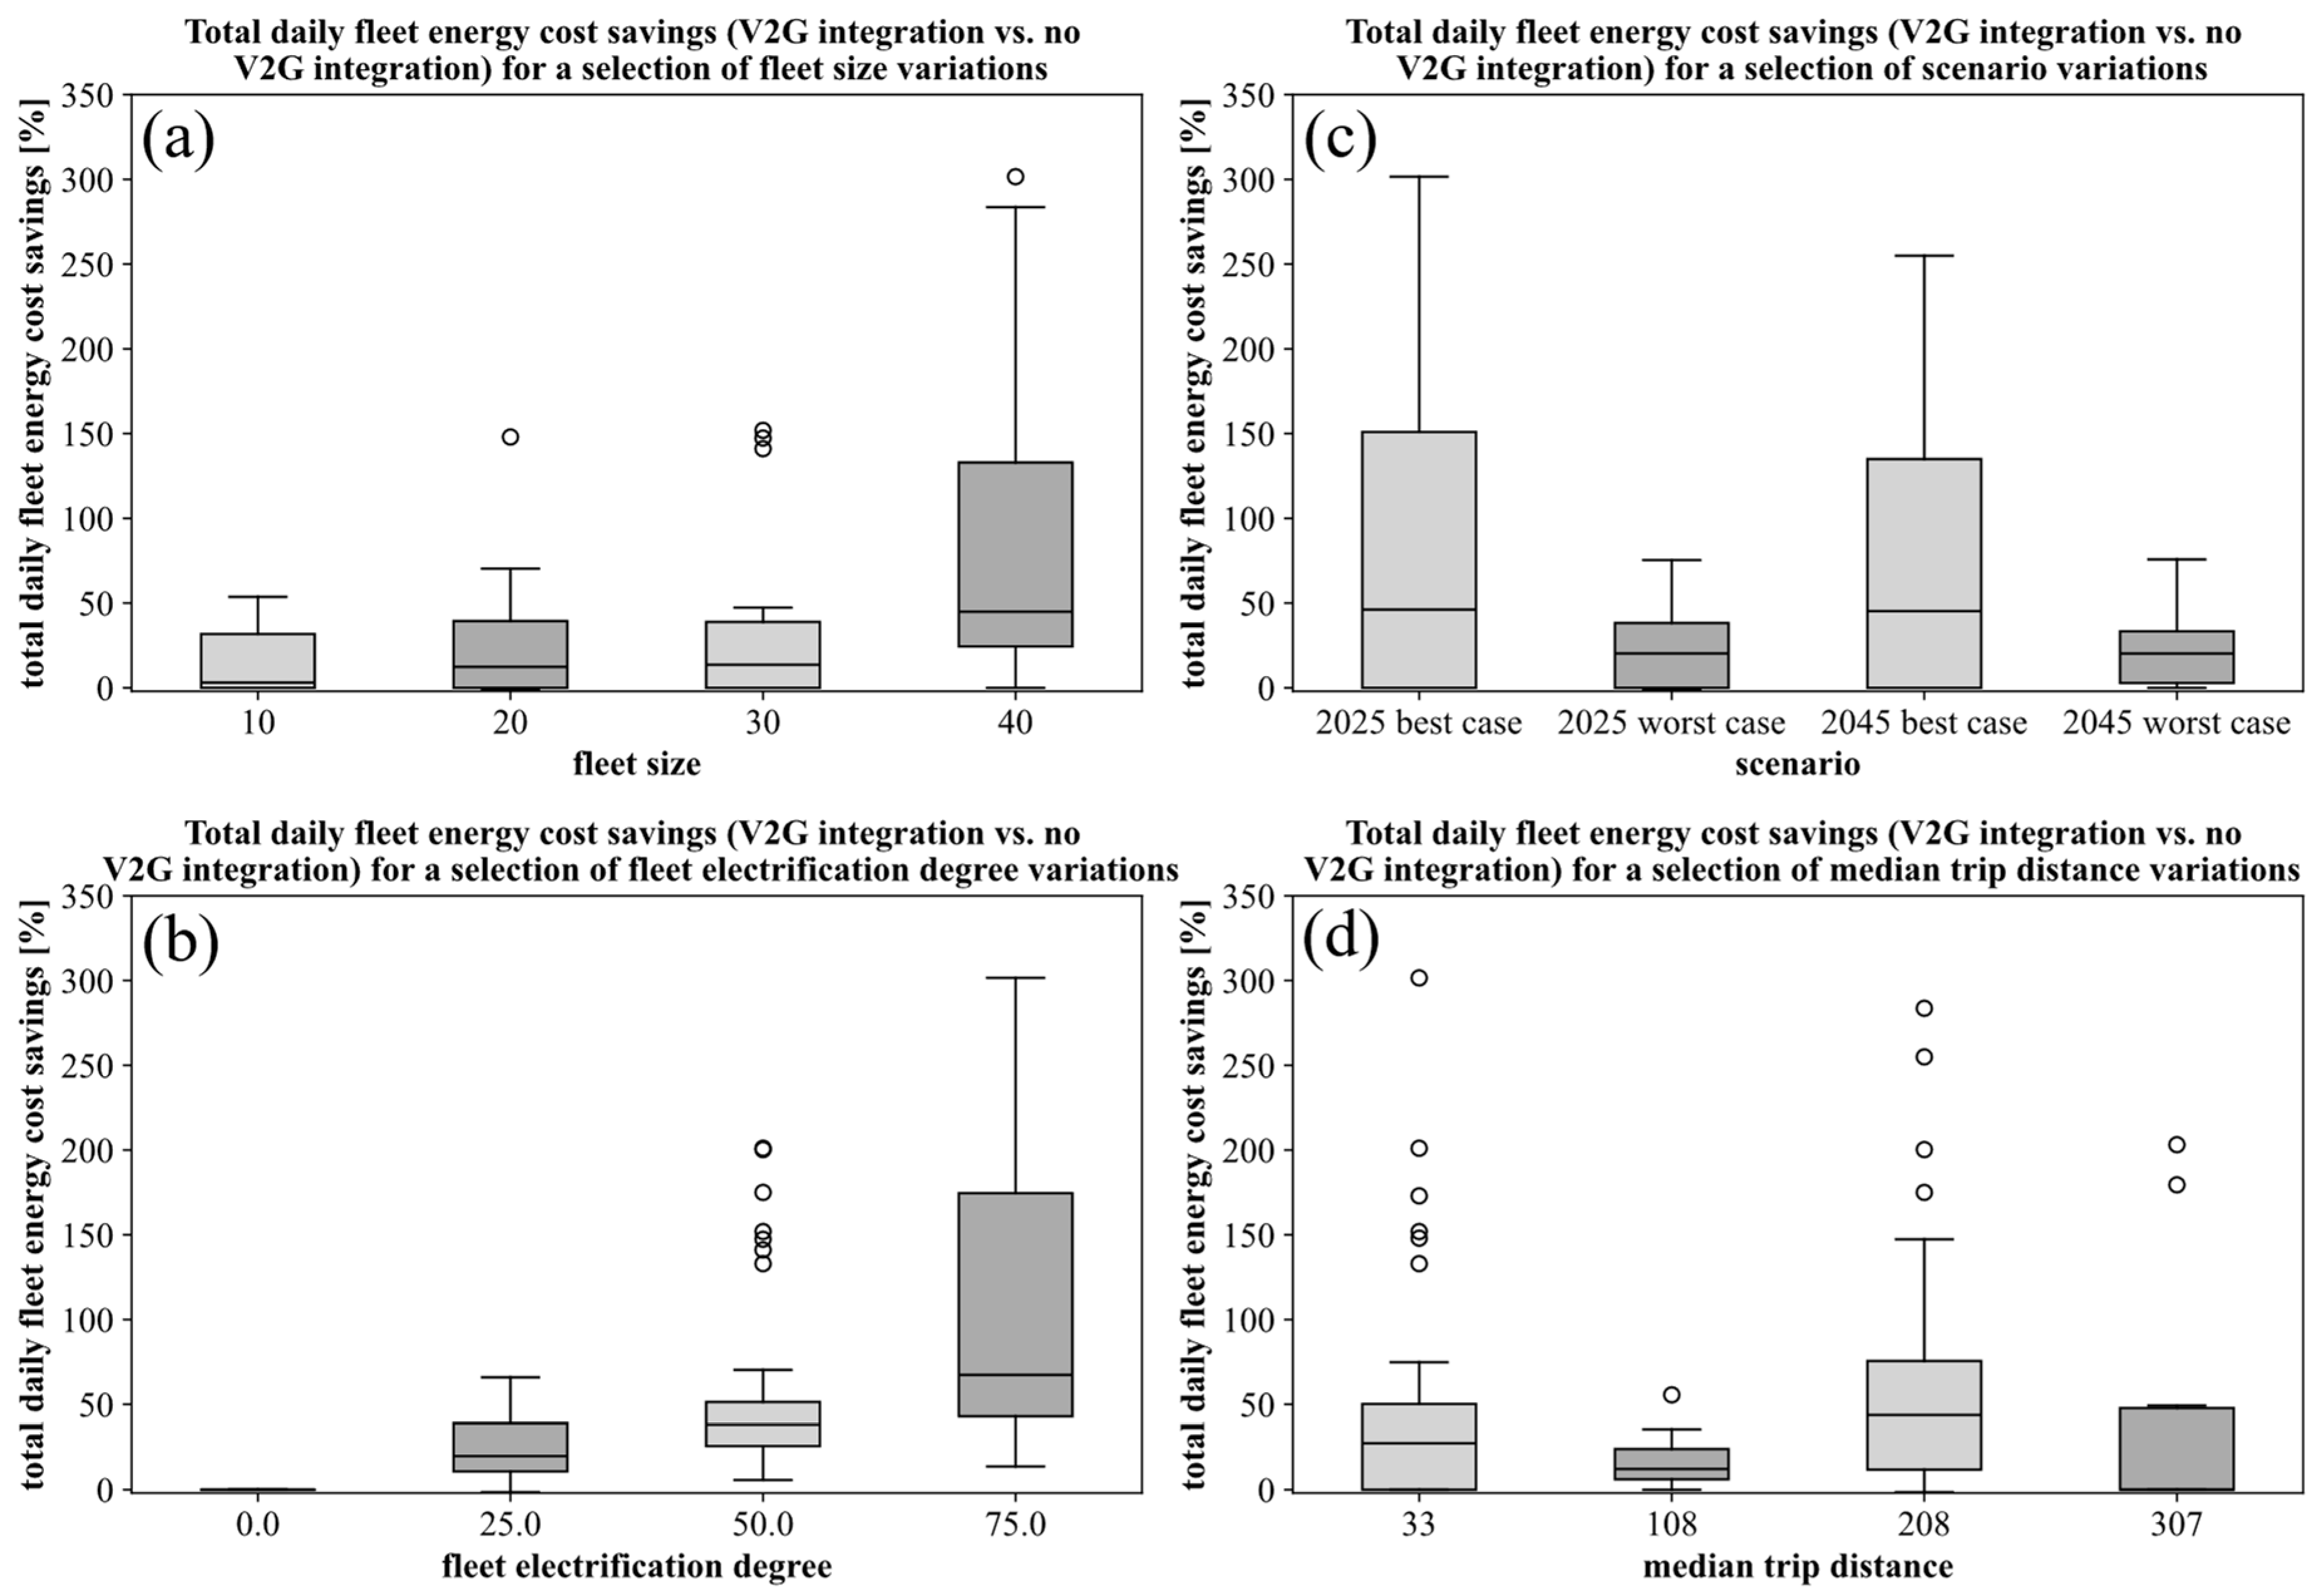

Disclaimer/Publisher’s Note: The statements, opinions and data contained in all publications are solely those of the individual author(s) and contributor(s) and not of MDPI and/or the editor(s). MDPI and/or the editor(s) disclaim responsibility for any injury to people or property resulting from any ideas, methods, instructions or products referred to in the content. |
© 2026 by the authors. Licensee MDPI, Basel, Switzerland. This article is an open access article distributed under the terms and conditions of the Creative Commons Attribution (CC BY) license.