


Abstract
Background: U-Net-style encoder–decoder architectures are widely used for 3D medical image segmentation, but their conventional skip connections usually transfer encoder features to the decoder through static concatenation. Such direct skip fusion may inadequately address the semantic gap between low-level encoder features and high-level decoder representations, especially in heterogeneous volumetric medical images. This study aims to improve skip-connection fusion by making encoder–decoder feature transfer adaptive, spatially expressive, and scale-aligned. Methods: We propose Capsule-Expert Routing UNet (CER-UNet), a skip-enhanced encoder–decoder architecture for 3D medical image segmentation. CER-UNet replaces static skip fusion with a Capsule-based Mixture-of-Experts (CapMoE) routing mechanism that dynamically selects and combines capsule-inspired spatial experts for skip-feature refinement. The routed features are further reorganized using ALIGNER-based multi-scale alignment before being injected into the decoder. The model also incorporates 2.5D Inception-style factorized convolutions and parameter-free Statistical Attention CBAM (SCBAM) to support efficient volumetric representation learning. Experiments were conducted on three public benchmarks: Synapse multi-organ CT, BTCV abdominal CT, and ACDC cardiac MRI. Results: CER-UNet achieved average Dice scores of 86.70% on Synapse, 84.94% on BTCV, and 92.52% on ACDC, using approximately 32M parameters in the proposed 2.5D configuration. These results show competitive segmentation performance compared with CNN-based, Transformer-based, and recent hybrid methods while maintaining a compact parameter budget. Conclusions: The findings suggest that adaptive skip-connection enhancement through capsule-expert routing and scale-aligned feature fusion can improve the effectiveness of encoder–decoder feature transfer for volumetric medical image segmentation.
1. Introduction
Three-dimensional medical image segmentation [1,2] is central to quantitative analysis of volumetric CT and MRI, but accurate delineation remains difficult because anatomical structures vary widely in size, shape, contrast, and through-plane continuity [3]. Convolutional architectures such as U-Net [4,5] are effective at modeling local image structure, whereas Transformer-based and hybrid CNN–attention models introduce broader contextual interactions [6,7,8]. These gains often come with substantial computational cost, particularly for high-resolution 3D inputs [9]. Efficient sequence models such as Mamba [10], factorized convolutions [11,12], multi-scale aggregation [13], and deformable operations [14] reflect a broader effort to preserve useful context without making volumetric models prohibitively expensive.
Skip connections are another important part of this trade-off. Standard U-Net skip pathways pass encoder features directly to the decoder, even though the two branches operate at different semantic levels. Gated fusion [15], cross-attention [16], and more recent mixture-of-experts formulations have therefore been used to make encoder–decoder transfer more selective. UTANet [17], for example, formulates skip fusion as a Task-Adaptive Mixture of Skip Connections (TA-MoSC) that redistributes multi-level encoder information according to the decoding stage. These approaches motivate a practical question: can skip routing remain adaptive and spatially expressive while retaining a compact volumetric model? We address this question with CER-UNet, an encoder–decoder architecture that combines efficient 2.5D representation learning with adaptive capsule-expert skip routing. The main contributions are summarized as follows:
- Efficient volumetric representation: 2.5D factorized multi-scale convolutions are paired with a SimAM-inspired, parameter-free Statistical Attention CBAM (SCBAM) module to retain local and cross-slice information with limited attention overhead.
- Adaptive capsule-expert skip fusion: Spatial capsule-inspired experts refine a fused multi-level encoder representation, while sparse multi-gate routing and ALIGNER-based scale adaptation produce skip features matched to successive decoder stages.
- Routing-aware evaluation: CER-UNet is evaluated on Synapse, BTCV, and ACDC, together with a parameter-matched routing audit and a pathology-skew stress test that measures both segmentation quality and expert-utilization stability.
This design focuses the contribution on how efficient representation, spatial expert transformations, routing, and scale alignment work together within the skip pathway.
2. Materials and Methods
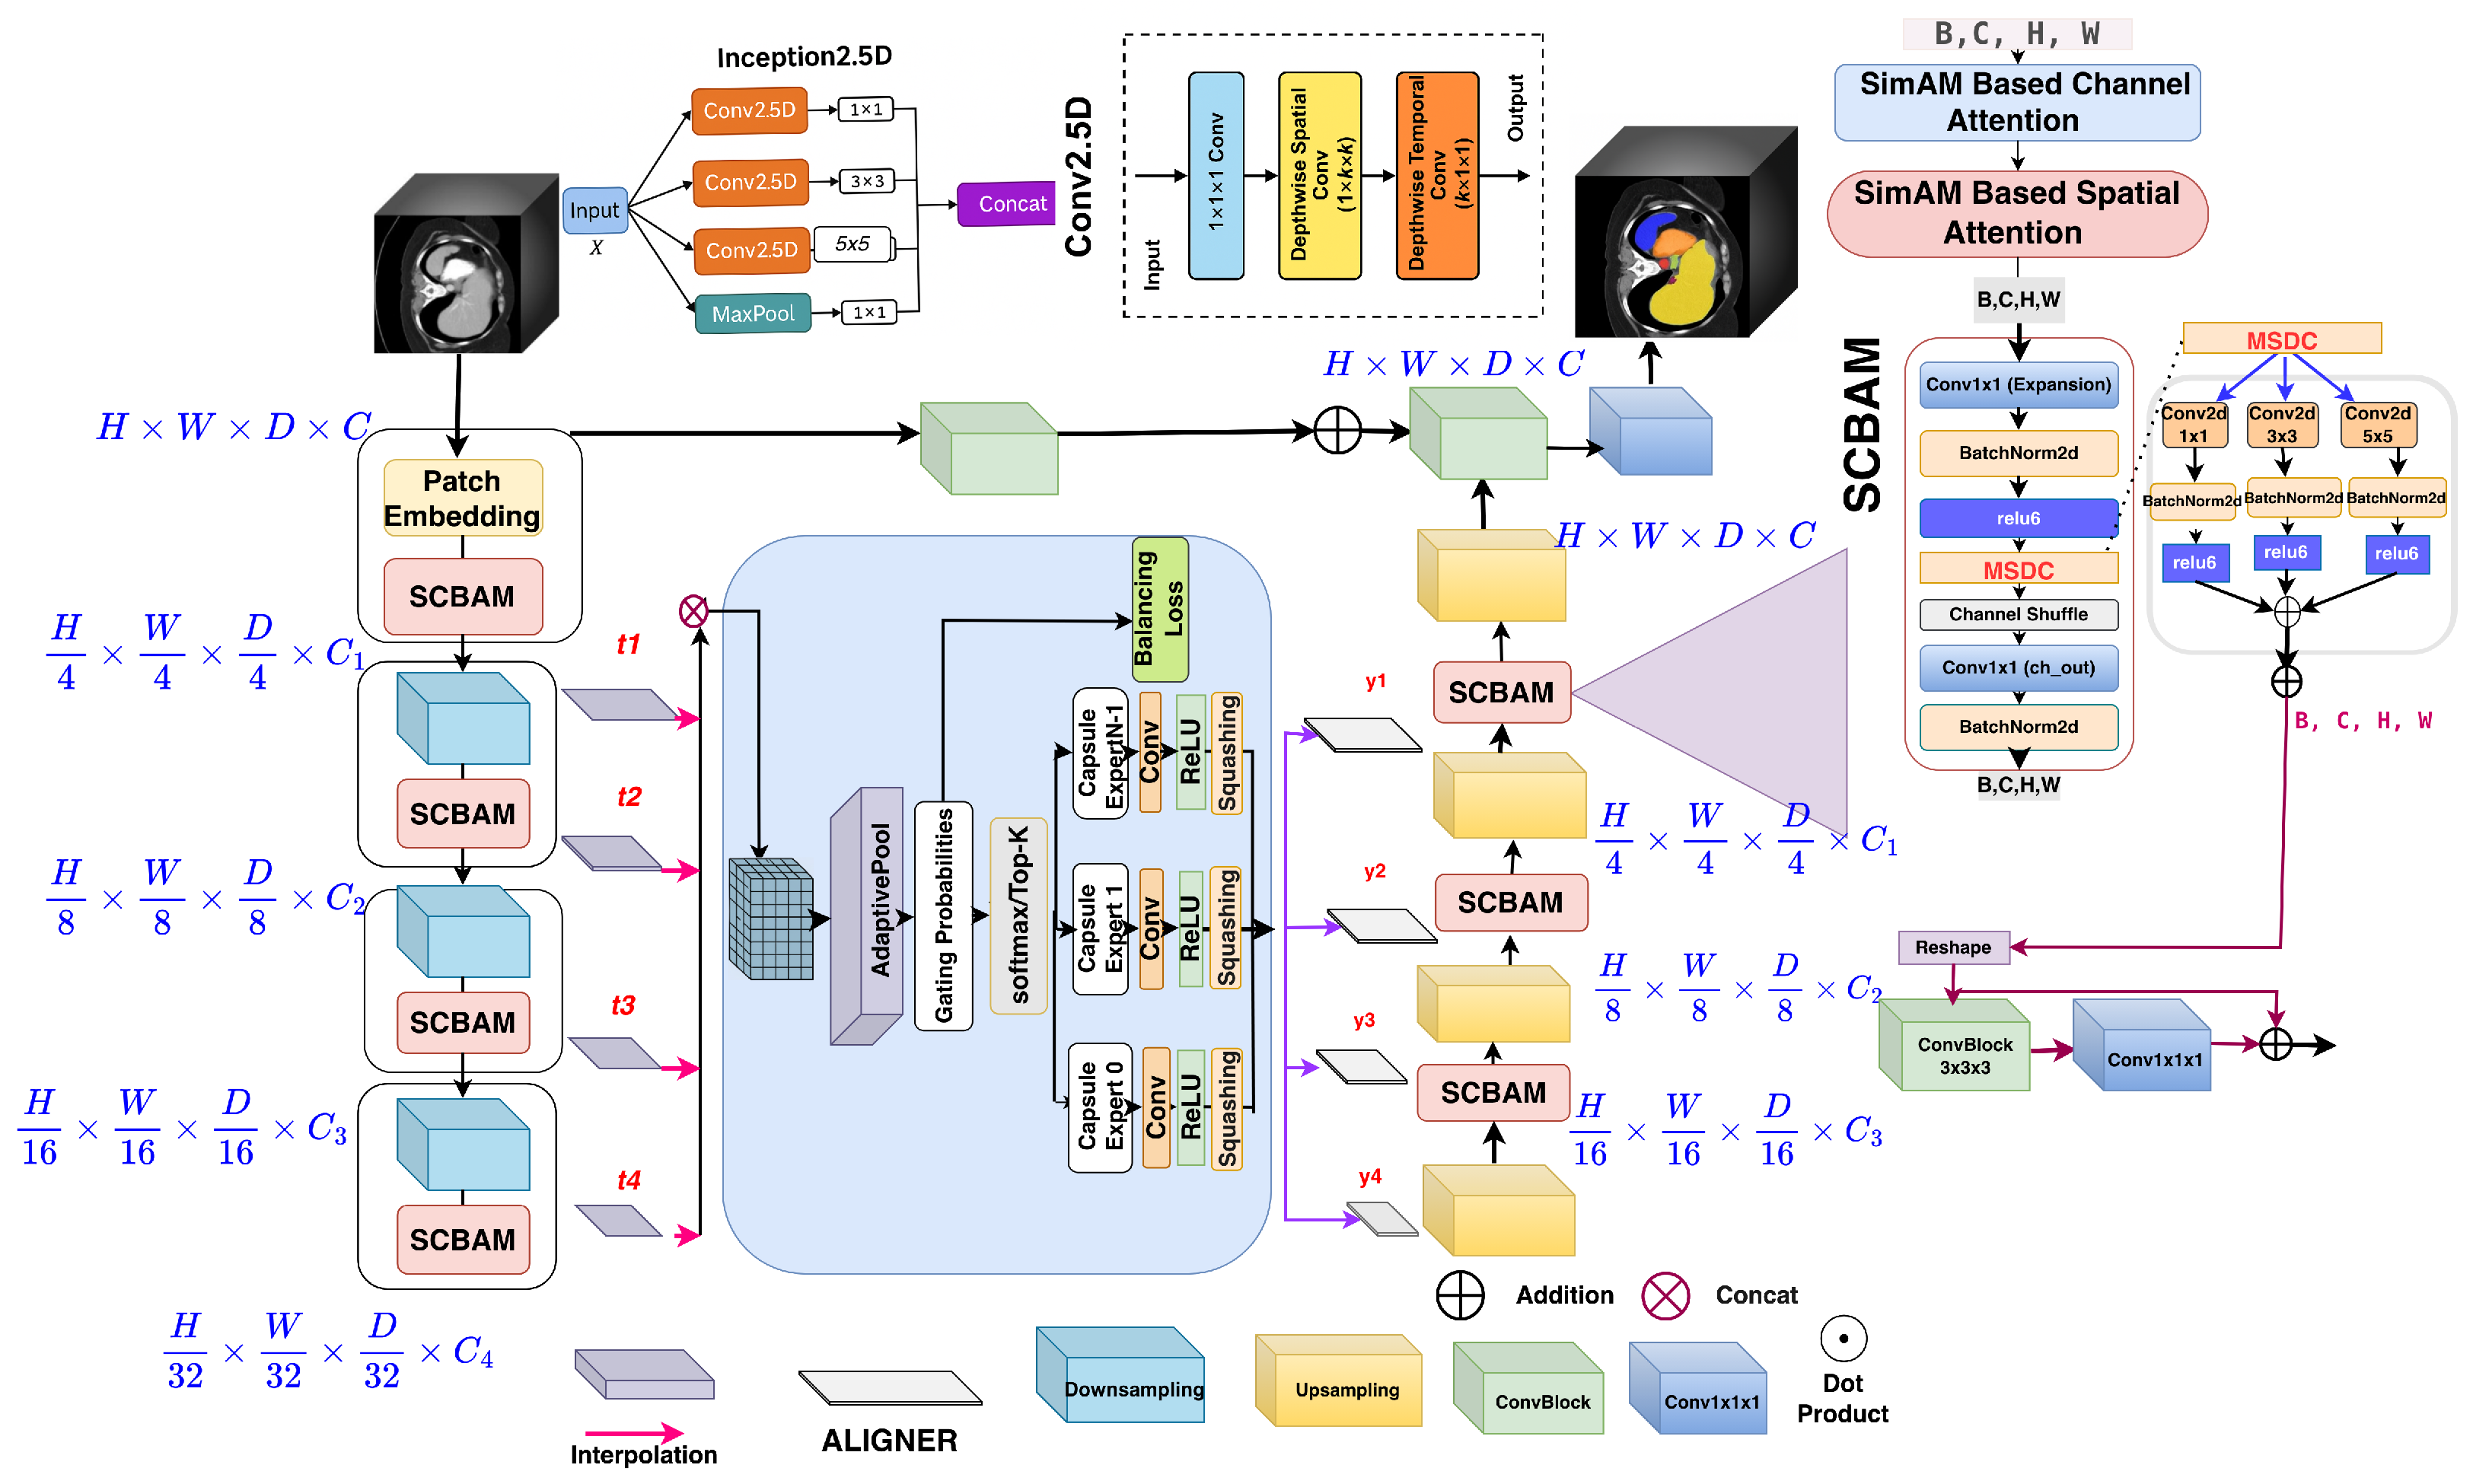
CER-UNet is designed to preserve useful volumetric context while making encoder–decoder feature transfer adaptive rather than fixed. The architecture integrates a 2.5D factorized encoder–decoder with parameter-free statistical attention, capsule-inspired spatial experts, sparse routing, and decoder-stage feature alignment. Within the encoder, the 2.5D Inception blocks decompose volumetric filtering into pointwise channel mixing, in-plane spatial filtering, and through-plane depthwise filtering, while SCBAM modulates the resulting features using activation statistics without introducing additional learned attention weights. The four hierarchical encoder representations are then projected to a common intermediate scale and fused to form a shared multi-scale representation for CapMoE. CapMoE adaptively routes this representation through the capsule-inspired experts, after which the ALIGNER modules transform the routed outputs into decoder-specific skip features at the required spatial scales. These aligned representations are progressively integrated into the decoder to support multi-scale volumetric segmentation. The overall architecture of CER-UNet is shown in Figure 1.
2.1. 2.5D Factorized Convolutions and Inception-Style Representation Learning
Volumetric convolution is effective for capturing spatial continuity in 3D medical images, but applying a full 3D kernel jointly across depth, height, and width substantially increases the computational and parameter cost. For an input with channels and output channels, a conventional 3D convolution with a kernel size of requires parameters. CER-UNet reduces this cost by decomposing volumetric filtering into complementary channel, in-plane, and through-plane operations. Specifically, a pointwise 1 × 1 × 1 convolution first performs channel mixing, followed by a depthwise 1 × × operation that captures spatial structure within each slice and a depthwise × 1 × 1 operation that propagates information across neighboring slices: Ignoring bias terms, the resulting parameter count is which is lower than the corresponding full 3D formulation while retaining interactions in both the in-plane and through-plane directions.
Rather than using this factorized operation at a single receptive-field scale, CER-UNet incorporates it within an Inception-style representation block. The purpose of this design is to capture anatomical patterns that appear at different spatial scales while avoiding the cost of repeatedly applying dense 3D convolutions. The factorized paths provide complementary local and broader contextual responses, which are combined to form the feature representation passed to the subsequent attention and encoder stages. In this way, the term 2.5D describes how volumetric filtering is factorized across spatial dimensions, whereas the Inception-style design describes how multiple receptive-field representations are aggregated within the same stage. These blocks form the basic convolutional representation units used throughout the CER-UNet encoder and decoder.
2.2. SCBAM: Statistical Attention CBAM
Following the feature extraction performed by the 2.5D Inception-style blocks, CER-UNet uses Statistical Attention CBAM (SCBAM) to refine the resulting representations without introducing additional trainable parameters in the attention mechanism. SCBAM is inspired by the energy-based formulation of SimAM [18] but organizes the statistical modulation sequentially along the channel and spatial dimensions. In contrast to conventional CBAM [19], which learns channel and spatial attention through dedicated MLP and convolutional branches, SCBAM derives its attention responses directly from the statistics of the incoming activations. This formulation allows the network to reweight informative responses while avoiding additional learned attention filters. Before SCBAM, a volumetric feature tensor is flattened into a token sequence (, where denotes the number of volumetric tokens). For statistical attention, these tokens are arranged on an auxiliary 2D grid, with zero padding along the token dimension when required, to obtain . After SCBAM, the grid is flattened back to the token sequence and subsequently restored to volumetric form. Here, H and W denote the auxiliary SCBAM grid dimensions rather than the original in-plane image dimensions. For the resulting feature map (), SCBAM first estimates the distribution of activations independently for each channel. For channel c, the mean and variance are computed as
where is included for numerical stability. These statistics measure how strongly an activation deviates from the characteristic response of its channel and are used to define the channel-wise energy term, i.e.,
where denotes the sigmoid function. The resulting response therefore modulates each activation according to its relative statistical deviation within the corresponding feature channel.
SCBAM subsequently performs spatial modulation on the channel-refined representation . At each spatial location , the mean and variance are evaluated across the C channels, allowing the module to characterize how strongly that location differs from the surrounding channel responses:
Because is computed for each spatial position and shared across channels, the spatial stage then adjusts the response at each location based on the information across channels, without requiring an additional learned convolutional attention map.
SCBAM therefore complements the preceding 2.5D Inception-style representation learning: the factorized multi-scale convolutions capture local, contextual, and cross-slice patterns, whereas SCBAM adaptively reweights those responses using their channel-wise and spatial activation statistics. The refined feature map () is then forwarded to the subsequent encoder or decoder operation.
2.3. Multi-Scale Residual Encoder–Decoder
The statistically refined features produced by the 2.5D Inception–SCBAM stages are organized through a hierarchical encoder [20], which generates four representations at progressively different resolutions, denoted by . These feature levels preserve information at different levels of the hierarchy, with earlier stages retaining fine anatomical details and deeper stages capturing broader contextual structure. Rather than forwarding each encoder feature independently to the decoder, CER-UNet first brings them to a common intermediate scale so that information from different depths can be combined before adaptive routing.
To achieve this, a lightweight projection and trilinear interpolation are applied according to the resolution of each encoder output. The first-level feature () is projected through a 1 × 1 × 1 convolution to obtain , while is upsampled and projected to form . Similarly, is projected before upsampling to produce . The deepest representation, , is first projected and reshaped back into volumetric form and is then trilinearly resized to obtain . By mapping all four representations to a compatible resolution, the network can combine fine structural information with deeper semantic context within a single feature space.
The aligned representations are concatenated along the channel dimension as
forming a shared multi-scale representation that serves as the input to CapMoE. This fused feature is not transferred directly to the decoder. Instead, CapMoE adaptively transforms it through expert routing and produces four routed outputs corresponding to different decoding stages. Each routed representation is then processed by an ALIGNER block to obtain the scale-matched skip features (), which are progressively introduced into the decoder as the spatial resolution is recovered. In this way, the encoder, routing module, and decoder form a continuous feature-processing pathway in which multi-scale information is first consolidated, selectively refined, and finally redistributed according to the requirements of each decoding stage. Residual connections are retained throughout the encoder and decoder to preserve feature information during these transformations and to support stable optimization.
2.4. Capsule Experts for Adaptive Skip Routing
The fused multi-scale representation () is passed to CapMoE, where direct encoder–decoder skip transfer is replaced by content-dependent expert routing. Rather than sending the same encoder representation to every decoder stage, CapMoE uses multiple gating heads to select the capsule-inspired experts that are most relevant to the current input. Each gate activates only the top-k experts, allowing the skip features to be adapted before they are passed to the decoder.
For a given routed feature tensor (), each capsule-inspired expert applies K parallel 3 × 3 convolutional branches. Their outputs are concatenated, passed through a capsule-style squashing function, and projected back to the original channel dimension using a 1 × 1 convolution:
The 3 × 3 branches allow each expert to capture information from neighboring locations while preserving the spatial size of the feature map. After the branch outputs are combined, the capsule-style squashing function controls their magnitude before the final 1 × 1 projection. The resulting expert features are then passed to the routing mechanism, where each gating head uses globally pooled information from the fused encoder representation to score the available experts. The top-k experts are selected, their weights are normalized, and their outputs are combined to form the routed feature. The resulting representation therefore combines the overall encoder context with the local spatial information captured by the selected experts. CapMoE produces four routed outputs for the different decoder stages. These outputs are passed to the ALIGNER modules, which adjust their spatial resolution and channel dimensions to match the corresponding stages of the decoder. The aligned outputs are then used as adaptive skip features instead of being transferred directly from the encoder through fixed skip connections.
The capsule-inspired experts introduce local spatial interactions within the routing pathway by allowing each response to incorporate information from neighboring locations before projection. Theorem 1 formalizes this local dependence, while Theorem 2 shows that the capsule-squash function remains bounded and stable across its input range. Together, these results help explain how the expert transformation behaves, while the routing mechanism, itself, is assessed separately through the routing audit and pathology-skew experiments.
- Capsule–MoE routing and load balancing:
Following the capsule-expert design above, we use a multi-gate CapMoE to adaptively route the fused skip tokens before scale-wise compression. The CapMoE routing procedure and the complete network forward pass are summarized in Algorithms 1 and 2, respectively. After the cross-scale fused volume is rearranged slice-wise, as specified in Algorithm 2, let denote the number of routing tokens, and let denote the resulting fused routing tensor. The capsule experts are denoted by . We use four independent gates (), with each . For each gate, we first summarize every routing token using average pooling, i.e., and compute expert scores as For every routing token, we select the top-k experts according to , renormalize the selected scores, and route the corresponding feature only to those experts. The expert outputs are then combined using the normalized weights to produce a routed feature map (). To discourage routing collapse and maintain expert availability, the router is trained with the soft-usage balance term defined in Equations (8) and (9).
Figure 1.
Overview of CER-UNet. The network combines 2.5D Inception-style factorized convolutions, SCBAM statistical attention, CapMoE skip routing, ALIGNER-based scale adaptation, and a multi-scale decoder for volumetric medical image segmentation.
2.5. ALIGNER for Decoder-Stage Feature Alignment
The routed features from CapMoE share a common intermediate scale, while the decoder operates across multiple spatial resolutions. ALIGNER bridges this difference by converting each routed output into a volumetric feature representation that matches the corresponding decoder stage. It first adjusts the channel dimension on a slice-by-slice basis, then restores the volumetric structure before applying scale-specific pooling. For a given slice-wise feature tensor (, where T denotes the number of slice tokens at the shared routing resolution), ALIGNER applies a 1 × 1 Conv2D followed by BN and ReLU to each slice independently. The projected features are then reshaped into a 5D volume () and resized using adaptive average pooling according to the through-plane and in-plane scaling factors :
The resulting output sizes are defined as , , and . Four ALIGNER blocks are used with progressively different scaling factors to produce the decoder-specific skip features (). In this way, the routed information from CapMoE is reorganized into coarse-to-fine volumetric representations that match the spatial and channel requirements of the successive decoder stages.
2.6. Decoder Integration
The decoder progressively upsamples the deepest representation while incorporating the four CapMoE-enhanced, scale-aligned skip features. The fused encoder tensor is routed in slice-wise form, the four routed outputs are converted back to volumetric features by the ALIGNER modules, and these features are introduced at the corresponding decoding stages. Deep supervision is retained during training. The complete pathway is summarized in Algorithm 2 and Figure 1.
| Algorithm 1: Capsule Mixture of Experts (CapMoE) |
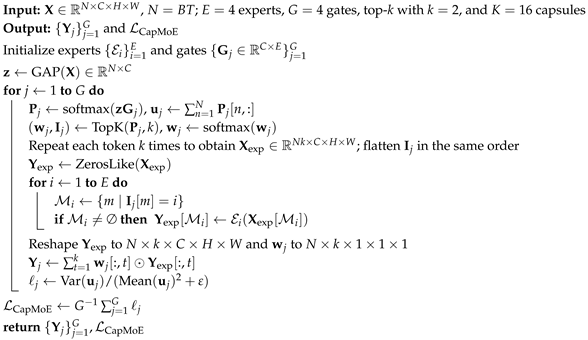 |
| Algorithm 2: Forward Pass with CapMoE and ALIGNER Blocks |
Input: Output: Segmentation logits and auxiliary loss ; for
do
for
do
for
(descending)
do
if
then
else
return
|
2.7. Training Objective and Routing Diagnostics
The network is trained with a segmentation objective and a routing-balance regularizer, i.e.,
where controls the contribution of the routing term.
For one-hot labels (Y) and predicted class probabilities (P), the segmentation term combines soft Dice and voxel-wise cross-entropy:
Here, I is the number of classes and V is the number of voxels.
The balance loss is computed from the soft gate probabilities before top-k expert selection. For gate g, let denote the routing probabilities, and let be the corresponding soft expert-usage vector. The per-gate penalty is
and the CapMoE balance loss averages this quantity across the gating heads:
Therefore, gradients reach the selected routing weights as well as the soft probabilities used to compute the balance loss.
Routing quality is also measured after routing has been realized. Let be the normalized expert-load vector over the evaluation set. We report the post hoc diagnostic, i.e.,
together with normalized entropy, minimum expert-load fraction, maximum-to-minimum load ratio, and starvation counts. Thus, is optimized during training, whereas describes realized expert utilization.
2.8. Theoretical Properties
The following results isolate two properties of the capsule-inspired expert: local spatial dependence and bounded nonlinear response.
Theorem 1 (Local Spatial Expressivity).
Consider an inference-time pointwise expert formed from spatially shared convolutions, fixed normalization statistics, and pointwise nonlinearities. Its output at location depends only on the feature vector at . In contrast, there exists a CapsuleExpert with a convolution, capsule squashing, and a final projection whose output at depends on at least one neighboring location.
Proof.
A composition of convolutions, fixed affine normalization, and pointwise nonlinearities acts independently at each spatial position. A convolution can instead assign a non-zero coefficient to an off-center location, so the pre-squash activation at can depend on a neighboring feature. The subsequent squash preserves this dependence, and the final projection can be chosen to retain a coordinate that varies with the neighboring feature. □
Theorem 2 (Stability of Capsule Squash).
For , with denoting the Euclidean norm, we define
Then, for every x, and s is globally Lipschitz.
Proof.
Let . For , . Writing with , the tangential and radial Jacobian eigenvalues are
At the origin, , since as .
Their absolute values are uniformly bounded for (in particular, by ). Hence, the Jacobian operator norm is globally bounded, which gives a global Lipschitz constant. □
3. Experimental Settings, Results, and Discussion
Table 1, Table 2, and Table 3 summarize the benchmark results on Synapse, BTCV, and ACDC, respectively. Table 4 presents the architectural ablation, and Table 5 reports the computational profile. Table 6 and Table 7 present the routing audit and expert-utilization diagnostics, respectively. Table 8 reports the pathology-skew stress test.
CER-UNet is implemented in PyTorch version 1.11.0 using MONAI version 0.7.0 [21]. The implementation of CER-UNet is available at https://github.com/nandkyadavusa/CER-Unet.git. The model is trained for 1000 epochs with AdamW, an initial learning rate of 0.01, and weight decay of . The Synapse experiments use patches, BTCV uses patches, and ACDC uses inputs. Synapse contains 30 CT scans with 18 training and 12 test cases [22]; BTCV contains 30 abdominal CT volumes with 13 target structures [22]; and ACDC contains 100 cardiac MRI subjects split 70/10/20 for training, validation, and testing [23,24]. CER-UNet experiments were run on a single NVIDIA Tesla V100 GPU. The benchmark tables and architectural ablation are based on the single run used for the main comparison. In contrast, the controlled routing audit and pathology-skew stress test are repeated experiments conducted over three matched seeds and are therefore reported as mean ± standard deviation. For this reason, the ACDC Dice score of in Table 3 and Table 4 should be interpreted as the main benchmark result rather than as the three-seed mean of any routing-audit configuration.
Table 1.
Segmentation performance on the Synapse multi-organ dataset. Organ-wise Dice, mean Dice (DSC), HD95, and parameter counts are reported. Boldface marks the best displayed value in each column.
Table 2.
Segmentation performance on BTCV. Dice (%) is reported for 13 abdominal structures, together with the mean across structures. RAG and LAG denote the right and left adrenal glands, respectively. Boldface marks the best displayed value in each column.
Table 3.
Segmentation performance on ACDC. Dice (%) is reported for the right ventricle (RV), myocardium (Myo), and left ventricle (LV), together with the mean across the three classes. Boldface indicates the best value in each column.
Table 4.
Ablation study on ACDC comparing alternative skip-fusion, attention, expert-routing, and alignment configurations. CER-UNet achieves the highest mean Dice in this experiment, although the differences among several configurations are small.
Table 5.
Computational profile on Synapse using a Tesla V100 (32 GB) and batch size of 1. FLOPs and latency are reported per volume; Mem denotes peak GPU memory under the stated profiling setup. Parameter counts correspond to the implementations instantiated for computational profiling and may therefore differ slightly from literature-reported values in Table 1.
Table 6.
Parameter-matched routing audit on ACDC under the standard training distribution. All variants use the same backbone and an effectively matched parameter budget, so the table focuses on segmentation performance, while Table 7 reports the corresponding routing behavior. Values are mean ± standard deviation over three seeds. This audit is separate from both the main ACDC benchmark in Table 3 and the pathology-skew experiment in Table 8. Each audit row was independently retrained under the matched three-seed audit protocol; therefore, these means are not expected to numerically reproduce the single-run benchmark value in Table 3.
Table 7.
Expert-utilization diagnostics for the three-seed ACDC routing audit. Diagnostic load (CV2) is computed from realized expert assignments and is distinct from the soft-CV2 balance loss optimized during training. Static uniform fusion is shown as a non-adaptive reference.
Table 8.
Pathology-skew stress test on ACDC. Only the training sampler was modified by varying the DCM sampling probability (p); validation and test distributions were unchanged. Values are mean ± standard deviation over three matched seeds. Soft-CV2 in the routing label denotes the training loss, whereas diagnostic load (CV2) is computed from realized expert assignments. “Starved seeds” counts runs in which at least one expert received of the realized routing load. Boldface marks the better value within each matched pair; ties are left unbolded.
3.1. Quantitative Results
Table 1, Table 2 and Table 3 summarize the benchmark results. On Synapse, CER-UNet reaches a mean Dice of , the highest displayed mean in Table 1, with 31.83 M parameters. Its HD95 is 9.57, while CoTr reports the lowest HD95 in the table, at 9.04. The organ-wise results also show that the gain is not uniform across structures: CER-UNet performs strongly on the aorta and achieves the best displayed mean Dice, whereas other methods remain better on individual structures such as the spleen, left kidney, gallbladder, pancreas, and stomach.
On BTCV, CER-UNet obtains the highest displayed mean Dice of . It has the better scores for several structures, including the spleen, both kidneys, liver, stomach, inferior vena cava, portal/splenic veins, pancreas, and both adrenal glands. Other methods remain stronger for the gallbladder, esophagus, and aorta. The BTCV result therefore supports strong multi-organ performance within this benchmark rather than uniform dominance on every structure.
On ACDC, CER-UNet achieves the highest displayed mean Dice of , with the best scores for Myo () and LV (). For RV, nnU-Net performs slightly better, reaching , compared with for CER-UNet. Overall, the results across Synapse, BTCV, and ACDC show that CER-UNet remains competitive across both abdominal CT and cardiac MRI while also indicating that some baseline methods perform better for specific structures. Rahman and Marculescu reported two different MERIT variants—namely, parallel and cascaded configurations. To keep the comparison clear, Table 1 refers to the cascaded version as MERIT (Cascaded), while Table 3 refers to the parallel version as MERIT (Parallel).
3.2. Qualitative Results
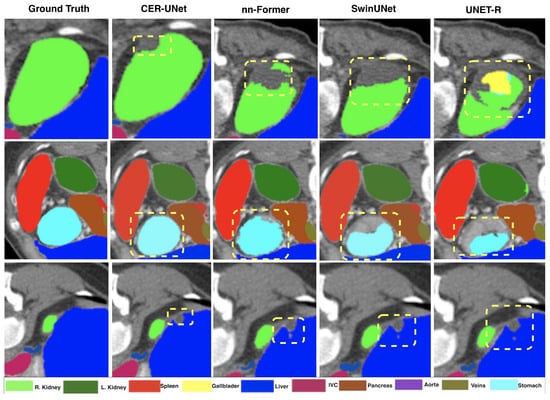
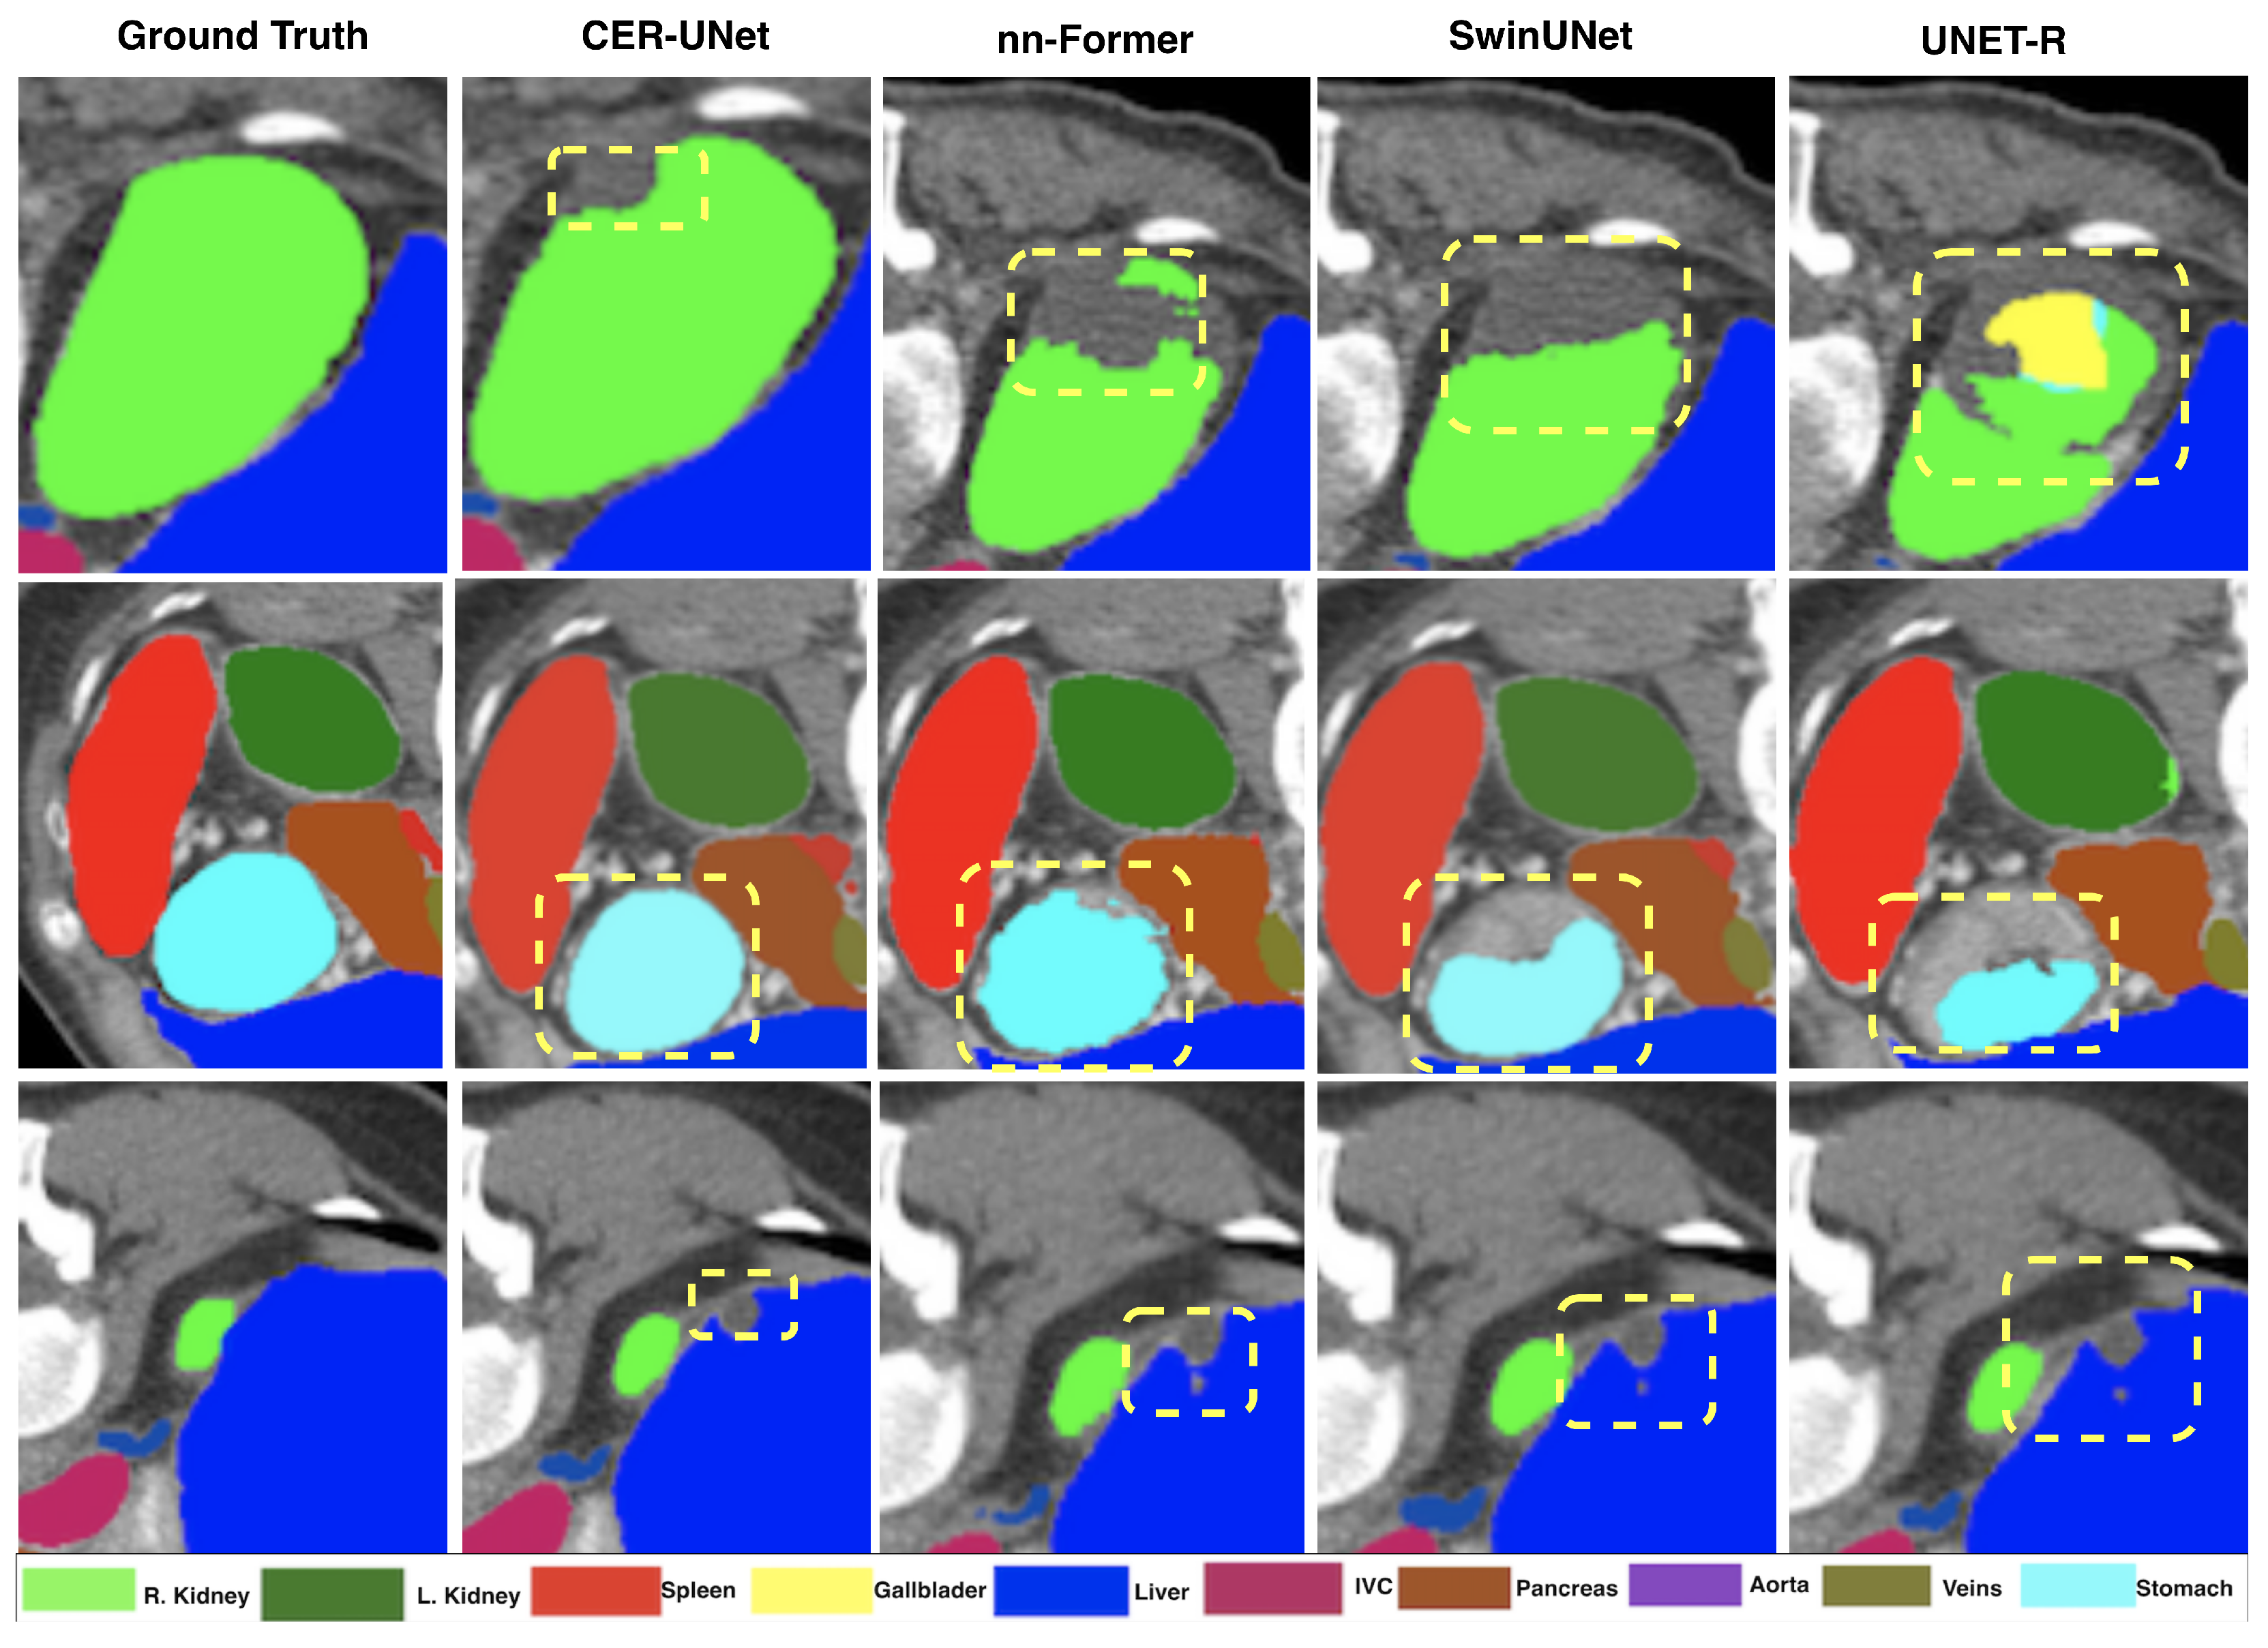
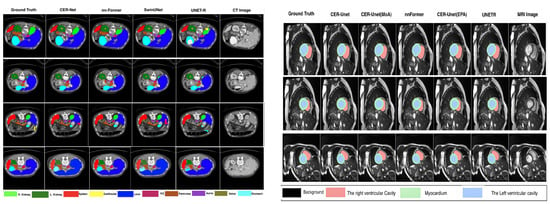
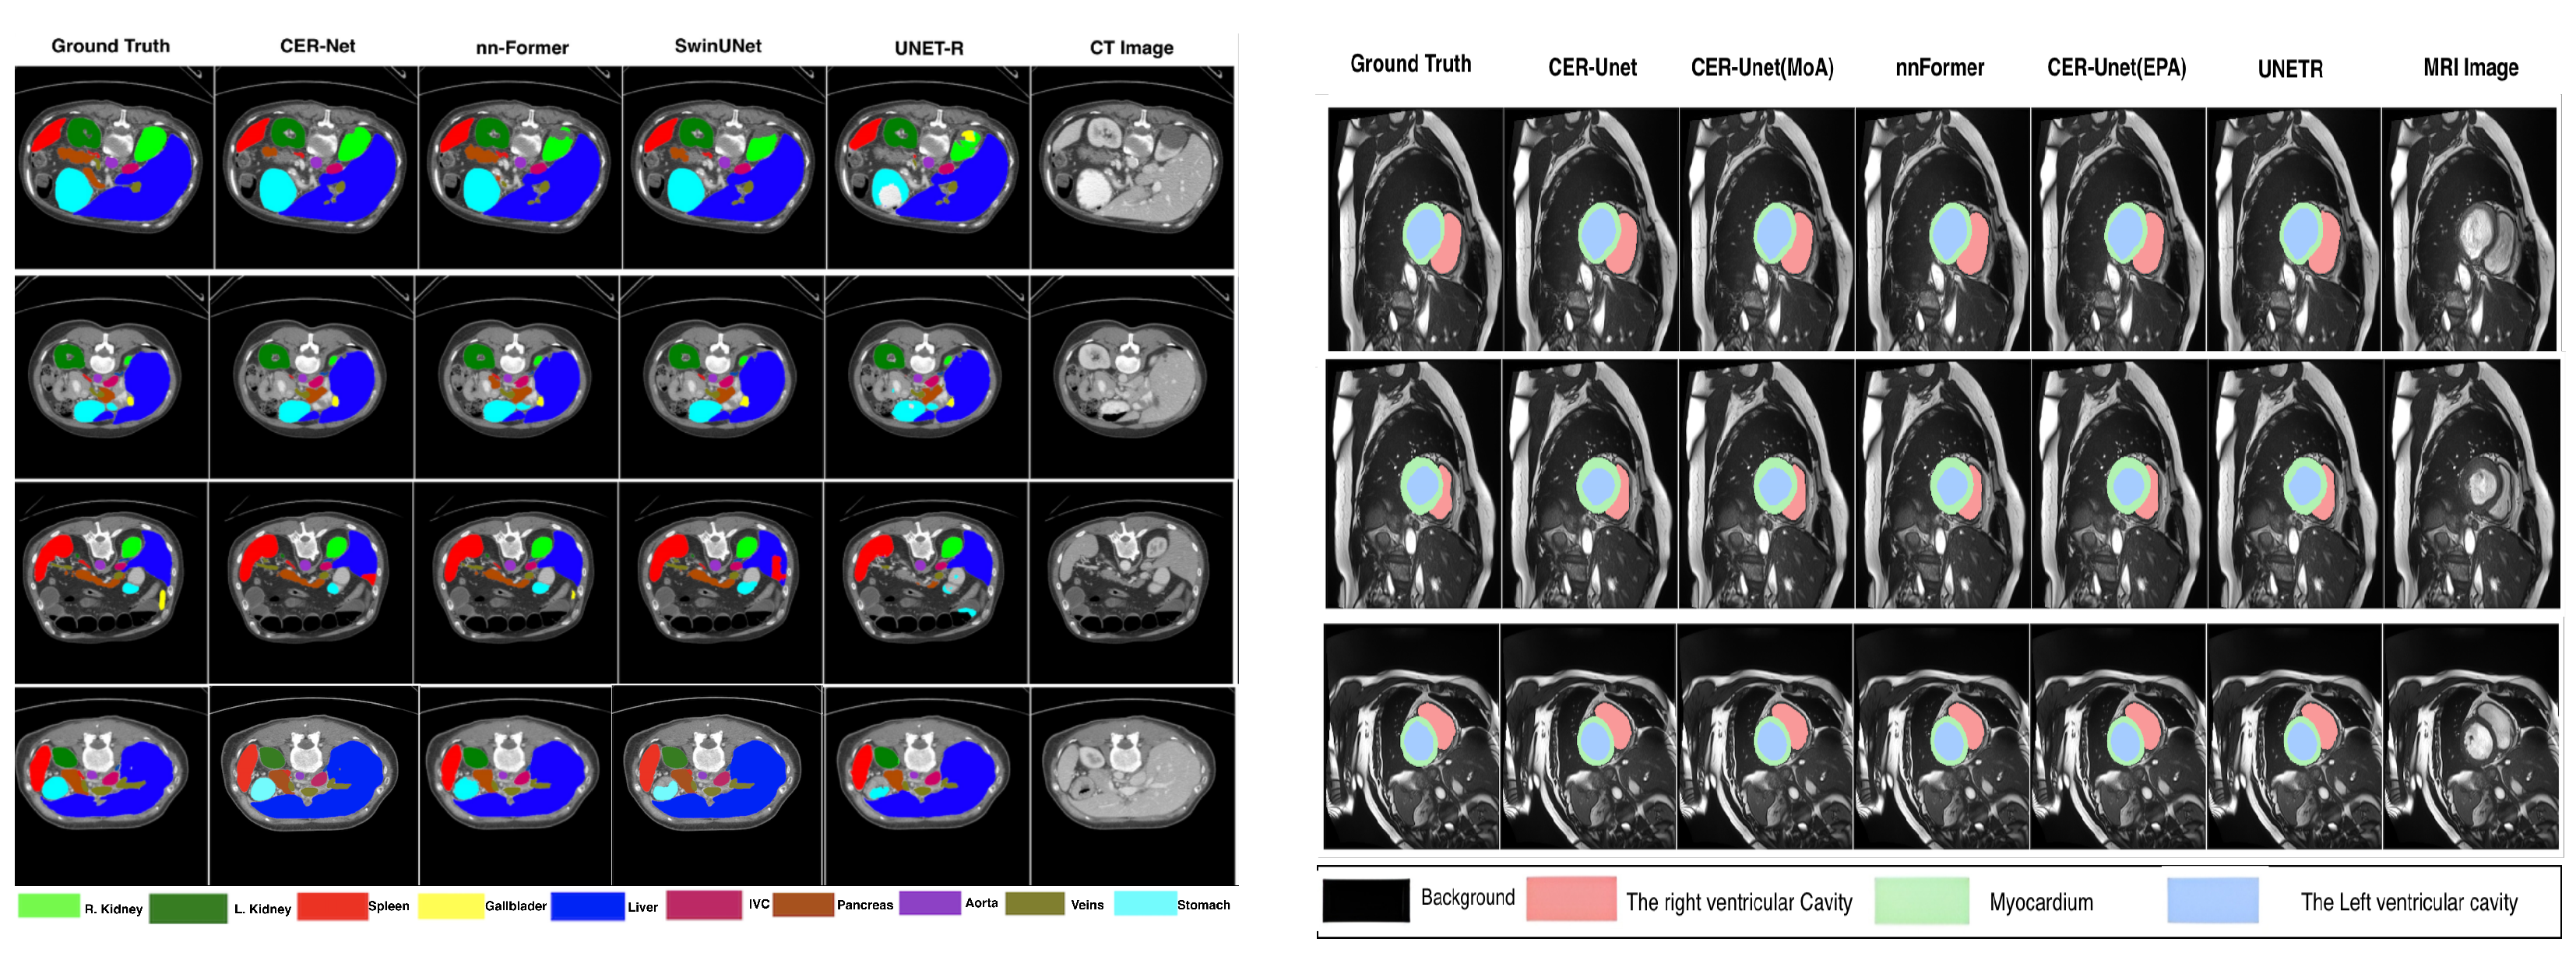
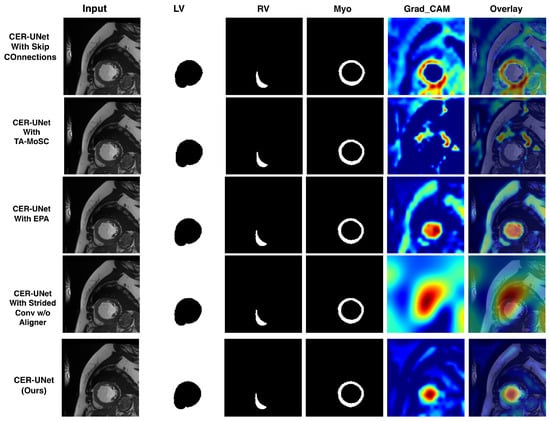
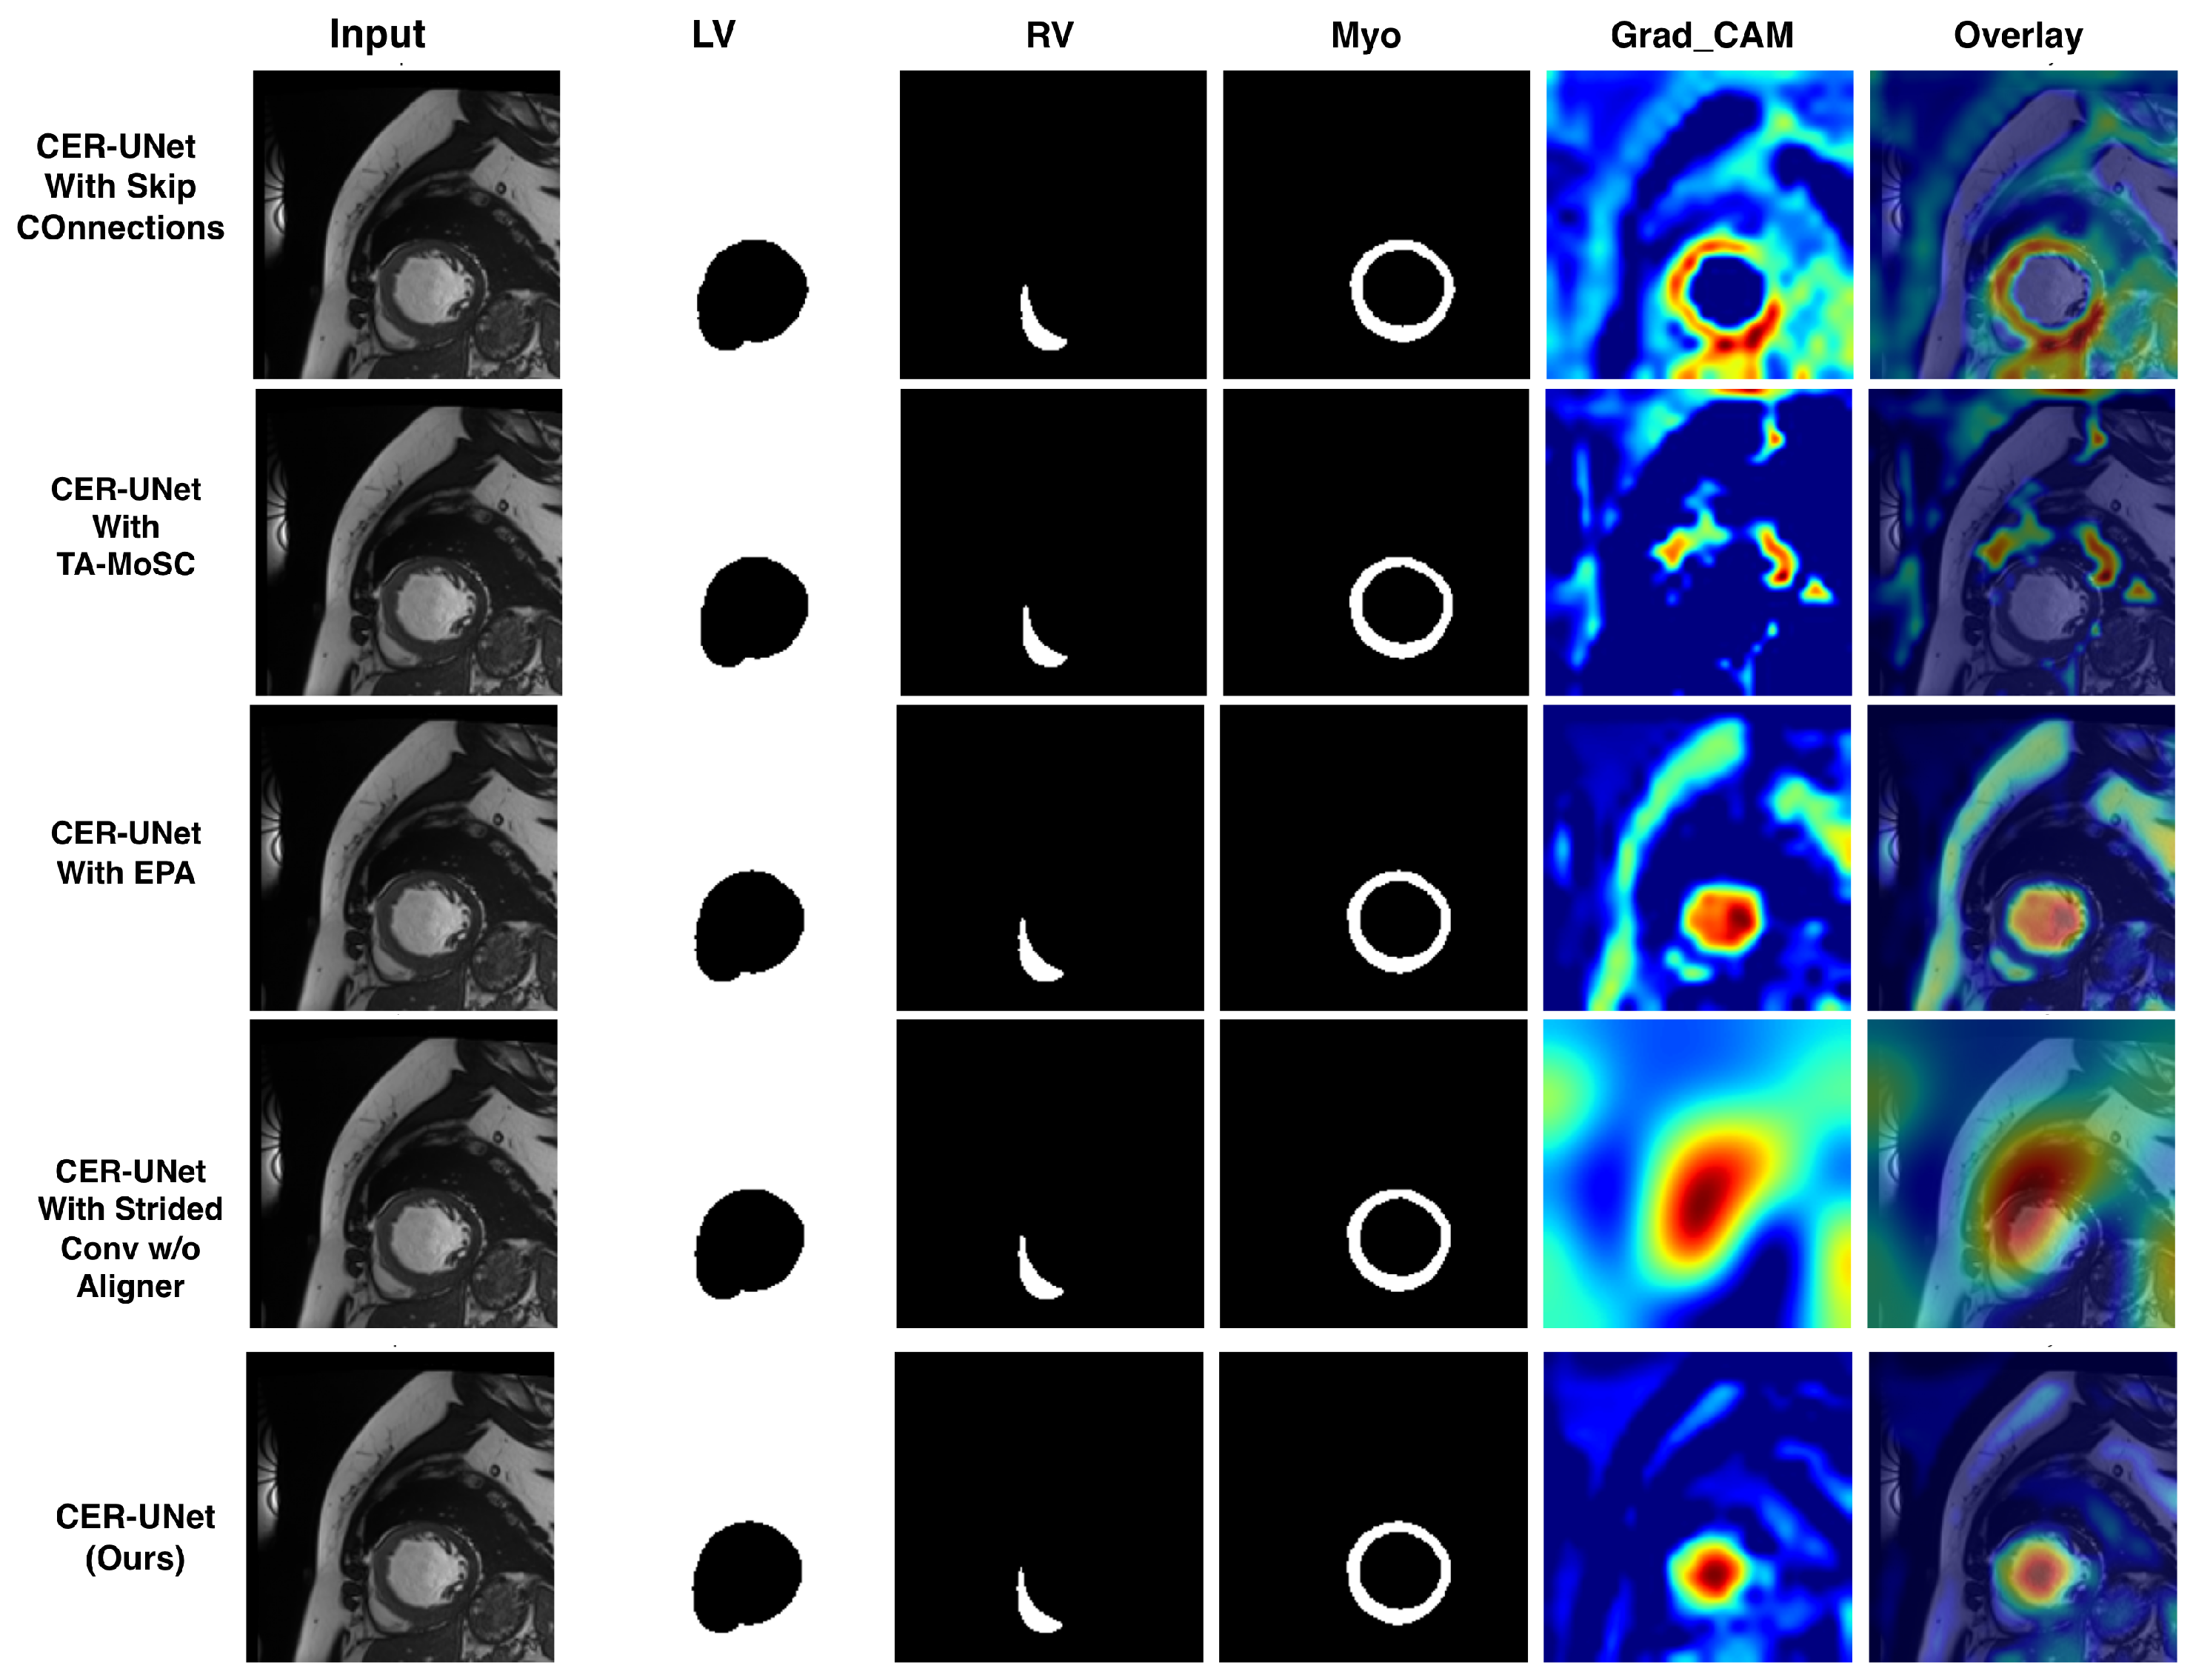
Figure 2 and Figure 3 provide representative visual examples from Synapse and ACDC. In the qualitative evaluation, CER-UNet preserves several small-organ boundaries and thin myocardial regions with limited leakage into adjacent structures. These observations are consistent with the quantitative results. The Grad-CAM maps in Figure 4 are used only to visualize model-responsive regions; they do not establish causal explanations or clinical utility.
Figure 2.
Qualitative comparison on Synapse. Highlighted regions show representative differences.
Figure 3.
Representative qualitative results on Synapse (left) and ACDC (right). The examples illustrate differences in boundary placement and ventricular delineation; they are intended as visual complements to the quantitative evaluation rather than as independent evidence of superiority.
Figure 4.
Qualitative comparison of class-wise cardiac segmentation and Grad-CAM model-response visualizations. From left to right, each row shows the input cardiac MRI slice and predicted masks for the left ventricle (LV), right ventricle (RV), and myocardium (Myo), followed by the Grad-CAM map and overlay. The visualizations are included to illustrate differences in model-sensitive regions across variants. They are not interpreted as causal explanations, evidence of diagnostic reasoning, or evidence of clinical utility.
Clinical interpretation and failure-oriented analysis: Mean Dice is useful for benchmark comparison, but a small numerical difference should not be equated with a perceptible clinical improvement. Dice is sensitive to structure size and can hide localized boundary errors in small or thin anatomy [36]. This is visible in the organ-wise results: the Synapse gallbladder and pancreas and the BTCV adrenal glands remain more difficult than large structures such as the liver. HD95 and structure-wise Dice therefore provide important context for the reported averages. For example, the Synapse mean Dice of 86.70% is 0.26 points above nnU-Net (86.44%) and 0.13 points above nnFormer (86.57%). These differences should therefore be interpreted as benchmark-level improvements rather than evidence of clinically perceptible benefit. Establishing clinical significance would require dedicated reader studies, task-specific clinical endpoints, or prospectively defined thresholds, which were beyond the scope of the present study.
3.3. Pathology-Skew Stress Test
To examine how sparse routing behaves when the training distribution becomes strongly imbalanced, we designed a controlled sampling experiment on ACDC. Only the training sampler was modified, while the validation and test sets remained unchanged. Dilated cardiomyopathy (DCM) cases were sampled with probabilities of . For each sampling level, we compared parameter-matched top-k routing without the balance loss against the same routing setup trained with the soft-CV2 objective. Three matched seeds (0, 1, and 2) were used for every condition, resulting in 30 training runs in total.
We report the mean Dice, HD95, diagnostic load (CV2), normalized routing entropy, minimum expert-load fraction, maximum-to-minimum load ratio, and number of seeds in which at least one expert receives less than 1% of the realized routing load. This stress test is evaluated separately from the standard-distribution routing audit reported in Table 6 and Table 7. Because each skew condition requires retraining under a different sampling distribution, the Dice and HD95 values are not expected to match those reported in the standard routing audit.
Stress-test interpretation: The routing diagnostics show a clear and consistent benefit from the soft-CV2 balance loss. Across all five DCM sampling probabilities, the balanced router maintains lower diagnostic load (CV2), higher normalized entropy, and a larger minimum expert-load fraction than the corresponding unregularized router. This difference becomes more noticeable as the sampling skew increases. At , one unregularized seed falls below the 1% starvation threshold, and the mean max/min ratio increases to , while the balanced router keeps the ratio at with no starved seed. A similar pattern is observed at , where one unregularized seed assigns zero load to an expert, making the max/min ratio unbounded, whereas no starvation occurs when the balance loss is used. The effect on segmentation performance is less consistent. The balanced router achieves a higher mean Dice only at and a lower HD95 at and . At the other sampling levels, the unregularized router performs slightly better on one or both segmentation metrics. These results suggest that the main benefit of the soft-CV2 objective is more stable expert utilization and reduced routing collapse, rather than a consistent improvement in Dice or HD95 across all skew conditions.
3.4. Ablation Studies on CER-UNet
Table 4 compares different skip-fusion, attention, expert-routing, and alignment configurations under the ACDC benchmark setting. The complete CER-UNet achieves the highest mean Dice of , although the differences from several simpler variants are relatively small. The two-expert configuration reaches , the variant without ALIGNER obtains , and the model with static skip connections achieves , while TA-MoSC reaches . Overall, the ablation results favor the complete CER-UNet configuration, but they also indicate that the final improvement comes from the combined design rather than from a single component alone.
The value in the main ACDC benchmark and architectural ablation is a single benchmark result, whereas Table 6 and Table 7 constitute a separate controlled three-seed routing audit. The audit is intended to compare routing formulations under a matched repeated-training protocol, not to reproduce the main-table point estimate. To isolate the routing mechanism from the broader architectural ablation, Table 6 and Table 7 compare the routing variants using the same backbone and an effectively matched parameter budget over three seeds. Robust CapMoE without volume context provides the strongest overall segmentation result in this audit, with the highest mean Dice () and the lowest mean HD95 (). The utilization statistics point in the same direction: the diagnostic load (CV2) is , normalized entropy is , the minimum expert-load fraction is , and the max/min ratio is . Dense learned routing, in contrast, shows a near-zero minimum load () and a very large max/min ratio, indicating severe imbalance.
Adding the audit-specific volume-context signal does not provide a consistent empirical benefit. The volume-context variant achieves the highest Myo Dice (), but its mean Dice decreases from to , and its HD95 increases from to . The no-volume configuration is also numerically better for RV Dice, LV Dice, and the reported utilization diagnostics. We therefore retain the no-volume variant as the stronger configuration in this controlled audit and do not claim an additional overall benefit from explicit volume context.
Robust CapMoE configuration in the routing audit: To evaluate whether expert utilization can be stabilized beyond the standard top-k router, we define a Robust CapMoE configuration for the controlled routing experiments. The architecture is unchanged and uses four capsule experts, four independent routing gates, and top-k selection with . For gate g, the pooled routing representation () is projected to expert logits:
During training only, zero-mean Gaussian noise with a standard deviation of is added to the router logits before expert selection to encourage exploration and prevent premature expert collapse. Routing probabilities are subsequently computed as
and the two experts with the largest logits are selected for each routing token. Their selected logits are renormalized with a softmax before the expert outputs are combined. This audit-specific Robust CapMoE rule is intentionally distinct from the standard CapMoE formulation in Algorithm 1, which selects the top-k entries from the full softmax probabilities, then renormalizes the selected scores.
The robust auxiliary objective combines complementary soft- and hard-routing regularizers. Let
denote the mean soft importance assigned to expert e, and let denote the corresponding fraction of hard top-k assignments. The switch-style term is
while the soft importance imbalance is measured using
Additionally we use the router-logit stabilization term, i.e.,
and a differentiable starvation penalty, i.e.,
After averaging the gate-wise quantities, the robust routing objective is
An expert is counted as starved for diagnostic reporting when its mean hard routing load falls below .
- Volume-context ablation:
The robust-routing audit also tests whether a simple volume-level descriptor improves routing beyond the slice-wise gate representation. CapMoE receives the fused feature tensor as consecutive 2D slice tokens and first obtains the slice-wise routing descriptor:
For the ACDC experiments, each volume contains routing tokens. Their mean representation is
The volume-context variant uses
where is a learnable scalar initialized to zero. The same volume descriptor is therefore shared across the T slice tokens of a volume, while the learnable scale allows the router to determine how strongly that context should modify the original slice-wise representation. In Robust CapMoE without volume context, this operation is disabled, and the gate receives directly. All remaining expert, routing, and optimization settings are identical between the two robust variants.
3.5. Computational Analysis
Table 5 summarizes the computational profile of CER-UNet and representative 3D segmentation models on the Synapse setting using a 128 × 128 × 64 input and batch size of 1. CER-UNet contains 31.83 M parameters and requires 216.4 GFLOPs per volume, while its peak GPU memory consumption is approximately 2.72 GB and the measured inference time is 78.8 ms per volume. In terms of model size, CER-UNet remains comparable to nnU-Net (30.71 M parameters) and is substantially smaller than UNETR (92.58 M), Swin-UNETR (62.8 M), nnFormer (150.2 M), and CoTr (41.86 M). CER-UNet also requires considerably fewer FLOPs than nnU-Net (476.57 G), Swin-UNETR (384.2 G), and CoTr (337.48 G), while its computational cost is close to nnFormer (213.4 G); UNETR remains the least computationally intensive model in terms of FLOPs, at 86.02 G. The most notable advantage of CER-UNet is its memory footprint, which is the lowest among the compared models, at 2.72 GB, compared with 7.65 GB for nnU-Net, 15.24 GB for UNETR, 13.90 GB for Swin-UNETR, 9.74 GB for nnFormer, and 8.10 GB for CoTr. CER-UNet also achieves the second-lowest measured inference latency, at 78.8 ms, slightly behind UNETR (74.2 ms) but faster than nnU-Net (80.5 ms), nnFormer (128.2 ms), CoTr (158.4 ms), and Swin-UNETR (176.2 ms). Overall, these results indicate that CER-UNet provides a favorable memory–latency trade-off while maintaining a moderate computational cost, rather than uniformly minimizing every complexity measure.
3.6. Limitations and Future Work
Several limitations define the scope of the present evidence. First, Synapse, BTCV, and ACDC are evaluated independently within their benchmark distributions. Performance across CT and MRI tasks does not establish frozen-checkpoint generalization to unseen hospitals, scanner vendors, acquisition protocols, or anatomical domains.
Second, the pathology-skew experiment addresses a narrower question: whether expert utilization remains stable when the ACDC training sampler is deliberately imbalanced. The soft-CV2 loss consistently improves the routing diagnostics and prevents the starvation events observed in the unregularized router, but it does not improve Dice or HD95 at every skew level. The experiment therefore supports the stability of expert utilization under pathology-prevalence imbalance, not general robustness to unrelated domain shifts.
Third, the main tables are benchmark comparisons. Small differences in Dice are not demonstrated clinical effects, and no reader study, manual-correction analysis, treatment-planning endpoint, or prospective clinical threshold was evaluated. The qualitative examples and Grad-CAM maps should be interpreted within the same limitation.
Finally, the 2.5D design emphasizes efficient in-plane and local through-plane processing. It may not capture long-range 3D continuity as completely as a fully volumetric architecture, and CapMoE/ALIGNER introduces additional routing and alignment operations relative to a static skip connection. Future work should therefore include frozen-checkpoint multi-center and multi-vendor evaluation, structure-size and failure-mode stratification, surface-distance and calibration metrics, and reader or workflow-based assessment.
4. Conclusions
CER-UNet combines 2.5D factorized representation learning, parameter-free statistical attention, capsule-inspired spatial experts, sparse routing, and decoder-stage alignment within an adaptive skip pathway. Across Synapse, BTCV, and ACDC, the model achieves competitive benchmark performance with a compact parameter budget. The routing experiments add a more specific result. Under the standard ACDC audit, the no-volume Robust CapMoE variant provides the best overall Dice and HD95 among the evaluated routing configurations, while the pathology-skew experiment shows that the soft-CV2 objective keeps expert utilization balanced and prevents the collapse events observed without balancing. The routing gain is therefore most clearly supported as improved utilization stability rather than as a uniform segmentation-accuracy gain across skew conditions.
Overall, the results support adaptive capsule-expert routing as a practical mechanism for refining encoder–decoder feature transfer. External multi-center validation and clinically meaningful workflow endpoints remain necessary before drawing conclusions about deployment or cross-institutional robustness.
Author Contributions
Conceptualization, R.R. and K.S.; methodology, N.K.Y., R.R., W.C.W.C. and K.S.; software, N.K.Y.; validation, N.K.Y. and W.C.W.C.; formal analysis, N.K.Y. and W.C.W.C.; investigation, N.K.Y.; resources, W.C.W.C. and K.S.; data curation, N.K.Y.; writing original draft preparation, N.K.Y.; writing review and editing, N.K.Y., R.R., W.C.W.C. and K.S.; visualization, N.K.Y.; supervision, W.C.W.C. and K.S.; project administration, W.C.W.C. and K.S.; funding acquisition, W.C.W.C. and K.S. All authors have read and agreed to the published version of the manuscript.
Funding
This work received partial support from the National Science Foundation (Grant No. 2346643, https://www.nsf.gov/awardsearch/showAward?AWD_ID=2346643 (accessed on 31 August 2026)), the United States Defense Established Program to Stimulate Competitive Research (DEPSCoR) (Award No. FA9550-23-1-0495, https://dtic.dimensions.ai/details/grant/grant.14525543 (accessed on 31 August 2026)), the U.S. Department of Education (Grant No. P116Z240151), the University of South Dakota, the South Dakota Board of Regents Governor’s Research Fund, and the United States National Institutes of Health (Grant No. 1R01EB038224). Any opinions, interpretations, conclusions, or recommendations expressed herein are those of the authors and should not be construed as representing the official views of the funding agencies.
Institutional Review Board Statement
Not applicable.
Informed Consent Statement
Not applicable.
Data Availability Statement
No new dataset was generated in this study. The experimental results reported in this article were obtained using publicly available benchmark datasets. The Synapse multi-organ CT dataset is available through the MICCAI 2015 Multi-Atlas Abdomen Labeling Challenge/Synapse repository at https://www.synapse.org/Synapse:syn3193805/wiki/217789 (accessed on 31 August 2026). The BTCV abdominal CT dataset used in this study is available from the Beyond the Cranial Vault benchmark data source, as cited in the manuscript [22]. The ACDC cardiac MRI dataset is publicly available from the Automated Cardiac Diagnosis Challenge website at https://www.creatis.insa-lyon.fr/Challenge/acdc/ (accessed on 31 August 2026). The implementation of CER-UNet is available at https://github.com/nandkyadavusa/CER-Unet.git (accessed on 31 August 2026).
Conflicts of Interest
The authors declare no conflicts of interest.
References
- Xing, J.; Zhang, J. Segmentation of Brain Tumors Using a Multi-Modal Segment Anything Model (MSAM) with Missing Modality Adaptation. Bioengineering 2025, 12, 871. [Google Scholar] [CrossRef] [Scilit]
- Yu, B.; Markham, H.; Moutasim, K.; Foria, V.; Liu, H. ClinSegNet: Towards Reliable and Enhanced Histopathology Screening. Bioengineering 2025, 12, 1156. [Google Scholar] [CrossRef] [Scilit] [PubMed]
- Babaeipour, R.; Fox, M.S.; Parraga, G.; Ouriadov, A. Comparative analysis of foundational, advanced, and traditional deep learning models for hyperpolarized gas MRI lung segmentation: Robust performance in data-constrained scenarios. Bioengineering 2025, 12, 1062. [Google Scholar] [CrossRef] [Scilit] [PubMed]
- Ronneberger, O.; Fischer, P.; Brox, T. U-Net: Convolutional Networks for Biomedical Image Segmentation. In Proceedings of the Medical Image Computing and Computer-Assisted Intervention (MICCAI); Springer: Cham, Switzerland, 2015; Volume 9351, pp. 234–241. [Google Scholar] [CrossRef] [Scilit]
- Yadav, N.K.; Rizk, R.; Chen, W.C.; Santosh, K.C. I Detect What I Don’t Know: Incremental Anomaly Learning with SWAG. In Intelligent Human Computer Interaction; Springer: Cham, Switzerland, 2026; Volume 16437, pp. 129–144. [Google Scholar] [CrossRef] [Scilit] [PubMed]
- Azad, R.; Arimond, R.; Aghdam, E.K.; Kazerouni, A.; Merhof, D. Dae-former: Dual attention-guided efficient transformer for medical image segmentation. In Proceedings of the International Workshop on Predictive Intelligence in Medicine; Springer: Cham, Switzerland, 2023; pp. 83–95. [Google Scholar]
- Hatamizadeh, A.; Nath, V.; Tang, Y.; Yang, D.; Roth, H.R.; Xu, D. Swin unetr: Swin transformers for semantic segmentation of brain tumors in mri images. In Proceedings of the International MICCAI Brainlesion Workshop; Springer: Cham, Switzerland, 2021; pp. 272–284. [Google Scholar]
- Yadav, N.K.; Singh, S.K.; Dubey, S.R. TranscoderGAN: Transformer-Inception Based Encoder-Decoder Generative Adversarial Network for Thermal-Visible Face Transformation. In Proceedings of the International Conference on Computer Vision and Image Processing; Springer: Cham, Switzerland, 2024; pp. 1–11. [Google Scholar]
- Hatamizadeh, A.; Tang, Y.; Nath, V.; Yang, D.; Myronenko, A.; Landman, B.; Roth, H.R.; Xu, D. Unetr: Transformers for 3d medical image segmentation. In Proceedings of the IEEE/CVF Winter Conference on Applications of Computer Vision; IEEE: New York, NY, USA, 2022; pp. 574–584. [Google Scholar]
- Ma, J.; Li, F.; Wang, B. U-mamba: Enhancing long-range dependency for biomedical image segmentation. arXiv 2024, arXiv:2401.04722. [Google Scholar]
- Roy, S.; Koehler, G.; Ulrich, C.; Baumgartner, M.; Petersen, J.; Isensee, F.; Jaeger, P.F.; Maier-Hein, K. MedNeXt: Transformer-driven Scaling of ConvNets for Medical Image Segmentation. arXiv 2023, arXiv:2303.09975. [Google Scholar]
- Yadav, N.K.; Rizk, R.; Chen, W.C.W.; Santosh, K.C. DynaFormer: A Dynamic Dual-Attention Transformer with Linear-Complexity Fusion for Medical Image Segmentation. In Proceedings of the 2026 IEEE Conference on Artificial Intelligence (CAI); IEEE: New York, NY, USA, 2026; pp. 1518–1523. [Google Scholar] [CrossRef] [Scilit]
- Zhou, Z.; Siddiquee, M.M.R.; Tajbakhsh, N.; Liang, J. UNet++: A Nested U-Net Architecture for Medical Image Segmentation. In Proceedings of the Deep Learning in Medical Image Analysis and Multimodal Learning for Clinical Decision Support; Springer: Cham, Switzerland, 2018; pp. 3–11. [Google Scholar]
- Dai, J.; Qi, H.; Xiong, Y.; Li, Y.; Zhang, G.; Hu, H.; Wei, Y. Deformable Convolutional Networks. In Proceedings of the IEEE International Conference on Computer Vision (ICCV); IEEE: New York, NY, USA, 2017; pp. 764–773. [Google Scholar]
- Rahman, M.M.; Munir, M.; Marculescu, R. Emcad: Efficient multi-scale convolutional attention decoding for medical image segmentation. In Proceedings of the IEEE/CVF Conference on Computer Vision and Pattern Recognition; IEEE: New York, NY, USA, 2024; pp. 11769–11779. [Google Scholar]
- Wang, H.; Cao, P.; Wang, J.; Zaiane, O.R. UCTransNet: Rethinking the Skip Connections in U-Net from a Channel-Wise Perspective with Transformer. In Proceedings of the AAAI Conference on Artificial Intelligence; Association for the Advancement of Artificial Intelligence (AAAI): Palo Alto, CA, USA, 2022; Volume 36, pp. 2441–2449. [Google Scholar] [CrossRef] [Scilit]
- Luo, Z.; Zhu, X.; Zhang, L.; Sun, B. Rethinking U-Net: Task-Adaptive Mixture of Skip Connections for Enhanced Medical Image Segmentation. In Proceedings of the AAAI Conference on Artificial Intelligence; Association for the Advancement of Artificial Intelligence (AAAI): Washington, DC, USA, 2025; Volume 39, pp. 5874–5882. [Google Scholar]
- Yang, L.; Zhang, R.Y.; Li, L.; Xie, X. SimAM: A Simple, Parameter-Free Attention Module for Convolutional Neural Networks. In Proceedings of the 38th International Conference on Machine Learning, Virtual, 18–24 July 2021; Meila, M., Zhang, T., Eds.; Proceedings of Machine Learning Research, PMLR: Cambridge, MA, USA, 2021; Volume 139, pp. 11863–11874. [Google Scholar]
- Woo, S.; Park, J.; Lee, J.Y.; Kweon, I.S. Cbam: Convolutional block attention module. In Proceedings of the European Conference on Computer Vision (ECCV); Springer: Cham, Switzerland, 2018; pp. 3–19. [Google Scholar]
- Shaker, A.M.; Maaz, M.; Rasheed, H.; Khan, S.; Yang, M.H.; Khan, F.S. UNETR++: Delving into Efficient and Accurate 3D Medical Image Segmentation. IEEE Trans. Med. Imaging 2024, 43, 3377–3390. [Google Scholar] [CrossRef] [Scilit] [PubMed]
- Cardoso, M.J.; Li, W.; Brown, R.; Ma, N.; Kerfoot, E.; Wang, Y.; Murrey, B.; Myronenko, A.; Zhao, C.; Yang, D.; et al. MONAI: An Open-Source Framework for Deep Learning in Healthcare. arXiv 2022, arXiv:2211.02701. [Google Scholar] [CrossRef] [Scilit]
- Landman, B.; Xu, Z.; Iglesias, J.E.; Styner, M.; Langerak, T.R.; Klein, A. (Eds.) MICCAI Multi-Atlas Labeling Beyond the Cranial Vault—Workshop and Challenge; Synapse: Munich, Germany, 2015; Available online: https://www.synapse.org/Synapse:syn3193805/wiki/ (accessed on 31 August 2026).
- Bernard, O.; Lalande, A.; Zotti, C.; Cervenansky, F.; Yang, X.; Heng, P.A.; Cetin, I.; Lekadir, K.; Camara, O.; Ballester, M.A.G.; et al. Deep learning techniques for automatic MRI cardiac multi-structures segmentation and diagnosis: Is the problem solved? IEEE Trans. Med. Imaging 2018, 37, 2514–2525. [Google Scholar] [CrossRef] [Scilit] [PubMed]
- Urschler, M.; Rechberger, E.; Thaler, F.; Štern, D. Cascaded Self-Supervision to Advance Cardiac MRI Segmentation in Low-Data Regimes. Bioengineering 2025, 12, 872. [Google Scholar] [CrossRef] [Scilit] [PubMed]
- Chen, J.; Mei, J.; Li, X.; Lu, Y.; Yu, Q.; Wei, Q.; Luo, X.; Xie, Y.; Adeli, E.; Wang, Y.; et al. TransUNet: Rethinking the U-Net architecture design for medical image segmentation through the lens of transformers. Med. Image Anal. 2024, 97, 103280. [Google Scholar] [CrossRef] [Scilit] [PubMed]
- Cao, H.; Wang, Y.; Chen, J.; Jiang, D.; Zhang, X.; Tian, Q.; Wang, L. Swin-Unet: Unet-like Pure Transformer for Medical Image Segmentation. arXiv 2021, arXiv:2105.05537. [Google Scholar]
- Huang, X.; Deng, Z.; Li, D.; Yuan, X.; Fu, Y. Missformer: An effective transformer for 2d medical image segmentation. IEEE Trans. Med. Imaging 2022, 42, 1484–1494. [Google Scholar] [CrossRef] [Scilit] [PubMed]
- Rahman, M.M.; Marculescu, R. Multi-scale hierarchical vision transformer with cascaded attention decoding for medical image segmentation. In Medical Imaging with Deep Learning; PMLR: Cambridge, MA, USA, 2024; Volume 227, pp. 1526–1544. [Google Scholar]
- Liu, J.; Yang, H.; Zhou, H.Y.; Xi, Y.; Yu, L.; Li, C.; Liang, Y.; Shi, G.; Yu, Y.; Zhang, S.; et al. Swin-umamba: Mamba-based unet with imagenet-based pretraining. In Proceedings of the International Conference on Medical Image Computing and Computer-Assisted Intervention; Springer: Cham, Switzerland, 2024; pp. 615–625. [Google Scholar]
- Liu, J.; Li, K.; Huang, C.; Dong, H.; Song, Y.; Li, R. MixFormer: A Mixed CNN–Transformer Backbone for Medical Image Segmentation. IEEE Trans. Instrum. Meas. 2025, 74, 5001220. [Google Scholar] [CrossRef] [Scilit]
- Xie, Y.; Zhang, J.; Shen, C. CoTr: Efficiently Bridging CNN and Transformer for 3D Medical Image Segmentation. arXiv 2021, arXiv:2103.03024. [Google Scholar]
- Isensee, F.; Jaeger, P.F.; Kohl, S.A.; Petersen, J.; Maier-Hein, K.H. nnU-Net: A Self-Configuring Method for Deep Learning-Based Biomedical Image Segmentation. Nat. Methods 2021, 18, 203–211. [Google Scholar] [CrossRef] [Scilit] [PubMed]
- Zhou, H.Y.; Guo, J.; Zhang, Y.; Han, X.; Yu, L.; Wang, L.; Yu, Y. nnFormer: Volumetric medical image segmentation via a 3D transformer. IEEE Trans. Image Process. 2023, 32, 4036–4045. [Google Scholar] [CrossRef] [Scilit] [PubMed]
- Zhang, W.; Zhang, Y.; Zhang, L. Multiplanar Data Augmentation and Lightweight Skip Connection Design for Deep-Learning-Based Abdominal CT Image Segmentation. IEEE Trans. Instrum. Meas. 2023, 72, 2532111. [Google Scholar] [CrossRef] [Scilit]
- Huang, D.X.; Zhou, X.H.; Gui, M.J.; Xie, X.L.; Liu, S.Q.; Wang, S.Y.; Feng, Z.Q.; Hou, Z.G. MOSformer: Momentum encoder-based inter-slice fusion transformer for medical image segmentation. arXiv 2025. [Google Scholar] [CrossRef] [Scilit]
- Seghier, M.L. Image Segmentation Evaluation With the Dice Index: Methodological Issues. Int. J. Imaging Syst. Technol. 2024, 34, e23203. [Google Scholar] [CrossRef] [Scilit]
Disclaimer/Publisher’s Note: The statements, opinions and data contained in all publications are solely those of the individual author(s) and contributor(s) and not of MDPI and/or the editor(s). MDPI and/or the editor(s) disclaim responsibility for any injury to people or property resulting from any ideas, methods, instructions or products referred to in the content. |
© 2026 by the authors. Licensee MDPI, Basel, Switzerland. This article is an open access article distributed under the terms and conditions of the Creative Commons Attribution (CC BY) license.