


Abstract
Rapid selection of appropriate antimicrobial therapy is important for improving patient outcomes and supporting antimicrobial stewardship, particularly in the context of increasing antimicrobial resistance (AMR). Conventional antimicrobial susceptibility testing (AST), although essential for clinical decision-making, may not provide actionable susceptibility information immediately. This study develops an explainable multi-label machine learning framework for patient-specific antibiotic recommendation based on susceptibility prediction and ranked decision support using routinely collected clinical microbiology data. The framework integrates leakage-controlled preprocessing, microbiological and demographic feature representation, multi-label susceptibility encoding, One-vs-Rest ensemble learning, probability-based antibiotic ranking, statistical evaluation, temporal validation, and SHapley Additive exPlanations (SHAP). The dataset comprised 234 clinical records, of which 196 bacterial/other records were retained for the primary analysis after excluding 38 fungal records. A chronological partition produced 156 development records and 40 temporally held-out test records. Thirty-three antibiotic susceptibility labels were retained based on development-set availability. XGBoost, Random Forest, and LightGBM were evaluated using five-fold out-of-fold (OOF) validation. Random Forest was selected for the final recommendation and explainability analyses based on its overall performance, achieving a Micro-F1 of 0.4204, Macro-F1 of 0.3003, AUROC of 0.7069, AUPRC of 0.3979, and Precision@5 of 0.3962. A leakage-safe local antibiogram was additionally evaluated as a population-level ranking baseline, achieving a Precision@5 of 0.3077. Feature ablation showed that the combination of organism and age produced the highest OOF Micro-F1 (0.4635) and AUROC (0.7186), while the addition of gender and specimen type improved selected ranking measures but did not consistently improve aggregate classification performance. On the temporally held-out test cohort, Random Forest achieved a Micro-F1 of 0.4267, AUROC of 0.7447, AUPRC of 0.4892, and Precision@5 of 0.4350. SHAP analysis was completed for all 33 antibiotic-specific classifiers, providing global and antibiotic-level explanations of model behavior. The framework provides an interpretable approach for ranking potentially susceptible antibiotics at the patient level and is intended as clinical decision support rather than an autonomous prescribing system. Further external and prospective multicentre validation, including dedicated evaluation of challenging cases such as pan-drug resistance, is required before clinical deployment.
1. Introduction
Antimicrobial resistance (AMR) has emerged as one of the most pressing global public health challenges, threatening the effective prevention and treatment of bacterial infections. The rapid rise in AMR, driven by the inappropriate, excessive, and unnecessary use of antibiotics, has accelerated the emergence and spread of multidrug-resistant (MDR) bacteria, leading to prolonged hospitalization, increased healthcare costs, treatment failure, higher mortality rates, and diminished long-term treatment effectiveness [1,2,3]. Because conventional antimicrobial susceptibility testing often requires considerable processing time, clinicians frequently rely on empirical antibiotic prescribing before laboratory results become available, increasing the risk of suboptimal treatment and further contributing to the development of antimicrobial resistance [4].
Rapid identification of effective antimicrobial therapy is therefore essential for improving patient outcomes, minimizing unnecessary antibiotic exposure, and slowing the spread of resistant microorganisms [5,6]. In recent years, advances in artificial intelligence (AI) and machine learning (ML) have demonstrated considerable potential for predicting antimicrobial susceptibility and supporting evidence-based antibiotic selection [7,8]. Nevertheless, most existing machine learning approaches formulate antimicrobial susceptibility prediction as a binary or single-label classification problem, predicting the effectiveness of only one antibiotic at a time. Such approaches provide limited support for real-world clinical decision-making, where clinicians must evaluate multiple therapeutic options simultaneously. Furthermore, many existing models lack interpretability, making it difficult for healthcare professionals to understand the factors influencing model predictions and reducing trust in AI-assisted clinical decision support [8,9,10].
To address these limitations, this study proposes an end-to-end explainable multi-label machine learning framework for patient-specific antibiotic recommendation support using routine clinical and microbiological data. The proposed framework integrates automated data preprocessing, feature engineering, multi-label prediction, explainable artificial intelligence (XAI) using SHAP, statistical evaluation, patient-specific antibiotic ranking, and automated reporting within a unified clinical decision-support pipeline. By combining these components, the framework transforms heterogeneous clinical and microbiological information into transparent, patient-specific antibiotic susceptibility rankings that can support evidence-based antimicrobial decision-making and stewardship [11,12,13].
Unlike conventional single-label prediction methods, the proposed framework introduces a patient-specific multi-label recommendation strategy that simultaneously predicts susceptibility probabilities for multiple antibiotics and ranks them for each patient. This formulation better reflects situations in which an individual isolate may be susceptible to more than one antimicrobial option and therefore provides a ranked set of potentially suitable candidates rather than a single binary prediction [13,14]. The framework reports predicted susceptibility probabilities rather than interpreting these values as clinical certainty or prescribing instructions.
The framework is comprehensively evaluated using three ensemble learning algorithms—XGBoost, Random Forest, and LightGBM—to identify the most effective model for patient-specific antimicrobial susceptibility prediction. Model development and comparison are performed using five-fold out-of-fold (OOF) validation within a development cohort, while a temporally held-out patient cohort is reserved for final evaluation. In addition to conventional multi-label classification measures, including Micro-F1 and Macro-F1, the study evaluates AUROC and AUPRC together with ranking-based measures, including Precision@1, Precision@3, Precision@5, Recall@1, Recall@3, and Recall@5. A leakage-safe local antibiogram is included as a population-level baseline to determine whether patient-specific modeling provides additional value beyond empirical population-level susceptibility patterns.
To improve transparency and clinical interpretability, SHAP-based explainable artificial intelligence is employed to quantify the contribution of input features to antibiotic-specific model predictions. The final framework provides SHAPs for all 33 retained antibiotic-specific classifiers. In addition, a Random Forest feature-ablation analysis examines the contribution of organism, age, gender, and specimen-related information under the same out-of-fold evaluation protocol. Statistical uncertainty is assessed using bootstrap confidence intervals, and paired model comparisons are evaluated with multiple-comparison correction. The framework also generates ranked Top-K antibiotic susceptibility outputs and population-level summaries of predicted susceptibility probabilities, providing complementary information that may support antimicrobial stewardship and evidence-based decision-making within the study setting in Erbil City, Kurdistan Region of Iraq.
Importantly, the proposed framework is intended as an interpretable decision-support approach rather than an autonomous prescribing system. Patient-specific rankings should be interpreted together with laboratory AST results and clinical considerations that are not represented in the current dataset, such as infection site, allergy history, renal and hepatic function, drug interactions, contraindications, dosing requirements, antimicrobial availability, and local treatment guidelines.
2. Materials and Methods
2.1. Study Design
This study developed an explainable multi-label machine learning framework for patient-specific antibiotic recommendation support using routinely collected clinical microbiology data. The aim was to estimate the probability that an individual patient’s isolate would be reported as susceptible to multiple antibiotics and to use these probabilities to produce a ranked list of potential antibiotic options.
Because the dataset originated from a single clinical center and contained one record per patient, hospital-level grouping was not applicable; no outbreak identifier was available for additional cluster-based partitioning. The analytical workflow included clinical data collection, microbiological identification and antimicrobial susceptibility testing (AST), data quality assessment, cohort construction, chronological data partitioning, leakage-controlled preprocessing, feature construction, multi-label target generation, machine learning model development, model comparison, statistical analysis, feature ablation, temporal validation, and explainability analysis using SHAP. Because a single patient isolate may be susceptible to multiple antibiotics simultaneously, the prediction task was formulated as a multi-label classification problem. XGBoost, Random Forest, and LightGBM were evaluated using a One-vs-Rest (OvR) strategy. Model development was performed using five-fold out-of-fold (OOF) validation within the development cohort, while the most recent observations were reserved as an independent temporal-test cohort.
The framework therefore consisted of seven major stages: (i) clinical data acquisition and initial cohort construction, (ii) microbiological identification and antimicrobial susceptibility testing, (iii) data preprocessing, feature engineering, and multi-label target construction, (iv) multi-label machine learning model development using a One-vs-Rest strategy, (v) model evaluation and statistical analysis within the development cohort, (vi) final evaluation on an untouched temporal-test cohort, and (vii) explainable artificial intelligence and patient-specific antibiotic recommendation support. The overall workflow is presented in Figure 1.
Figure 1.
Overall workflow of the proposed explainable multi-label framework for patient-specific antibiotic recommendation support. The study begins with 234 unique patients from a single-center dataset; 38 fungal records are excluded, leaving 196 bacterial/other records. Chronological partitioning produces 156 development and 40 untouched temporal-test patients, with 33 antibiotic labels selected using development data only. Leakage-controlled preprocessing is followed by five-fold OOF evaluation of XGBoost, Random Forest, and LightGBM using One-vs-Rest. Model comparison includes a local antibiogram baseline, bootstrap confidence intervals, paired statistical testing, and Random Forest feature ablation. Random Forest is then refitted on the 156 development patients and evaluated on the 40 temporal-test patients. SHAP analysis provides antibiotic-specific explanations, while the framework generates susceptibility probabilities and patient-specific Top-5 antibiotic rankings for decision support.
2.2. Sample Collection and Clinical Dataset Acquisition
A retrospective clinical microbiology dataset was collected from a single clinical center in Erbil, Kurdistan Region of Iraq. The original dataset comprised 234 records from 234 unique patients and contained demographic, sampling, microbiological, and antimicrobial susceptibility information, including Gender, Age, Sample Date, Strain, and Resistant, Intermediate, and sensitive results. The study population comprised 155 male patients (66.2%) and 79 female patients (33.8%). Patients were distributed across five age groups: <20, 20–39, 40–59, 60–79, and ≥80 years (Table 1).
Table 1.
Demographic characteristics of the clinical dataset.
Clinical specimens included urine, sputum, blood, wound swabs, Foley catheter urine, throat and other swab specimens, central venous line tips, tissue, bone, pus, abdominal pus, cerebrospinal fluid, chest-tube drainage, aspiration fluids, and other sterile body fluids. Specimen Type was retained as a predictive feature in the revised machine-learning framework to account for the heterogeneity of the clinical samples.
Each record corresponded to one unique patient and contained demographic information, specimen information, microorganism identification, and antimicrobial susceptibility results. Microorganism identification and AST were performed using the VITEK® 2 Compact automated identification and antimicrobial susceptibility testing system (bioMérieux S.A., Marcy l’Étoile, France). Ethical approval was obtained from the Scientific Research Ethics Committee of Erbil Polytechnic University (Approval No. 214/00218 HRE, 9 December 2025), and all study procedures were conducted in accordance with the Declaration of Helsinki.
The unequal distribution across age groups reflects the observed composition of the retrospective clinical cohort and was not imposed through sampling or artificial balancing; therefore, the age-group frequencies should be interpreted as descriptive characteristics of the study population rather than as predefined sampling proportions.
2.3. Culture of Clinical Specimens
All clinical specimens were examined and processed according to standard microbiological procedures. Depending on the specimen type, samples were inoculated onto appropriate culture media, including Blood Agar, MacConkey Agar, Chocolate Agar, Mannitol Salt Agar (MSA), Cysteine Lactose Electrolyte Deficient (CLED) Agar, Sabouraud Dextrose Agar (SDA), and other selective or differential media as required. Blood culture specimens were processed using an automated BACT/ALERT® blood culture system (bioMérieux S.A., Marcy l’Étoile, France) according to the manufacturer’s instructions. Following incubation, typically overnight at 37 °C, clinical isolates were initially identified based on colony characteristics, Gram-stain morphology, hemolysis on blood agar, and biochemical tests.
2.4. Identification and Antimicrobial Susceptibility Testing
The VITEK® 2 Compact system was used for the automated identification of bacterial and fungal isolates and for antimicrobial susceptibility testing. Several colonies from pure 18–24 h cultures were transferred using sterile loops into clear plastic test tubes containing 3 mL of 0.45% sterile saline solution (pH 4.5–7.0). Bacterial suspensions were adjusted to 0.5–0.63 McFarland using a DensiCHEK™ turbidity meter (bioMérieux S.A., Marcy l’Étoile, France), whereas yeast suspensions were adjusted to 1.96–2.25 McFarland.
Gram-negative bacteria were identified using VITEK® 2 GN cards, Gram-positive bacteria using VITEK® 2 GP cards, and yeast isolates using VITEK® 2 YST cards (bioMérieux S.A., Marcy l’Étoile, France), and yeast isolates using YST cards. For antimicrobial susceptibility testing, VITEK® 2 AST-GN417 and AST-GN419 cards were used for Gram-negative bacteria, AST-GP580 and AST-GP592 cards for Gram-positive bacteria, and AST-YS08 cards for yeast (bioMérieux S.A., Marcy l’Étoile, France). After inoculation, the cards and corresponding suspension tubes were loaded into the VITEK® 2 instrument, which automatically processed the isolates and generated the identification and antimicrobial susceptibility results [15,16].
The antimicrobial susceptibility results were interpreted according to the Clinical and Laboratory Standards Institute (CLSI) Performance Standards for Antimicrobial Susceptibility Testing (M100), 35th edition (2025). The resulting classifications were recorded as Resistant (R), Intermediate (I), or Sensitive/Susceptible (S) according to the applicable CLSI breakpoints. For the machine-learning analysis, only the recorded Sensitive/Susceptible results were used to define positive multi-label targets. Resistant and Intermediate results were not modeled as separate target classes; therefore, the prediction task focused on identifying antibiotics for which a Sensitive/Susceptible result was recorded.
2.5. Data Preprocessing and Leakage Control
Before model development, the clinical dataset underwent data-quality assessment and preprocessing to ensure consistency and compatibility with the machine-learning models. The audit confirmed 234 records from 234 unique patients, with no duplicate records identified in the analytical dataset. The records were classified according to organism type, comprising 196 bacterial/other records and 38 fungal records. Because the primary objective was antibacterial susceptibility prediction, the 38 fungal records were excluded from the primary analysis, leaving 196 patients for subsequent analysis.
The 196-patient cohort was ordered chronologically according to Sample Date and divided into 156 development patients and 40 temporal-test patients. The temporal-test cohort remained completely untouched during model development and was not used for preprocessing, fitting, antibiotic-label selection, model training, model comparison, feature ablation, or model selection.
To prevent information leakage, preprocessing was performed within each training fold of the five-fold out-of-fold (OOF) procedure. Numerical variables were imputed, where necessary, using medians calculated from the training subset only, while categorical variables were imputed using the training-fold mode and encoded using one-hot encoding fitted on the training subset. The resulting preprocessing transformations were then applied unchanged to the corresponding validation fold without refitting. For the final temporal-test evaluation, all preprocessing parameters were estimated using the complete 156-patient development cohort and then applied unchanged to the 40 temporal-test patients. No standardization or z-score scaling was applied.
This fold-specific preprocessing strategy ensured that information from validation and temporal-test observations could not influence the transformations used for model training or evaluation [17].
2.6. Feature Engineering
The original demographic and microbiological variables were converted into a structured representation suitable for machine learning. Age was represented numerically in years, while Gender was retained as a categorical variable. The microorganism information was represented as Organism, and the source of the clinical specimen was represented separately as Specimen Type. Sample Date was converted into a standardized date representation, from which Month and Year were extracted.
The final predictive feature set consisted of Age, Gender, Organism, Specimen Type, Month, and Year, as summarized in Table 2. These variables represent demographic, microbiological, specimen-related, and temporal characteristics of each patient record.
Table 2.
Predictive features used in the machine-learning framework.
For patient , the resulting feature vector was defined as
No antimicrobial susceptibility result was included among the predictor variables.
2.7. Multi-Label Representation of Antibiotic Susceptibility
The susceptibility prediction task was formulated as a multi-label classification problem because a single patient isolate may be susceptible to several antibiotics simultaneously. This representation allows multiple antibiotic labels to be assigned to the same patient rather than forcing each observation into a single class [18,19].
For patient , the susceptibility target vector was defined as
where denotes the total number of antibiotic labels included in the final analysis, and
The susceptible antibiotic lists were converted into binary multi-label vectors using the MultiLabelBinarizer procedure. Initially, 45 candidate antibiotic labels were identified from the dataset. To prevent information from the temporal-test cohort from influencing the definition of the prediction task, antibiotic-label selection was performed using the 156-patient development cohort only. This procedure resulted in 33 antibiotic labels being retained for the final analysis.
The resulting target matrices were therefore:
for the development cohort and
for the temporal-test cohort.
The Resistant (R) and Intermediate (I) fields were not encoded as separate target labels. Consequently, a value of zero indicates that a Sensitive/Susceptible label was not recorded for the corresponding antibiotic and should not automatically be interpreted as laboratory-confirmed resistance. This binary multi-label representation provides the basis for simultaneously estimating susceptibility probabilities for multiple antibiotics and generating patient-specific ranked antibiotic recommendations.
2.8. Proposed Explainable Multi-Label Machine Learning Framework
Three ensemble-based machine learning algorithms were evaluated within the proposed multi-label framework: XGBoost, Random Forest, and LightGBM [20,21,22]. Because each patient may have susceptibility labels for multiple antibiotics, all three models were implemented using a One-vs-Rest (OvR) strategy. Under this approach, an independent binary classifier was fitted for each of the 33 antibiotic labels.
For patient and antibiotic , the corresponding classifier estimates the probability of a Sensitive/Susceptible result as
where represents the feature vector of the patient , and denotes the predicted probability that the patient’s isolate will be recorded as Sensitive/Susceptible to the antibiotic .
Accordingly, the model produces a 33-dimensional probability vector for each patient:
These predicted probabilities were used for quantitative model evaluation and for ranking antibiotics according to their estimated susceptibility probability. The resulting rankings form the basis of the patient-specific antibiotic recommendation-support component described in Section 2.12.
The three candidate models were compared using the same development-cohort OOF validation procedure. Following model comparison, the best-performing model was selected according to the predefined evaluation criteria and subsequently refitted using the complete development cohort before evaluation on the untouched temporal-test cohort.
2.9. Model Validation and Performance Evaluation
2.9.1. Five-Fold Out-of-Fold Validation
Model development and internal validation were performed exclusively on the 156-patient development cohort using five-fold out-of-fold (OOF) validation. In each iteration, four folds were used for training and the remaining fold for validation, ensuring that every patient was used once for validation. The five validation predictions were combined to obtain OOF predictions for all development patients. All preprocessing and model fitting were performed using the corresponding training folds only. The 40 temporal-test patients were excluded from all development-stage analyses, including model comparison, feature ablation, and model selection, and were reserved for final temporal evaluation.
2.9.2. Classification and Ranking Metrics
Model performance was evaluated using Micro-F1, Macro-F1, AUROC, AUPRC, Precision@1, Precision@3, Precision@5, Recall@1, Recall@3, and Recall@5. These metrics were selected to provide complementary information on overall multi-label classification performance, antibiotic-specific discrimination, and the quality of the ranked susceptibility outputs [18,19,23,24].
Micro-F1 summarizes performance across all antibiotic labels by aggregating true positives, false positives, and false negatives before calculating the F1-score:
Macro-F1 calculates the F1-score separately for each antibiotic and then averages the results, giving equal weight to all modeled antibiotics:
where represents the total number of modeled antibiotic labels.
AUROC was used to measure the ability of each antibiotic-specific classifier to distinguish between patients with and without a recorded Sensitive/Susceptible outcome across different probability thresholds. The true-positive rate (TPR) and false-positive rate (FPR) were calculated as
AUROC represents the area under the resulting receiver operating characteristic curve:
Higher AUROC values indicate better discrimination between positive and negative susceptibility outcomes.
AUPRC was used as a complementary discrimination measure by summarizing the relationship between precision and recall across probability thresholds. Precision and recall were calculated as
and the area under the precision–recall curve was defined as
AUPRC is particularly useful for assessing performance when susceptibility labels have unequal frequencies across antibiotics.
For patient-specific recommendation ranking, antibiotics were ordered according to their predicted Sensitive/Susceptible probabilities. Precision@ measured the proportion of the highest-ranked antibiotics that corresponded to antibiotics recorded as Sensitive/Susceptible for the patient:
where is the number of evaluated patients, is the patient’s highest-ranked antibiotics, and is the set of antibiotics recorded as Sensitive/Susceptible for the patient .
Recall@ measured the proportion of the patient’s recorded Sensitive/Susceptible antibiotics recovered within the Top- ranking:
Considering patients with at least one recorded Sensitive/Susceptible antibiotic.
Because the proposed framework generates a Top-5 antibiotic ranking, Precision@5 and Recall@5 were treated as the principal ranking measures. Precision@1, Precision@3, Recall@1, and Recall@3 were additionally reported to assess the performance of shorter ranked antibiotic lists.
In addition to the aggregate multi-label metrics, antibiotic-specific performance was evaluated separately for each modeled antibiotic using AUROC, AUPRC, precision, recall, and F1-score, where both outcome classes were present in the corresponding validation data.
Accuracy was not used as a primary evaluation measure because the task is a multi-label classification problem with unequal antibiotic-label frequencies and substantial class imbalance. In this setting, aggregate accuracy can be dominated by the majority negative decisions across labels and may therefore provide a less informative assessment of susceptibility prediction and ranking quality. Micro-F1, Macro-F1, AUROC, AUPRC, and Precision@K/Recall@K were therefore prioritized to capture overall classification performance, label-balanced performance, discrimination, and patient-level ranking quality.
2.10. Statistical Analysis
Uncertainty in model performance was estimated using 2000 patient-level bootstrap resamples of the development-cohort OOF predictions. For each bootstrap resample, patients were sampled with replacement, and the corresponding performance metrics were recalculated. The 2.5th and 97.5th percentiles of the bootstrap distributions were used to obtain 95% confidence intervals (CIs) [25].
Pairwise comparisons between models were performed using paired patient-level bootstrap resampling, preserving the correspondence between predictions for the same patients. The primary comparison used Precision@5, reflecting the Top-5 antibiotic ranking generated by the framework. For two models and , the paired performance difference was calculated as
where and represent the corresponding performance measures of models and , respectively.
Two-sided bootstrap comparisons produced raw p-values, and the Holm correction was applied to adjust for multiple pairwise comparisons among the evaluated models. Statistical evidence for a difference was assessed using the adjusted p-values together with the corresponding 95% bootstrap CIs.
This patient-level bootstrap procedure avoids treating the five OOF folds as independent clinical samples and provides uncertainty estimates and paired comparisons at the patient level.
2.11. SHAP-Based Model Explainability
To improve model transparency and facilitate interpretation of the predicted susceptibility patterns, SHapley Additive exPlanations (SHAPs) were used to investigate the contribution of individual input features to the predictions of the final Random Forest model [26]. SHAP provides feature-attribution values that indicate how individual predictors contribute to a model output and can be used to obtain both global and patient-level explanations.
Because the final model uses a One-vs-Rest (OvR) architecture, SHAP analysis was performed at the antibiotic-specific classifier level. Thus, the contribution of the input features was examined separately for the individual antibiotic susceptibility predictions rather than treating the complete multi-label model as a single output.
For a model prediction, the SHAP decomposition was expressed as
where represents the model output for a given patient and antibiotic classifier, is the baseline model output, represents the contribution of feature , and denotes the total number of input features.
The SHAP analysis provided two complementary levels of interpretation. Global explanations were used to summarize the overall contribution of the available predictors across observations, whereas local explanations were used to examine how individual features contributed to the prediction for a specific patient and antibiotic classifier.
This analysis was used to improve the transparency of the patient-specific susceptibility predictions and to identify the features most strongly associated with the model’s predicted outputs [26].
2.12. Patient-Specific Antibiotic Recommendation Support
For each patient, the final model generated a predicted susceptibility probability for each of the 33 modeled antibiotics:
The antibiotics were ranked in descending order according to their predicted susceptibility probabilities, and the five highest-ranked antibiotics were retained as the patient’s Top-5 susceptibility ranking.
The reported values represent predicted susceptibility probabilities, not confidence scores or probabilities of clinical treatment success. Accordingly, patient-specific antibiotic recommendation support refers only to the ranked susceptibility information generated by the framework and does not imply autonomous antibiotic prescribing. The ranked outputs are intended to support interpretation of susceptibility patterns and must not replace laboratory antimicrobial susceptibility testing (AST), antimicrobial stewardship principles, or clinical judgment.
The available dataset did not contain several clinical variables relevant to antibiotic selection, including infection site and severity, allergy history, renal and hepatic function, drug interactions, contraindications, previous antimicrobial exposure, dosing requirements, and drug availability. Therefore, the ranked outputs require confirmation against laboratory AST and consideration of relevant clinical factors before any treatment decision.
No clinical probability threshold was imposed to exclude a candidate antibiotic from the ranked Top-5 output because an evidence-based threshold could not be established from the available dataset. Instead, a sensitivity audit evaluated the number of ranked candidates exceeding probability levels of 0.20, 0.30, 0.50, and 0.70 using development-cohort OOF predictions. These thresholds were used only for transparent auditing and were not used for model selection or applied to the temporal-test cohort. Thus, the predicted probabilities should be interpreted as model-derived susceptibility estimates rather than measures of clinical treatment suitability.
2.13. Local Antibiogram Baseline
A local antibiogram baseline was included to determine whether the patient-specific machine-learning models provided additional ranking information beyond a conventional population-level susceptibility profile. For each OOF training fold, the susceptibility prevalence of antibiotic was calculated using the training patients only:
where denotes the patients in the corresponding training fold and indicates whether antibiotic was recorded as Sensitive/Susceptible for patient .
The resulting prevalence values were used to rank antibiotics for patients in the corresponding validation fold. Because the antibiogram does not use patient-specific predictors, patients within the same validation fold received the same population-level ranking.
The baseline was evaluated using AUROC, AUPRC, Precision@1, Precision@3, Precision@5, Recall@1, Recall@3, and Recall@5. Threshold-dependent Micro-F1 and Macro-F1 were not applicable because the antibiogram provides population-level rankings rather than patient-specific binary predictions. The implementation explicitly treated these F1 measures as unavailable for this baseline.
2.14. Feature Ablation Methodology
Feature ablation was performed using the Random Forest model to assess the incremental contribution of the available predictors. Feature ablation was performed using the Random Forest model to assess the incremental contribution of the available predictors (Table 3).
Table 3.
Five feature configurations were evaluated.
Each configuration was evaluated using the same five-fold OOF procedure, leakage-controlled preprocessing, Random Forest configuration, and evaluation metrics. The ablation analysis was used to assess the contribution of demographic, specimen-related, and temporal information beyond microorganism identity. The full six-feature representation was retained for the primary model. These five configurations are directly supported by the implementation.
2.15. Temporal-Test Evaluation
Following development-cohort model comparison, Random Forest was selected as the final recommendation model.
The selected model was refitted using all 156 development patients and evaluated once on the 40 temporal-test patients. The temporal-test cohort was not used for antibiotic-label selection, preprocessing fitting, model training, model comparison, feature ablation, or model selection.
The final temporal evaluation used Micro-F1, Macro-F1, Micro-Precision, Micro-Recall, AUROC, AUPRC, Precision@1, Precision@3, Precision@5, Recall@1, Recall@3, and Recall@5. The resulting performance therefore represents an out-of-time evaluation of the selected model rather than another internal cross-validation estimate.
2.16. Model Training and Hyperparameter Configuration
XGBoost, Random Forest, and LightGBM were trained using the One-vs-Rest strategy within the five-fold OOF development procedure. Preprocessing and model fitting were restricted to the corresponding training folds.
The final recommendation model was a Random Forest, configured with 300 trees, a maximum tree depth of 10, and balanced class-subsample weighting. Model selection was performed using the development-cohort OOF results, after which the selected Random Forest model was refitted to all 156 development patients before the final temporal-test evaluation.
No information from the temporal-test cohort was used for model selection or parameter estimation. No systematic hyperparameter search or nested cross-validation was performed. The models were evaluated using fixed, prespecified configurations, with all model fitting conducted within the corresponding training folds.
All machine-learning and statistical analyses were implemented in Python 3.12. Data preprocessing, MultiLabelBi-narizer, One-vs-Rest classification, Random Forest modeling, and performance evaluation were implemented using scikit-learn (version 1.9.1). XGBoost (version 3.4.1) and LightGBM (version 4.7.0) were used for the corresponding machine-learning models, while SHAP (version 0.52.0) was used for model explainability and feature-attribution analysis.
3. Results
3.1. Dataset Characteristics
The study dataset comprised 234 records from 234 unique patients. The data-quality assessment identified no duplicate records. The records included demographic information together with specimen collection dates, microorganism identification, and antimicrobial susceptibility results. The organism-type assessment identified 196 bacterial/other records and 38 fungal records. Because the primary objective was antibacterial susceptibility prediction, the fungal records were excluded from the subsequent modeling analysis.
The 196 retained records were ordered chronologically according to the sample date. The earliest 156 patients constituted the development cohort, whereas the most recent 40 patients were reserved as an untouched temporal-test cohort. Following development-only antibiotic-label selection, 33 antibiotic labels were retained from the initial set of 45 candidate labels. The resulting target matrices contained 33 antibiotic columns, giving dimensions of for the development cohort and for temporal testing. The principal dataset and analytical cohort characteristics are summarized in Table 4.
Table 4.
Characteristics of the study dataset and analytical cohorts.
The chronological partition established a clear separation between model development and evaluation on later observations. The temporal-test cohort was not used during preprocessing, antibiotic-label selection, model comparison, feature ablation, or model selection.
3.2. Distribution of Microorganisms
The 234-record cohort showed substantial heterogeneity in microorganism composition (Table 5; Figure 2). Klebsiella pneumoniae was the most frequently represented organism, accounting for 29.06% (68/234) of the records, followed by Escherichia coli (14.53%, 34/234) and Acinetobacter baumannii (12.82%, 30/234). Among fungal organisms, Candida albicans was the most frequently recorded species (7.69%, 18/234), followed by Candida spp. (3.42%, 8/234). Pseudomonas aeruginosa accounted for 5.98% (14/234), while Staphylococcus aureus and MRSA each accounted for 3.85% (9/234).
Table 5.
Distribution of microorganisms and no-growth records in the original 234-record cohort.
Figure 2.
Distribution of microorganisms in the original 234-record clinical cohort. The horizontal bar chart presents the frequency of each identified microorganism, with the corresponding number and percentage of records shown at the end of each bar. The cohort was dominated by Klebsiella pneumoniae (68, 29.06%), Escherichia coli (34, 14.53%), and Acinetobacter baumannii (30, 12.82%), while the remaining microorganisms occurred at lower frequencies; fungal organisms and records with no bacterial pathogen isolated/no growth are distinguished separately.
The remaining organisms occurred at substantially lower frequencies, with most represented by two or fewer records. This heterogeneous distribution is relevant to the susceptibility-prediction task because the multi-label outcomes reflect the antimicrobial susceptibility profiles associated with individual microorganisms. More frequently represented organisms consequently contribute more observations to the overall susceptibility patterns, whereas estimates for rarely observed organisms are based on fewer records.
The observed distribution also supports the inclusion of Organism as a core predictive feature. However, microorganism frequency alone does not establish a causal relationship with antimicrobial resistance. Rather, it describes the composition of the study population and provides context for interpreting the subsequent organism-dependent susceptibility predictions.
3.3. Five-Fold Out-of-Fold Model Performance
Five-fold out-of-fold (OOF) validation was performed within the 156-patient development cohort to compare XGBoost, Random Forest, and LightGBM under the same multi-label prediction framework. Each model was evaluated using the OOF predictions generated across the five validation folds, and the resulting performance measures are summarized in Table 6 and Figure 3. The implementation completed all five folds for each of the three models.
Table 6.
Five-fold out-of-fold performance of the evaluated models.
Figure 3.
Five-fold out-of-fold (OOF) performance comparison of the evaluated models. The figure presents (A) Micro-F1, (B) Macro-F1, (C) AUROC, (D) AUPRC, and (E) Precision@5. Random Forest achieved the highest values among the three machine-learning models across all five measures, while the local antibiogram provided a population-level reference for the ranking-based measures.
Among the three machine-learning models, Random Forest achieved the strongest overall OOF performance. It obtained the highest Micro-F1 (0.4204), Macro-F1 (0.3003), AUROC (0.7069), and AUPRC (0.3979). It also produced the highest-ranking performance, with Precision@1, Precision@3, and Precision@5 of 0.5769, 0.4466, and 0.3962, respectively, and Recall@1, Recall@3, and Recall@5 of 0.2433, 0.4410, and 0.5881.
XGBoost showed the second-highest overall performance for most measures, with a Micro-F1 of 0.4011, Macro-F1 of 0.2778, AUROC of 0.6538, and AUPRC of 0.3149. Its Precision@5 and Recall@5 were 0.3564 and 0.5429, respectively. LightGBM produced lower values across the principal measures, with a Micro-F1 of 0.2841, Macro-F1 of 0.1933, AUROC of 0.6046, and AUPRC of 0.2515. Its Precision@5 and Recall@5 were 0.3179 and 0.4869, respectively.
The ranking measures further showed that Random Forest achieved the highest Precision@1, Precision@3, and Precision@5, as well as the highest Recall@1, Recall@3, and Recall@5 among the three machine-learning models. This indicates that its predicted susceptibility probabilities provided the strongest Top-K ranking performance within the development cohort.
For comparison, the local antibiogram was evaluated separately as a leakage-safe population-level ranking baseline. It achieved an AUROC of 0.3563, AUPRC of 0.1118, Precision@1 of 0.4679, Precision@3 of 0.3440, Precision@5 of 0.3077, Recall@1 of 0.1454, Recall@3 of 0.3192, and Recall@5 of 0.4485. Micro-F1 and Macro-F1 were not calculated for this baseline because they provide population-level rankings rather than threshold-dependent binary predictions.
The model-comparison plots in Figure 3 provide a visual representation of these results across Micro-F1, Macro-F1, AUROC, AUPRC, and Precision@5. The Local Antibiogram is included only in the panels for which its ranking-based evaluation is defined; it is not assigned artificial Micro-F1 or Macro-F1 values.
Bootstrap uncertainty analysis further supported the observed performance differences. Based on 2000 patient-level bootstrap resamples of the OOF predictions, Random Forest achieved a Micro-F1 of 0.4200 (95% CI: 0.3636–0.4766), a Macro-F1 of 0.2920 (95% CI: 0.2240–0.3538), and Precision@5 of 0.3964 (95% CI: 0.3474–0.4474). The corresponding estimates for XGBoost were 0.4000 (95% CI: 0.3414–0.4609), 0.2698 (95% CI: 0.2025–0.3438), and 0.3564 (95% CI: 0.3102–0.4051), respectively. LightGBM achieved 0.2836 (95% CI: 0.2340–0.3382), 0.1876 (95% CI: 0.1353–0.2445), and 0.3184 (95% CI: 0.2756–0.3641), respectively. The local antibiogram achieved a Precision@5 of 0.3082 (95% CI: 0.2679–0.3474). These bootstrap intervals provide uncertainty estimates around the principal OOF performance measures and complement the paired Precision@5 comparisons reported in Section 3.4. The corresponding bootstrap confidence intervals are summarized in Table 7.
Table 7.
Bootstrap 95% confidence intervals for principal out-of-fold performance measures.
3.4. Statistical Comparison of Model Performance
To assess whether differences in recommendation performance were statistically meaningful, paired patient-level bootstrap comparisons were performed using 2000 bootstrap resamples of the OOF predictions. Because the final recommendation output consists of five ranked antibiotics, Precision@5 was used as the primary metric for pairwise comparison. The resulting p-values were adjusted using the Holm correction for multiple comparisons.
As shown in Table 8, Random Forest significantly outperformed XGBoost in Precision@5, with a mean difference of 0.0400 in favor of Random Forest (95% CI: 0.0141–0.0667; raw p = 0.003, Holm-adjusted p = 0.006). Random Forest also significantly outperformed LightGBM (mean difference = 0.0780, 95% CI: 0.0487–0.1103; adjusted p < 0.001) and the local antibiogram baseline (mean difference = 0.0882, 95% CI: 0.0564–0.1205; adjusted p < 0.001).
Table 8.
Paired patient-level bootstrap comparisons of Precision@5.
XGBoost also significantly outperformed LightGBM (mean difference = 0.0380, 95% CI: 0.0141–0.0628; adjusted p = 0.004) and the local antibiogram (mean difference = 0.0482, 95% CI: 0.0141–0.0833; adjusted p = 0.006). In contrast, the difference between LightGBM and the local antibiogram was not statistically significant (mean difference = 0.0102, 95% CI: −0.0244–0.0449; adjusted p = 0.586).
These results provide additional statistical support for selecting Random Forest as the final recommendation model. Importantly, the analysis was performed at the patient level using paired bootstrap resampling rather than treating the five cross-validation folds as independent clinical observations.
3.5. Feature Ablation Analysis
As shown in Table 9 and Figure 4, feature ablation was performed using Random Forest with five progressively expanded feature configurations. The results showed that Organism + Age achieved the highest Micro-F1 (0.4635) and AUROC (0.7186), while adding Gender and Specimen Type produced the best AUPRC (0.4000), Precision@5 (0.4000), and Recall@5 (0.5966). The full six-feature representation was retained for the primary analysis because the ablation experiment was designed to assess the contribution of individual feature groups rather than to replace the prespecified primary feature representation through post hoc feature selection.
Table 9.
Random Forest feature ablation results.
Figure 4.
Random Forest feature-ablation performance across five feature configurations, showing the effect of progressively adding Age, Gender, Specimen Type, Month, and Year to the Organism-based representation using Micro-F1, Macro-F1, AUROC, AUPRC, Precision@5, and Recall@5.
The ablation therefore indicates that Age contributed to overall predictive performance, whereas the addition of Gender and Specimen Type improved several ranking-oriented measures. The temporal variables Month and Year did not further improve the full configuration. Because the study period covered only approximately 13 months, Month and Year were included as available temporal predictors but were not interpreted as evidence of long-term antimicrobial-resistance trends.
3.6. Temporal-Test Performance
After completion of the five-fold OOF model comparison, Random Forest was selected as the final model and refitted using the complete 156-patient development cohort. It was then evaluated once on the independent 40-patient temporal-test cohort, which was defined chronologically at the patient-record level as the later records in the dataset and remained completely untouched throughout model development and model selection. The final temporal-test results are presented in Table 10.
Table 10.
Random Forest performance on the independent temporal-test cohort.
On the temporal-test cohort, Random Forest achieved a Micro-F1 of 0.4267, Macro-F1 of 0.2249, AUROC of 0.7447, and AUPRC of 0.4892. For recommendation ranking, Precision@1, Precision@3, and Precision@5 were 0.6250, 0.5000, and 0.4350, respectively, while Recall@1, Recall@3, and Recall@5 were 0.1873, 0.3292, and 0.4410.
The temporal evaluation provides an out-of-time assessment of the selected model using patients that were not involved in preprocessing, fitting, model training, model comparison, or feature selection. The results therefore provide a more stringent assessment of model generalization than the internal OOF estimates. The implementation also confirms that the development and temporal-test target matrices contained 156 × 33 and 40 × 33 observations, respectively.
3.7. Antibiotic-Specific Performance
To complement the aggregate multi-label results, the selected Random Forest model was evaluated separately for each of the 33 modeled antibiotics using development-cohort out-of-fold (OOF) predictions. Performance varied substantially across antibiotic labels. The highest F1-scores were observed for Tigecycline (0.6517), Gentamicin (0.6364), Fosfomycin (0.6000), and Amikacin (0.5783), whereas several less frequent labels produced an F1-score of zero.
The strongest discrimination was observed for Fusidic Acid (AUROC = 0.9063), followed by Clindamycin (0.8852), Tigecycline (0.8764), and Rifampicin (0.8739). AUPRC was highest for Tigecycline (0.7517), Fusidic Acid (0.7442), Fosfomycin (0.7071), and Gentamicin (0.6824).
For each antibiotic, positive susceptibility prevalence was calculated from the 156-patient development cohort as follows:
where Positive N denotes the number of development-cohort patients with a recorded Sensitive/Susceptible result for the corresponding antibiotic. Thus, the reported prevalence reflects the proportion of development-cohort patients with a positive susceptibility label for each antibiotic. Antibiotic-specific performance was calculated from development-cohort OOF predictions.
These results demonstrate substantial heterogeneity in predictive performance across antibiotic labels. Labels with greater positive susceptibility support generally provided more stable performance, whereas several less frequent labels showed limited predictive performance, including F1-scores of zero. The complete antibiotic-specific results, including positive counts, positive prevalence, and performance measures, are presented in Table 11, with the variation in F1-score illustrated in Figure 5.
Table 11.
Antibiotic-specific performance of the Random Forest model.
Figure 5.
Per-antibiotic F1-scores obtained by the Random Forest model across the 33 modeled antibiotic susceptibility labels. The results demonstrate substantial variation in predictive performance across antibiotics, with the highest F1-scores observed for Tigecycline (0.652), Gentamicin (0.636), Fosfomycin (0.600), and Amikacin (0.578), while several lower-frequency antibiotic labels achieved an F1-score of 0.000.
3.8. SHAP-Based Explainability
SHAP analysis was applied to the selected Random Forest model to quantify the contribution of the available input features to antibiotic susceptibility predictions. Because the prediction task was formulated using a One-vs-Rest (OvR) structure, SHAPs were generated separately for each antibiotic-specific classifier. The SHAP completion audit confirmed successful analysis for all 33 modeled antibiotics (33/33; 100%).
The global analysis showed that Age_years had the largest mean absolute SHAP value (0.074971), followed by Month (0.043720), Klebsiella pneumoniae (0.042860), Escherichia coli (0.031589), and Acinetobacter baumannii (0.029380). Other influential encoded predictors included sputum and MRSA specimen categories, Staphylococcus aureus, gender, Pseudomonas aeruginosa, and urine specimen type. These findings indicate that the model predictions were influenced by a combination of demographic, temporal, organism-related, and specimen-related information.
The antibiotic-specific SHAP results were retained in Supplementary Table S1 (SHAP_per_antibiotic.csv), allowing the feature contributions to be examined separately for each of the 33 antibiotic classifiers. This documents the application of SHAP within the OvR multi-label framework rather than treating the complete prediction task as a single output. The global feature-importance results are summarized in Table 12 and visualized in Figure 6. Importantly, SHAP values represent feature contributions to model predictions and not causal clinical effects. Therefore, the identified features should be interpreted as factors influencing model behavior rather than as independent determinants of antibiotic susceptibility.
Table 12.
Global SHAP feature importance of the selected Random Forest model.
Figure 6.
Global SHAP feature-importance plot showing the contribution of the input features to the Random Forest antibiotic susceptibility predictions. Features are ranked by mean absolute SHAP value; Age_years and Month show the largest overall contributions, followed by organism- and specimen-related features. The plot presents the 15 most influential encoded features from the complete global SHAP analysis.
3.9. Patient-Specific Antibiotic Recommendation Based on Top-5 Susceptibility Rankings
The selected Random Forest model generated patient-specific susceptibility rankings by estimating a predicted susceptibility probability for each of the 33 final antibiotic labels and ordering the antibiotics from highest to lowest probability. The five highest-ranked antibiotics were retained as the patient-specific Top-5 output.
Representative OOF rankings are presented in Table 13. The results demonstrate substantial variation between patients. For example, Gentamicin was ranked first for DEV_P1 with a predicted susceptibility probability of 0.7771, whereas Fosfomycin was ranked first for DEV_P3 (0.5295) and DEV_P6 (0.8709). DEV_P7 received Ceftazidime/Avibactam as its highest-ranked option (0.8216), while DEV_P9 was ranked highest for Minocycline (0.6522).
Table 13.
Representative patient-specific Top-5 susceptibility rankings from out-of-fold predictions.
The corresponding OOF patient–antibiotic heatmap (Figure 7) provides a broader view of these patient-level differences across the modeled antibiotics. Each row represents a patient, and each column represents an antibiotic, with the intensity indicating the predicted probability of susceptibility.
Figure 7.
Patient–antibiotic heatmap showing OOF predicted susceptibility probabilities for the 33 modeled antibiotics. Each row represents a patient, and each column represents an antibiotic; color intensity indicates the predicted susceptibility probability, with higher intensities corresponding to higher predicted probabilities. The heatmap illustrates patient-level variation in susceptibility profiles used to generate the Top-5 rankings.
These results demonstrate that the framework can produce individualized antibiotic rankings rather than a single population-level recommendation. The rankings are intended as decision-support outputs and should be interpreted together with laboratory AST results, clinical characteristics, and antimicrobial stewardship considerations; they are not autonomous prescribing recommendations.
3.10. Probability Calibration
The predicted susceptibility probabilities generated by the selected Random Forest model were visually assessed for calibration using the out-of-fold predictions from the development cohort. This analysis provides a visual assessment of the agreement between predicted probabilities and observed susceptibility outcomes; it does not constitute formal clinical validation of probability calibration. The calibration analysis complements the ranking results presented in Section 3.9 by providing an additional assessment of the reliability of the predicted probabilities used for patient-specific ranking. The corresponding OOF calibration results are presented in Figure 8.
Figure 8.
Out-of-fold calibration plot for the selected Random Forest model, comparing predicted susceptibility probabilities with observed susceptibility outcomes. The plot assesses the reliability of the probabilities used for patient-specific antibiotic ranking.
3.11. Population-Level Antibiotic Ranking
Beyond patient-specific recommendations, the selected Random Forest model was used to summarize antibiotic rankings at the population level. Antibiotics were ranked according to their aggregated predicted susceptibility probabilities, providing an overall view of the antibiotics with higher predicted susceptibility across the evaluated patients. This analysis complements the patient-specific Top-5 rankings presented in Section 3.9. The resulting population-level ranking is presented in Figure 9.
Figure 9.
Population-level ranking of antibiotics based on mean out-of-fold (OOF) predicted susceptibility probabilities from the selected Random Forest model. Antibiotics are ordered from highest to lowest mean predicted susceptibility, with Gentamicin showing the highest population-level predicted susceptibility, followed by Amikacin, Meropenem, and Tigecycline.
3.12. Clinical Decision-Support Interpretation
The results demonstrate that the proposed framework can provide patient-specific susceptibility rankings and offer interpretable information about the factors influencing model predictions. The Random Forest outputs should therefore be regarded as clinical decision-support information rather than autonomous antibiotic prescribing recommendations.
The predicted susceptibility probabilities and Top-5 rankings can complement conventional antimicrobial susceptibility testing (AST), local resistance patterns, and patient-specific clinical assessment. In particular, the population-level ranking in Section 3.11 provides an aggregate view of predicted susceptibility, whereas the patient-specific rankings in Section 3.9 account for differences between individual patients.
Importantly, a higher predicted susceptibility probability does not by itself establish that an antibiotic is clinically appropriate for treatment. Final antibiotic selection should remain subject to microbiological evidence, clinical characteristics, antimicrobial stewardship principles, and clinician judgment. This interpretation maintains the intended role of the framework as an explainable decision-support tool rather than a replacement for clinical decision-making.
4. Discussion
The present study developed an explainable multi-label machine learning framework for patient-specific antibiotic recommendation using clinical microbiology data. The revised analysis strengthens the original framework by combining leakage-controlled evaluation, temporal testing, One-vs-Rest modeling of 33 antibiotic labels, model comparison, feature ablation, SHAP-based explainability, and probability-based patient-specific ranking. These components provide a more comprehensive assessment of the feasibility of using machine learning to support antibiotic susceptibility-based decision-making.
The microbial profile was dominated by Klebsiella pneumoniae, Escherichia coli, and Acinetobacter baumannii. This pattern is consistent with previous reports identifying these organisms as important contributors to healthcare-associated infections and antimicrobial resistance (AMR) [6,27]. The prominence of K. pneumoniae is particularly relevant because of its association with extended-spectrum β-lactamase and carbapenem-resistant strains, which can substantially restrict therapeutic options [28,29]. Likewise, E. coli and A. baumannii are important causes of urinary, bloodstream, and respiratory infections and have considerable capacity to acquire multidrug resistance [6,30].
Although fungal isolates were excluded from the primary bacterial susceptibility prediction analysis, Candida albicans was the predominant fungal species in the original cohort, followed by other Candida spp., consistent with previous reports identifying C. albicans as a leading cause of invasive candidiasis despite the increasing emergence of non-albicans Candida species with reduced antifungal susceptibility [31]. Other clinically important organisms, including Pseudomonas aeruginosa, Staphylococcus aureus, methicillin-resistant S. aureus (MRSA), and Staphylococcus epidermidis, were also present in the original microbiological profile [5,32]. These findings reinforce the importance of incorporating organism information into antimicrobial susceptibility prediction.
Random Forest was selected as the final model based on its overall performance across the evaluated measures. The use of multiple complementary metrics is important because the objective of the framework extends beyond independent binary classification to ranking potentially susceptible antibiotics for each patient. The revised analysis therefore considers both classification and ranking performance rather than relying on a single metric. Previous antimicrobial susceptibility studies have also reported competitive performance from ensemble tree-based approaches, supporting their continued investigation for AMR prediction [3,33].
The feature-ablation results further indicate that organism-related information provides substantial predictive information, while demographic, specimen-related, and temporal variables contribute additional information across different evaluation measures. This supports the use of a broader feature set rather than relying exclusively on organism identity. Nevertheless, these predictive contributions should not be interpreted as causal determinants of antimicrobial susceptibility.
SHAP analysis provided an additional perspective on model behavior. Across the 33 antibiotic-specific classifiers, Age_years showed the largest global mean absolute SHAP value, followed by Month and several organism-related features, including K. pneumoniae, E. coli, and A. baumannii. Specimen-related and demographic variables also contributed to predictions. This suggests that the model uses multiple sources of information when estimating susceptibility rather than depending on a single predictor. Explainability is particularly relevant to healthcare AI because transparent model behavior can facilitate clinical interpretation and support more trustworthy use of predictive systems [26,34]. Previous studies have likewise identified organism-related information as an important predictor of antimicrobial resistance [3,35]. However, SHAP values represent contributions to model predictions and should not be interpreted as causal clinical effects.
An important feature of the framework is its probability-based multi-label recommendation strategy. The OvR models estimate susceptibility probabilities for the 33 antibiotic labels, which are then ranked to generate patient-specific Top-5 outputs. This approach recognizes that more than one antibiotic may have relatively high predicted susceptibility for a patient and provides several candidate options rather than forcing a single binary decision. Similar recommendation-oriented approaches have been explored as a means of supporting individualized antimicrobial selection and stewardship [2,4,36,37,38]. In the present study, however, the rankings are interpreted as susceptibility-based decision support rather than autonomous treatment recommendations.
The population-level ranking provides a complementary view of the patient-specific results by summarizing predicted susceptibility across the study population. Such information may complement local antibiograms and provide additional data for antimicrobial stewardship activities [6,27]. Nevertheless, the population ranking is specific to the investigated cohort and should not be interpreted as a universal prescribing hierarchy. Its value lies in providing an aggregate description of the model’s predicted susceptibility patterns that can be considered alongside microbiological surveillance and established stewardship practices.
The revised validation strategy also strengthens the interpretation of the findings. The analysis used an untouched chronological temporal-test cohort in addition to out-of-fold development evaluation, reducing the risk that performance estimates were driven solely by randomly partitioned observations. The temporal results showed that the selected model retained measurable discrimination and ranking performance on the later held-out cohort; however, the small size of this cohort limits the precision and generalizability of these estimates, while the lower Macro-F1 observed for the temporal cohort also indicates that performance remains more challenging for less frequent antibiotic labels. Thus, the temporal evaluation provides encouraging evidence of generalization but does not substitute for independent external validation.
Taken together, the framework integrates multi-label susceptibility prediction, model comparison, feature ablation, SHAP explainability, patient-specific Top-5 ranking, and population-level analysis within a unified workflow. Previous research has demonstrated the potential of machine learning for antimicrobial susceptibility prediction [3,33]. Recent work has emphasized the importance of explainability, validation, and integration with antimicrobial stewardship for clinical adoption [34,37,39,40,41]. The present study extends this direction by combining susceptibility prediction with interpretable ranking-oriented decision support while maintaining a clear distinction between model output and clinical treatment decisions.
Despite these strengths, several limitations should be acknowledged. First, the relatively small, single-centre dataset may limit the generalizability of the findings to other hospitals and geographical settings; therefore, the temporal-test evaluation does not replace independent external validation. Second, the available predictors were mainly demographic, microbiological, specimen-related, and temporal variables, while important clinical and molecular factors such as previous antimicrobial exposure, comorbidities, infection severity, renal function, allergy history, and resistance determinants were not available. Their inclusion may improve future prediction and recommendation quality. Third, the relatively short study period limits assessment of longer-term changes in antimicrobial resistance patterns. Finally, although PDR cases were present in the original dataset, a dedicated PDR subgroup performance analysis was not performed; therefore, the reliability of the generated antibiotic rankings specifically for PDR patients cannot be established from the current results. Future studies should evaluate PDR cases separately using larger datasets with comprehensive susceptibility profiles, richer clinical and molecular information, and prospective multicenter validation before clinical deployment.
5. Conclusions
The proposed explainable multi-label machine learning framework provides a practical approach for patient-specific antibiotic recommendations based on susceptibility ranking and clinical decision support. By combining multi-label prediction, probability-based Top-5 ranking, SHAP-based explainability, and population-level analysis, the framework provides interpretable information that may complement antimicrobial susceptibility testing and antimicrobial stewardship.
The results support the potential of the selected Random Forest model for susceptibility-based ranking, while the temporal-test evaluation provides additional evidence of its predictive utility on later unseen patients. However, the model should not be interpreted as an autonomous prescribing system, and its predictions should be considered together with microbiological evidence, patient-specific clinical factors, local resistance patterns, and clinician judgment.
Further validation on larger, multicenter, and prospective datasets, including dedicated evaluation of challenging cases such as PDR, is required before the framework can be considered for routine clinical deployment.
Supplementary Materials
The following supporting information can be downloaded at: https://www.mdpi.com/article/10.3390/biomedinformatics6050076/s1. Supplementary Table S1. SHAP feature contributions for each antibiotic-specific classifier.
Author Contributions
Conceptualization, S.I.O., S.W.S., K.A.-B. and C.J.; methodology, K.A.-B., S.I.O., R.H.S. and S.W.S.; software, K.A.-B., B.A.I., K.I.N. and S.W.S.; validation, S.I.O., K.A.-B., C.J. and S.W.S.; formal analysis, S.I.O., K.A.-B., S.A.H., B.A.I., K.I.N. and S.W.S.; investigation, S.I.O., R.H.S., K.A.-B., K.M.A., M.A.A. (Muhamed Aydin Abbas), S.A.H., B.A.I., A.A.B., A.B., K.I.N. and S.W.S.; resources, S.I.O., K.A.-B., C.J. and S.W.S.; data curation, R.H.S., S.I.O., B.A.I., K.I.N. and S.W.S.; writing—original draft preparation, K.A.-B., S.I.O. and S.W.S.; writing—review and editing, R.H.S., K.A.-B., K.M.A., M.A.A. (Mohammed Awat Ali), S.A.H., B.A.I., A.A.B., C.J., A.B., K.I.N. and S.W.S.; visualization, K.A.-B., B.A.I., A.A.B., K.I.N. and S.W.S.; supervision, C.J. and S.W.S.; project administration, S.W.S.; funding acquisition, C.J. All authors have read and agreed to the published version of the manuscript.
Funding
This research was supported by Uppsala University under grant number 657BJ65.
Institutional Review Board Statement
Ethical approval was obtained from the Scientific Research Ethics Committee of Erbil Polytechnic University (Approval No. 214/00218 HRE, 9 December 2025). All study procedures were conducted in accordance with relevant guidelines and regulations and with the principles of the Declaration of Helsinki.
Informed Consent Statement
The requirement for informed consent was waived by the Scientific Research Ethics Committee of Erbil Polytechnic University because the study used retrospectively collected and anonymized data.
Data Availability Statement
The data supporting the findings of this study are available from the corresponding authors upon reasonable request, subject to ethical and institutional restrictions.
Acknowledgments
The authors gratefully acknowledge Uppsala University, Sweden, for supporting the APC. The authors also thank the participating institutions and healthcare professionals who contributed to data collection and verification.
Conflicts of Interest
The authors declare no conflicts of interest.
Abbreviations
| Abbreviation | Full term |
| AI | Artificial intelligence |
| AMR | Antimicrobial resistance |
| APC | Article Processing Charge |
| AST | Antimicrobial susceptibility testing |
| AUPRC | Area under the precision–recall curve |
| AUROC | Area under the receiver operating characteristic curve |
| CDC | Centers for Disease Control and Prevention |
| CLED | Cysteine Lactose Electrolyte Deficient |
| CSF | Cerebrospinal fluid |
| CV | Central venous |
| ECDC | European Centre for Disease Prevention and Control |
| ESBL | Extended-spectrum β-lactamase |
| GN | Gram-negative |
| GP | Gram-positive |
| LightGBM | Light Gradient Boosting Machine |
| ML | Machine learning |
| MRSA | Methicillin-resistant Staphylococcus aureus |
| MSA | Mannitol Salt Agar |
| ORCID | Open Researcher and Contributor ID |
| OOF | Out-of-Fold |
| OvR | One-vs-Rest |
| PDR | Pan-Drug Resistance |
| SDA | Sabouraud Dextrose Agar |
| SDG | Sustainable Development Goal |
| SHAPs | SHapley Additive exPlanations |
| VITEK | Automated microbial identification and susceptibility testing system |
| WHO | World Health Organization |
| XAI | Explainable artificial intelligence |
| XGBoost | Extreme Gradient Boosting |
| YST | Yeast identification card |
References
- Antimicrobial Resistance Collaborators. Global burden of bacterial antimicrobial resistance in 2019: A systematic analysis. Lancet 2022, 399, 629–655. [Google Scholar] [CrossRef] [Scilit] [PubMed]
- Elyan, E.; Hussain, A.; Sheikh, A.; Elmanama, A.A.; Vuttipittayamongkol, P.; Hijazi, K. Antimicrobial Resistance and Machine Learning: Challenges and Opportunities. IEEE Access 2022, 10, 31561–31577. [Google Scholar] [CrossRef] [Scilit]
- Yang, J.; Eyre, D.W.; Lu, L.; Clifton, D.A. Interpretable machine learning-based decision support for prediction of antibiotic resistance for complicated urinary tract infections. npj Antimicrob. Resist. 2023, 1, 14. [Google Scholar] [CrossRef] [Scilit] [PubMed]
- Cavallaro, M.; Moran, E.; Collyer, B.; McCarthy, N.D.; Green, C.; Keeling, M.J. Informing antimicrobial stewardship with explainable AI. PLoS Digit. Health 2023, 2, e0000162. [Google Scholar] [CrossRef] [Scilit] [PubMed]
- Centers for Disease Control and Prevention. Antibiotic Resistance Threats in the United States; U.S. Department of Health and Human Services: Atlanta, GA, USA, 2019. [CrossRef] [Scilit]
- World Health Organization. Antimicrobial Resistance. Available online: https://www.who.int/news-room/fact-sheets/detail/antimicrobial-resistance (accessed on 28 July 2026).
- Arango-Argoty, G.; Garner, E.; Pruden, A.; Heath, L.S.; Vikesland, P.; Zhang, L. DeepARG: A deep learning approach for predicting antibiotic resistance genes from metagenomic data. Microbiome 2018, 6, 23. [Google Scholar] [CrossRef] [Scilit] [PubMed]
- Amrollahi, F.; Haredasht, F.N.; Vansomphone, A.; Marshall, N.; Maddali, M.V.; Ma, S.P.; Chang, A.; Deresinski, S.C.; Goldstein, M.K.; Kanjilal, S.; et al. Machine Learning-Based Prediction of Antimicrobial Susceptibility: A Step Towards Precision Antimicrobial Stewardship. AMIA Annu. Symp. Proc. 2024, 2024, 138–146. [Google Scholar] [PubMed]
- Lewin-Epstein, O.; Baruch, S.; Hadany, L.; Stein, G.Y.; Obolski, U. Predicting Antibiotic Resistance in Hospitalized Patients by Applying Machine Learning to Electronic Medical Records. Clin. Infect. Dis. 2021, 72, e848–e855. [Google Scholar] [CrossRef] [Scilit] [PubMed]
- Shin, D.W.; Kim, H.; Park, J.S.; Park, K.U.; Choi, M.H.; Kim, D.; Jeong, S.H.; Kim, H.J.; Kim, Y.A.; Ahn, K.; et al. Performance of a quality control center supporting national antimicrobial resistance surveillance. Br. J. Biomed. Sci. 2026, 83, 16457. [Google Scholar] [CrossRef] [Scilit] [PubMed]
- Goto, M.; Bandyopadhyay, A.; Shi, Q.; Wang, Y.; Perencevich, E.N.; Hernandez, D.; Street, W.N. Personalized Antibiogram: A Novel Multitask Machine Learning Framework for Simultaneous Prediction of Antimicrobial Resistance Profile With Enhanced Detection of Carbapenem Resistance in Enterobacteriaceae. Clin. Infect. Dis. 2026, 83, e1–e9. [Google Scholar] [CrossRef] [Scilit] [PubMed]
- Sulianta, F.; Amalia, E.; Samiharjo, R.; Herdinata, N.E. Optimizing Transformer-Based Learning Model with Tabtransformer for Predicting Antibiotic Susceptibility from Microbiology Medical Records. J. Ilmu Pengetah. Teknol. Komput. 2026, 11, 651–660. [Google Scholar] [CrossRef] [Scilit]
- Wishal, S.; Sahara, R. Predicting Multi-Drug Resistance in Bacterial Isolates Through Performance Comparison and LIME-based Interpretation of Classification Models. arXiv 2026, arXiv:2602.22400. [Google Scholar] [CrossRef] [Scilit]
- Almalki, Z.; Althagafi, A.; Al-Shareef, S. Comparative evaluation of ensemble machine learning models for predicting antibacterial resistance from electronic health records. Discov. Artif. Intell. 2026, 6. [Google Scholar] [CrossRef] [Scilit]
- Pincus, D. Microbial Identification Using the bioMérieux VITEK® 2 System. In Encyclopedia of Rapid Microbiological Methods; Miller, M.J., Ed.; Parenteral Drug Association: Bethesda, MD, USA, 2014; Volume 2, pp. 1–32. [Google Scholar]
- Ling, T.K.; Tam, P.C.; Liu, Z.K.; Cheng, A.F. Evaluation of VITEK 2 rapid identification and susceptibility testing system against gram-negative clinical isolates. J. Clin. Microbiol. 2001, 39, 2964–2966. [Google Scholar] [CrossRef] [PubMed]
- Pedregosa, F.; Varoquaux, G.; Gramfort, A.; Michel, V.; Thirion, B.; Grisel, O.; Blondel, M.; Prettenhofer, P.; Weiss, R.; Dubourg, V.; et al. Scikit-learn: Machine Learning in Python. J. Mach. Learn. Res. 2011, 12, 2825–2830. [Google Scholar]
- Tsoumakas, G.; Katakis, I. Multi-Label Classification. Int. J. Data Warehous. Min. 2007, 3, 1–13. [Google Scholar] [CrossRef] [Scilit]
- Zhang, M.-L.; Zhou, Z.-H. A Review on Multi-Label Learning Algorithms. IEEE Trans. Knowl. Data Eng. 2014, 26, 1819–1837. [Google Scholar] [CrossRef] [Scilit]
- Chen, T.; Guestrin, C. XGBoost: A Scalable Tree Boosting System. In Proceedings of the 22nd ACM SIGKDD International Conference on Knowledge Discovery and Data Mining, San Francisco, CA, USA, 13–17 August 2016; pp. 785–794. [Google Scholar] [CrossRef] [Scilit]
- Breiman, L. Random Forests. Mach. Learn. 2001, 45, 5–32. [Google Scholar] [CrossRef] [Scilit]
- Ke, G.; Meng, Q.; Finley, T.; Wang, T.; Chen, W.; Ma, W.; Ye, Q.; Liu, T.-Y. LightGBM: A Highly Efficient Gradient Boosting Decision Tree. In Proceedings of the Advances in Neural Information Processing Systems 30 (NeurIPS 2017), Long Beach, CA, USA, 4–9 December 2017; pp. 3146–3154. [Google Scholar]
- Sokolova, M.; Lapalme, G. A systematic analysis of performance measures for classification tasks. Inf. Process. Manag. 2009, 45, 427–437. [Google Scholar] [CrossRef] [Scilit]
- Powers, D. Evaluation: From precision, recall and F-measure to ROC, informedness, markedness & correlation. arXiv 2020, arXiv:2010.16061. [Google Scholar] [CrossRef] [Scilit]
- Efron, B.; Tibshirani, R.J. An Introduction to the Bootstrap, 1st ed.; Chapman and Hall/CRC: Boca Raton, FL, USA, 1994. [Google Scholar]
- Lundberg, S.; Lee, S.-I. A Unified Approach to Interpreting Model Predictions. In Proceedings of the Advances in Neural Information Processing Systems 30 (NeurIPS 2017), Long Beach, CA, USA, 4–9 December 2017; pp. 4765–4774. [Google Scholar] [CrossRef] [Scilit]
- European Centre for Disease Prevention and Control. Surveillance of Antimicrobial Resistance in Europe, 2024 Data; ECDC: Stockholm, Sweden, 2026; Available online: https://www.ecdc.europa.eu/en/publications-data/surveillance-antimicrobial-resistance-europe-2024-data (accessed on 28 July 2026).
- Karampatakis, T.; Tsergouli, K.; Behzadi, P. Carbapenem-Resistant Klebsiella pneumoniae: Virulence Factors, Molecular Epidemiology and Latest Updates in Treatment Options. Antibiotics 2023, 12, 234. [Google Scholar] [CrossRef] [Scilit] [PubMed]
- De Oliveira, D.M.P.; Forde, B.M.; Kidd, T.J.; Harris, P.N.A.; Schembri, M.A.; Beatson, S.A.; Paterson, D.L.; Walker, M.J. Antimicrobial Resistance in ESKAPE Pathogens. Clin. Microbiol. Rev. 2020, 33, e00181-19. [Google Scholar] [CrossRef] [Scilit] [PubMed]
- Sati, H.; Carrara, E.; Savoldi, A.; Hansen, P.; Garlasco, J.; Campagnaro, E.; Boccia, S.; Castillo-Polo, J.A.; Magrini, E.; Garcia-Vello, P.; et al. The WHO Bacterial Priority Pathogens List 2024: A prioritisation study to guide research, development, and public health strategies against antimicrobial resistance. Lancet Infect. Dis. 2025, 25, 1033–1043. [Google Scholar] [CrossRef] [Scilit] [PubMed]
- Pappas, P.G.; Kauffman, C.A.; Andes, D.R.; Clancy, C.J.; Marr, K.A.; Ostrosky-Zeichner, L.; Reboli, A.C.; Schuster, M.G.; Vazquez, J.A.; Walsh, T.J.; et al. Clinical Practice Guideline for the Management of Candidiasis: 2016 Update by the Infectious Diseases Society of America. Clin. Infect. Dis. 2016, 62, e1–e50. [Google Scholar] [CrossRef] [Scilit] [PubMed]
- Tong, S.Y.; Davis, J.S.; Eichenberger, E.; Holland, T.L.; Fowler, V.G., Jr. Staphylococcus aureus infections: Epidemiology, pathophysiology, clinical manifestations, and management. Clin. Microbiol. Rev. 2015, 28, 603–661. [Google Scholar] [CrossRef] [Scilit] [PubMed]
- Kim, J.I.; Maguire, F.; Tsang, K.K.; Gouliouris, T.; Peacock, S.J.; McAllister, T.A.; McArthur, A.G.; Beiko, R.G. Machine Learning for Antimicrobial Resistance Prediction: Current Practice, Limitations, and Clinical Perspective. Clin. Microbiol. Rev. 2022, 35, e0017921. [Google Scholar] [CrossRef] [Scilit] [PubMed]
- High-Level Expert Group on Artificial Intelligence. Ethics Guidelines for Trustworthy AI; European Commission: Brussels, Belgium, 2019. [Google Scholar] [CrossRef]
- Nguyen, H.A.; Peleg, A.Y.; Song, J.; Antony, B.; Webb, G.I.; Wisniewski, J.A.; Blakeway, L.V.; Badoordeen, G.Z.; Theegala, R.; Zisis, H.; et al. Predicting Pseudomonas aeruginosa drug resistance using artificial intelligence and clinical MALDI-TOF mass spectra. mSystems 2024, 9, e0078924. [Google Scholar] [CrossRef] [Scilit] [PubMed]
- Kherabi, Y.; Thy, M.; Bouzid, D.; Antcliffe, D.B.; Rawson, T.M.; Peiffer-Smadja, N. Machine learning to predict antimicrobial resistance: Future applications in clinical practice? Infect. Dis. Now 2024, 54, 104864. [Google Scholar] [CrossRef] [Scilit] [PubMed]
- Li, Y.; Cui, X.; Yang, X.; Liu, G.; Zhang, J. Artificial intelligence in predicting pathogenic microorganisms’ antimicrobial resistance: Challenges, progress, and prospects. Front. Cell. Infect. Microbiol. 2024, 14, 1482186. [Google Scholar] [CrossRef] [Scilit] [PubMed]
- Peiffer-Smadja, N.; Rawson, T.M.; Ahmad, R.; Buchard, A.; Georgiou, P.; Lescure, F.X.; Birgand, G.; Holmes, A.H. Machine learning for clinical decision support in infectious diseases: A narrative review of current applications. Clin. Microbiol. Infect. 2020, 26, 584–595. [Google Scholar] [CrossRef] [Scilit] [PubMed]
- de la Lastra, J.M.P.; Wardell, S.J.T.; Pal, T.; de la Fuente-Nunez, C.; Pletzer, D. From Data to Decisions: Leveraging Artificial Intelligence and Machine Learning in Combating Antimicrobial Resistance—A Comprehensive Review. J. Med. Syst. 2024, 48, 71. [Google Scholar] [CrossRef] [Scilit] [PubMed]
- Lv, G.; Wang, Y. Machine learning-based antibiotic resistance prediction models: An updated systematic review and meta-analysis. Technol. Health Care 2024, 32, 2865–2882. [Google Scholar] [CrossRef] [Scilit] [PubMed]
- Giacobbe, D.R.; Marelli, C.; Guastavino, S.; Mora, S.; Rosso, N.; Signori, A.; Campi, C.; Giacomini, M.; Bassetti, M. Explainable and Interpretable Machine Learning for Antimicrobial Stewardship: Opportunities and Challenges. Clin. Ther. 2024, 46, 474–480. [Google Scholar] [CrossRef] [Scilit] [PubMed]
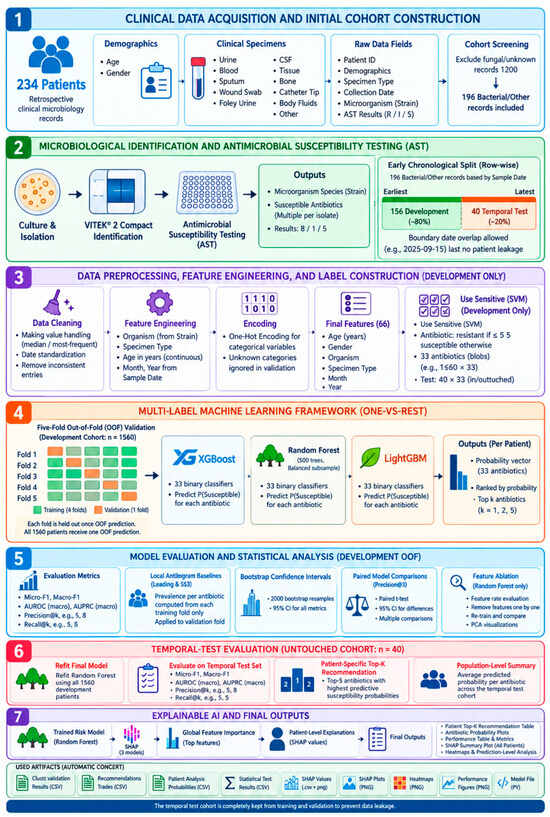
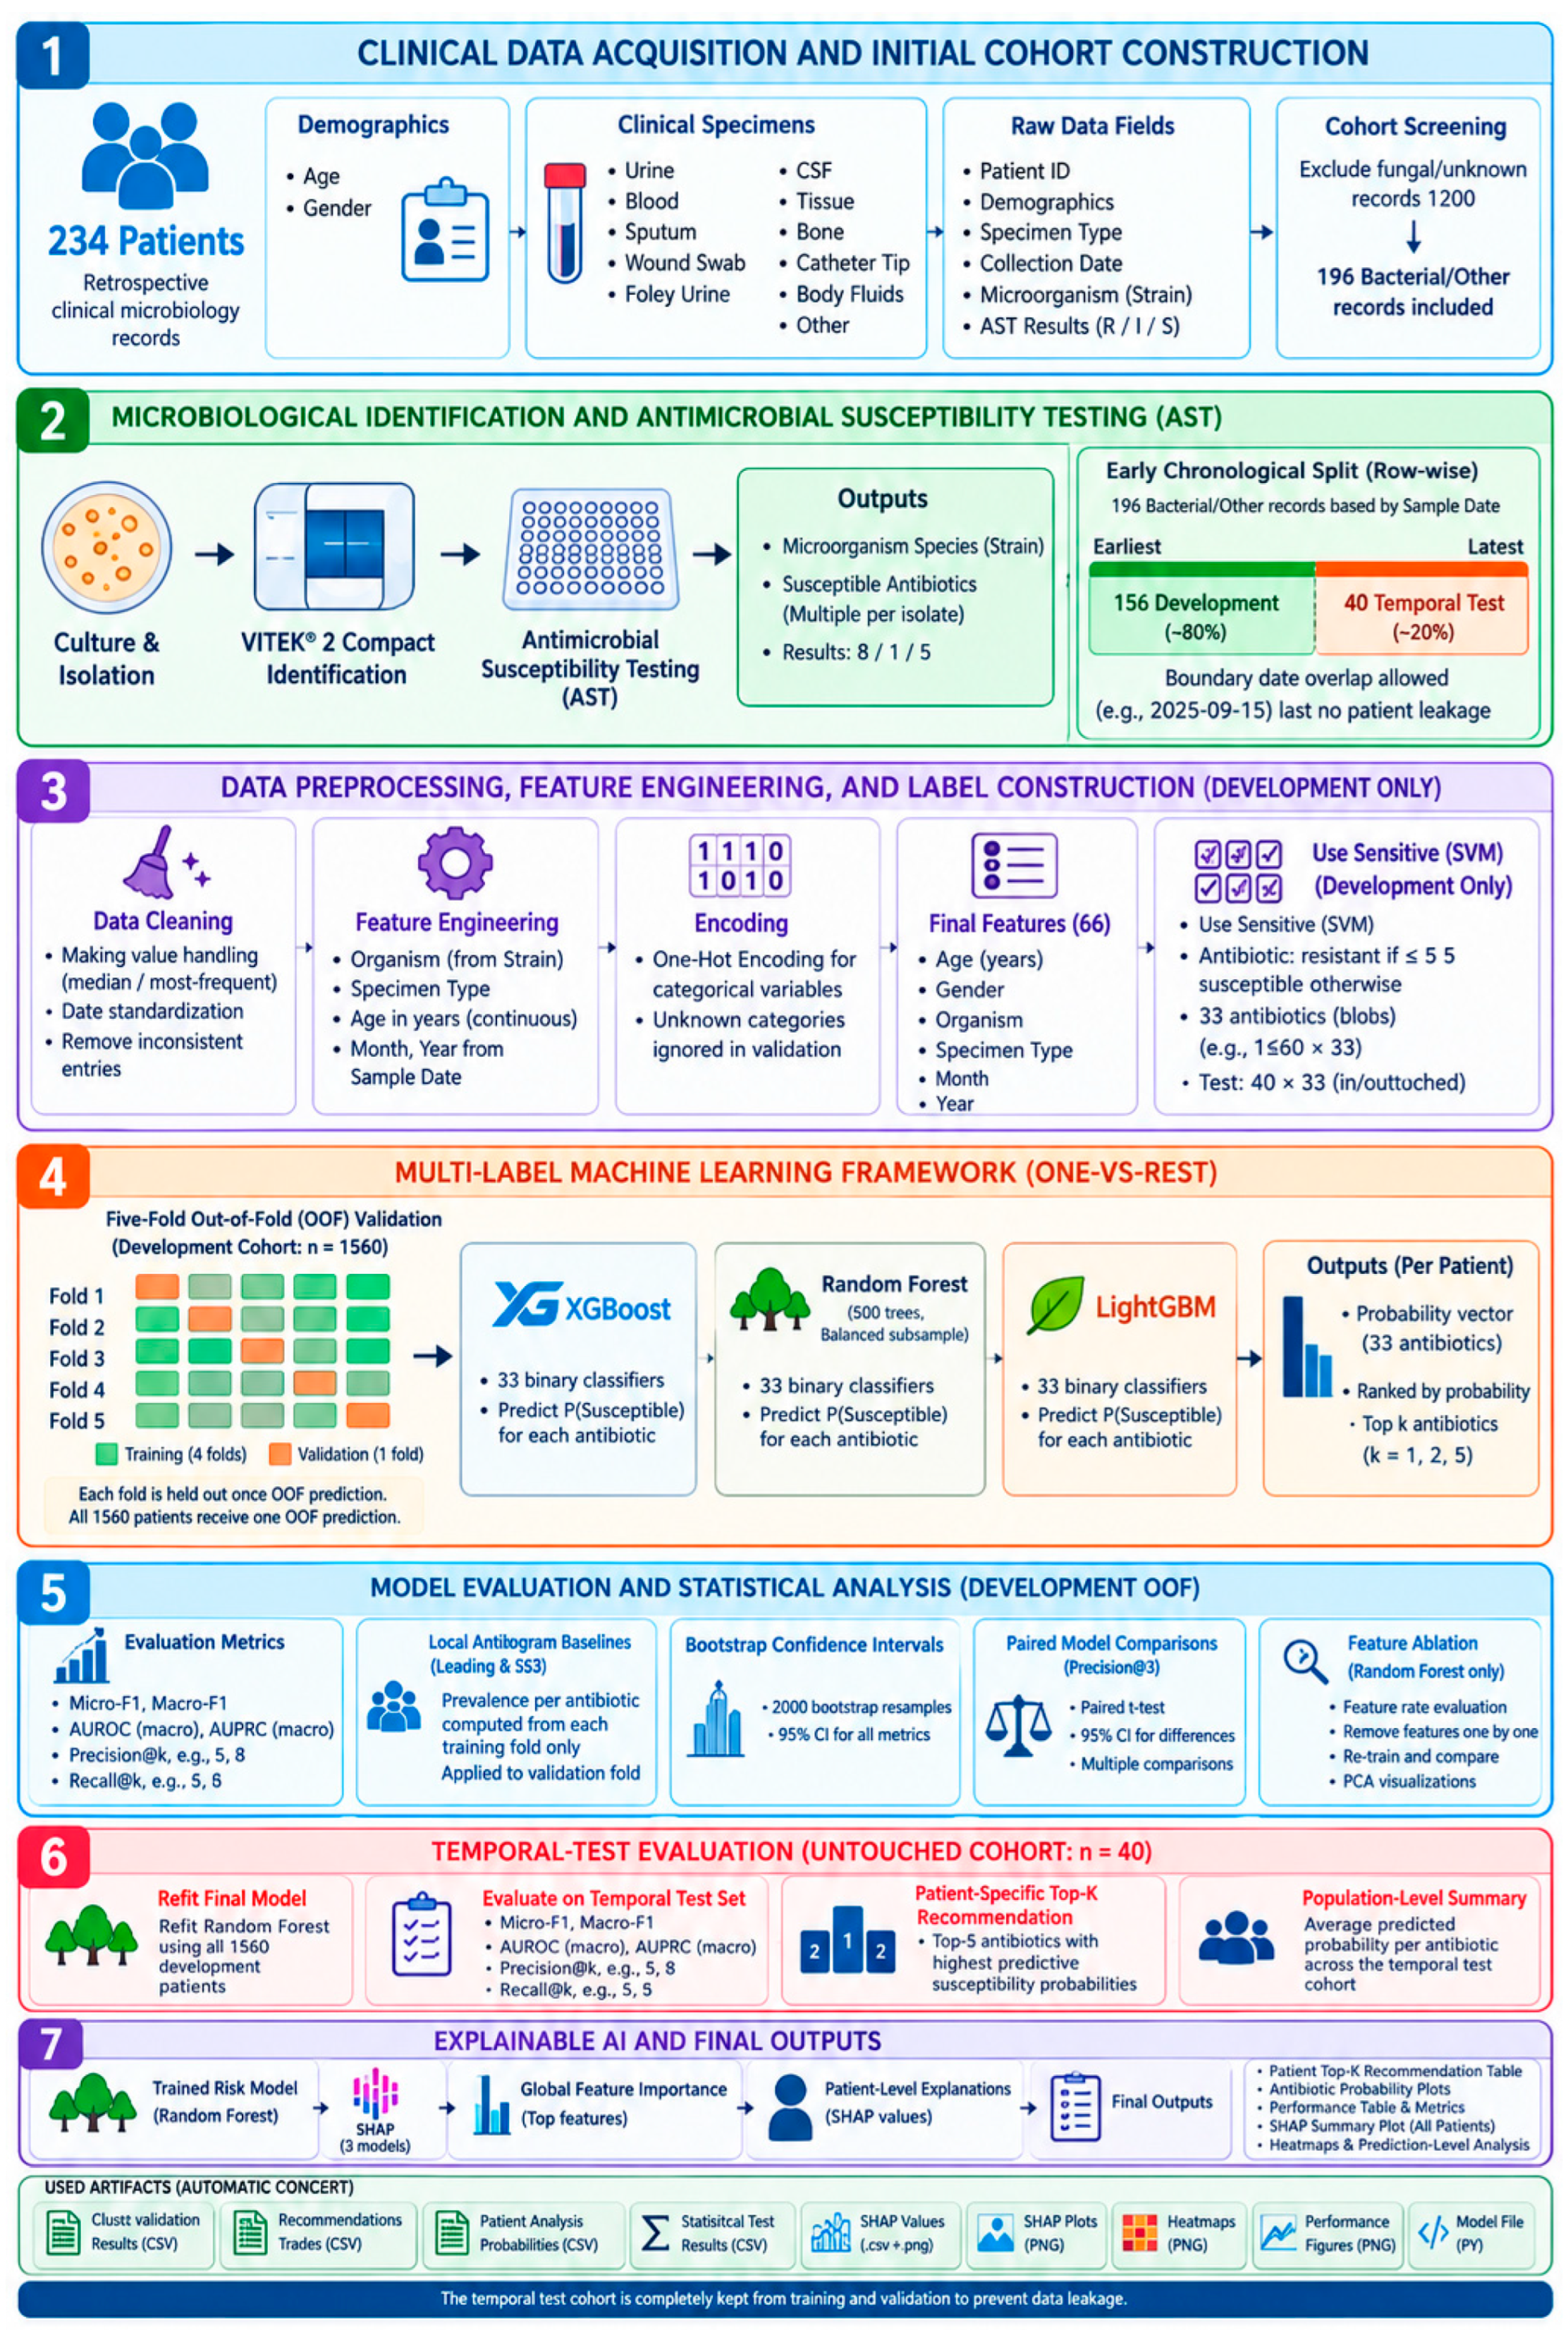
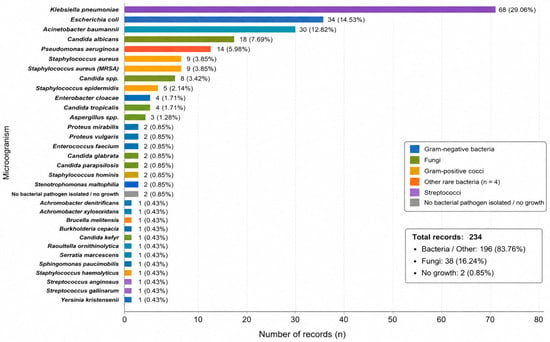
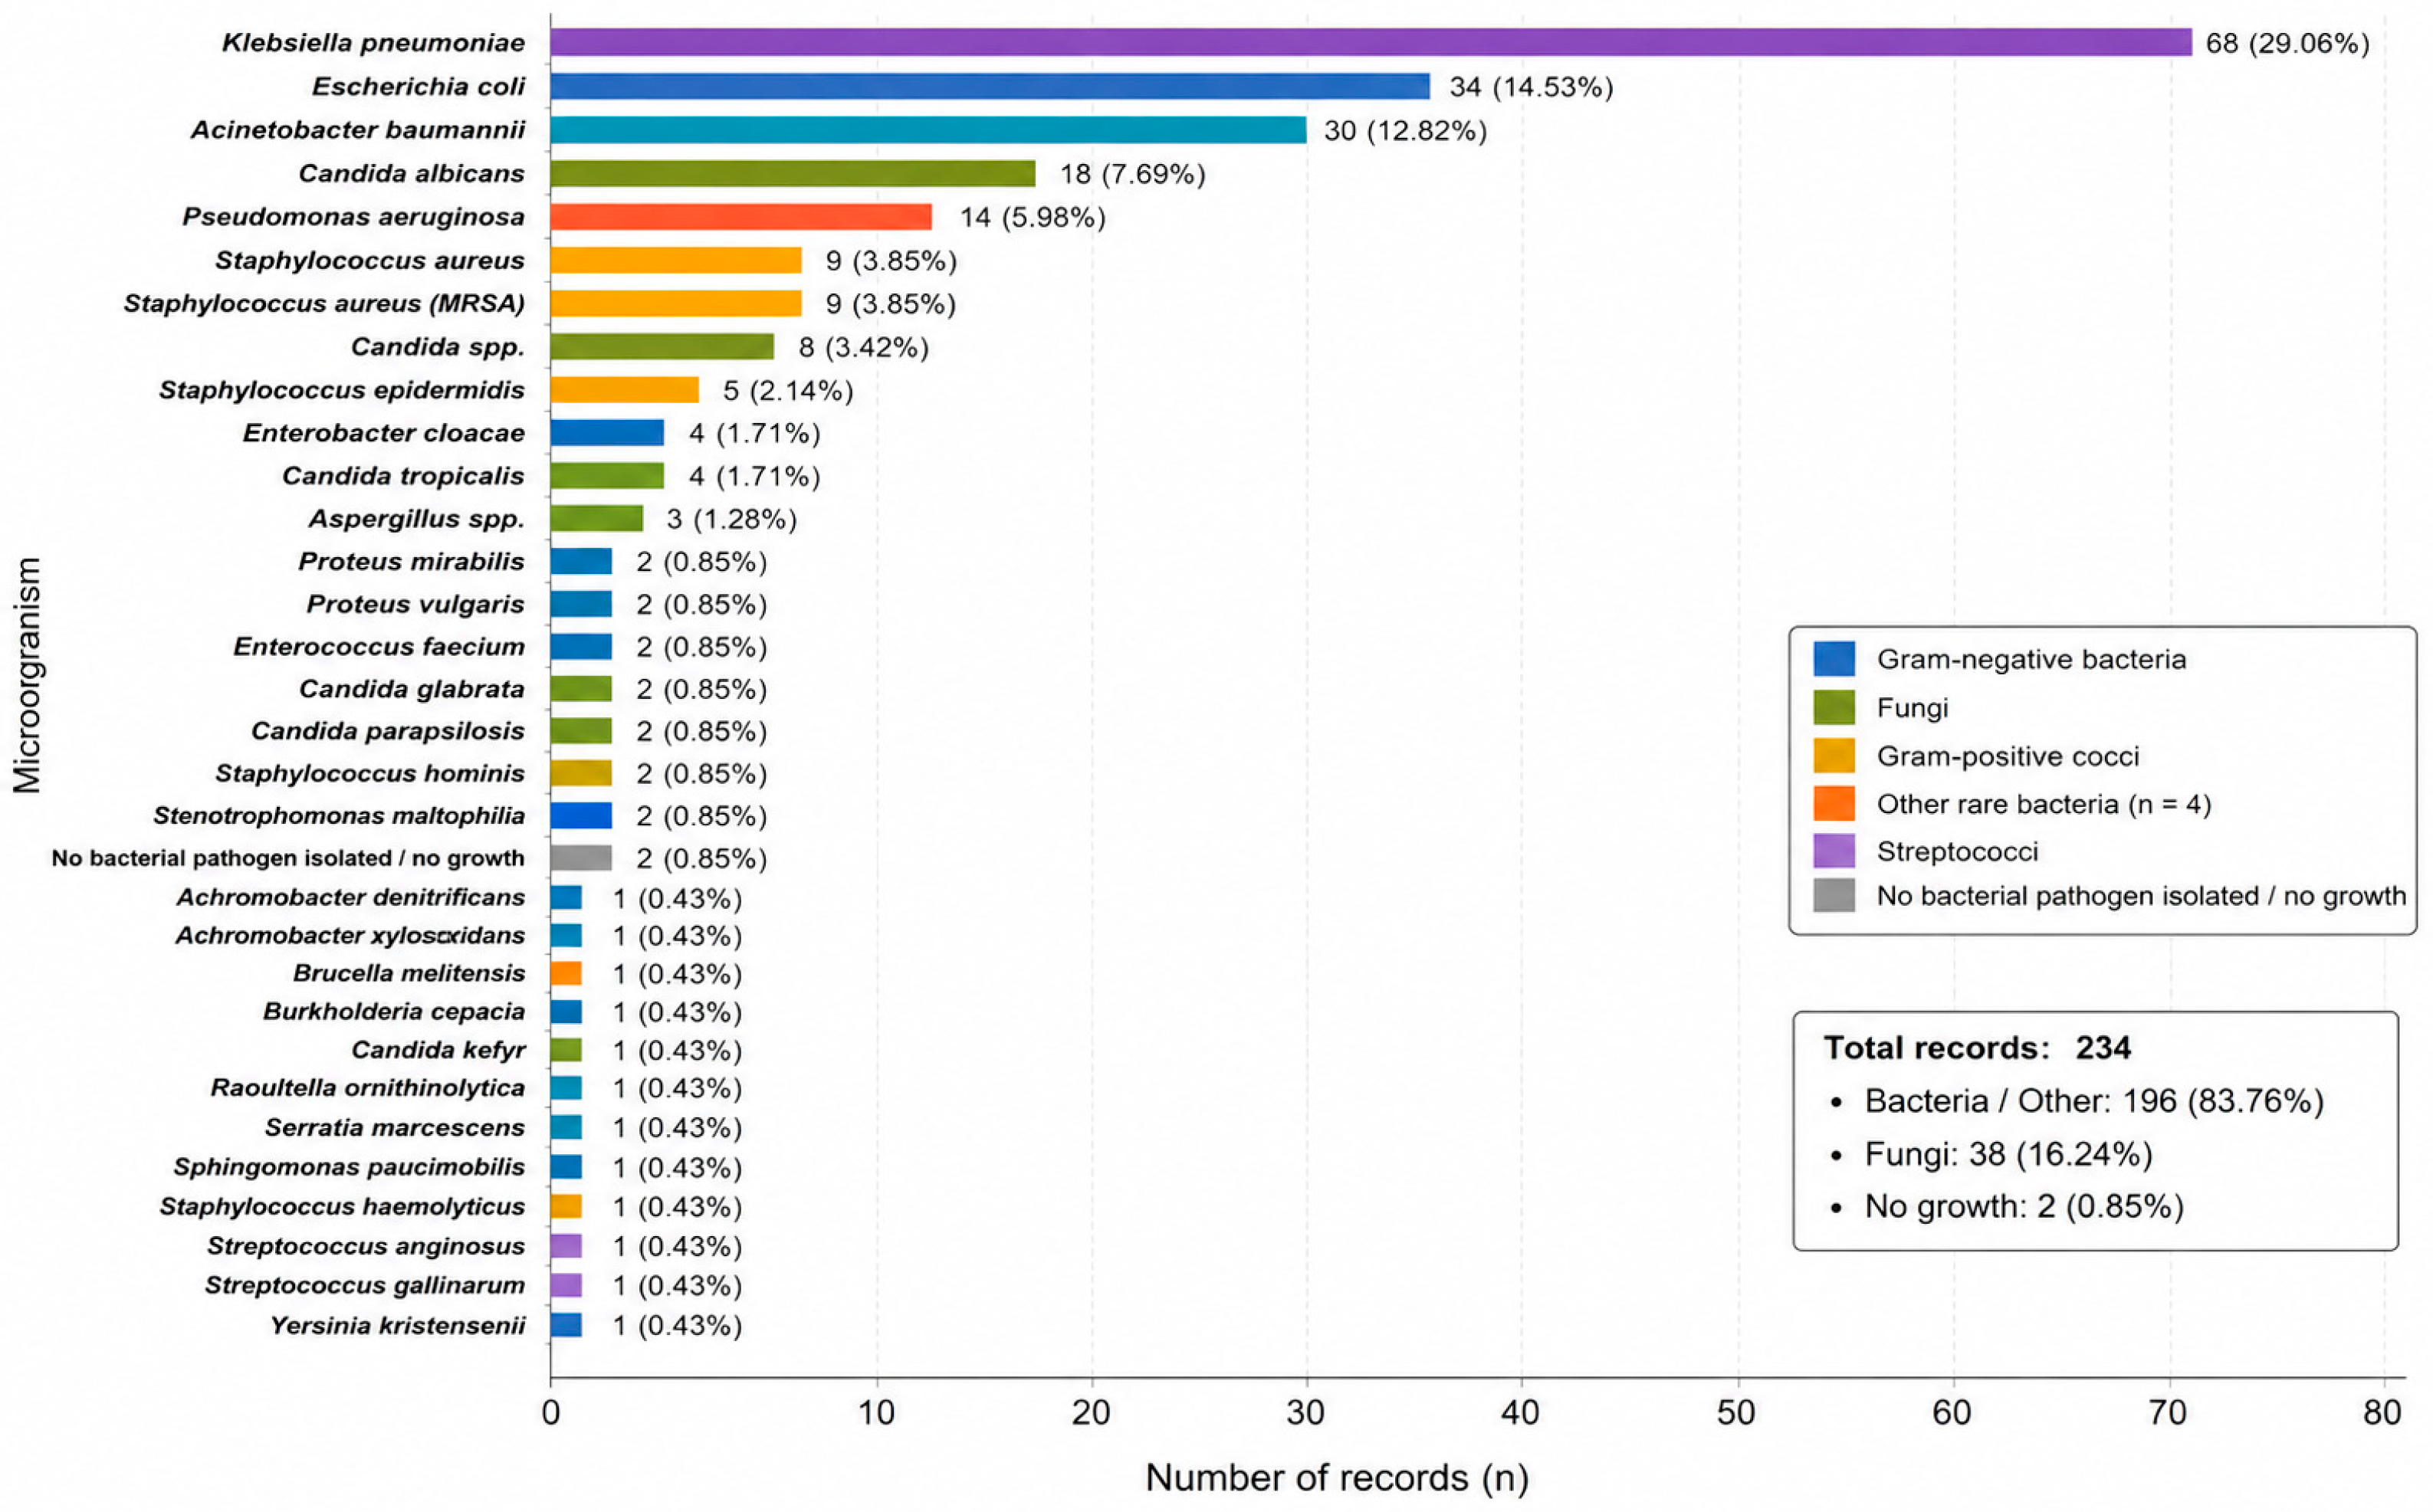
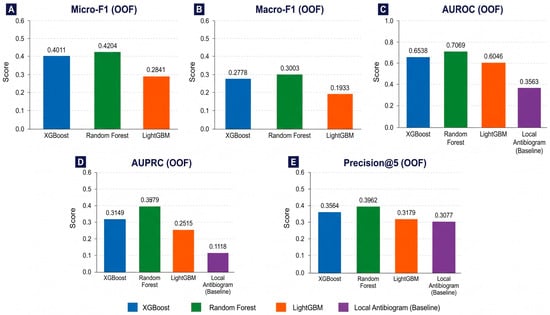
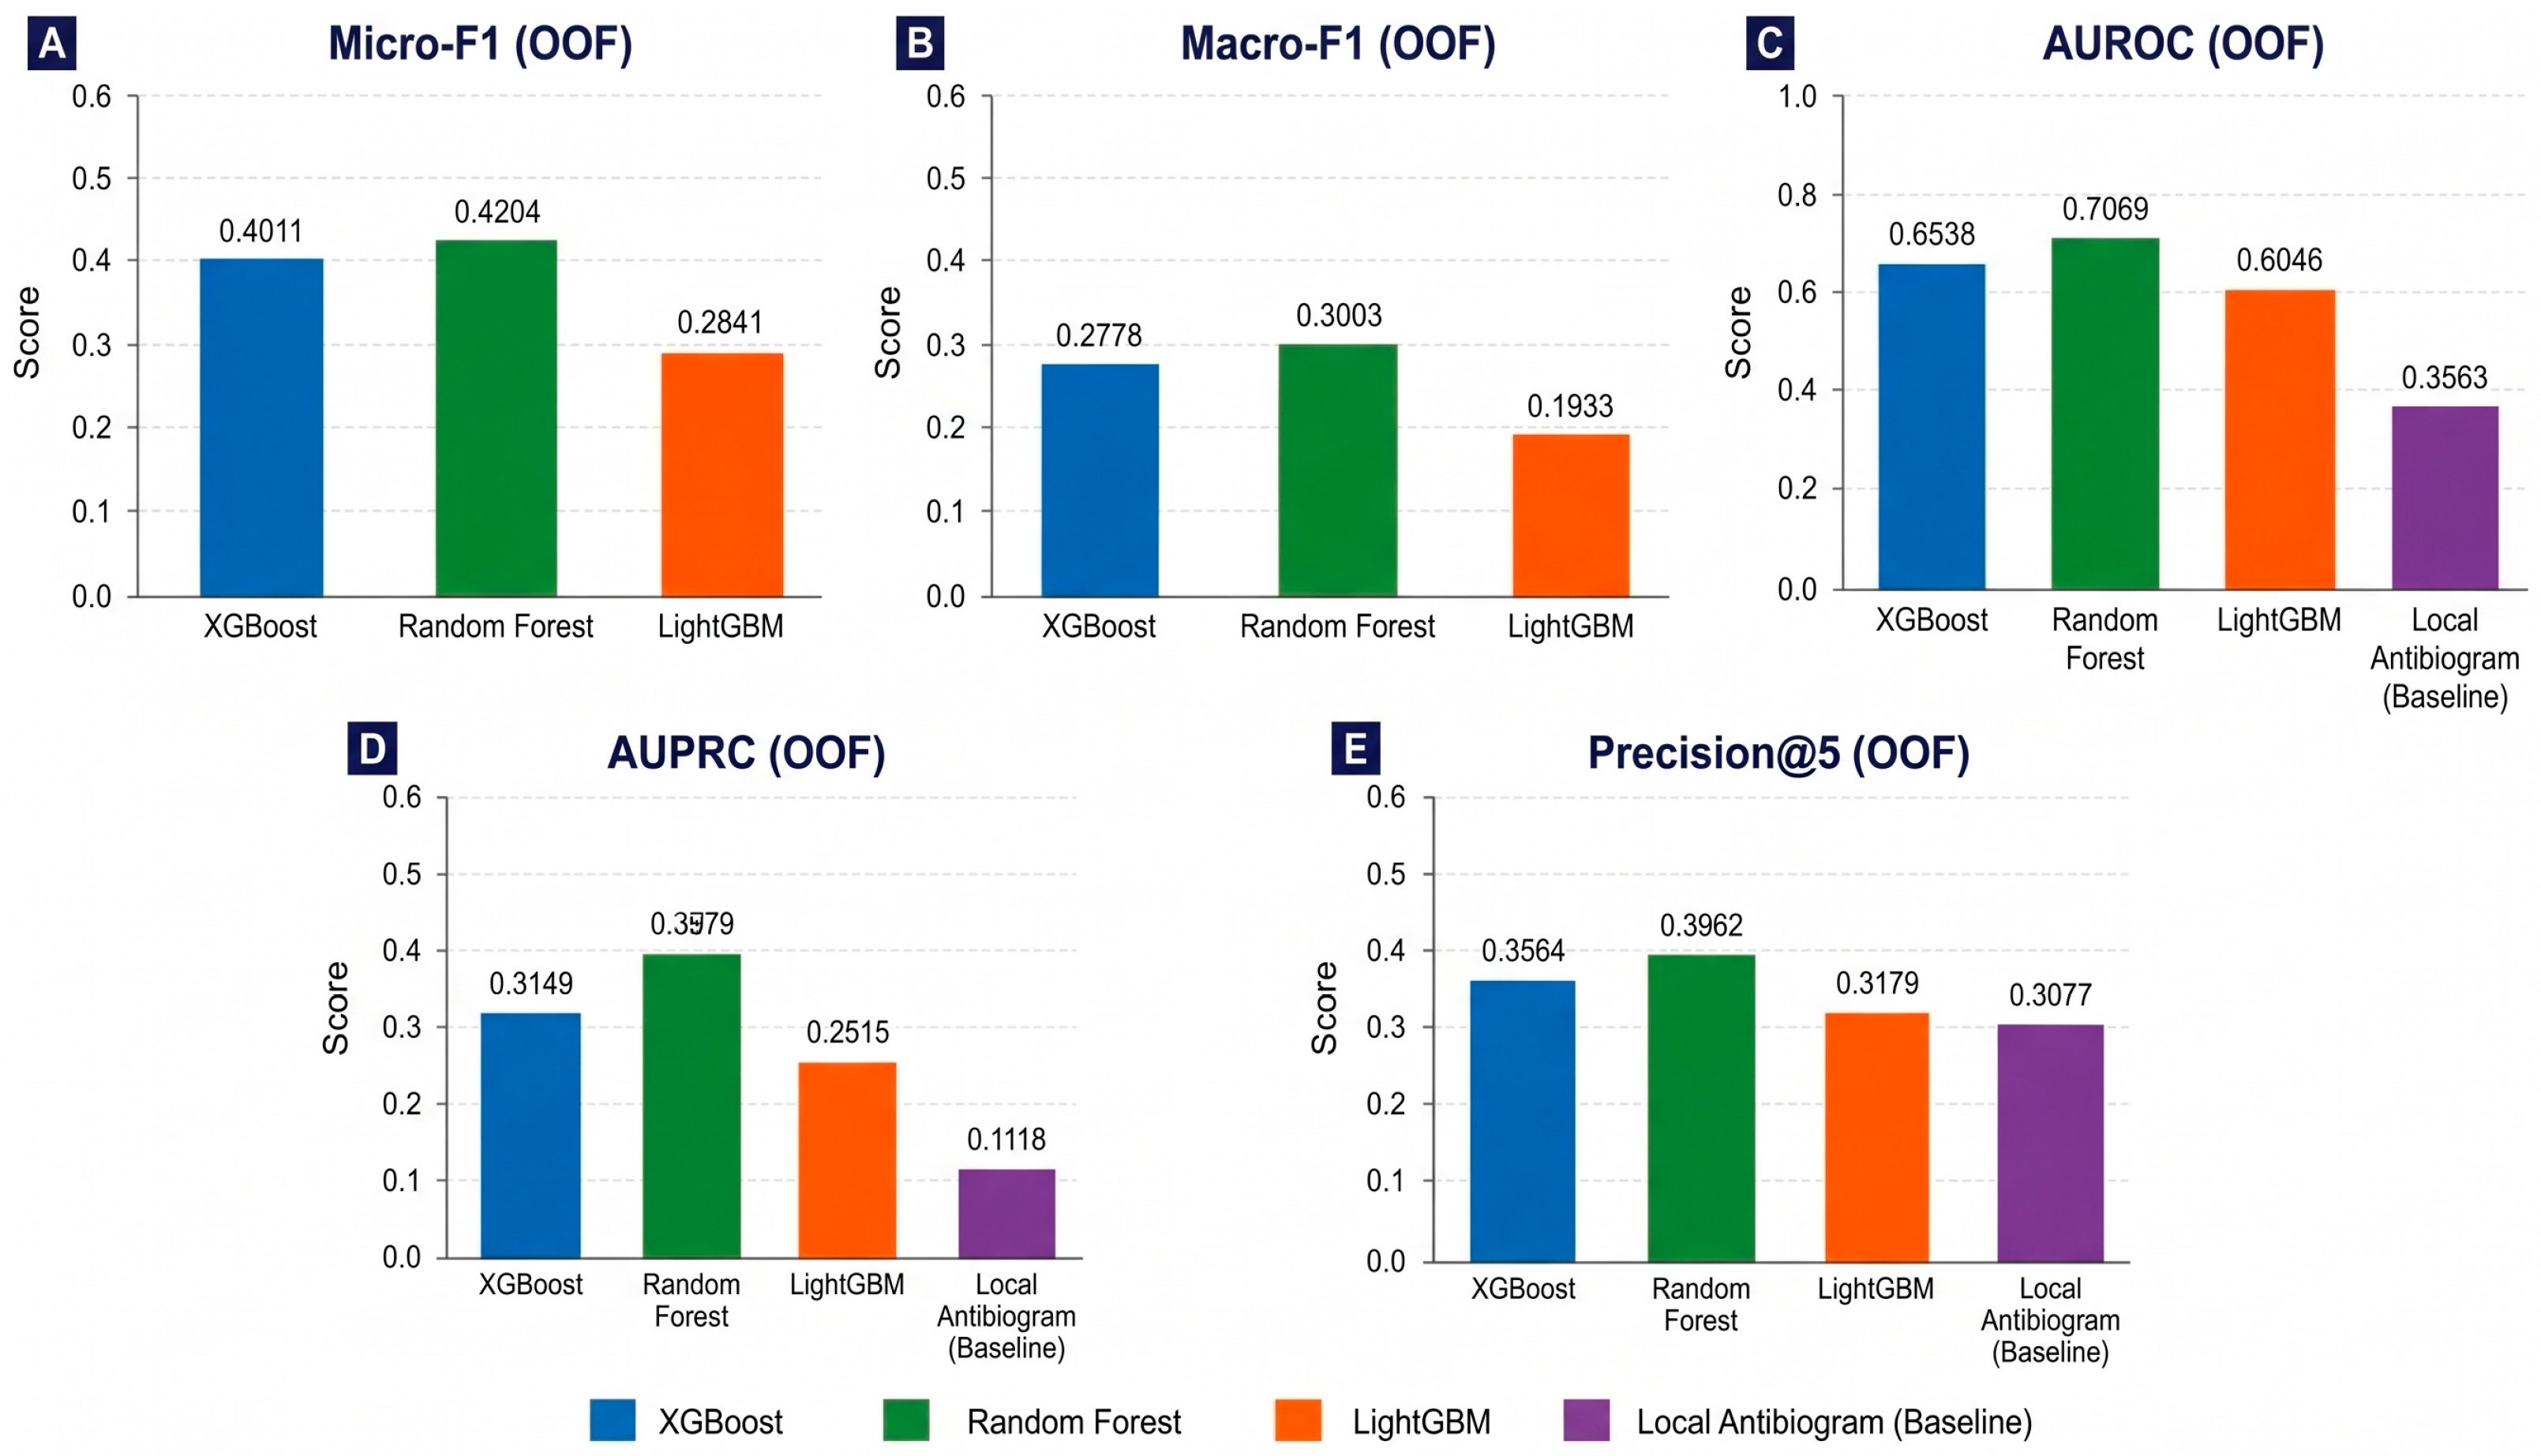
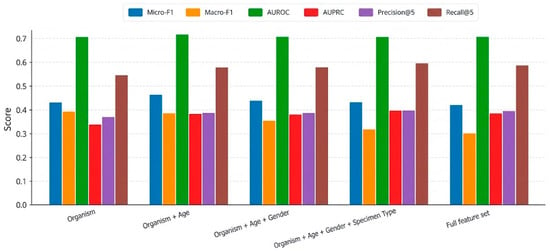
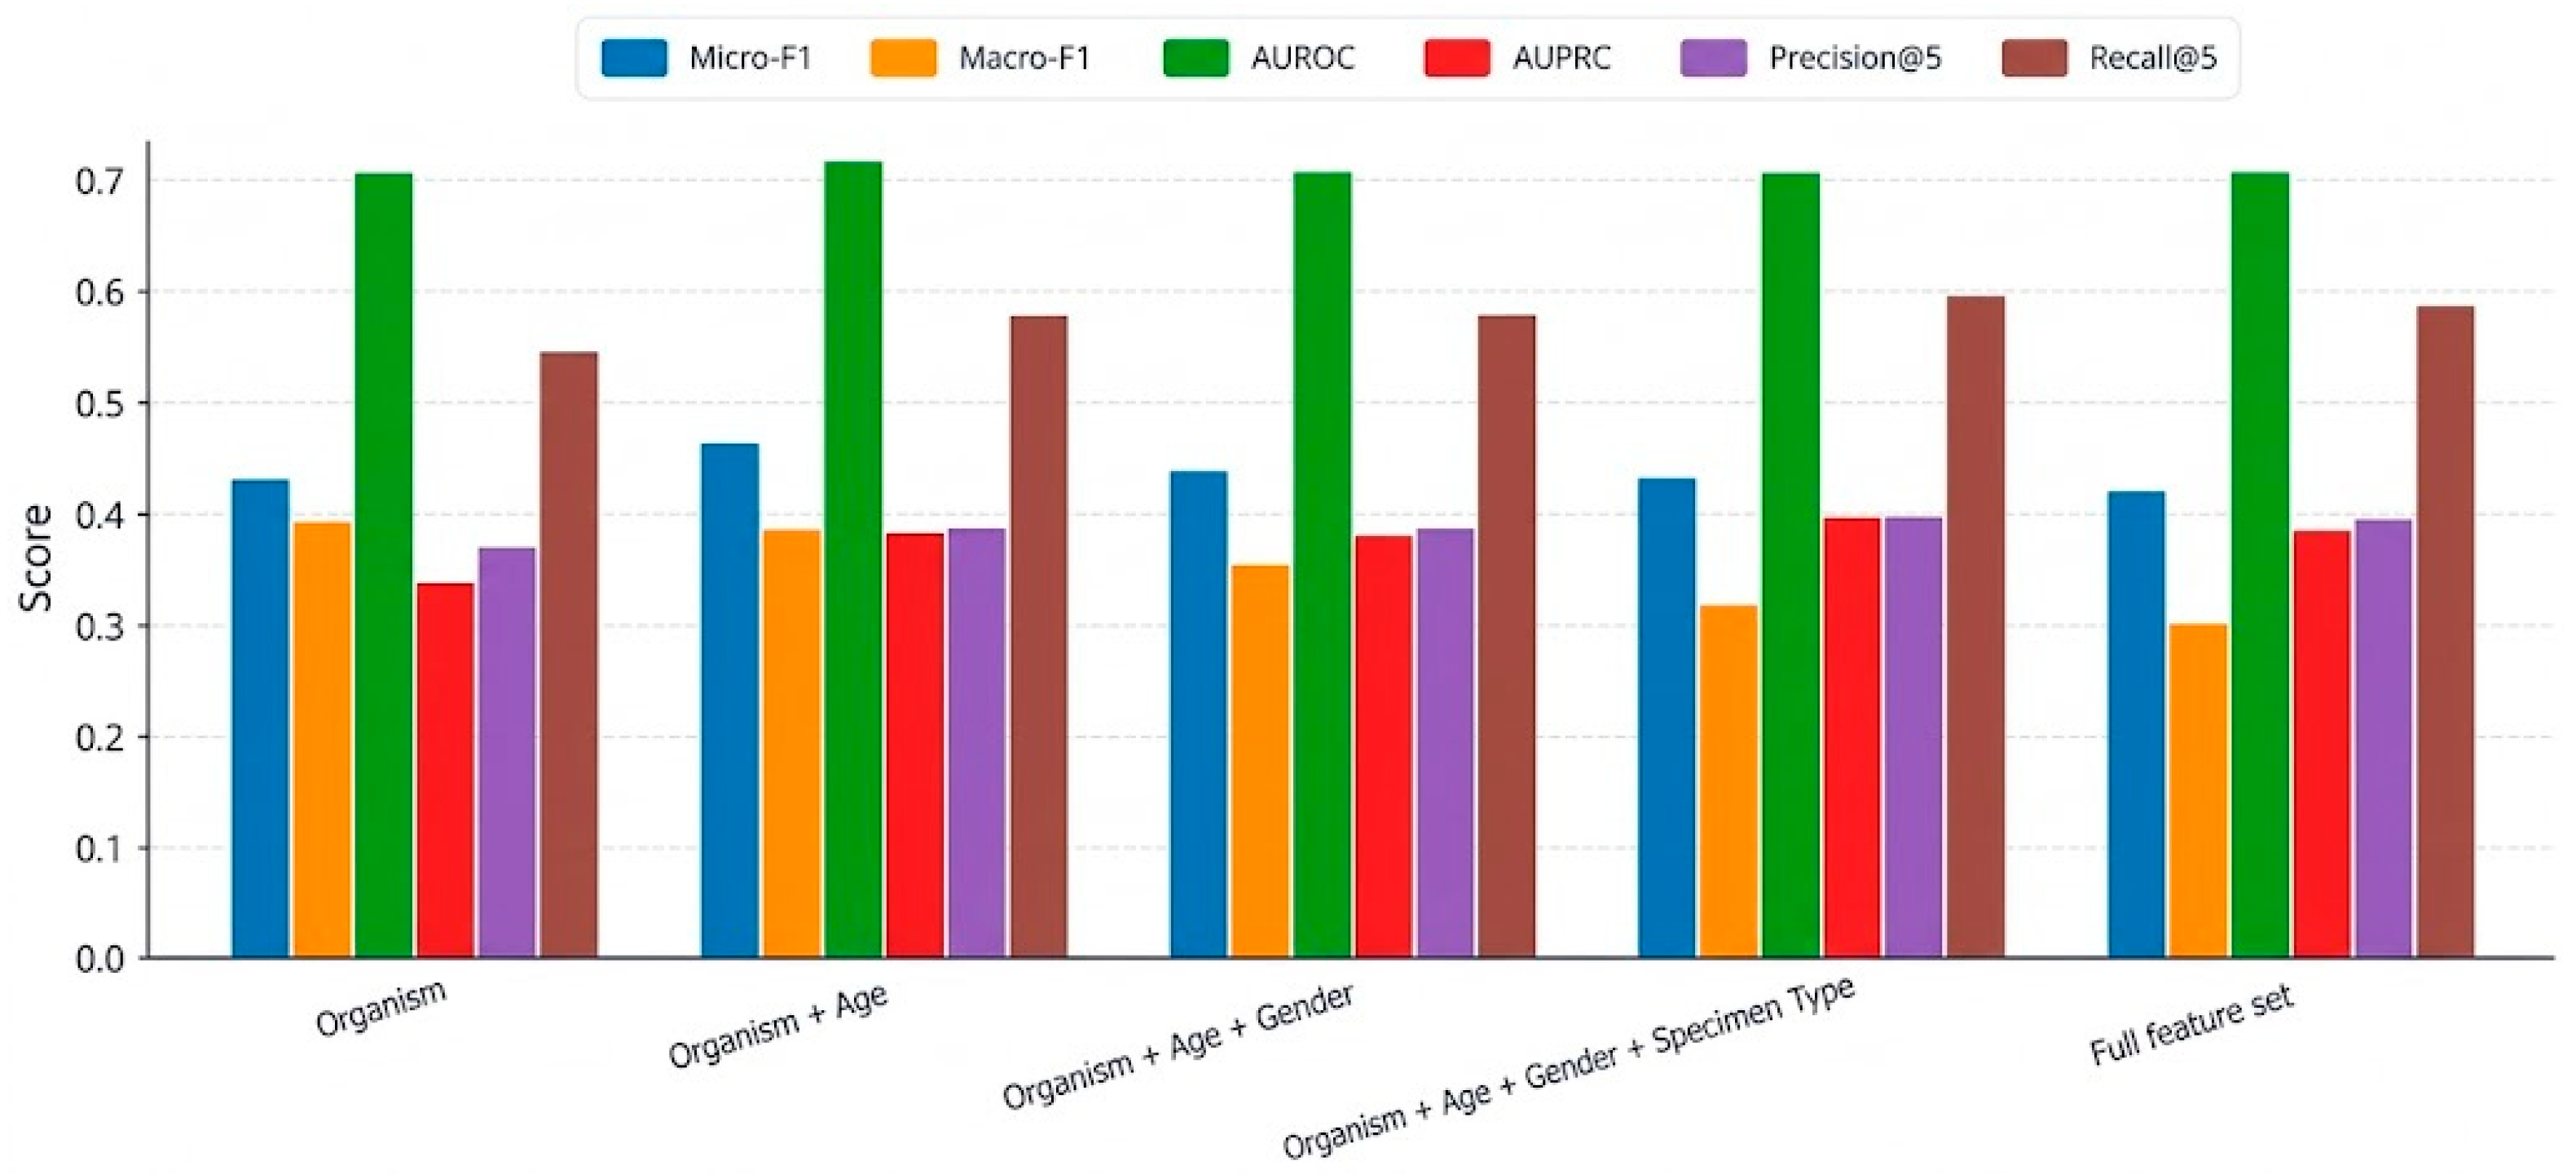
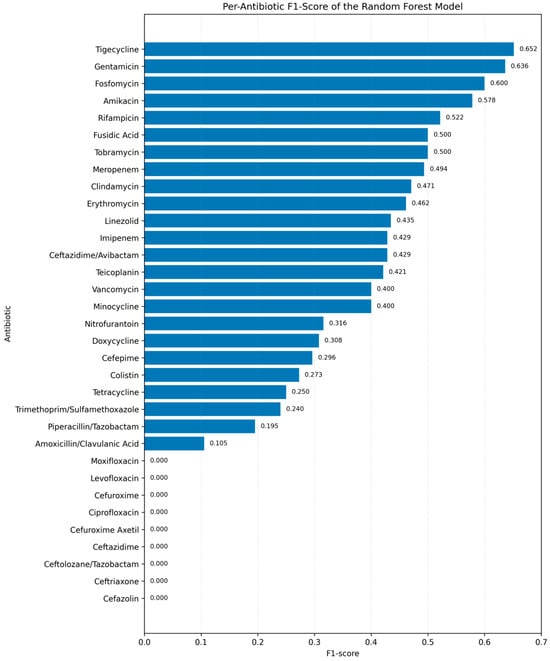
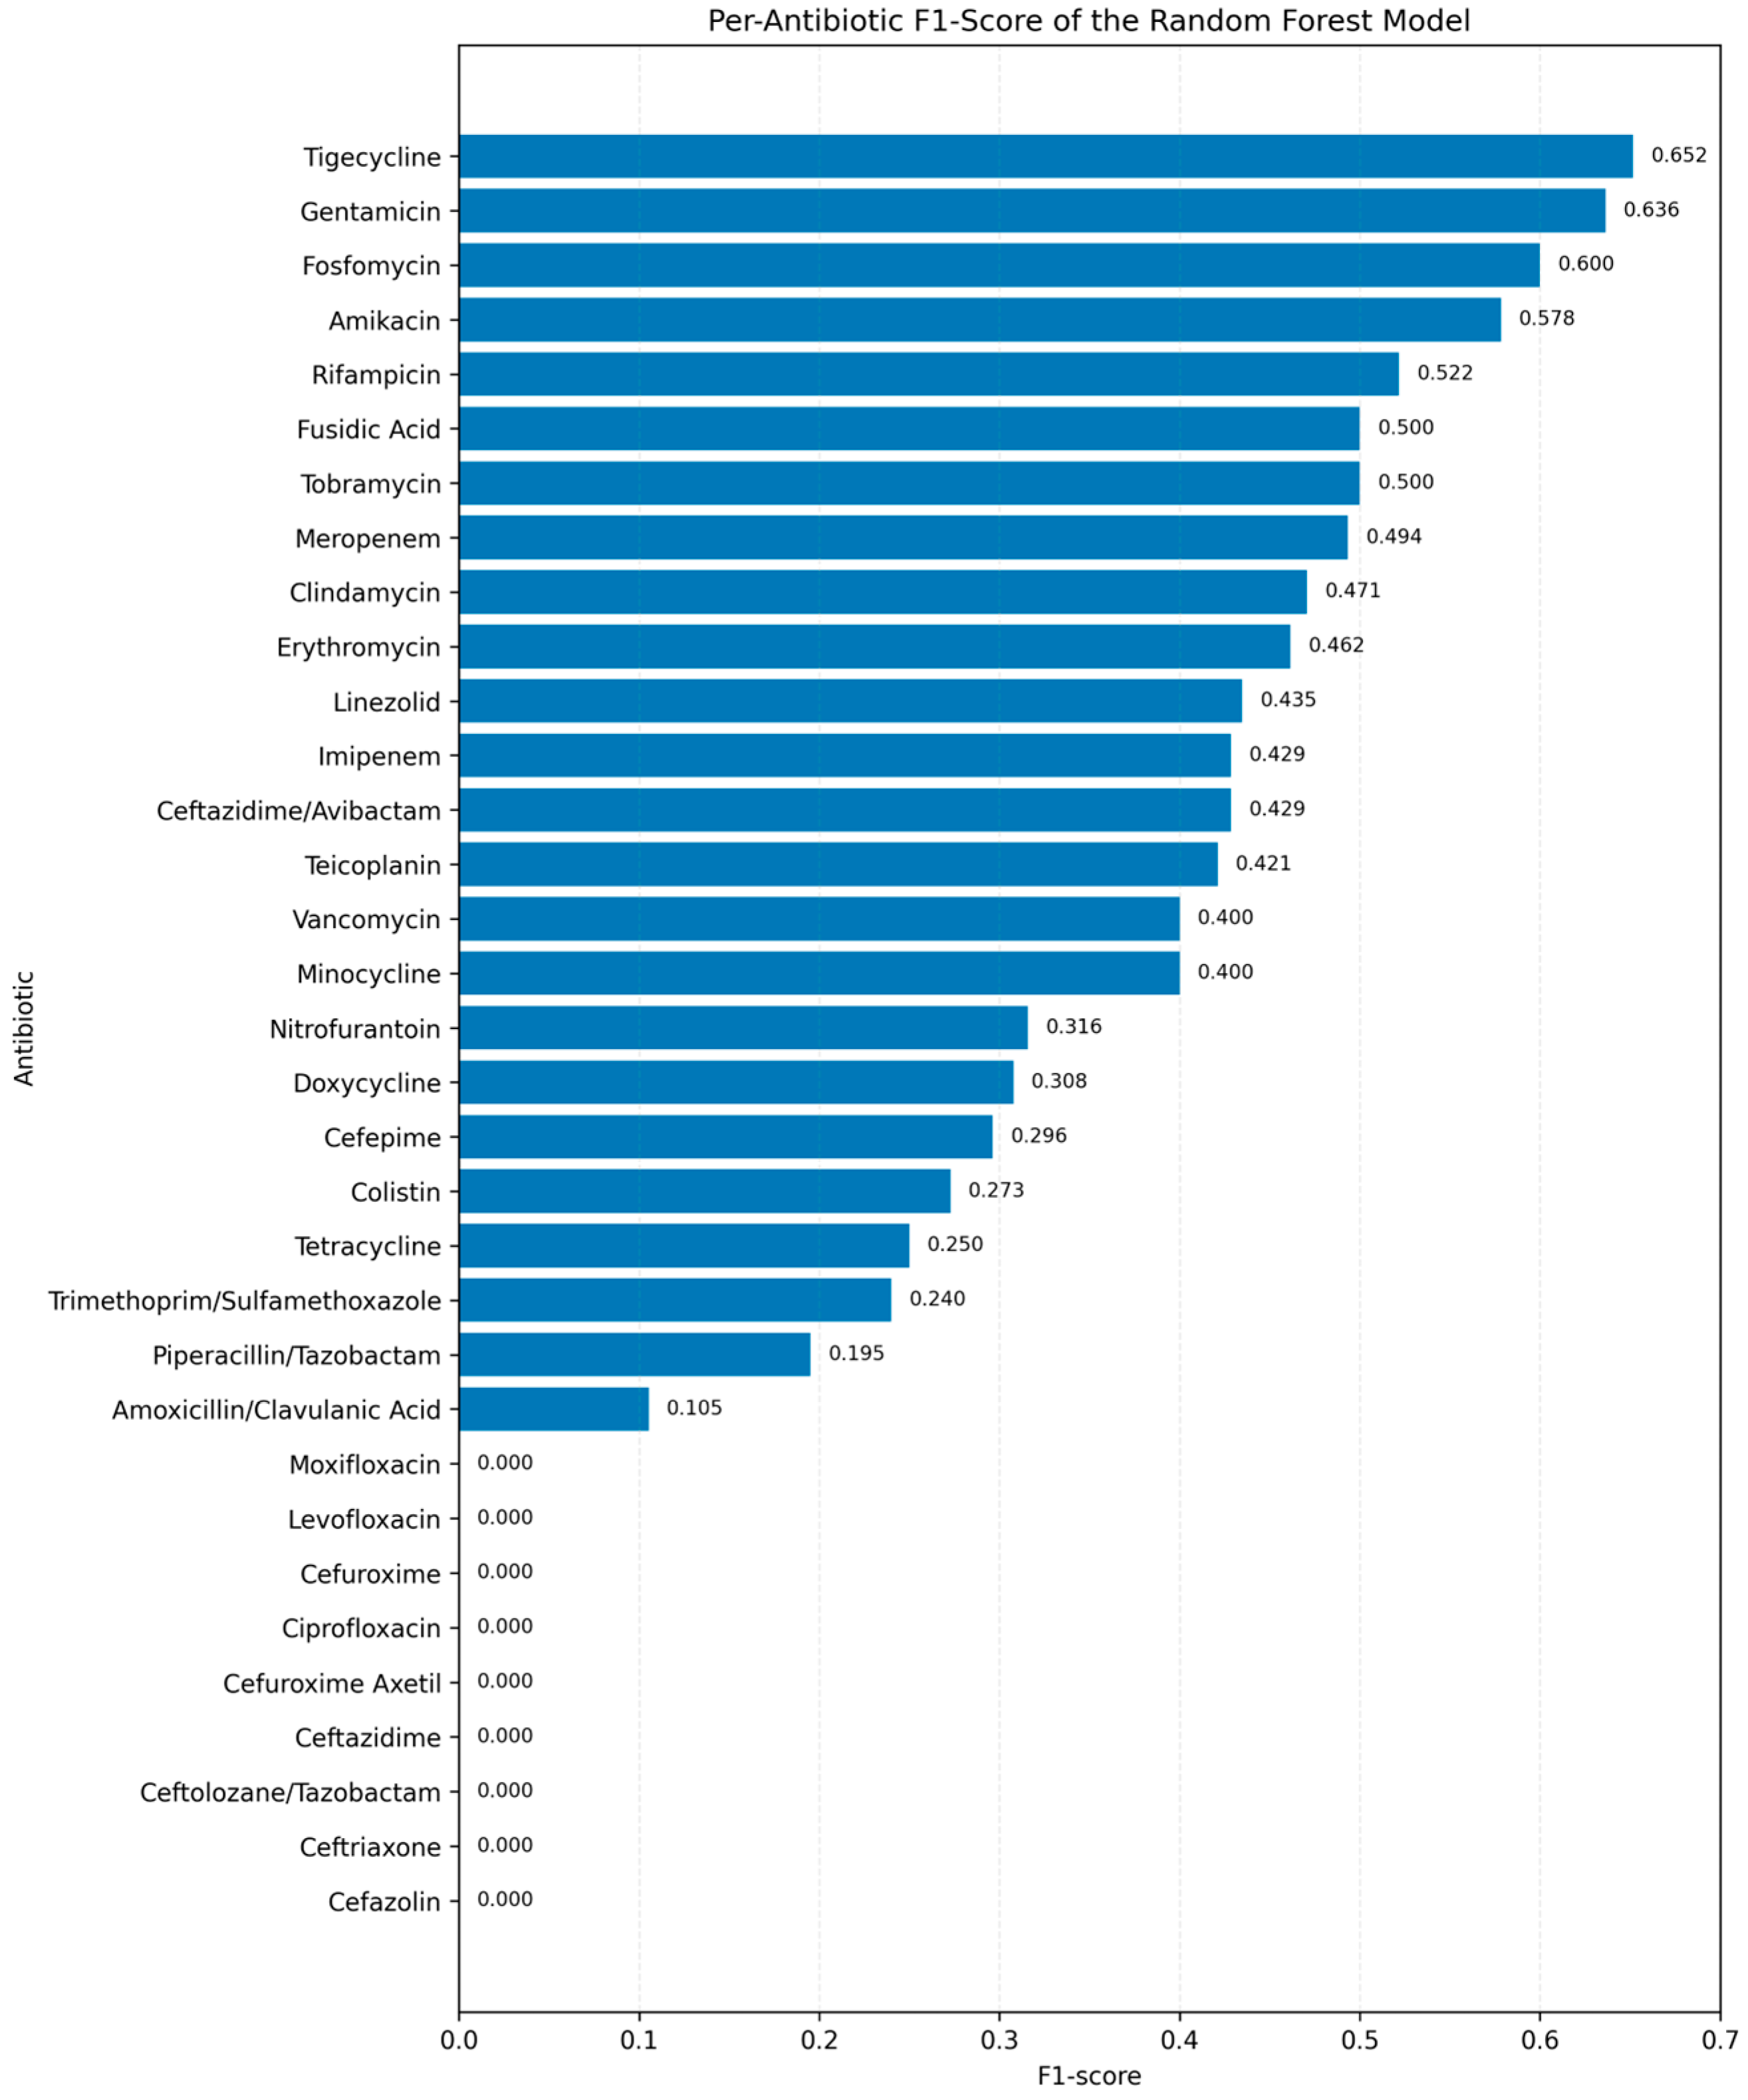
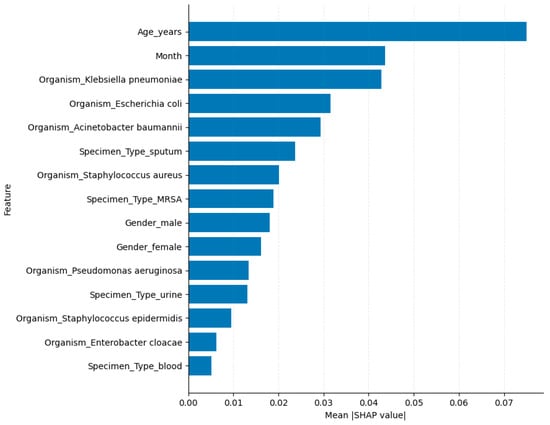
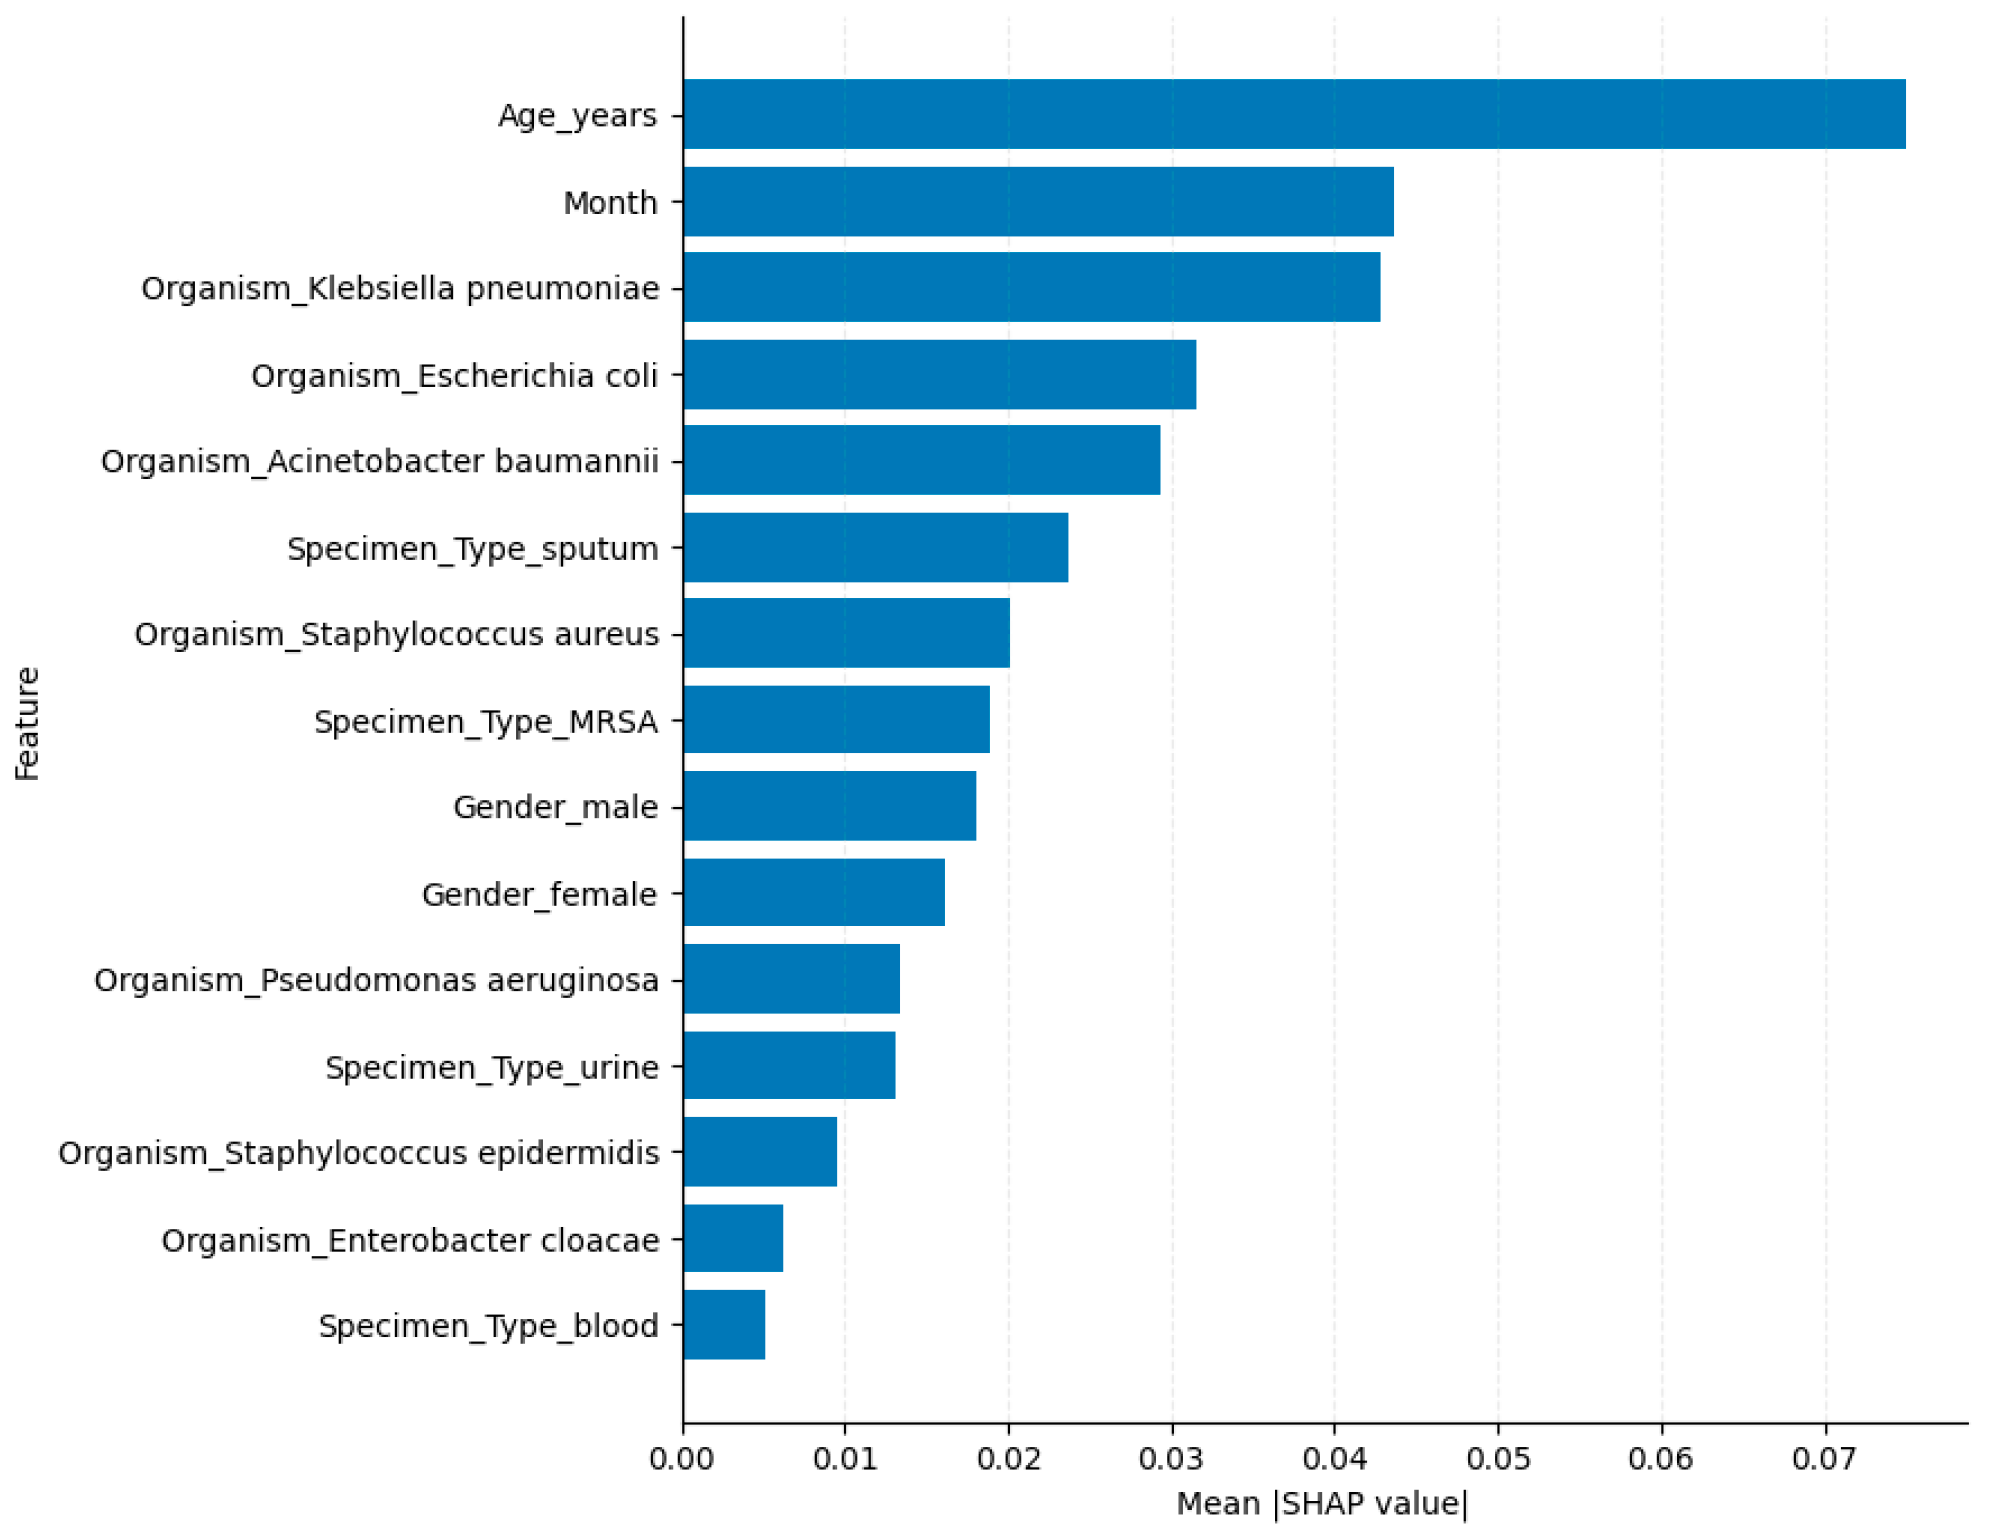
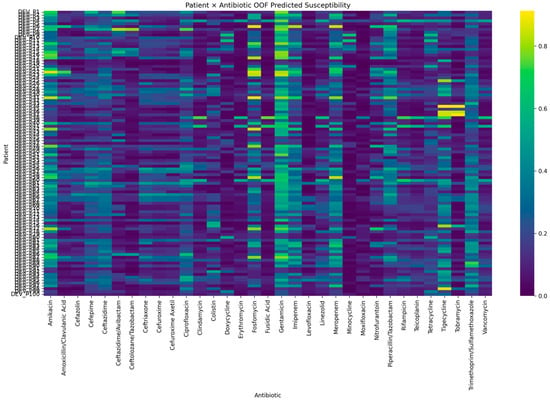
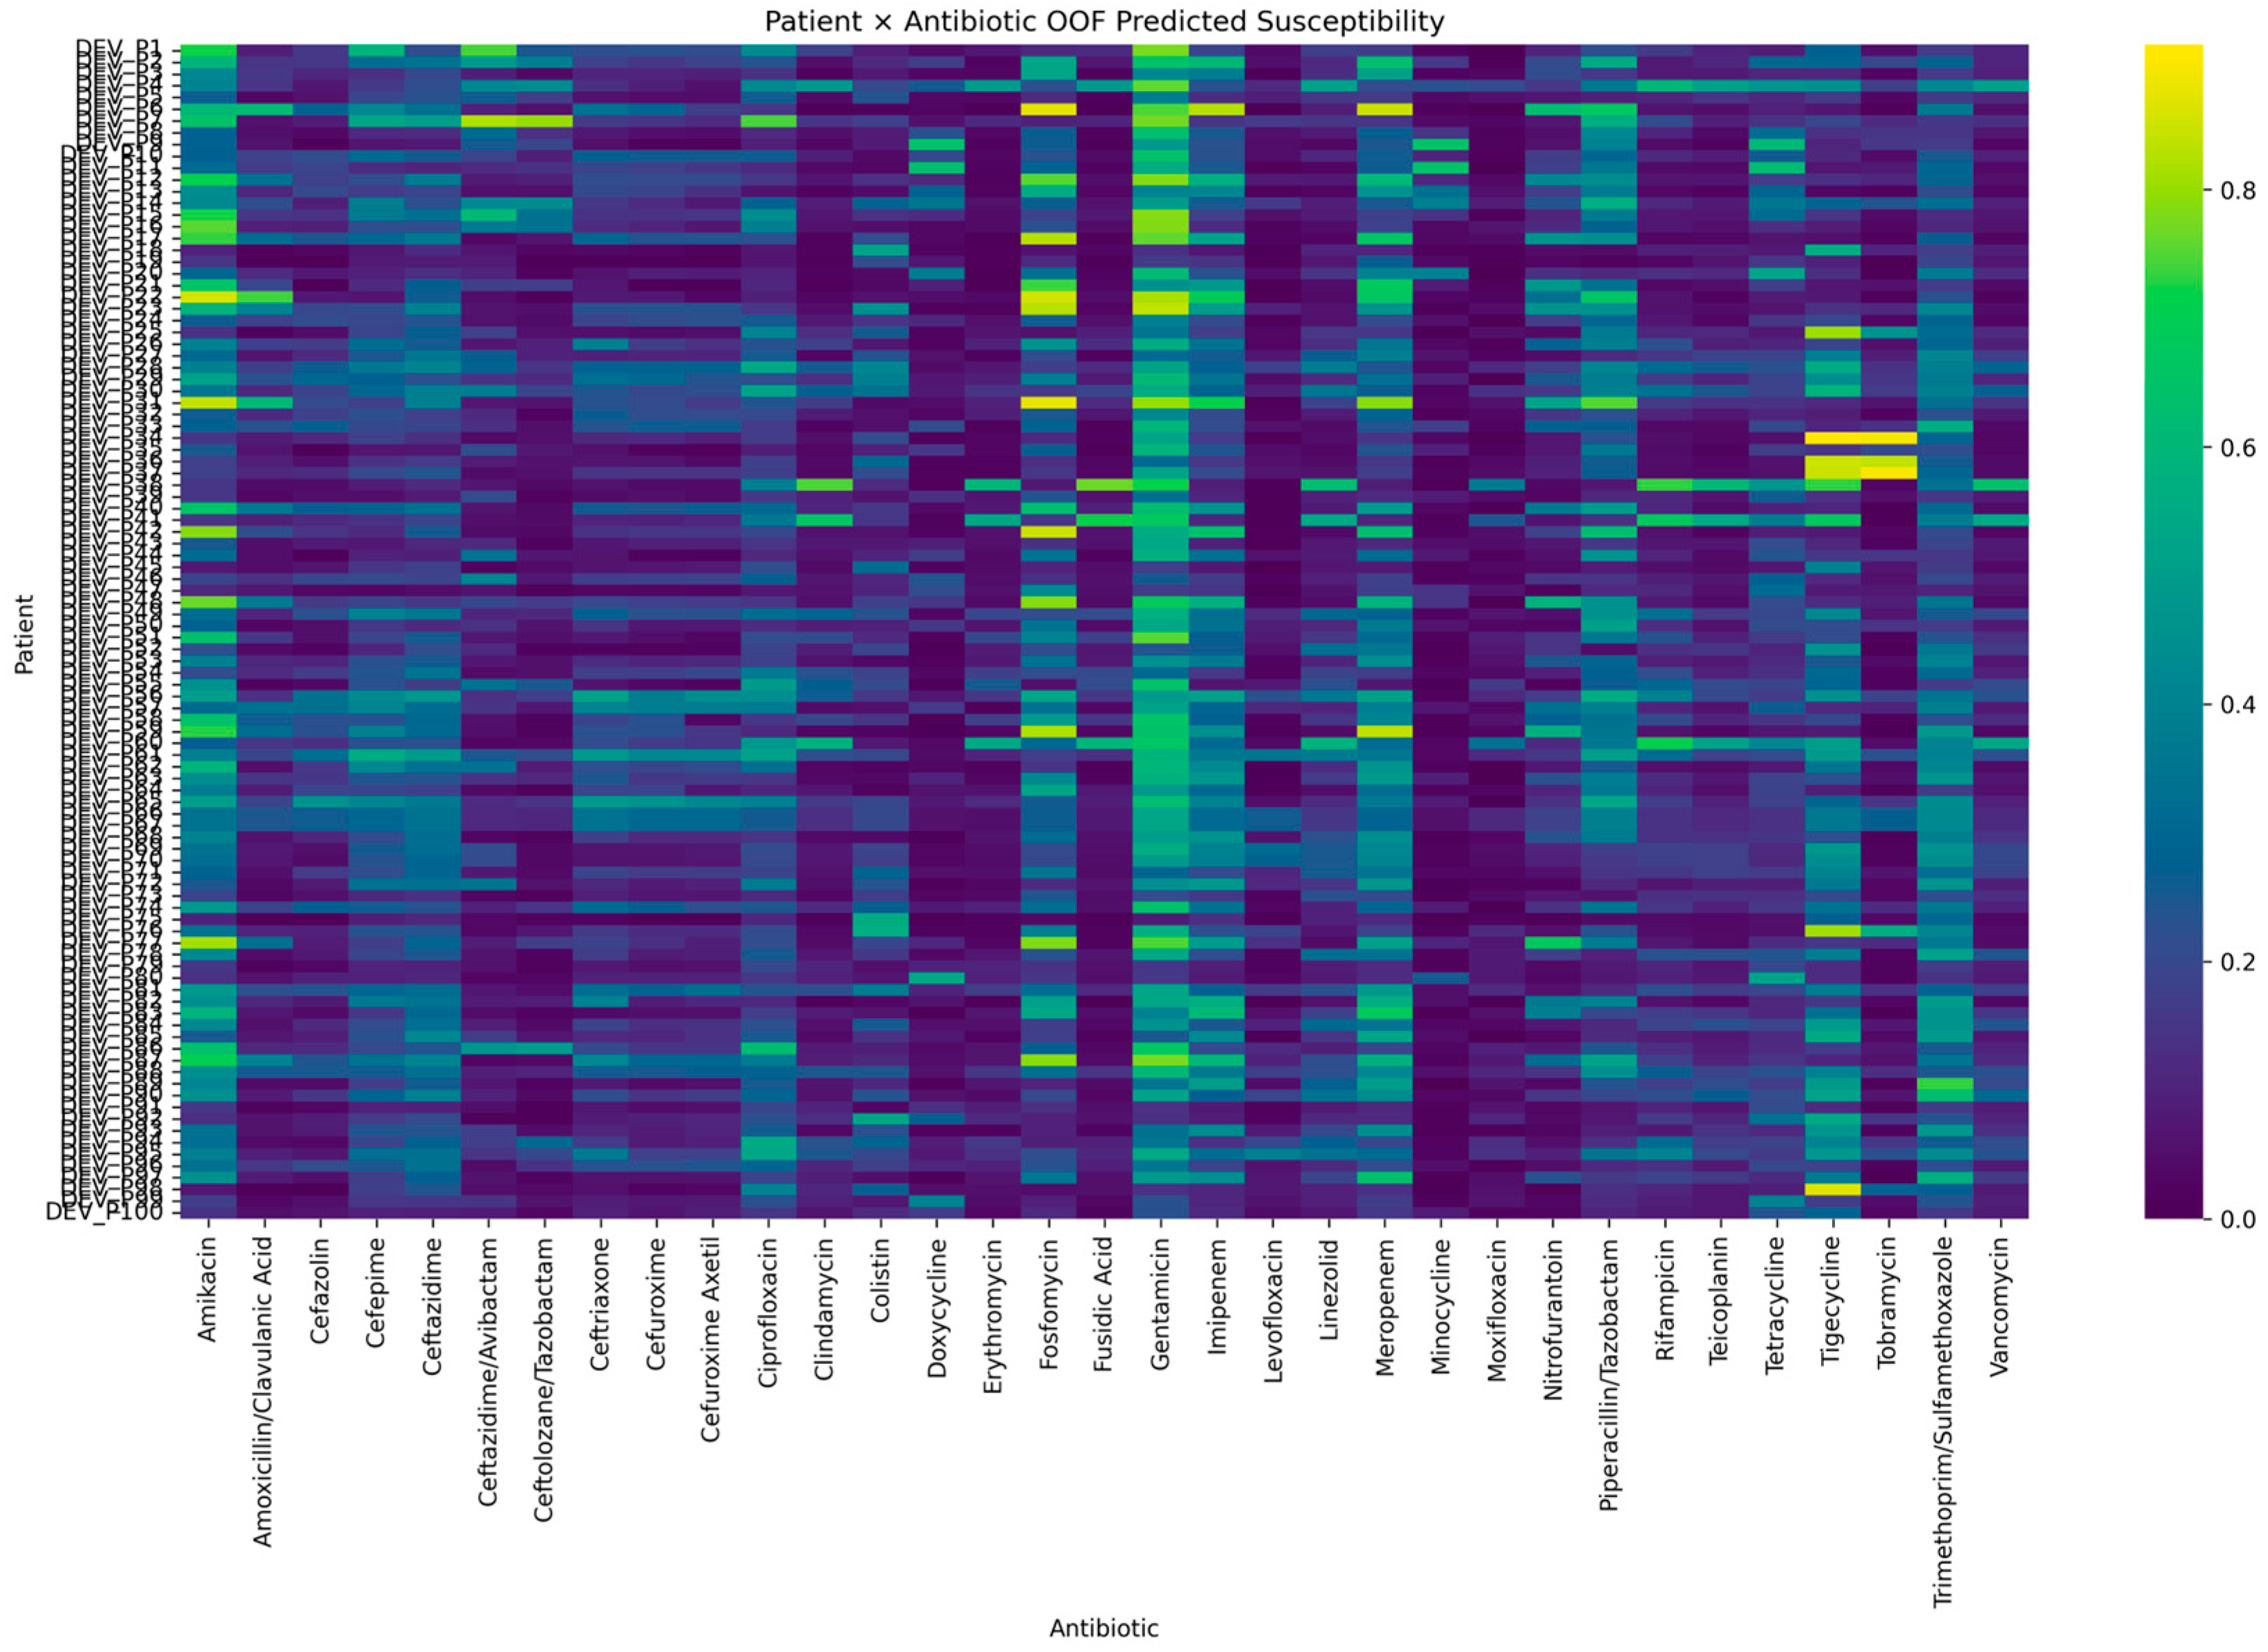
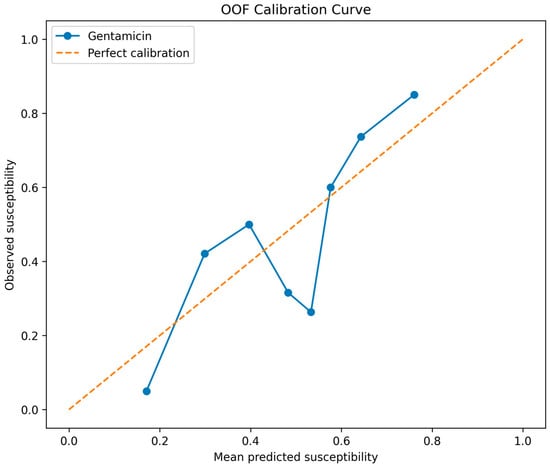
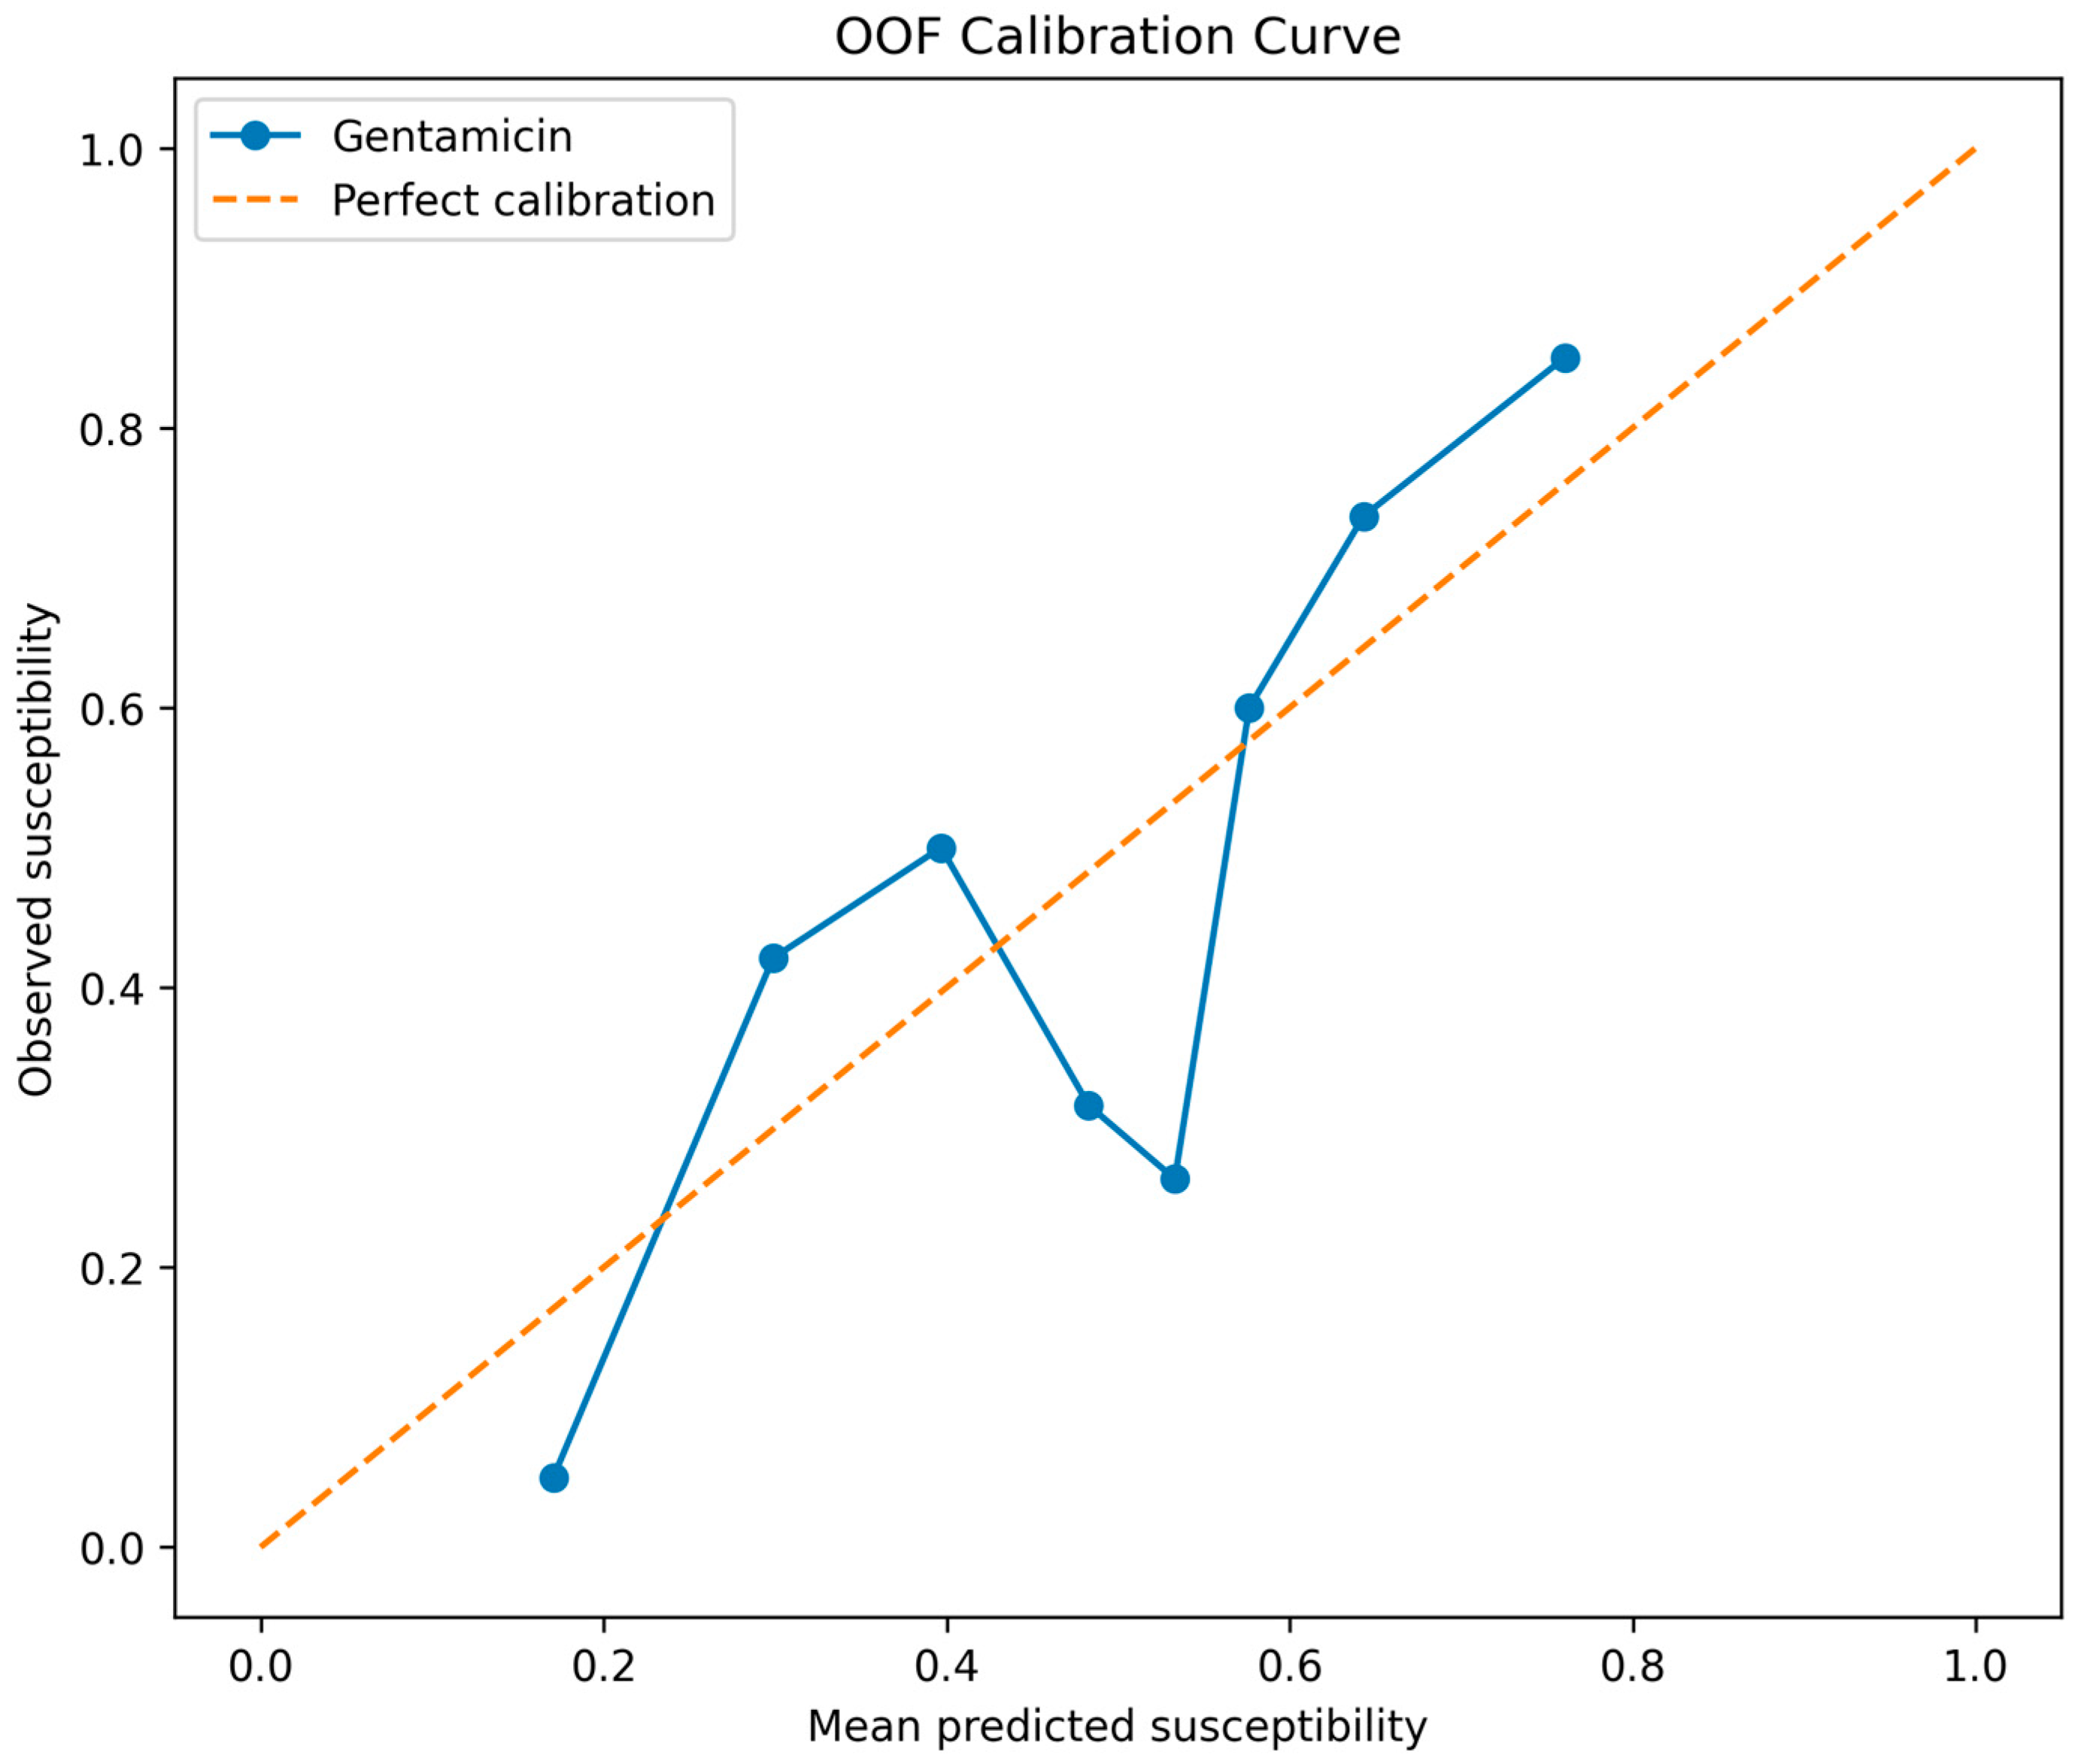
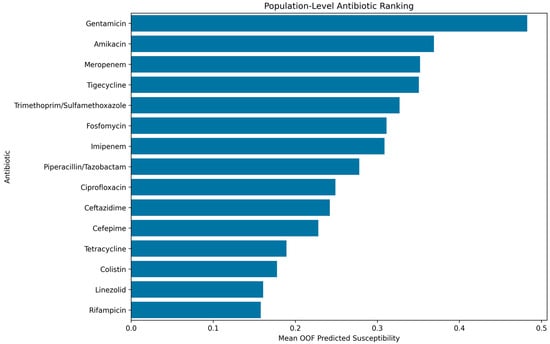

Disclaimer/Publisher’s Note: The statements, opinions and data contained in all publications are solely those of the individual author(s) and contributor(s) and not of MDPI and/or the editor(s). MDPI and/or the editor(s) disclaim responsibility for any injury to people or property resulting from any ideas, methods, instructions or products referred to in the content. |
© 2026 by the authors. Licensee MDPI, Basel, Switzerland. This article is an open access article distributed under the terms and conditions of the Creative Commons Attribution (CC BY) license.