


Abstract
Early identification of individuals with abnormal glucose metabolism is essential for timely intervention and prevention of diabetes-related complications. Routine laboratory testing generates large amounts of clinical data that may support automated glycemic classification through machine learning approaches. This study aimed to develop and evaluate a machine learning framework for the classification of HbA1c-defined glycemic status using routinely available clinical laboratory features. A retrospective dataset of 1434 individuals with available glycemic measurements was analyzed. Participants were categorized into HbA1c-defined normoglycemic, prediabetic-range, or diabetic-range groups. Three concurrent classification tasks were examined: HbA1c-defined dysglycemia classification, diabetic-range HbA1c classification, and multiclass HbA1c-defined glycemic-status classification. Demographic, biochemical, and hematological variables were used as predictors. Data preprocessing included missing-value handling, feature filtering, and outlier treatment. Several supervised learning algorithms were evaluated, including Logistic Regression, Random Forest, Gradient Boosting, Support Vector Machine, and Multinomial Logistic Regression. Model performance was assessed using train–test validation and cross-validation with accuracy, precision, recall, F1-score, and area under the receiver operating characteristic curve. For dysglycemia, Gradient Boosting achieved the highest AUC (0.848), while Random Forest achieved the highest accuracy (0.801) and sensitivity (0.908). For diabetic-range HbA1c, Random Forest achieved the highest AUC (0.864), whereas SVM achieved the highest accuracy (0.794). In multiclass classification, Random Forest achieved the highest accuracy (0.610), while Gradient Boosting achieved the highest macro-AUC (0.796) and macro-F1 score (0.603). Pairwise comparisons showed no statistically significant superiority of any classifier after Holm correction. Clinical-baseline and ablation analyses demonstrated that fasting glucose accounted for a substantial proportion of discrimination, with only modest incremental value from additional laboratory variables. These findings support cautious interpretation of routine laboratory-based classification models pending further validation and clinical-utility assessment.
1. Introduction
Diabetes mellitus is a chronic metabolic disorder characterized by persistent hyperglycemia resulting from impaired insulin secretion, reduced insulin action, or both. Its increasing prevalence is associated with substantial cardiovascular, renal, neurological, and ophthalmological morbidity. Early identification of abnormal glucose metabolism is therefore important, because timely lifestyle and therapeutic interventions may reduce the risk of long-term complications. Current diagnostic strategies rely mainly on fasting plasma glucose, oral glucose tolerance testing, and glycated hemoglobin (HbA1c). According to widely accepted thresholds, HbA1c values below 5.7% fall within the normoglycemic range, values of 5.7–6.4% fall within the prediabetic range, and values of 6.5% or greater fall within the diabetic range and may support a diagnosis of diabetes when appropriately confirmed [1,2,3,4,5,6].
Although glucose and HbA1c remain central to glycemic assessment, routinely measured hematological and biochemical parameters may provide complementary information regarding metabolic, inflammatory, renal, and vascular alterations associated with dysglycemia. Red cell distribution width (RDW) and RDW-standard deviation (RDW-SD) reflect erythrocyte size heterogeneity and have been associated with inflammation, oxidative stress, diabetes, and its complications [7,8,9,10,11,12,13,14]. Urea and sodium may reflect renal–metabolic and fluid–electrolyte disturbances related to impaired glucose metabolism [15,16,17,18], whereas platelet count, mean platelet volume (MPV), and platelet distribution width (PDW) may provide indirect information regarding platelet activation and the prothrombotic state associated with diabetes [19,20,21,22,23]. Previous work has demonstrated that several of these routinely available variables differ among non-diabetic, prediabetic, and diabetic individuals and may support the identification of patients who require further glycemic assessment [24].
Machine learning methods can complement conventional statistical analysis by identifying multivariable and potentially nonlinear relationships within routinely collected clinical data. Recent diabetes-prediction studies have evaluated logistic regression, support vector machines, tree-based ensemble methods, and other artificial intelligence approaches using demographic, clinical, biochemical, and hematological predictors [25,26,27]. These investigations support the potential utility of machine learning for risk stratification, while also emphasizing the importance of model interpretability, representative datasets, appropriate internal and external validation, and cautious clinical implementation [27,28,29]. The use of routinely available laboratory variables is particularly attractive because these measurements are inexpensive, standardized, and frequently obtained during clinical evaluation.
Therefore, the objective of the present retrospective cross-sectional study was to develop and compare statistical and machine learning models for concurrent classification of HbA1c-defined dysglycemia, diabetic-range HbA1c, and three HbA1c-defined glycemic-status categories using routinely available demographic, biochemical, and hematological parameters. We hypothesized that these variables, particularly when combined with age, would provide additional discriminatory information for concurrent HbA1c-defined glycemic-status classification. Their incremental value was evaluated relative to simple clinically relevant baselines, including fasting glucose alone and fasting glucose combined with age.
2. Materials and Methods
2.1. Study Design, Population, and Outcomes
This study was designed as a retrospective analytical investigation with the objective of developing and internally validating a machine learning framework for the classification of abnormal glycemic status using routinely available laboratory data [30,31]. The underlying hypothesis was that commonly obtained biochemical and hematological parameters, in combination with age, provide discriminatory information for concurrent classification of current HbA1c-defined glycemic status. Because all predictors and HbA1c-defined outcomes were derived from the same cross-sectional laboratory assessment, the analysis was not designed to predict future diabetes or estimate longitudinal disease risk. To achieve both robust predictive accuracy and clinical relevance, the analytical approach integrated conventional statistical techniques with contemporary machine learning methods, thereby combining interpretability with predictive performance. The dataset used in the present investigation partially overlaps with that of our previous study [24], but the current study uses an expanded dataset and addresses a distinct analytical objective, namely the development and internal evaluation of multivariable statistical and machine learning models for concurrent HbA1c-defined glycemic-status classification. The present analyses therefore extend the previous descriptive and inferential work by evaluating multiple classification algorithms, binary and multiclass outcomes, feature importance, predictor-ablation strategies, and model-validation procedures.
The dataset comprised anonymized laboratory records from adult inpatients and outpatients evaluated at the General Hospital of Thessaloniki between November 2017 and October 2018. Laboratory testing was performed as part of routine clinical evaluation. Blood specimens were collected in the morning following overnight fasting, and the hematological, biochemical, and HbA1c measurements included in the analysis were obtained during the same laboratory evaluation. Records without an available HbA1c measurement were excluded because HbA1c served as the reference measure for glycemic-status classification. Repeated records from the same individual were identified before analysis; when multiple eligible records were available, only the first eligible record was retained. Thus, each participant contributed a single observation to the final analytical dataset, preventing patient-level duplication across the training and test subsets. Following the removal of records with incomplete outcome data, the final analytical cohort consisted of 1434 participants. Candidate variables comprised age, fasting plasma glucose, albumin, sodium, urea, MCV, RDW, RDW-SD, platelet count, MPV, PDW, and RBC count. The finalized machine learning predictor set comprised age, fasting glucose, sodium, urea, MCV, RDW, RDW-SD, platelet count, MPV, and PDW. RBC was retained for the conventional multivariable logistic regression and multicollinearity analyses but was not included in the finalized machine learning feature set. These variables were selected on the basis of their potential to capture complementary biological pathways associated with glucose homeostasis, renal function, nutritional and inflammatory status, hematological alterations, and age-related metabolic decline [25].
Three outcome variables were defined exclusively according to glycated hemoglobin (HbA1c) thresholds. The primary binary outcome was HbA1c-defined dysglycemia, with the positive class comprising participants with HbA1c ≥ 5.7% (n = 1034) and the negative class comprising participants with HbA1c < 5.7% (n = 400). The secondary binary outcome was diabetic-range HbA1c, with the positive class comprising participants with HbA1c ≥ 6.5% (n = 604) and the negative class comprising participants with HbA1c < 6.5% (n = 830). For the multiclass task, participants were categorized into three HbA1c-defined glycemic-status groups: normoglycemic (HbA1c < 5.7%), prediabetic-range (HbA1c 5.7–6.4%), and diabetic-range (HbA1c ≥ 6.5%). These categories represent laboratory-defined glycemic ranges used as study outcomes and should not be interpreted as independently confirmed clinical diagnoses of diabetes or prediabetes.
2.2. Data Preprocessing and Statistical Analysis
A structured and methodologically rigorous preprocessing pipeline was applied prior to model development. Initially, variable names were standardized to ensure consistency and reproducibility, while non-informative identifier fields were removed because they carried no predictive relevance and could introduce spurious associations. Subsequently, all eligible predictors were converted to numeric format where required in order to ensure compatibility with downstream statistical and machine learning algorithms [32]. The overall analytical workflow is illustrated in Figure 1.
Figure 1.
Workflow of the proposed machine learning framework for HbA1c-defined glycemic-status classification.
The extent and distribution of missing data were systematically assessed across all candidate variables. For each candidate variable, the number and percentage of missing observations were quantified overall and separately across the three HbA1c-defined glycemic-status groups. Variables with more than 40% missing observations were excluded from model development; accordingly, albumin was excluded because 55.8% of its values were missing. Differences in missingness across glycemic groups were assessed using missingness indicators and contingency-table comparisons. In addition, univariable missing-indicator analyses were performed for the two binary HbA1c-defined outcomes to examine whether the probability of a value being missing was associated with glycemic-status classification. For the remaining variables, missing observations were imputed using the median value of each feature. Median imputation was selected because several laboratory parameters demonstrated skewed, non-Gaussian distributions and were potentially influenced by outliers, rendering the median a more robust estimator of central tendency than the mean. Importantly, all preprocessing and imputation procedures were embedded within the training pipeline and applied separately within each resampling iteration, thereby preventing information leakage between training and testing subsets. To assess the sensitivity of the findings to the missing-data strategy, the finalized machine learning models were additionally rerun in participants with complete data for all finalized machine learning predictors. The same model configurations, class-imbalance handling, outlier treatment, and evaluation framework used in the primary analysis were retained, except that no imputation was required in the complete-case dataset [33].
Following data cleaning and imputation, model-specific feature importance analyses were performed to quantify the relative contribution of each predictor to model performance. Because different machine learning algorithms estimate feature importance using different methodologies, the interpretation approach was adapted accordingly. For Random Forest, feature importance was quantified using the impurity-based importance scores derived during model training. For Gradient Boosting and SVM, permutation importance was calculated by randomly permuting the values of each predictor across observations while preserving its marginal distribution and measuring the corresponding decrease in predictive performance. For Logistic Regression, standardized regression coefficients were examined with their original signs preserved, allowing both the magnitude and direction of the association with the modeled outcome to be interpreted. Predictors producing larger decreases in performance or larger standardized coefficients were considered more influential for classification. These analyses provided complementary information regarding the contribution of individual predictors across different modeling approaches [34]. The use of model-specific feature importance methods provided global assessment of predictor contribution while respecting the methodological characteristics of each algorithm. Consequently, the proposed preprocessing and global model-interpretation framework not only ensured high-quality input data but also facilitated a systematic assessment of predictor contributions across different machine learning approaches [35]. These methods provide global information on predictor contribution but do not explain individual predictions, quantify prediction uncertainty, or fully characterize nonlinear feature effects and interactions. Accordingly, the present analyses are interpreted as global model-interpretation analyses rather than comprehensive explainable-AI methods.
Variables exhibiting zero or near-zero variance were excluded prior to model fitting, as predictors with minimal variability offer negligible discriminatory capacity and may unnecessarily increase model complexity without contributing meaningful information [36]. Extreme values in continuous predictors were addressed through an interquartile range (IQR)-based winsorization procedure, whereby observations lying beyond the conventional lower and upper IQR thresholds were capped at the respective boundary values. This approach was adopted to reduce the undue influence of extreme observations while preserving the overall structure and sample size of the dataset.
Four predictor configurations were evaluated. The primary analysis compared two feature sets (with age and without age) to quantify the incremental contribution of age [37]. In addition, an ablation analysis was performed using two supplementary predictor configurations: (i) all predictors except fasting glucose while retaining age (No glucose, with age), and (ii) non-glycemic laboratory variables only, excluding both fasting glucose and age. The same preprocessing procedures and validation strategy were applied across all predictor configurations to ensure direct comparability.
Comprehensive descriptive statistics were generated for all study variables. Continuous predictors were summarized using measures of central tendency and dispersion, including the mean, standard deviation, median, interquartile range, and observed minimum–maximum range. Distributional assumptions were formally assessed using the Shapiro–Wilk test. As the majority of variables demonstrated statistically significant departures from normality, nonparametric methods were adopted for inferential analyses [38].
Differences among the three glycemic categories were examined using the Kruskal–Wallis test. For the two binary outcomes, univariable logistic regression models were initially fitted to estimate the crude association between each predictor and the respective outcome. Predictors demonstrating clinical relevance and/or statistical evidence of association in the univariable analyses were subsequently entered into multivariable logistic regression models to evaluate their independent effects after adjustment for potential confounding [39]. Effect estimates are presented as odds ratios (ORs) with corresponding 95% confidence intervals (CIs) and two-sided p-values. Statistical significance was defined a priori as p < 0.05.
Potential multicollinearity among predictors included in the multivariable logistic regression models was assessed using Variance Inflation Factors (VIFs). VIF values below 5 were considered indicative of acceptable collinearity, whereas values slightly exceeding this threshold were interpreted cautiously in the context of biologically related hematological variables.
2.3. Machine Learning Development, Validation, and Model Interpretation
Several supervised learning algorithms representing distinct methodological families were systematically evaluated. Logistic Regression was employed as an interpretable linear baseline model, providing transparent coefficient-based estimates of predictor effects. Random Forest and Gradient Boosting were selected as ensemble tree-based methods because of their ability to capture nonlinear relationships, complex decision boundaries, and higher-order interactions among predictors. A Support Vector Machine with a radial basis function kernel was additionally included as a margin-based nonlinear classifier capable of handling potentially intricate class separation patterns. For the multiclass glycemic categorization task, Multinomial Logistic Regression was also implemented. This comparative analytical framework enabled the simultaneous assessment of highly interpretable statistical models alongside more flexible and potentially higher-performing machine learning approaches [40].
Model configurations were initially prespecified on the basis of published recommendations, commonly used model settings, and preliminary analyses restricted to the training data. To evaluate the sensitivity of model performance to these configuration choices and improve reproducibility, a structured set of alternative hyperparameter configurations was subsequently assessed using stratified 10-fold cross-validation exclusively within the training set. Candidate values and the number of configurations evaluated for each algorithm are reported in Table 1. Mean cross-validated AUC was used as the evaluation criterion for the two binary classification tasks, whereas macro-averaged one-versus-rest AUC was used for multiclass classification. The alternative configurations produced only small differences in cross-validated discrimination relative to the prespecified configurations used in the primary analysis (maximum ΔAUC = 0.0135). Therefore, to avoid post hoc optimization of the finalized models, the prespecified configurations were retained for the reported independent test-set and secondary analyses. The independent test set was not accessed for configuration assessment or model-selection decisions.
Table 1.
Prespecified hyperparameter ranges evaluated and final model configurations used in the analysis.
For all classification tasks, the dataset was partitioned into training and testing subsets using a stratified 80:20 split with random_state = 42, resulting in an independent test set of 287 participants. Stratification preserved the original class distribution across subsets. Stratified 10-fold cross-validation was employed exclusively on the training set during model development and structured hyperparameter-configuration assessment [41]. Class imbalance was handled consistently across classifiers. Logistic Regression, Random Forest, and Support Vector Machine used inverse-frequency class weighting through class_weight = “balanced”. Because the Gradient Boosting implementation did not provide an equivalent class-weight parameter, balanced sample weights derived from the training labels were supplied during model fitting. For multiclass Logistic Regression, balanced class weighting was likewise applied. All class weights or sample weights were calculated exclusively from the corresponding training data within each model-development or validation iteration.
The independent test set was not used during model development or hyperparameter-configuration assessment and was reserved solely for final performance evaluation, thereby preventing information leakage and optimistic performance estimation.
To assess the stability of model performance beyond the single hold-out split, an additional repeated stratified cross-validation analysis was performed using 5-fold cross-validation repeated three times (15 resampling iterations per model and outcome). The same preprocessing, class-imbalance handling, and model configurations used in the primary analysis were applied independently within each resampling iteration. Mean accuracy, F1-score, and AUC (macro-AUC for the multiclass task), together with their standard deviations, were calculated across repetitions. This repeated validation analysis was considered a robustness assessment complementary to, rather than a replacement for, the independent 20% test-set evaluation.
Uncertainty around test-set performance estimates was quantified using 2000 patient-level nonparametric bootstrap resamples. Performance metrics were recalculated across bootstrap samples, and 95% confidence intervals were obtained from the corresponding empirical distributions. The participant was used as the resampling unit to preserve the dependence among model predictions generated for the same individuals. For multiclass classification, the one-versus-rest macro-AUC was recalculated within each bootstrap sample before deriving the empirical 95% confidence interval.
Model performance for the two binary outcomes was evaluated using accuracy, sensitivity, specificity, positive predictive value (PPV), negative predictive value (NPV), F1-score, balanced accuracy, and the area under the receiver operating characteristic curve (AUC-ROC). For the multiclass outcome, performance was assessed using overall accuracy, macro-precision, macro-recall, macro-F1 score, and one-versus-rest macro-AUC. The use of multiple complementary indices enabled a more comprehensive evaluation of classification performance, particularly in the presence of class imbalance [42]. Confusion-matrix analysis was additionally used to characterize the operating characteristics and false-positive burden of the high-sensitivity Random Forest dysglycemia classifier.
For the two binary classification tasks, probability calibration was additionally assessed on the independent test set using the Brier score, calibration intercept, and calibration slope. A calibration intercept of 0 and slope of 1 were considered indicative of ideal calibration. Calibration curves were generated by comparing mean predicted probabilities with observed event frequencies across probability bins.
Exploratory clinical utility was assessed using decision-curve analysis across threshold probabilities from 0.05 to 0.80. Net benefit was calculated for each classifier and compared with the default strategies of classifying all participants as positive (“treat all”) or none as positive (“treat none”). These analyses were interpreted as internal exploratory assessments and not as evidence of established clinical utility or implementation readiness.
Model interpretability was examined using model-specific feature importance techniques to quantify the relative contribution of individual predictors to classification performance. Because different machine learning algorithms estimate predictor importance using different methodologies, the interpretation approach was adapted accordingly. Random Forest importance was estimated using impurity-based importance scores derived during model training. For Gradient Boosting and SVM, permutation importance was calculated by sequentially randomizing each predictor and quantifying the resulting decrease in predictive performance, thereby providing a model-agnostic estimate of variable relevance [43,44]. For Logistic Regression, standardized regression coefficients were reported with their original signs preserved, allowing both the magnitude and direction of association with the modeled outcome to be interpreted. Predictor ranking was based on the absolute magnitude of the standardized coefficient, while the signed coefficient itself was retained to indicate the direction of association. This complementary interpretability framework enabled evaluation of whether clinically plausible predictors, including fasting glucose, age, urea, and hematological indices, consistently contributed to model predictions across different machine learning algorithms.
The study was conducted according to the Declaration of Helsinki and its latest amendments. Ethical approval for the study was obtained from the Administration and the Scientific Committee of the General Hospital in Thessaloniki with protocol number 6/26/4/2018 on 26 April 2018. The confidentiality of the participants was meticulously maintained, and personal privacy was thoroughly respected. All laboratory records were anonymized prior to analysis, and no identifiable personal information was accessed during the study.
All analyses were conducted in Python 3.13 using pandas for data management, NumPy for numerical operations, SciPy and statsmodels for statistical analyses, and scikit-learn for preprocessing, model development, validation, calibration, and performance evaluation [45].
3. Results
The findings are presented according to the sequential stages of the analytical strategy, encompassing descriptive characterization, inferential analysis, classification modeling, validation, and global model-interpretation assessment. Initially, demographic, biochemical, and hematological variables were examined across glycemic categories in order to identify statistically significant and clinically relevant differences associated with metabolic status. Subsequently, multivariable logistic regression models were fitted to evaluate independent associations with HbA1c-defined dysglycemia and diabetic-range HbA1c after adjustment for potential confounding factors. Thereafter, supervised machine learning algorithms were comparatively evaluated for both binary and multiclass classification tasks using multiple complementary performance metrics, thereby enabling a comprehensive assessment of discrimination and classification performance [46]. Finally, interpretability analyses were performed to quantify the relative contribution of individual predictors and to evaluate the biological and clinical plausibility of the resulting predictive models [26]. The reported performance values correspond to the independent test set after model development and internal cross-validation performed exclusively on the training data.
The study cohort was substantially enriched for abnormal HbA1c-defined glycemic status. Overall, 1034 of 1434 participants (72.1%) met the study definition of dysglycemia, while 604 participants (42.1%) had HbA1c values in the diabetic range. This distribution should be considered when interpreting prevalence-dependent performance measures such as PPV and NPV.
The missing-data profile of the candidate analytical variables was examined before model development. Table 2 summarizes the number and percentage of missing observations overall and across the three HbA1c-defined glycemic-status groups. Albumin showed the highest proportion of missing values (55.8%), whereas sodium, platelet count, and PDW also exhibited substantial missingness.
Table 2.
Missing-data profile of candidate analytical variables across HbA1c-defined glycemic-status groups.
Missingness differed significantly across HbA1c-defined glycemic-status groups for sodium (p = 0.0035) and more weakly for platelet count (p = 0.0491). Missing-indicator analyses further showed associations between sodium missingness and both binary outcomes, as well as between platelet and PDW missingness and diabetic-range HbA1c. Therefore, a completely random missing-data mechanism cannot be assumed.
Table 3 summarizes the distribution of the candidate predictors in the study cohort according to glycemic category. The final analytical dataset included 1434 participants with available glycated hemoglobin measurements, comprising 400 participants in the HbA1c-defined normoglycemic group, 430 in the prediabetic-range group, and 604 in the diabetic-range group.
Table 3.
Descriptive statistics of the finalized machine learning predictors.
Age differed significantly among groups, increasing from a median of 53 years in the normoglycemic group to 66 years in the prediabetic-range group and 69 years in the diabetic-range group. Fasting glucose increased from 89 mg/dL in the normoglycemic group to 103 mg/dL in the prediabetic-range group and 139 mg/dL in the diabetic-range group. Urea also increased progressively across categories, from 32 mg/dL in the normoglycemic group to 36 mg/dL in the prediabetic-range group and 41 mg/dL in the diabetic-range group. Although sodium showed a statistically significant difference, the median values were nearly identical across groups, indicating limited clinical relevance.
Among erythrocyte indices, MCV showed a small but significant difference, with slightly lower values in participants in the diabetic-range HbA1c group. RDW and RDW-SD increased across glycemic categories, indicating greater anisocytosis across progressively higher HbA1c-defined glycemic-status categories. Platelet count did not differ significantly among groups, while MPV showed only a non-significant upward trend. PDW reached statistical significance, but the identical median values across groups suggest that the absolute difference was small.
Overall, the cohort consisted mainly of middle-aged and older adults, with progressively higher age across worsening glycemic categories. Fasting glucose also increased clearly from the normoglycemic to the prediabetic-range and diabetic-range groups, supporting the validity of the glycemic classification. Among the biochemical variables, urea showed a progressive increase across groups, whereas sodium differed statistically but showed minimal absolute variation. Hematological variables, particularly RDW and RDW-SD, were higher in dysglycemic groups, suggesting greater erythrocyte size heterogeneity in individuals with impaired glucose metabolism. Platelet count and MPV showed no significant group differences, while PDW reached statistical significance despite similar median values across categories.
Consistent with the results of the normality assessment described in the Materials and Methods section, group comparisons were performed using nonparametric statistical tests. The descriptive characteristics of the study population are summarized in Table 3.
Multivariable logistic regression was performed to identify independent predictors of dysglycemia. The results are shown in Table 4.
Table 4.
Multivariable logistic regression for dysglycemia.
In the multivariable model for HbA1c-defined dysglycemia, fasting glucose showed the strongest adjusted association with the outcome. Each 1 mg/dL increase in fasting glucose was associated with higher odds of HbA1c-defined dysglycemia. Age also remained independently associated with dysglycemic status, confirming the contribution of demographic risk to abnormal glucose metabolism. Urea was independently associated with dysglycemia, suggesting that renal or metabolic burden may provide additional information beyond glucose and age.
Platelet count was also retained as a significant predictor, although the effect size per unit was small and should be interpreted in relation to the measurement scale. MCV showed an inverse association with dysglycemia, indicating that lower MCV values were independently associated with abnormal glycemic status. Overall, higher glucose, older age, increased urea, higher platelet count, and lower MCV were independently associated with dysglycemia. The multivariable logistic regression model for diabetic-range HbA1c is presented in Table 5.
Table 5.
Multivariable logistic regression for diabetic-range HbA1c.
In the multivariable logistic regression model, glucose remained the strongest independent predictor of diabetic-range HbA1c classification (OR = 1.045, 95% CI: 1.040–1.051, p < 0.001). Urea (OR = 1.016, 95% CI: 1.007–1.025, p < 0.001) and age (OR = 1.016, 95% CI: 1.005–1.027, p = 0.005) also remained independently associated with diabetic-range HbA1c status after adjustment for the remaining laboratory variables. None of the hematological indices, including RDW, RDW-SD, MCV, platelet count, MPV, PDW, or sodium, retained independent statistical significance in the multivariable model. These findings indicate that diabetic-range HbA1c status was primarily associated with fasting glucose together with age and urea, whereas the additional hematological variables did not retain independent statistical significance after multivariable adjustment.
Multicollinearity was generally limited, although RDW showed a VIF slightly above the conventional threshold of 5 (VIF = 5.43), while RDW-SD approached this threshold (VIF = 4.63). This finding was interpreted cautiously given the biological and mathematical relationship between these erythrocyte-distribution indices. All remaining predictors exhibited VIF values below 3, suggesting no evidence of substantial multicollinearity that would materially affect interpretation of the logistic regression coefficients (Table 6).
Table 6.
Variance Inflation Factors (VIFs) for predictors.
Machine learning models were then evaluated for HbA1c-defined dysglycemia classification using feature sets with and without age. The comparative performance of the models is shown in Table 7.
Table 7.
Performance of consistently weighted classifiers for HbA1c-defined dysglycemia.
Under consistent class-imbalance handling, the evaluated classifiers showed broadly comparable discrimination for HbA1c-defined dysglycemia, with AUCs ranging from 0.826 to 0.848. Gradient Boosting achieved the numerically highest AUC (0.848; 95% bootstrap CI 0.801–0.889), whereas Random Forest achieved the highest accuracy (0.801), sensitivity (0.908), and F1-score (0.868). Logistic Regression achieved the highest specificity (0.850) and PPV (0.924). These findings demonstrate a clear sensitivity–specificity trade-off and do not support overall superiority of a single classifier.
The full-model results therefore indicate that the relative ranking of algorithms depends on the evaluation metric: Gradient Boosting provided the highest discrimination, Random Forest favored sensitivity and overall accuracy, and Logistic Regression favored specificity. This metric-dependent pattern was considered in the subsequent pairwise and clinical-baseline analyses.
To further characterize the sensitivity–specificity trade-off, the Random Forest dysglycemia classifier was examined using threshold-dependent metrics and its confusion matrix. The model achieved a sensitivity of 0.908, specificity of 0.525, PPV of 0.832, NPV of 0.689, and false-positive rate of 0.475. The confusion matrix (Figure 2) showed 188 true-positive, 42 true-negative, 38 false-positive, and 19 false-negative classifications. Thus, 47.5% of normoglycemic participants were incorrectly classified as dysglycemic at the evaluated operating point. Based on the observed PPV, approximately 1.20 model-positive individuals would require confirmatory testing to identify one true-positive dysglycemia case in this enriched test cohort. This quantity is prevalence-dependent and should not be extrapolated directly to general screening populations.
Figure 2.
Confusion matrix for the Random Forest dysglycemia classifier.
The comparative performance of the models for diabetic-range HbA1c classification is shown in Table 8.
Table 8.
Performance of consistently weighted classifiers for diabetic-range HbA1c.
For diabetic-range HbA1c classification, Random Forest achieved the highest discrimination (AUC = 0.864; 95% bootstrap CI 0.820–0.904), whereas SVM achieved the highest accuracy (0.794), specificity (0.855), F1-score (0.745), and balanced accuracy (0.783). Gradient Boosting achieved the highest sensitivity (0.727). The differences among the leading classifiers were modest and depended on the selected performance metric.
Logistic Regression also demonstrated useful discrimination (AUC = 0.833), while Gradient Boosting and SVM achieved AUCs of 0.859 and 0.853, respectively. These results again indicate that no single algorithm dominated across discrimination, sensitivity, specificity, and overall classification accuracy.
Accordingly, the primary model comparison was interpreted as a comparison of complementary performance profiles rather than as evidence that one algorithm was uniformly superior.
The multiclass classification task, which distinguished the three HbA1c-defined glycemic categories, is summarized in Table 9.
Table 9.
Performance of consistently weighted classifiers for multiclass HbA1c-defined glycemic status.
Multiclass classification was more challenging than the binary tasks. Random Forest achieved the highest accuracy (0.610), whereas Gradient Boosting achieved the highest macro-F1 score (0.603), macro-recall (0.603), and macro-AUC (0.796; 95% bootstrap CI 0.755–0.834). The corresponding macro-AUC values for Logistic Regression, Random Forest, and SVM were 0.779, 0.793, and 0.786, respectively. The small differences across classifiers again indicate that no single algorithm consistently dominated across all evaluation criteria.
To assess whether the reported findings depended strongly on the single 80:20 partition, repeated stratified 5-fold cross-validation with three repetitions was additionally performed using the finalized modeling pipeline. The repeated-validation results were broadly consistent with the held-out test-set findings (Table 10).
Table 10.
Repeated stratified cross-validation performance.
Across repeated resampling, mean AUCs varied only modestly among classifiers. For dysglycemia, mean AUC ranged from 0.842 to 0.849, and for diabetic-range HbA1c, from 0.854 to 0.869; for the multiclass task, macro-AUC ranged from 0.800 to 0.810. The relatively small between-model differences and low-to-moderate standard deviations indicate that the overall pattern of discrimination was stable across repeated data partitions and further support the conclusion that no single classifier consistently dominated.
To provide a comprehensive statistical comparison among classifiers, all pairwise model comparisons were performed across the dysglycemia, diabetic-range HbA1c, and multiclass classification tasks. Differences in AUC were evaluated using paired patient-level bootstrap comparisons, whereas differences in paired classification errors were assessed using McNemar’s test. To account for multiple pairwise testing, p-values from the AUC and McNemar comparisons were adjusted separately within each classification task using the Holm procedure. The complete pairwise results are presented in Table 11.
Table 11.
Pairwise statistical comparisons of classifier performance after correction for multiple comparisons.
Pairwise comparisons demonstrated only small numerical differences in discrimination among the evaluated classifiers. For diabetic-range HbA1c, the Logistic Regression–Random Forest comparison yielded an unadjusted AUC p-value of 0.024, but this difference was no longer statistically significant after Holm correction (adjusted p = 0.144). No pairwise AUC comparison remained statistically significant after correction for multiple testing in the dysglycemia, diabetic-range HbA1c, or multiclass tasks. Holm-adjusted McNemar tests led to the same overall conclusion. Therefore, the statistical comparisons do not support clear superiority of any single classifier.
Because fasting glucose is itself a direct and routinely available glycemic marker, the multivariable models were additionally compared with clinically simple baseline approaches based on age alone, fasting glucose alone, fasting glucose plus age, and conventional fasting-glucose thresholds (100 mg/dL for dysglycemia and 126 mg/dL for diabetic-range HbA1c). These analyses were performed on the same independent test set to determine the extent to which the expanded laboratory models provided discrimination beyond readily available clinical information (Table 12).
Table 12.
Performance of clinically relevant baseline approaches for HbA1c-defined classification.
Fasting glucose alone already provided substantial discrimination, with AUCs of 0.796 for dysglycemia and 0.803 for diabetic-range HbA1c. Adding age increased AUC to 0.837 and 0.815, respectively. For dysglycemia, the conventional fasting-glucose threshold achieved a sensitivity of 0.749, a specificity of 0.775, a PPV of 0.896, and an FPR of 0.225. For diabetic-range HbA1c, the conventional threshold achieved a sensitivity of 0.554, a specificity of 0.892, a PPV of 0.788, and an FPR of 0.108. Because the conventional threshold represents a single fixed operating point rather than a probability model, an AUC was not reported for the threshold rows. These findings confirm that fasting glucose itself contains substantial discriminatory information and provide a clinically relevant reference for evaluating the incremental value of the expanded models.
Glucose-ablation analysis quantifies the loss of discrimination after removal of fasting glucose but does not directly establish whether the additional biochemical and hematological predictors improve classification beyond a clinically meaningful glucose-based model. Therefore, the incremental change in AUC was quantified by comparing each expanded multivariable model with the predefined fasting-glucose-plus-age baseline using patient-level bootstrap resampling.
The additional laboratory predictors (Table 13) provided little incremental discrimination beyond fasting glucose plus age for dysglycemia: none of the four expanded models showed a statistically supported improvement in AUC, and the ΔAUC estimates ranged from −0.011 to 0.010. For diabetic-range HbA1c, however, Random Forest (ΔAUC = 0.049, 95% CI 0.014–0.086, p = 0.009), Gradient Boosting (ΔAUC = 0.044, 95% CI 0.009–0.082, p = 0.017), and SVM (ΔAUC = 0.038, 95% CI 0.003–0.076, p = 0.034) showed modest incremental improvement over fasting glucose plus age, whereas the Logistic Regression increment was smaller and not statistically supported. Thus, incremental value was outcome- and model-dependent and remained modest in absolute magnitude.
Table 13.
Incremental discrimination of the expanded multivariable models relative to fasting glucose plus age.
Because discrimination alone does not establish the reliability of predicted probabilities, internal calibration was additionally assessed for the binary classification models. Table 14 summarizes Brier scores, calibration intercepts, and calibration slopes.
Table 14.
Internal calibration of binary classification models.
For dysglycemia, Random Forest achieved the lowest Brier score (0.143), with a calibration intercept of −0.002 and slope of 0.954, values close to the ideal values of 0 and 1. SVM also showed a slope close to 1 (0.952). For diabetic-range HbA1c, Random Forest again achieved the lowest Brier score (0.148), with an intercept of 0.106 and slope of 1.069, while SVM showed a slope of 0.975. These findings suggest comparatively favorable internal calibration for Random Forest and SVM, although calibration remains to be externally validated.
Decision-curve analysis was performed to explore the potential clinical net benefit of the binary classifiers across threshold probabilities from 0.05 to 0.80 (Figure 3).
Figure 3.
Decision-curve analysis of the binary classification models. (A) HbA1c-defined dysglycemia and (B) diabetic-range HbA1c.
Exploratory decision-curve analysis showed positive net benefit for the evaluated models across several probability thresholds compared with default treat-all and treat-none strategies. For dysglycemia, Random Forest showed positive net benefit relative to the default strategies across the broadest evaluated threshold range (0.05–0.80), whereas the other models demonstrated positive incremental net benefit mainly at moderate-to-higher thresholds. For diabetic-range HbA1c, all evaluated classifiers demonstrated positive incremental net benefit across substantial portions of the tested threshold range. These findings suggest potential internal decision-analytic value but should be interpreted cautiously because net benefit depends on the study prevalence, outcome definition, and selected threshold.
To determine whether the observed classification performance was primarily driven by fasting glucose, additional ablation experiments were performed. Models were evaluated using three predictor configurations: the full predictor set, a glucose-excluded set retaining age, and a non-glycemic laboratory-only set excluding both glucose and age.
For dysglycemia classification, the highest AUC decreased from 0.848 in the full predictor configuration to 0.723 after glucose exclusion and to 0.677 in the non-glycemic laboratory-only configuration. The corresponding accuracy of the AUC-best full-model configuration was 0.780, compared with 0.676 and 0.641 for the best-performing glucose-excluded and non-glycemic laboratory-only configurations, respectively. These findings demonstrate a marked loss of discrimination when fasting glucose was removed.
For diabetic-range HbA1c classification, the highest AUC decreased from 0.864 in the full predictor configuration to 0.681 after glucose exclusion and to 0.656 in the non-glycemic laboratory-only configuration. In the multiclass task, macro-AUC decreased from 0.796 to 0.658 and 0.651, respectively. Across all three outcomes, the bootstrap confidence intervals confirmed substantially lower discrimination in the glucose-excluded configurations.
These findings confirm that fasting glucose accounted for a substantial proportion of model discrimination. The remaining non-glycemic biochemical and hematological variables retained limited-to-moderate discriminatory ability above chance, indicating complementary but insufficient standalone value. Table 15 summarizes the best-performing model for each outcome and predictor configuration, together with patient-level bootstrap confidence intervals for accuracy and AUC.
Table 15.
Ablation analysis comparing full and glucose-excluded predictors.
To assess sensitivity to the preprocessing strategy, the complete modeling pipeline was repeated without IQR-based winsorization. Differences were small: accuracy changed by 0.013 for dysglycemia, 0.013 for diabetic-range HbA1c, and 0.007 for multiclass classification, while AUC changed by 0.009, 0.001, and 0.005, respectively. Thus, winsorization did not materially alter the overall performance pattern (Table 16).
Table 16.
Sensitivity analysis of model performance with and without winsorization.
The complete-case sensitivity analysis included 574 participants (40.0% of the full cohort). Overall discrimination remained within a broadly similar range, although the magnitude and direction of the differences varied across outcomes and classifiers (Table 17). For dysglycemia, complete-case AUCs were generally lower than those in the primary imputed analysis, with the largest decrease observed for Gradient Boosting (ΔAUC = −0.064). In contrast, diabetic-range HbA1c AUCs were similar or higher in the complete-case analysis, while multiclass differences were generally modest. These findings indicate that the principal discrimination patterns were not eliminated by complete-case restriction, but the observed model- and outcome-dependent differences, together with the substantial reduction in sample size, support cautious interpretation of the missing-data assumptions.
Table 17.
Complete-case sensitivity analysis compared with the primary median-imputed analysis.
Figure 4 summarizes the comparative accuracy of the finalized models across the three classification tasks. Random Forest achieved the highest accuracy for dysglycemia (0.801), SVM achieved the highest accuracy for diabetic-range HbA1c (0.794), and Random Forest achieved the highest multiclass accuracy (0.610). The differences among algorithms were generally modest, consistent with the pairwise statistical comparisons.
Figure 4.
Comparative classification accuracy of machine learning models across the three HbA1c-defined classification tasks.
Feature importance analysis was performed for the evaluated machine learning models to improve model interpretability and identify the predictors contributing most strongly to diabetic-range HbA1c classification. Because different algorithms estimate feature importance using model-specific methodologies, the resulting importance values should primarily be interpreted within each model. The corresponding feature importance estimates and predictor rankings are presented in Table 18.
Table 18.
Feature importance ranking.
Feature contribution was evaluated using model-specific interpretation methods: impurity-based importance for Random Forest, permutation importance for Gradient Boosting and SVM, and signed standardized coefficients for Logistic Regression. For Logistic Regression, coefficient signs were retained to indicate the direction of association, whereas predictor ranking was based on coefficient magnitude. Glucose showed the strongest positive standardized coefficient (β = 1.727), followed by urea (β = 0.270), RDW (β = 0.246), and age (β = 0.180), whereas MCV showed the strongest negative coefficient (β = −0.102). Because the reported quantities are derived from different interpretation methods and scales, they are intended primarily for within-model interpretation rather than direct numerical comparison across algorithms.
Glucose consistently emerged as the most influential predictor across all evaluated models, ranking first in Random Forest, Gradient Boosting, Logistic Regression, and SVM. Age and urea also demonstrated consistently high importance, although their relative ranking varied between algorithms. Among the hematological variables, RDW, MCV, RDW-SD, MPV, and platelet-related indices contributed to the prediction with model-dependent importance, reflecting differences in the underlying learning mechanisms.
Overall, these findings indicate that classification of diabetic-range HbA1c was driven primarily by fasting glucose, while demographic and additional laboratory variables provided complementary information. The consistent prominence of fasting glucose across algorithms is biologically plausible because fasting glucose is a direct glycemic measurement associated with the HbA1c-defined outcomes. This cross-model consistency should not, however, be interpreted as evidence of robustness to sampling variation, measurement error, population shift, different laboratory analyzers, or external clinical settings.
Figure 5 illustrates the ranked feature importance values derived from the Random Forest model. The dominance of glucose was expected and supports the biological validity of the model. Within the Random Forest model, age ranked as the second most important predictor, whereas its relative importance varied across the remaining algorithms, as shown in Table 18. RDW, urea, and MCV contributed additional information in the full model; however, the ablation analysis demonstrated that their standalone discriminatory value was substantially lower than that of fasting glucose.
Figure 5.
Ranked feature importance derived from the Random Forest model for diabetic-range HbA1c classification.
Collectively, the results show that fasting glucose provides a large proportion of the discrimination for HbA1c-defined glycemic-status classification. Additional routine laboratory variables contributed limited incremental discrimination for dysglycemia and modest incremental improvement for diabetic-range HbA1c in several models. Algorithm rankings varied by outcome and performance metric, and no classifier demonstrated statistically significant overall superiority after correction for multiple comparisons.
4. Discussion
The present study demonstrates that routinely available laboratory variables, particularly when combined with age, can support the classification of dysglycemia, diabetes, and multiclass glycemic status [47]. The strongest and most consistent predictor was fasting glucose, whereas urea, age, RDW, MCV, RDW-SD, platelet indices, and sodium provided complementary predictive information, with their relative importance varying across the evaluated machine learning algorithms. Although sodium and PDW differed significantly between glycemic groups, their absolute differences were minimal. Therefore, these variables should be interpreted as weak complementary markers rather than strong independent predictors, and their incremental clinical value should be confirmed in future externally validated studies. Τhe ablation analysis demonstrated that their discrimination was substantially weaker in the absence of fasting glucose. These findings support the concept that diabetes is not only a disorder of glucose concentration but also a systemic metabolic condition accompanied by renal, inflammatory, hematological, and vascular changes. Although RDW and RDW-SD are biologically related hematological measures, multicollinearity assessment indicated moderate collinearity between these biologically related variables, with RDW showing the highest VIF (5.43), indicating that the reported logistic regression coefficients remained sufficiently stable for interpretation. Nevertheless, not all statistically significant laboratory variables demonstrated comparable clinical relevance.
An additional consideration is that HbA1c, which was used to define the study outcomes, may itself be influenced by erythrocyte lifespan and hematological conditions independent of glycemic status. Consequently, the predictive contribution of red-cell indices such as RDW, RDW-SD, and MCV should not be interpreted exclusively as reflecting metabolic alterations, since these variables may partially capture biological factors affecting HbA1c measurement.
Because information regarding anemia, iron deficiency, vitamin B12 or folate deficiency, hemoglobinopathies, and other disorders affecting erythrocyte turnover was not available in the present dataset, residual confounding cannot be excluded.
The ablation analysis clarified the contribution of fasting glucose to the observed model performance. Excluding glucose resulted in a marked reduction in AUC across all three classification tasks: from 0.848 to 0.723 for dysglycemia, from 0.864 to 0.681 for diabetic-range HbA1c, and from 0.796 to 0.658 for multiclass classification. This confirms that a substantial proportion of full-model discrimination was driven by the direct glycemic biomarker. The clinical-baseline analysis further showed that fasting glucose alone already provided substantial discrimination, reinforcing the need to interpret the expanded models relative to simple glucose-based comparators.
Models restricted to non-glycemic laboratory variables achieved AUC values of 0.677 for dysglycemia, 0.656 for diabetic-range HbA1c, and 0.651 for multiclass classification. These results indicate limited-to-moderate discrimination above chance and suggest that variables such as urea, RDW, RDW-SD, MCV, and platelet indices contain complementary systemic information. Their standalone performance, however, was insufficient for clinical classification and should be interpreted as supplementary rather than alternative information to direct glycemic measurements.
For dysglycemia, the principal trade-off was between sensitivity and specificity rather than clear algorithmic superiority. Random Forest achieved high sensitivity (0.908) but low specificity (0.525), whereas Logistic Regression achieved substantially higher specificity (0.850). Gradient Boosting achieved the highest AUC (0.848). This pattern indicates that the preferred model would depend on the intended clinical threshold and the relative consequences of false-positive and false-negative classifications rather than on a single overall performance ranking [48,49].
Age provided complementary discriminatory information, although its incremental contribution varied across models and classification tasks. Advancing age is associated with progressive insulin resistance, declining beta-cell reserve, altered body composition, chronic low-grade inflammation, and a greater burden of comorbidities. However, the persistence of acceptable performance in models excluding age indicates that the laboratory variables alone contained relevant information about glycemic status. This observation is useful for settings where demographic information is incomplete or where the objective is to evaluate the independent screening value of laboratory data.
The importance of RDW and RDW-SD is consistent with previous evidence linking erythrocyte size heterogeneity to inflammation, oxidative stress, chronic kidney disease, cardiovascular morbidity, and diabetic complications [7,8,9,10,11,12,13,14]. Hyperglycemia may promote oxidative damage to erythrocytes, alter membrane deformability, shorten red blood cell survival, and disturb erythropoiesis. These mechanisms could explain why RDW-related indices contributed to model discrimination, even when their absolute differences among groups were modest. Nevertheless, RDW is nonspecific and may be influenced by iron status, vitamin deficiencies, chronic inflammatory disease, renal dysfunction, liver disease, and other comorbidities. Therefore, RDW should be interpreted as a complementary correlate of HbA1c-defined glycemic status rather than as an independent diagnostic marker.
Urea was another relevant predictor in both regression and machine learning analyses. This finding may reflect early renal dysfunction, dehydration, increased catabolic state, or the broader metabolic burden associated with diabetes. Previous work has reported associations between higher blood urea nitrogen and incident diabetes, insulin resistance in chronic kidney disease, and diabetic retinopathy [15,16,17]. In the present study, urea should not be interpreted as a direct diagnostic marker, but rather as a routine biochemical variable that may capture renal-metabolic stress and comorbidity patterns associated with HbA1c-defined dysglycemia. In the diabetic-range HbA1c multivariable model, fasting glucose, age, and urea were the only predictors that remained statistically significant after adjustment, whereas the additional hematological variables did not retain statistical significance.
The inverse association between MCV and glycemic status requires cautious interpretation. The observed differences were small, and values generally remained within conventional reference intervals. Lower MCV in participants with HbA1c-defined dysglycemia or diabetic-range HbA1c may reflect subtle iron-restricted erythropoiesis, chronic inflammation, renal-related hematological changes, or population-specific comorbidity patterns. Because HbA1c itself may be affected by erythrocyte lifespan and red cell disorders, future studies should account for anemia, iron status, vitamin B12/folate concentrations, renal function, and hemoglobin variants when evaluating laboratory-based classification of glycemic status.
Platelet-related variables contributed modestly to model performance. Diabetes is associated with platelet hyperreactivity, endothelial dysfunction, inflammation, and a prothrombotic state [19,20,21,22,23]. Higher MPV or altered PDW may therefore reflect platelet activation or increased platelet turnover in some patients. In the present dataset, however, platelet-related findings were weaker than those for glucose, age, urea, and red cell indices. Their value appears to be additive rather than independently diagnostic [50].
Sodium showed a limited contribution to model discrimination. Although group differences in sodium were statistically significant, the median values were very similar, suggesting limited clinical magnitude. This highlights an important interpretive issue in large datasets: statistically significant differences may not always be clinically meaningful. Sodium may still contribute indirectly to classification by capturing hydration status, renal handling, medication effects, or comorbidity patterns, but it should not be overinterpreted as a standalone glycemic marker.
From a methodological perspective, flexible nonlinear models achieved competitive performance, but their numerical advantages were not consistent across outcomes or metrics. Random Forest, Gradient Boosting, Logistic Regression, and SVM showed broadly overlapping discrimination, and no classifier remained statistically superior after correction for multiple comparisons. In screening contexts, high sensitivity may be desirable because false negatives could delay further assessment, but this must be balanced against false positives, unnecessary HbA1c testing, and downstream clinical workload.
Formal pairwise statistical comparisons confirmed that no classifier demonstrated statistically significant superiority after Holm correction in the dysglycemia, diabetic-range HbA1c, or multiclass tasks. Although the unadjusted Logistic Regression–Random Forest AUC comparison for diabetic-range HbA1c yielded p = 0.024, the Holm-adjusted p-value was 0.144. The findings therefore support interpreting the evaluated algorithms as having broadly comparable internal discrimination, with model selection depending on the outcome and the relative importance of sensitivity, specificity, calibration, and clinical consequences.
The study has several limitations. First, its retrospective cross-sectional design precludes causal inference and makes the analysis vulnerable to residual and unmeasured confounding. Second, potentially important clinical variables, including body mass index, medication use, smoking status, inflammatory disease, renal function markers beyond urea, iron studies, vitamin B12/folate status, and detailed comorbidity data, were not incorporated into the final classification framework. Albumin was initially considered as a candidate predictor but was excluded during data preprocessing because 55.8% of its values were missing, exceeding the predefined exclusion threshold (>40%). Although albumin has recognized biological relevance in diabetes, its inclusion would have substantially reduced data completeness and potentially introduced bias. Future studies using datasets with more complete albumin measurements should evaluate its incremental contribution to HbA1c-defined glycemic-status classification.
Third, HbA1c was used as the reference biomarker for defining the classification outcomes. However, HbA1c can be influenced by altered erythrocyte lifespan, anemia, hemoglobinopathies, renal disease, and other hematological or metabolic conditions. Because HbA1c itself defined the outcome categories, associations involving hematological variables related to erythrocyte turnover may partly reflect biological variation in HbA1c rather than independent metabolic mechanisms. The absence of information on anemia, iron status, vitamin B12 or folate deficiency, hemoglobinopathies, inflammatory disorders, medication use, and detailed renal function therefore represents an additional source of potential residual confounding. Accordingly, the observed associations of RDW, RDW-SD, MCV, and related hematological variables should be interpreted as associations with HbA1c-defined glycemic status rather than as evidence of independent metabolic, causal, or diagnostic effects.
Fourth, the study cohort was substantially enriched for abnormal glycemic status, with 72.1% of participants meeting the study definition of HbA1c-defined dysglycemia and 42.1% having diabetic-range HbA1c values. This distribution is unlikely to reflect an unselected population-screening setting. Consequently, prevalence-dependent measures such as PPV and NPV, as well as the expected proportion of individuals referred for further testing, may differ substantially in populations with lower prevalence of abnormal glycemic status. These estimates should therefore not be directly extrapolated to general screening populations without validation in cohorts with clinically representative prevalence and case mix.
Fifth, missing data represent an additional methodological limitation. Although median imputation was performed within the training pipeline to minimize information leakage, missingness was not uniformly distributed across all variables or HbA1c-defined glycemic-status groups. In particular, sodium missingness differed significantly across groups, and missing-indicator analyses identified associations between selected missingness patterns and the binary classification outcomes. Therefore, a completely random missing-data mechanism cannot be assumed. The complete-case sensitivity analysis retained the overall discriminatory signal but showed model- and outcome-dependent changes in performance, while reducing the available cohort to 574 participants (40.0%). These findings support retaining the imputed analysis as the primary analysis while indicating that some performance estimates are sensitive to the missing-data strategy.
Sixth, although the primary evaluation relied on a single stratified 80:20 train–test split, repeated stratified cross-validation provided additional evidence that the overall performance pattern was not strongly dependent on a single data partition. Mean AUCs remained broadly consistent across repeated resampling, and classifier rankings showed only modest variation [51]. Nevertheless, repeated internal validation cannot substitute for external or temporal validation, and independent evaluation in clinically representative cohorts remains necessary before model generalizability can be established.
Seventh, the winsorization sensitivity analysis showed only small changes in model performance, suggesting that the overall pattern of results was not materially dependent on the selected IQR-based outlier-treatment strategy. Nevertheless, alternative preprocessing approaches should be evaluated in independent datasets to determine the robustness of the findings across different laboratory populations and data distributions.
From a technical perspective, routinely collected laboratory variables could eventually support automated concurrent HbA1c-defined glycemic-status classification within laboratory information systems or electronic health records. However, the present analysis does not establish implementation readiness or demonstrate that the models can diagnose diabetes. Any future deployment would require external validation, recalibration in the target population, prospective assessment of clinical consequences, and formal evaluation of workflow impact and cost-effectiveness [52].
The additional analyses extend the evaluation beyond discrimination by examining internal probability calibration and exploratory clinical net benefit. Random Forest demonstrated favorable internal calibration for both binary HbA1c-defined outcomes, with calibration slopes close to 1 and comparatively low Brier scores, while SVM also showed calibration slopes close to the ideal value. Decision-curve analysis suggested positive net benefit across several threshold ranges relative to the default treat-all and treat-none strategies. However, these findings remain internal and prevalence-dependent and should not be interpreted as evidence of established clinical utility. External calibration, prospective decision-impact evaluation, and cost-effectiveness analysis remain necessary before implementation can be considered.
Future studies should evaluate whether the addition of albumin, creatinine/eGFR, C-reactive protein, lipid profile, body mass index, medication data, and other clinically relevant variables provides meaningful incremental value beyond fasting glucose and the routinely available laboratory predictors evaluated here. External validation across different populations, laboratory analyzers, healthcare systems, and prevalence settings will be essential to establish the transportability and generalizability of the proposed models.
5. Conclusions
This retrospective study indicates that machine learning models based on routine biochemical and hematological parameters provide moderate internal discrimination for HbA1c-defined glycemic-status classification. Fasting glucose accounted for a substantial proportion of model performance, and the additional laboratory variables provided limited incremental discrimination for dysglycemia and modest incremental gains for diabetic-range HbA1c in several models. No classifier demonstrated statistically significant overall superiority after correction for multiple comparisons, and the low specificity of the high-sensitivity dysglycemia Random Forest model highlights the potential false-positive burden of a screening application. The findings should therefore be interpreted as internally validated classification results rather than evidence of established clinical applicability, and external validation and clinical-utility assessment remain necessary before implementation.
Author Contributions
Conceptualization, A.G. and D.G.; methodology, D.G.; software, D.G.; validation, A.G., E.L. and D.G.; formal analysis, D.G.; investigation, A.G.; resources, E.V.; data curation, D.G.; writing—original draft preparation, A.G. and D.G.; writing—review and editing, D.P., E.V. and E.L.; visualization, D.P.; supervision, D.G.; project administration, E.L. All authors have read and agreed to the published version of the manuscript.
Funding
This research received no external funding.
Institutional Review Board Statement
The study was conducted according to the Declaration of Helsinki and its latest amendments. Ethical approval for the study was obtained from the Administration and the Scientific Committee of the General Hospital in Thessaloniki with protocol number 6/26/4/2018 on 26 April 2018. The confidentiality of the participants was meticulously maintained, and personal privacy was thoroughly respected.
Informed Consent Statement
Informed consent was obtained from all subjects involved in the study.
Data Availability Statement
The data presented in this study are available upon request from the corresponding authors due to ethical restrictions.
Conflicts of Interest
The authors declare no conflicts of interest.
Abbreviations
The following abbreviations are used in this manuscript:
| AUC | Area under the curve |
| AUC-ROC | Area under the receiver operating characteristic curve |
| CI | Confidence interval |
| eGFR | Estimated glomerular filtration rate |
| F1-score | Harmonic mean of precision and recall |
| HbA1c | Glycated hemoglobin |
| IQR | Interquartile range |
| L2 | L2 regularization |
| L-BFGS | Limited-memory Broyden–Fletcher–Goldfarb–Shanno algorithm |
| MCV | Mean corpuscular volume |
| MPV | Mean platelet volume |
| OR | Odds ratio |
| PDW | Platelet distribution width |
| RBF | Radial basis function |
| RDW | Red cell distribution width |
| RDW-SD | Red cell distribution width–standard deviation |
| ROC | Receiver operating characteristic |
| SD | Standard deviation |
| SVM | Support vector machine |
References
- ElSayed, N.A.; Aleppo, G.; Aroda, V.R.; Bannuru, R.R.; Brown, F.M.; Bruemmer, D.; Collins, B.S.; Hilliard, M.E.; Isaacs, D.; Johnson, E.L.; et al. Classification and Diagnosis of Diabetes: Standards of Care in Diabetes—2023. Diabetes Care 2023, 46, S19–S40. [Google Scholar] [CrossRef] [Scilit]
- Sun, H.; Saeedi, P.; Karuranga, S.; Pinkepank, M.; Ogurtsova, K.; Duncan, B.B.; Stein, C.; Basit, A.; Chan, J.C.N.; Mbanya, J.C.; et al. IDF Diabetes Atlas: Global, regional and country-level diabetes prevalence estimates for 2021 and projections for 2045. Diabetes Res. Clin. Pract. 2022, 183, 109119. [Google Scholar] [CrossRef] [Scilit] [PubMed]
- Deshpande, A.D.; Harris-Hayes, M.; Schootman, M. Epidemiology of diabetes and diabetes-related complications. Phys. Ther. 2008, 88, 1254–1264. [Google Scholar] [CrossRef] [Scilit]
- Stumvoll, M.; Mitrakou, A.; Pimenta, W.; Jenssen, T.; Yki-Järvinen, H.; Van Haeften, T.; Renn, W.; Gerich, J. Use of the oral glucose tolerance test to assess insulin release and insulin sensitivity. Diabetes Care 2000, 23, 295–301. [Google Scholar] [CrossRef] [Scilit]
- Mannucci, E.; Ognibene, A.; Sposato, I.; Brogi, M.; Gallori, G.; Bardini, G.; Cremasco, F.; Messeri, G.; Rotella, C.M. Fasting plasma glucose and glycated haemoglobin in the screening of diabetes and impaired glucose tolerance. Acta Diabetol. 2003, 40, 181–186. [Google Scholar] [CrossRef] [Scilit]
- Perry, R.C.; Shankar, R.R.; Fineberg, N.; McGill, J.; Baron, A.D. HbA1c measurement improves the detection of type 2 diabetes in high-risk individuals with nondiagnostic levels of fasting plasma glucose. Diabetes Care 2001, 24, 465–471. [Google Scholar] [CrossRef] [Scilit]
- Lippi, G.; Targher, G.; Montagnana, M.; Salvagno, G.L.; Zoppini, G.; Guidi, G.C. Relation between red blood cell distribution width and inflammatory biomarkers in a large cohort of unselected outpatients. Arch. Pathol. Lab. Med. 2009, 133, 628–632. [Google Scholar] [CrossRef] [Scilit]
- Joosse, H.J.; van Oirschot, B.A.; Kooijmans, S.A.; Hoefer, I.E.; van Wijk, R.A.H.; Huisman, A.; van Solinge, W.W.; Haitjema, S. In-vitro and in-silico evidence for oxidative stress as drivers for RDW. Sci. Rep. 2023, 13, 9223. [Google Scholar] [CrossRef] [Scilit]
- Ma, Y.; Li, S.; Zhang, A.; Ma, Y.; Wan, Y.; Han, J.; Cao, W.; Xu, G. Association between red blood cell distribution width and diabetic retinopathy: A 5-year retrospective case-control study. J. Ophthalmol. 2021, 2021, 6653969. [Google Scholar] [CrossRef] [Scilit]
- Malandrino, N.; Wu, W.C.; Taveira, T.H.; Whitlatch, H.B.; Smith, R.J. Association between red blood cell distribution width and macrovascular and microvascular complications in diabetes. Diabetologia 2012, 55, 226–235. [Google Scholar] [CrossRef] [Scilit]
- Hassan, A.A.; Ahmed, B.E.; Adam, I. Red cell distribution width and prediabetes in adults in Northern Sudan: A case-control study. Hematol. Rep. 2023, 15, 651–661. [Google Scholar] [CrossRef] [Scilit]
- Al-Kindi, S.G.; Refaat, M.; Jayyousi, A.; Asaad, N.; Al Suwaidi, J.; Abi Khalil, C. Red cell distribution width is associated with all-cause and cardiovascular mortality in patients with diabetes. BioMed Res. Int. 2017, 2017, 5843702. [Google Scholar] [CrossRef] [Scilit]
- Deng, X.; Gao, B.; Wang, F.; Zhao, M.H.; Wang, J.; Zhang, L. Red blood cell distribution width is associated with adverse kidney outcomes in patients with chronic kidney disease. Front. Med. 2022, 9, 877220. [Google Scholar] [CrossRef] [Scilit]
- Lu, Y.A.; Fan, P.C.; Lee, C.C.; Wu, V.C.; Tian, Y.C.; Yang, C.W.; Chen, Y.C.; Chang, C.H. Red cell distribution width associated with adverse cardiovascular outcomes in patients with chronic kidney disease. BMC Nephrol. 2017, 18, 361. [Google Scholar] [CrossRef] [Scilit]
- Xie, Y.; Bowe, B.; Li, T.; Xian, H.; Yan, Y.; Al-Aly, Z. Higher blood urea nitrogen is associated with increased risk of incident diabetes mellitus. Kidney Int. 2018, 93, 741–752. [Google Scholar] [CrossRef] [Scilit] [PubMed]
- Thomas, S.S.; Zhang, L.; Mitch, W.E. Molecular mechanisms of insulin resistance in chronic kidney disease. Kidney Int. 2015, 88, 1233–1239. [Google Scholar] [CrossRef] [Scilit]
- Zhong, J.B.; Yao, Y.F.; Zeng, G.Q.; Zhang, Y.; Ye, B.K.; Dou, X.Y.; Cai, L. A closer association between blood urea nitrogen and the probability of diabetic retinopathy in patients with shorter type 2 diabetes duration. Sci. Rep. 2023, 13, 9881. [Google Scholar] [CrossRef] [Scilit]
- Cheng, Q.; Liu, X.; Cai, A.; Zhou, D.; Huang, Y.; Feng, Y. Serum sodium level is inversely associated with new-onset diabetes in hypertensive patients. J. Diabetes 2022, 14, 831–839. [Google Scholar] [CrossRef] [Scilit]
- Sharpe, P.C.; Trinick, T. Mean platelet volume in diabetes mellitus. Q. J. Med. 1993, 86, 739–742. [Google Scholar] [CrossRef] [Scilit]
- Colwell, J.A.; Nesto, R.W. The platelet in diabetes: Focus on prevention of ischemic events. Diabetes Care 2003, 26, 2181–2188. [Google Scholar]
- Vinik, A.I.; Erbas, T.; Park, T.S.; Nolan, R.; Pittenger, G.L. Platelet dysfunction in type 2 diabetes. Diabetes Care 2001, 24, 1476–1485. [Google Scholar] [CrossRef] [Scilit]
- Schneider, D.J. Factors contributing to increased platelet reactivity in people with diabetes. Diabetes Care 2009, 32, 525–527. [Google Scholar] [CrossRef] [Scilit]
- Kakouros, N.; Rade, J.J.; Kourliouros, A.; Resar, J.R. Platelet function in patients with diabetes mellitus: From a theoretical to a practical perspective. Int. J. Endocrinol. 2011, 2011, 742719. [Google Scholar] [CrossRef] [Scilit]
- Ginoudis, A.; Ioannidou, S.; Tsakiroglou, G.; Kazeli, K.; Vagdatli, E.; Lymperaki, E. Correlation of albumin, red cell distribution width and other biochemical and hematological parameters with glycated hemoglobin in diabetic, prediabetic and non-diabetic-range groups. Int. J. Mol. Sci. 2024, 25, 8037. [Google Scholar] [CrossRef] [Scilit]
- Ali, M.S.; Islam, M.K.; Das, A.A.; Duranta, D.U.S.; Haque, M.F.; Rahman, M.H. A novel approach for best parameters selection and feature engineering to analyze and detect diabetes: Machine learning insights. BioMed Res. Int. 2023, 2023, 8583210. [Google Scholar] [CrossRef] [Scilit]
- Mansoori, A.; Sahranavard, T.; Hosseini, Z.S.; Soflaei, S.S.; Emrani, N.; Nazar, E.; Gharizadeh, M.; Khorasanchi, Z.; Effati, S.; Ghamsary, M.; et al. Prediction of type 2 diabetes mellitus using hematological factors based on machine learning approaches: A cohort study analysis. Sci. Rep. 2023, 13, 663. [Google Scholar] [CrossRef] [Scilit]
- Bornstein, S.R.; Dey, A.K.; Steenblock, C.; Mohan, V.; Anjana, R.M.; Schwarz, P.E.H. Artificial intelligence and diabetes: Time for action and caution. Lancet Diabetes Endocrinol. 2025, 13, 552–554. [Google Scholar] [CrossRef] [Scilit]
- Rajkomar, A.; Dean, J.; Kohane, I.S. Machine learning in medicine. N. Engl. J. Med. 2019, 380, 1347–1358. [Google Scholar] [CrossRef] [Scilit]
- Lekadir, K.; Lekadir, K.; Frangi, A.F.; Porras, A.R.; Glocker, B.; Cintas, C.; Langlotz, C.P.; Weicken, E.; Asselbergs, F.W.; Prior, F.; et al. FUTURE-AI: International consensus guideline for trustworthy and deployable artificial intelligence in healthcare. BMJ 2025, 388, e081554. [Google Scholar] [CrossRef] [Scilit] [PubMed]
- Lundberg, S.M.; Erion, G.; Chen, H.; DeGrave, A.; Prutkin, J.M.; Nair, B.; Katz, R.; Himmelfarb, J.; Bansal, N.; Lee, S.-I. From local explanations to global understanding with explainable AI for trees. Nat. Mach. Intell. 2020, 2, 56–67. [Google Scholar] [CrossRef] [Scilit] [PubMed]
- Bhattacharya, S.; Reddy Maddikunta, P.K.; Pham, Q.-V.; Gadekallu, T.R.; Krishnan, S.S.R.; Chowdhary, C.L.; Alazab, M.; Piran, M.J. Deep learning and medical image processing for coronavirus (COVID-19) pandemic: A survey. Sustain. Cities Soc. 2021, 65, 102589. [Google Scholar] [CrossRef] [Scilit]
- Sree, K.S.; Karthik, J.; Niharika, C.; Srinivas, P.V.V.S.; Ravinder, N.; Prasad, C. Optimized conversion of categorical and numerical features in machine learning models. In Proceedings of the 2021 Fifth International Conference on I-SMAC (IoT in Social, Mobile, Analytics and Cloud); IEEE: Piscataway, NJ, USA, 2021; pp. 294–299. [Google Scholar]
- Apicella, A.; Isgrò, F.; Prevete, R. Don’t push the button! Exploring data leakage risks in machine learning and transfer learning. Artif. Intell. Rev. 2025, 58, 339. [Google Scholar] [CrossRef] [Scilit]
- Fisher, A.; Rudin, C.; Dominici, F. All models are wrong, but many are useful: Learning a variable’s importance by studying an entire class of prediction models simultaneously. J. Mach. Learn. Res. 2019, 20, 1–81. [Google Scholar]
- Freiesleben, T.; König, G.; Molnar, C.; Tejero-Cantero, Á. Scientific inference with interpretable machine learning: Analyzing models to learn about real-world phenomena. Minds Mach. 2024, 34, 32. [Google Scholar] [CrossRef] [Scilit]
- Kuhn, M.; Johnson, K. Feature Engineering and Selection: A Practical Approach for Predictive Models, 1st ed.; Chapman and Hall: Boca Raton, FL, USA; CRC: Boca Raton, FL, USA, 2019. [Google Scholar] [CrossRef] [Scilit]
- Lundberg, S.M.; Nair, B.; Vavilala, M.S.; Horibe, M.; Eisses, M.J.; Adams, T.; Liston, D.E.; Low, D.K.-W.; Newman, S.-F.; Kim, J.; et al. Explainable machine-learning predictions for the prevention of hypoxaemia during surgery. Nat. Biomed. Eng. 2018, 2, 749–760. [Google Scholar] [CrossRef] [Scilit]
- Kuhn, M.; Silge, J. Tidy Modeling with R: A Framework for Modeling in the Tidyverse; O’Reilly Media: Sebastopol, CA, USA, 2022. [Google Scholar]
- Christodoulou, E.; Ma, J.; Collins, G.S.; Steyerberg, E.W.; Verbakel, J.Y.; Van Calster, B. A systematic review shows no performance benefit of machine learning over logistic regression for clinical prediction models. J. Clin. Epidemiol. 2019, 110, 12–22. [Google Scholar] [CrossRef] [Scilit] [PubMed]
- Sendak, M.P.; D’Arcy, J.; Kashyap, S.; Gao, M.; Nichols, M.; Corey, K.; Ratliff, W.; Balu, S. A path for translation of machine learning products into healthcare delivery. EMJ Innov. 2020, 4, 38–45. [Google Scholar] [CrossRef] [Scilit]
- Raschka, S.; Liu, Y.H.; Mirjalili, V. Machine Learning with PyTorch and Scikit-Learn: Develop Machine Learning and Deep Learning Models with Python; Packt Publishing: Birmingham, UK, 2022. [Google Scholar]
- Chicco, D.; Jurman, G. The advantages of the Matthews correlation coefficient over F1 score and accuracy in binary classification evaluation. BMC Genom. 2020, 21, 6. [Google Scholar] [CrossRef] [Scilit]
- Delprato, M. Identifying the post-pandemic determinants of low-performing students in Latin America through interpretable machine learning SHAP values—Insights from PISA 2022. arXiv 2025, arXiv:2509.24508. [Google Scholar]
- Pedregosa, F.; Varoquaux, G.; Gramfort, A.; Michel, V.; Thirion, B.; Grisel, O.; Blondel, M.; Prettenhofer, P.; Weiss, R.; Dubourg, V.; et al. Scikit-learn: Machine learning in Python. J. Mach. Learn. Res. 2011, 12, 2825–2830. [Google Scholar]
- Sarker, I.H. Machine learning: Algorithms, real-world applications and research directions. SN Comput. Sci. 2021, 2, 160. [Google Scholar] [CrossRef] [Scilit]
- Nagy, M.; Molontay, R. Interpretable dropout prediction: Towards XAI-based personalized intervention. Int. J. Artif. Intell. Educ. 2024, 34, 274–300. [Google Scholar] [CrossRef] [Scilit]
- Biau, G.; Scornet, E. A random forest guided tour. Test 2016, 25, 197–227. [Google Scholar] [CrossRef] [Scilit]
- Yu, K.-H.; Beam, A.L.; Kohane, I.S. Artificial intelligence in healthcare. Nat. Biomed. Eng. 2018, 2, 719–731. [Google Scholar] [CrossRef] [Scilit]
- Zaccardi, F.; Webb, D.R.; Yates, T.; Davies, M.J. Pathophysiology of type 1 and type 2 diabetes mellitus: A 90-year perspective. Postgrad. Med. J. 2016, 92, 63–69. [Google Scholar] [CrossRef] [Scilit]
- Pattnayak, P.; Panda, A.R. Innovation on machine learning in healthcare services—An introduction. In Technical Advancements of Machine Learning in Healthcare; Tripathy, H.K., Mishra, S., Mallick, P.K., Panda, A.R., Eds.; Studies in Computational Intelligence; Springer: Singapore, 2021; Volume 936, pp. 1–30. [Google Scholar] [CrossRef] [Scilit]
- Samek, W.; Montavon, G.; Lapuschkin, S.; Anders, C.J.; Müller, K.-R. Explaining deep neural networks and beyond: A review of methods and applications. Proc. IEEE 2021, 109, 247–278. [Google Scholar] [CrossRef] [Scilit]
- Steyerberg, E.W.; Harrell, F.E., Jr.; Borsboom, G.J.J.M.; Eijkemans, M.J.C.; Vergouwe, Y.; Habbema, J.D.F. Internal validation of predictive models: Efficiency of some procedures for logistic regression analysis. J. Clin. Epidemiol. 2001, 54, 774–781. [Google Scholar] [CrossRef] [Scilit] [PubMed]
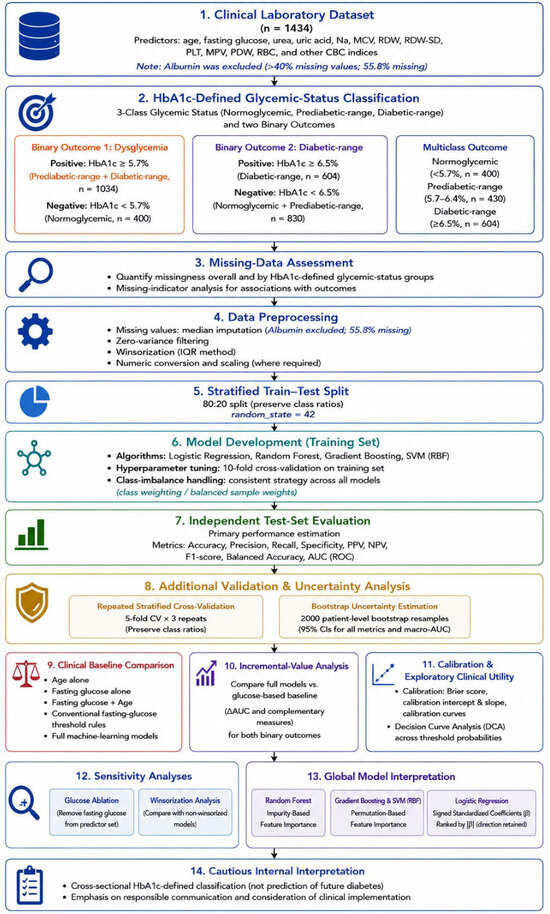
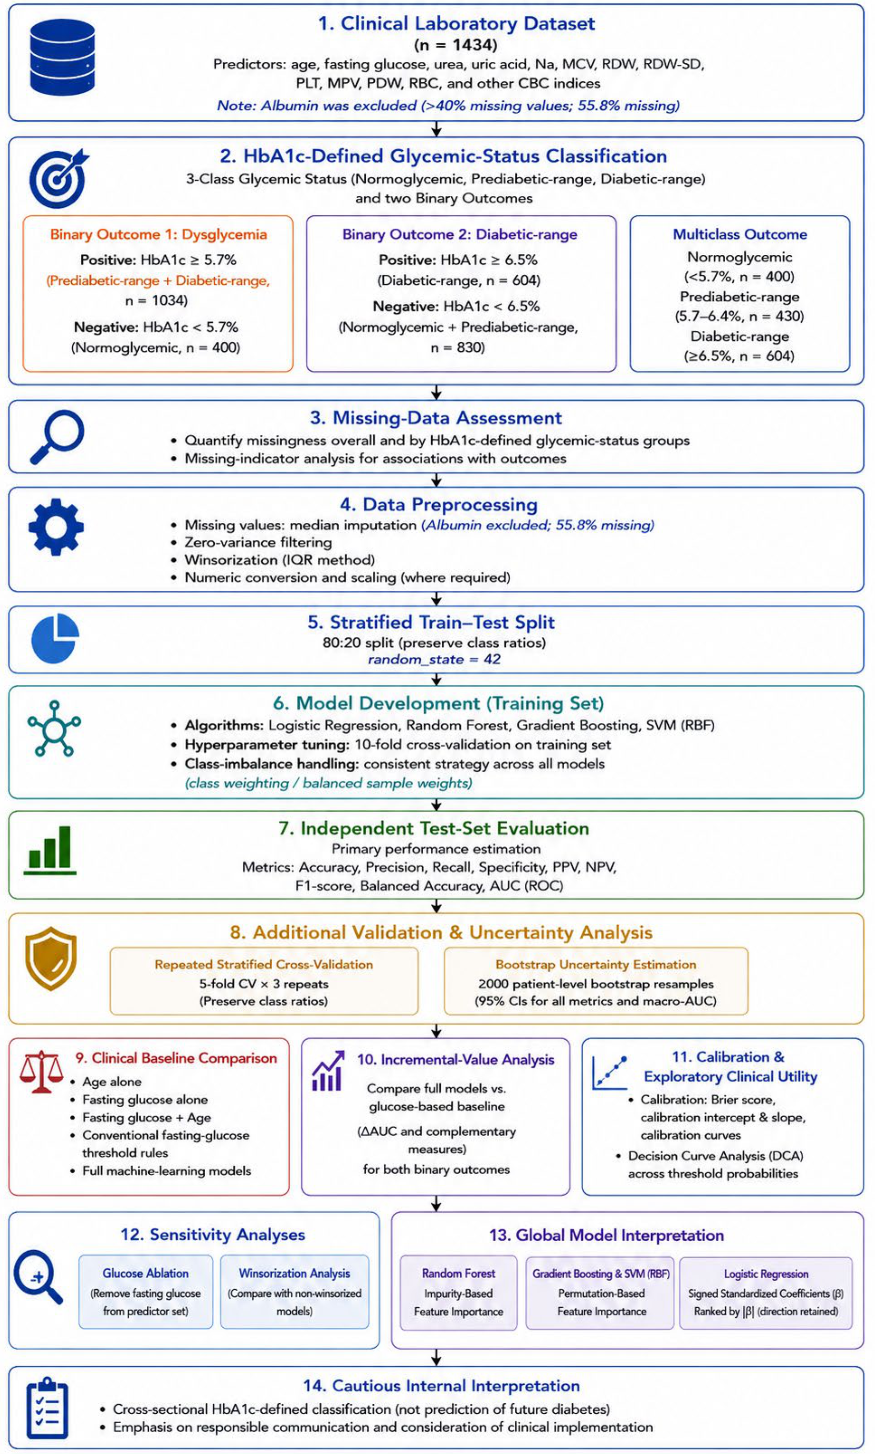
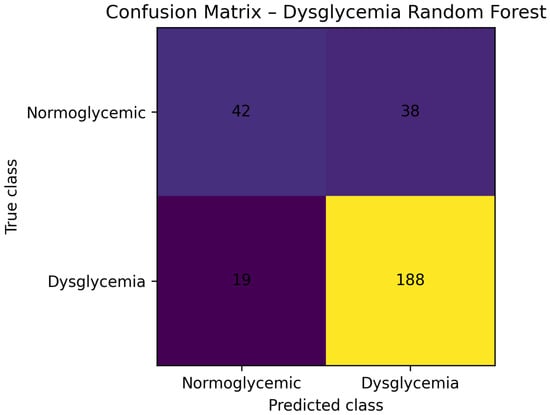
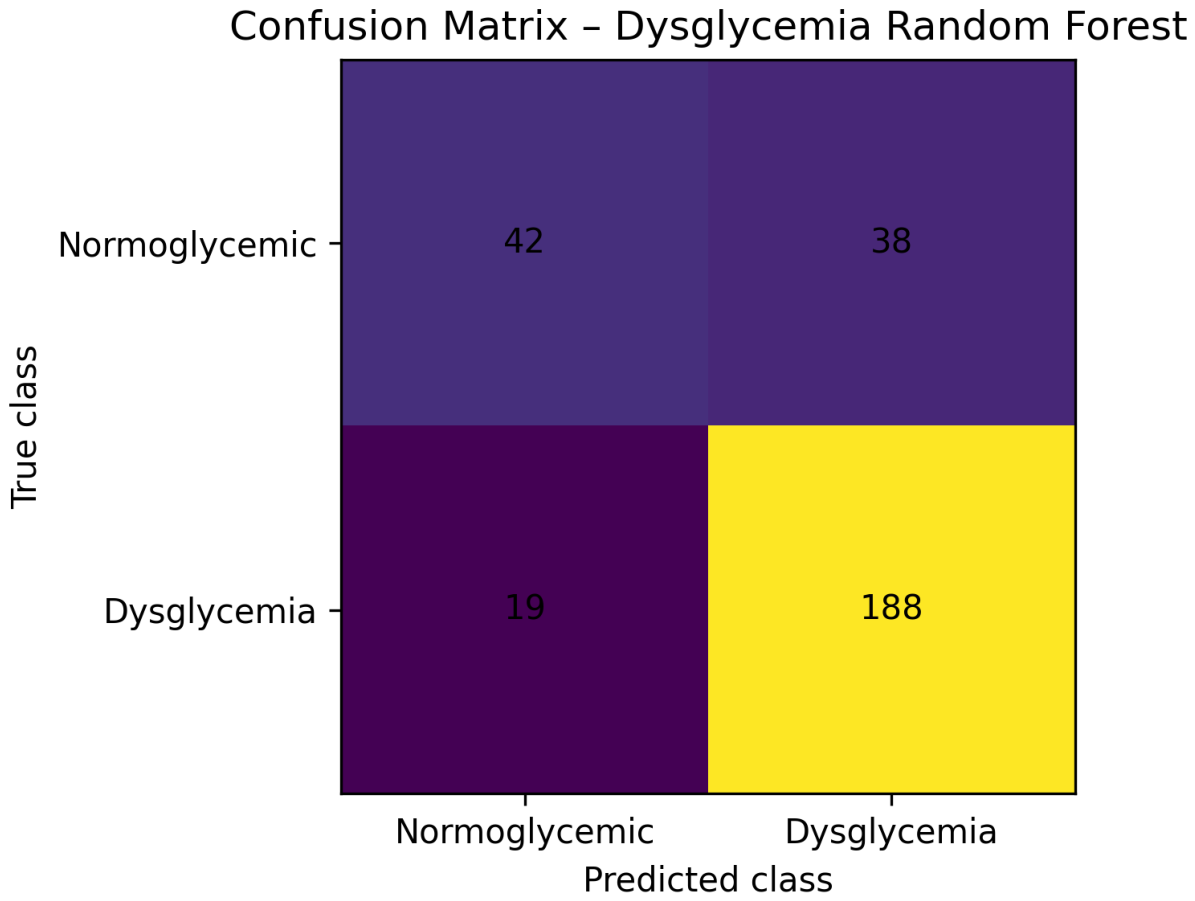
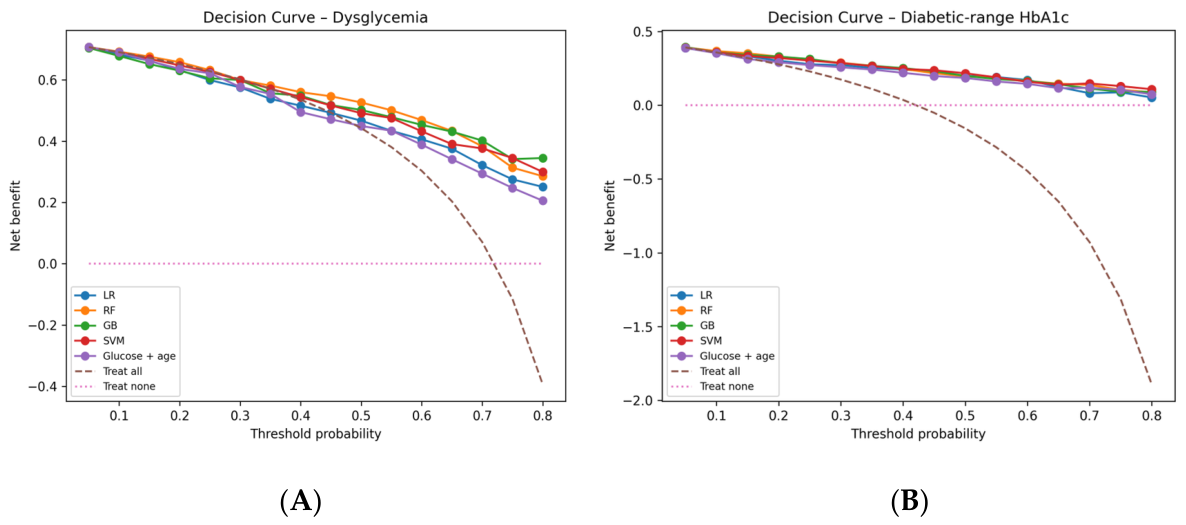
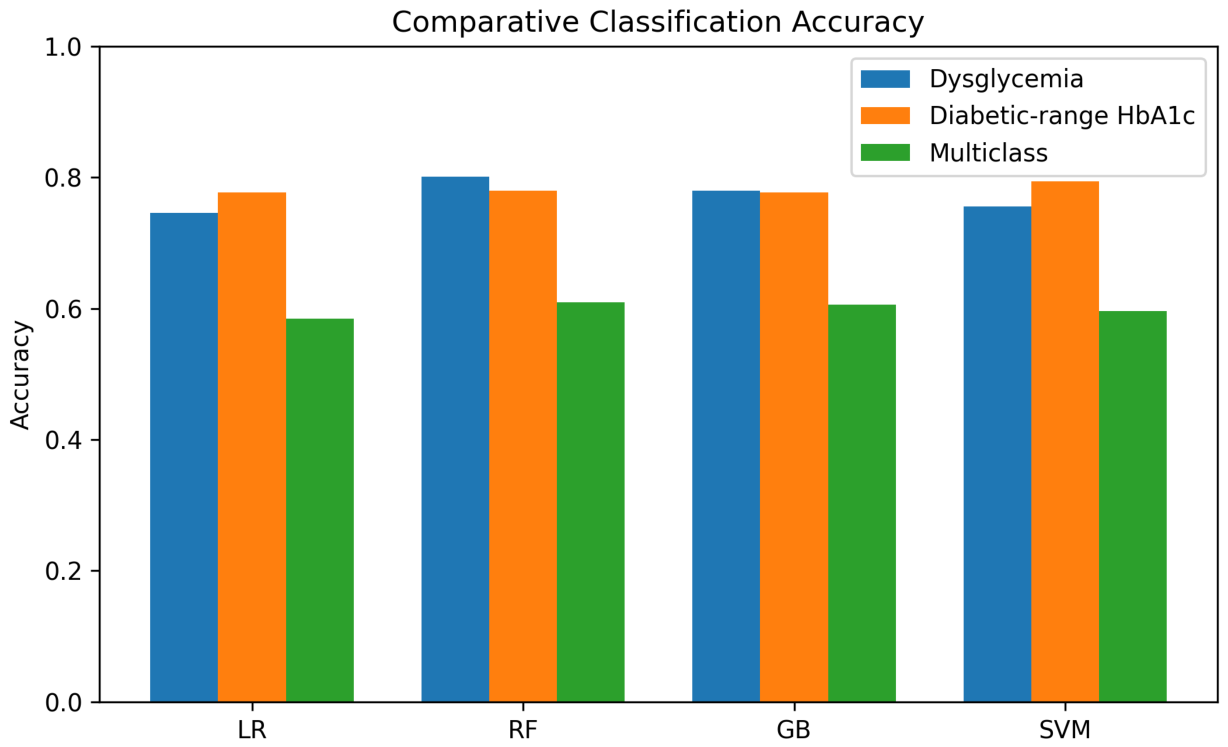
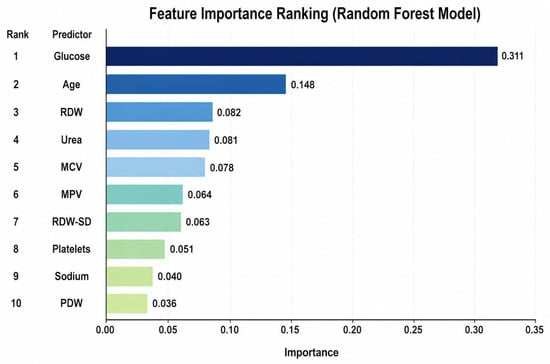
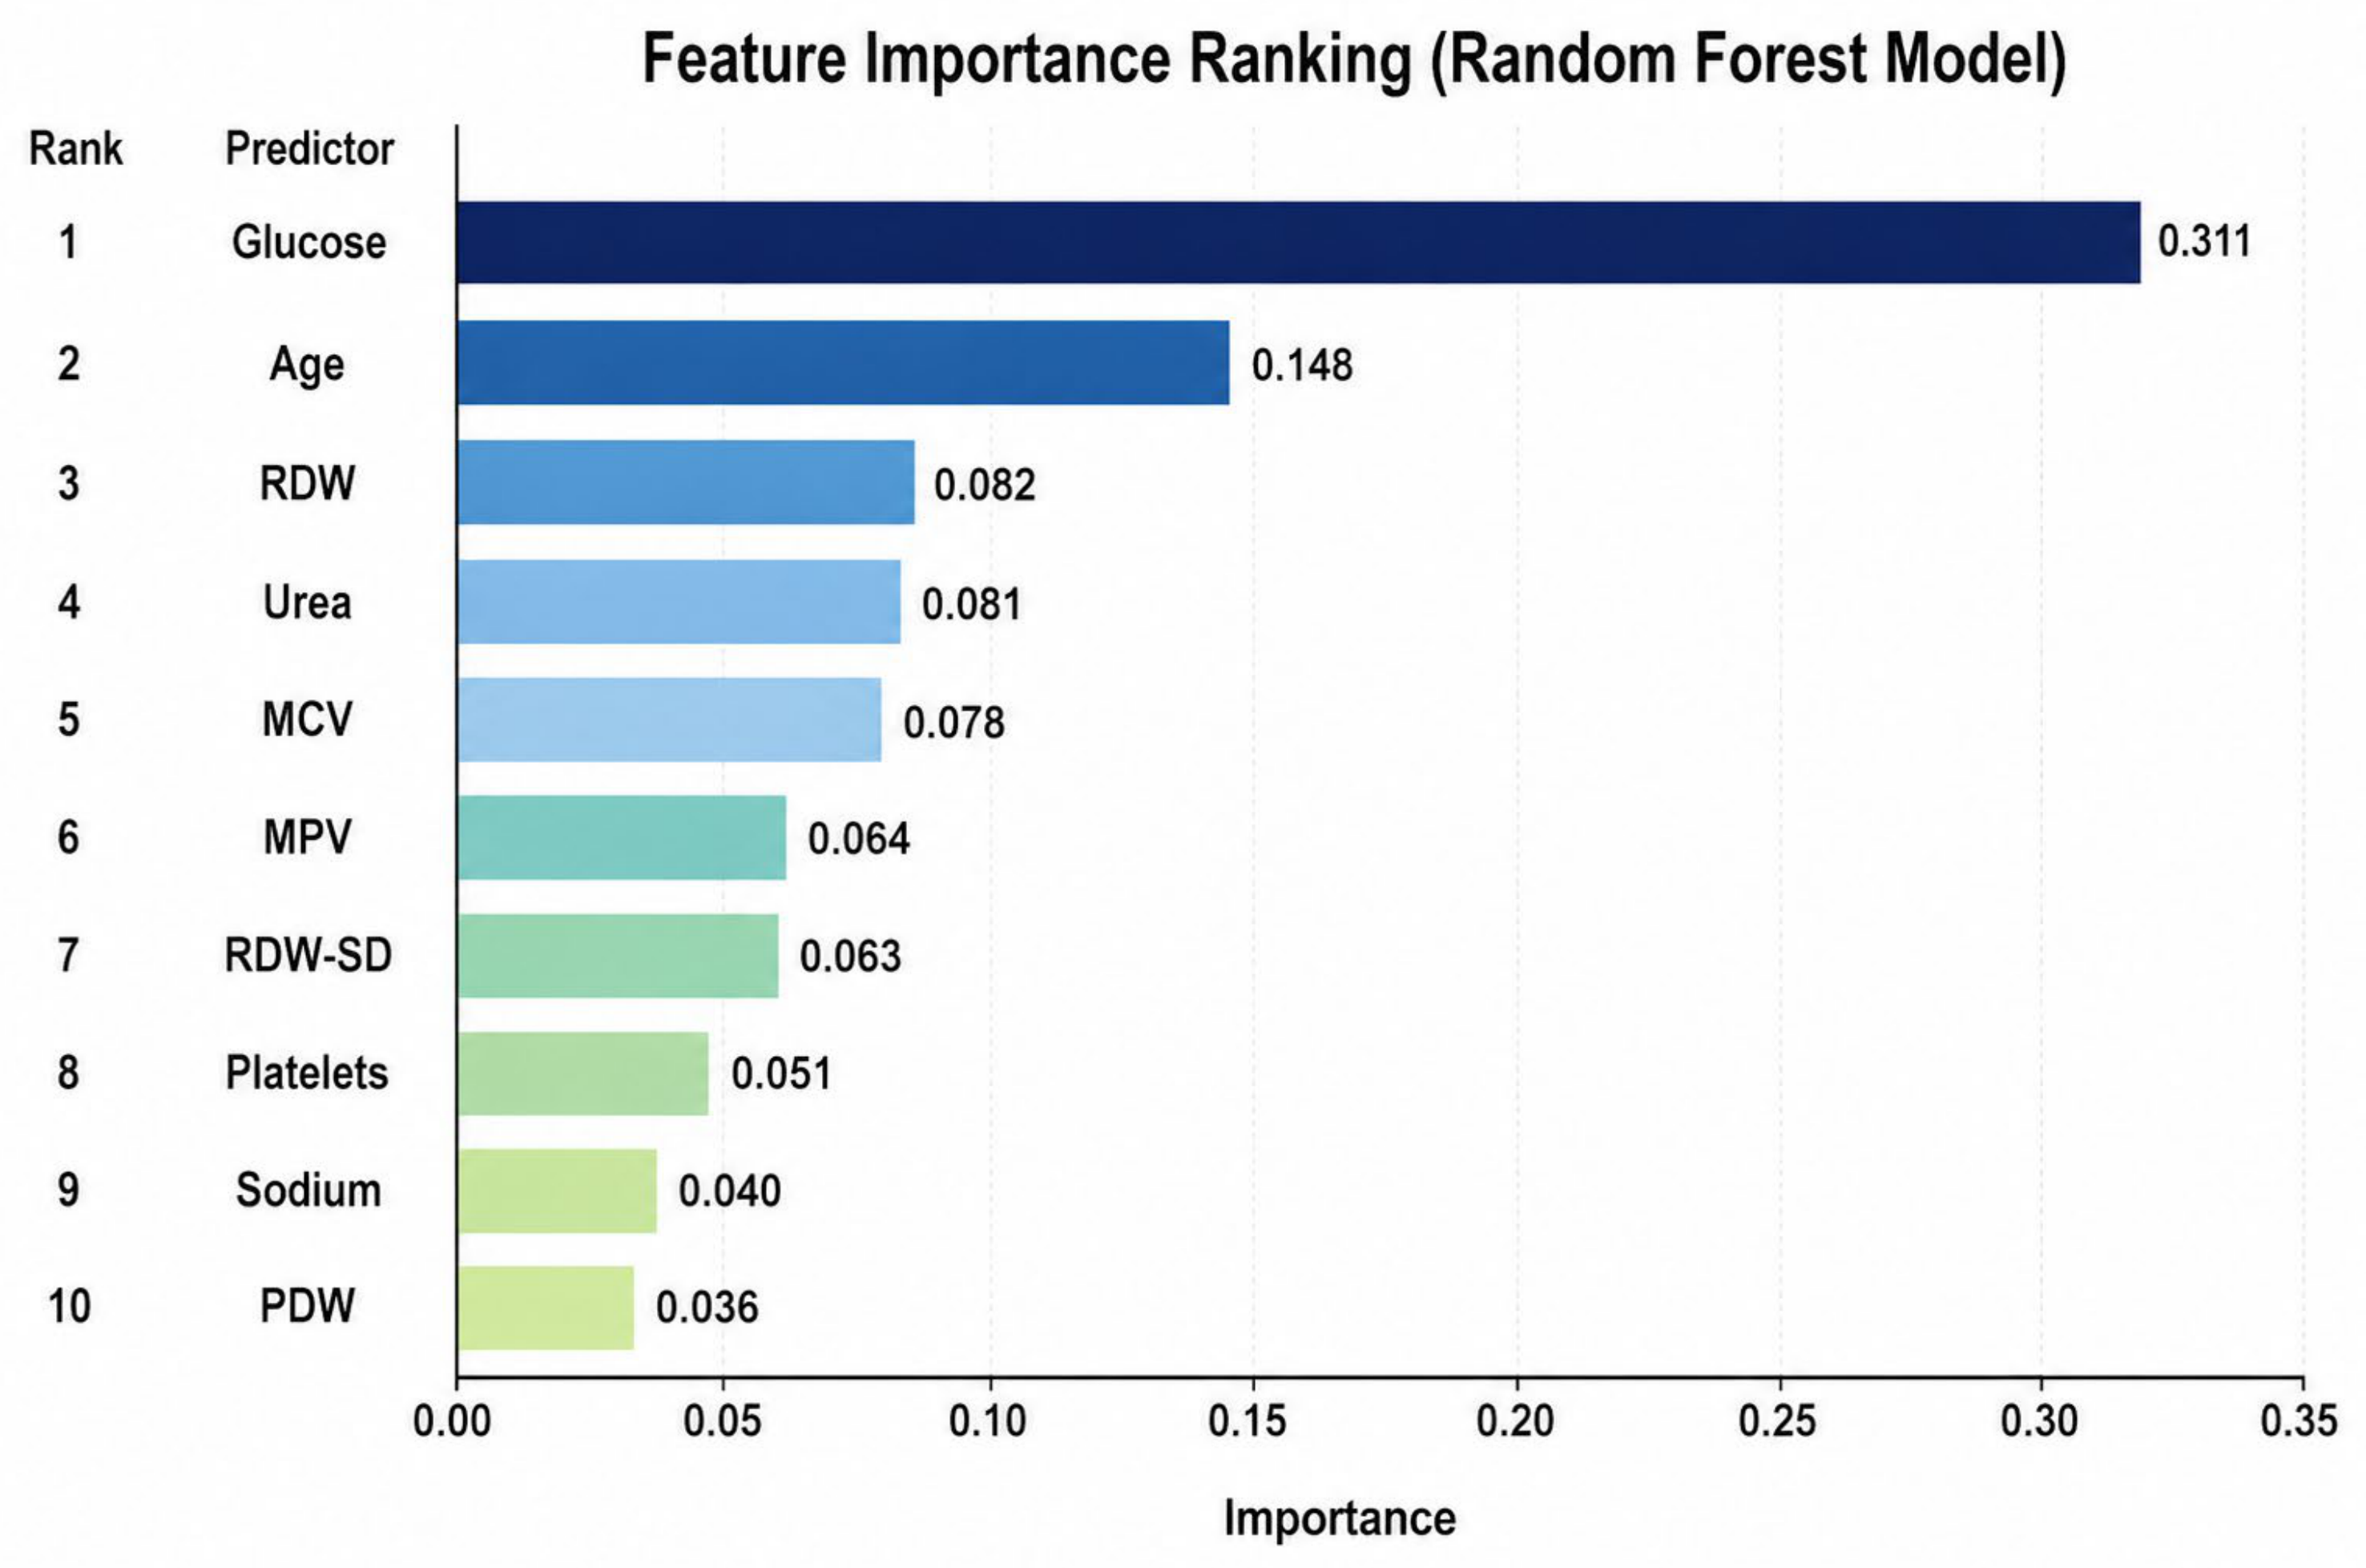

Disclaimer/Publisher’s Note: The statements, opinions and data contained in all publications are solely those of the individual author(s) and contributor(s) and not of MDPI and/or the editor(s). MDPI and/or the editor(s) disclaim responsibility for any injury to people or property resulting from any ideas, methods, instructions or products referred to in the content. |
© 2026 by the authors. Licensee MDPI, Basel, Switzerland. This article is an open access article distributed under the terms and conditions of the Creative Commons Attribution (CC BY) license.