


Abstract
GPS-derived floating car data (FCD) provide spatially continuous urban traffic observations without fixed-sensor infrastructure. This study develops a spatiotemporal baseline framework jointly modelling day type and precipitation for 1189 junction-level nodes in Budapest. A six-phase pipeline—GPS preprocessing, coordinate reprojection, FME (Feature Manipulation Engine, Safe Software Inc., Surrey, BC, Canada)-based map-matching, junction-level aggregation, Voronoi meteorological allocation, and dataset assembly—was applied to 44.1 million 10 s records from approximately 1100 probe vehicles (November 2024–December 2025). Public holidays form a structurally distinct traffic flow pattern compared to Sundays (r = 0.71) and to regular workdays (r = 0.42); morning peak shifts to 09:00–11:00 and pooling holidays with Sundays introduces reference errors of 15–25%. Precipitation raises morning peak volumes by 6–17% across all zones while afternoon peaks remain statistically unchanged, consistent with commuter inertia; Saturday volumes fall by 7–15%. Rainy Wednesdays reach 109–112% of the Monday dry reference in inner zones, attributed to hybrid workers advancing their office day. Pairwise junction correlations show a non-monotonic distance-decay pattern, and time-lagged cross-correlation identifies 23 anticipative junction pairs with 60–90 min lead times. The results could potentially help decision making when developing city-wide infrastructure and tuning traffic signals so that traffic can be optimised and adapt to both real-time natural and social effects. The resulting baselines map onto DATEX II (Data Exchange standard, CEN EN 16157) ElaboratedDataPublication fields, supporting metadata publication on the Hungarian National Access Point under EU Regulation 2022/670/EU.
1. Introduction
GPS-based data from probe vehicles have now become a standard tool for urban traffic monitoring. A fleet of instrumented vehicles provides speed and travel time data on the road sections they traverse, thereby enabling, in principle, network-wide coverage [1]. A device penetration rate of 2–3% is sufficient for reliably reconstructing traffic flow speeds [2]; with nearly 1100 vehicles, the fleet of iCell Kft. (a Hungarian fleet telematics company) approaches this within the Budapest network. The reliability of derived traffic indicators depends on correctly assigning each GPS record to the appropriate road segment, time window, and relevant temporal, societal and meteorological conditions.
The effect of precipitation on motor vehicle traffic has been documented in various urban contexts. Keay and Simmonds [3] found a negative correlation between rainfall and traffic intensity in Melbourne. Cools et al. [4] reported a 3–11% change in traffic volume on Belgian highways depending on the time of day and travel purpose. A companion study [5] further showed that under cold and rainy conditions, the demand for leisure travel decreases more than that for commuting. Agarwal et al. [6] identified a reduction in capacity on urban expressways in Iowa. Tsapakis et al. [7] showed asymmetric morning and afternoon responses in London travel times.
A literature review by Böcker et al. [8] noted that leisure trips are consistently more sensitive to weather than work-related trips. Koetse and Rietveld [9] provided an intermodal overview, confirming that precipitation increases congestion especially during peak hours. Saneinejad et al. [10] examined mode choice among Toronto commuters under varying weather conditions; Sabir [11] confirmed this finding using data from the Netherlands, demonstrating that precipitation and low temperatures significantly reduce the proportion of walking and cycling trips, while increasing the share of motorised modes among commuters with flexible mode choice.
The type of day and precipitation both influence traffic intensity and speed; however, the existing literature typically examines these factors in isolation and rarely integrates them into a unified, junction-level reference framework. The traffic impact of day type is not limited to the simple workday–weekend distinction. The traffic profile of statutory holidays differs significantly from both normal workdays and Sundays, yet aggregate analyses often fail to treat them as a distinct category. The spread of hybrid work habits following the pandemic has further distinguished midweek traffic patterns from those observed on Mondays and Fridays. In this study, we treat statutory holidays as a separate day type and quantify their traffic characteristics accordingly.
The spatial correlation of traffic flows at the node level has received less attention in the literature than aggregated traffic models. Anselin’s local spatial association indicators (LISA) [12] decompose the global Moran’s I index [13] into local components and provide a clustering measure for each individual node, while time-shifted cross-correlation [14] identifies lead–lag relationship node pairs. When combined with distance-based analysis, these two methods enable the characterisation of the spatial correlation structure of the Budapest network, revealing a non-monotonic, distance-decay pattern, documented here for the first time in the case of Budapest, the capital of Hungary.
The mapping of GPS tracks onto a road graph (map matching) forms the spatial basis of all floating car data-based (FCD) analyses. Quddus et al. [15] reviewed the main families of map matching algorithms. Brakatsoulas et al. [16] proposed a Fréchet-distance-based method suitable for noisy urban tracks. Jenelius and Koutsopoulos [17] developed a probabilistic principal component analysis model for forecasting urban network travel times from low-frequency probe data, demonstrating that spatial correlations in link travel times can be used to refine estimation accuracy.
Against this background, the present study addresses a specific research gap: a junction-level analysis that jointly resolves a set of day types (including public holidays), coupling it with a Voronoi-based meteorological assignment over an entire city, has not been identified yet. Existing studies typically link traffic either to weather or to a coarse day-type split (workday versus weekend), while this study combines the two major aspects. A further practical gap is that, at present, only floating car data of limited fleet size and a sparse meteorological station network are available. Accordingly, the aim of this research is to assess the way precipitation impacts traffic in Budapest, and to assess the way traffic is affected by the various day types (individual workdays, public holidays, weekends), at the same time. Based on the available data, this analysis could potentially help decision making when developing city-wide infrastructure and tuning traffic signals so that traffic can be optimised and adapt to both real-time natural and social effects. The corresponding hypotheses are: the traffic volumes of public holidays form a structurally distinct day type, separate from both Sundays and regular workdays; precipitation raises the morning peak volume while leaving the afternoon peak essentially unchanged; anticipative junction pairs indicating traffic flow exist. This work is positioned as basic research that establishes a methodological foundation and a development direction rather than a final, high-confidence operational model.
The paper is organised as follows. Section 2 describes the data and their day-type classification, as well as the six processing phases and statistical framework, including precipitation effect estimation, day-type baseline profiles, spatial correlation analysis and the mapping of DATEX II metadata. Section 3 presents the results by day type, precipitation conditions and spatial structure. Section 4 interprets and discusses the results, addressing the implications for DATEX II (CEN EN 16157) metadata publication.
2. Materials and Methods
The study area is Budapest, a city of approximately 1.75 million inhabitants within a 525 km2 administrative area. The River Danube divides the city into hilly Buda (west bank) and the lowland Pest (east bank), which differ in both road network topology and traffic response characteristics.
2.1. Data
2.1.1. GPS Fleet Data (iCell Kft.)
GPS track data were provided from iCell Kft.’s fleet tracking system under a research data-sharing agreement; ownership of the dataset remains with the company. The vehicles are equipped with OBU (On-Board Unit) data loggers that record WGS84 latitude/longitude coordinates, instantaneous speed (km/h), heading (in degrees from north), and a UTC (Coordinated Universal Time) Unix timestamp approximately every 10 s. The study period covers 1 November 2024 to 31 December 2025, comprising a total of 426 calendar days. The dataset contains nearly 1100 unique vehicle identifiers, yielding a total of 44,106,342 raw position records. Table 1 shows the monthly record counts following preprocessing and map matching (described in Section 2.2.1 and Section 2.2.3).
Table 1.
Monthly GPS record counts after preprocessing filters. Study period: 1 November 2024–31 December 2025.
The fleet consists predominantly of light commercial, delivery vehicles and company cars. This fleet structure may exhibit systematic differences relative to the full traffic population, particularly during congested peak periods compared to mixed traffic. However, this does not bias relative comparisons across day types and weather conditions, as the fleet composition remained essentially stable during the study period.
2.1.2. Meteorological Data
The 10 min precipitation totals and air temperature data were obtained from five automatic weather stations operated by HungaroMet Nonprofit Zrt. (Hungarian National Meteorological Service), located within or near the administrative boundaries of Budapest. The data were provided in ZIP-compressed CSV files with a 10 min time resolution. The stations use different file encodings (latin-1 and UTF-8), requiring encoding standardisation during decompression to ensure correct parsing of numerical measurement fields. Table 2 lists the stations along with their EOV/HD72 (Egységes Országos Vetület, Hungarian National Grid, EPSG:23700) coordinates and the network zones assigned to them.
Table 2.
HungaroMet monitoring stations used in the analysis. EOV coordinates are given in metres; zone assignments are derived from the Voronoi tessellation described in Section 2.2.5.
2.1.3. Road Network Geometry
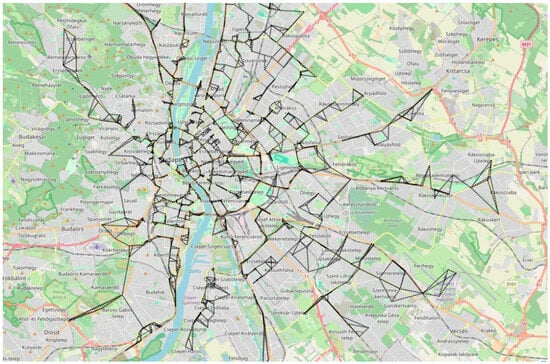
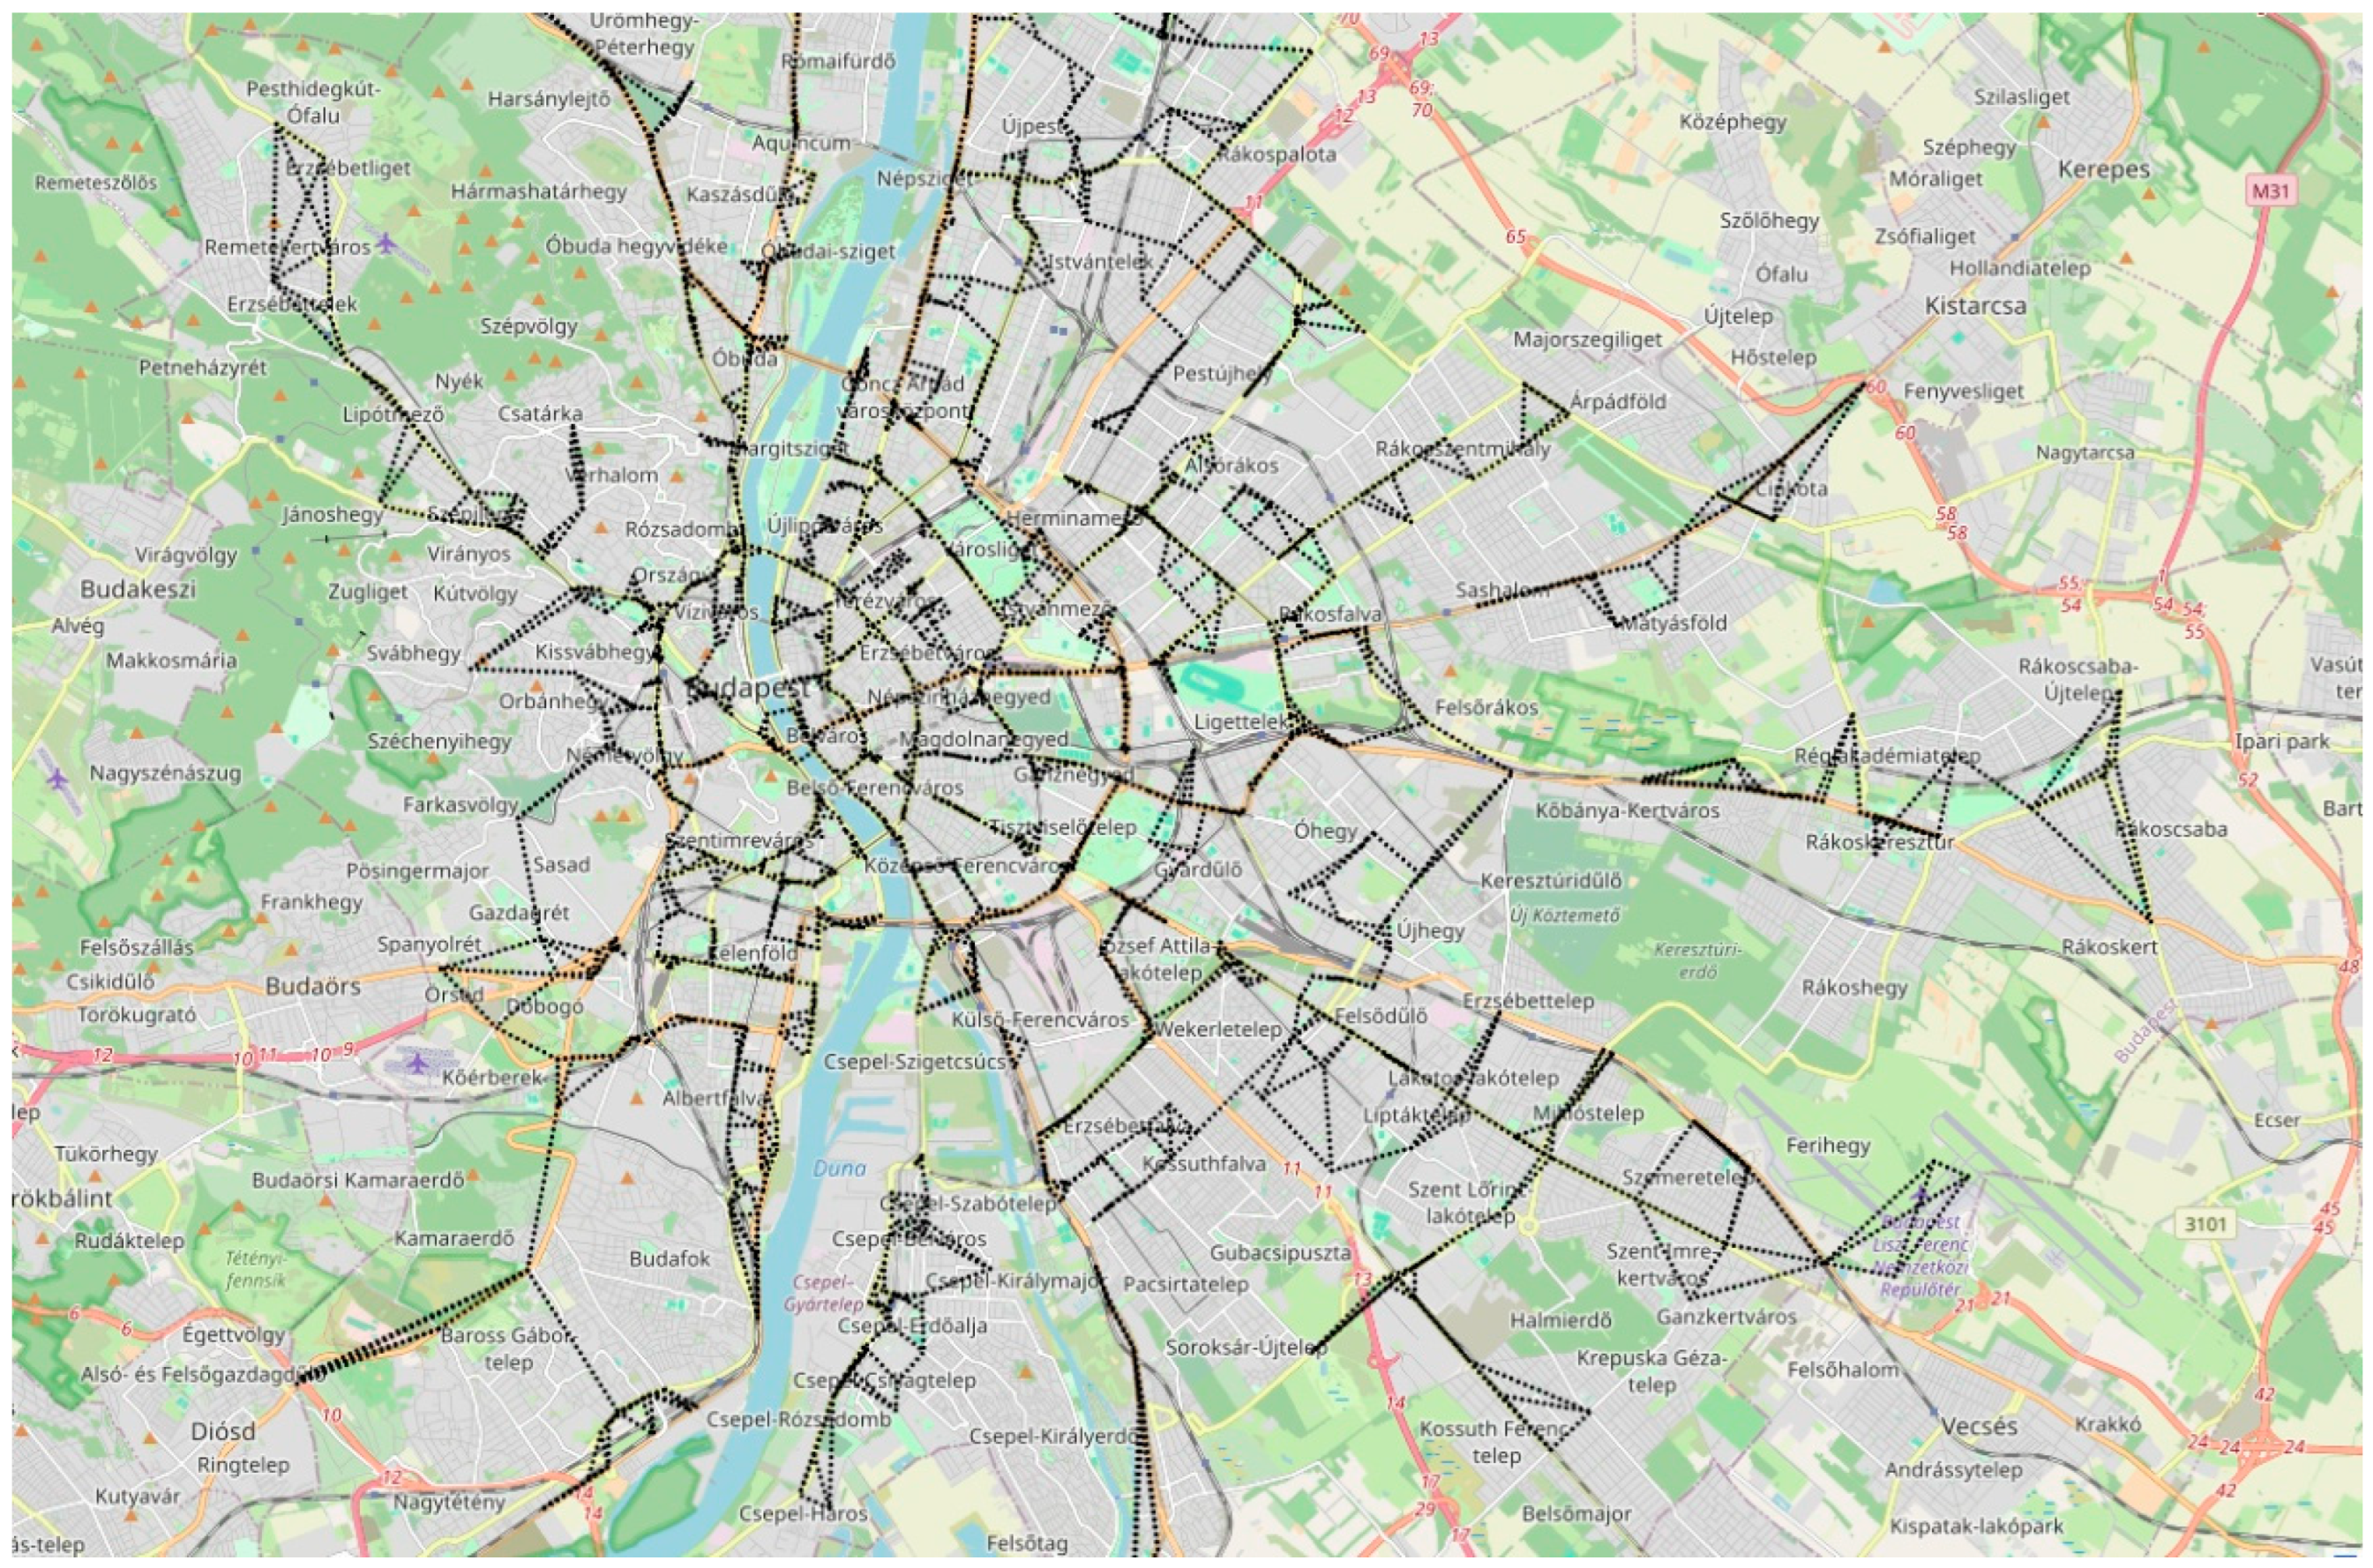
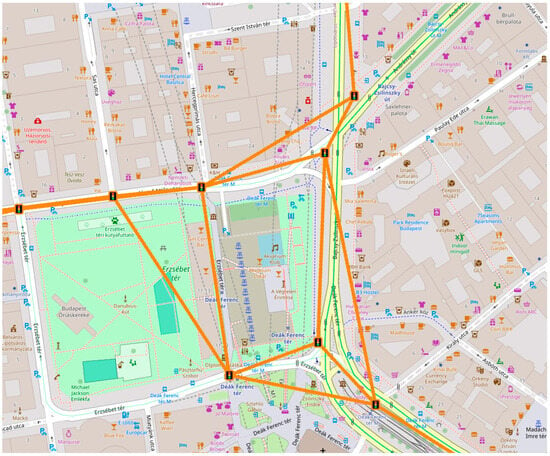
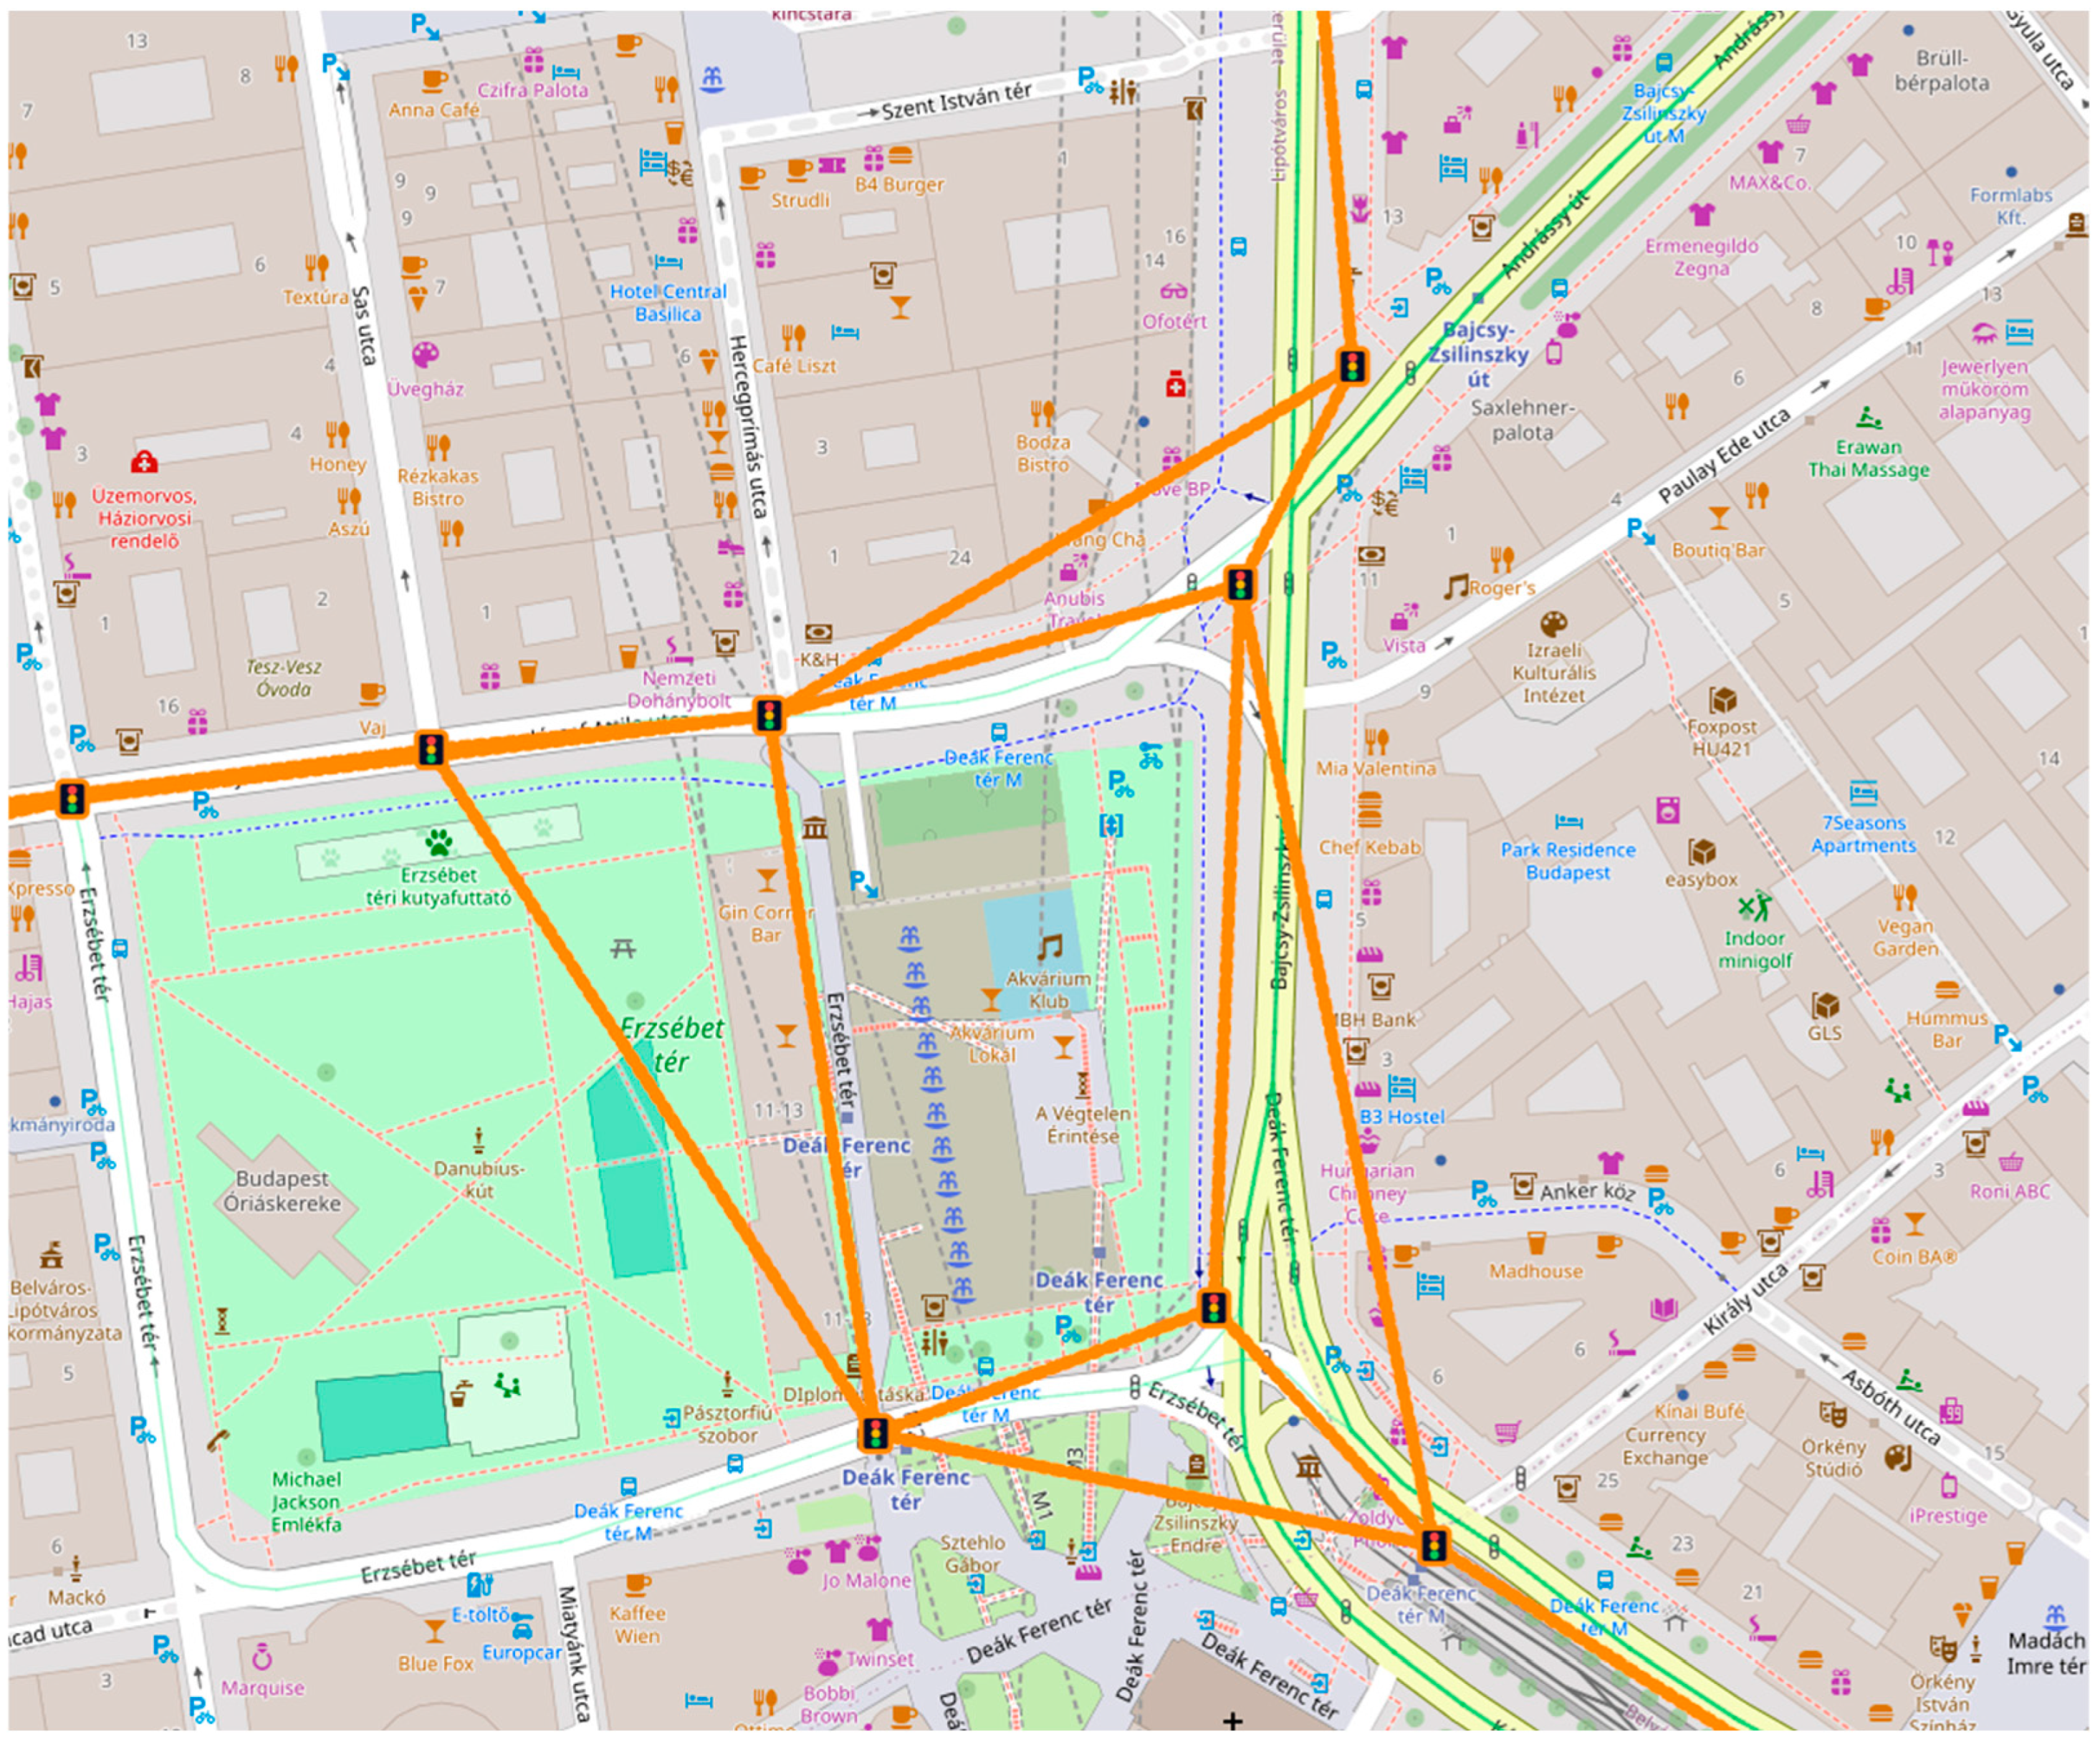
The directed road network graph covers all road segments open to vehicular traffic within the administrative boundaries of Budapest. The network spans the full administrative area of Budapest (Figure 1), with a partial section of the network shown in detail in Figure 2. The graph was derived from OpenStreetMap data, queried via the Overpass API: nodes were restricted to signalised intersections carrying the “highway = traffic_signals” tag, and the directed edges represent the road segments connecting them. After excluding service roads and pedestrian routes, the graph contains 1189 nodes and 3847 directed edges in the EOV CRS (EPSG:23700). The structure of the nodes is [node ID, Y, X, zone ID]. Attributes of an example record for a node are [10042, 650968, 237140, 44505]. Edges have attributes indicating the node IDs being connected (e.g., 10041 and 10042), length (e.g., 143 m), bearing (e.g., 274°), and road type (e.g., one-way). The node coordinates are used in both the Voronoi cell-based zone allocation (Section 2.2.5) and the spatial autocorrelation calculations.
Figure 1.
The road network graph used for the analysis, showcasing the full extent of the study area. Basemap: © OpenStreetMap.
Figure 2.
A portion of the road network graph used for the analysis. The signalised intersections are depicted with a traffic light symbol. Additional edges between nearby junctions were introduced to support lead–lag (precedence) analysis. Basemap: © OpenStreetMap.
2.1.4. Day-Type Classification
Traffic volume varies regularly depending on the day of the week, public holidays, and the school calendar. We distinguished seven day types: Monday (normal workday), Tuesday–Thursday (normal workdays, collectively “midweek” days), Friday (normal workday), Saturday, Sunday, statutory public holidays, and Saturdays designated as workdays (workday substitutes). Within the normal workday categories, we refer to Mondays and Fridays as “regular” (threshold days showing transitional effects) and Tuesdays through Thursdays as “midweek” days. This distinction reflects differences observed in daily traffic profiles in the later analysis. Since public holidays can differ in nature, due to their heterogeneity, correlation estimates for public holidays carry wider uncertainty than other day types.
This classification covers all 426 days of the study period in accordance with the 2024 and 2025 Hungarian public holiday schedule calendar. We treat statutory holidays as a separate category and do not combine them with Sundays, as their traffic profiles differ significantly from both Sundays and normal working days, as shown in Section 4.2.
We selected dry Mondays as the reference category: they are minimally affected by confounding calendar and weather effects, thus most clearly reflecting peak-period commuter demand; all other day types are expressed as percentages relative to this baseline. Table 3 shows the distribution of day types during the study period. The “Junction volume relative to Monday dry (%)” column indicates the percentage of the median junction-level traffic volume measured during the morning peak period (06:00–09:00) for each day type compared to the average for the same period on dry Mondays.
Table 3.
Day-type distribution across the study period (1 November 2024–31 December 2025, n = 426 days).
2.2. Processing Methodology
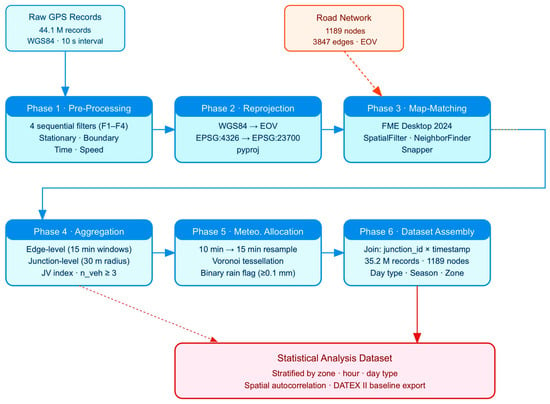
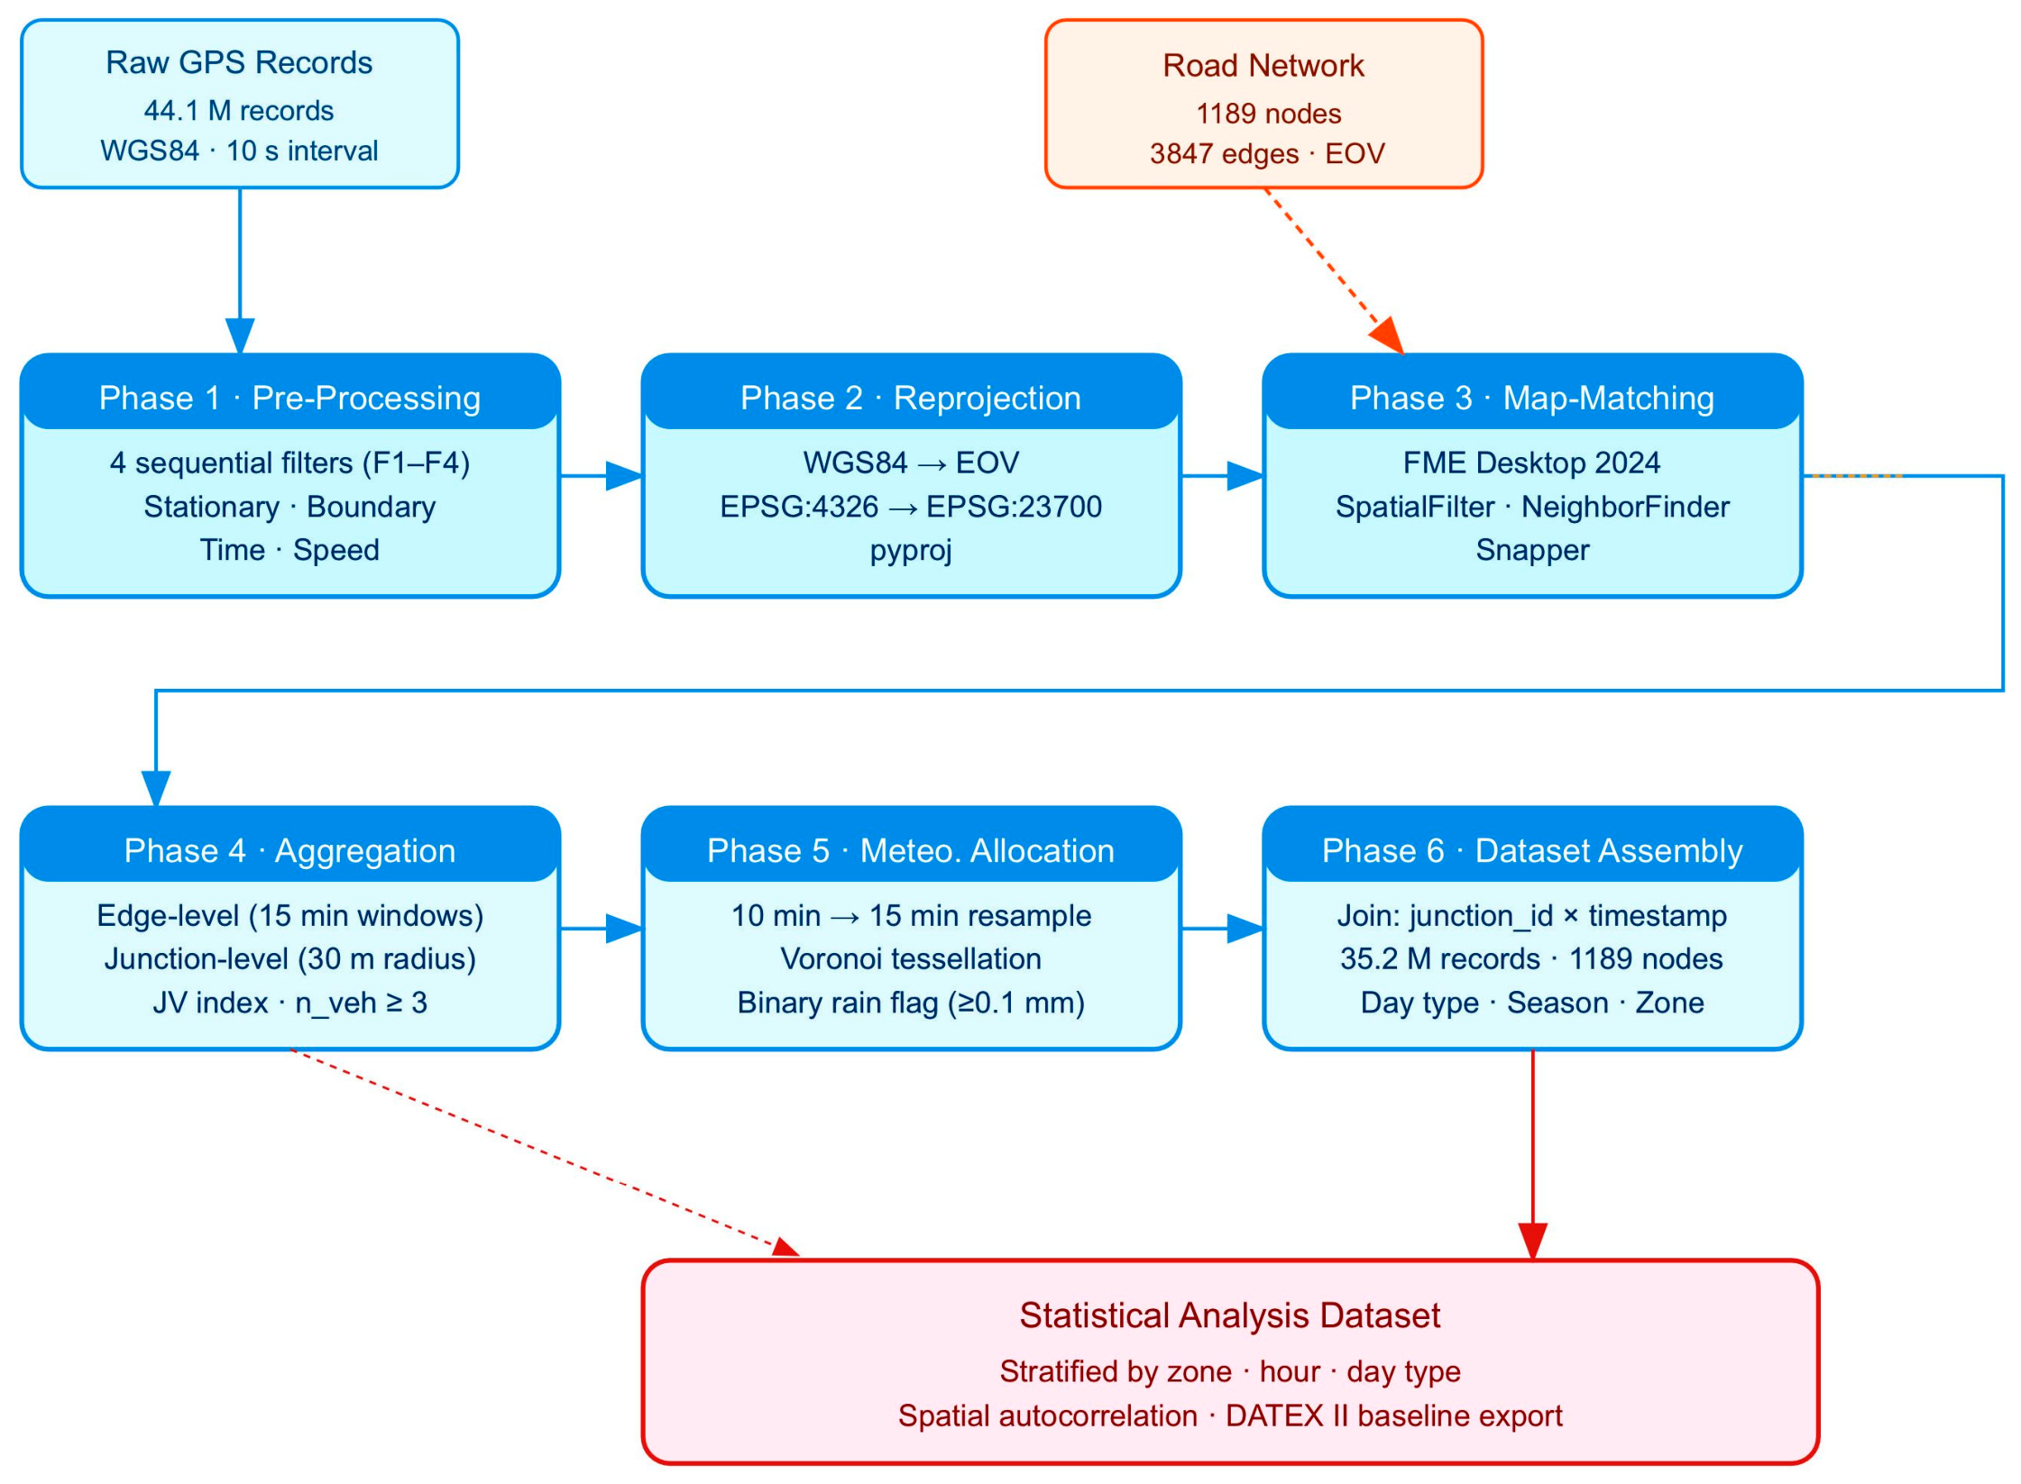
The processing workflow generates a node-level traffic dataset derived from raw GPS position records and supplemented with information on day type and meteorological conditions. This dataset is produced in six phases (see Figure 3): preprocessing and outlier removal; coordinate reprojection; FME-based map matching; segment- and junction-level aggregation; meteorological data resampling and spatial assignment; and final dataset assembly. The estimation of the precipitation impact and the day-type and spatial-correlation analyses described in the following subsections are likewise an integral part of this methodology, applied to the assembled dataset.
Figure 3.
Flow diagram of the developed six-phase processing workflow.
In the Python 3.11 implementation, all modules use chunked reading (Pandas 3.0.2 read_csv(), with a chunk size of 500,000 rows) to stay within the available 8 GB RAM. Intermediate outputs are written to Parquet files. Each phase can be rerun independently, without reprocessing the entire dataset.
2.2.1. Phase 1: Preprocessing of GPS Tracks
Four filters were applied to the raw GPS records, in sequential order.
- Filter 1 (F1)—Stationary data. For any sequence of three or more consecutive records with a vehicle speed of 0 km/h, the second and subsequent records are removed, while the first data point with 0 km/h is retained as a genuine stopping event. This removes dwell time duplication and reduces GPS-signal loss periods.
- Filter 2 (F2)—Data outside spatial boundary. Records outside the Budapest administrative area are removed by checking the spatial relationship between the GPS records and the Budapest area polygon using Shapely 2.1.2. The source for the area polygon is OpenStreetMap (relation: Budapest (37244)).
- Filter 3 (F3)—Temporal window. The UTC timestamps are converted to local times. Records with local times before 05:00 or after 22:00 are excluded. The analysis focuses on the active traffic day. Night-time records predominantly represent maintenance and logistics movements that are not representative of the commuting and leisure demand under study.
- Filter 4 (F4)—Speed outliers. Records with speed exceeding 180 km/h are removed as GPS measurement errors. This threshold is set conservatively above the maximum legal speed on any road in the study area (130 km/h on urban expressways).
Table 4 shows the number of records removed by the filters, sequentially.
Table 4.
GPS preprocessing filters applied sequentially to the raw iCell dataset. Percentages are of the running total of records at each step.
2.2.2. Phase 2: Coordinate Reprojection
All subsequent spatial operations require metric distances. The 38.6 million retained records are reprojected from WGS84 (EPSG:4326) to the EOV Hungarian National Grid (EPSG:23700) using pyproj 3.6 (a Python interface to the PROJ coordinate transformation library). EOV is an oblique conformal cylindrical projection (based on the HD-72 datum on ellipsoid IUGG67/GRS67), providing high positional accuracy over the territory of Hungary. This enables accurate distance-based calculations in subsequent steps.
2.2.3. Phase 3: Feature Alignment and Map Matching in FME
Map matching assigns each reprojected GPS record to a directed road segment. The workflow runs in FME Desktop 2024 (Feature Manipulation Engine, a geospatial data integration and transformation platform developed by Safe Software) as a server-executable workspace. We apply four transformer modules sequentially: feature preselection, direction-constrained nearest-neighbour matching, logging of unmatched records, and orthogonal projection.
The SpatialFilter transformer selects labelled directed edges from the road graph using a 50 m buffer around each GPS point. This typically reduces the candidate set of edges from 3847 to 2–6 per point and reduces the computational load of the subsequent distance calculation by approximately 95%.
The NeighborFinder transformer selects the geometrically closest labelled edge satisfying a ±25° tolerance between the vehicle’s instantaneous heading and the edge’s azimuth, consistent with direction-constrained matching practice for urban networks [15]. The ±25° threshold was determined empirically as the range at which point-to-edge assignment accuracy seemed to be the highest (90–95%). At wider tolerances, accuracy dropped to approximately 70% or below, because a point may satisfy the directional threshold for an edge that is geometrically close but topologically incorrect. This risk is amplified by the historically evolved, non-orthogonal geometry of the Budapest network, in which adjacent road sections frequently do not join perpendicularly [18], so an overly permissive angular window would allow more false assignments. The directional constraint also handles two errors: two-way road pairs, where the opposite direction is the geometrically closer edge, and one-way streets, where only one direction is valid. While checking against this threshold could introduce systematic mismatches while matching records of vehicles at low speeds especially at nearby junctions (due to degraded heading accuracy), on the used dataset this did not produce conspicuous errors.
The Tester transformer directs unaligned records to a diagnostic log. A monthly review of the log identifies recurring alignment errors caused by new road construction, network geometry errors, or GPS logger firmware updates. Unmatched records account for 5.8% of the filtered dataset. Post-analysis indicates that 3.1% can be attributed to GPS outages lasting longer than 10 s (typically in underground parking garages and tunnels), while 2.7% are due to road segments shorter than 50 m.
The Snapper transformer projects every aligned GPS point perpendicularly onto the aligned edge, retaining both the original GPS coordinate and the projected point in the output. This step is necessary for the accuracy of the node-distance calculation performed in Phase 4.
After map matching, 36,354,652 records are assigned to directed edges (94.2% of the filtered dataset and 82.4% of the raw dataset). The matching rate is stable month-to-month: 94.1–94.3% relative to the filtered records (Table 1).
2.2.4. Phase 4: Segment- and Junction-Level Aggregation
The matched records are aggregated in two steps.
First, the records are grouped by directed edge and a 15 min time window, producing per-edge per-window statistics: mean speed (), minimum speed, maximum speed, and unique vehicle count (n_veh). Time windows follow the convention [HH:MM, HH:MM+15). Windows with n_veh < 3 are discarded.
Secondly, the edge-level records are spatially joined to junction nodes. For each node, all incoming directed edges whose midpoint falls within a 30 m radius contribute their n_veh to a junction traffic volume index, JV. For junction j at time t,
where JV(j, t) denotes the normalised junction traffic volume index at junction j and time interval t; ∑ = sum over all contributing directed edges e; n_veh(e, t) = unique vehicle count on edge e in the 15 min interval t; = long-run mean vehicle count at junction j across all dry regular-workday intervals in the 06:00–09:00 morning peak band (junction-specific normalisation constant). JV = 1.0 indicates reference load; values above or below 1.0 are directly interpretable as percentage deviations. This junction-specific normalisation renders JV values comparable across nodes regardless of the number of contributing edges or their absolute base volumes.
2.2.5. Phase 5: Resampling and Spatial Assignment of Meteorological Data
HungaroMet data are provided at 10 min intervals. To resample the data for the 15 min grid, linear interpolation is used for temperature and a conservative binary rule is used for precipitation: the 15 min interval is classified as rainy (P = 1) if either of the two adjacent 10 min records indicates ≥0.1 mm of accumulated precipitation; otherwise, P = 0. This conservative threshold ensures that intervals on the margins of a rainfall event, where wet road surfaces or altered driving behaviour may already be present, are not misclassified as dry.
Spatial assignment follows the Voronoi cell method of Okabe et al. [19]. The Voronoi diagram is calculated using scipy.spatial.Voronoi (SciPy 1.13, a Python library for scientific computing) based on the EOV coordinates of the five stations and is clipped by the administrative polygon of Budapest. Each of the 1189 nodes is assigned to the station in whose Voronoi cell the node lies. The assignment is a static lookup table; it is recalculated only when the station network changes. The five network zones included in the analysis were defined based on the Voronoi cell boundaries.
2.2.6. Phase 6: Final Dataset Assembly
The node traffic table (Phase 4) and the meteorological table (Phase 5) are linked using a composite identifier (node_id, timestamp_15 min). Each row of the resulting dataset contains: a node ID, a 15 min timestamp, a node traffic index, a binary precipitation indicator (P), air temperature, day type (one of seven categories), and network zone. As an example for a final junction node and its attributes: junction ID 10042, 12 March 2025 at 07:30, traffic index 1.14, rain present, a Tuesday–Thursday weekday type, in the South-inner zone. Air temperature is only stored as a descriptor attribute for future analyses, but is not used as an explanatory variable in the present study.
The final dataset contains 34,556,960 valid node-interval records, covering 1189 nodes and the 426-day study period. Table 5 summarises the dataset by network zone. The traffic index is normalised using junction-specific reference values defined in Section 2.2.4.
Table 5.
Final dataset by network zone after all processing steps. Volume reference = mean dry regular-workday morning peak value for that zone.
In the following steps, all statistical comparisons are conducted by zone, time of day, and day type, so that each rainy observation is compared with dry observations from the same zone, the same time slot, and the same day type category.
2.2.7. Estimation of Precipitation Impact
Estimating the impact of precipitation reveals insights into whether rain causes traffic volume deviations at junctions, and, if so, how prominent this impact is. As one of the key objectives of the study, this explores the relationship between weather and traffic in Budapest, also to be later combined with day-type distinction in the analysis.
The precipitation effect for stratum (zone z, hour h, day type d) is estimated as
where ΔJV(z, h, d) = precipitation-induced junction traffic volume deviation (%) for stratum (z, h, d); z = network zone; h = clock hour band; d = day-type category; = mean junction traffic volume index under rainy conditions in stratum (z, h, d); = mean junction traffic volume index under dry conditions in the same stratum, used as the reference denominator.
Statistical significance is assessed with Welch two-sample t-tests (unequal variances). p-values are Bonferroni-corrected for the 17 h-band strata tested per zone–day-type combination. A deviation is reported as significant only if it survives correction at α = 0.05.
2.2.8. Day-Type Reference Profiles
As the other key objective, the day-type profiling tests whether the day-type categories we defined are actually distinguishable in the data, based on traffic volumes.
For each intersection and day-type category, a median-diurnal profile based on the dry intervals of that category is calculated. The median was chosen over the mean because it is more robust against atypical days caused by accidents, road closures, or major events. The profiles were calculated for public holidays separately and not combined with the profiles for Sundays and weekdays. We characterise the distance between individual day-type profiles using the pairwise Pearson correlation of the median diurnal curves; where this value is below r = 0.90, we consider the two day types to be structurally distinct.
2.2.9. Spatial Correlation Analysis
The spatial correlation analysis then reveals how traffic volumes on junctions move together and which junctions lead others in time, which is what makes proactive control conceivable.
We calculate the Moran I index and the LISA indices [12] based on morning rush-hour traffic intensity at nodes (junctions). For the distance-dependent analysis, we classify all 706,716 unique node pairs into 500 m-wide distance bands. Within each band, we determine the Pearson correlation of the two nodes’ JV series (dry normal-weekday morning peaks). The average correlation obtained for each band as a function of the band’s median distance is plotted, to illustrate the network’s spatial correlation structure.
We calculate the time-shifted cross-correlations [14] between node pairs for delays of 0, 1 and 2 h. We consider node A to be anticipatory of node B if the lag-1 or lag-2 correlation between A’s JV series and B’s delayed JV series exceeds the lag-0 correlation by at least 0.05 and the delayed correlation itself is at least 0.70.
2.2.10. DATEX II Metadata Mapping
The DATEX II standard (CEN EN 16157) [20] defines an XML schema for the exchange of traffic data. We publish intersection traffic counts as “MeasuredDataPublication” records containing “vehicleFlow” fields. Day-type-based reference profiles are published as derived indicators in ElaboratedDataPublication records and are tagged with a dayType qualifier corresponding to one of the seven categories defined in Section 2.1.4. Precipitation indicators are added as separate meteorological ElaboratedDataPublication records and are assigned to nodes using the Voronoi assignment table in Section 2.2.5. This three-layer structure (real-time data, day-type-based reference framework and meteorological context) enables data users to select appropriate reference profiles for the given conditions.
Conforming to the standard is supposed to make the results usable beyond the paper. In the DATEX II structure the values can be published on the standard European platforms and fed into traffic-control equipment as an external input. Moreover, the relevant EU regulation expects baseline data of this kind to be published in exactly this format on the national access point. This mapping is therefore the operational endpoint of the method.
3. Results
3.1. Precipitation Impact on Morning and Afternoon Peaks
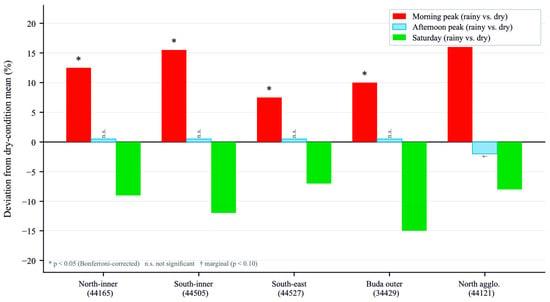
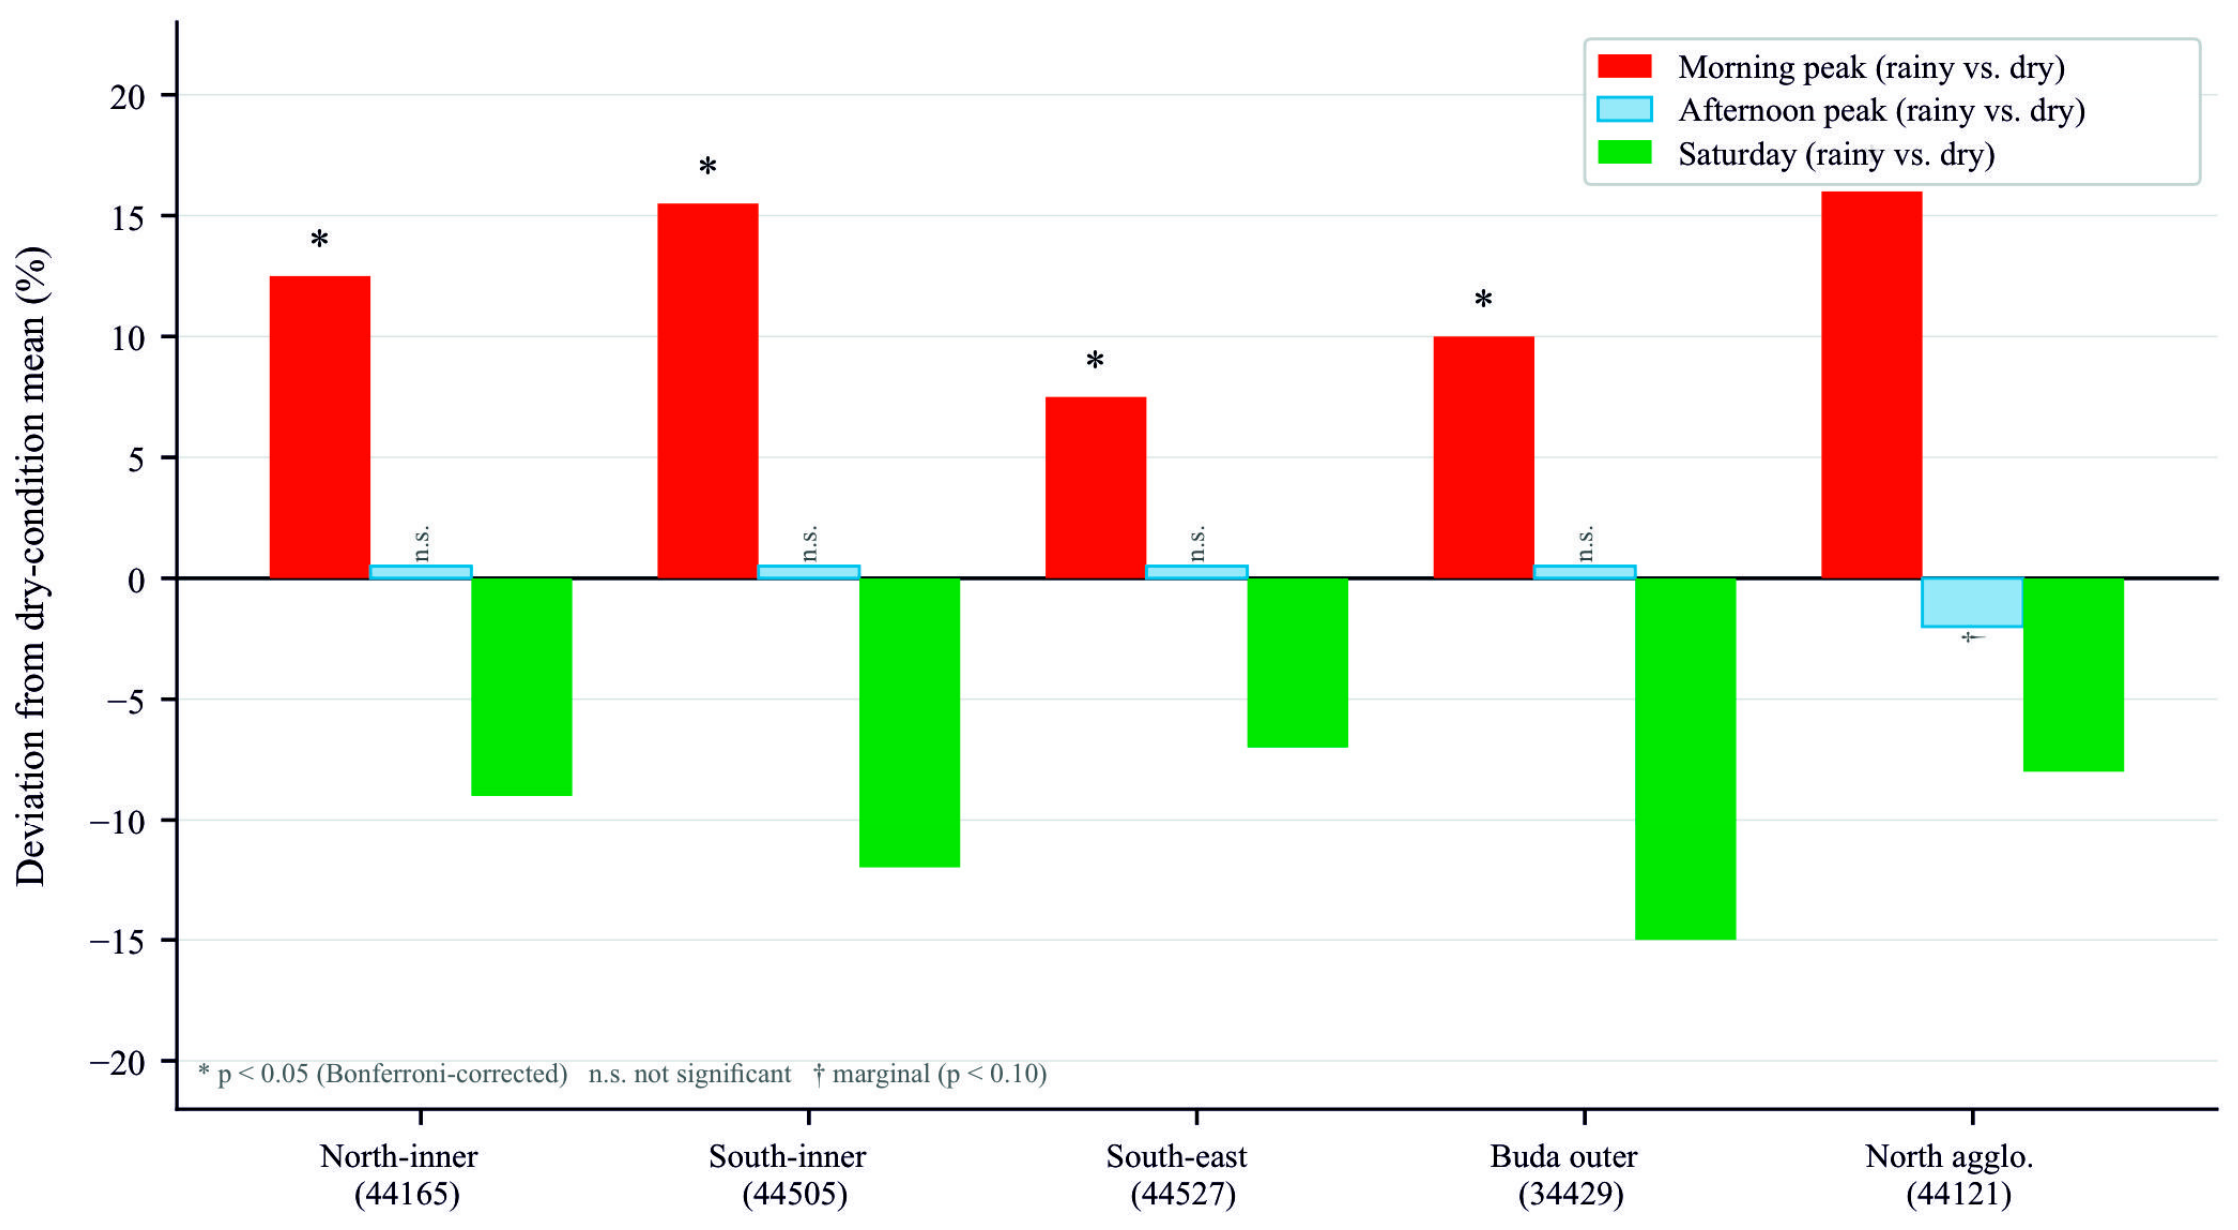
Table 6 and Figure 4 show the changes in the junction traffic volume index caused by precipitation during the morning (6:00–9:00 a.m.) and afternoon (3:00–7:00 p.m.) peaks in the five zones. The deviations during the morning peak are positive and significant (Bonferroni-corrected p < 0.05) in all five zones, ranging from +6% to +17%. By contrast, afternoon peak deviations are not significant in four zones. The northern agglomeration shows a marginal negative value of approximately −2%, which does not survive the Bonferroni correction.
Table 6.
Precipitation-induced junction traffic volume deviations (% relative to dry-condition stratum mean) for morning and afternoon peaks by zone; n.s. = not significant after Bonferroni correction.
Figure 4.
Precipitation-induced junction traffic volume deviations (% relative to dry-condition stratum mean) for morning peak, afternoon peak and Saturday across five network zones. * p < 0.05 after Bonferroni correction. n.s. = not significant. † p < 0.10; does not survive Bonferroni correction.
The morning–afternoon asymmetry is consistently observed in all five zones. Previous studies, e.g., Chung et al. [21], have shown that on the Tokyo Metropolitan Expressway demand declines significantly more on rainy weekends than on weekdays, which supports the differing sensitivities of various days. This pattern is consistent with the hypothesis that commuters are less likely to change their travel behaviour in the morning peak than in the afternoon. This was also suggested by Khattak and De Palma in their Brussels survey [22]. Rain reduces traffic by 7–15% on Saturdays in all zones, which is consistent with the weather sensitivity of leisure travel [8]. Moran’s I value = 0.28 (p < 0.001), calculated for morning peak deviation, indicates positive spatial clustering: rain-sensitive nodes are concentrated near major entry points and mode-shift nodes. Overall, precipitation effects exhibit a consistent temporal asymmetry, with significant amplification during the morning peak and negligible impact in the afternoon.
3.2. Day-Type Reference Profiles
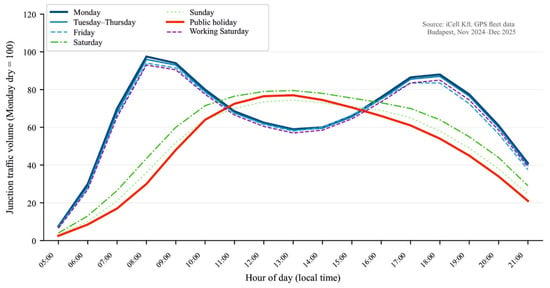
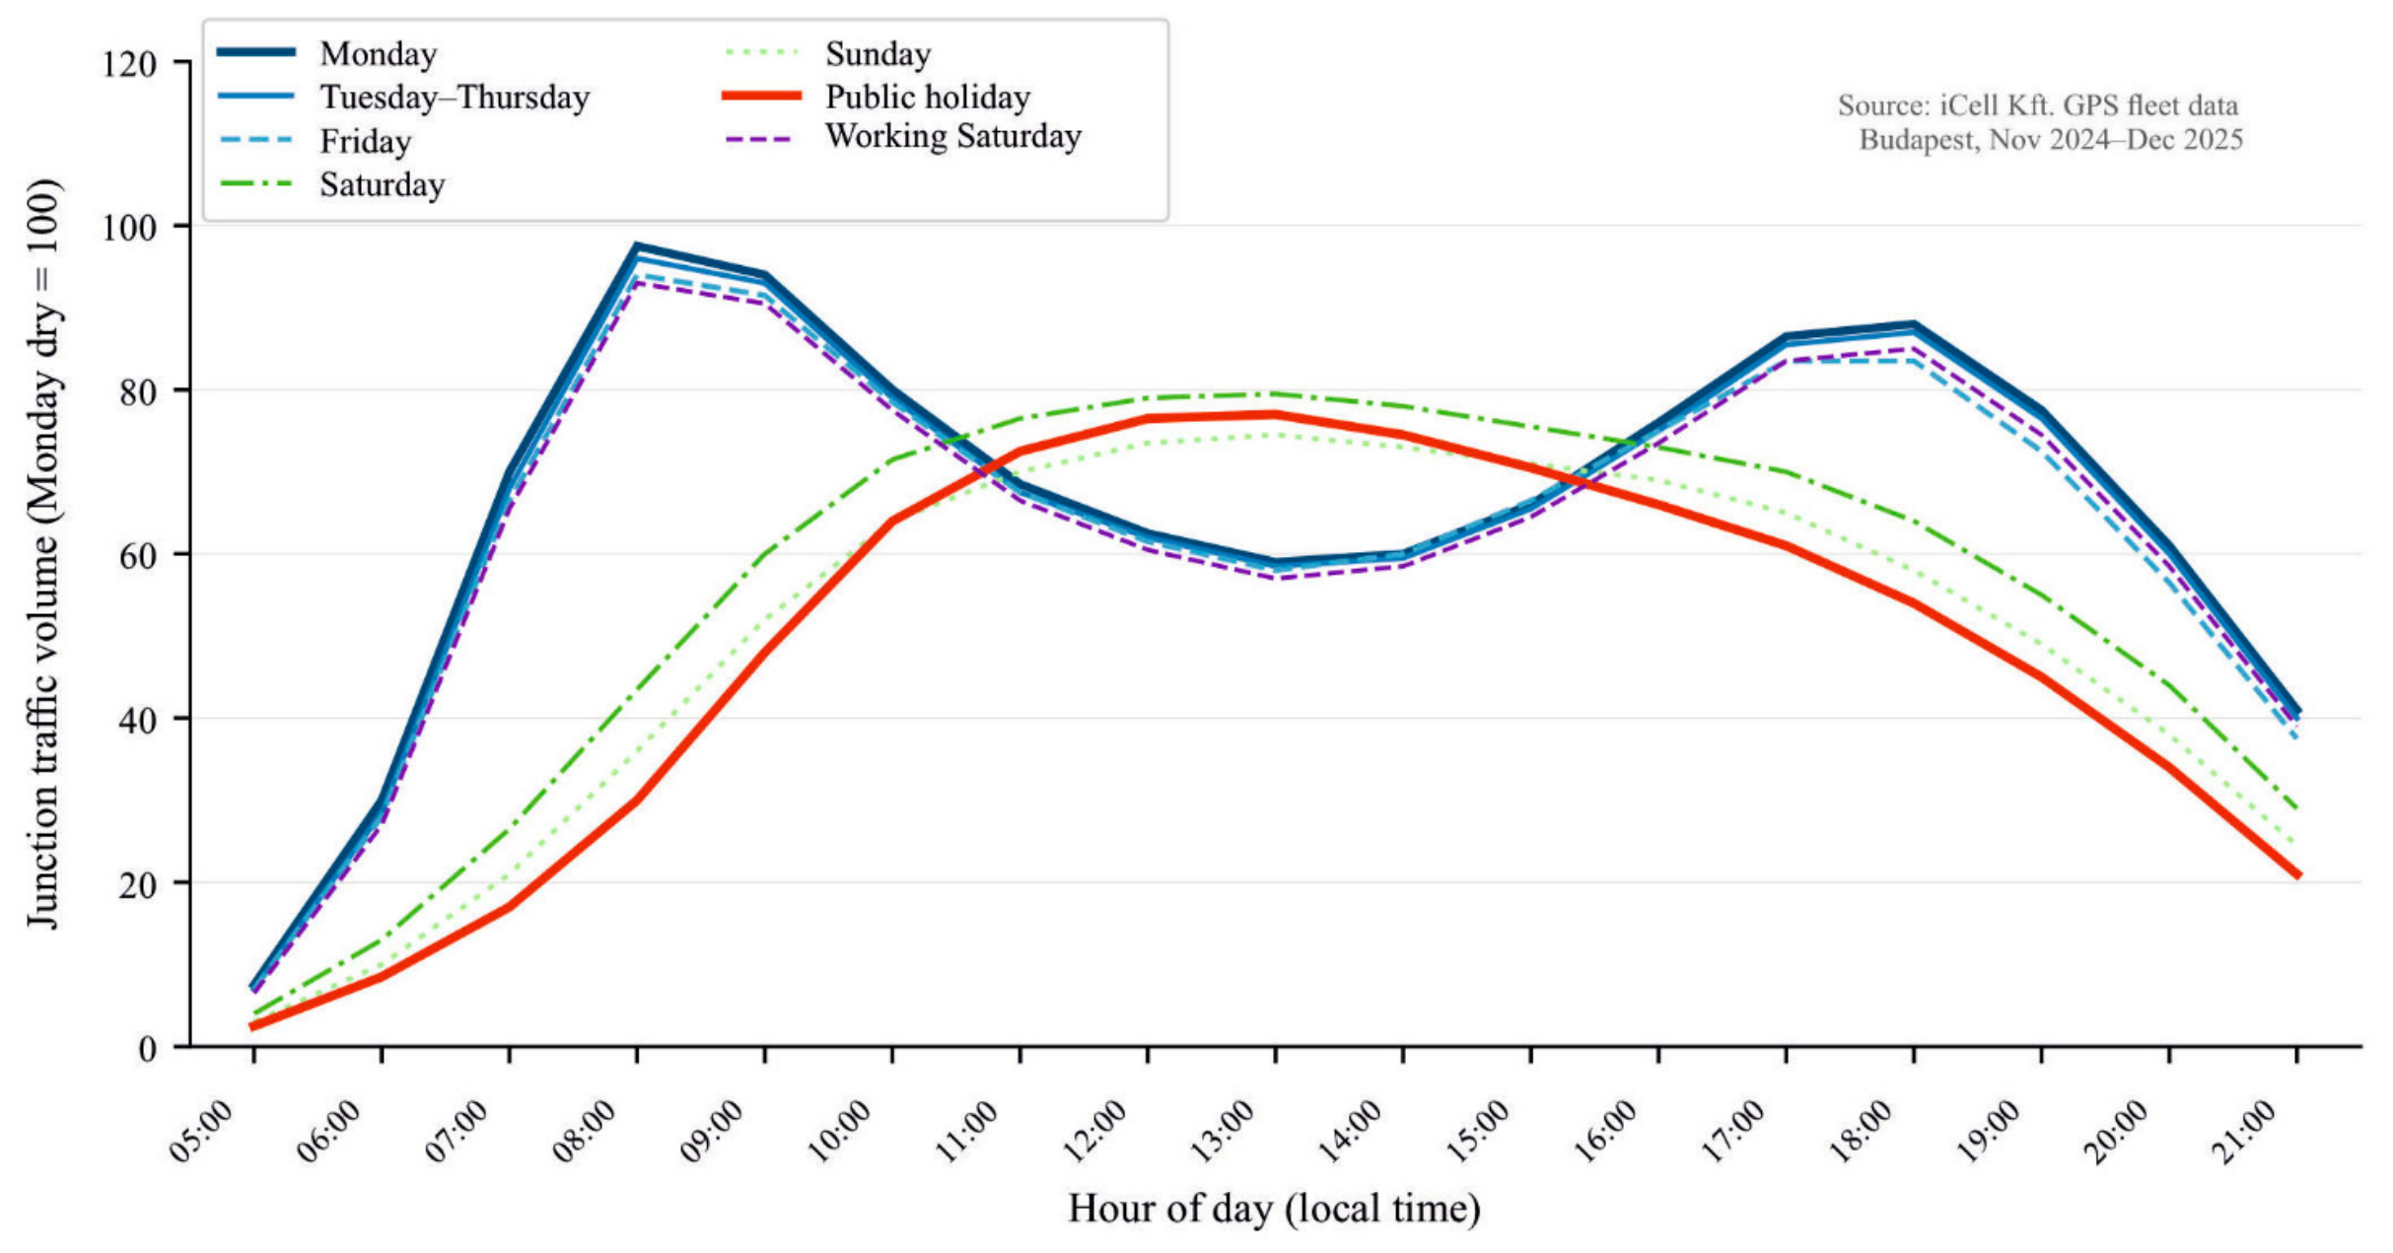
Day-type reference profiles are based on dry-weather days, ensuring that the reference profiles are free from precipitation-induced distortion. Figure 5 shows the diurnal traffic volume profile for each of the seven day-type categories, averaged across the three inner-city zones (44165, 44505, 34429). Even though the three selected inner zones contain different numbers of junctions, the average of the junction traffic volume indices is unweighted, as weighting the average by junction count would introduce a bias for a denser junction distribution, regardless of the actual traffic volume. Public holidays show a profile that is structurally distinct from regular workdays (inter-profile r = 0.42, 99% CI [0.417, 0.423]) with the morning peak delayed to 09:00–11:00 instead of 06:00–09:00, and somewhat distinct from Sundays (r = 0.71, 99% CI [0.709, 0.711]), showing lower afternoon volumes. Pooling public holidays with Sundays would therefore introduce systematic bias in the resulting reference profiles.
Figure 5.
Median diurnal traffic volume profiles by day type, averaged across the three inner-city zones (44165, 44505, 34429). Each curve represents the median dry-day profile for that day-type category. Public holidays show a structurally distinct profile from regular workdays, and a somewhat distinct profile from Sundays, with a difference visible in early and late traffic volumes.
Table 7 gives the inter-profile Pearson correlation matrix for all seven day types. Correlations below 0.90 (classification threshold for structural distinctness, Section 2.2.8) appear in italics. The matrix confirms that public holidays, Sundays, and Saturdays each form structurally distinct categories. Among weekday profiles, Monday shows a strong correlation with the Tue–Thu composite (r = 0.97, 99% CI [0.9699, 0.9701]) and Friday (r = 0.95, 99% CI [0.9499, 0.9501]), while the Mandated Saturday profile aligns most closely with Friday (r = 0.97, 99% CI [0.9695, 0.9705]), reflecting its working-day character.
Table 7.
Inter-profile Pearson correlation matrix for seven day-type median diurnal traffic volume profiles (dry conditions, inner-city zones). Values below the structural distinctness threshold of r = 0.90 appear in italics.
3.3. Wednesday Precipitation Anomaly
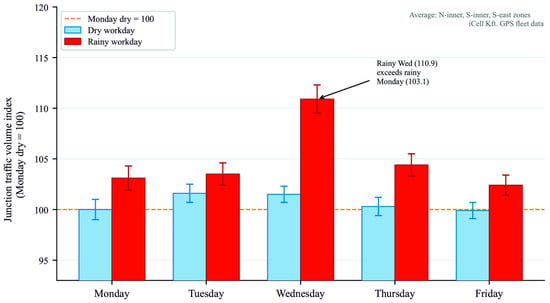
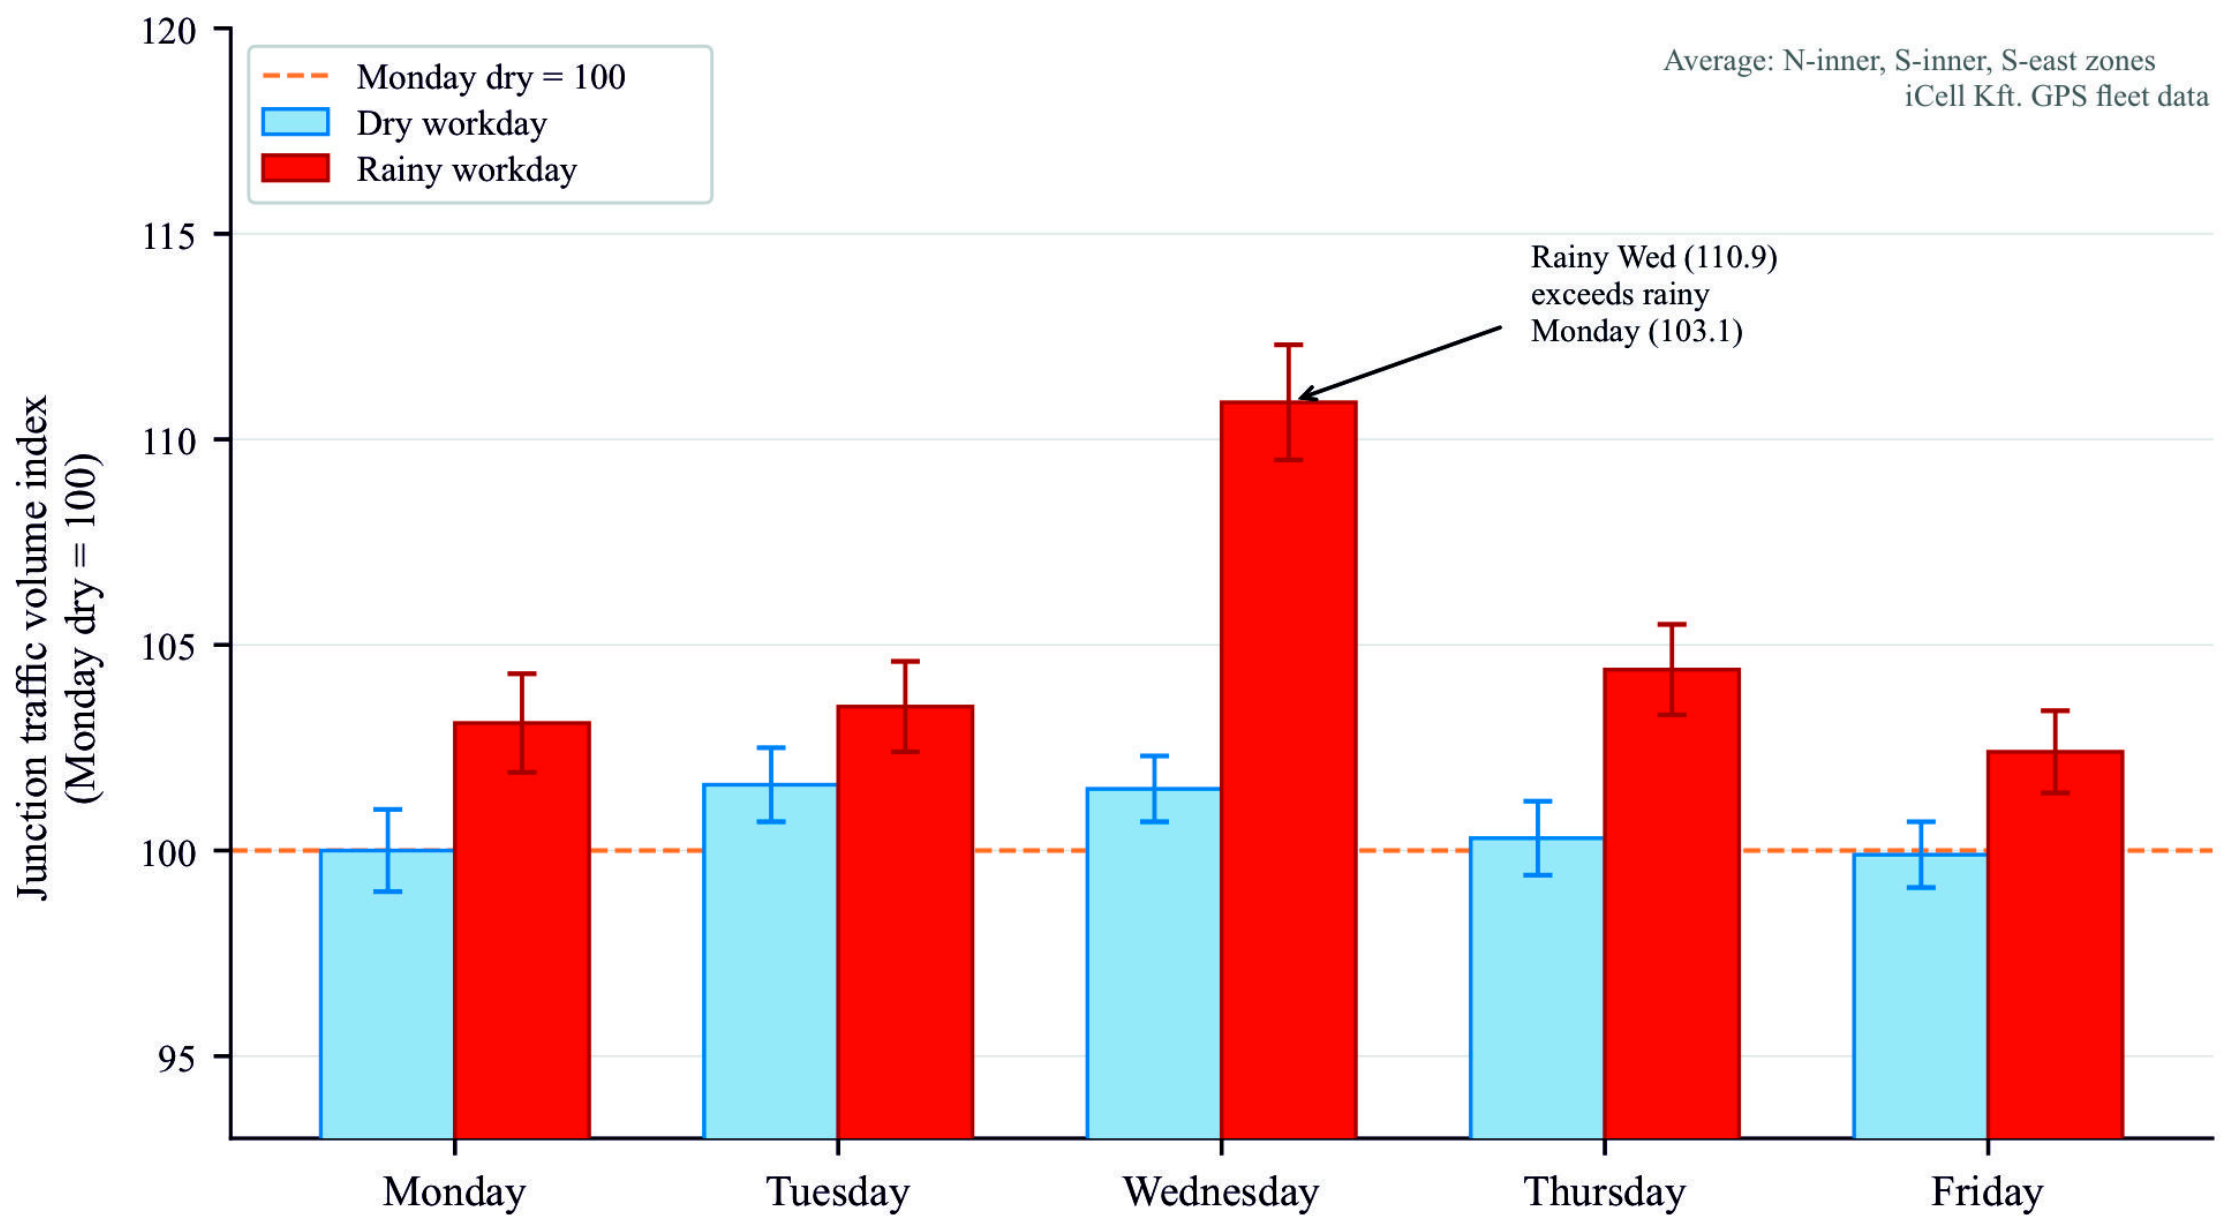
Within the workday group, Wednesday shows an anomalous response to rain. On dry Wednesdays, morning peaks in the three inner zones average 101–103% of the Monday dry reference, reflecting the hybrid work-from-home scheduling typical of midweek. On rainy Wednesdays, the same zones average 109–112%—above even the rainy-Monday level (102–105%). Figure 6 shows this at the junction level.
Figure 6.
Morning peak junction traffic volume index (Monday dry = 100) for dry and rainy workdays, averaged across the three inner-city zones (44165, 44505, 44527). Error bars = ±1 SE. The Wednesday rainy value (110.9) exceeds the rainy-Monday level.
The Buda outer zone shows the reverse: rainy Wednesday junction traffic volume is 95.1% of the reference, below both dry Wednesday (100.2%) and rainy Monday (106.3%). This contrast suggests zone-specific behavioural responses, which are examined further in Section 4.
3.4. Spatial Correlation Structure and Distance Decay
The Pearson correlation between morning rush-hour traffic volumes at intersections, plotted against the distance between intersections in 500 m intervals, does not exhibit a monotonic pattern. Correlations are high for nearby pairs (average r = 0.81 for those within 500 m), decrease to a local minimum at around 2.0–2.5 kilometres (average r = 0.54), partially recover at around 4.5–5.5 km (average r = 0.64) and then decrease again above 7 km. This partial recovery is consistent with junction pairs located on the radial main route, which experience synchronised commuter demand regardless of their physical distance. This non-monotonic pattern is consistent with the hierarchical structure of the Budapest road network.
Time-lagged cross-correlation analysis identified 23 leading node pairs where the lag-1 (one-hour) correlation exceeded the lag-0 correlation by more than 0.05 and where the lagged correlation itself exceeded 0.70. These pairs are concentrated at the points where the main radial corridors enter the city and at the Danube bridge crossings. This is consistent with kinematic wave propagation spreading from the agglomeration into the internal network [23].
4. Discussion
4.1. Precipitation, Mode Change and Trip Deferral
The current findings regarding the morning–afternoon asymmetry are consistent with the results of previous studies conducted in Melbourne, Belgium, Iowa and London, which were carried out in different cities, using different measurement methods and at different times.
At the node level, the results are more detailed: according to LISA clustering, rain-sensitive intersections are concentrated near locations with high modal transfer potential and major entry points. This spatial concentration suggests that traffic management interventions during rainy periods may be most effective when targeted at these locations. The 7–15% decrease in Saturday traffic is consistent with the known weather sensitivity of leisure trips [8] and the mode-shift results of Saneinejad et al. [10], suggesting that on leisure-dominated days precipitation suppresses trip generation rather than redirecting it to motorised modes.
4.2. Public Holidays as a Distinct Traffic Pattern
The traffic profile on public holidays differs significantly from that on Sundays (r = 0.71, 99% CI [0.709, 0.711]) and normal working days (r = 0.42, 99% CI [0.417, 0.423]). The later and lower morning peak reflects the absence of commuter traffic and a higher proportion of leisure and tourist travel. Combining public holidays with Sundays would result in underestimation of traffic between 09:00 and 11:00 by 15–25%, while simultaneously overestimating afternoon traffic by a similar margin. A public holiday qualifier is therefore necessary for ElaboratedDataPublication records in DATEX II to ensure the reference profiles remain accurate.
4.3. Spatial Correlation and Network Structure
The non-monotonic, distance-dependent pattern is explained by the radial structure of the Budapest network. The partial recovery of correlation observed at 4.5–5.5 km corresponds to the typical distance between the inner ring road and outer radial access points. This implies that equidistant sensor placement may be suboptimal for network configuration, as medium-distance node pairs carry independent information, whereas the signals in long radial corridor pairs are partially redundant. The preceding node pairs provide a lead time of 60–90 min for modifying the downstream signal, which is consistent with kinematic wave theory [23]. The empirical findings translate into a set of operational implications for traffic management and data publication systems.
4.4. Operational Recommendations
Based on the results, four operational recommendations can be formulated.
4.4.1. Rainy Morning Traffic Light Control
If precipitation is expected or observed, the rainy morning signal plan should extend the green phase duration by 10–15% for traffic entering the radial corridors between 6:00 a.m. and 9:00 a.m. No systematic weather-dependent adjustments are necessary for the afternoon signal plan within the analysed dataset. A separate entry should be incorporated for Wednesdays in the plan selection logic: on dry Wednesdays, a milder plan (101–103% of Monday’s plan) is warranted, but on rainy Wednesdays, the full rainy morning plan must be applied.
4.4.2. Separation of the Light Control Used on Public Holidays and on Sundays
A separate signal timing plan should be prepared for public holidays rather than simply adopting the Sunday plan. Morning peak traffic on public holidays falls between 9:00 a.m. and 11:00 a.m., and there is also less afternoon traffic than on Sundays. A Sunday-based plan would therefore underestimate morning demand and overallocate green time in the afternoon period.
4.4.3. Anticipative Monitoring of Priority Nodes
The 23 preceding node pairs should be designated as priority monitoring points. In these pairs, the real-time JV value measured at the upstream nodes provides a lead time of 60–90 min before the demand wave reaches the internal network. Threshold crossing rules, which are calibrated using historical lag-1 distributions, can be implemented in existing SCADA (Supervisory Control and Data Acquisition) systems without the need for additional hardware.
4.4.4. DATEX II Metadata Enrichment
As described in Section 2.2.10, the three-layer DATEX II architecture must be implemented at the Hungarian National Access Point (NAP) in accordance with Regulation (EU) 2022/670 [24]. Together, the public holiday qualifier, the precipitation indicator linked to Voronoi cell division, and the anticipative demand propagation indices enable navigation and logistics services to select appropriate reference profiles for the given conditions.
4.5. Limitations
Two main limitations apply. Firstly, the Voronoi meteorological assignment uses five stations to cover an area of 525 km2, meaning convective summer showers with a spatial extent of less than 5 km are not resolved. This does introduce some uncertainty that may influence the results. Resolving smaller local showers would require a denser meteorological observation network across the city. The findings still provide a concrete argument for convincing decision-makers in Budapest that investment in denser urban meteorological data collection, tightly integrated with urban traffic data to optimise traffic flow, is worthwhile. Secondly, the study period (November 2024–December 2025) covers the process of post-pandemic normalisation of work patterns. Therefore, the magnitude of the Wednesday anomaly should be re-estimated annually.
5. Conclusions
A six-phase GPS data processing pipeline was applied to 44.1 million, 10 s resolution floating car data records across 1189 nodes in Budapest (November 2024–December 2025), producing a spatiotemporal baseline framework that jointly models day type and precipitation.
The principal findings are as follows:
- Public holidays constitute a traffic flow pattern structurally distinct from both Sundays (inter-profile r = 0.71, 99% CI [0.709, 0.711]) and regular workdays (r = 0.42, 99% CI [0.417, 0.423]), with a later morning peak and lower afternoon flows. Pooling public holidays with Sundays would introduce systematic profile errors of 15–25% in the 09:00–11:00 window.
- Precipitation increases morning peak junction traffic volumes by 6–17% across all five zones while leaving afternoon peaks statistically unchanged. Saturday volumes decrease by 7–15%, consistent with the higher weather sensitivity of discretionary travel.
- Rainy Wednesdays reach 109–112% of the Monday dry reference in three inner zones, exceeding even rainy Monday levels. The Buda outer zone shows the reverse (95.1%), suggesting zone-specific behavioural responses under precipitation.
- Pairwise junction correlations exhibit a non-monotonic distance-decay pattern: high at short range, a local minimum at 2.0–2.5 km, and partial recovery at 4.5–5.5 km corresponding to arterial corridor pairs. This structure indicates medium-distance junction pairs as providing the most independent monitoring information.
- Time-lagged cross-correlation reveals 23 anticipative junction pairs with 60–90 min lead times, concentrated at city entry points and Danube bridge crossings.
- The framework maps directly onto a three-layer DATEX II architecture (live junction traffic volumes, contextual baseline with day-type qualifier, and meteorological context), supporting metadata enrichment on the Hungarian National Access Point under EU Regulation 2022/670/EU.
The presented methodology would be applicable to any city, provided the city is within operational GNSS-coverage (no major jamming events or malfunctions happening at the time of data collection), there is a vehicle fleet capable of recording real-time position (FCD) and heading information, and the city operates multiple meteorological stations that record data in a high temporal resolution (preferably every 10 min). If these conditions are present, the methodology would be applicable in any city by combining the two major data sources.
Future work will extend the precipitation classification to multiple categories (e.g., dry/light rain/heavy rain or winter conditions), incorporate the anticipative junction structure into a short-term forecasting model, and support deployment of the DATEX II feed to the Hungarian National Access Point. Comprehensive validation remains future work: it would require the city’s traffic-counter data and data from large GPS-tracking mapping services, against which the estimates could be benchmarked. The methodology is not specific to Budapest, and broadening both the vehicle fleet and the meteorological station network is the principal route to higher-confidence, operationally deployable results.
Author Contributions
Conceptualisation, Z.F.-N. and Z.G.T.; methodology, Z.F.-N.; software, Z.F.-N.; formal analysis, Z.F.-N.; investigation, Z.F.-N., Z.G.T. and D.B.; data curation, Z.F.-N.; writing—original draft preparation, Z.F.-N.; writing—review and editing, Z.F.-N., Z.G.T. and D.B.; visualisation, Z.F.-N.; supervision, Z.G.T. All authors have read and agreed to the published version of the manuscript.
Funding
This research received no external funding.
Data Availability Statement
The original data presented in the study are openly available at https://ikelte-my.sharepoint.com/:f:/g/personal/mor1ef_inf_elte_hu/IgCC1O0wpDwyRZd7SF0sB7NqAXy8DmhQxrSMLaJFAAAQZ48 (accessed on 21 May 2026). Meteorological station records are available from HungaroMet Nonprofit Zrt. (https://odp.met.hu/, accessed on 18 June 2026).
Conflicts of Interest
The authors declare no conflicts of interest.
Abbreviations
The following abbreviations are used in this manuscript:
| DATEX II | Data Exchange standard, CEN EN 16157 |
| EOV | Egységes Országos Vetület, Hungarian National Grid (EOV/HD72, EPSG:23700) |
| FCD | Floating Car Data |
| FME | Feature Manipulation Engine (Safe Software Inc.) |
| JV | Junction Traffic Index (normalised from GPS fleet data) |
| LISA | Local Indicators of Spatial Association |
| NAP | National Access Point |
| OBU | On-Board Unit |
| SCADA | Supervisory Control and Data Acquisition |
References
- Jenelius, E.; Koutsopoulos, H.N. Travel time estimation for urban road networks using low frequency probe vehicle data. Transp. Res. Part B Methodol. 2013, 53, 64–81. [Google Scholar] [CrossRef] [Scilit]
- Herrera, J.C.; Work, D.B.; Herring, R.; Ban, X.; Jacobson, Q.; Bayen, A.M. Evaluation of traffic data obtained via GPS-enabled mobile phones: The Mobile Century field experiment. Transp. Res. Part C Emerg. Technol. 2010, 18, 568–583. [Google Scholar] [CrossRef] [Scilit]
- Keay, K.; Simmonds, I. The association of rainfall and other weather variables with road traffic volume in Melbourne, Australia. Accid. Anal. Prev. 2005, 37, 109–124. [Google Scholar] [CrossRef] [Scilit] [PubMed]
- Cools, M.; Moons, E.; Wets, G. Assessing the impact of weather on traffic intensity. Weather Clim. Soc. 2010, 2, 60–68. [Google Scholar] [CrossRef] [Scilit]
- Cools, M.; Moons, E.; Creemers, L.; Wets, G. Changes in travel behavior in response to weather conditions: Do type of weather and trip purpose matter? Transp. Res. Rec. 2010, 2157, 22–28. [Google Scholar] [CrossRef] [Scilit]
- Agarwal, M.; Maze, T.H.; Souleyrette, R. Impacts of weather on urban freeway traffic flow characteristics and facility capacity. In Proceedings of the 2005 Mid-Continent Transportation Research Symposium, Ames, IA, USA, 18–19 August 2005; pp. 1–14. [Google Scholar]
- Tsapakis, I.; Cheng, T.; Bolbol, A. Impact of weather conditions on macroscopic urban travel times. J. Transp. Geogr. 2013, 28, 204–211. [Google Scholar] [CrossRef] [Scilit]
- Böcker, L.; Dijst, M.; Prillwitz, J. Impact of everyday weather on individual daily travel behaviours in perspective: A literature review. Transp. Rev. 2013, 33, 71–91. [Google Scholar] [CrossRef] [Scilit]
- Koetse, M.J.; Rietveld, P. The impact of climate change and weather on transport: An overview of empirical findings. Transp. Res. Part D 2009, 14, 205–221. [Google Scholar] [CrossRef] [Scilit]
- Saneinejad, S.; Roorda, M.J.; Kennedy, C. Modelling the impact of weather conditions on active transportation travel behaviour. Transp. Res. Part D 2012, 17, 129–137. [Google Scholar] [CrossRef] [Scilit]
- Sabir, M. Weather and Travel Behaviour. Ph.D. Thesis, Vrije Universiteit Amsterdam, Amsterdam, The Netherlands, 2011. Available online: http://dare.ubvu.vu.nl/handle/1871/19500 (accessed on 18 June 2026).
- Anselin, L. Local indicators of spatial association—LISA. Geogr. Anal. 1995, 27, 93–115. [Google Scholar] [CrossRef] [Scilit]
- Moran, P.A.P. Notes on continuous stochastic phenomena. Biometrika 1950, 37, 17–23. [Google Scholar] [CrossRef] [Scilit]
- Hamilton, J.D. Time Series Analysis; Princeton University Press: Princeton, NJ, USA, 1994. [Google Scholar]
- Quddus, M.A.; Ochieng, W.Y.; Noland, R.B. Current map-matching algorithms for transport applications: State-of-the-art and future research directions. Transp. Res. Part C 2007, 15, 312–328. [Google Scholar] [CrossRef] [Scilit]
- Brakatsoulas, S.; Pfoser, D.; Salas, R.; Wenk, C. On map-matching vehicle tracking data. In Proceedings of the 31st International Conference on Very Large Data Bases (VLDB), Trondheim, Norway, 30 August–2 September 2005; ACM: New York, NY, USA, 2005; pp. 853–864. [Google Scholar]
- Jenelius, E.; Koutsopoulos, H.N. Urban network travel time prediction based on a probabilistic principal component analysis model of probe data. IEEE Trans. Intell. Transp. Syst. 2018, 19, 436–445. [Google Scholar] [CrossRef] [Scilit]
- Boeing, G. Urban spatial order: Street network orientation, configuration, and entropy. Appl. Netw. Sci. 2019, 4, 67. [Google Scholar] [CrossRef] [Scilit]
- Okabe, A.; Boots, B.; Sugihara, K.; Chiu, S.N.; Kendall, D.G. Spatial Tessellations: Concepts and Applications of Voronoi Diagrams, 2nd ed.; Wiley: Chichester, UK, 2000. [Google Scholar] [CrossRef] [Scilit]
- CEN EN 16157; Intelligent transport systems—DATEX II data exchange specifications for traffic management and information. CEN Technical Committee 278, Road Transport and Traffic Telematics: Brussels, Belgium, 2018.
- Chung, E.; Ohtani, O.; Warita, H.; Kuwahara, M.; Morita, H. Effect of rain on travel demand and traffic accidents. In Proceedings of the 8th IEEE International Conference on Intelligent Transportation Systems (ITSC 2005), Vienna, Austria, 13–16 September 2005; IEEE: New York, NY, USA, 2005; pp. 1080–1083. [Google Scholar] [CrossRef] [Scilit]
- Khattak, A.J.; De Palma, A. The impact of adverse weather conditions on the propensity to change travel decisions: A survey of Brussels commuters. Transp. Res. Part A 1997, 31, 181–203. [Google Scholar] [CrossRef] [Scilit]
- Lighthill, M.J.; Whitham, G.B. On kinematic waves. II. A theory of traffic flow on long crowded roads. Proc. R. Soc. Lond. A 1955, 229, 317–345. [Google Scholar] [CrossRef] [Scilit]
- European Commission. Commission Delegated Regulation (EU) 2022/670 of 2 February 2022 Supplementing Directive 2010/40/EU of the European Parliament and of the Council with Regard to the Provision of EU-Wide Real-Time Traffic Information Services. Off. J. Eur. Union 2022, L122, 1–16. [Google Scholar]

Disclaimer/Publisher’s Note: The statements, opinions and data contained in all publications are solely those of the individual author(s) and contributor(s) and not of MDPI and/or the editor(s). MDPI and/or the editor(s) disclaim responsibility for any injury to people or property resulting from any ideas, methods, instructions or products referred to in the content. |
© 2026 by the authors. Licensee MDPI, Basel, Switzerland. This article is an open access article distributed under the terms and conditions of the Creative Commons Attribution (CC BY) license.