1. Introduction
Understanding the spatial behavior of population groups is vital for urban and regional planning, especially in forecasting travel volumes and determining necessary infrastructure requirements [
1,
2,
3]. Travel behavior models are generally based on the premise that, despite variations in how individuals interact with space and the differences in their locational patterns, underlying similarities can be identified or assumed [
4,
5,
6]. Prior to the establishment of comprehensive data collection methods, identifying individual spatial trajectories was a formidable challenge and was often limited to small population samples [
7,
8]. However, the recent data revolution has made it possible for researchers to examine societal travel behavior using extensive datasets [
9,
10,
11]. Our paper capitalizes on this opportunity by presenting empirical results from a massive analysis of mobile cellular data, using a robust data-processing methodology and clustering algorithm.
To meet operational demands like billing, capacity management, and business development, mobile phone service providers routinely collect data on subscriber activity [
12]. Despite the extensive nature of these datasets, they are primarily generated as a by-product of business operations and are infrequently analyzed within broader social or economic frameworks [
13,
14]. While there are concerns about hype, overvaluation, bias, and emerging challenges [
15,
16,
17,
18,
19], the use of extensive datasets now offers researchers an unprecedented opportunity to advance our understanding of human behavior. Compared to conventional survey methodologies, mobile phone data possess distinct characteristics that open new avenues for social research [
20]. Since mobile devices are routinely carried by their users, they provide ‘in situ’ data, meaning that the ‘sensor’ is either in direct contact with, or in close proximity to, the observed phenomena, unlike remote observation techniques [
21]. Consequently, there is a growing scholarly interest in leveraging mobile phones as sensors to measure and analyze human behavior [
9,
22,
23,
24,
25].
Using this approach, researchers aim to examine geographical findings related to travel behavior or activity space estimations [
2,
3,
26,
27]. Early studies emphasized the analysis of tourism statistics and patterns of tourist movement [
10,
28,
29]. Other investigations employed cellular data to estimate local daytime population densities [
11,
30] or to analyze origin–destination matrices and commuting patterns, specifically identifying residential and workplace locations and commuting modalities [
13,
14,
31]. Moreover, mobile phone data have been integrated into urban big data frameworks and used in smart city contexts to address issues such as urban social positioning, spatial classification, and the monitoring of visitor mobility [
5,
32,
33,
34,
35]. The inherently spatiotemporal nature of mobile phone data has led researchers to increasingly focus on identifying and quantifying spatial mobility patterns. For example, González et al. [
36] examined user trajectories and found strong regularities in human dynamics. Candia et al. [
37] demonstrated how spatiotemporal anomalies can be characterized by analyzing the average collective behavior captured through mobile phone data during unusual events. Phithakkitnukoon et al. [
6] explored daily activity patterns, concentrating on routine behaviors such as dining, shopping, entertainment, and recreation, while Gao [
38] utilized a space–time cube framework to examine human mobility trends and intra-urban communication patterns. Additionally, a recent study by Ogushi et al. [
39] investigated the differences in mobility patterns between urban and rural residents, providing additional insight into the spatial heterogeneity of human movement behaviors.
This study contributes to the ongoing discourse on GIS-based human mobility analytics by focusing on user profiling and the identification of similarly behaving population groups in an unprecedentedly large dataset of mobile phone users. Previous studies have addressed key issues such as solutions for the georeferencing of mobile cell data [
40,
41] and the connection between territorial mobility indicators and socio-economic variables [
42]; however, their limitations have often posed constraints (such as the inaccuracy of Voronoi tessellation-based estimations [
43,
44] or the limited spatial and social interconnections with data [
45]). Particularly in the case of processes that cannot be distinctly partitioned spatially, challenges have arisen regarding the creation of overlapping and transitional fuzzy groups instead of direct population group delineations [
46]. Existing scholarly publications have only presented individual components of the outlined complex task [
44]; therefore, the sequential methodological logic applied in our study can be considered unique. Our study is positioned as incremental rather than disruptive, aiming to incorporate nationally developed georeferencing for mobile cell data, mobility metrics, and fuzzy clustering.
Our first objective is to develop an efficient methodology for detecting groups of individuals who exhibit similar behavioral patterns. The research proposes GIS-assisted mobility metrics and introduces fuzzy clustering and visualization techniques tailored to mobile phone-based spatial behavior analysis.
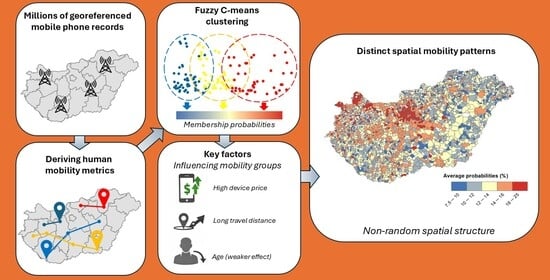
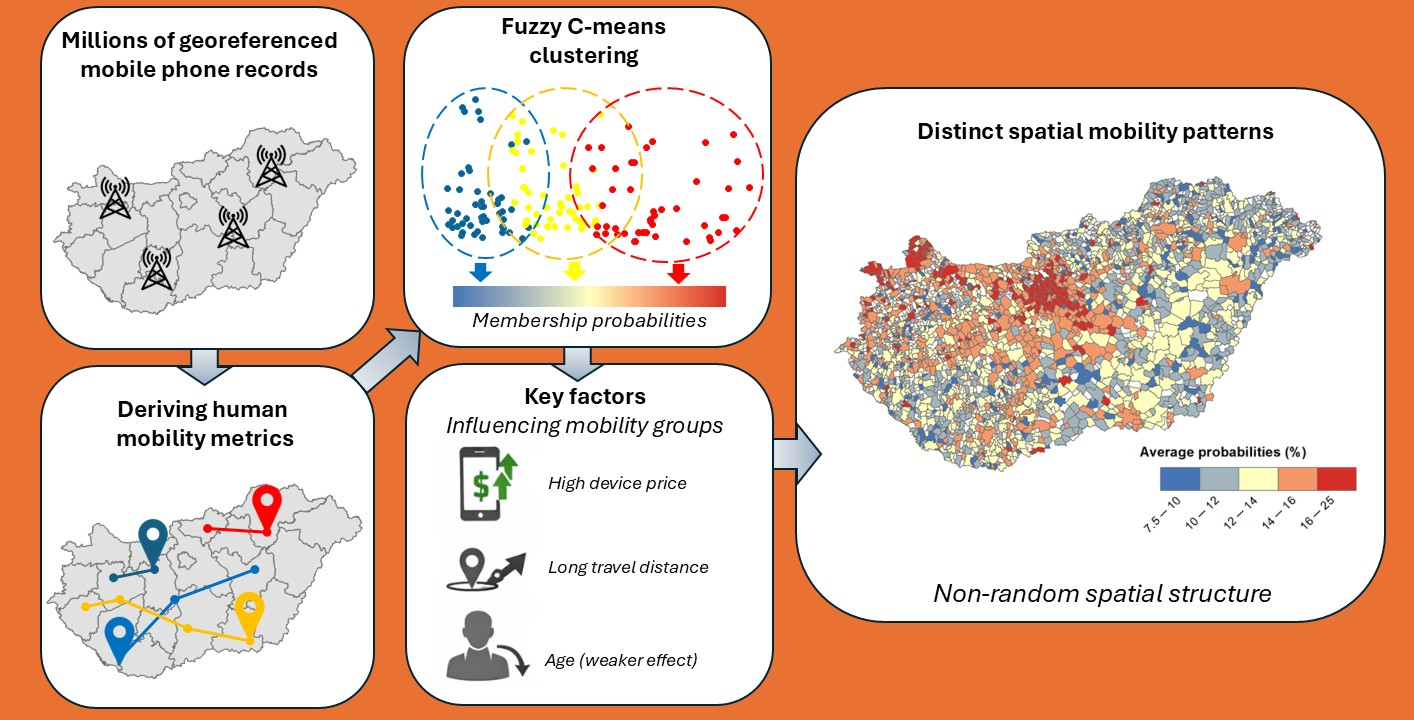
Figure 1 briefly summarizes the successive, interrelated phases of the workflow, including the primary input sources, the sub-phases of data preparation, the key analytical variables, the steps of the analysis, and the resulting visual outcomes.
Our second objective involves demonstrating that the identified user groups have spatial distributions that are geographically bounded, or have measurable degrees of spatial determinacy, which is crucial in informing urban and regional planning and development strategies. While several studies have applied clustering techniques to mobile phone-derived data for specific purposes, such as identifying primary activity locations [
47], determining home and workplace locations through cluster analysis [
48], or characterizing mobile tower catchment areas based on users’ activity spaces centered around estimated home locations [
49], no prior large-scale mobile phone study has employed the proposed mobility metrics in combination with two- and three-dimensional fuzzy clustering in a spatial context.
2. Data Background
Our analysis is based on a mobile phone dataset provided by a Hungarian telecom operator, which has been a long-standing market leader in voice, multimedia, and wireless services, and holds a stable 45% share of the national mobile telecommunications market. The research database was built with the intention of conserving the extensive granularity of the dataset, which includes exceptional detail in terms of geographic and temporal resolution, as well as communication activity. The basic units of analysis are ‘equipment’ records, each corresponding to a mobile device equipped with a SIM card and actively engaging in multimedia communication on the operator’s wireless network. For the purposes of this study, each equipment record is treated as an individual data entity, potentially representing either a domestic subscriber or a foreign user temporarily using the network in Hungary. To ensure user anonymity, equipment identifiers were anonymized using a randomly generated artificial ID through a hashing process. These identifiers are re-encoded every 24 h, thus limiting the reconstruction of mobility trajectories to discrete 24-h intervals.
After careful preprocessing and data transformation, a dataset that contained fifteen variables was created for each day during the study period. For each record (SIM card), the number of distinct devices that used the SIM card is documented. The device type is identified by its Type Allocation Code (TAC). Although a SIM card is typically associated with a single device, in some cases, multiple TACs may be linked to a single SIM card. The dataset refers to this variable as TACNum (
Table 1).
The nominal variables in the dataset include ten-year age brackets of SIM card holders (Age), customer segment (Segment), which distinguishes between residential users, various sizes of business subscriptions, and special contractual groups, the postal code corresponding to the official address of the SIM card holder (PostalCode), the device manufacturer (Vendor), and the marketing name or series of the equipment (EqSeries). It is important to note that age is only accessible to residential subscribers. This attribute is not recorded for business customers.
The dataset also includes numerical variables measured on a ratio scale, grouped into three primary dimensions such as event traffic, equipment price, and derived mobility metrics.
Traffic variables capture the daily activity of each equipment. These include the number of communication events (EvNum), encompassing all voice calls, data transfers, and text messages generated by the equipment within the service provider’s network, and the number of distinct cell areas (PolyNum) used by the equipment over the course of a day. Cells are represented as polygons that define the coverage area of mobile communication antennas. As per the system data, an average device produces approximately 25 events and interacts with five different polygons on an average workday.
The equipment price (PriceNew) is derived using vendor information (Vendor) and the device’s marketing name (EqSeries). Each equipment is assigned a price based on an extensive Google search, which involves calculating the arithmetic mean of three listed prices from the time of market introduction or, if not available, the most recent data. Incorporating such equipment prices as variables in mobility research represents a novel approach in the field.
The final group of variables consists of mobility metrics that serve as proxies for human movement patterns. It is important to emphasize that these metrics indirectly infer mobility, as they are based on the movement of mobile devices rather than the users themselves. In order to fully comprehend the development and interpretation of these mobility indicators, it is important to clarify the geographical positioning framework employed in the dataset.
2.1. Georeferencing of Data
A key advantage of investigations based on mobile phone data is their ability to analyze social spatial processes using high-resolution, quasi-real-time sensor-based spatial data, an improvement over traditional spatial statistics, which are typically limited to survey-based administrative units. Mobile communication generates two main types of spatial data [
20,
50]. The first is derived from log files of location-based applications operating on the device, such as GPS tracking data [
51]. The second type is produced through radio frequency transmissions during interactions between the mobile device and the telecommunication infrastructure. In this case, location data refers not to the precise position of the device, but to the location of the active transceiver tower involved in the communication event, as recorded in the service provider’s database. Our research relies on this latter type of spatial data (tower-based geographical information) to spatially contextualize mobile network activity.
There are multiple ways to estimate the actual position of a mobile device within the coverage area of transceiver antennas. All of these methods require the device to be registered with the transceiver tower to which it is connected. Each tower is uniquely identified by a Cell-ID and is associated with specific geographic coordinates (latitude and longitude). The Cell-ID corresponds to a Base Transceiver Station (BTS), each of which serves a geographical area known as a cell. The cells’ size and shape vary depending on the surrounding environment and network design.
One of the most commonly used spatial approximation techniques for positioning mobile devices is Voronoi tessellation [
37,
52,
53]. This method assumes that a mobile device connects to the nearest BTS and, accordingly, assigns every point in a region to its closest antenna. The process creates convex polygons that represent the most probable area of influence for a given cell tower. However, Voronoi-based modeling is limited by its assumption of uniform antenna characteristics, which does not take into account differences in transceiver power, environmental interference, or topographical shading effects [
53]. Moreover, in reality, devices are not always able to connect to the geographically nearest antenna, leading to more uncertainty and complexity in location estimation.
Considering that Voronoi polygons are usually used as rough approximations for mobile device positioning, we propose a more refined method by improving the spatial resolution of positioning using a GIS-based multistep approach. Building upon the framework suggested by Tennekes [
54], our method incorporates both signal strength and geographical shading (or visibility) effects, utilizing Shuttle Radar Topography Mission (SRTM) data for all Base Transceiver Stations. The determination of each BTS’s service (reception) area began with calculations based on the technical specifications of the antennas, as provided by the telecom company. These calculations accounted for the nominal power of each antenna, which influenced the size of its coverage area. The final output was a set of theoretical, distance-based coverage polygons representing initial service areas. To enhance spatial accuracy, we refined these polygons by excluding areas affected by topographic shading, where signal reception would be significantly diminished or blocked. This process resulted in a set of irregularly shaped polygons that more accurately represent the effective service areas of each BTS, reflecting both signal propagation characteristics and environmental constraints.
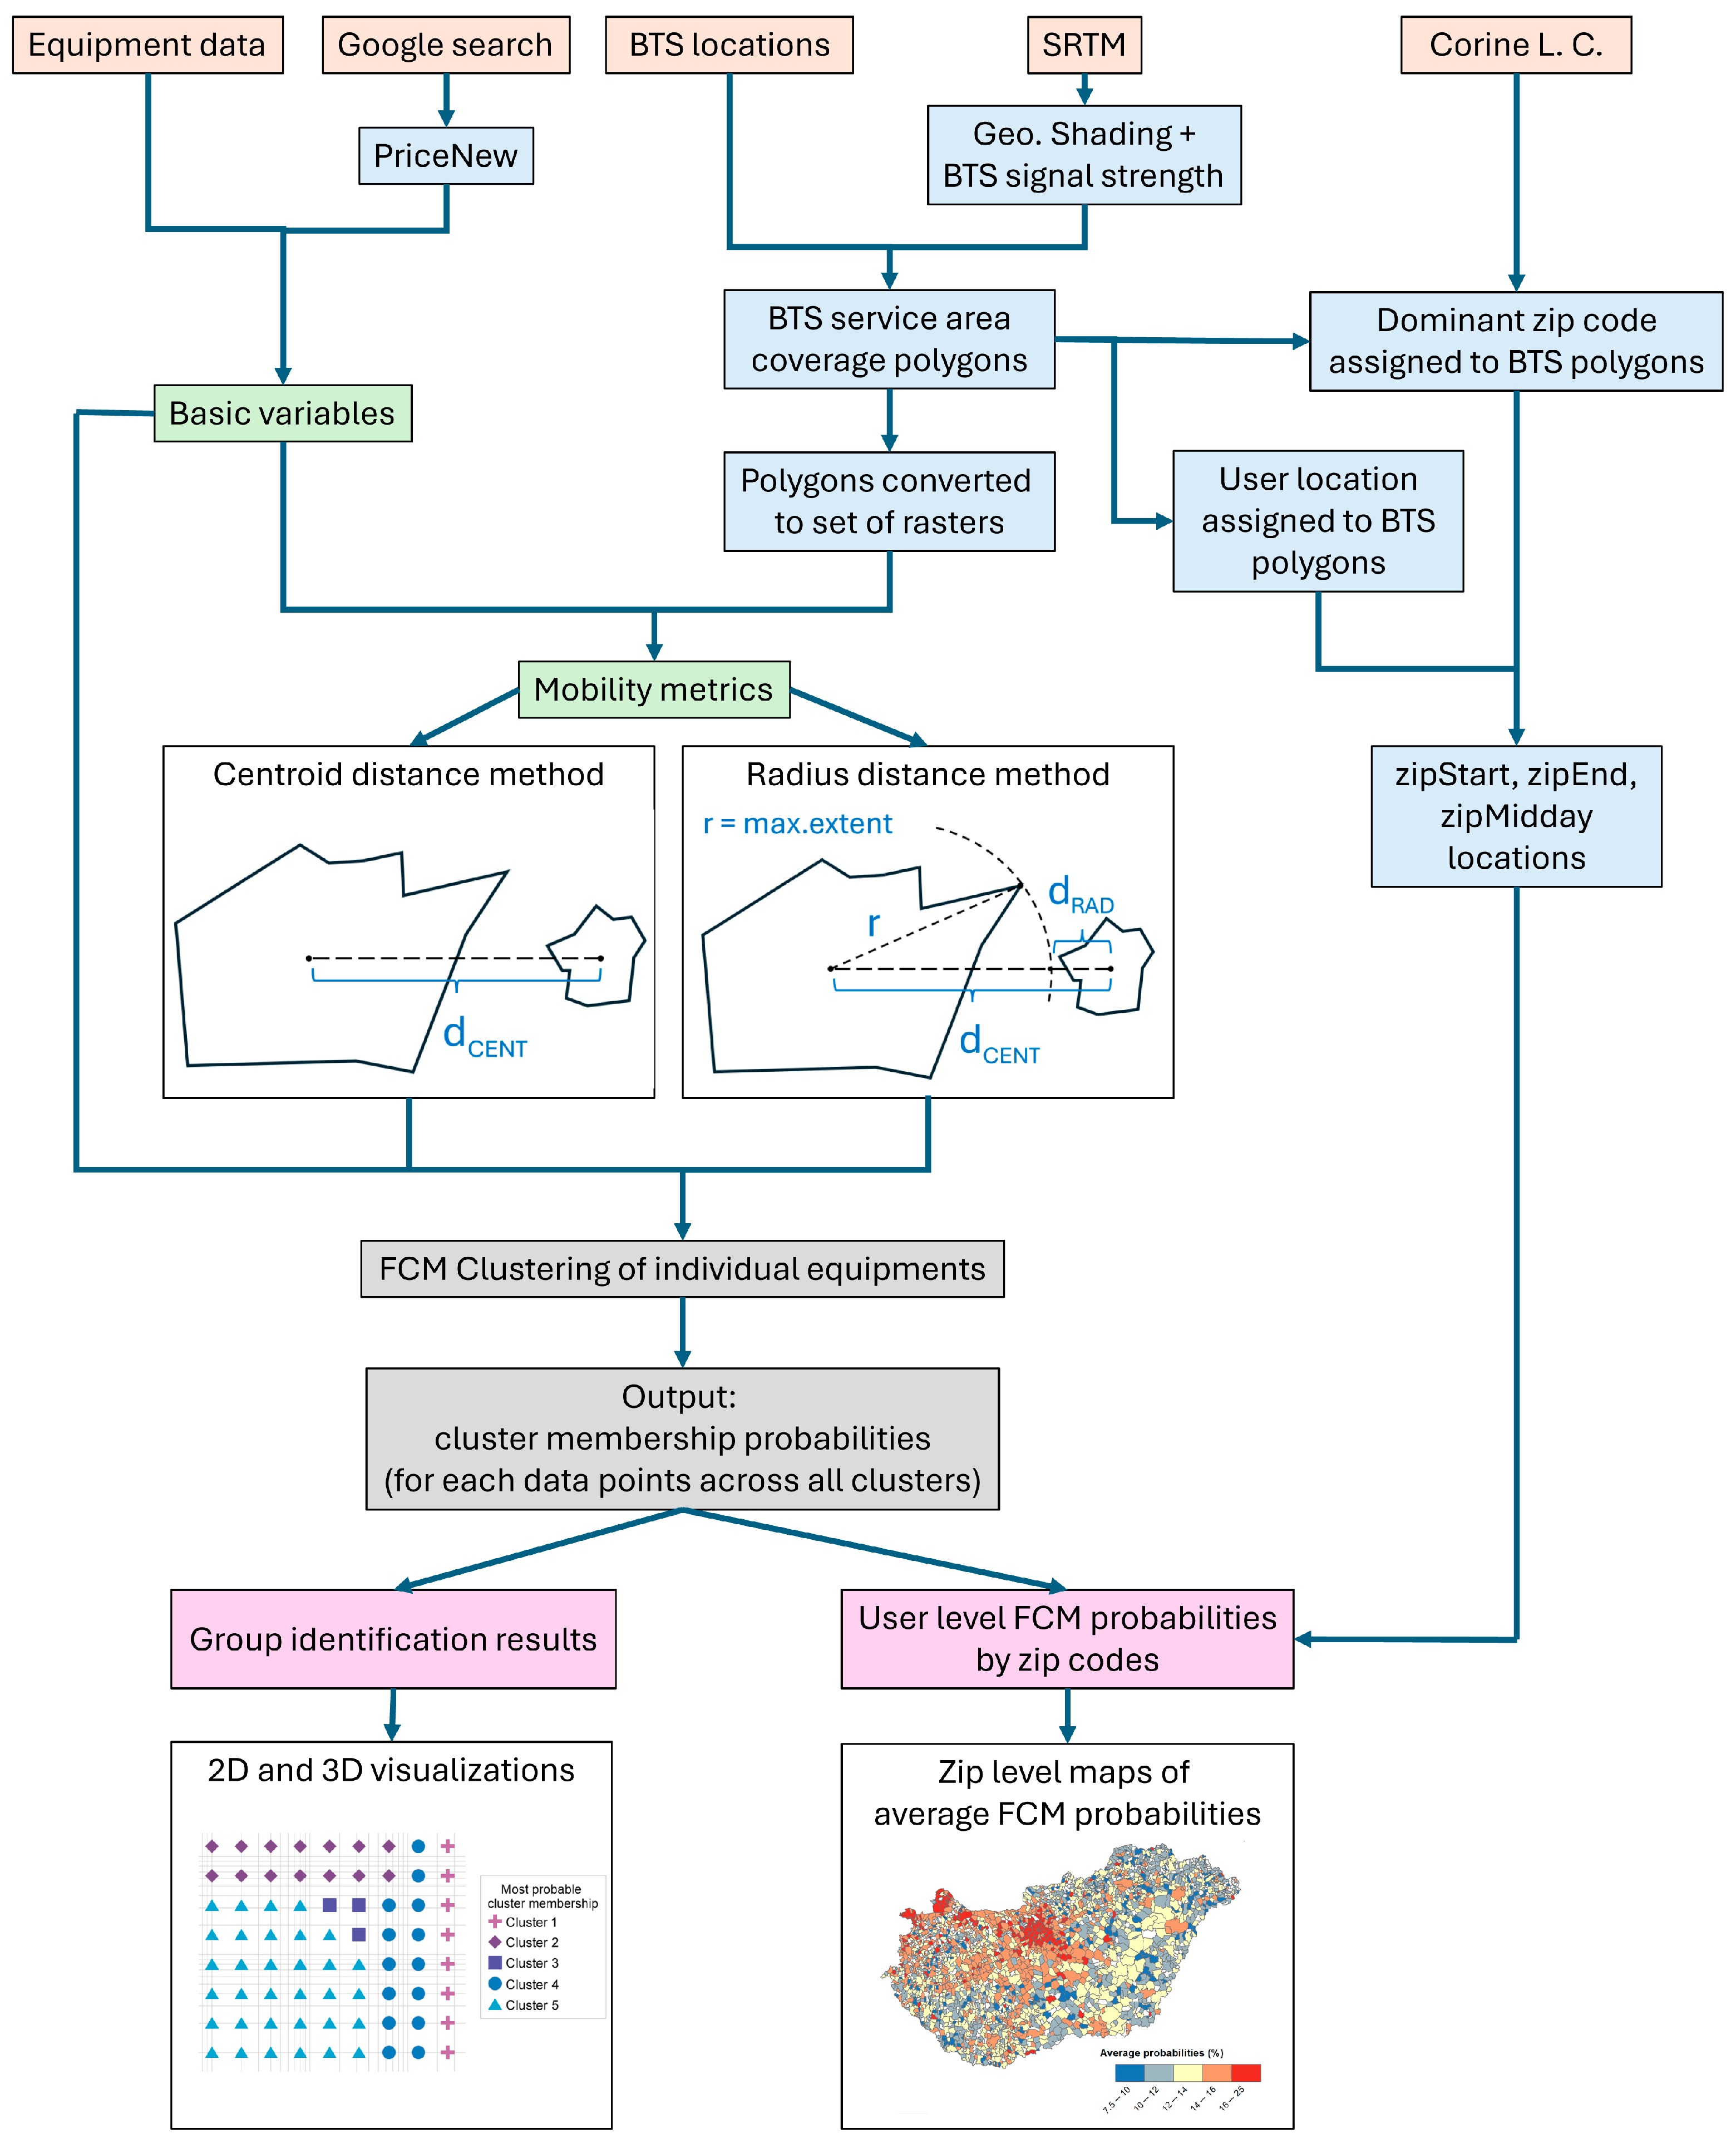
In practice, each service area polygon was generated independently, unlike the contiguity-based Voronoi method in which polygons are adjacent and share well-defined boundaries. Instead, our polygons are allowed to overlap, which can accurately reflect real-world conditions where the coverage areas of BTS towers often intersect (see
Figure 2). For analytical purposes, these service areas were converted into sets of grid cells (128 m × 128 m), referred to as rasters, which served as the fundamental spatial units for calculating mobility metrics. The presence of a specific device (equipment) was thus determined on a raster-level basis. The number of devices in each raster was estimated for every time interval using the fuzzy probability algorithm described in a later section. In summary, our georeferencing approach provides a more precise alternative to Voronoi-based cell positioning by accounting for overlapping signal areas and topographic variability, thereby enabling the derivation of more precise and meaningful mobility metrics.
2.2. Mobility Metrics and Data Transformations
In order to quantitatively approximate human mobility, we propose a set of simple metrics that are favorable for investigating mobile cell-based travel behavior. Our proposed mobility metrics fall into three categories: (1) maximum distance between polygons used (DistMaxCent/Rad), (2) total route length covered (RouteSumCent/Rad), and (3) maximum speed of movement (SpeedMaxCent/Rad). Each metric is calculated using two methodological approaches: one based on polygon centroids and the other on radius approximations. The variables are derived from three key parameters: the number of communication events, the number of unique polygons (cell areas) used, and the elapsed time between two successive events. The maximum distance metric refers to the greatest geographic separation between any two polygons accessed by a given device within a single day. For DistMaxCent, this is calculated as the Euclidean distance between the centroids of the polygons, identifying the largest such distance observed. However, challenges arose with the centroid-based method. Due to network optimization protocols, equipment may appear to rapidly alternate between adjacent towers, even when physically stationary, resulting in artificial ‘jumps’ in location. This phenomenon is a consequence of the handover process, where a device switches between cells [
50] without necessarily changing its actual position. Such artifacts can distort derived mobility metrics, particularly route length and speed, by inflating the apparent extent and dynamics of movement.
To avoid distortions caused by handovers (where equipment switches between nearby towers without actual movement), we implemented a refined distance estimation method based on radial distances derived from overlapping polygons. Specifically, for each transition between two polygons in a mobility track, we calculated the radial distance by first determining the maximum spatial extent of the latter polygon. The extent was defined by the distance from the polygon’s centroid to the farthest raster cell. We then subtracted this extent from the Euclidean distance between the centroids of the two polygons and ensured that the resulting distance was constrained to be greater than zero. This approach yields a radius-adjusted distance value, representing a more realistic estimate of the actual movement between two service areas. In cases where polygons overlap by more than 50%, the radius-based distance was reduced to zero, effectively eliminating false movement signals. The incorporation of this method allowed us to exclude quasi-movements caused by network management protocols, thus preserving the integrity of derived mobility metrics. The aggregated daily route distance for each equipment was calculated using both the centroid-based method (RouteSumCent) and the radius-based method (RouteSumRad), depending on the chosen distance metric. We also derived maximum speed variables (SpeedMaxCent and SpeedMaxRad) to estimate the highest velocity achieved by a device within a given day. These speed values were not only used to characterize mobility dynamics, but also as a tool for controlling data quality. Specifically, records indicating speeds greater than 180 km/h (often because of rapid network-driven tower switching) were flagged as noise and excluded from further analysis.
During model development, extensive data transformation was necessary. Our observations revealed highly asymmetric distributions in many variables, particularly those related to mobility and event traffic. Extreme right-skewness was evident in multiple variables, with skewness indices exceeding 80, which indicate exponential-type distributions. To address the analytical challenges posed by such distributions (especially the prevalence of values clustered near zero and drawn-out right tails) we applied a logarithmic transformation to normalize the data and enhance model performance.
3. Methodology
Mobility and locational data provide valuable new dimensions for analyzing group behavior and uncovering patterns that traditional methods may overlook. In business contexts, such as customer profiling or churn prediction, segmentation algorithms are commonly applied [
12]. However, in scientific research, a broader range of analytical possibilities is explored. Among these, various clustering techniques are widely used to identify patterns in spatial behavior [
49,
55,
56]. When applying clustering methods to georeferenced mobile cell data, the unique characteristics of the data require careful methodological consideration. The variance inherent in spatial data can cause confusion when assigning observations to specific clusters. A fundamental methodological question is whether to enforce hard clustering, which assigns each object to a single, discrete group, or to adopt soft clustering, which accounts for the continuous nature of the data and the uncertainty in object membership. Hard clustering is advantageous when a clear, unambiguous classification is needed, but it may not be as effective when input data is noisy or imprecise. In the case of mobile cell data, location accuracy is typically lower than that of GPS-derived datasets, which introduces a level of geographical uncertainty. Furthermore, the overlap between service area polygons adds complexity to spatial interpretations, making hard boundaries between groups less meaningful. Considering these challenges, fuzzy clustering is a more appropriate approach. Unlike hard clustering, fuzzy clustering allows an object to belong to multiple clusters simultaneously, with each membership represented by a probability weight. This flexibility allows for the spatial and behavioral ambiguity inherent in mobile network data, resulting in a more nuanced and realistic segmentation of the population.
To identify populations that exhibit similar behavior patterns, we assigned each individual device (i.e., equipment) to clusters based on similarities in their attribute profiles. This segmentation was performed using the Fuzzy C-Means (FCM) clustering algorithm, an unsupervised machine learning approach that extends the recently popular conventional K-means method [
57,
58] by incorporating fuzzy set theory [
59,
60]. Our analysis employed both two-dimensional and three-dimensional fuzzy clustering techniques to capture different levels of behavioral complexity. Unlike hard clustering methods, which assign each data point to a single cluster, FCM allows partial membership, meaning that a data point can simultaneously belong to multiple clusters with varying degrees of certainty. These degrees of membership are represented by values range from 0 to 1, where higher values indicate stronger association with a given cluster.
Formally, let X = {
x1, …, xm} be a set of data points in n-dimensions, where
xi = {
xi1, …, xin}. N-dimensional data points in X form subsets of clusters, C
1, C
2, … C
k, such that each point
xi belongs to every cluster C
j with a degree of membership
wij. The membership value
wij quantifies the strength of association between object
xi and cluster C
j. Here,
wij is the weight with which object
xi belongs to cluster C
j.
Each xi data point belongs to at least one Cj cluster with a membership value greater than 0, and at least one wij value attached to any Cj cluster by xi is, consequently, lower than 1.
Assigning cluster membership to objects is based on the calculated distance from the cluster centroids. Unlike the traditional K-means algorithm, the FCM machine learning method reaches an equilibrium of cluster centroids by incrementally updating the centers until the sum of squared errors reaches the minimum. At this point, the centroids stabilize, and the final cluster configuration is determined.
The clustering progress begins by initializing a random membership matrix, where
xi is assigned to C
j with the weight of
wij. Then the center
cj of cluster C
j is calculated by applying the following:
To define center cj, all points should be covered since each point belongs to all centroids to a certain extent, where the strength of belonging is expressed by the membership degree wij. Here, p represents the value of the extent to which the weights influence the exact location of centers. The value of p can be 1 or higher.
After initializing the random membership matrix, the next step is to calculate the dissimilarities between the data points and the centroid using Euclidean distancing. Dissimilarity here corresponds to the sum of squared errors (SSE).
Once the first (random) partition is established, and the cluster centroids and the sum of squared errors (SSE) are computed, an iterative optimization process begins until a stable clustering configuration is reached and SSE is minimal. During this process,
wij is gradually updated since the membership matrix is defined by the weights. We consequently applied
p = 2, corresponding to the squared Euclidean distance commonly used in social sciences. The value of
p influences the final partition of clusters, by rendering weight to the clusters near to data points. If
p > 2, the weight of the nearest clusters decreases, resulting in less explicit separation between clusters. By applying
p approaching 1, the membership values attached to the nearest clusters increases and implicates a sharper cluster partition.
The process of updating membership values continues iteratively until the cluster centroids stabilize, that is, until changes in their positions fall below a predefined threshold or become negligible. At this point, the algorithm is considered to have converged, and the final configuration of clusters is obtained. The resulting model represents a prototype structure that most accurately captures the inherent ambiguity and overlap nature of the original data.
In the implemented two-dimensional version of the Fuzzy C-Means algorithm, each data point was represented by two variables (coordinates) with at least one being a mobility metric. Similarly, the three-dimensional variant incorporated three variables as input dimensions. These original continuous variables were subsequently converted into categorical values based on logarithmically scaled intervals, enabling the formulation of a manageable and interpretable set of value combinations. The initial random membership matrix was created by assigning random probabilities for categorical value-combinations, so that after running the unsupervised machine learning algorithm the outcomes were also given as probabilities for categorical value-combinations. In the final step, individual records (based on their associated categorical value combinations) were assigned the cluster membership probabilities derived for their category across all clusters. This approach allowed for a probabilistic classification of individuals, while preserving the fuzzy nature of the clustering. The primary advantage of this two- and three-dimensional FCM implementation, combined with categorical transformation and probabilistic assignment, lies in its computational efficiency and scalability. The method is both relatively simple (conceptually straightforward) and well-suited for handling large-scale, computation-intensive datasets, making it highly applicable to big data environments, like those that involve extensive mobile phone records.
FCM requires the number of clusters (k) to be specified a priori; consequently, the selection of k is a model-design decision rather than an output of the optimization itself. In line with established practice in cluster analysis, we approached k as a parsimony–interpretability trade-off and retained a five-cluster representation for all reported 2D and 3D configurations. Conceptually, the rationale follows the ‘elbow’ principle for within-cluster dispersion (objective function/SSE) (elbow-type reasoning; see, e.g., [
61]): increasing k always improves the fit, but beyond a certain point the marginal gain becomes small and clusters mainly fragment an already coherent central mass. Conversely, reducing k below this point forces the merging of behaviorally distinct extremes, which lowers interpretability. In fuzzy clustering, this reasoning is consistent with the behavior of common fuzzy validity indices that reward compactness and separation while penalizing excessive overlap (e.g., Partition Coefficient, Partition Entropy, Xie-Beni index, fuzzy silhouette) [
62,
63,
64,
65,
66]. Given the large scale of the dataset and the categorical value-combination implementation used for computational efficiency, we prioritize robust interpretation based on stable cluster prototypes and high-membership regions over borderline assignments.
4. Results and Discussion
4.1. Group Identification and Profiling
To conduct detailed data analysis, we focused on utilizing information from a standard and fairly representative time period. To achieve this, we opted for a neutral testing period of two weeks to conduct frequency examinations and assess the reliability of the data. The findings revealed slight differences in the frequency distribution of mobility metrics between weekend and weekday data collection, while variation on working days remained minimal. These outcomes aligned with both anticipated results and the existing literature [
67]. Consequently, we selected a typical working day (Tuesday, 28 May 2019) and obtained a total of 6.3 million equipment records by querying the ‘residential’ customer segment. As the data originate from the most widely used Hungarian service provider across all segments of the population, the relatively large sample size allows for an unbiased representation of population distribution, with no significant subgroup differences observed.
Our initial exploratory analyses focused on identifying meaningful user groupings based on traveled distance and the number of distinct BTS cells traversed, which served as primary segmentation variables. Specifically, the variable DistMaxCent, namely the maximum Euclidean distance between centroids of BTS polygons visited by a device within a day, was used to differentiate between user mobility profiles. This allowed us to categorize individuals into five distinct mobility types: (1) stayers, who remained stationary throughout the day (DistMaxCent = 0); (2) local users, who traveled only short distances; (3) urban commuters, exhibiting moderate intra-city movements; (4) intra-urban travelers, characterized by medium-range displacements within broader urban areas; and (5) long-distance travelers, who covered substantial distances across BTS zones. In parallel, the variable PolyNum, namely the count of distinct BTS polygons accessed per day, was employed as a proxy for spatial diversity in user location patterns. While PolyNum does not directly measure distance, it effectively captures the extent of spatial activity by indicating the number of unique areas visited. The Pearson correlation coefficient between DistMaxCent and PolyNum was 0.464, suggesting a moderate positive relationship, but not a strictly linear one. This implied that groupings could not be identified based solely on increasing values across the two metrics, but rather by examining covariance patterns, especially among the low and high value ranges of both indicators.
Given the continuous nature of the original input data, the raw cross-tabulation of DistMaxCent and PolyNum yielded an excessively large number of potential value combinations, complicating the grouping process. To address this, we logarithmically scaled both indicators and transformed them into categorical variables. Due to the differing value ranges and units of measurement, we applied scaling adjustments to align the lower-range variable with the scale of the higher-range one, thereby avoiding distortion in clustering due to unit bias. Additionally, comparative examinations were performed based on DistMaxRad data in order to test the effects of different distance calculation methods (centroid vs. radius distance metrics) on clustering. Interestingly, despite minor differences, the clustering outcomes remained largely consistent, reinforcing the notion that macro-scale patterns dominate in large datasets [
17]. It is important to note that, in addition to the centroid- versus radius-based distance definition, the present large-scale implementation involves modeling choices that can influence the sharpness of fuzzy partitions, such as the fuzziness exponent
p and the discretization scheme used to recode continuous variables into logarithmically scaled categories. In FCM,
p primarily controls membership ‘softness’: higher values generally yield smoother, more overlapping memberships, whereas values closer to 1 approach a crisper, hard-clustering-like partition. Likewise, changing the binning thresholds mainly affects the resolution at which the heavy-tailed mobility variables are represented. Accordingly, our interpretation focuses on the persistence of cluster prototypes and the spatial coherence of high-membership regions, which are conceptually more stable than boundary cases with intermediate memberships. This robustness framing follows standard recommendations in the fuzzy clustering literature, where stability is assessed by checking whether substantive conclusions depend on a single parameterization [
62,
65].
Furthermore, two additional indicators were examined: SpeedMaxRad, originally developed to filter erroneous movement records, proved informative in identifying dynamic user behavior patterns; and PriceNew, which introduced a socioeconomic dimension to the clustering model. This variable served as a proxy for user affluence by estimating device cost using a web-sourced average of market entry prices.
While not directly tied to mobility, the inclusion of PriceNew enabled us to explore potential correlations between device value and travel behavior, thus enriching the segmentation framework with economic relevance. It should be noted, however, that the device release price can serve only as an indirect proxy for socio-economic status, which limits the full applicability of this variable. Potential sources of bias include, among others, second-hand purchases and device choices driven by prestige considerations.
An additional benefit of the above-mentioned transformation of the originally continuous variables into categorical values is that it made the research findings easier to present visually. In the figures illustrating the results, the labels indicate the most likely clusters expected for each specific combination of values. At the same time, it should be kept in mind that every cluster is present for every value combination, even though the expected probabilities are lower.
The most likely cluster memberships, illustrated in
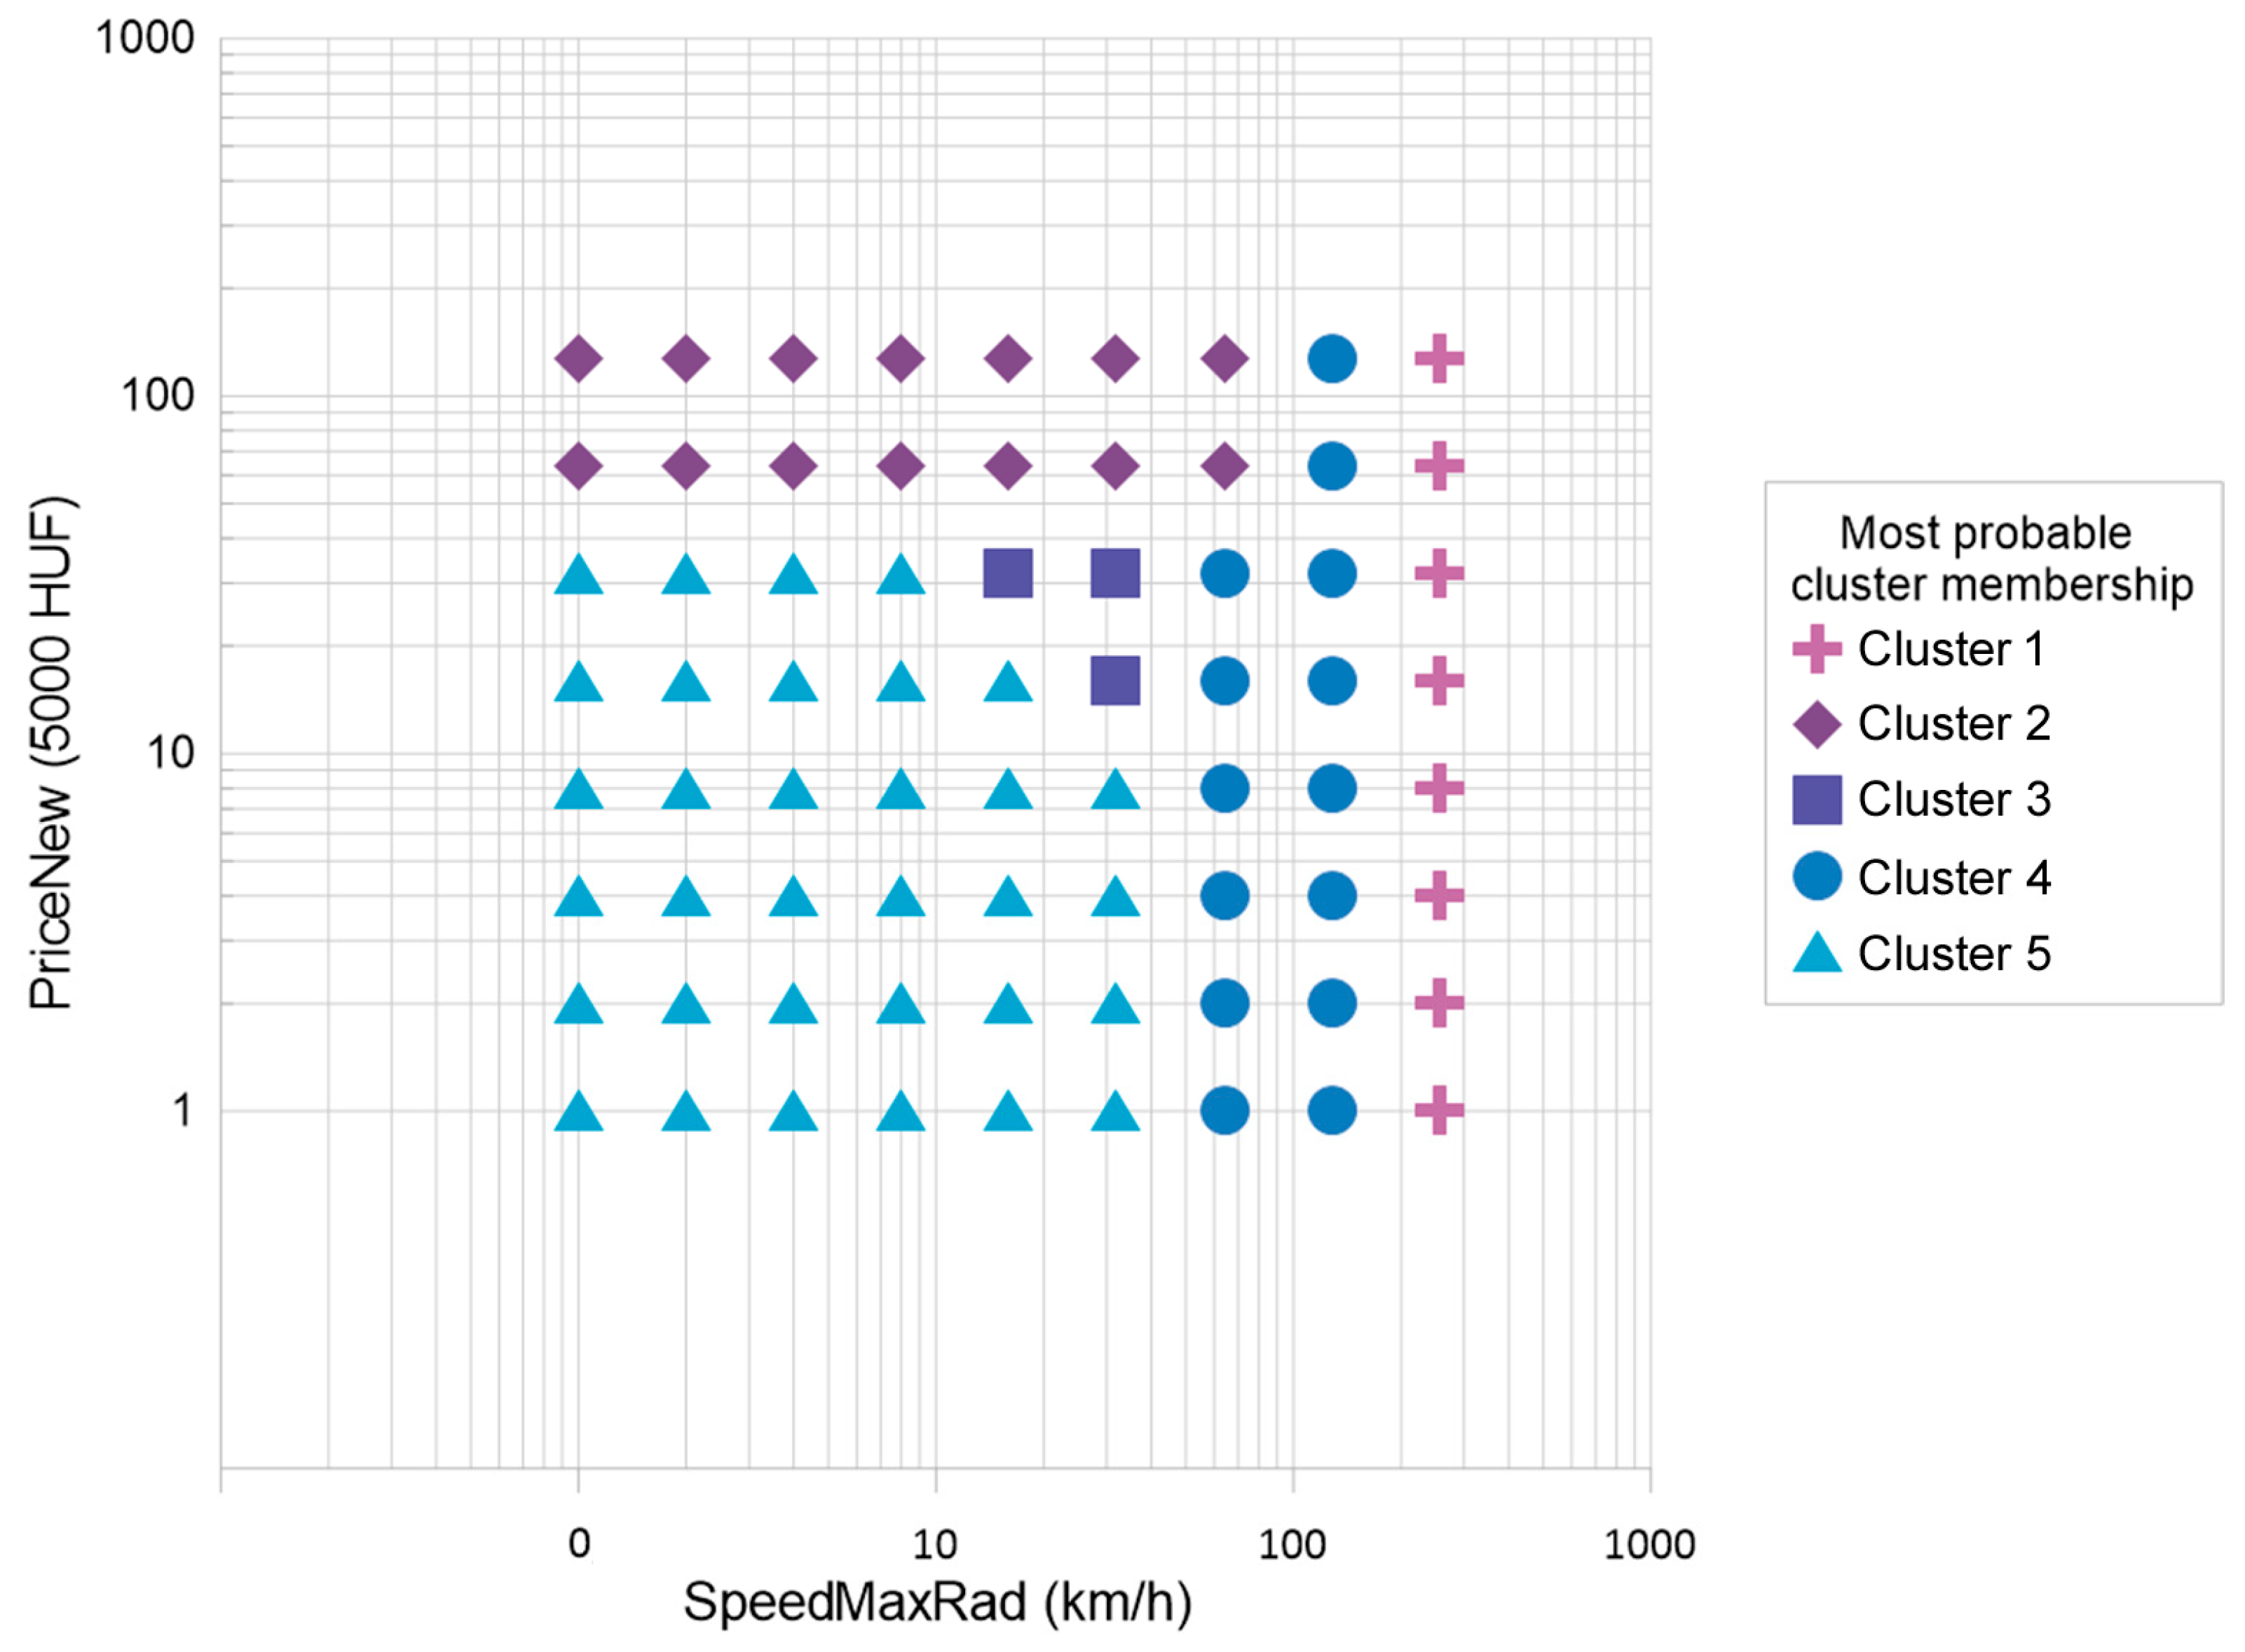
Figure 3, reveal a non-linear relationship between maximum travel speed and phone price, as also indicated by the low Pearson correlation coefficient (r = 0.058) between these two variables. In this 2D FCM examination, we initially explored solutions up to k = 10 as an upper bound for screening potential group structure, and retained a five-cluster solution as a parsimonious and interpretable representation. A smaller k would require merging clusters located at distinct extreme ranges along the mobility and socio-economic dimensions, while a higher k would mainly subdivide the central mass into smaller groups with diffuse memberships, yielding limited additional behavioral insight. To be transparent, we report all models using k = 5, which also supports comparability across the three clustering configurations presented in the study (SpeedMaxRad–PriceNew; RouteSumRad–PriceNew; RouteSumRad–PriceNew–Age). A massive cluster (Cluster 5) encompasses users with both low mobility speeds and low device prices, likely representing individuals with limited travel activity and less expensive mobile equipment, possibly indicating lower socioeconomic status or lifestyle patterns involving minimal daily movement. Furthermore, the emergence of distinct clusters at extreme values along either axis suggests that both high device price and high travel speed serve as strong differentiators in user segmentation (Clusters 1 and 2, respectively). It seems that some clusters are largely influenced by price, although this pattern is primarily noticeable in the higher value categories, where cluster membership probabilities remain around 30–35%, with mobility still acting as an important differentiating factor. The variation in cluster membership probabilities across combinations of speed and price confirms the heterogeneous and ambiguous nature of group affiliations, further validating the appropriateness of the fuzzy clustering approach. The presence of both stable clusters with high membership certainty and unstable groupings with more diffuse memberships illustrates the added value of a fuzzy methodology in capturing the gradual transitions and uncertainties inherent in large-scale behavioral datasets.
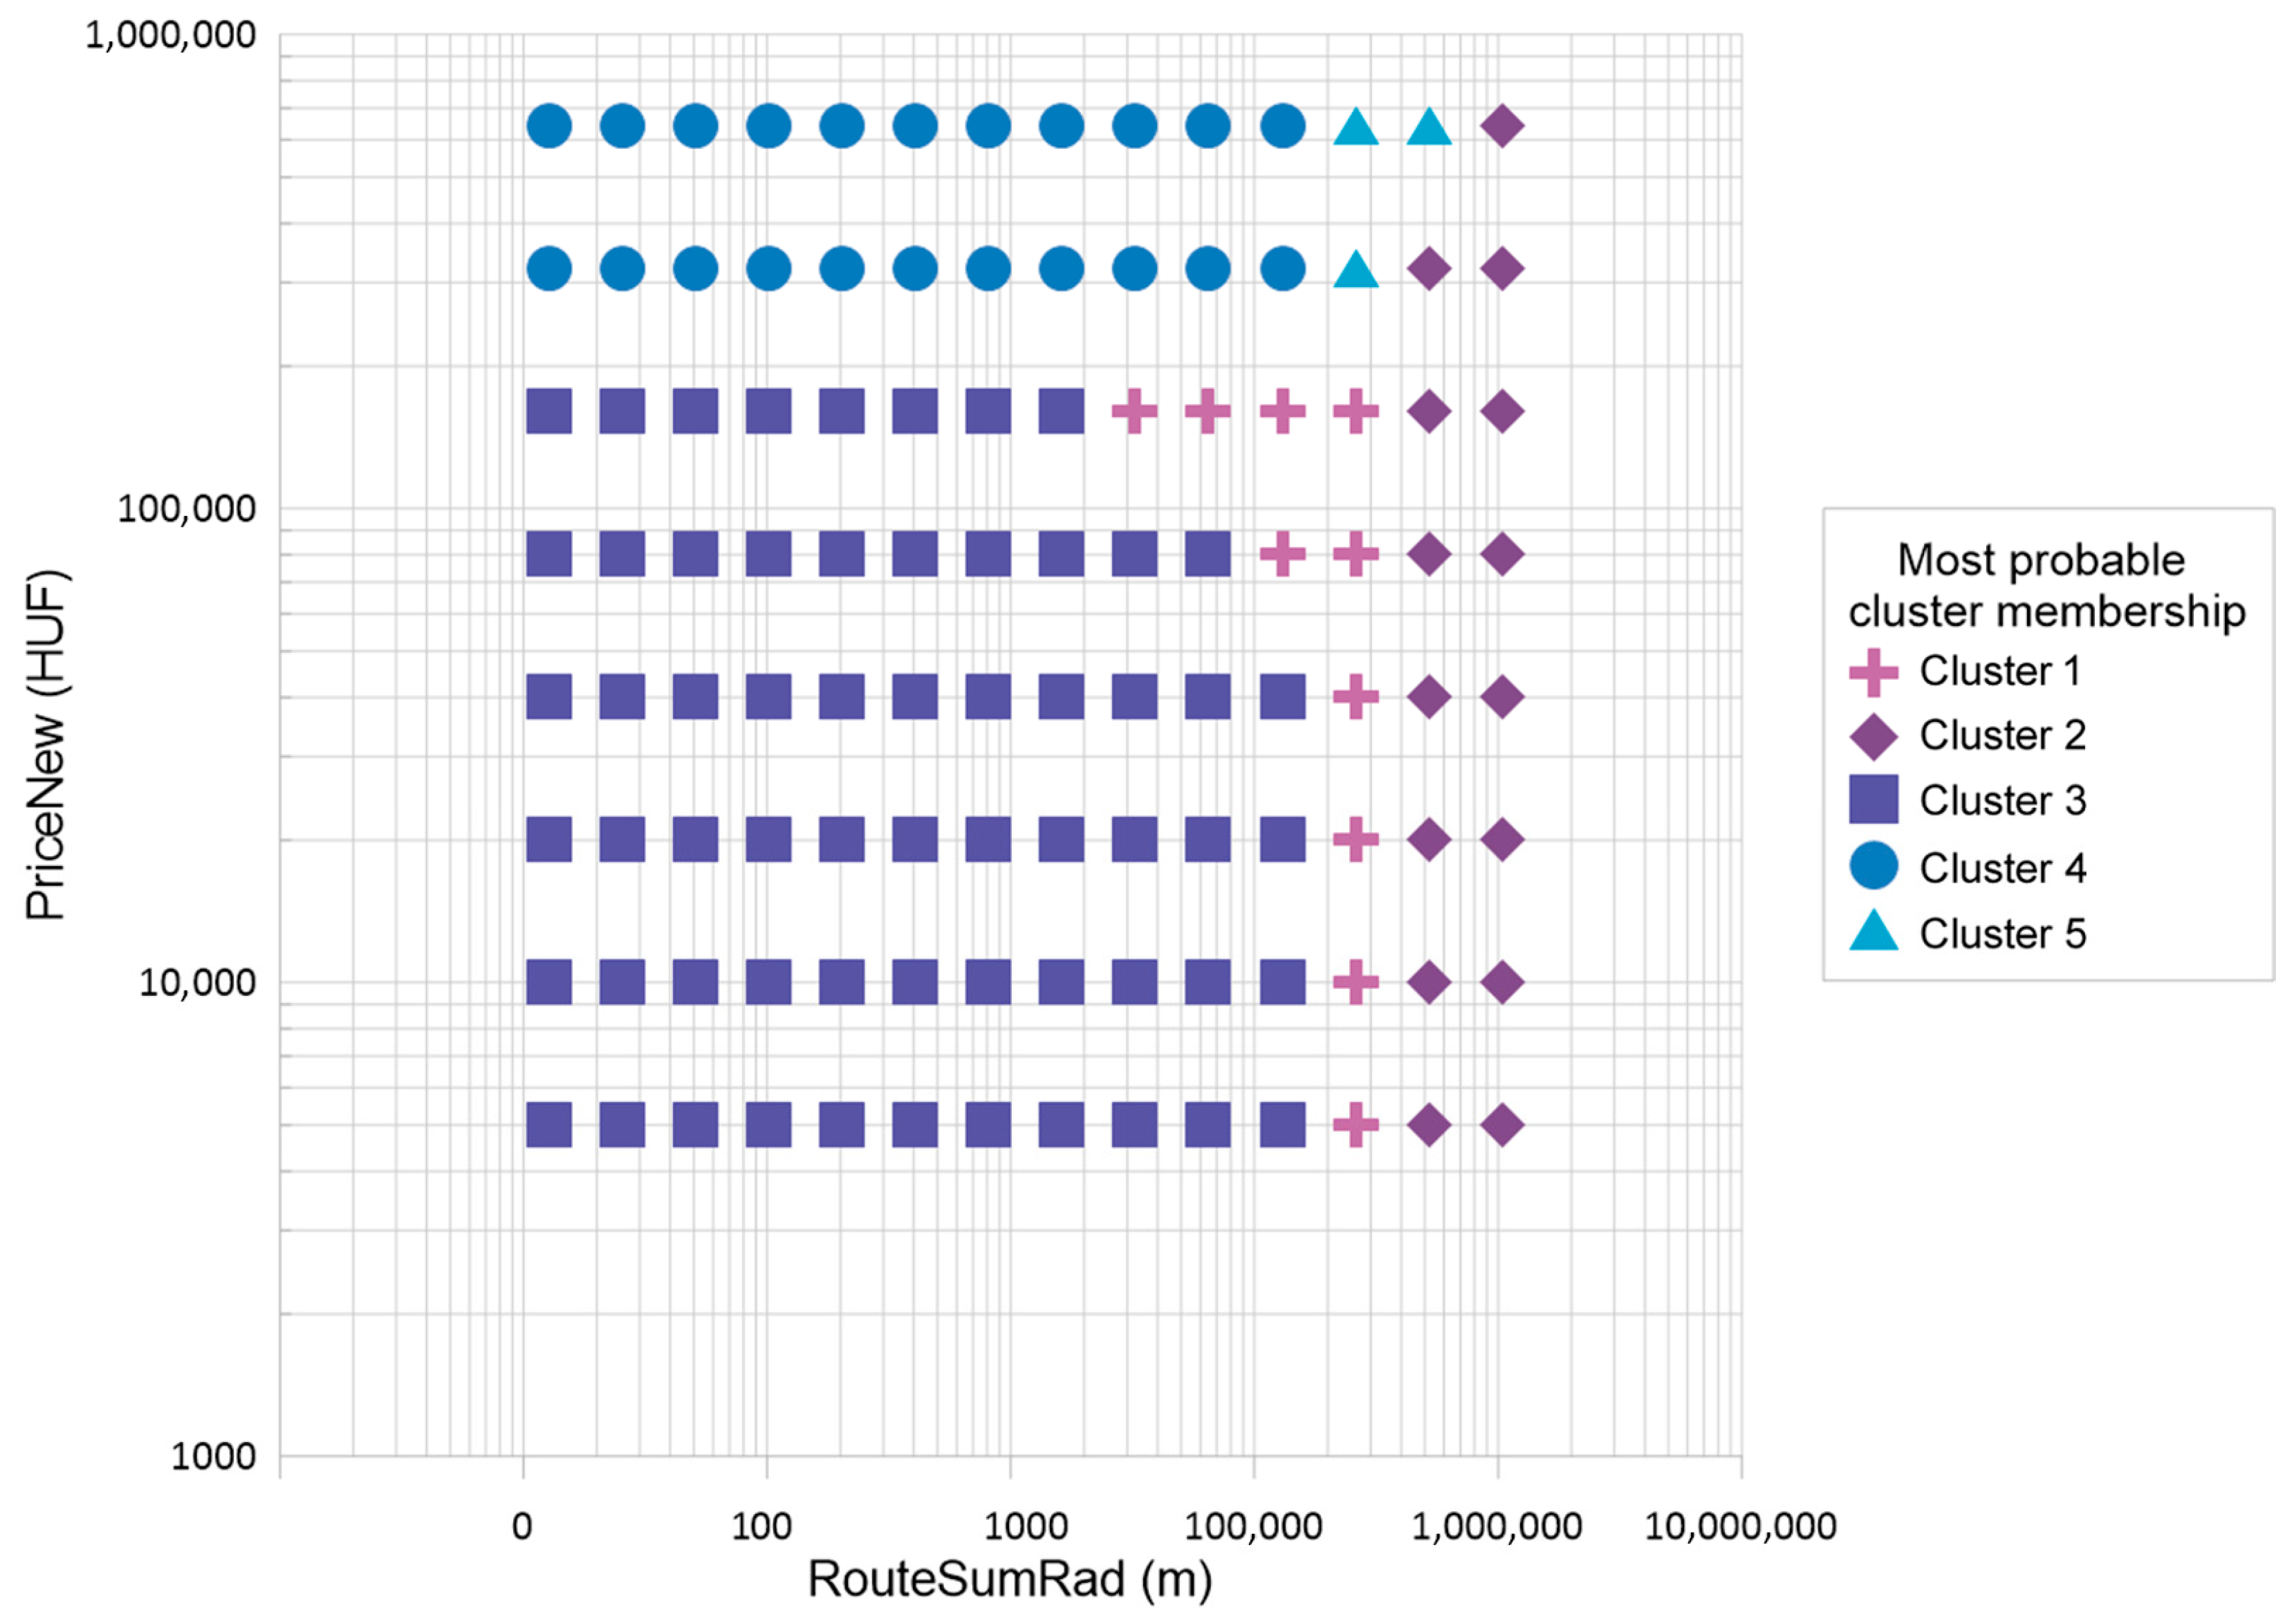
In our subsequent model, we incorporated the aggregated daily travel distance of each device (RouteSumRad) and the price of the equipment (PriceNew) as clustering variables, with the objective of exploring how overall mobility intensity and socioeconomic status influence user segmentation. Unlike DistMaxRad or SpeedMaxRad, which capture peak movement parameters, RouteSumRad accounts for the total distance traveled during the day, offering a more comprehensive representation of daily mobility behavior. Given the low Pearson correlation coefficient (r = 0.035) between RouteSumRad and PriceNew, we anticipated a non-linear relationship between total travel distance and device price. As illustrated in
Figure 4, the fuzzy clustering algorithm revealed several meaningful groupings. A prominent cluster (Cluster 3) is made up of users who have short to moderate travel distances and own low- to mid-priced mobile phones. Additionally, two distinct groups emerged: one comprising users with high-end mobile devices (Cluster 4), and another defined by intensive daily mobility (Cluster 2). Although additional clusters were identified, many displayed lower dominant membership probabilities, reflecting the continuous and uncertain nature of group boundaries. Nevertheless, the results support the interpretation that extreme values in either travel behavior or device cost serve as key differentiators, producing discernible separation among population groups.
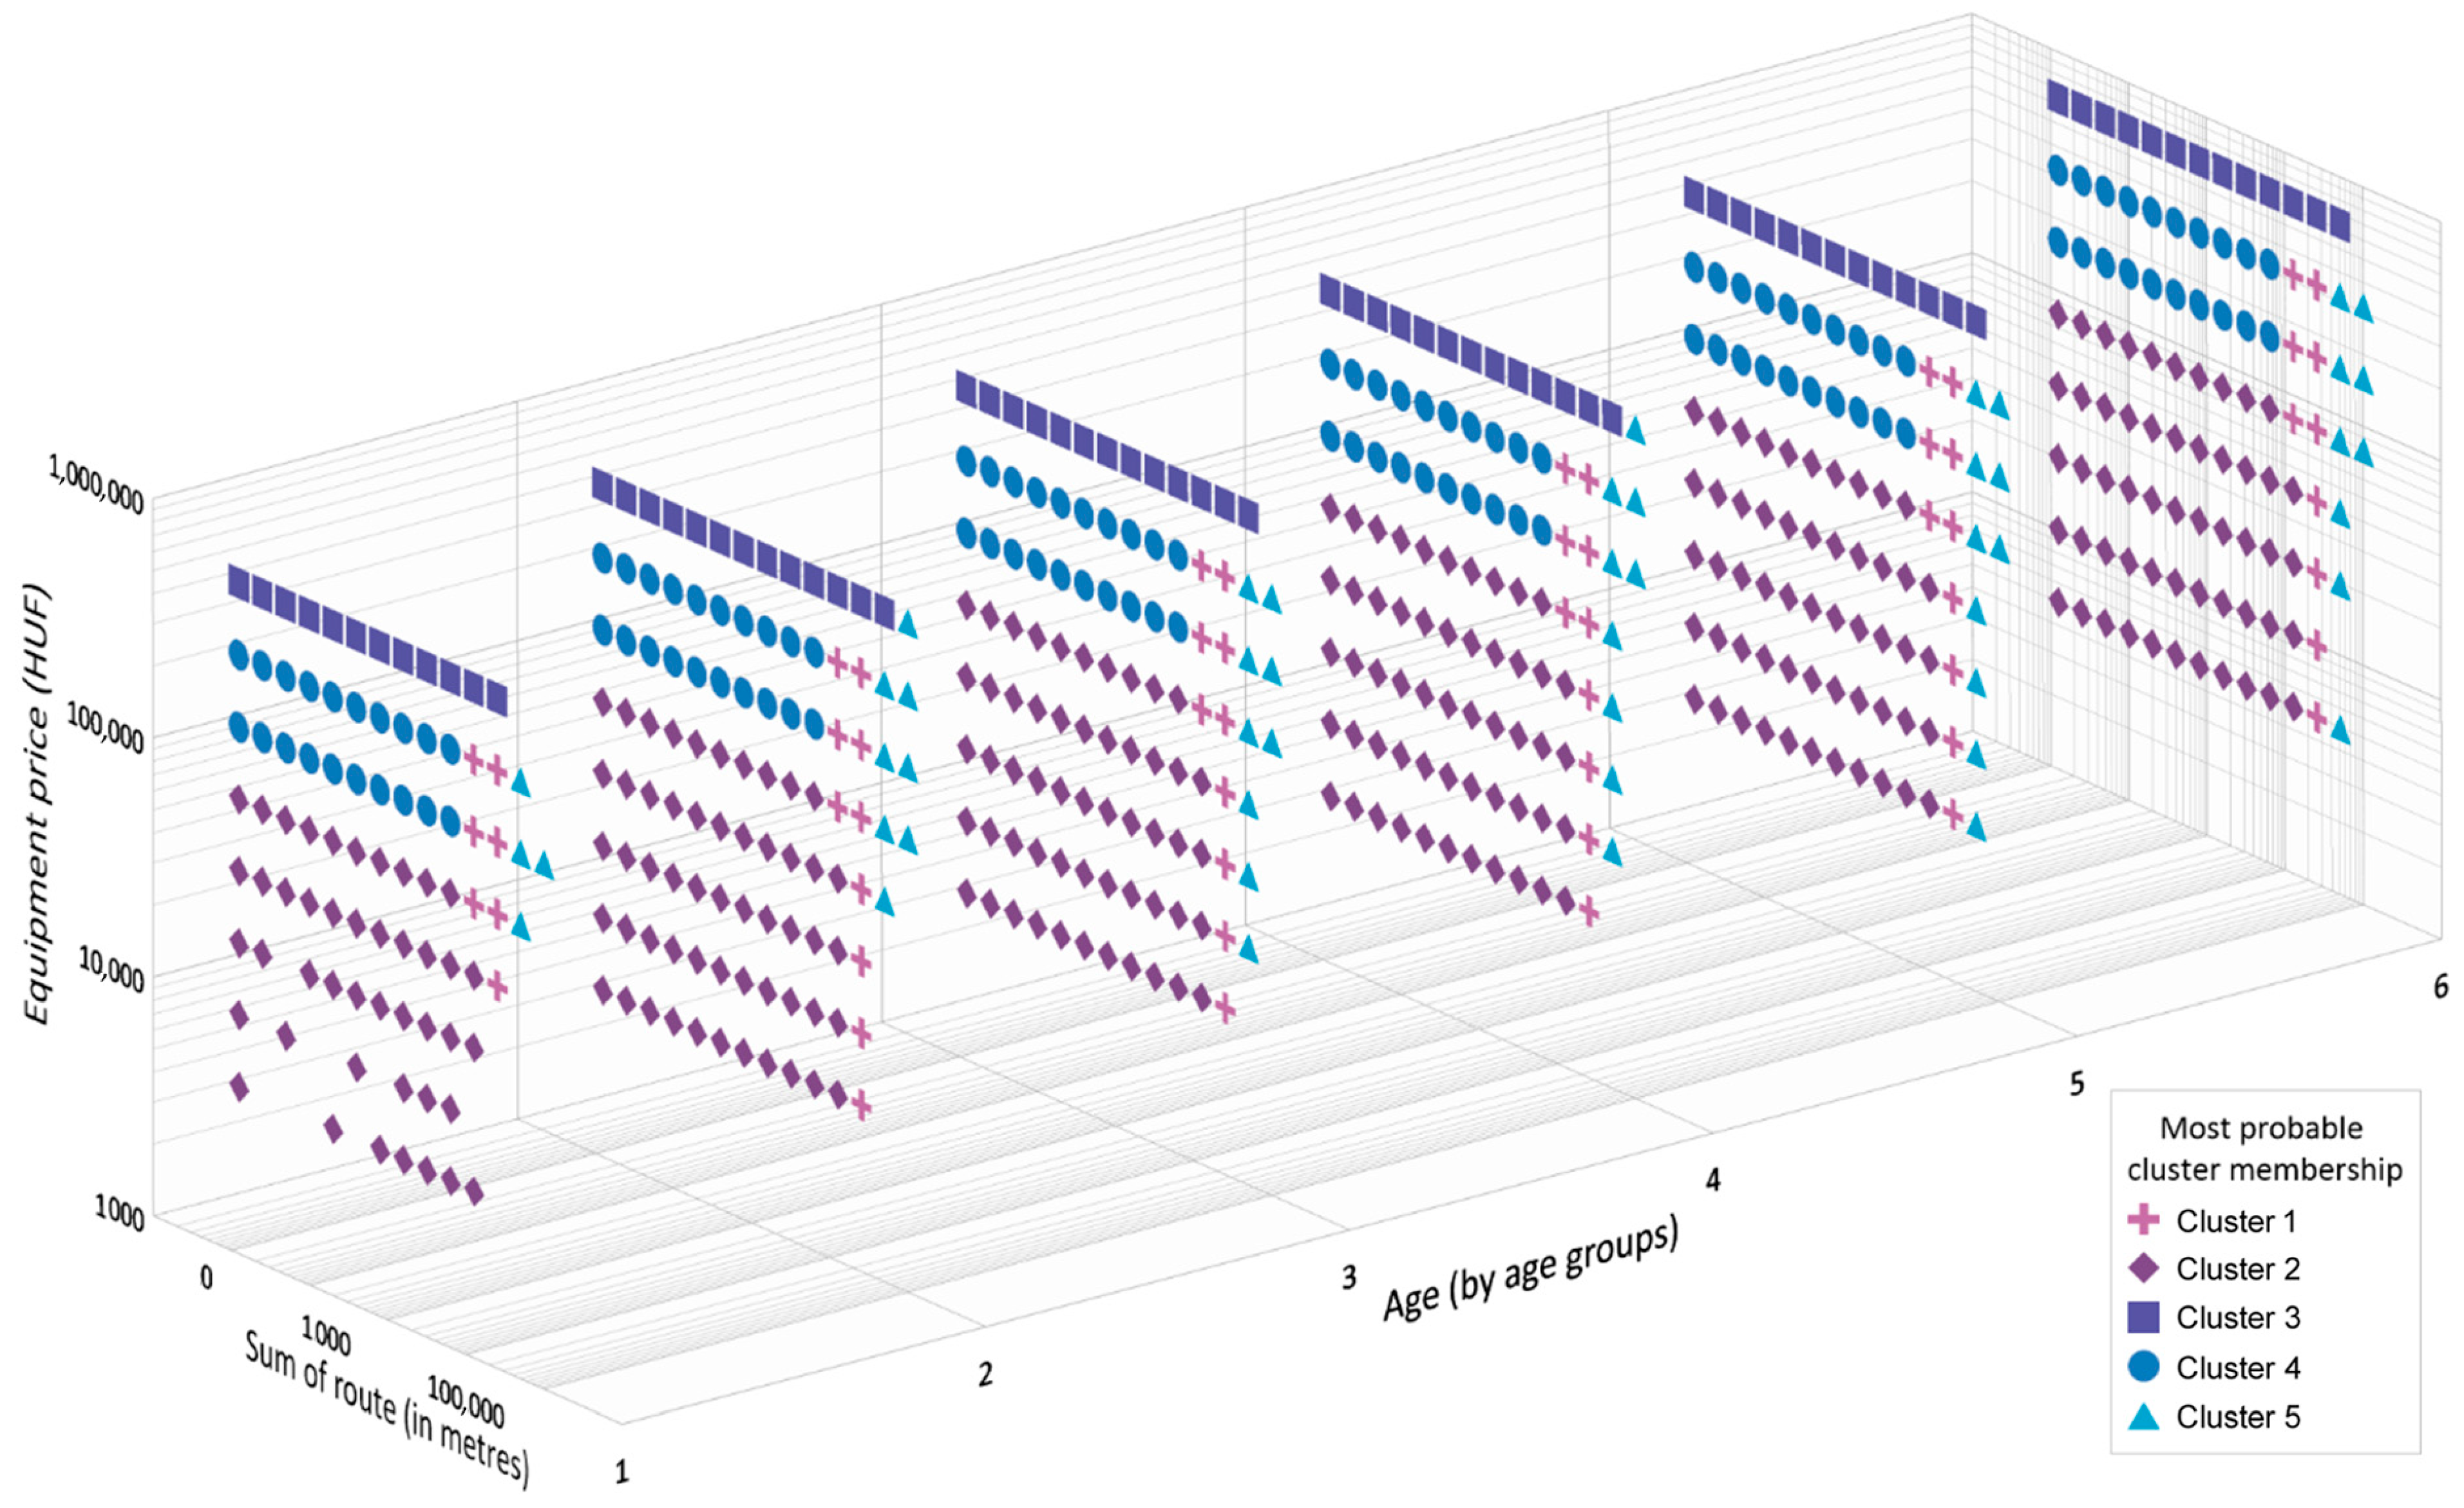
To gain a more nuanced understanding of user segmentation, we extended our analysis by applying 3D FCM incorporating RouteSumRad, PriceNew, and Age as input variables. This approach allowed us to explore whether generational differences exert an additional influence on the grouping of users based on travel behavior and device price. The three input indicators formed a 3D data cube, where each cell represents a unique cross-sectional combination of mobility intensity, device cost, and age category (
Figure 5). Based on these combinations, fuzzy membership probabilities were computed, which led to the delineation of five distinct fuzzy clusters. The position and density of clusters varied along all three axes of analysis, demonstrating the multidimensional structure of behavioral patterns. While the inclusion of age introduced additional variation in cluster configuration, the results indicate that complex mobility behavior is only marginally influenced by age. This limited impact is likely also attributable to the fact that our data were available only in highly aggregated ten-year categories, whereas in the case of device price and distance traveled we had more varied (and continuous) data, allowing for the formation of more fluid clusters. Nonetheless, age appears to moderately adjust the cluster boundaries, suggesting that generational factors, although not primary drivers, do play a secondary role in shaping mobility-related groupings.
4.2. Geographical Distribution Analysis
It is logical to assume that many of the identified behavioral clusters correspond to spatially structured population groups, exhibiting geographically distinguishable patterns. To validate this hypothesis, cluster results were geographically anchored by associating user-level fuzzy probabilities with mappable spatial units. Given the probabilistic (non-discrete) nature of cluster memberships, a nuanced geolocation procedure was required to represent users spatially in a meaningful and interpretable way. User locations were assigned based on the BTS service area polygons associated with their activity. Since equipment (i.e., users) may appear in multiple BTS polygons throughout the day, a methodological decision was necessary to select a representative polygon for mapping purposes. Three alternative approaches were developed: zipStart represented the zip code of the polygon where the user’s first event of the day was recorded, zipEnd represented the zip code of the polygon corresponding to the last event of the day, while zipMidday referred to the zip code of the polygon where the equipment was located at or near 12 pm. While zipStart and zipEnd can be interpreted as proxies for home locations or anchor points [
49], zipMidday is assumed to reflect likely workplace or activity space during peak daytime hours. Since BTS service areas do not correspond neatly with administrative zip boundaries (often overlapping or spanning multiple zip zones), we applied a modified GIS-based weighting algorithm similar to dasymetric methodologies [
68,
69] to assign a dominant zip code to each BTS polygon. This involved computing a CORINE-based weighted sum of raster cells within each polygon and determining which zip area contributed the most to that weighted total. In this procedure, each BTS polygon was converted to raster cells and spatially joined with the CORINE Land Cover 2018 dataset to determine land use classification. Then, we assigned weights to each raster cell based on its CORINE land cover type as follows: weight = 1.0 for urban fabric (residential areas, parks, cemeteries, green spaces, sport facilities); weight = 0.5 for industrial/transport infrastructure (factories, roads, railways, ports); weight = 0.2 for non-urban land uses (agriculture, forest, water bodies). These weights were summed by zip code for each overlapping polygon, and then the zip code with the highest aggregated weight was selected as the representative spatial unit for that BTS polygon. By using this geospatial procedure, behavioral profiles can be probabilistically assigned to specific zip-code-level locations, which allows for the spatial analysis and visualization of fuzzy user clusters with improved locational accuracy and interpretive value.
After gathering the probabilities of fuzzy cluster membership at the user level, the subsequent task involved aggregating these values spatially. To achieve this, the mean probability of membership in each fuzzy cluster was calculated for every zip code area, resulting in a set of geographically aggregated probability values. Unlike a hard cluster map that assigns each spatial unit to a single dominant group, the ‘average probability’ maps preserve the fuzzy nature of the classification by visualizing the mean membership degree (0–1) of users associated with a given zip code to each cluster. Consequently, high average probabilities indicate spatial determinacy (many users with strong membership to that cluster), while low average probabilities reflect mixed or overlapping behavioral profiles where several clusters co-exist and no single group is dominant. This enabled the visualization of average cluster membership probabilities on maps, thereby providing insight into the spatial determinacy and distributional patterns of behavioral groups. To comprehensively evaluate the cartographic outcomes, the spatial distribution of each cluster from the fuzzy models was mapped using all three zip-code assignment methods (zipStart, zipEnd, and zipMidday) yielding a substantial number of decomposable maps.
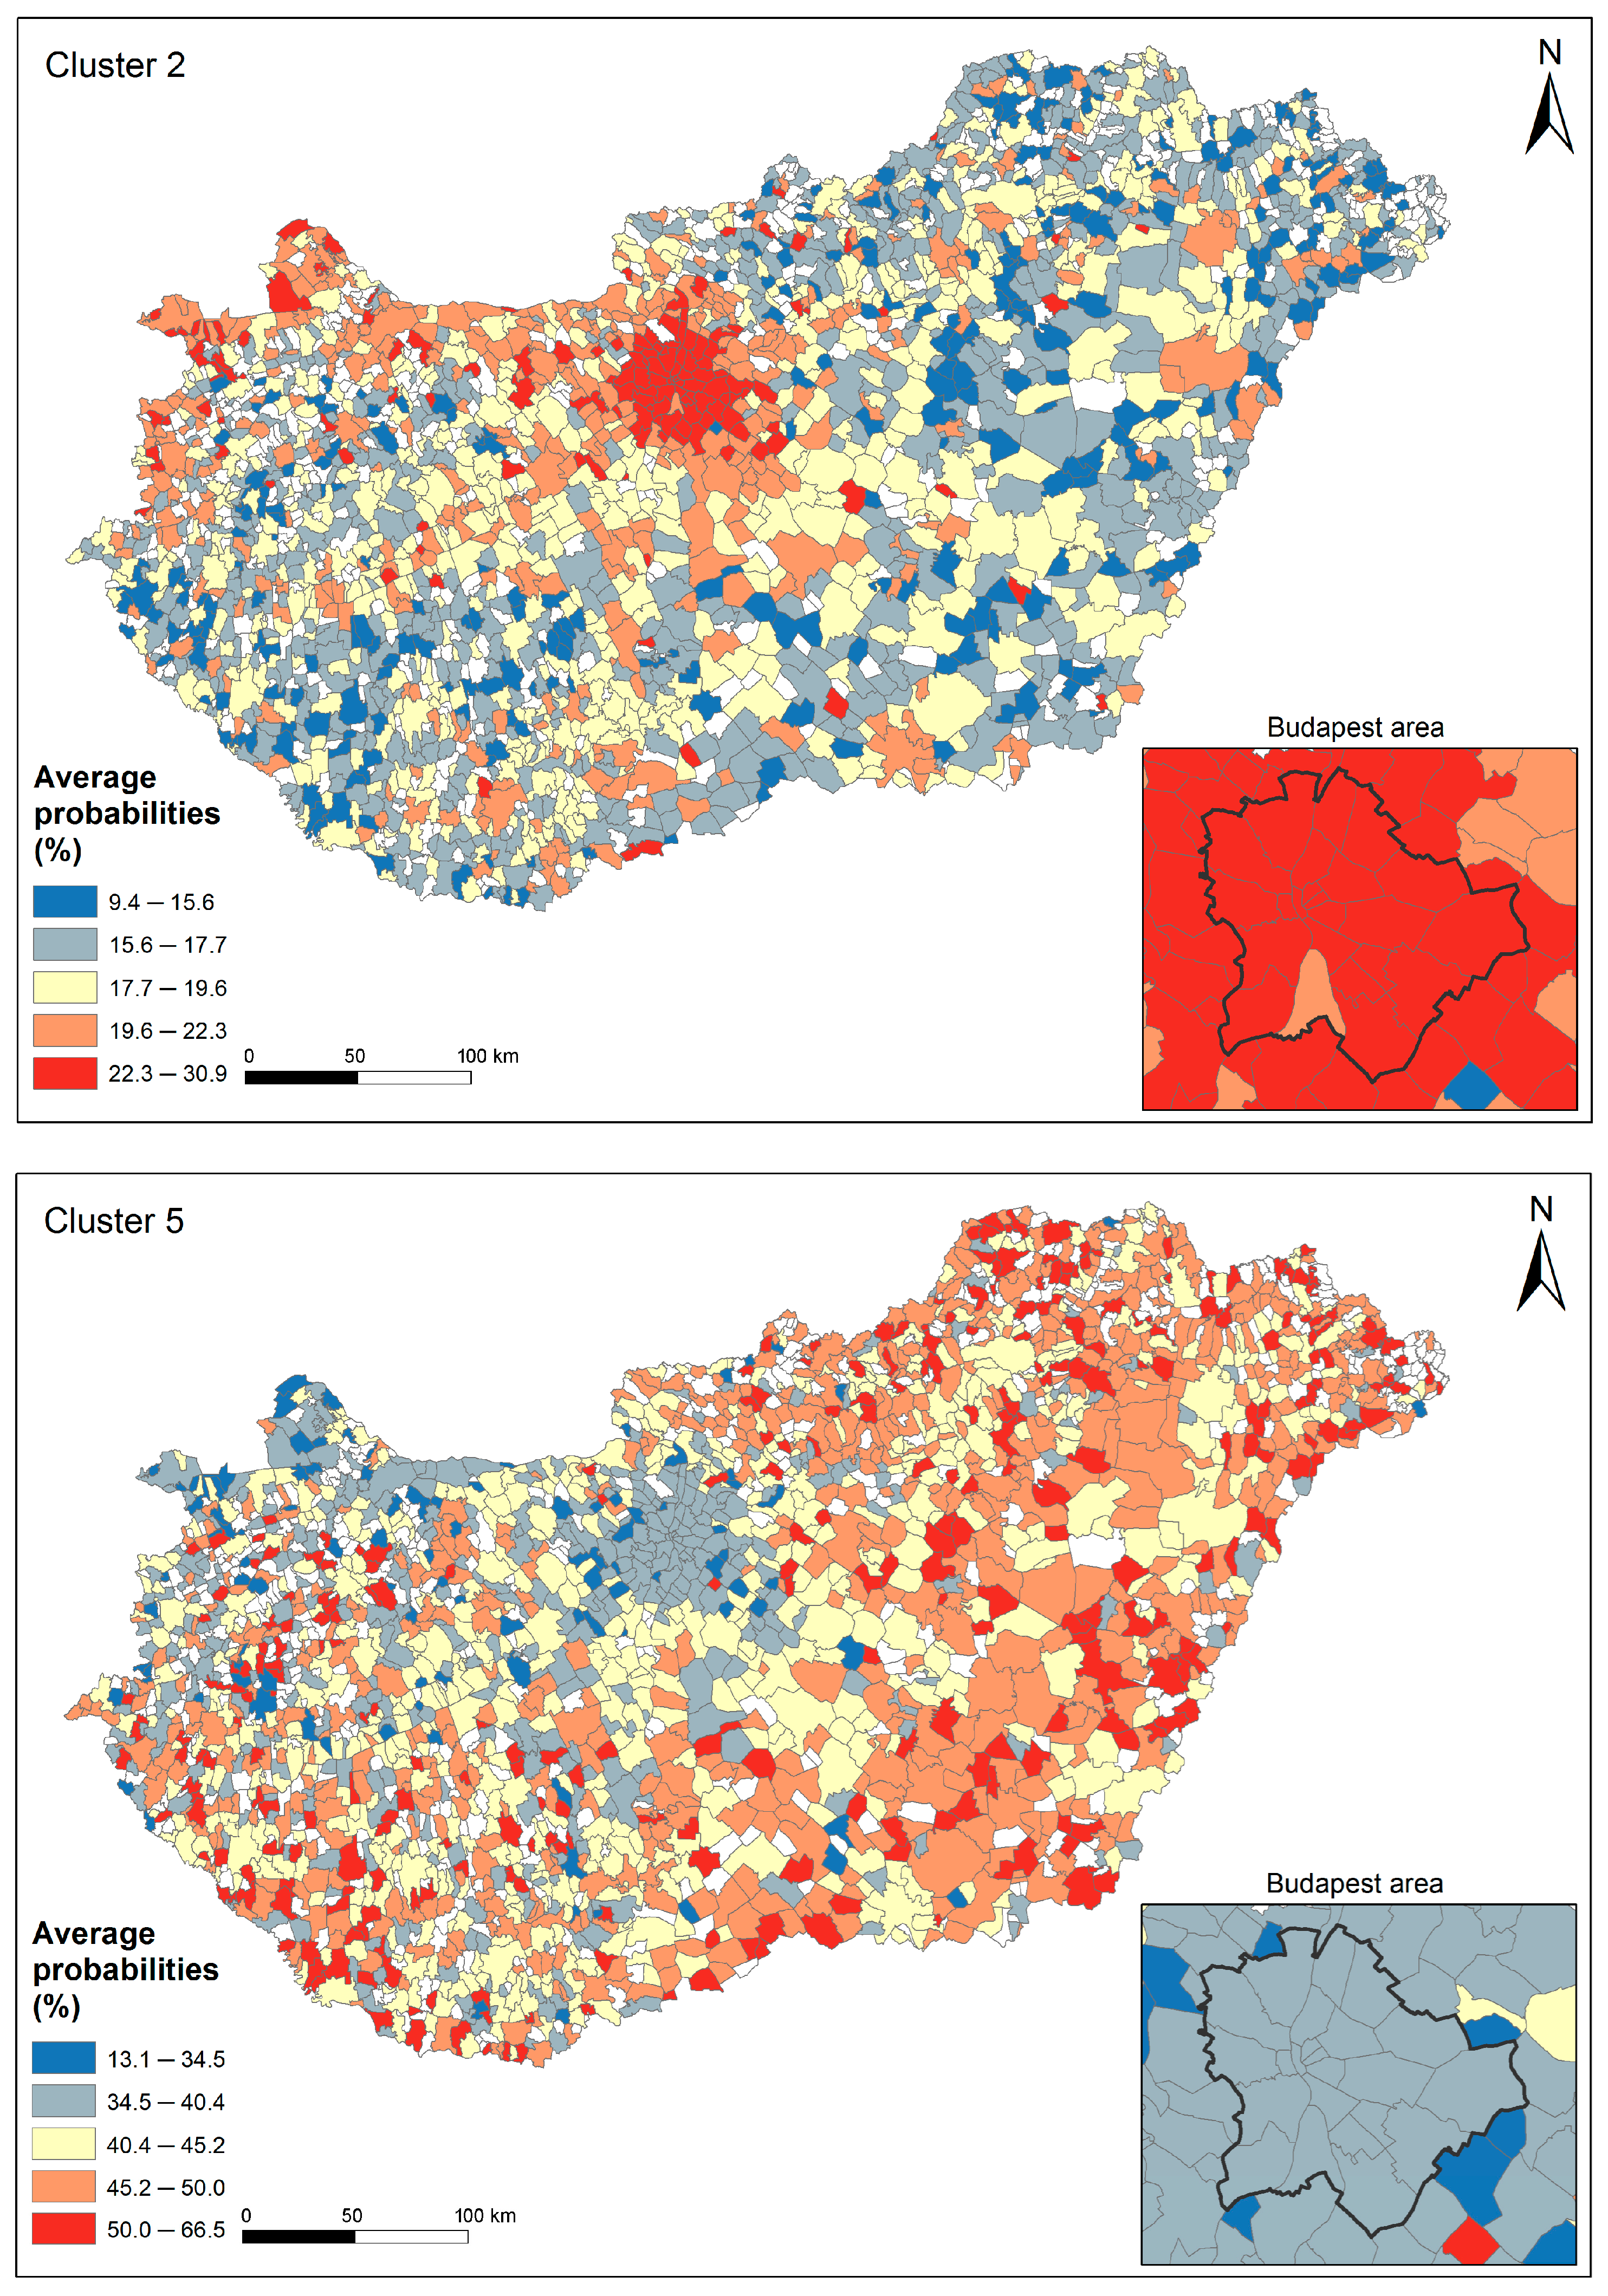
Among the examined models, the spatial structure of the SpeedMaxRad–PriceNew fuzzy clustering model proved particularly revealing. It is important to be aware of the potential cartographic bias that may result from the size variation in postal code level spatial aggregation (i.e., Modifiable Areal Unit Problem); however, the overall spatial trends are clearly discernible. As illustrated in
Figure 6, Cluster 2, which is primarily influenced by high mobile phone prices, displayed a strong spatial concentration, particularly around Budapest and Northwest Hungary. This is consistent with the known economic geography of Hungary [
70,
71], where economically developed regions are concentrated in and around the capital and western parts of the country. The statistically significant co-variation between the territorial patterns emerging from the cluster analysis and spatial income statistics suggests that any internal bias in the PriceNew data is unlikely to be substantial. Conversely, Cluster 5, shaped by low estimated phone prices, also showed a distinct but less direct spatial correlation. While one might expect this cluster to align with economically disadvantaged areas, its spatial pattern did not perfectly mirror the distribution of Hungary’s backward regions, suggesting a more complex interplay of mobility and socio-economic factors. Cluster 3, which shares some characteristics with Cluster 2, appeared in fewer cross-sectional value combinations and presented a similar spatial pattern. Meanwhile, the remaining clusters exhibited greater randomness, reflected in lower average probabilities across most zip areas, implying weaker spatial coherence. However, this was expected as the spatial pattern of the resulting clusters generally delineates less sharply defined group boundaries due to the nature of the fuzzy methodology. Overall, these findings reinforce the idea that although phone price (as an occasional proxy for socio-economic status [
72,
73]) plays a significant role in determining cluster membership, it certainly does not function as the sole explanatory variable. Importantly, the fuzzy clustering methodology allows for a moderated spatial structure, one that accommodates gradual transitions and overlapping memberships, rather than enforcing rigid territorial classifications. This flexibility enhances the realism and interpretive value of spatial behavioral modeling based on large-scale mobile phone data.
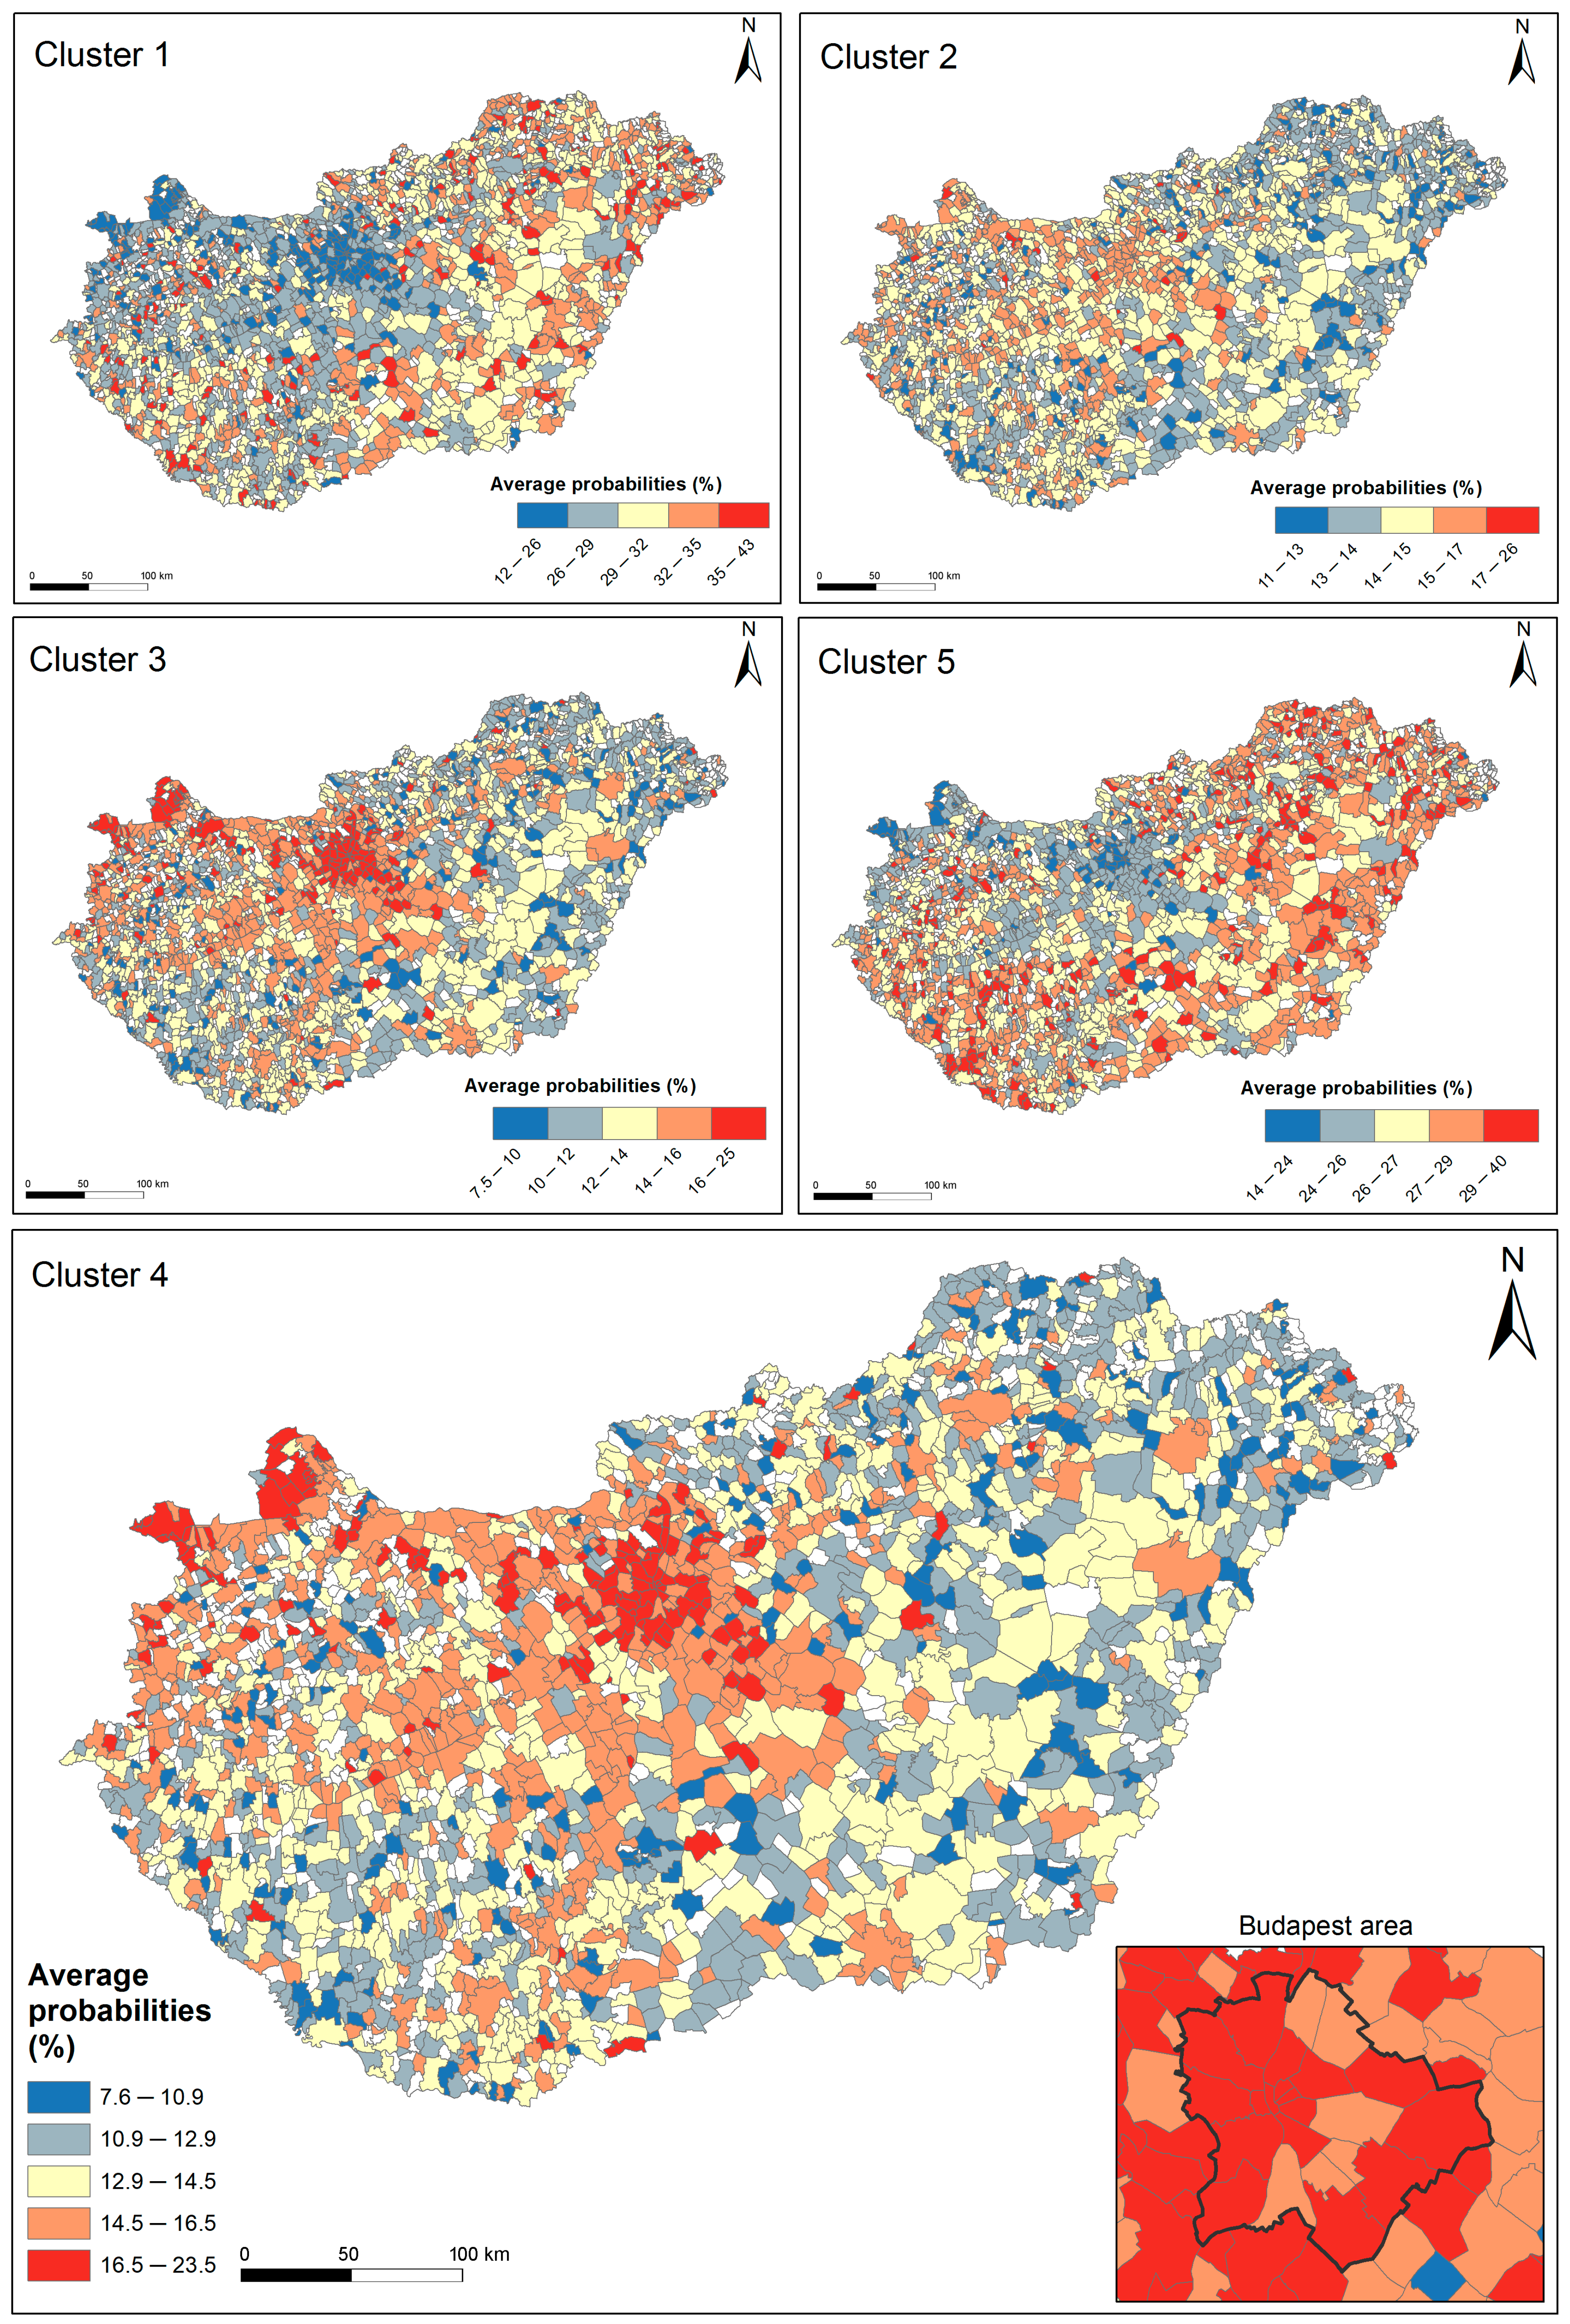
The cluster outcomes based on aggregated travel distance (RouteSumRad) and mobile phone price (PriceNew), as well as those from the extended model incorporating Age as a third variable, exhibited only minor differences, suggesting that Age had a limited impact on altering the fundamental grouping characteristics derived from the other two indicators. In our visualized models (
Figure 7), a clear and comparable spatial structure emerged for Clusters 3 and 4, while the opposite of that emerged for Clusters 1 and 5. Notably, Cluster 2 showed a more balanced and diffuse spatial distribution of mean cluster membership probabilities across zip areas. While its pattern did not exhibit strong regional concentration, it nonetheless retained subtle traces of the broader spatial structure observed in the other clusters.
The highest average cluster membership probabilities across zip areas were observed for Clusters 1 and 5, which is consistent with expectations, as these groups are generally defined by less extreme values in the original indicator dimensions (refer again to
Figure 5). In contrast, Clusters 3 and 4 (characterized by more extreme values in the phone price category) showed moderately lower average probabilities across zip areas, likely due to their more narrowly defined user profiles. The lowest average probabilities were associated with Cluster 2, which is distinguished by very high aggregated travel distances and a slight overrepresentation of older age groups. Overall, these findings affirm that discernible geographical patterns of mobile phone user behavior can be identified even within the framework of a probabilistic, fuzzy clustering methodology. This outcome highlights a key insight: although fuzzy clustering allows for overlapping group memberships and accounts for uncertainty, it still reveals structured spatial divisions in user behavior. Importantly, this underscores the contribution of the study, that geographical factors, though external to the mobile telecommunications market, are clearly manifest in the mobility behavior of mobile phone users. Such spatial determinacy suggests a non-random, geography-sensitive segmentation of customer behavior that holds valuable implications for both urban planning and market strategy development.
5. Conclusions
In this study, we presented a comprehensive analytical framework to investigate the complex travel behavior of mobile phone users using a significantly large and high-resolution dataset. Drawing on 6.3 million equipment records provided by a Hungarian telecommunications company, we analyzed population mobility through the lens of mobility metrics and customer attributes, leveraging cellular-level mobile phone communication data. A methodological contribution of this work lies in our GIS-based multistep geolocation procedure, which enhances the accuracy of spatial positioning compared to traditional Voronoi models. This improvement enabled the construction of fine-grained mobility indicators that served as the foundation for behavioral analysis. For each user (i.e., equipment), we transformed original variables into logarithmically scaled categorical values, and then employed computationally efficient two- and three-dimensional Fuzzy C-Means clustering to segment users into groups with similar behavioral patterns. This unsupervised machine learning approach, unlike conventional survey-based methods, enabled the detection of nuanced mobility groupings across millions of anonymized user records.
Our results demonstrated that long travel distance and high phone prices are strong contributors to distinct mobility group formation, while age showed a less pronounced influence in shaping behavioral clusters. Despite the soft clustering nature of FCM, which yields probabilistic rather than absolute classifications, we observed non-random and spatially coherent groupings, indicating that geographical context plays a significant role in shaping mobile phone usage and associated mobility behaviors. For instance, distinct spatial patterns were evident for clusters associated with higher equipment prices and extensive travel distances, particularly in Budapest and Northwest Hungary, highlighting the socio-economic and infrastructural dimensions of user behavior. The findings underscore the dual strength of fuzzy clustering: its ability to capture the ambiguity and fluidity of real-world human mobility, while still yielding interpretable spatial structures. This balance is especially valuable in the context of mobile data analytics, where sharp delineations may not adequately reflect the dynamic nature of user movement.
Two limitations should be emphasized when interpreting empirical clusters. First, the behavioral profiles were derived from a single workday; therefore, the reported groupings should be interpreted as a snapshot rather than an accurate estimation of long-term individual routines. Mobility patterns may vary across weekdays, weekends, and seasons, and extending the temporal span could reveal additional within-person variability or shifts in group boundaries. Second, the analyzed period precedes the COVID-19 pandemic; since post-2020 mobility regimes have been influenced by teleworking and broader behavioral changes, the presented clusters should be interpreted as a pre-pandemic baseline scenario. Importantly, these limitations do not affect the transferability of the proposed GIS-assisted workflow and fuzzy segmentation framework, which can still be applied to recent observations.
Although the empirical demonstration is based on a Hungarian operator dataset and a single typical workday, the proposed framework is intentionally modular and can be transferred to other territorial contexts and mobile network environments. The key steps—(i) GIS-based representation of cell service areas, (ii) derivation of interpretable mobility proxies from sequential network events, (iii) scale-aware transformation of heavy-tailed indicators (e.g., log-scaling and discretization into categorical intervals), (iv) probabilistic segmentation using Fuzzy C-Means, and (v) spatial aggregation of membership degrees to reporting units—do not rely on country-specific assumptions and can therefore be reproduced with comparable inputs elsewhere. In practice, the workflow can be adapted to alternative data availability scenarios: where detailed antenna parameters and terrain data are accessible, the refined georeferencing can be implemented as presented; where such engineering metadata are unavailable, a simplified coverage approximation (e.g., tessellation- or radius-based) can still support the subsequent mobility-metric and fuzzy-segmentation steps, albeit with a clearer acknowledgment of positional uncertainty. Similarly, the approach can be extended from single to multi-day or seasonal windows by computing user-level mobility indicators for each day and analyzing either day-specific segmentations or temporally aggregated profiles, while maintaining privacy safeguards through anonymization and aggregation. Finally, because the clustering is performed on a small set of conceptually transparent indicators, additional dimensions (e.g., other mobility metrics, customer attributes, or territorial covariates) can be incorporated without changing the core logic of the framework, supporting comparative studies across cities, regions, and countries.
In conclusion, our findings suggest that even in large and complex datasets, data-driven techniques like fuzzy clustering can meaningfully reflect the spatial and social structures of modern societies and can enhance our understanding of contemporary human mobility in the digital age. Our results have the potential to back up the evidence-based preparation of regional and urban development decisions, where the real-time population size and composition are crucial (for example, when assessing traffic load on transport infrastructure). Furthermore, they contribute to a better understanding of the dynamic spatial distribution of population volumes, thereby supporting, for instance, the modeling of environmental pressures as well as the development of resilient and sustainable local and regional strategies.