


Abstract
Emerging technologies are reshaping labor market dynamics and redefining the competencies required for employability. However, their benefits remain unevenly distributed, particularly among socially vulnerable populations such as people with visual impairments. This study examined the relationship between emerging technologies and employability among individuals with visual disabilities in a city in northern Peru, within the broader framework of inclusive development and equal opportunity. A quantitative, non-experimental, cross-sectional design was employed with a sample of 132 participants. Data were collected through a Likert-type questionnaire measuring indicators associated with emerging technologies and employability. To capture the structural interdependencies between both domains, the study used psychometric network analysis based on ordinal correlations and EBICglasso estimation. The resulting network comprised 17 nodes and 89 edges, with a predominance of cross-domain associations between technology and employability indicators. The nodes with the strongest expected influence were EM5, TE7, and TE9, suggesting that these indicators occupied relatively central positions within the estimated exploratory network. Taken together, the results suggest preliminary associations between employability-related indicators and technology-related indicators, particularly those linked to technological access, skills development, autonomy, and innovation. Given the exploratory nature of the instrument, the cross-sectional design, and the sample size, these findings should be interpreted as preliminary. In this context, psychometric network analysis is best understood as a complementary exploratory approach that helps identify conditional associations between indicators, while further psychometric confirmation of the instrument remains necessary.
1. Introduction
Emerging technologies, artificial intelligence, automation, digital platforms, and assistive tools have redefined the nature of work and expanded, in an unprecedented way, the horizon of employability: the dynamic ability to acquire, maintain, and move between jobs throughout one’s working life. However, this transformative potential does not reach all sectors of the population equally. People with visual impairments, who experience the spectrum from low vision to total blindness, continue to inhabit the margins of formal employment, not due to a lack of ability, but because work and technological environments were rarely designed to include them. Accordingly, this study examines how indicators of emerging technologies and employability are structurally interconnected among people with visual disabilities in a city in northern Peru, with particular attention to central and bridge nodes within the estimated network.
International evidence shows that employment rates for people with disabilities are approximately half those of the general population, not due to productivity deficits but rather to structural and attitudinal barriers. This phenomenon directly challenges the commitments made in the 2030 Agenda: SDG 8 (decent and inclusive work), SDG 4 (accessible technical and vocational training), and SDG 10 (reduced inequalities) highlight the need to generate evidence linking technology, training, and the labor market for vulnerable populations. However, the reviewed literature is concentrated mainly in contexts outside northern Peru, and empirical evidence on the relationship between emerging technologies and employability among people with visual disabilities in this regional setting remains limited.
A critical review of the state of the art reveals two unresolved tensions: the gap between technological knowledge and effective adoption—only 40% of people with disabilities use the technologies they are familiar with—and the unresolved debate between approaches that attribute employability to individual attributes versus those that emphasize structural determinants. This is compounded by a twofold knowledge gap: geographical, due to the lack of empirical research in Latin America on this thematic intersection; and methodological, since many prevailing cross-sectional survey designs and latent-variable approaches are less directly suited to modeling conditional dependencies among multiple observed indicators when the phenomenon is highly interdependent and multidimensional.
Given this scenario, the present study examines the relationship between emerging technologies and employability among people with visual disabilities in a city in northern Peru. Because the phenomenon is multidimensional and potentially characterized by interdependent indicators, psychometric network analysis was incorporated as an exploratory complementary approach to describe conditional associations between observed variables. In this study, the network approach is not treated as a substitute for establishing latent structure, but rather as an additional analytical strategy aimed at identifying central and bridge indicators within a preliminary measurement framework.
The study is justified on three levels. Scientifically, it contributes localized empirical evidence on an underexplored topic and combines exploratory measurement assessment with relational modeling of indicators. Socially, it focuses on the employability conditions of a population historically disadvantaged in the labor market, in line with the social model of disability, which situates disadvantage in environmental and structural barriers rather than in individual deficits. From an applied perspective, the study may offer preliminary insights relevant to future discussions on accessibility, training, and labor inclusion, although no direct policy or intervention claims are inferred from the present design.
Accordingly, this study was guided by the following research questions: RQ1. What conditional associations are observed between emerging technology indicators and employability indicators among people with visual disabilities in a city in northern Peru? RQ2. Which indicators show the highest expected influence and bridge expected influence in the exploratory TE–EM network? RQ3. How are technology-related and employability-related indicators organized into empirical clusters within the estimated network? RQ4. To what extent should the observed associations be interpreted cautiously, considering the cross-sectional design, the sample size, and the preliminary psychometric status of the instrument? Based on these questions, the study aimed to describe the conditional association structure between emerging technologies and employability indicators, identify relatively central and bridge indicators, and explore the modular organization of the TE–EM network.
2. Theoretical Framework
The relationship between emerging technologies and employability in people with visual disabilities has gained growing relevance in contemporary labor, educational, and social debates. The topic is not limited to technological innovation itself, but extends to the ways in which accessibility, skills formation, organizational culture, and structural inclusion shape participation in the labor market. Under this perspective, the literature converges on three foundational constructs that organize the present framework: emerging technologies, employability, and visual impairment.
2.1. Foundational Constructs of the Analysis
2.1.1. Emerging Technologies and Labor Transformation
Emerging technologies are transforming work, education, and social participation by modifying the skills, tools, and forms of interaction required in contemporary labor markets. These transformations include artificial intelligence, robotics, automation, digital platforms, big data, and assistive technologies, which may generate both opportunities and vulnerabilities for workers depending on the context of adoption [1,2]. In labor settings, emerging technologies are changing recruitment, task design, work practices, creativity, engagement, and the competency profiles expected from employees [3,4,5]. In educational and professional training contexts, online learning ecosystems, microcredentials, learning analytics, and work-integrated learning have also been linked to employability development, although their long-term and inclusive effects remain unevenly demonstrated [6,7,8].
For people with visual disabilities, emerging technologies acquire an additional inclusive meaning because they can support access to information, autonomy, communication, mobility, and participation in educational or work-related environments. Recent assistive solutions, such as object detection models and image-captioning systems, illustrate how technological innovation may contribute to accessibility when it is designed around the needs of visually impaired users [9,10]. Nevertheless, such technologies should not be assumed to automatically improve employability, since their value depends on effective adoption, training, affordability, usability, and compatibility with real work contexts.
2.1.2. Employability as a Multidimensional and Contextual Construct
Employability is a multidimensional and contextual construct that extends beyond obtaining a job. It involves the capacity to acquire, maintain, and adapt to employment opportunities through knowledge, practical skills, professional capital, motivation, and social or institutional support [11]. In technology-mediated labor markets, employability is increasingly associated with digital competencies, data literacy, problem-solving, digital content creation, intellectual property knowledge, and the ability to use technological tools meaningfully [12,13,14]. Educational experiences such as project-based learning, curriculum–labor market alignment, technological pedagogical knowledge, and self-efficacy in technology integration also contribute to employability development in different professional contexts [15,16,17].
At the same time, employability in technologically changing environments is shaped by how workers and professionals perceive artificial intelligence, entrepreneurial human capital, and the future value of their own competencies [18,19]. For people with visual impairments, employability should also be interpreted in relation to disability trajectory and accessibility conditions. Evidence indicates that the age of onset of visual impairment may affect employment outcomes, suggesting that labor participation is shaped not only by skills, but also by life trajectory, educational access, assistive support, and opportunity structures [20].
2.1.3. Visual Impairment, Accessibility, and Labor Participation
Visual impairment ranges from low vision to total blindness and affects access to education, employment, and social participation in differentiated ways. Previous evidence shows that visual limitations may affect quality of life and work conditions, confirming that visual disability is not only a clinical issue, but also a labor, social, and inclusion issue [21]. The employability of people with visual impairments is strongly conditioned by contextual factors, including organizational barriers, internalized devaluation, the absence of enabling ecosystems, and limited disability awareness in workplaces [22,23]. Training and institutional adaptation are also central, since assistive technology training and digitally adapted educational programs may support academic performance, autonomy, and future employability when implemented in accessible and inclusive conditions [24,25].
2.2. Main Analytical Dimensions
The literature suggests that the relationship between emerging technologies and employability among people with visual disabilities can be organized around four closely connected dimensions. The first is access to assistive and emerging technologies. Access includes not only the availability of devices or digital tools, but also affordability, awareness, accessibility, and sustained use. Prior research has shown that knowledge of assistive technologies does not necessarily translate into effective adoption, which is especially relevant in contexts where training and support are unevenly distributed [26]. At the same time, recent developments in object detection, image captioning, haptic interfaces, and co-designed accessible applications illustrate the potential of technological innovation for visually impaired users when accessibility is incorporated from the design stage [9,10,27].
The second dimension concerns digital skills and professional capital. In technology-mediated labor markets, employability depends on the ability to convert technological access into usable competencies, such as digital problem-solving, information management, communication, and adaptive learning [12,13]. This is particularly important for people with disabilities, since the use of assistive technologies often requires specific training, continuous updating, and functional readiness rather than only declarative awareness of technology [2,28,29].
The third dimension refers to structural and attitudinal barriers. Employment inclusion is shaped by organizational accessibility, employer expectations, inclusive hiring practices, reasonable accommodations, communication barriers, assumptions about productivity, and broader labor-market segmentation [30,31,32,33]. Therefore, employability should not be understood exclusively as an individual attribute, but as the result of interaction between personal resources and enabling or disabling environments.
The fourth dimension involves support networks, training, and retention. Sustainable labor inclusion requires coordinated action among educational institutions, employers, families, public agencies, rehabilitation services, and support organizations [34,35,36]. Retention also depends on work motivation, perceived value of work, and the adaptation of technological implementation to real workflows and operational needs [37,38]. From this perspective, emerging technologies may contribute to employability only when they are embedded in broader systems of training, accessibility, organizational support, and meaningful work integration.
2.3. Theoretical Approaches Guiding Interpretation
Three complementary theoretical perspectives guide the interpretation of this study. First, the social model of disability frames visual disability not as an individual deficit, but as the result of interaction between impairment and environments that may create or reduce barriers. From this perspective, employability depends on accessibility, organizational inclusion, employer attitudes, assistive support, and the removal of structural obstacles [22,30].
Second, human capital and professional capital perspectives emphasize the role of knowledge, skills, training, professional identity, and social networks in labor participation [11,19]. These approaches are useful for understanding why digital skills, continuous learning, and technological self-efficacy may be associated with employability, while also recognizing that such resources are unequally distributed across groups and contexts [6,17].
Third, socio-technical and technological-congruence perspectives suggest that the value of emerging technologies depends on their fit with users’ needs, work tasks, training opportunities, institutional conditions, and real workflows [5,8,38]. This perspective is especially relevant for people with visual disabilities, since assistive or emerging technologies may support autonomy and participation only when they are accessible, usable, and embedded in inclusive environments. It also helps interpret the risks of technological change, since automation, robotics, and AI may intensify vulnerability when technological expectations grow faster than support systems and organizational adaptation [4,36,39].
2.4. Gaps, Tensions, and Unresolved Debates
Despite growing interest in technology, disability, and employability, several gaps remain relevant. First, there is a substantive tension regarding the dual role of technology as both opportunity and risk. Assistive and emerging technologies may support autonomy, accessibility, training, and labor participation [9,24,29], but automation and AI may also deepen vulnerability when technological expectations increase faster than inclusive support mechanisms [1,39]. Second, there is a persistent gap between technological awareness and effective adoption. Prior research shows that knowing about assistive technologies or digital credentials does not necessarily lead to sustained use or labor value, especially when affordability, accessibility, training, and institutional support are limited [7,26].
Third, there is a geographical gap. Available evidence is concentrated mainly outside northern Peru, with some related studies in contexts such as Ecuador, Albania, and South Africa, but limited direct evidence on emerging technologies and employability among people with visual disabilities in this regional setting [14,16,31]. Fourth, there is a conceptual gap between individual and structural explanations of employability. Some studies emphasize competencies, capital, and training [11,13,15], whereas others highlight organizational, attitudinal, and labor-market constraints [22,30,32]. Collaborative support structures may help connect both perspectives by linking individual skills with institutional and vocational support [35].
Finally, there is a methodological gap. Most studies rely on cross-sectional surveys, structural equation models, qualitative case studies, bibliometric approaches, or hybrid predictive models [40]. Although these approaches are valuable, fewer studies examine conditional associations among observed indicators in disability-related employability research. In this context, psychometric network analysis offers an exploratory complementary strategy for describing how technology-related and employability-related indicators are conditionally associated. However, this approach should not be understood as a substitute for full psychometric validation or causal modeling. Instead, it is useful for identifying patterns of association, central indicators, and bridge indicators that may guide future confirmatory, longitudinal, and intervention-oriented research.
3. Materials and Methods
3.1. Participants and Sampling
The target accessible population of the study consisted of 198 adults with visual disabilities residing in a city in northern Peru. In this study, people with visual disabilities were understood as adults with visual impairment, including both individuals with low vision and individuals with blindness. The sample was not restricted exclusively to Braille users, screen-reader users, or low-vision users relying on magnification tools; therefore, participants may have differed in their degree of visual functioning and in their assistive technology profiles. Based on this accessible population, and considering a 95% confidence level and a 5% margin of error, the minimum required sample size was estimated at 131 participants. The final analytical sample comprised 132 valid participants, slightly exceeding the minimum required size. Participant inclusion was carried out according to residence in the study area, adult status, visual disability condition, accessibility conditions for survey participation, eligibility criteria, and voluntary informed consent.
3.2. Procedure and Ethical Considerations
Data collection was conducted using an accessible questionnaire format designed for people with visual disabilities. Participants were contacted through institutional and community-based channels associated with the accessible population in the study area, including local networks linked to disability, education, and social support. Eligibility was verified according to adult status, residence in the city under study, visual disability condition, and voluntary willingness to participate. Participants were informed about the purpose of the study, the voluntary nature of participation, confidentiality safeguards, and their right to withdraw at any time.
The questionnaire was administered in an accessible format. Informed consent was obtained electronically through a mandatory question presented at the beginning of the questionnaire; only respondents who agreed to participate were allowed to continue with the survey. When participants required accessibility support, assistance could be provided for reading, accessing, or recording responses without influencing the content of their answers. The study protocol was reviewed and approved by the Research Ethics Committee of the School of Business Administration at César Vallejo University (revision code 2024-1-56, 1 April 2024).
3.3. Instrument and Study Variables
A quantitative, non-experimental, cross-sectional design was adopted to examine the conditional association structure between indicators of emerging technologies (TE) and employability (EM) among people with visual disabilities. Data were collected using a five-point Likert-type questionnaire initially composed of 18 items (TE1–TE9 and EM1–EM9). The TE domain included indicators related to technological innovation, practical use, and continuous technological updating, whereas the EM domain included knowledge mastery, practical skills, and innovation-oriented capacity. The questionnaire was developed from a two-domain conceptual framework. The emerging technologies domain was structured around three dimensions: technological innovation, practical use, and continuous technological updating. The employability domain was similarly structured around three dimensions: mastery of key knowledge, development of practical skills, and innovation-oriented capacity. Item generation was guided by prior conceptual definitions of emerging technologies and employability and then organized into indicators aligned with these six subdimensions.
To support content validity, the instrument underwent an expert-judgment validation process conducted under the academic procedures of Universidad César Vallejo before data collection. Three experts with doctoral-level training and professional experience in academic, methodological, and organizational settings participated in the review. Their areas of expertise were related to research methodology, instrument validation, inclusive education, organizational studies, employability, and accessibility. The experts assessed the instrument according to four criteria: sufficiency, clarity, coherence, and relevance. Sufficiency referred to the adequacy of the item set for representing each proposed dimension; clarity referred to the semantic comprehensibility of each item; coherence referred to the alignment between the item, the indicator, and the theoretical construct; and relevance referred to the importance of each item for measuring the intended domain.
The institutional validation classified the instrument as satisfactory, with high global expert-assessment scores. These results provided quantitative institutional evidence of content adequacy at the global instrument level before empirical application. However, because the available validation records reported global expert scores rather than item-level ratings, Aiken’s V or the Content Validity Index was not calculated. This distinction is important because the present study reports expert-based content adequacy and exploratory internal-structure evidence, rather than full confirmatory validation. In parallel, semantic intelligibility and contextual adequacy were considered in the wording of the items so that the questionnaire could be administered in an accessible format for people with visual disabilities. Accordingly, the final initial version of the instrument consisted of 18 Likert-type items, distributed across the two theoretical domains and six subdimensions (see Table 1).
Table 1.
Structured Survey.
3.4. Data Preparation and Network Estimation
Prior to modeling, a data quality control and cleaning protocol was implemented to ensure consistency and analytical traceability. First, variable names were standardized, and the ordinal coding of responses (1–5) was verified, controlling for ranges, outliers, and category structure. Item completeness was assessed, identifying a minimal and localized level of missing data (two missing values in EM5). This was handled conservatively using simple imputation by median only to stabilize the ordinal correlation estimation stage, preserving the robustness of the analysis without inducing substantial distortions in the overall response pattern. Additionally, the frequency distribution by category was inspected for each item, revealing that some items had empty categories (an expected pattern in Likert scales when the sample is concentrated at high or low levels of agreement). Since the estimation of polychoric correlations can fail or become unstable when there are categories without observations, the ordinal levels of each variable were redefined using only the categories actually observed, which made it possible to obtain computable ordinal correlation matrices consistent with the available empirical information.
All analyses were conducted in R 4.6.0. (R Foundation for Statistical Computing, Vienna, Austria).ata cleaning, missing-value inspection, category-frequency analysis, and descriptive procedures were performed using base R and standard data-management functions. Polychoric correlations and exploratory factor analysis were performed using the psych package (version 2.4.3). The positive-definite approximation of the ordinal correlation matrix was conducted using the Matrix package (version 1.7-0) through the nearPD function. The regularized psychometric network was estimated and visualized using the qgraph package (version 1.9.8) with EBICglasso regularization. Centrality indices, including Strength and Expected Influence, were obtained from the estimated network structure. Bridge expected influence was calculated by defining TE and EM as two theoretical communities and estimating each node’s signed cross-community connectivity. Modularity analysis was conducted to identify empirical clusters within the TE–EM network.
The internal reliability of the instrument was estimated using Cronbach’s alpha coefficient, yielding an overall value of α = 0.89, which suggests high internal consistency for the set of items under the assumption of homogeneous measurement. This result was interpreted as favorable evidence of reliability, especially considering the ordinal nature of the responses and the sensitivity of the consistency indices to skewed distributions. Additionally, psychometric indicators were monitored at the block level, and results were compared with robust approximations when appropriate, in order to avoid conclusions based solely on a single coefficient and to strengthen the instrument’s quality criteria before its structural analysis.
In the analytical phase, psychometric network analysis was incorporated as an exploratory complementary approach to examine conditional associations between items while controlling for the effect of the remaining variables. Within the present study, this procedure was used to describe the relational organization of indicators and identify central and bridge nodes, but not as a substitute for evaluating the internal structure of the instrument. Given the ordinal nature of the data, estimation based on automatic ordinal correlations was used, and the positive-definition property of the resulting matrix was verified. This verification was critical, as the ordinal correlation matrix initially showed a negative minimum eigenvalue, indicating non-definite positivity and, therefore, direct unsuitability for regularization algorithms (GLASSO). To address this numerical instability, which may occur in polychoric matrices with empty categories or high collinearity, the matrix was approximated to the nearest positive-definite correlation matrix using the nearPD function from the Matrix package. This stabilized the correlational structure and enabled subsequent estimation of the network without compromising the ordinal logic of the instrument. This step was documented as part of methodological assurance, as it helps ensure that network inferences are based on a valid mathematical foundation.
A key quality control finding was the detection of two items with near-perfect association: EM8 and TE8, with a correlation close to 1.00. This suggests semantic redundancy or operational overlap between the two items. This condition, in addition to affecting the stability of the correlation matrix, can artificially inflate network connectivity and distort centrality metrics. For this reason, a refinement strategy focused on discriminant validity was implemented: EM8 was removed to reduce extreme collinearity and avoid identification/estimation problems, while preserving the content represented by TE8 within the construct of emerging technologies. This decision was based on combined criteria (statistical diagnosis and conceptual coherence), prioritizing a more parsimonious and stable instrument for network analysis.
Subsequently, the network was estimated using EBICglasso regularization implemented in the qgraph package on the positive-definite matrix, producing a regularized partial-correlation network intended to facilitate interpretation and reduce overfitting within an exploratory framework. The analysis was complemented with centrality measures, specifically Strength and Expected Influence, to describe the relative connectivity of each node within the estimated network. Bridge expected influence was also estimated by defining TE and EM as two theoretical communities and calculating each node’s signed connectivity with the opposite community. These procedures provided exploratory evidence on possible patterns of conditional association between technology-related and employability-related indicators. Overall, this methodological procedure integrated expert review, internal consistency assessment, redundancy control, empty-category inspection, ordinal matrix stabilization, and regularized network modeling. These steps were intended to improve analytical transparency, numerical feasibility, and interpretability within an exploratory psychometric framework, rather than to establish definitive validation of the instrument.
4. Results
4.1. Exploratory Internal Structure and Instrument Dimensionality
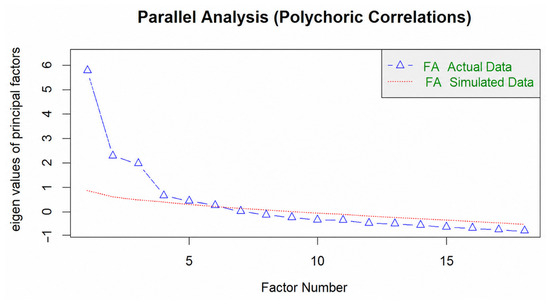
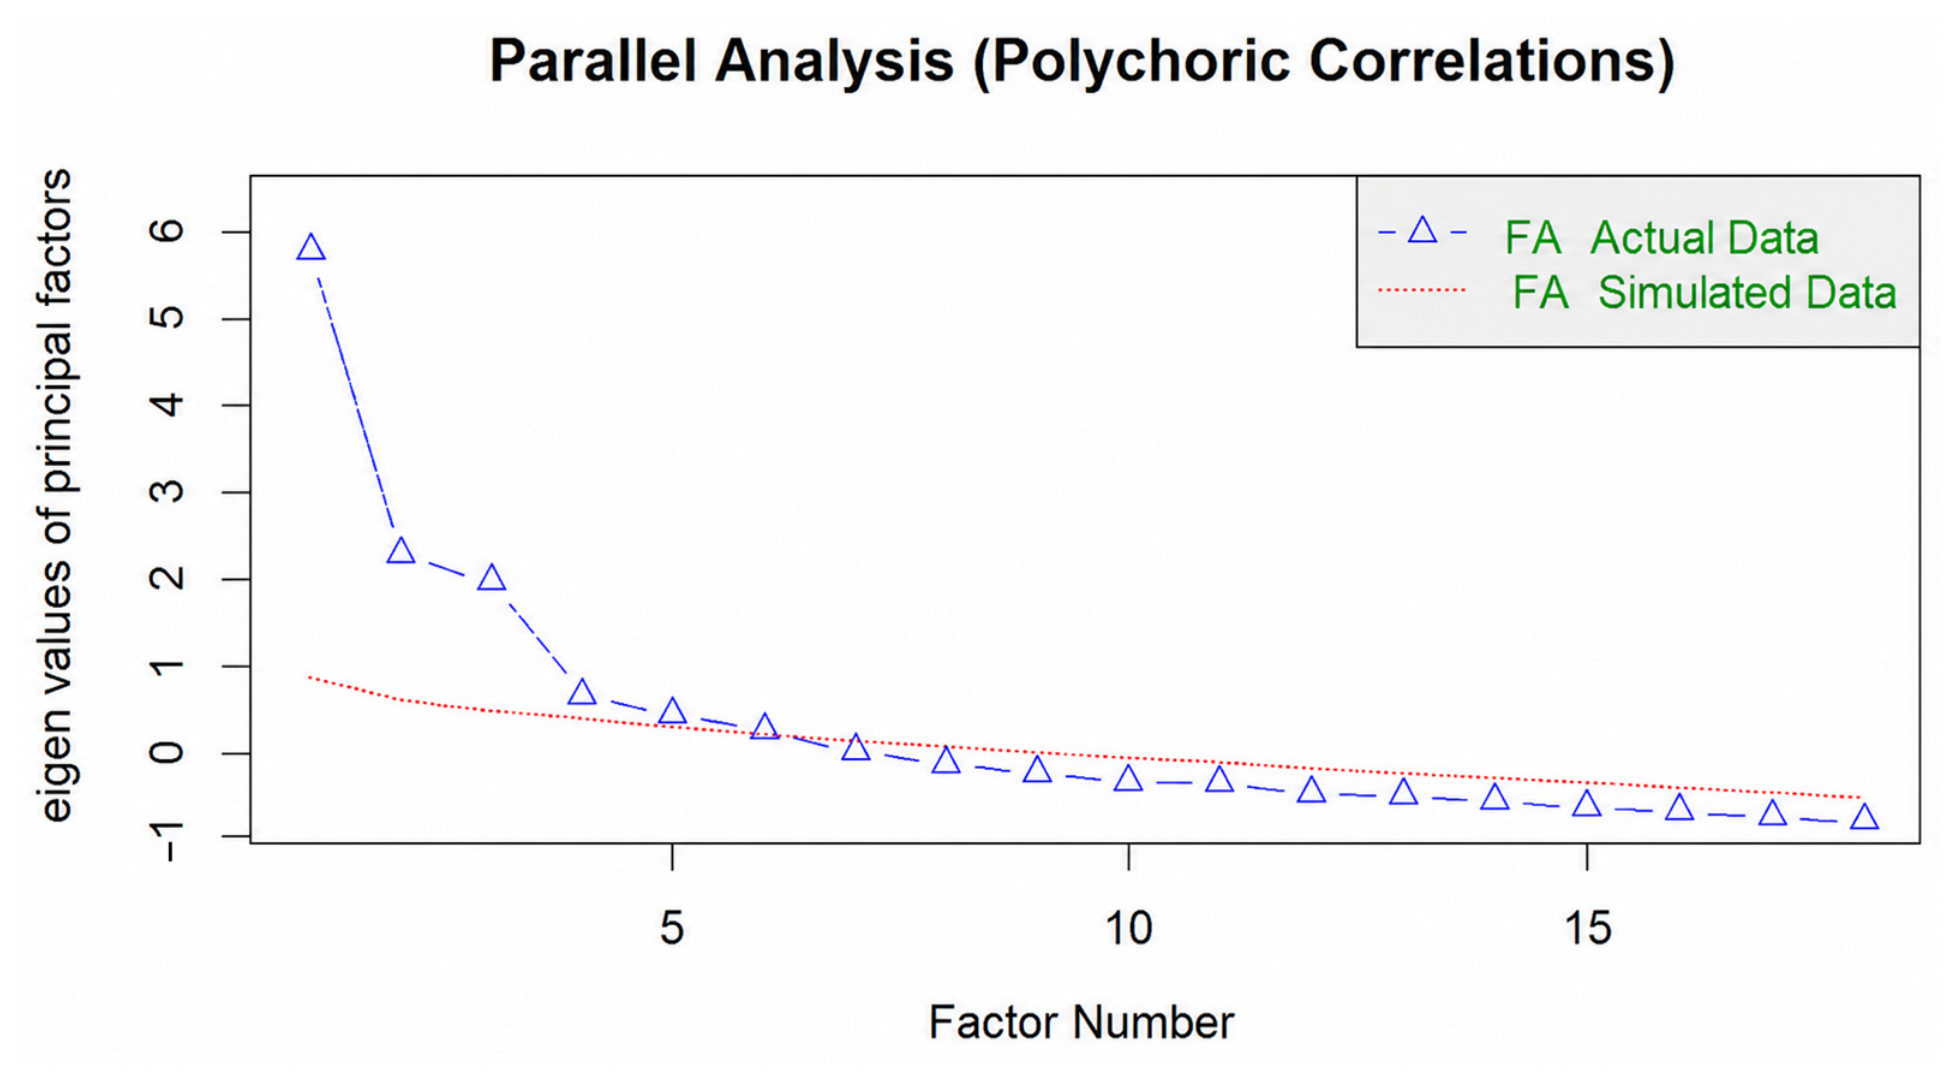
As part of the preliminary assessment of the instrument’s measurement quality, an exploratory factor analysis (EFA) was conducted on the 18 original questionnaire items (TE1–TE9 and EM1–EM9) using polychoric correlations, given the ordinal nature of the responses. This analysis was included to examine whether the covariance pattern among the items showed an internal organization consistent with the theoretical constructs of emerging technologies and employability. Figure 1 presents the parallel analysis, in which the observed eigenvalues exceeded the simulated ones in the first components. This pattern suggested that a strictly unidimensional representation was not the most adequate descriptive solution and supported the exploratory examination of multifactorial structures.
Figure 1.
Parallel analysis based on polychoric correlations.
Based on this result, two main solutions were examined: a two-factor solution, useful for identifying a broad differentiation between domains, and a six-factor solution, aimed at capturing a more specific structure closer to the theoretical organization of the questionnaire. In addition, a two-factor sensitivity solution excluding EM8 was also estimated because redundancy was detected during the internal diagnostic assessment of the instrument. Descriptively, the six-factor solution showed greater structural specificity and lower average residual error, whereas the two-factor solution provided a more aggregated representation. However, these results should be interpreted as exploratory evidence of internal organization rather than as confirmatory validation. Table 2 summarizes the most relevant comparative indicators.
Table 2.
Exploratory comparison of factorial solutions for the instrument.
From a descriptive standpoint, these results indicate that the instrument shows an empirically detectable internal structure. However, this evidence should be interpreted cautiously and at an exploratory level. In particular, the improvement observed in the six-factor solution does not imply definitive confirmatory validation, but rather suggests that the items do not cluster randomly and that a substantial part of their covariation can be represented in relatively distinguishable dimensions. Accordingly, the two-factor solution was useful for ruling out unidimensionality, whereas the six-factor solution allowed a more refined reading of the questionnaire’s internal complexity.
4.2. Exploratory Factorial Solutions and Empirical Representation of the Items
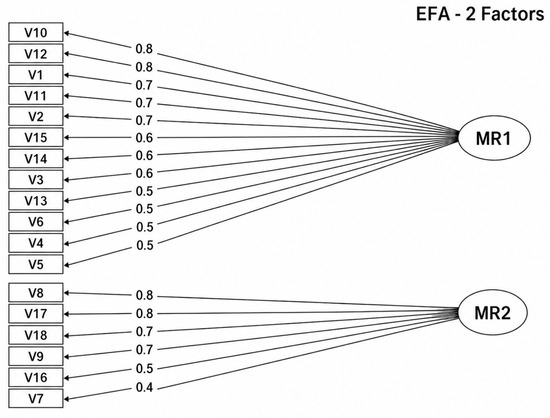
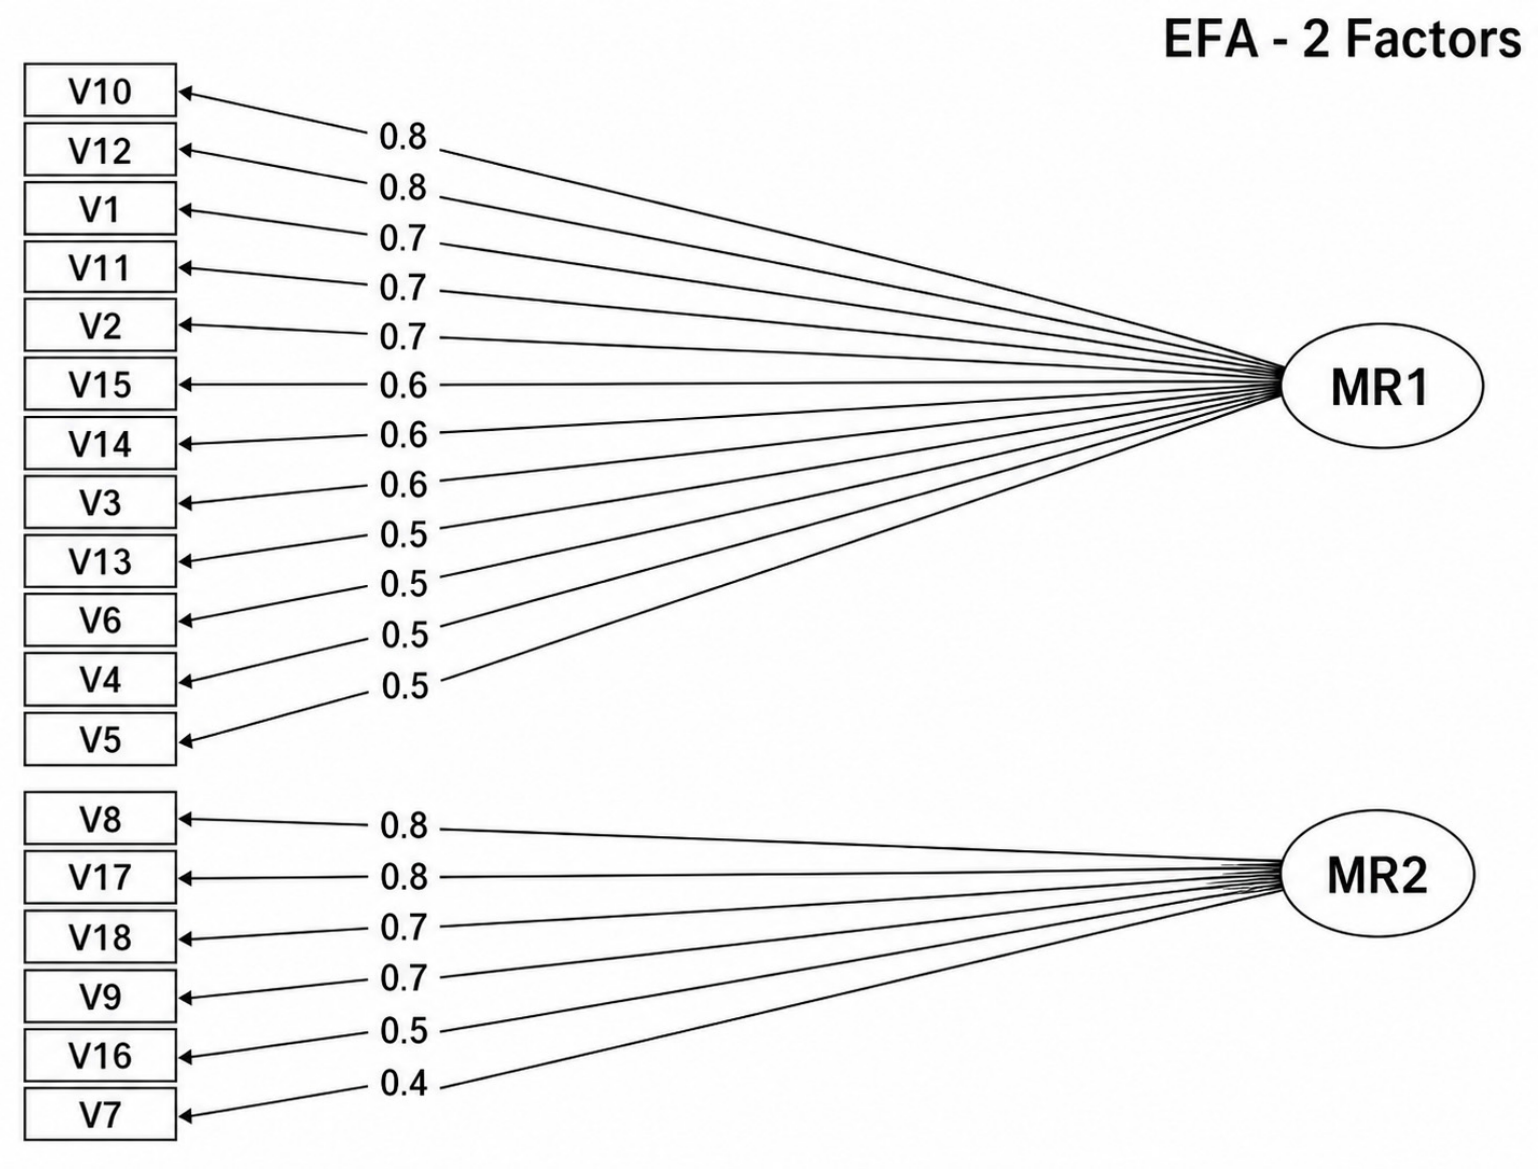
Figure 2 presents the two-factor solution. This configuration revealed a broad structure in which several emerging technologies and employability items converged into general blocks. Although this solution made it possible to identify a basic differentiation between item groupings, its level of aggregation remained high. From a substantive perspective, this organization suggests that part of the instrument content shares a common zone associated with updating, adaptation, practical use, and innovation, which limits the ability of the two-factor solution to represent the full conceptual complexity of the questionnaire precisely.
Figure 2.
Exploratory two-factor solution for the original instrument. The figure provides a broad descriptive representation of item grouping and should not be interpreted as confirmatory evidence of a definitive latent structure. EFA = exploratory factor analysis.
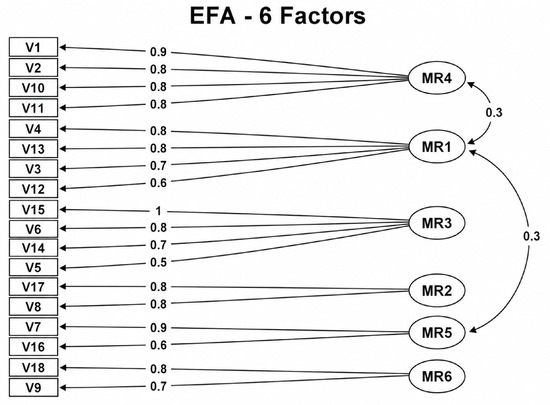
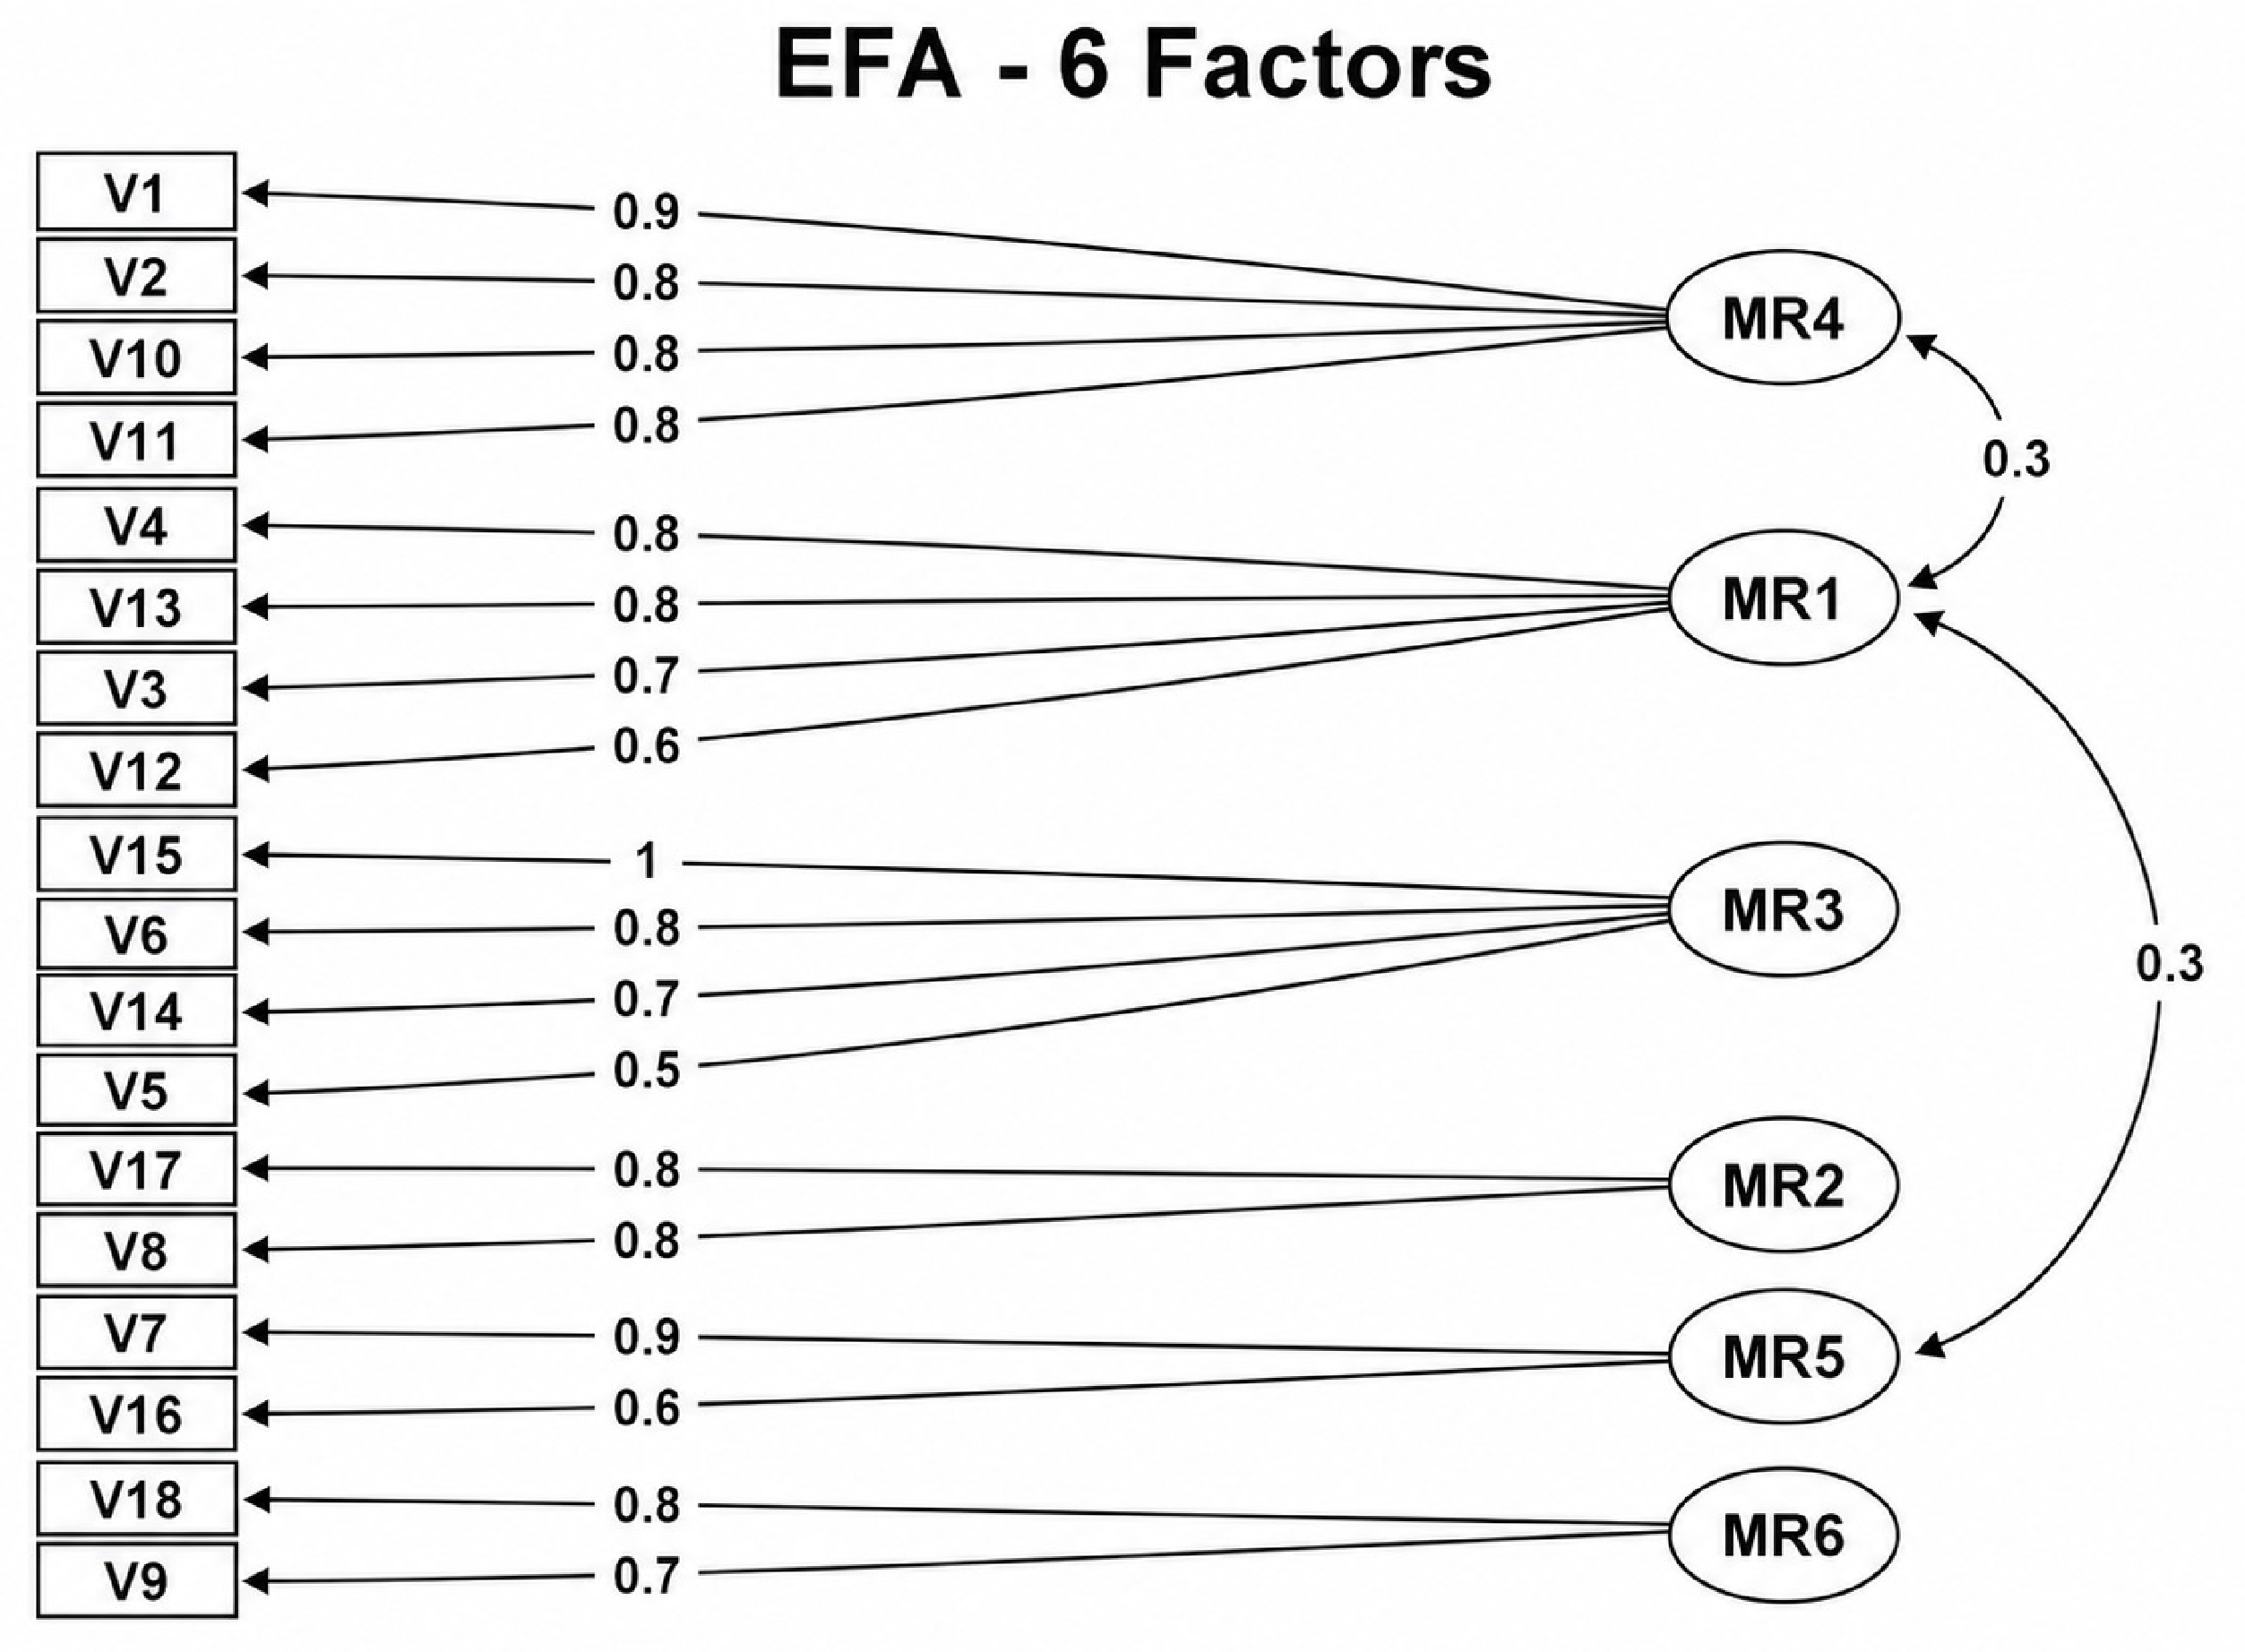
To obtain a representation more closely aligned with the original conceptual logic, the six-factor solution shown in Figure 3 was also examined. This structure offered a more specific item distribution and a clearer separation of empirical groups, although some factors still retained proximity between homologous item pairs from both domains. To avoid overinterpretation, the factors are retained here using their empirical notation (MR1–MR6) rather than being treated as confirmed dimensions. Even so, the solution was methodologically informative because it showed that most items reached high primary loadings and satisfactory communalities. Table 3 presents the dominant loading and communality of each item in the six-factor solution.
Figure 3.
Exploratory six-factor solution for the original instrument. Factors are retained using empirical labels to avoid overinterpretation of the preliminary structure.
Table 3.
Dominant loading and communality of items in the exploratory six-factor solution.
Taken together, these solutions suggest a non-trivial internal organization of the instrument and provide a preliminary basis for describing the subsequent relational findings. The two-factor solution confirmed that the questionnaire cannot be reduced to a single dimension, whereas the six-factor solution offered a more specific representation with globally higher communalities. Within this logic, the EFA is not presented as conclusive validation, but as preliminary evidence of internal coherence that supports the instrument’s analytical relevance.
4.3. Ordinal Correlational Structure and Redundancy Control
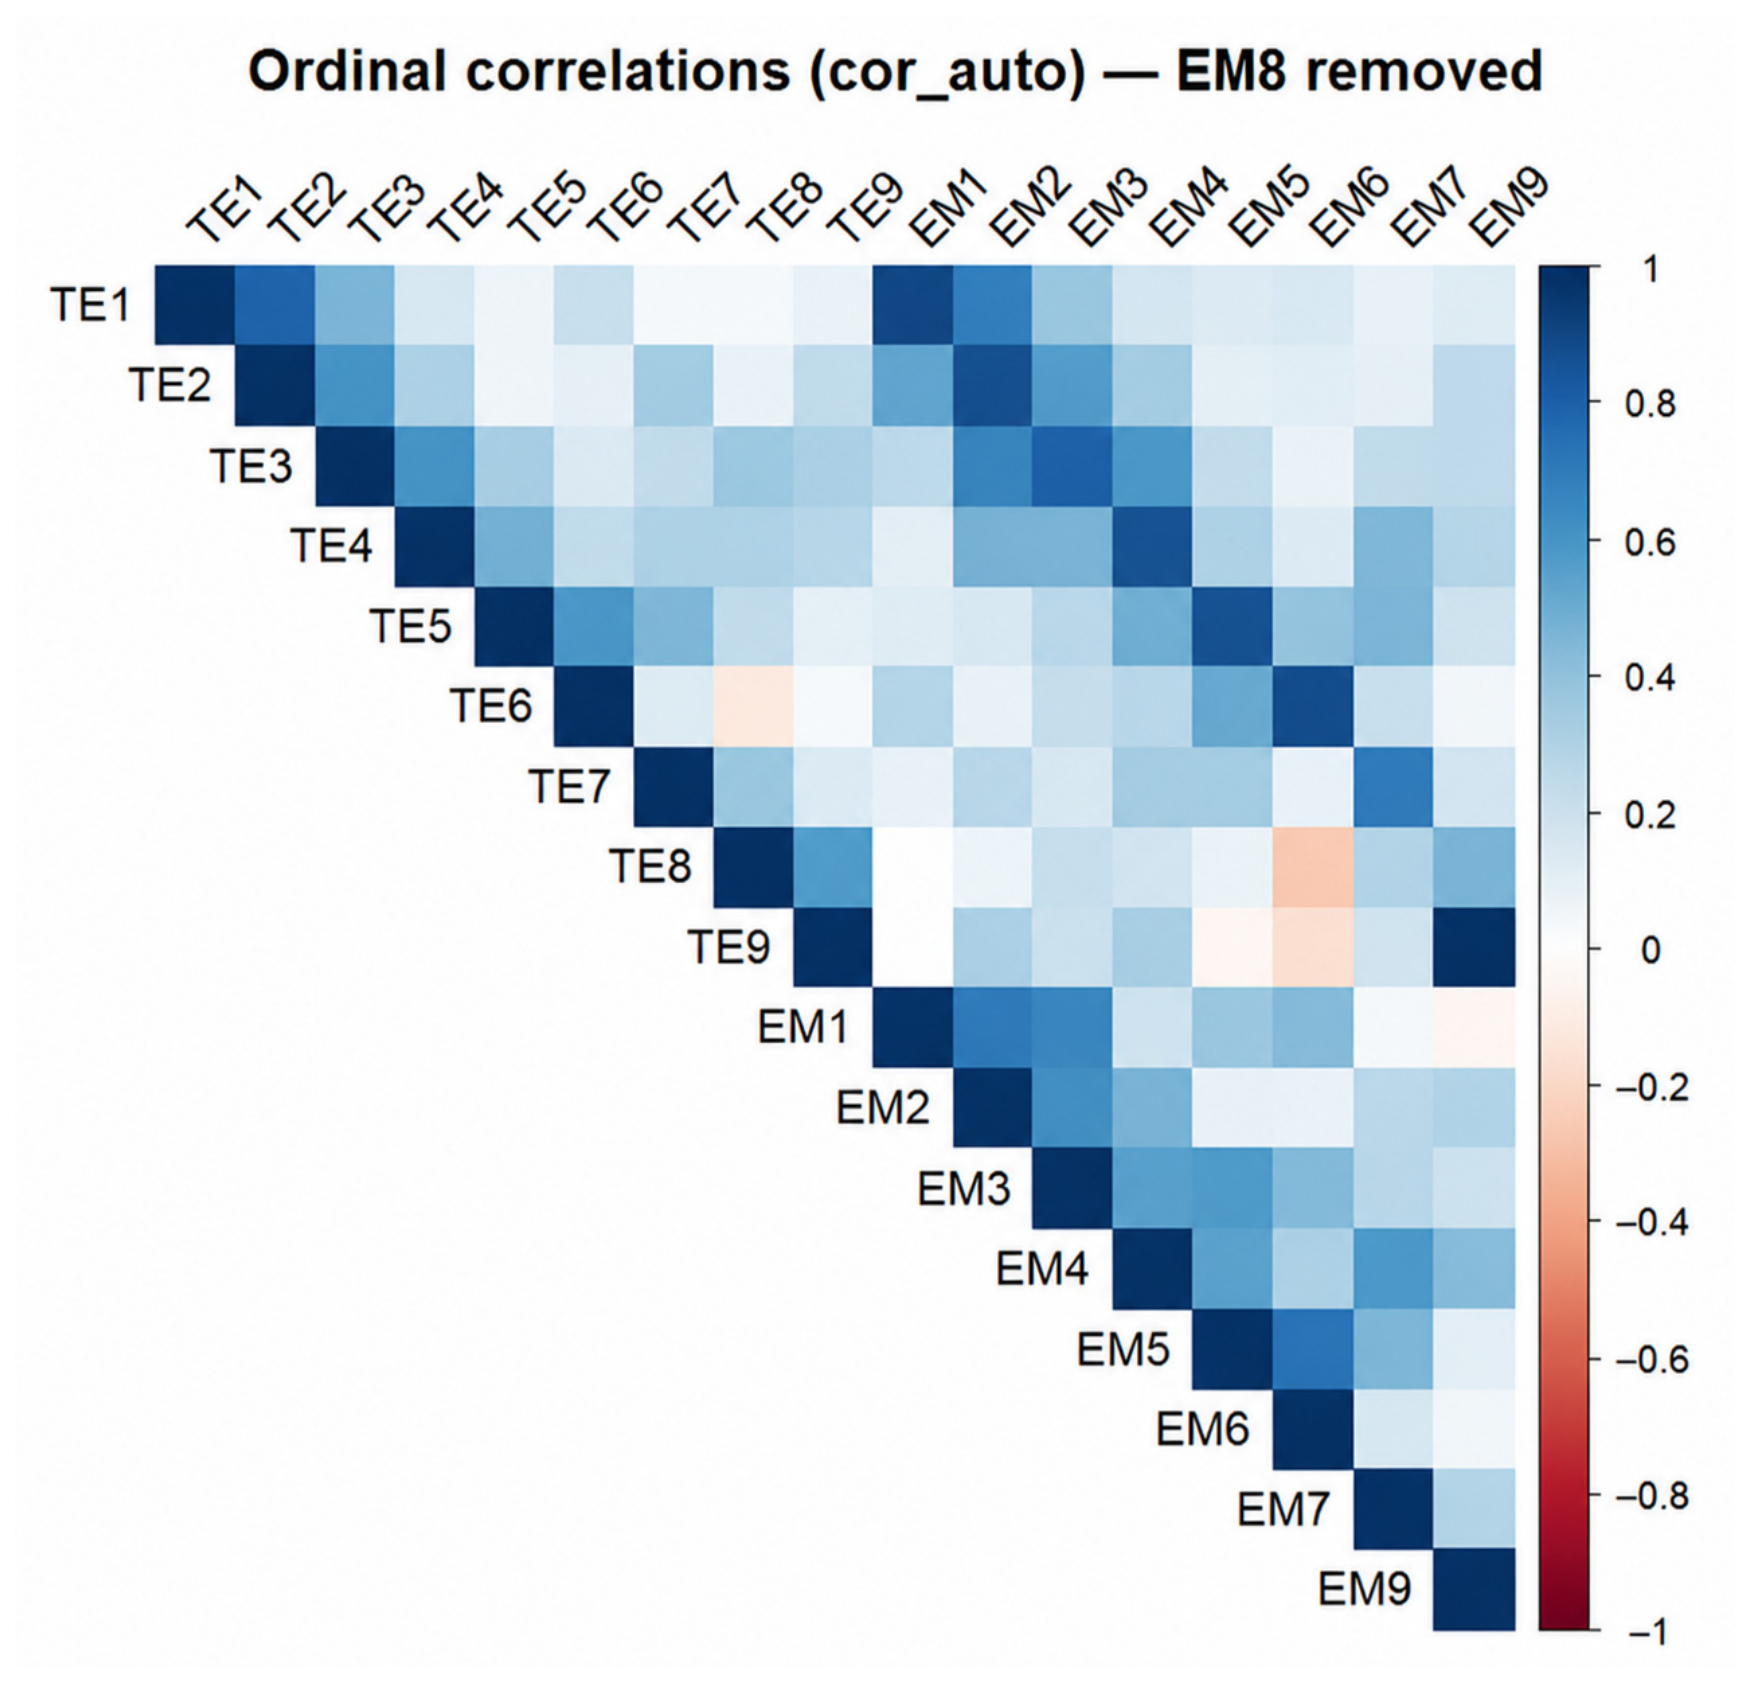
The pattern of bivariate associations, estimated through ordinal correlations, showed a block structure consistent with the theoretical organization of the questionnaire: the TE items displayed positive internal associations and, similarly, the EM items maintained intradomain coherence. In addition, a block of TE–EM associations was observed, indicating bivariate relationships between technology-related and employability-related indicators before the estimation of the regularized network. The interpretation was based on the use of polychoric/ordinal correlations, which are appropriate when the indicators are ordered categorical variables.
A critical quality-control finding was the identification of extreme redundancy between EM8 and TE8 (correlation ≈ 0.999), a situation that can artificially inflate associations, impair empirical discrimination between indicators, and generate numerical instabilities in estimates based on correlation matrices (non-positive definite matrices). For this reason, EM8 was removed from the analysis in order to preserve interpretability, reduce collinearity, and stabilize network estimation. Subsequently, as part of model quality assurance, the resulting ordinal correlation matrix initially showed signs of non-positive definiteness; therefore, it was projected into the space of valid matrices through a “nearest correlation matrix” procedure (approximation to the closest positive definite matrix). This step is standard when mathematical feasibility must be ensured for regularization algorithms applied to correlation matrices.
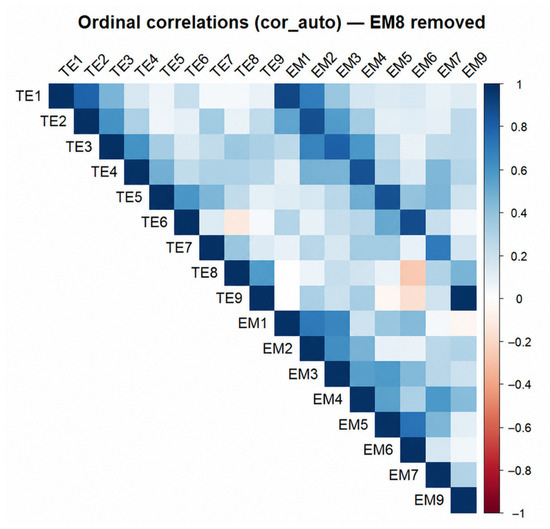
Figure 4 visually synthesizes the ordinal correlational structure after data cleaning, showing the block pattern of associations and the disappearance of the extreme duplication artifact associated with EM8. These results justified moving to conditional dependency modeling (psychometric network) rather than relying solely on bivariate correlations.
Figure 4.
Ordinal correlation matrix after data cleaning and redundancy control. The figure displays the bivariate association structure among the retained TE and EM indicators before regularized network estimation.
4.4. Regularized Psychometric Network and Global Connection Pattern
With the ordinal base stabilized, a psychometric network of regularized partial correlations was estimated using EBICglasso, an approach widely used to obtain interpretable and parsimonious networks from psychological and attitudinal data by statistically controlling for the effect of the remaining variables on each edge.
The final network consisted of 17 nodes (9 TE and 8 EM; EM8 removed) and 89 nonzero edges after regularization. The network showed moderate-to-high density (0.654), with a mean absolute edge weight of 0.261. A remarkable structural feature was the predominance of cross-domain connections: 45 edges (50.6%) directly connected TE and EM nodes, exceeding the total number of links within each separate domain (TE ↔ TE: 26; EM ↔ EM: 18). This pattern indicates that, in the estimated network, cross-domain TE–EM associations were more frequent than within-domain associations; these details are presented in Table 4.
Table 4.
Quantitative summary of the estimated psychometric network.
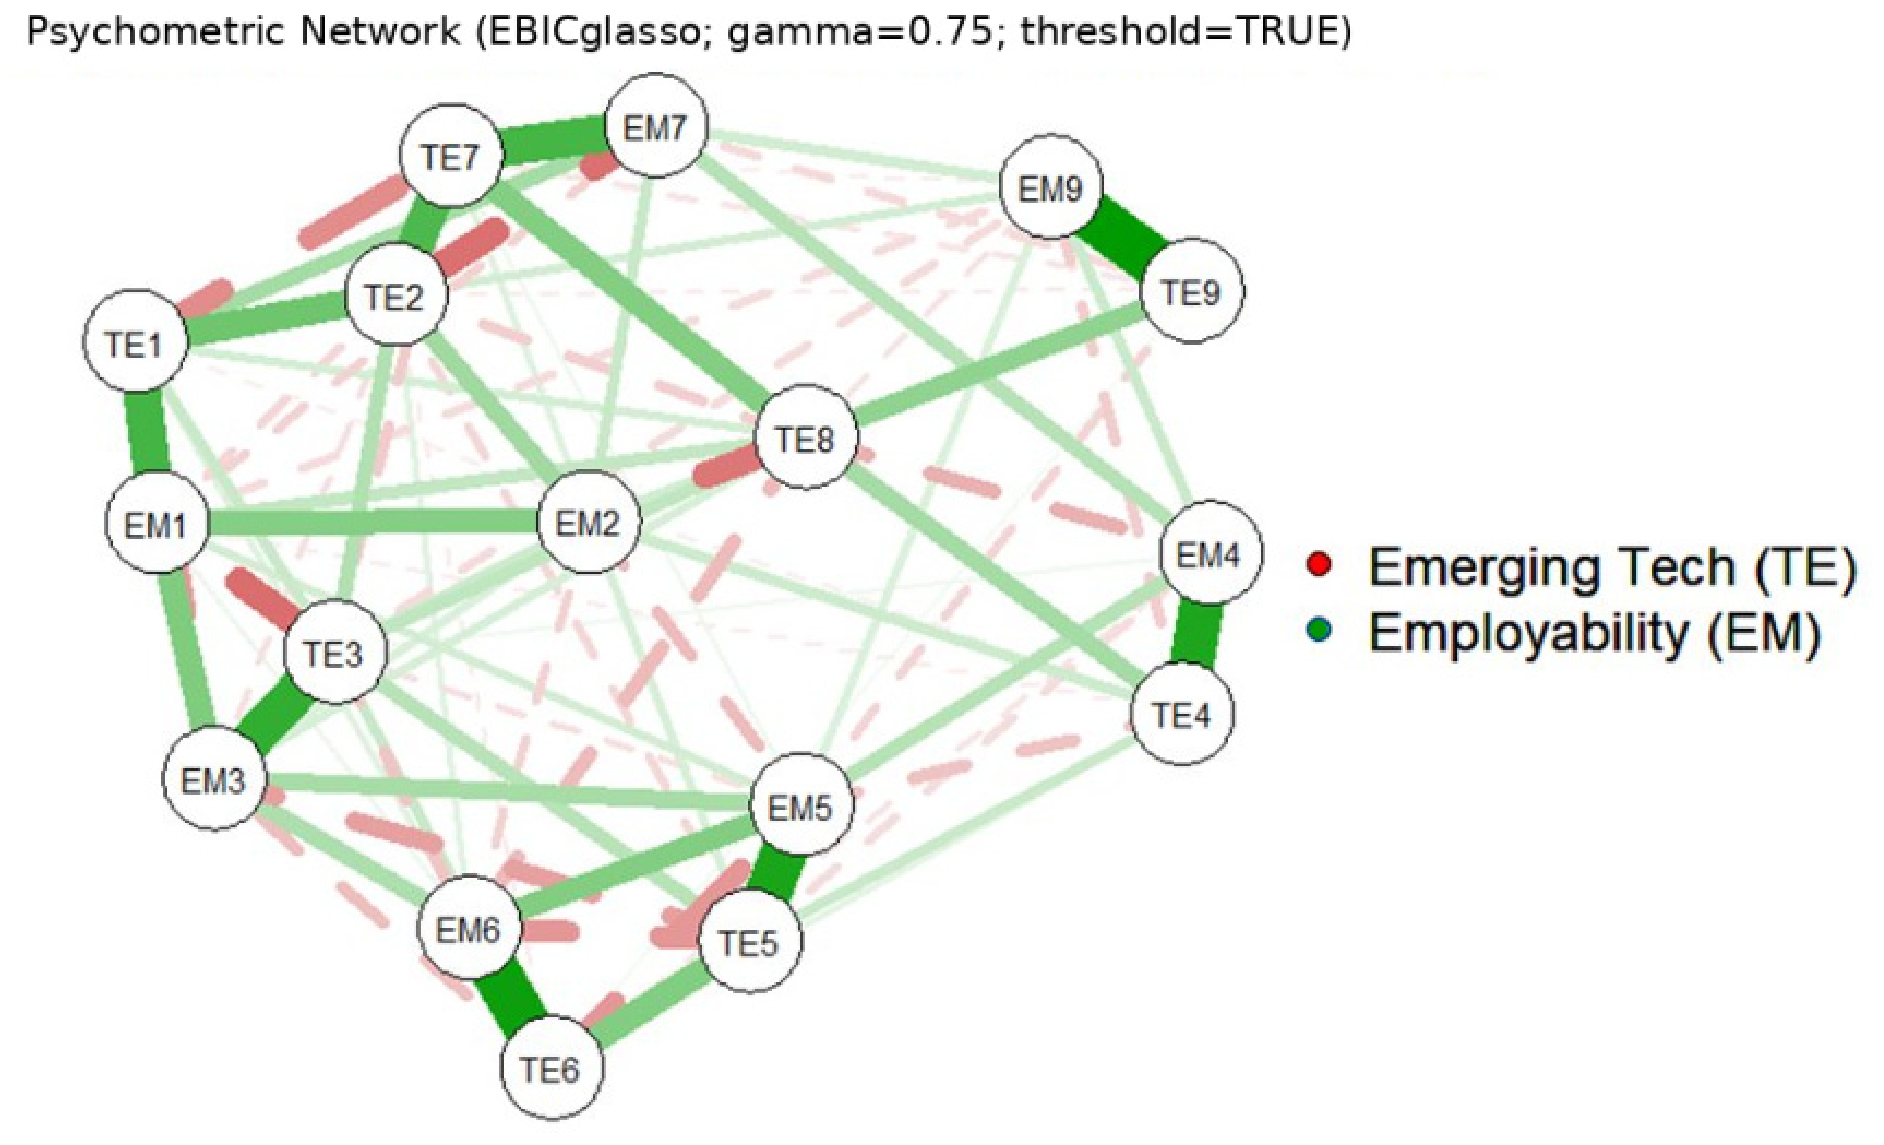
Edge analysis revealed a particularly strong and conceptually informative “skeleton” of connections: the strongest TE–EM edges corresponded to numerically homologous pairs (TE9–EM9, TE6–EM6, TE5–EM5). Descriptively, these links indicate that the strongest conditional associations were concentrated in specific TE–EM item pairs after controlling for the remaining indicators.
At the same time, the network displayed a relevant set of negative edges, especially in the TE ↔ EM block, indicating conditional “trade-off” relationships or statistical suppression effects: when other items are held constant, an increase in one indicator may be associated with a relative decrease in another. This pattern is expected in partial-correlation networks when overlapping variables exist or when several nodes compete to explain shared variance.
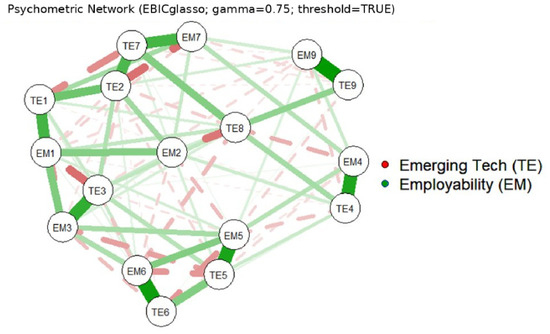
Figure 5 shows the network in a conservative visualization format (greater specificity), where it can be seen that the thickest connections are concentrated in high-intensity TE–EM links, in addition to internal TE ↔ TE and EM ↔ EM substructures. Consistent with Table 4, the TE ↔ EM cross-domain links were not only frequent but also, on average, more intense than the within-domain links. The specificity details are shown in Table 5.
Figure 5.
Regularized psychometric network estimated using ordinal correlations and EBICglasso. Nodes represent TE and EM indicators, edges represent regularized partial correlations, and edge thickness reflects the magnitude of the conditional association.
Table 5.
Most relevant TE ↔ EM edges (top positive and top negative by weight).
These results show two descriptive patterns: (i) strong positive conditional associations between comparable TE–EM pairs, and (ii) negative conditional associations between specific variables after controlling for the remaining nodes. The substantive interpretation of these patterns is addressed in the Section 5.
4.5. Centrality Estimates and Relative Position of the Indicators
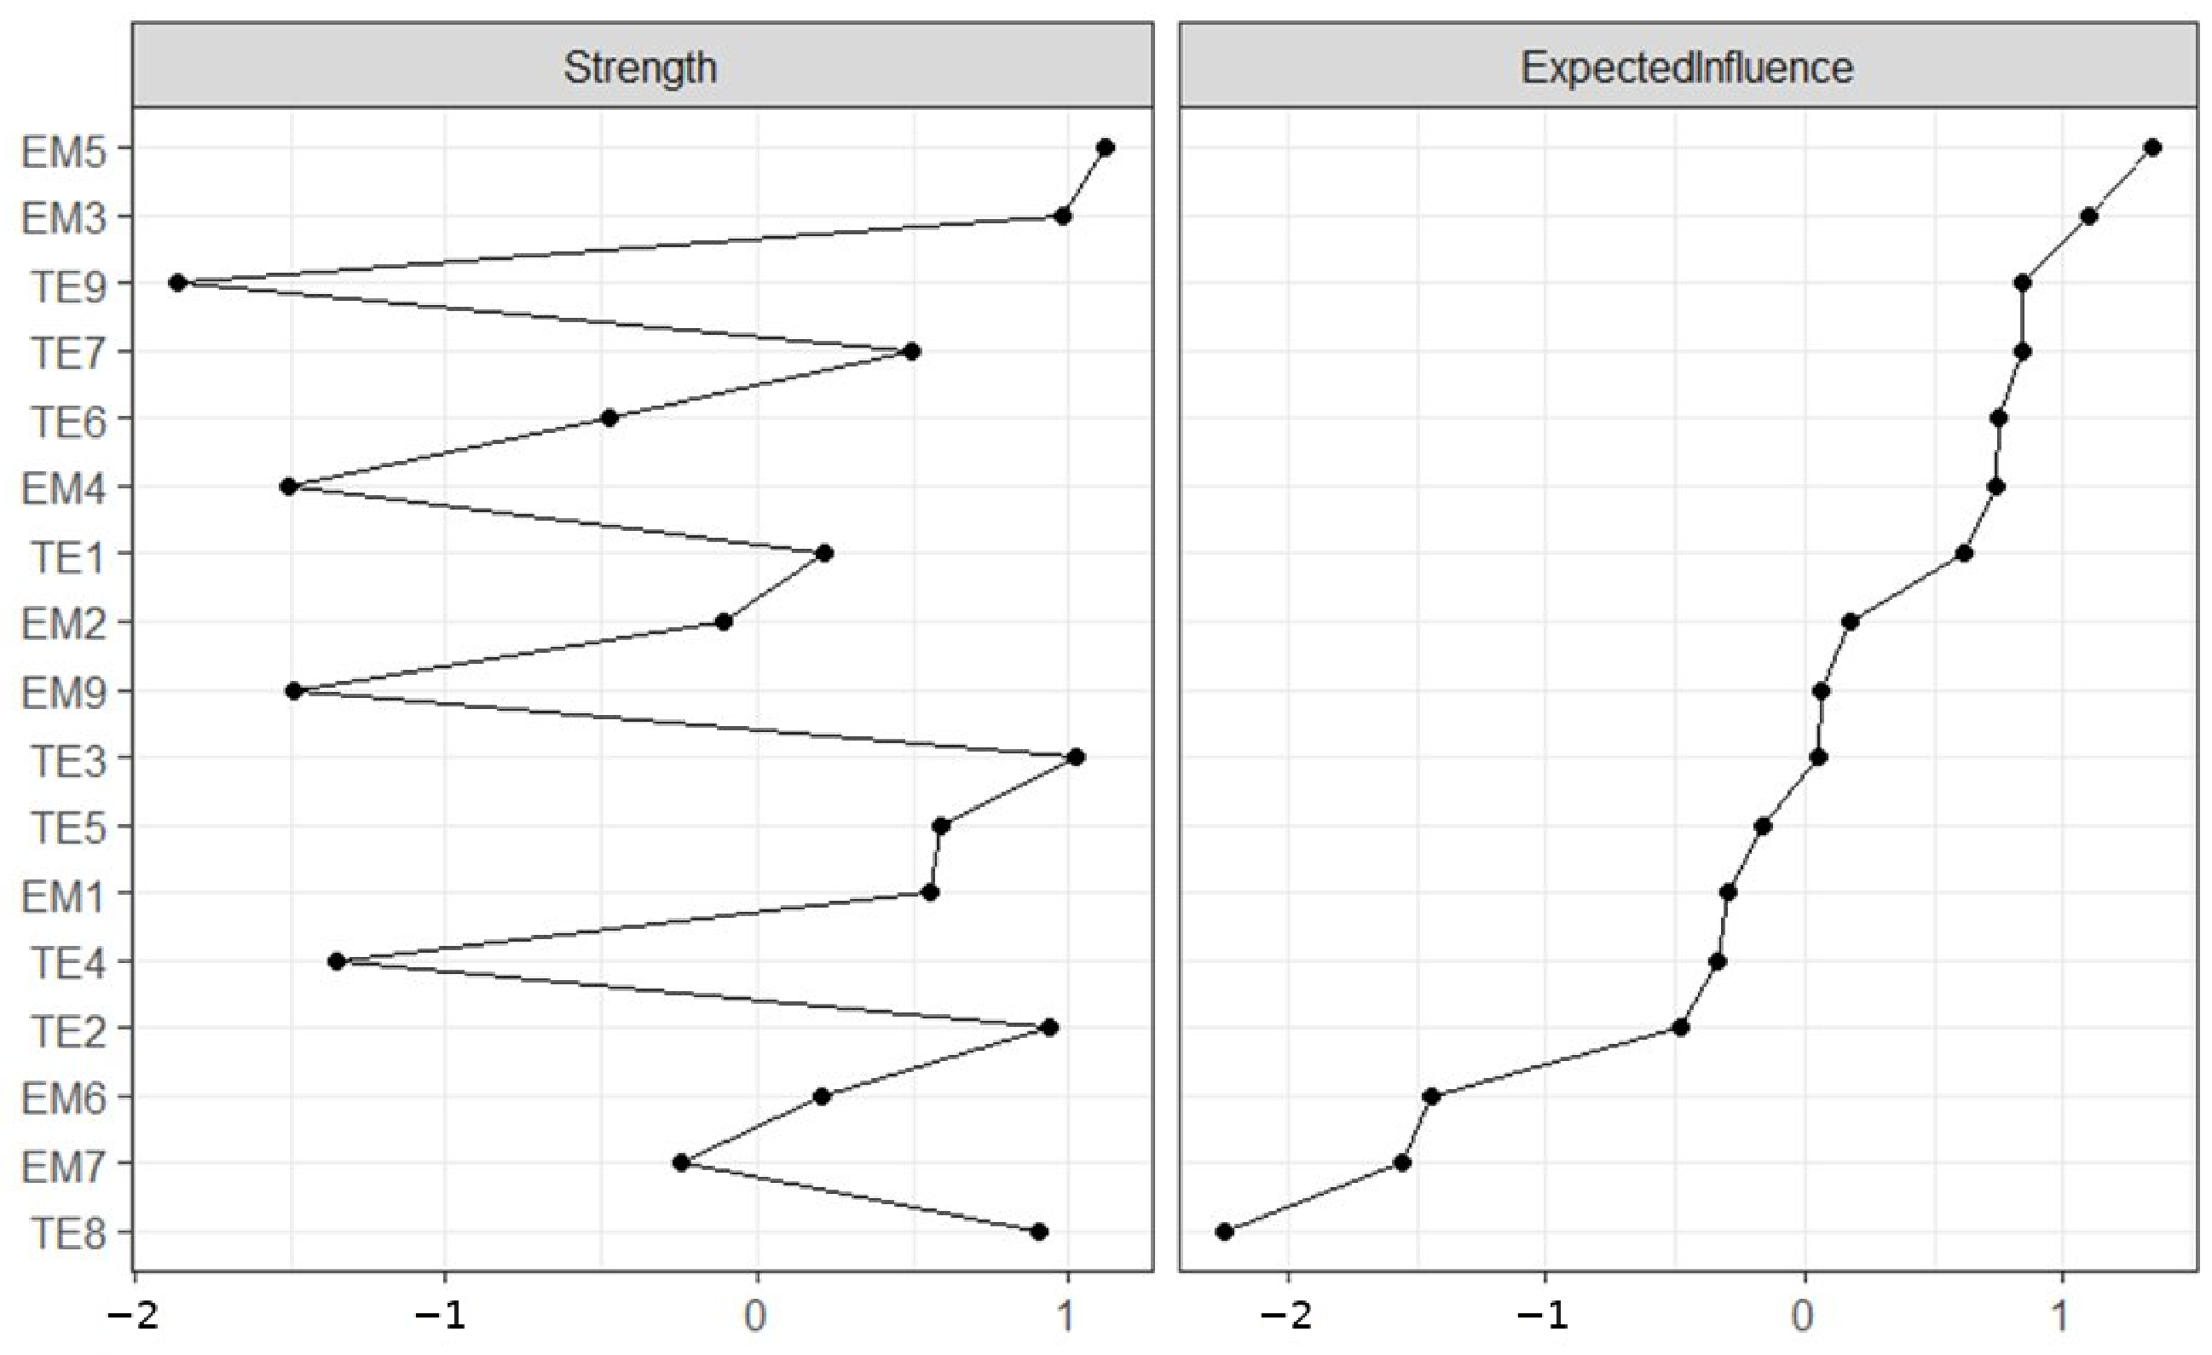
Centrality measures were estimated to describe the relative position and connectivity of each node within the exploratory network structure. Because the model includes both positive and negative edges, Expected Influence (EI) was prioritized as the main metric, since it preserves the sign of the connections and therefore better represents the net impact of a node on its neighborhood. In contrast, Strength summarizes the level of connectivity in magnitude, usually based on absolute values, and may therefore obscure whether a node concentrates inhibitory (negative) or facilitating (positive) ties. To facilitate visual comparison among nodes, the figure presents standardized centralities (z-scores); in that context, negative values indicate lower-than-average centrality in the network, not “negative influence.”
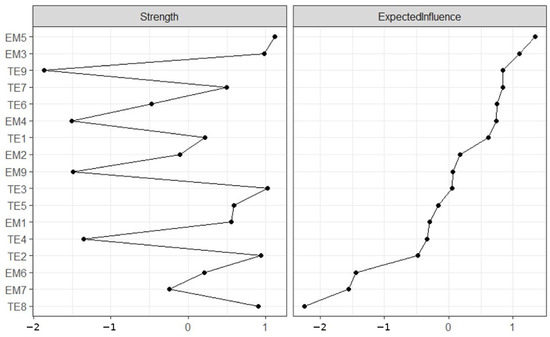
The results showed a polycentric pattern: the nodes with the highest EI were distributed across both domains (TE and EM), indicating that relatively central indicators appeared in both technology-related and employability-related blocks. In particular, EM5 records the greatest net influence (EI = 1.093) and high total connectivity (Strength = 3.268), indicating that it was one of the most connected and positively weighted nodes in the estimated network. It is followed by TE7 (EI = 1.068) and TE9 (EI = 1.059), which suggests that these technology-related indicators occupied relatively influential positions in the estimated network, without implying causal propagation (See Figure 6).
Figure 6.
Standardized centrality values for Strength and Expected Influence. Values are presented as z-scores for descriptive comparison across nodes; higher values indicate relatively greater connectivity within the estimated exploratory network.
The comparison between EI, Strength, and degree adds relevant nuances. For example, TE9 combines high EI with moderate Strength and a lower degree (8) compared to nodes like EM5 or TE7 (12). This configuration is best interpreted as relatively more focused connectivity, where the balance between positive and negative edges (4 and 4) does not preclude a high EI because, in terms of weights, positive connections could dominate in magnitude over negative ones (or concentrate in particularly influential relationships). Similarly, TE7 exhibits high degree and a symmetrical sign balance (6 and 6), which implies that its high EI does not depend on the number of links, but rather on how positive weights compensate for (or outweigh) negative ones (See Table 6).
Table 6.
Top 10 nodes by Expected Influence (with degree and sign balance).
The centrality structure suggests that the network is not organized around a single dominant node, but rather around a distributed core where TE and EM nodes coexist with a high capacity for articulation. This interpretation should be kept descriptive: in transversal networks, centrality identifies points of coupling within the system, but does not establish causality.
4.6. Bridge Centrality Estimates and Modular Organization of the TE–EM Network
To describe cross-domain connectivity between the predefined TE and EM communities, bridge expected influence was estimated as the signed sum of each node’s edges toward the opposite domain.
The results showed that TE9 (Bridge EI = 0.785) and TE7 (Bridge EI = 0.660) had the highest positive bridge expected influence values among technology-related nodes. On the employability side, EM2 (Bridge EI = 0.620) and EM9 (Bridge EI = 0.597) showed the highest bridging contributions toward the technology domain. In contrast, TE8 exhibited a markedly negative bridging influence (Bridge EI = −0.746), indicating that, when controlling for the entire network, TE8 is associated with net decreases in connected employability nodes, especially due to large negative edges (TE8–EM2 = −0.483; TE8–EM4 = −0.282; TE8–EM6 = −0.243). This pattern should be interpreted cautiously because TE8 was located in a measurement-sensitive area of the instrument, particularly after the redundancy detected between TE8 and EM8. Its high strength combined with a lower EI suggests mixed-sign connectivity rather than a uniformly positive bridge role (See Table 7).
Table 7.
Nodes with greater and lesser influence of the TE ↔ EM bridge (EI Bridge).
Additionally, the network showed a modular organization that grouped TE and EM items into mixed empirical clusters. A modular partitioning based on maximizing modularity identified four modules, each dominated by a high-magnitude TE-EM edge, suggesting that the TE-EM coupling is not randomly distributed but organized into thematic clusters (See Table 8).
Table 8.
TE-EM functional modules and dominant edge in each module.
Descriptively, the empirical results showed three main patterns: (i) the estimated TE–EM network was dense and structured, (ii) the strongest links were concentrated in homologous TE–EM pairs, and (iii) centrality and bridge estimates were distributed across both technology-related and employability-related indicators. The substantive interpretation of these patterns is developed in the Section 5.
5. Discussion
The present findings suggest preliminary conditional associations between emerging technology indicators and employability indicators among people with visual disabilities. The estimated network showed a dense structure with a predominance of cross-domain TE–EM associations, indicating that technology-related experiences, practical capacities, training, autonomy, and innovation-related perceptions were statistically connected within the same exploratory structure. This pattern is consistent with previous studies showing that digital skills, professional capital, and technology-related self-efficacy are relevant to employability formation [11,12,17]. However, the present findings should not be interpreted as evidence that technology directly improves employability. Rather, they suggest that technology-related and employability-related indicators may be interconnected in ways that require further psychometric, longitudinal, and contextual validation.
A central issue in interpreting the network concerns the strong associations between functionally homologous TE–EM item pairs. The strongest cross-domain edges were concentrated in pairs such as TE4–EM4, TE5–EM5, TE6–EM6, and TE9–EM9. On the one hand, this pattern is conceptually coherent because items referring to the practical use of technology, technological usefulness, adaptation to real needs, and perceived technological advances were closely connected with items referring to competitive skills, work adaptation, support for job skills, and motivation to innovate using technological tools. On the other hand, this result must be interpreted cautiously because these associations may also reflect semantic proximity or item-wording parallelism. In other words, the network may be capturing not only substantive relationships between emerging technologies and employability, but also measurement-design effects derived from similarly worded items. Therefore, the strongest TE–EM edges should be understood as preliminary evidence of conceptual convergence and possible item-level overlap, rather than as definitive evidence of underlying mechanisms.
The relationship between technological innovation, autonomy, and employability-related knowledge also requires a nuanced interpretation. Positive conditional associations such as TE1–EM1 and TE3–EM3 suggest that access to adapted technologies and perceived technological autonomy were connected with employability-related knowledge and adapted technical training. Nevertheless, the negative edge between TE3 and EM1 indicates that, once the rest of the network was controlled for, perceived autonomy derived from technology did not necessarily coincide with feeling professionally updated to access job opportunities. This finding may reflect a partial decoupling between everyday technological autonomy and labor-market knowledge capital. A person may perceive that technology improves personal autonomy without necessarily having access to formal training, accreditation, professional updating, or job-placement opportunities. This interpretation is compatible with a structural view of disability, in which employability is not reduced to individual ability, but is shaped by educational access, organizational conditions, assistive support, and broader opportunity structures [22,30].
The practical-use block of the network further supports the idea that technology and employability should not be interpreted as isolated domains. The strongest positive associations involving TE4–TE6 and EM4–EM6 suggest that the use of technological tools in work or educational environments, their usefulness in daily activities, and their adaptation to real needs were closely connected with practical employability skills. This is compatible with prior evidence indicating that assistive technology training and accessible technological environments may support participation, autonomy, and future labor integration when they are embedded in inclusive conditions [9,24]. However, the coexistence of negative edges such as TE6–EM5 and TE5–EM6 suggests that this relationship is not linear. These negative conditional associations may indicate that different profiles of participants experience technology, skills, and support in different ways. For some participants, useful technology may be more closely associated with autonomous adaptation skills, whereas for others, institutional or external support may be more relevant for translating technology into employability-related capacity. Since the study is cross-sectional, these patterns should be interpreted as conditional associations, not as causal routes.
The centrality results also require careful interpretation. EM5, TE7, and TE9 showed relatively high expected influence values, suggesting that adaptive work skills, constant access to affordable technological updates, and the perception of technological advances benefiting people with visual disabilities occupied comparatively central positions within the estimated exploratory network. This does not imply that these nodes are causal drivers of employability. Instead, it indicates that they were strongly and positively connected with other indicators in the estimated network. From a theoretical perspective, this result is relevant because adaptability, technological updating, and perceived accessible innovation are dimensions frequently associated with employability in digital and inclusive labor contexts. However, they should be considered candidate indicators for future research rather than direct intervention targets.
The Bridge Expected Influence analysis adds another important layer to the interpretation. TE9 and TE7 showed the highest positive bridge expected influence values among technology-related nodes, whereas EM2 and EM9 showed relevant bridging values from the employability domain. This pattern suggests that, within the estimated network, the connection between emerging technologies and employability was not limited to a one-way association from technological access to labor outcomes. Rather, employability-related dispositions, such as continuous training and motivation to innovate using technological tools, were also statistically connected with technology-related indicators. This reading is coherent with socio-technical and technological-congruence perspectives, according to which the value of technology depends on its fit with users’ needs, task demands, learning processes, and the capacity to mobilize it as a functional resource [5,8,11,17].
The negative bridge pattern observed for TE8 deserves particular attention. TE8, referring to frequent training in new technologies, showed high strength but lower expected influence and a negative bridge expected influence. This does not mean that technological training is ineffective. A more cautious interpretation is that TE8 may represent a measurement-sensitive and substantively ambivalent area of the instrument. Training in new technologies may not always translate directly into employability-related gains, especially if such training is not connected with disciplinary knowledge, formal certification, job placement, or real work opportunities. Previous research has shown that awareness or availability of assistive technologies does not necessarily lead to sustained use, and that digital credentials or training experiences may expand without a uniform labor value across contexts [7,26]. Therefore, TE8 may reflect a possible misalignment between training exposure and employability-related integration within the estimated network.
This interpretation is reinforced by the redundancy detected between EM8 and TE8. EM8, which referred to the ability to propose innovative ideas in a work environment, was almost indistinguishable from TE8, which referred to frequent training in new technologies. This finding has direct implications for discriminant validity. Conceptually, it suggests that, in this sample, innovation may have been interpreted less as independent creative agency or workplace ideation and more as a consequence of technological training. Methodologically, this overlap could inflate internal consistency and artificially strengthen network connectivity without necessarily improving measurement quality. Future versions of the instrument should therefore re-specify EM8 toward more observable behaviors of workplace innovation, such as process improvement, creative problem-solving, implementation of new ideas, or participation in innovation-oriented tasks, while retaining EM9 as the item most directly aligned with motivation to innovate through technological tools.
The modularity analysis further suggests that the estimated TE–EM associations were organized into mixed empirical clusters rather than into a single homogeneous structure. These modules combined indicators of technological updating, practical technology use, adapted support, autonomy, skills, and innovation-related motivation. This pattern is compatible with socio-technical interpretations of work, which emphasize that technological transformation becomes meaningful only when accompanied by organizational adaptation, support structures, training, and competency development [4,36]. It is also consistent with the literature on digital skills and employability, which highlights that labor integration depends on articulated combinations of training, capability development, and contextual support rather than on isolated competencies [12,15].
Several limitations should guide the interpretation of these findings. First, the cross-sectional design prevents any causal interpretation of the estimated edges, centrality values, or bridge indicators. Second, the instrument is still in an exploratory stage; therefore, the EFA and network analysis should be understood as preliminary evidence of internal organization and conditional association, not as full psychometric validation. Although the instrument underwent institutional expert validation and was classified as satisfactory, the available validation records reported global expert-assessment scores rather than item-level ratings; therefore, Aiken’s V or the Content Validity Index could not be calculated in the present study. Third, the sample size, although adequate for an exploratory study with the accessible population, limits the stability and generalizability of the network structure. Fourth, the presence of homologous item pairs and the redundancy between EM8 and TE8 indicate that part of the network structure may be influenced by item wording and measurement design. Consequently, central and bridge nodes should be interpreted as descriptive indicators within the estimated network and not as definitive mechanisms or direct intervention targets.
Taken together, the findings support an exploratory socio-technical and inclusion-oriented interpretation of employability among people with visual disabilities. The results suggest that labor inclusion may be associated not only with the availability of technological tools, but also with how those tools relate to training processes, adaptive skill formation, motivational dynamics, accessibility conditions, and enabling environments. However, these interpretations remain preliminary. The present study should therefore be read as an initial analytical contribution that identifies promising patterns of association, while future research should refine the instrument, test its confirmatory psychometric structure, examine the stability of the network in larger samples, and explore longitudinal designs capable of evaluating temporal or causal relations.
6. Conclusions
This study provides preliminary evidence on the conditional associations between emerging technology indicators and employability indicators among people with visual disabilities in a city in northern Peru. At the regional level, it offers one of the first exploratory empirical models in northern Peru, and one of the few in Latin America, focused on the relationship between emerging technologies and employability in this population. The estimated psychometric network showed a dense structure with several cross-domain TE–EM associations, suggesting that technology-related experiences, adaptive skills, training, and innovation-related perceptions were statistically interconnected within the exploratory model. EM5, TE7, and TE9 showed relatively high expected influence values, while TE9, TE7, EM2, and EM9 showed relevant bridge expected influence values between the predefined TE and EM domains.
These findings support the idea that emerging technologies may constitute a meaningful, although not exclusive, factor associated with employability-related perceptions among people with visual disabilities. However, they should be interpreted cautiously. The cross-sectional design does not allow causal conclusions, and the centrality or bridge position of a node should not be understood as evidence of causal priority or as a direct intervention target. In addition, the instrument remains at an exploratory stage and requires further psychometric validation in larger and more diverse samples. Therefore, the contribution of this study lies in identifying preliminary patterns of association that may guide future confirmatory, longitudinal, and intervention-oriented research on technology, accessibility, and employability among people with visual disabilities.
Author Contributions
Conceptualization, J.A.V.-C., E.S.B.-P., G.A.V.-S., I.B.P.-G. and A.F.H.-S.; methodology, E.S.B.-P. and A.F.H.-S.; software, A.F.H.-S.; validation, G.A.V.-S.; formal analysis, F.V.L.-V.; investigation, J.A.V.-C., E.S.B.-P. and A.F.H.-S.; resources, I.B.P.-G.; data curation, F.V.L.-V.; writing—original draft preparation, E.S.B.-P.; writing—review and editing, J.A.V.-C., E.S.B.-P. and A.F.H.-S.; visualization, E.S.B.-P. and A.F.H.-S.; supervision, J.A.V.-C.; project administration, J.A.V.-C.; funding acquisition, G.A.V.-S. All authors have read and agreed to the published version of the manuscript.
Funding
This research was funded by Universidad César Vallejo through the Fondo de Apoyo a la Investigación 2024, project code P-2024-108. The APC was funded by Universidad César Vallejo. The authors acknowledge the Research Center of the Chiclayo branch of Universidad César Vallejo for support with APC funding and fieldwork logistics.
Institutional Review Board Statement
The study was conducted in accordance with the Declaration of Helsinki and approved by the Research Ethics Committee of the School of Business Administration at César Vallejo University, Peru (revision code 2024-1-56, 1 April 2024).
Informed Consent Statement
Informed consent was obtained electronically from all subjects involved in the study through a mandatory consent question presented at the beginning of the questionnaire. Only participants who agreed to participate were allowed to continue with the survey.
Data Availability Statement
The data presented in this study are available upon reasonable request from the corresponding author. The data are not publicly available due to ethical and privacy restrictions related to research involving human participants from a vulnerable population.
Conflicts of Interest
The authors declare no conflicts of interest. The funders had no role in the design of the study; in the collection, analyses, or interpretation of data; in the writing of the manuscript; or in the decision to publish the results.
Disability Language/Terminology Positionality Statement
In this manuscript, we primarily use person-first language (e.g., “people with visual disabilities”) to emphasize the dignity and individuality of participants and to align our terminology with the inclusive and rights-based orientation of the study. This choice is consistent with the social model of disability adopted in our interpretation, in which disability is understood in relation to environmental, technological, and labor barriers rather than as an individual deficit. Where alternative expressions such as “visual impairment” appear, they are retained only when necessary for conceptual precision or to reflect the terminology used in cited sources. We recognize that language preferences may vary across communities and contexts, and our terminology is used respectfully and deliberately within the cultural, legal, and disciplinary framework of this study.
Abbreviations
The following abbreviations are used in this manuscript:
| AI | Artificial Intelligence |
| EBICglasso | Extended Bayesian Information Criterion Graphical Least Absolute Shrinkage and Selection Operator |
| EI | Expected Influence |
| EM | Employability |
| ET | Emerging Technologies |
| GLASSO | Graphical Least Absolute Shrinkage and Selection Operator |
| ICT | Information and Communication Technologies |
| MOOCs | Massive Open Online Courses |
| PLS-SEM | Partial Least Squares Structural Equation Modeling |
| SDG | Sustainable Development Goal |
| TE | Technology/Emerging Technologies |
| TE–EM | Technology–Employability Network |
References
- Palazzani, L. The future of work in the era of emerging technologies. Thought 2022, 78, 777–784. [Google Scholar] [CrossRef] [Scilit]
- Opesemowo, O.A.G.; Iwintolu, R.O.; Odeyemi, T.F.; Opesemowo, T.R. Exploration of employability skills among Osun State undergraduate students in the era of 4IR. Discov. Sustain. 2025, 6, 803. [Google Scholar] [CrossRef] [Scilit]
- Chang, K.; Cheng, K.T. The emerging technology in hiring: Insights from assembly line workers and managers. Adm. Sci. 2025, 15, 463. [Google Scholar] [CrossRef] [Scilit]
- Sundarrajan, P.; Krishnan, L.R.K. Emerging technologies and evolving work practices impacting employee engagement: Automobile industry. J. Soc. Environ. Manag. 2024, 18, e5835. [Google Scholar] [CrossRef] [Scilit]
- Yang, Y.; Yan, L.; Alshuaibi, M.S.I.; Chethiyar, S.D.M. Harnessing AI-supported work environments: Unveiling micro-psychological pathways to employ eco-initiative creative behavior. Acta Psychol. 2025, 261, 105869. [Google Scholar] [CrossRef] [Scilit] [PubMed]
- Norris, D.M.; Lefrere, P. Transformation through expeditionary change using online learning and competence-building technologies. ALT J. Res. Learn Technol. 2011, 19, 61–72. [Google Scholar] [CrossRef]
- Savita, K.S.; Isawasan, P.; Asmawi, M.A.H.A.; Shaheen, M.; Ghafoor, R. Emerging themes and research directions in MOOCs and micro-credentials. Int. J. Mod. Educ. Comput Sci. 2025, 17, 97–110. [Google Scholar] [CrossRef] [Scilit]
- Papazis, S.A.; Ioannides, M.G. Emerging energy engineering education on the way to employment. In Lecture Notes in Networks and Systems; Springer Science and Business Media Deutschland GmbH: Berlin/Heidelberg, Germany, 2022; Volume 456, pp. 655–677. [Google Scholar] [CrossRef] [Scilit]
- Adam, M.M.S.; Aljehane, N.O.; Alzahrani, M.Y.; Al Zanin, S. Leveraging assistive technology for visually impaired people through optimal deep transfer learning based object detection model. Sci. Rep. 2025, 15, 30113. [Google Scholar] [CrossRef] [Scilit] [PubMed]
- Asiri, M.M.; Alghamdi, K.; Alzahrani, F.; Sharif, M.M. An innovative multi-head attention mechanism-driven recurrent neural network model with feature representation fusion for enhanced image captioning to assist individuals with visual impairments. Sci. Rep. 2025, 15, 35845. [Google Scholar] [CrossRef] [Scilit] [PubMed]
- Coetzee, M. Students’ career capital resource needs for employability in the technology-driven work world. J. Teach. Learn Grad. Employab. 2023, 14, 136–150. [Google Scholar] [CrossRef] [Scilit]
- Kee, D.M.H.; Anwar, A.; Gwee, S.L.; Ijaz, M.F. Impact of acquisition of digital skills on perceived employability of youth: Mediating role of course quality. Information 2023, 14, 42. [Google Scholar] [CrossRef] [Scilit]
- Singh, U.; Tewari, V.; Das, S. Digital workforce competencies: A multidimensional scale for the 21st century. Acta Psychol. 2025, 261, 105883. [Google Scholar] [CrossRef] [Scilit] [PubMed]
- Qoku, M.; Spiro, L. Bridging law, business and technology: The role of industrial property in university curricula in Albania. Eur. J. Soc. Sci. Educ. Res. 2025, 12, 169–180. [Google Scholar] [CrossRef] [Scilit]
- Isa, M.U.; Kamin, Y.B.; Salihu, Y.I.; Shuaibu, H.; Cledumas, A.M. Enhancing employability skills of woodwork technology education students through project based learning at colleges of education (technical) in Nigeria. Univ. J. Educ. Res. 2020, 8, 31–40. [Google Scholar] [CrossRef] [Scilit]
- Yende, S.J.; Mugovhani, G. Employability challenges facing vocal art graduates in South Africa: A case study of Tshwane University of Technology. Muziki 2021, 18, 110–126. [Google Scholar] [CrossRef] [Scilit]
- Yu, J.; Alibakhshi, G. Modeling the relationships among physical education teachers’ technological pedagogical content knowledge, technological integration self-efficacy, employability, and the mediating role of job passion. Sci. Rep. 2025, 15, 25999. [Google Scholar] [CrossRef] [Scilit] [PubMed]
- Aggarwal, K.; Ravi, R.; Yerraguntla, K. Artificial intelligence and patient care: Perspectives of audiologists and speech-language pathologists. Intell. Based Med. 2025, 11, 100214. [Google Scholar] [CrossRef] [Scilit]
- Mercer, C.E.; Clarke, A.P. Entrepreneurial thinking in radiography: Developing an imaging facility to support the future workforce. Radiography 2024, 30, 74–78. [Google Scholar] [CrossRef] [Scilit] [PubMed]
- Jeon, B.; Koo, H.; Lee, H.J.; Han, E. Effect of the age of visual impairment onset on employment outcomes in South Korea: Analysis of the national survey on persons with disabilities data. BMC Public Health 2022, 22, 35845. [Google Scholar] [CrossRef] [Scilit] [PubMed]
- Madraswala, M.E.; Moodley, V.R.; Mashige, K.P. Visual status, ocular profiles and associated quality of life of workers in the weaving community of Salem District, Tamil Nadu, South India. Indian J. Occup. Environ. Med. 2025, 29, 65–69. [Google Scholar] [CrossRef] [Scilit] [PubMed]
- Chui, C.H.K.; Cui, T. Enablers and inhibitors of the co-production of disability-inclusive employment: Perspectives from people with visual impairment. Disabil. Soc. 2025, 40, 1017–1038. [Google Scholar] [CrossRef] [Scilit]
- Nourbakhsh, S.; Rehman, U.S.A.; Carbonneau, H.; Archambault, P.S. Development and validation of virtual reality scenarios to improve disability awareness among museum employees. Disabilities 2024, 4, 525–538. [Google Scholar] [CrossRef] [Scilit]
- Elshemy, R.; Alzahrani, F.; Fawzy, S.; Almasoudi, F.; Moussa, Y.; Elsayed, M. Bridging to possible: Empowering visually impaired students through assistive technology rehabilitative training to become better students and future employees. Edelweiss Appl. Sci. Technol. 2025, 9, 1160–1175. [Google Scholar] [CrossRef] [Scilit]
- Nemirova, N.V.; Kantor, V.Z. Research on the needs of school teaching staff within the framework of institutionalization of inclusive education for the blind and visually impaired. Sci. Educ. Today 2020, 10, 28–44. [Google Scholar] [CrossRef] [Scilit]
- Maisikeli, S.G. Level of assistive technology use and awareness among people with physical disabilities in the United Arab Emirates. Technol. Disabil. 2023, 35, 11–20. [Google Scholar] [CrossRef] [Scilit]
- Marfoglia, A.; Santilli, T.; Generosi, A.; Mengoni, M.; Giaconi, C.; Ceccacci, S. Co-designing a virtual museum application with a haptic interface involving people with vision impairments and blindness. Int. J. Incl. Mus. 2025, 18, 201–230. [Google Scholar] [CrossRef] [Scilit]
- An, N.; Vesty, G.; Cheong, C. Defining digital wellbeing literacy in remote work integrated learning. Australas. J. Inf. Syst. 2023, 27, 1–24. [Google Scholar] [CrossRef] [Scilit]
- Hamideh Kerdar, S.; Kirchhoff, B.M.; Adolph, L.; Bachler, L. A study on chatbot development using no-code platforms by people with disabilities for their peers at a sheltered workshop. Technologies 2025, 13, 146. [Google Scholar] [CrossRef] [Scilit]
- Mahasneh, R.; Randle, M.; Gordon, R.; Algie, J.; Connolly, A. Predictors of employers’ intention to hire people with disabilities. Soc. Mark. Q. 2025, 31, 278–295. [Google Scholar] [CrossRef] [Scilit]
- Intriago-Mendoza, M.P.; Ruiz-Cedeno, S.D.M. Performance of labor competencies in people with disabilities in supermarket chains in the city of Portoviejo, Ecuador. Sapienza 2022, 3, 187–196. [Google Scholar] [CrossRef] [Scilit]
- Fauquembergue, L.; Valentin, G.; Buscail, B.; Descatha, A. Sectors-job retention/disability matrix on Reunion Island: A 2024 update, with perspective on employment, arduous work. Arch. Mal. Prof. Environ. 2025, 86, 102856. [Google Scholar] [CrossRef] [Scilit]
- Sundar, V.; Brucker, D.L. Work limitations as a moderator of the relationship between job crafting and work performance: Results from an SEM analysis of cross-sectional survey data. J. Occup. Rehabil. 2023, 33, 107–120. [Google Scholar] [CrossRef] [Scilit] [PubMed]
- Kurnianto, A.A.; Khatatbeh, H.; Premusz, V.; Nemeskeri, Z.; Agoston, I. Managing disabled workers due to occupational accidents in Indonesia: A case study on return to work program. BMC Public Health 2023, 23, 943. [Google Scholar] [CrossRef] [Scilit] [PubMed]
- Maebara, K.; Yaeda, J. Relationship between collaboration in work support and knowledge and skills in providing support for individuals with disabilities. J. Intellect. Disabil. Diagn. Treat. 2021, 9, 585–591. [Google Scholar] [CrossRef] [Scilit]
- Fajardo-Castro, L.V.; Martinez-Tur, V.; Moliner, C.; Lira, E.; Gracia, E. Digitalization and integrated employment for persons with intellectual disabilities. Res. Dev. Disabil. 2025, 164, 105070. [Google Scholar] [CrossRef] [Scilit] [PubMed]
- Yeh, S.H.; Huang, K.C. The impact of organizational commitment and work motivation on retention intention: Evidence from long-term care institution caregivers based on expectancy theory. Healthcare 2025, 13, 2832. [Google Scholar] [CrossRef] [Scilit] [PubMed]
- Hunt, C.L.; Yu, L.; Cochran, M.; Liu, J.C.; Mcccarl, B.; Johnson, C.D.; Brun, M.; Berquist, M. A case study approach to high-containment laboratory workflows promoting sustainability, networking and innovation. Rev. Sci. Tech. 2020, 39, 663–673. [Google Scholar] [CrossRef] [Scilit] [PubMed]
- Alcover, C.M.; Guglielmi, D.; Depolo, M.; Mazzetti, G. Aging-and-tech job vulnerability: A proposed framework on the dual impact of aging and AI, robotics, and automation among older workers. Organ Psychol. Rev. 2021, 11, 175–201. [Google Scholar] [CrossRef] [Scilit]
- Nouib, H.; Qadech, H.; Benatiya Andaloussi, M.; Chowdhury, S.J.; Moumen, A. Predicting graduate employability using hybrid AHP-TOPSIS and machine learning: A Moroccan case study. Technologies 2025, 13, 385. [Google Scholar] [CrossRef] [Scilit]

Disclaimer/Publisher’s Note: The statements, opinions and data contained in all publications are solely those of the individual author(s) and contributor(s) and not of MDPI and/or the editor(s). MDPI and/or the editor(s) disclaim responsibility for any injury to people or property resulting from any ideas, methods, instructions or products referred to in the content. |
© 2026 by the authors. Licensee MDPI, Basel, Switzerland. This article is an open access article distributed under the terms and conditions of the Creative Commons Attribution (CC BY) license.