


Abstract
Climate change poses significant challenges for building energy retrofit, as solutions optimized for present-day conditions may become suboptimal under future climates. Although multi-objective optimization is an effective approach for identifying retrofit strategies, incorporating both present and future scenarios substantially increases computational cost. This study proposes a simplified multi-objective optimization method in which the genetic-algorithm search is performed only once, under present-day weather; the resulting Pareto-optimal solutions are then re-simulated under four future IPCC CMIP6 scenarios (SSP1-2.6, SSP2-4.5, SSP3-7.0, and SSP5-8.5), reducing the required full optimization runs. The approach combines EnergyPlus for thermal simulation, Future Weather Generator for creating future weather files, and jEPlus+EA for NSGA-II optimization. The method was applied to a university residence in La Pampa, Argentina, optimizing wall, roof, and window retrofits for Annual Heating Load and Heat Index Safe Hours. The most robust solutions prevented heat gains—including ventilated façades, enhanced roof insulation, and heat-mirror glazing—achieving 29% and 36% increases in Safe Hours and heating load, respectively, versus the non-retrofitted building; however, they failed to maintain that performance under future climates. These findings demonstrate a useful method to include climate change in building energy retrofit design, ensuring its effectiveness under evolving climate conditions.
1. Introduction
The building sector currently accounts for about 28% of the global final energy consumption, a demand that has grown steadily over the past decade and is projected to keep rising through 2050, especially in emerging markets and developing economies [1]. Space cooling is the fastest growing energy consumption source in the building sector [2] and it is affected by climate change, so predicting future building energy demand is crucial for guiding the planning and development of future energy infrastructure and the formulation of energy policies. Global temperatures are projected to rise by 1.5 °C within 2021–2040 [3] with a higher occurrence of heatwaves and extreme hot periods that increase indoor temperatures in buildings and, consequently, their cooling loads.
Comprehensive reviews of the future energy consumption of the building sector and the growth of HVAC equipment were performed both at building and urban levels [4,5]. Global urban cooling demand increased over the last two decades. While European cities saw the highest relative increases (2.5–5%) due to rapid warming, their absolute demand remains significantly lower than the warmer, more densely populated cities in the Global South [4]. In Central and South America, the warmer future climate will raise the energy demand for cooling; thus, increased energy production and improved energy infrastructure will be required to maintain ideal indoor building condition [6]. For example, in the Caribbean and Central America region, the building energy demand per capita is shown to increase by up to 27% and 62.5% under RCP4.5 and RCP8.5 scenarios (Representative Concentration Pathways scenarios, with expected changes in radiative forcing of 4.5 and 8.5 W/m2, respectively, corresponding to an intermediate scenario and the worst-case high emission scenario), at the end of the twenty-first century and with respect to the current climate [6]. In Brazil, cooling energy consumption could increase by 48% by the 2050s, while excessive overheating issues could reach 37% of buildings [7]. Similarly, studies in mid-western Brazil [8] projected significant increases of 54.18% in energy demand by 2080 under the A2 scenario. The A2 trajectory represents a high-emissions, regionalized climate scenario from the older IPCC SRES (Special Report on Emissions Scenarios) generation, cited here to contextualize the historical literature prior to the adoption of the CMIP6 Shared Socioeconomic Pathways (SSPs) used in our main analysis. Other research of the effects of climate change on the thermo-energetic performance of Brazilian low-income housing in Belém and São Paulo under A2 scenario showed that natural ventilation, solar absorptance of the envelope, and thermal transmittance of the walls are crucial for building performance improvements [9]. Future climate projections for five Latin American cities (Rio de Janeiro, Sao Paulo, Santiago, Bogota and Lima) and machine learning techniques were used to establish optimal building envelope design thresholds that maximize thermal comfort and minimize energy demand [10]. In Argentina, climate change over the central-eastern region will bring more warm days and more intense heatwaves in the future [11]. Using bias-corrected CORDEX projections for Argentine social housing, ref. [12] found future cooling (heating) demand variations from 27–37 (303–330) MJ/m2 under moderate emissions to 51–70 (266–326) MJ/m2 in high-emission scenarios. Another research about the energy consumption of a single-family social house in eight Argentinean cities [13] showed that significant increases in cooling loads (3.6–7.9 times higher) and decreases in heating loads (23–59% lower) are expected in the future (2080) as compared with the baseline period (1961–1990). Furthermore, for Santa Rosa city in La Pampa (the location of the case study in this paper), a decrease in the heating load of about 6.2 kWh/(m2-decade) and an increase in the cooling load of about 1.7 kWh/(m2-decade) are expected [13].
The energy consumption of buildings and the associated CO2 emissions can be reduced by taking retrofit measures to effectively address energy efficiency [14]. Given the uncertainty of future climate conditions, understanding how possible retrofit strategies will perform under different future weather conditions is crucial [7]. Dynamical energy simulation enables the assessment of this impact [14], and combining it with genetic algorithms and multi-objective optimization allows evaluating a very large number of possible retrofit measures.
Multi-objective optimization refers to the process of simultaneously optimizing two or more conflicting objectives subject to certain constraints, in order to find a set of optimal trade-offs or Pareto-optimal solutions. Optimizing building thermal behavior under climate change is a challenging task, and the optimization processes are time- and power-consuming. Recently, many researchers have faced this problem with different tools and strategies. For example, Li et al. [15] used EnergyPlus [16] and multi-objective optimization through jEPlus+EA [17] to study the impact of climate change over the past 60 years on the energy consumption of an office building in China. They found that climate change caused energy consumption to increase by about 4.6% and that the optimal solutions can reduce the cooling energy consumption of the building by 10.6–16.8%. In a related study, Li et al. [18] developed an optimization framework aimed at identifying robust building designs under multiple climate scenarios, applying it to a case study in China under 2020, 2050, and 2020–2050 conditions derived from a General Circulation Model. Machine learning models were used to predict heating, cooling, and cost as functions of envelope parameters, enabling a multi-objective optimization that simultaneously maximized energy efficiency and minimized life-cycle costs. This study underscored the substantial influence that an evolving climate exerts on building design decisions. Ascione et al. [19] proposed a multi-stage, multi-objective approach to find robust cost-optimal energy retrofit solutions for four global warming and economic scenarios (0, 0.6, 1.2, and 1.8 °C increases in ambient dry-bulb temperature) using EnergyPlus to obtain four separate Pareto fronts (one per scenario). The approach was applied to a typical Mediterranean building in South Italy and the authors concluded that a substantial reduction in computational times compared to a standard exhaustive sampling was obtained; however, the need to run four complete optimization processes remained time- and power-consuming. More recently, Adhikari et al. [20] faced the same computational burden when applying NSGA-II (Non-Dominated Sorting Genetic Algorithm II) and EnergyPlus to identify retrofit strategies that balance heating energy use and summertime overheating risk in non-air-conditioned Baltimore rowhouses. Running the optimization independently for the present day (2020–2039) and the late-century (2080–2099) they found that optimal retrofit solutions under future climate experienced a 140–421% increase in overheating degree-hours and only a 3–6% reduction in heating energy use relative to current-climate optimal designs. In Iran, Naderi et al. [21] proposed the optimization of controlled blinds in an office room using EnergyPlus, jEPlus [17], and jEPlus+EA [17] tools for thermal simulation, identification of objective functions and decision-making parameters, and multi-objective optimization, respectively. Surrogate machine learning models, transfer learning techniques, and the NSGA-III algorithm were used to efficiently evaluate architectural designs and their improvements to increase thermal comfort and decrease energy demand under future climate scenarios [21]. Fast multi-objective optimization and decision-making support for building retrofit was applied to a building at Pennsylvania University [22]. Extending this line of work, an automated three-stage retrofit optimization scheme, combining pre-optimization feature selection, a non-dominated sorting differential evolution algorithm, and post-optimization decision-making, applied to two educational buildings was proposed in [23] with decision-making under multiple stakeholder “mindsets” rather than a single fixed weighting scheme. A recent systematic review of 105 studies on climate-adaptive building retrofit [24] concluded that a critical methodological gap remains: existing multi-objective optimization frameworks either rely on computationally expensive white-box models applied independently to each climate scenario, or use simplified surrogate models that sacrifice simulation accuracy, and called explicitly for ‘a simplified yet accurate modeling approach’.
A comparative analysis of representative building retrofit optimization studies under changing climates is shown in Table A1. Traditional approaches typically fall into two categories: they either perform independent, computationally intensive optimization runs for every individual climate scenario, which results in significant time and power consumption, or resort to simplified surrogate or machine learning models that can compromise transient physical simulation accuracy. On the other hand, several studies have successfully utilized similar tools to optimize specific envelope elements under current conditions. However, these studies do not propagate long-term climate change uncertainty across multiple scenarios. The approach in this study fills a critical gap by maintaining full physical simulation accuracy (without resorting to simplified surrogate models) while avoiding the massive computational cost of running separate optimization processes for each future emission pathway.
Considering the reviewed literature, much research has been done on the impact of climate change on the energy consumption of buildings. It is also clear that multi-objective optimization is a valuable tool for exploring retrofit strategies under different global warming scenarios. However, solutions optimized for present climate may not perform adequately under future scenarios, and accounting for both present and future conditions requires time-consuming and computationally intensive calculations, typically one optimization per global-warming scenario. Little research has combined present and future weather and optimal design parameters into a simplified method to obtain such optimized solutions. The Pareto-evolution method proposed here directly addresses this gap: a single EnergyPlus-based optimization is performed for present-day conditions, and climate uncertainty across different future scenarios is subsequently propagated through direct re-simulation, rather than through repeated optimization.
Specifically, this study aims to: (i) develop a simplified multi-objective optimization framework in which the genetic-algorithm search is performed only once under present-day climate, and climate change uncertainty is subsequently assessed through Pareto-front evolution; (ii) demonstrate the framework through a representative case study of a free-running, naturally ventilated university residence in Santa Rosa, Argentina, using Annual Heating Load and Heat Index Safe Hours as illustrative objective variables; (iii) quantify the variability of retrofit performance across four CMIP6 (Coupled Model Intercomparison Project Phase 6) SSP scenarios (SSP1-2.6, SSP2-4.5, SSP3-7.0, SSP5-8.5); and (iv) select a single climate-robust retrofit solution using a multi-criteria decision-making method (R-method).
The paper is organized as follows. Section 2 describes the proposed methodology and tools, and presents the passive building used as the case study together with the main climatic characteristics of the site. Section 3 describes the results, including the present-day Pareto solutions and their behavior under four future scenarios. The optimal solution is selected by applying the R-method, and a discussion about the more influential consequences and impacts is presented. Section 4 highlights the main conclusions and limitations of this investigation and proposes future research directions.
2. Materials and Methods
2.1. Multi-Objective Optimization and Re-Simulation Under Future Climate
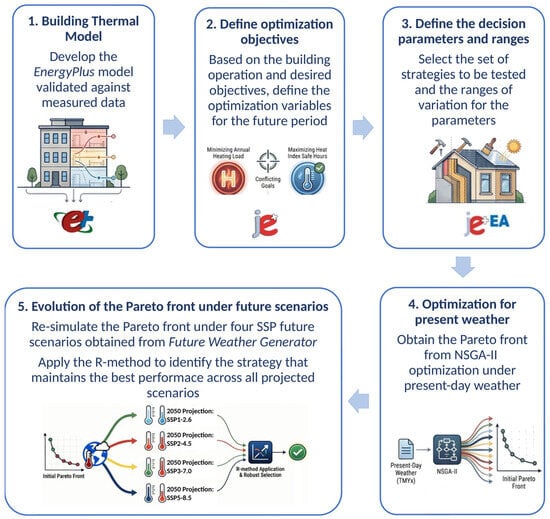
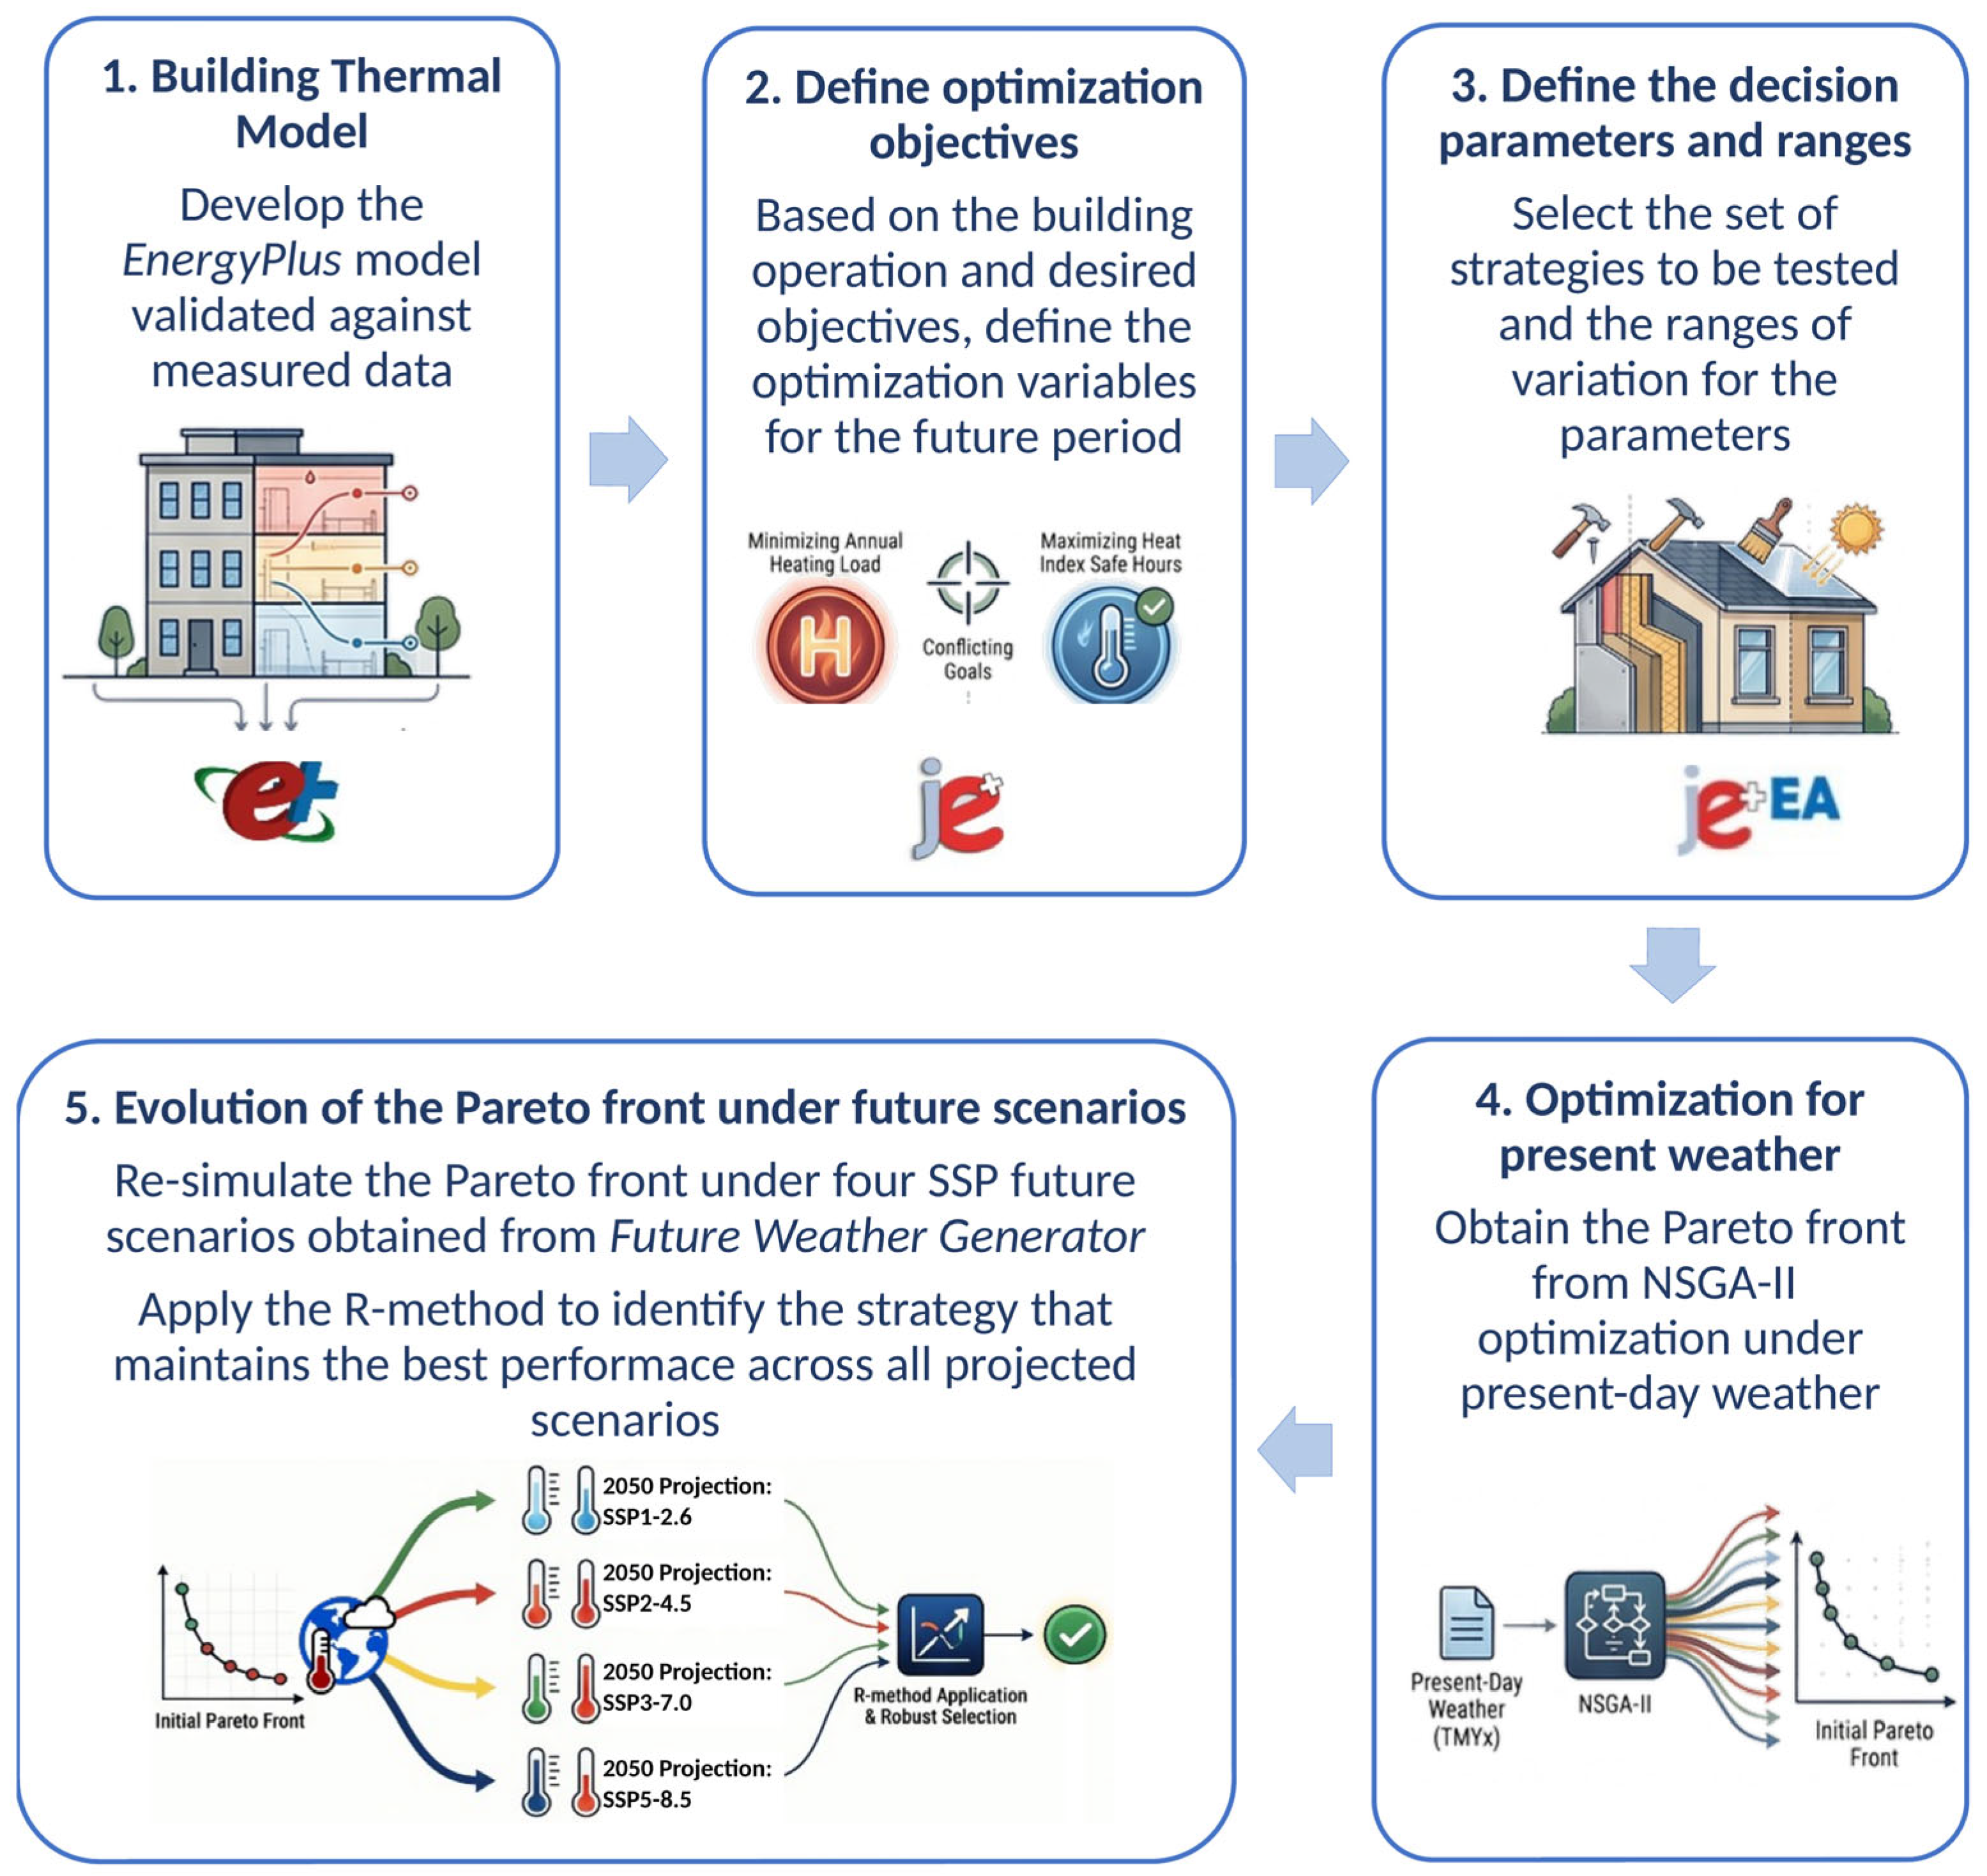
The various stages of the research procedure are illustrated in Figure 1. In summary, it consists of optimizing the building behavior for present-day meteorological data and evaluating the set of best present solutions under future scenarios. Thus, the solution with the best performance in all scenarios will be the optimal one.
Figure 1.
Scheme of the methodology.
The proposed methodology involves five steps. The first step consists of generating the building thermal model, which ideally should be validated against measured data to obtain a reliable model that can predict the thermal behavior of the building for the present-day layout and management [25]. The simulation tools most used in the scientific community are EnergyPlus [16], ESP-r [26], and TRNSYS [27]. In this paper EnergyPlus V23.1.0 through OpenStudio V3.10.0 free interface [28] was used, due to its capability in handling transient conduction, detailed convective heat transfer calculations, its native ‘Exterior Natural Vented Cavity’ module for naturally ventilated facades, and its seamless integration with the open source jEPlus+EA genetic algorithm wrapper for NSGA-II optimization [17].
The second step consists of defining the optimization objectives. In conditioned buildings, the objective variables are usually related to the energy consumption, while in free-running buildings the variables are related to comfort conditions (operative temperature, Predicted Mean Vote (PMV), Predicted Percentage Dissatisfied (PPD), Adaptive Predicted Mean Vote, SET (Standard Effective Temperature), or Heat Index (HI), among others).
The third step consists of defining the decision parameters that characterize the selected retrofit strategies. In a real building, some geometric parameters and design variables are fixed (such as building orientation, apartment layout, materials, etc.), so the retrofit strategies are restricted to the building envelope and operation. Once the parameters were defined, the multi-optimization process was run and the Pareto front for the present day was obtained (fourth step). In this study, the tools jEPlus and jEPlus+EA were used.
The last step consists of re-simulating the Pareto front for future scenarios and selecting the optimal solution. Future climate projections based on the most up-to-date scenarios of the Intergovernmental Panel on Climate Change IPCC AR6 [3] have been adopted. These scenarios are known as Shared Socioeconomic Pathways (SSPs) and they describe different development paths of society, including things such as population, economic growth, education, urbanization, and the rate of technological development. These scenarios are: SSP1 (the sustainable and “green” pathway: global CO2 emissions are cut severely, reaching net zero after 2050; temperatures stabilize around 1.8 °C higher by the end of the century), SSP2 (the “middle-of-the-road” pathway: global CO2 emissions will not reach net zero by 2100 and temperatures will rise by 2.7 °C by the end of the century), SSP3 (Regional Rivalry or the fossil-fueled development pathway: global CO2 emissions will roughly double from current levels by 2100 and average temperatures will rise by 3.6 °C by the end of the century), SSP4 (Inequality), and SSP5 (the fossil-fueled development and integration of global markets pathway: current CO2 emissions levels will roughly double by 2050 and the average global temperature will increase to 4.4 °C by 2100). The future climate weather data can be obtained from available tools [29,30,31,32]. In this study, the free and open tool Future Weather Generator V2.2.1 [32] is used, which is a free, open-source, and cross-platform application for researchers and building design professionals designed by researchers from the University of Coimbra, Portugal. Table 1 lists all the software tools used in this study, together with their specific versions and their primary functions.
Table 1.
Software versions used in this study and description of their functions.
2.1.1. Selection of the Optimal Solution
There are several methods for selecting an optimal solution from the Pareto front, such as TOPSIS (Technique for Order of Preference by Similarity to Ideal Solution), GRA (Gray Relational Analysis), LINMAP (Linear Programming Technique for Multidimensional Analysis of Preference), and other methods well described in [33]. Unlike these traditional techniques, which require the decision-maker to pre-define exact numerical weights (often introducing subjectivity and cognitive bias), the R-method used in this study converts ordinal importance rankings directly into mathematical weights through reciprocal rank processing [34]. This is highly advantageous in building design, as stakeholders can easily rank objectives qualitatively (e.g., prioritizing indoor thermal safety over energy cost) without having to mathematically quantify exact weight percentages.
In the R-method, a two-step ranking process is performed: the M objectives are prioritized according to the stakeholder’s preferences, while the N non-dominated Pareto solutions are ranked independently for each objective based on their performance. Using Equation (1), both rankings are subsequently converted into unified weights [34]:
where is the weight of the objective (), is the ordinal rank of the objective (), and is the number of objectives. The composite score of each alternative solution is the weighted sum of its objective weights, and the solution with the highest composite score is selected as the best compromise Pareto-optimal solution.
2.1.2. Present and Future Climate Data
Predictions of energy consumption and thermal behavior of buildings usually employ “typical” or “reference” years containing a one-year sequence of 8760 hourly values of meteorological parameters derived from a long-term database through statistical processing [35]. These TMY (Typical Meteorological Year) files can be easily retrieved from many freely available databases [36,37,38].
Future weather data are generated through Future Weather Generator V2.2.1 [32]. The application morphs hourly EPW weather files (baseline 1985–2014) to match future climate change scenarios derived from the four scenarios SSP1-2.6, SSP2-4.5, SSP3-7.0, and SSP5-8.5, where SSPx-y is the scenario x with radiative forcing y (in W/m2) in the year 2100. The application calculates the typical years (including the warmest and coldest years) for two timeframes: 2050 (calculated from the period 2036–2065) and 2080 (calculated from the period 2066–2095). In version 2.2.1, 20 GCM (General Circulation Models) experiments that contributed to the 6th IPCC Assessment Report AR6 [3] are implemented in the application (see Table 2), so they are the most up-to-date models available in the field. The user can generate a weather file (in EPW format) for each selected model or an ensemble of user-selected models. In this study, an ensemble of 11 GCM experiments was selected from those available in the Future Weather Generator application [32], as detailed in Table 2, focusing on models with the highest spatial resolution. The user can also select from three grid interpolation methods (bilinear interpolation of the four nearest grid points as default) [36].
Table 2.
GCM models and SSPs included in the Future Weather Generator application [32] to generate the future weather data for 2050. The models and CMIP6 SSPs used in this study are shown in gray.
2.2. Case Study
2.2.1. Building Description
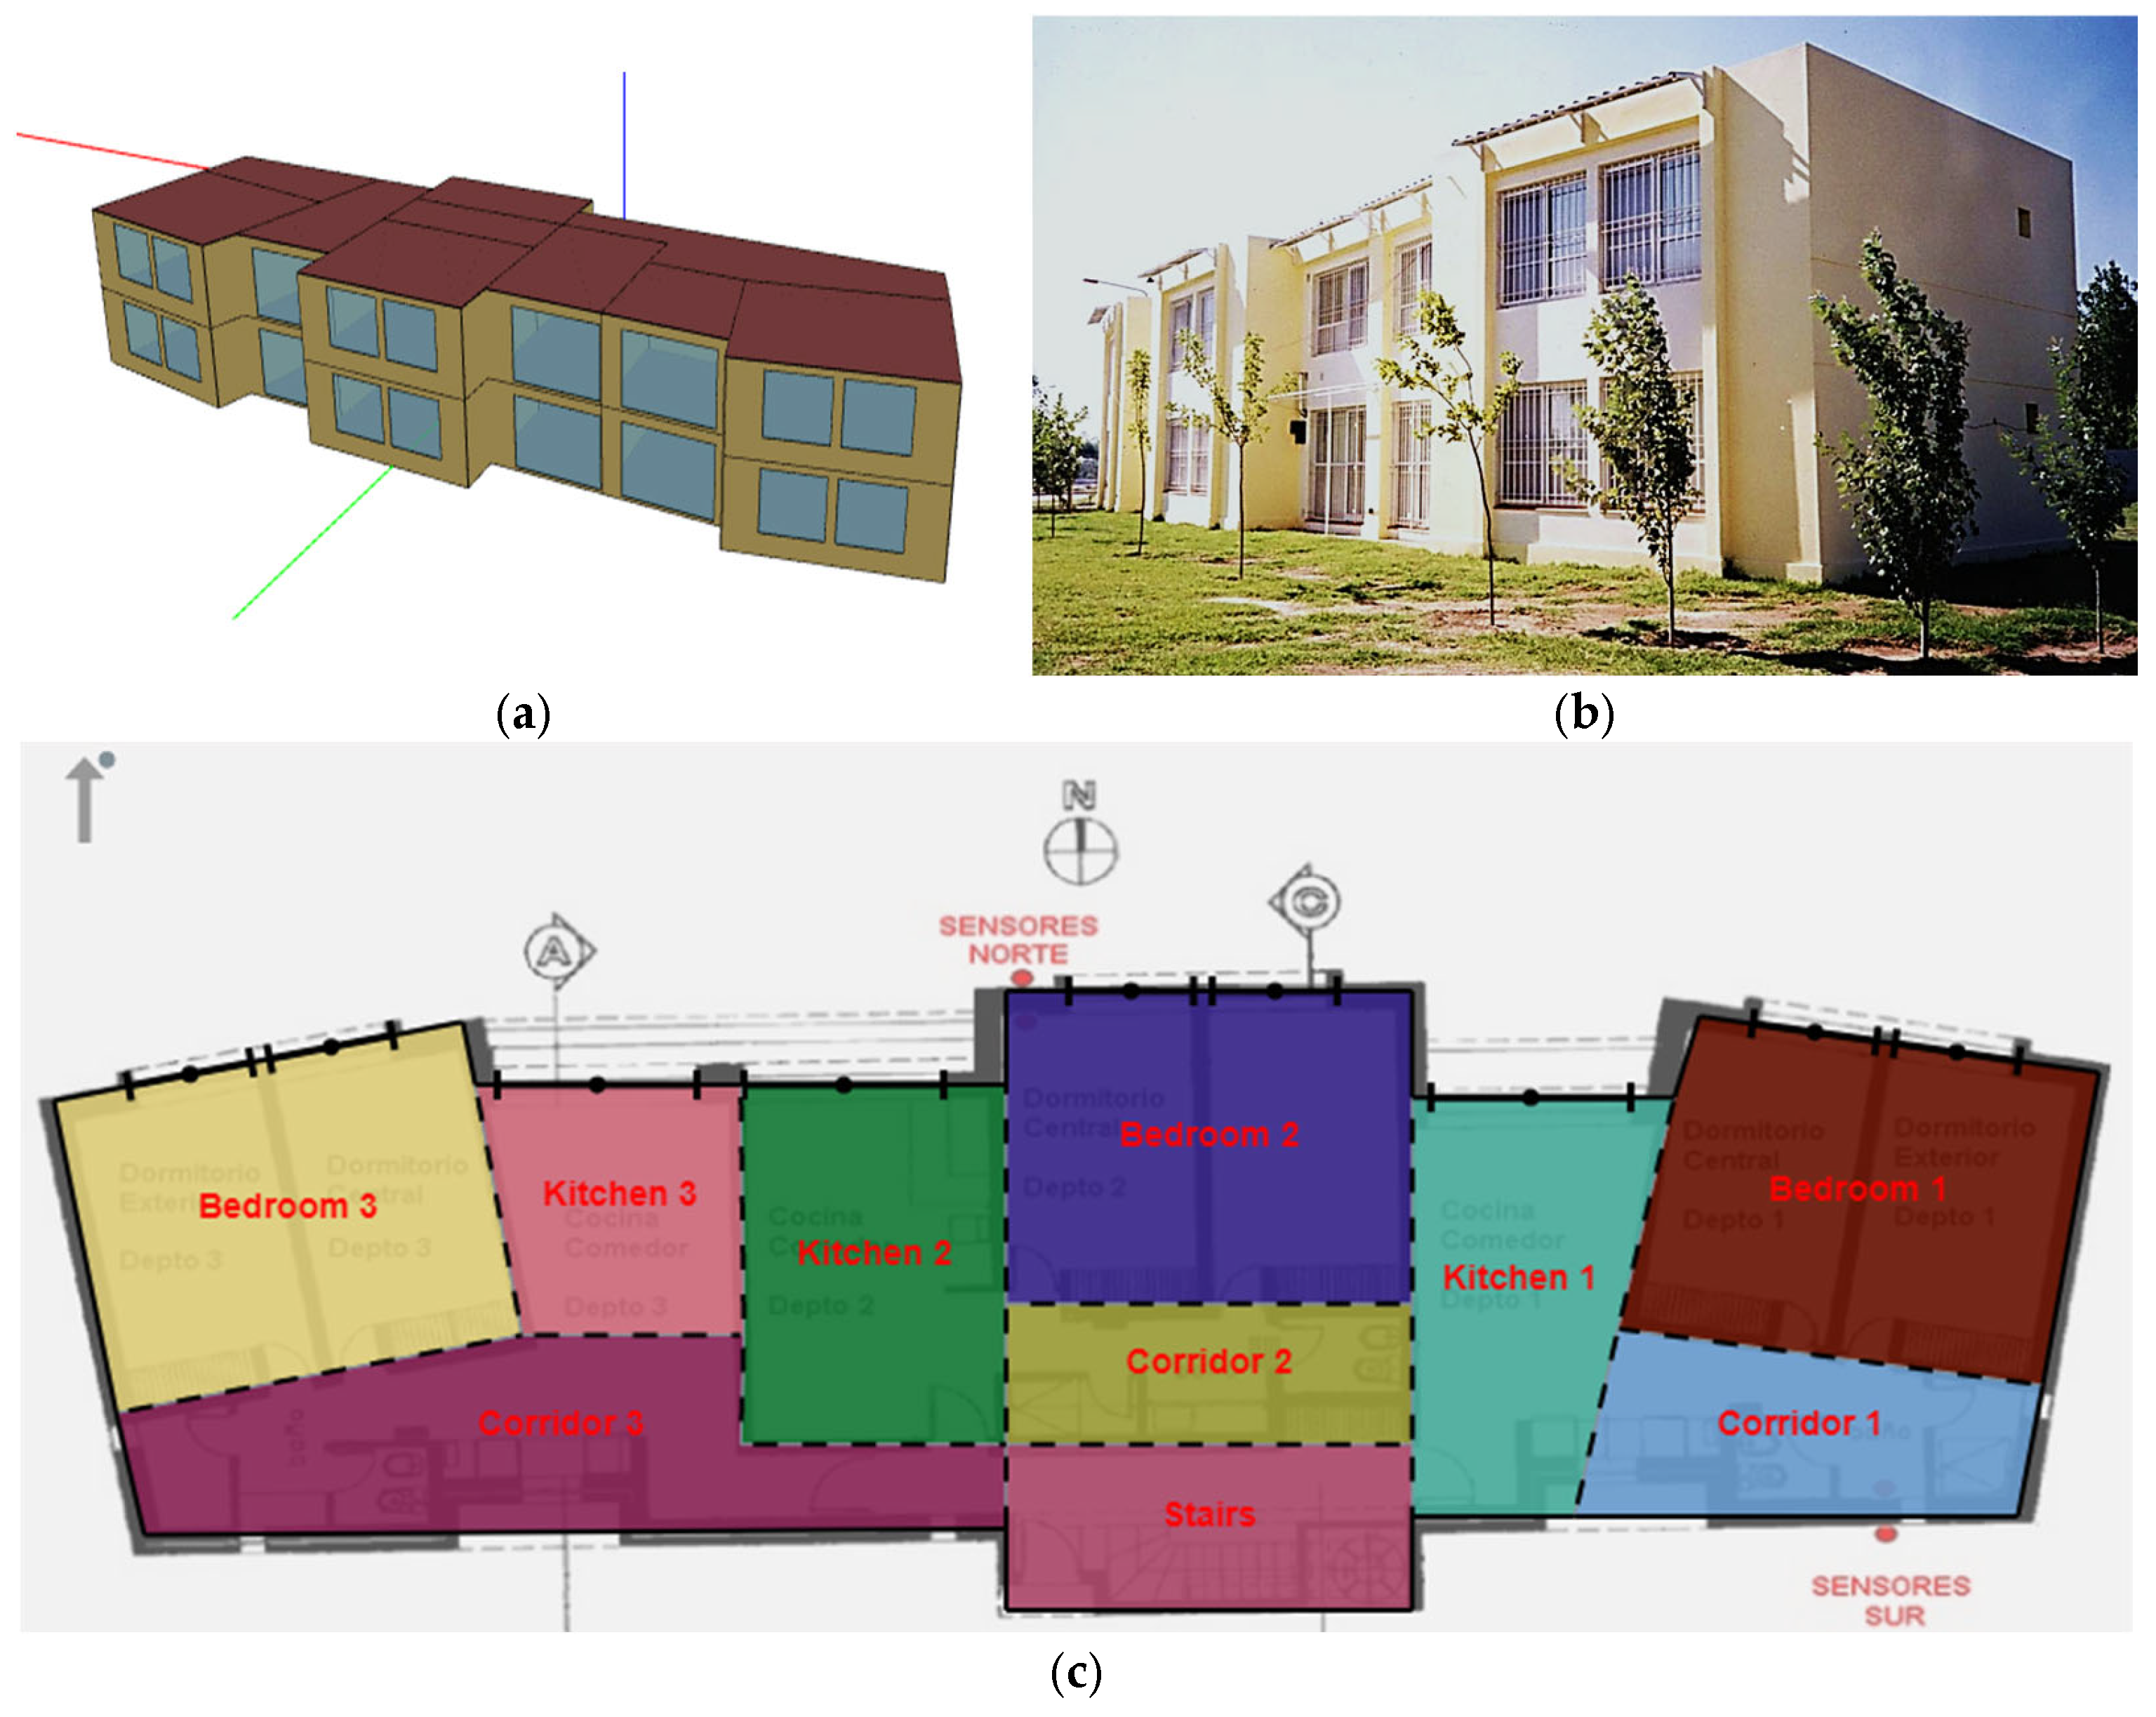
The studied buildings are two identical building blocks of university bioclimatic residences built in 2001 (Figure 2), selected for this study because of the extensive monitoring data collected over the past 20 years of occupancy [39,40,41]. They are located in Santa Rosa City (36.64 S, 64.29 W, 189 m above sea level), Argentina. The building is owned and maintained by the National University of La Pampa (UNLPam), which assumes capital infrastructure investments, whereas monthly utility operating costs are borne by the resident students. Each block has 350 m2 of useful floor area (about 54 m2 per apartment), and comprises six apartments accessed by a central southern stairwell. Each apartment has two bedrooms and a north-facing dining room and kitchen, with services facing south. The distance between the two blocks is large enough to avoid mutual overshadowing and preserve winter solar gains. The building relies on individual, non-condensing natural gas heaters with an efficiency of 75% for space heating, operated manually by the occupants. No active cooling or mechanical ventilation systems are present; thus, summer cooling is achieved strictly via manual window opening for natural cross-ventilation. The original design followed the bio-climatic design tools available at the time, the Olgyay bio-climogram and the Givoni chart, together with prior local experience, applying passive solar gain, thermal mass, natural ventilation, insulation, and shading to improve year-round comfort (Table 3).
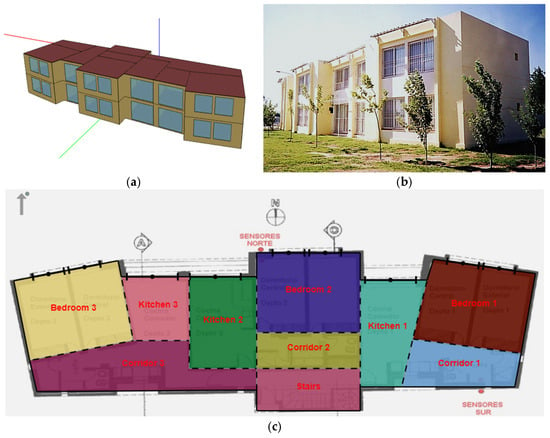
Figure 2.
(a,b) Building layout and view. (c) Thermal zoning in EnergyPlus V23.1.0 with OpenStudio V3.10.0.
Table 3.
Design features to save auxiliary energy and reach indoor comfort in the studied building.
2.2.2. Previous Results and Monitoring Information
Intensive monitoring was performed and the thermal model of the building was validated against measured data [39,40,41]; the same validated thermal model is used in this research, with the main relevant results summarized in Table 4. While winter thermal performance was highly efficient, with an annual energy consumption for heating of 109 kWh/m2-year and indoor temperatures of 18–26 °C, the building suffered from severe summer overheating (its actual energy consumption for cooling is zero because no active cooling systems are installed). Peak indoor temperatures reached 31.4 °C on the top floor and 29.3 °C on the lower level, resulting in excessive hours exceeding Safe indoor Heat Index thresholds. This overheating was unevenly distributed: first-floor apartments were consistently warmer than those on the ground level, and central units suffered the most critical overheating due to obstructed natural cross-ventilation.
Table 4.
Main results of the monitoring, thermal simulation, and post-occupancy analysis of the studied building [39,40,41].
2.2.3. EnergyPlus Model and Validation
The building was modeled as 20 thermal zones (three per apartment across the six apartments, plus two circulation stairwell zones, Figure 2), using constructive data from building plans; the thermal and optical properties of walls and roof materials are listed in Table 5. Openings between kitchens and corridors were modeled as Air Wall materials, allowing heat and air exchange between zones. Occupancy was set at two students per apartment with no additional internal gains, and a constant infiltration rate of 2 air changes per hour was adopted following [42]. Vegetal shading was excluded from the 2001 validation run, since trees had not yet grown at that time, but it is included in the present- and future-period simulations as Site Shading objects with a seasonal transmittance schedule (1.0 from April to September; 0.2 for the rest of the year, when trees are in full foliage). Annual Heating Load was computed using the IdealHeatLoads object over an April–September heating period, with a constant 22.3 °C thermostat setpoint, corresponding to the average temperature measured across the six apartments in 2001 [40].
Table 5.
Wall and roof constructions and material properties used in EnergyPlus (original building).
The model was validated against hourly indoor air temperature measured in the six apartments throughout 2001 [40,41], following ASHRAE Guideline 14 [43], which requires a normalized mean bias error (NMBE) below 10% and a coefficient of variation in the root-mean-square error (CV (RMSE)) below 30% for hourly calibrations. Both criteria were met, confirming that the model reliably reproduces both the temperature variations and the heating energy consumption of the building.
2.2.4. Typical Meteorological Year for Present-Day and Future Weather
Present-day weather conditions were represented using the Typical Meteorological Year (TMYx 2011–2025) for Santa Rosa, obtained from the climate.onebuilding.org database as the most recent record available for this station. Future weather conditions for 2050 were generated for the four SSP scenarios (SSP1-2.6, SSP2-4.5, SSP3-7.0, and SSP5-8.5) in EPW format using Future Weather Generator V2.2.1 [32]. The 2050 timeframe (2036–2065) was selected because it approximates the expected remaining service life of the retrofit measures evaluated.
Because Future Weather Generator computes climate anomalies relative to a 1985–2014 baseline TMY, it was calculated from hourly historical records of the Argentinean National Meteorological Service for Santa Rosa (Station N° 876230, period 1985–2014), following the TMY/ISO 15927-4:2005 methodology [35], implemented in a purpose-built Python script. To clarify the usage of different meteorological datasets for Santa Rosa City, Table A2 in Appendix B summarizes their sources, temporal periods, and respective roles in simulation baseline definition, model validation, and climate morphing.
2.2.5. Objective Variables
The building relies on gas heaters for winter but has no cooling equipment for summer, since the students’ low and variable income makes acquiring or installing cooling active systems unlikely in the near future. A fundamental distinction exists between mechanically cooled and free-running buildings. In air-conditioned spaces, summer thermal stress is converted into electricity demand for cooling; in contrast, in free-running naturally ventilated buildings, active cooling energy consumption is physically zero, and overheating manifests directly as unmitigated indoor thermal stress and heat-related health hazards [44,45]. Evaluating overheating risk through non-energy thermal comfort metrics—while simultaneously minimizing space heating energy demand—is a well-established approach in multi-objective retrofit optimization for non-air-conditioned housing [46]. In this study, because the target student population faces severe economic constraints that make acquiring or operating active cooling systems unlikely, thermal safety under free-running conditions was identified as the highest priority. Consequently, Heat Index Safe Hours was selected as the primary summer safety metric to be maximized alongside the minimization of Annual Heating Load. It is important to emphasize that while the proposed methodology is demonstrated here using space heating load and thermal safety hours, the overall framework is inherently modular and flexible. The choice of objective variables is a designer-specific decision that depends on the building operational mode, climate zone, and occupant socio-economic profile. The framework itself remains valid regardless of whether active cooling energy, peak load, operational costs, or embodied carbon are included in the decision space.
The Heat Index HI (°C) is based on the standard NOAA/National Weather Service (USA) categories [47] and uses both air temperature and relative humidity to measure the human perceived equivalent temperature. HI is calculated through an equation derived by multiple regression analysis, which combines air temperature and relative humidity [45]. The five thresholds of HI values indicate different risk levels, measuring the likelihood of heat disorders with prolonged exposure or strenuous activity, following the classification established by the USA National Weather Service [47,48]: Safe (≤26.7 °C), Caution (>26.7, ≤32.2 °C), Extreme Caution (>32.2, ≤39.4 °C), Danger (>39.4, ≤51.7 °C), and Extreme Danger (>51.7 °C). Thus, the Heat Index Safe Hours () directly quantifies the indoor safety conditions, that is, the number of annual hours with the Heat Index in the Safe category (HI < 26.7 °C), where occupants are Safe from heat-related health risks under free-running conditions. Accordingly, the two objective functions selected for optimization were the Annual Heating Load (kWh/m2-year), to be minimized, and the Heat Index Safe Hours , to be maximized. Solutions were further required to keep overheating below 10% of annual hours ( > 7884 h).
Both objectives were extracted directly from the EnergyPlus Tabular Output Report generated by EnergyPlus for each simulation: was obtained in Wh from the Annual Building Utility Performance Summary and converted to kWh/m2-year. This calculation was performed by jEPlus, by converting the total annual heating energy in Wh to kWh and then dividing by the total useful floor area of the residence (350 m2), while was directly obtained from the Annual Thermal Resilience Summary, specifically from the “Heat Index Hours in Safe (≤26.7 °C)” field, which reports the average number of annual hours in Safe conditions across all thermal zones.
2.2.6. Decision Parameters and Ranges
Retrofit strategies related to user behavior were not accounted for, because of the high variability between dwellers evidenced from the experimental measurements [41]. In a building with a high rotation of dwellers from year to year, this decision allows to optimize the building design alone, independently of the users’ behavior. Given the target population’s low and variable income and the complete absence of cooling infrastructure, active cooling systems were deliberately excluded from the decision variables. Instead, the optimization focus was restricted to passive envelope retrofits (wall and roof insulation, dynamic ventilated cavities, spectrally selective glazing, and night ventilation) aimed at maximizing passive survivability. This ensures that the building envelope protects occupants against extreme summer heatwaves without introducing electrical energy penalties or reliance on active HVAC systems. This passive-focused approach is heavily supported by the regional literature on Global South housing vulnerability [9,49]. The list of possible retrofit strategies and parameter ranges is shown in Table 6. For the exterior walls, four possible retrofits were analyzed: thermal insulation and gypsum board added on the interior side of the wall (W1), an opaque thermally insulated exterior double façade (W2), and opaque naturally ventilated façades for East and West walls (with an external opaque fibro cement board cladding, an intermediate ventilated air space, and the original building wall, W3). For the roof retrofit, the addition of a new ceiling (thermal insulation and gypsum board) was proposed, with different insulation thicknesses, and using a radiative coating on the rooftop (solar reflectance 0.92 and infrared emissivity of 0.91) [50]. For windows, four options for double glazing units (DGU) were considered (low-e clear, low-e tinted, low-e spectrally selective clear, and low-e spectrally selective tinted glass). The optical properties were obtained from the EnergyPlus library for window glass materials [51]. Finally, user behavior was also optimized by considering natural ventilation during the night.
Table 6.
Retrofit strategies for the building. The descriptions of the wall and roof constructions and their thermal properties are shown in Table 5.
The opaque ventilated façade was modeled in EnergyPlus through the module Exterior Natural Vented Cavity. This element allows the characteristics of the outer leaf, the ventilated cavity (Height Scale for buoyancy-driven ventilation), and the openings for natural ventilation to be entered. More details of the model may be found in the EnergyPlus program documentation [16]. In this case, opaque facades were included only in the East and West walls. A concrete opaque sheet (thermal emissivity of 0.9, solar absorptivity of 0.7) was considered with openings in the top and bottom of the building façade (opening area fraction of 0.04, discharge coefficient of 0.65, and neutral height plane at 2.80 m).
The parameters selected for the NSGA-II algorithm in jEPlus+EA were: a population size of 40, a maximum of 200 generations, a crossover rate of 100%, and a mutation rate of 20%, in accordance with the literature [13]. The convergence was assessed based on the stabilization of the non-dominated set (hypervolume), which exhibited negligible changes after approximately 150 generations, justifying the 200-generation stopping criterion. Once the Pareto-optimal solutions were obtained, the R-method was applied and the objectives were ranked based on their importance, as perceived by the decision-maker. In this study, Safe Hours were assigned a higher weight ( = 0.6) than Heat Load ( = 0.4) because the building has gas heating but no cooling system; winter discomfort can therefore be actively corrected by occupants at a moderate economic cost, whereas summer overheating cannot, making health-related overheating risk the higher-priority objective for this specific building typology. Then, by using these weights, the Pareto-optimal solutions are ranked based on their performance and the composite ranks of the alternative solutions based on the composite scores are determined. The alternative solution having the highest composite score is considered the best compromise Pareto-optimal solution.
3. Results
3.1. Climatic Characterization and Thermal Forcing Drivers
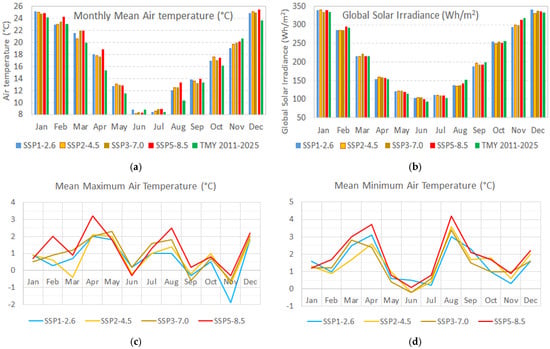
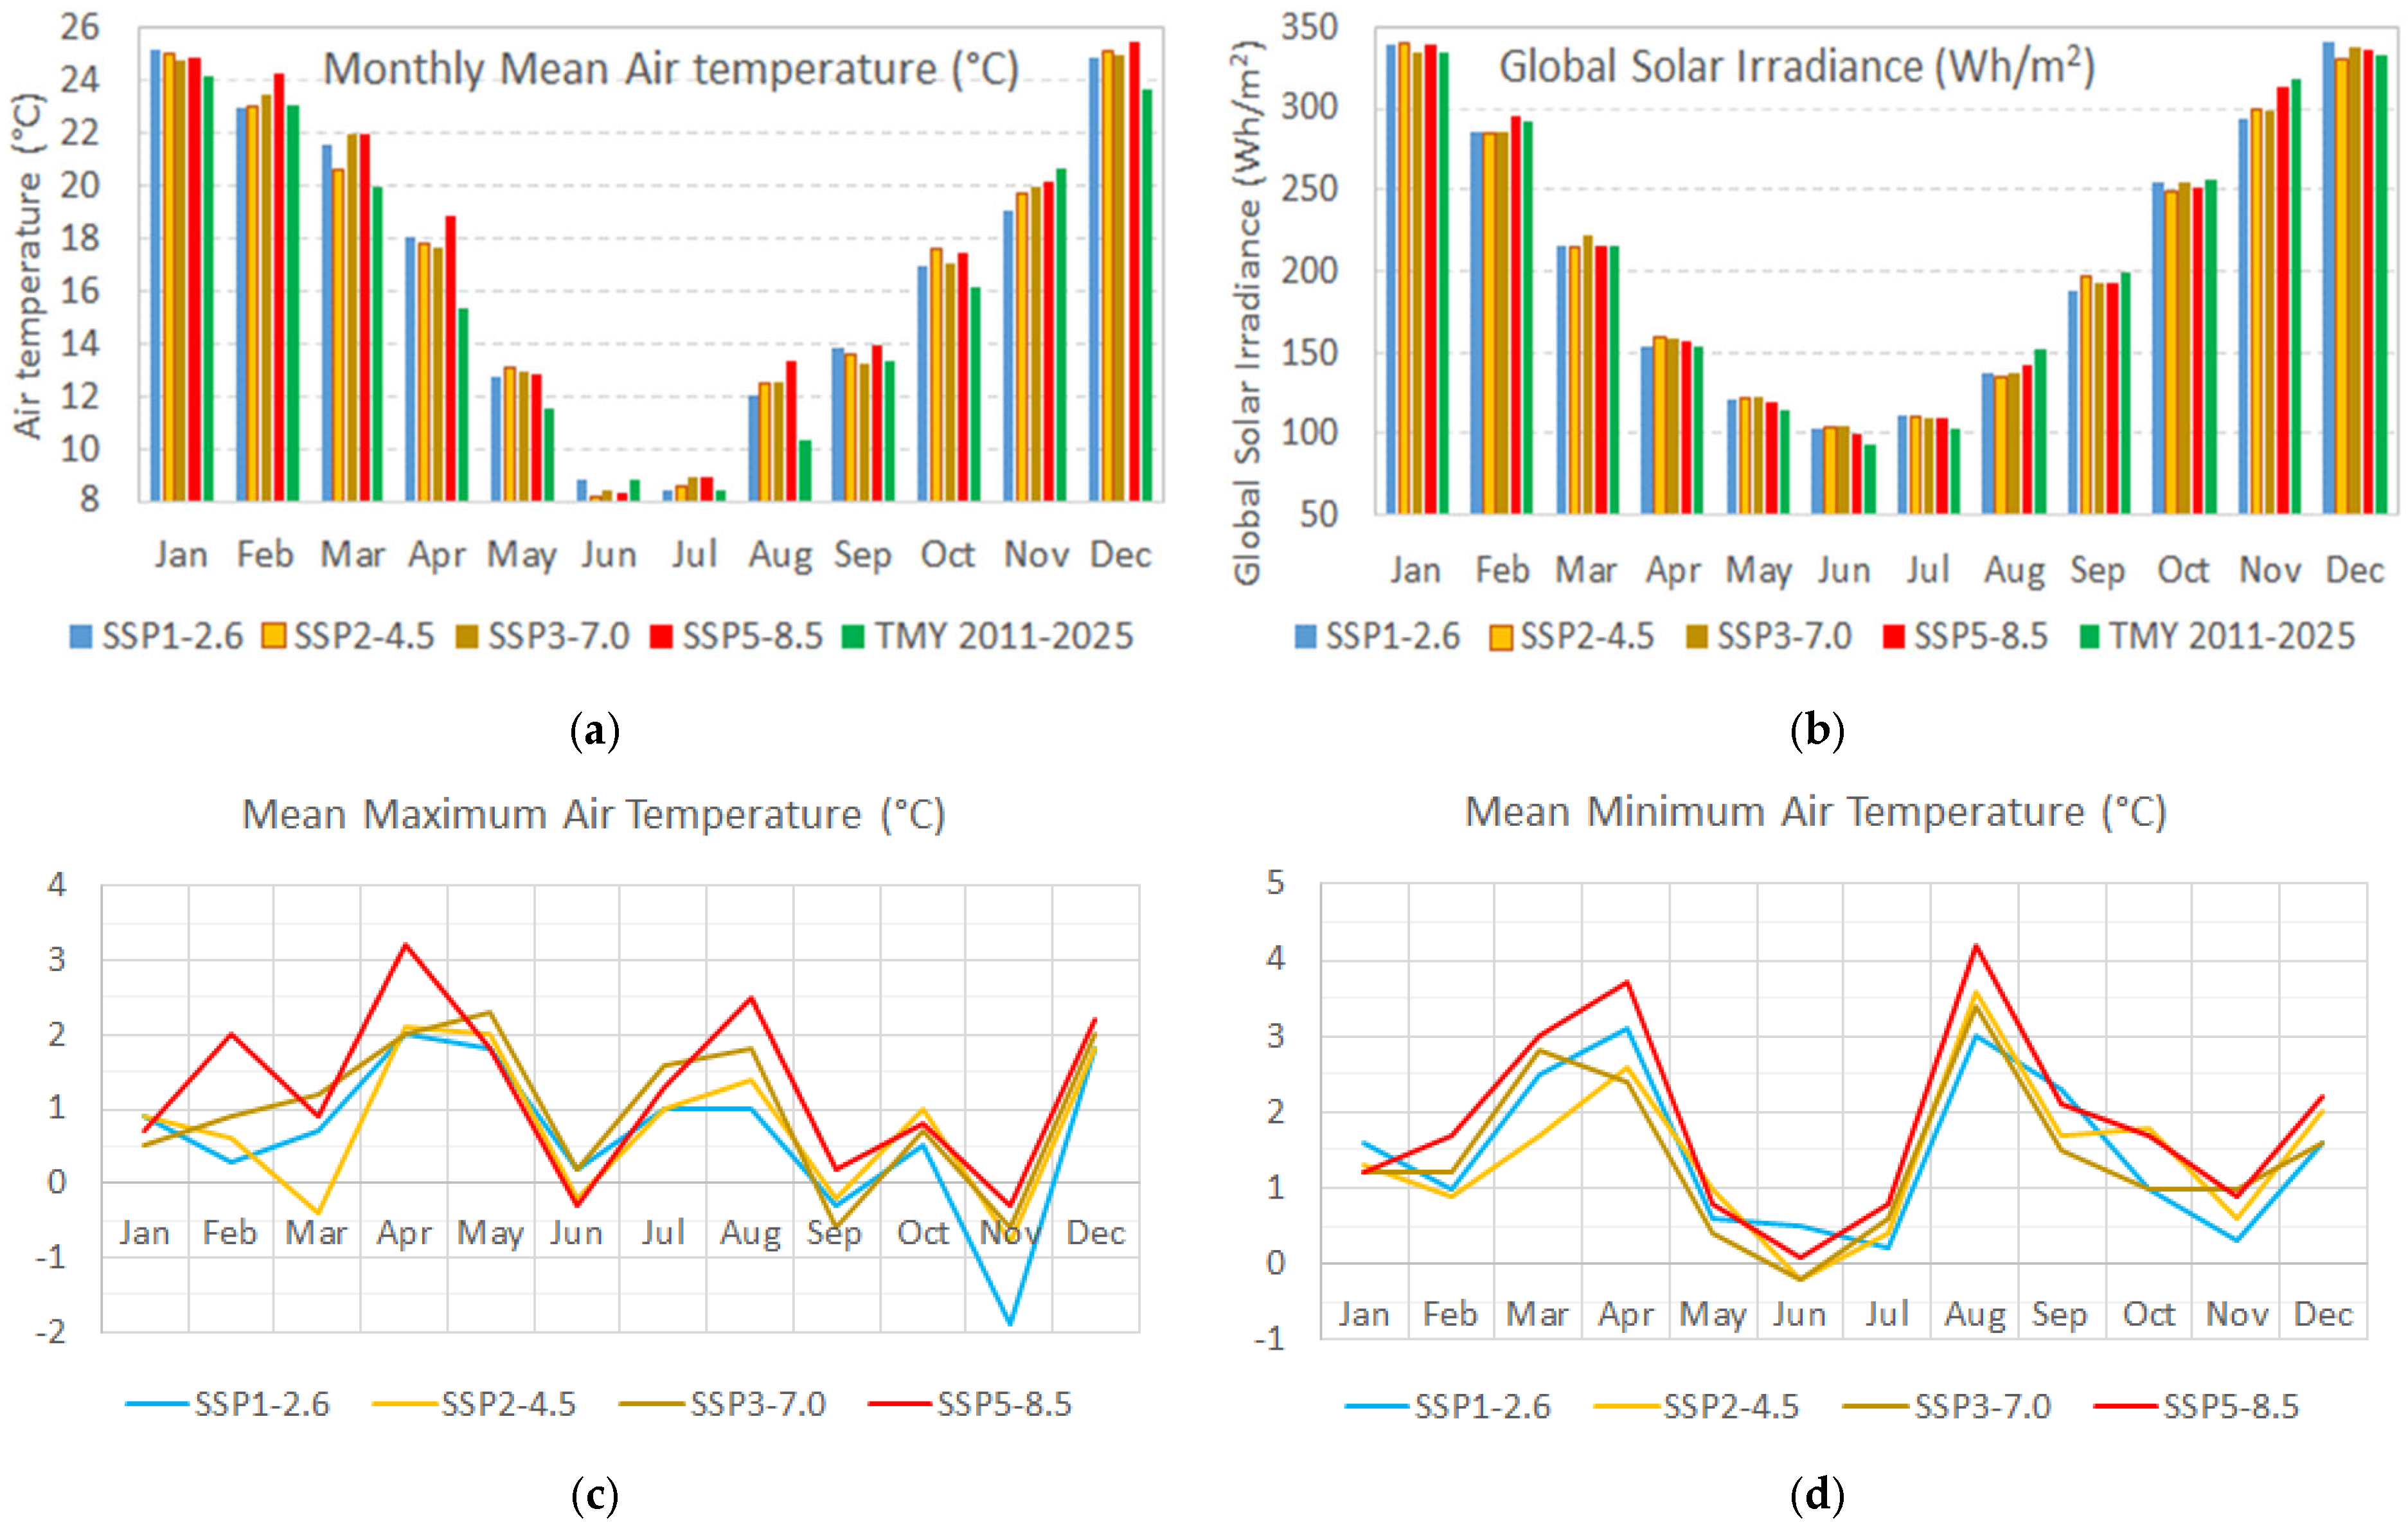
Figure 3 shows the mean monthly air temperature and global horizontal solar irradiance for the present-day TMY (2011–2025) and for the four future SSP scenarios in 2050, together with the resulting differences in monthly mean, maximum, and minimum air temperature relative to the 1985–2014 baseline. Monthly mean temperatures increase across all future scenarios, most markedly under SSP5-8.5. The severity of the temperature signal in the SSP5-8.5 scenario suggests a thermal stress level that may exceed the adaptive capacity of traditional bioclimatic design, establishing the climatic baseline for the robustness assessment in Section 3.2. In winter (June–August), the mean air temperature is projected to rise by about 0.8 °C (1.0 °C and 1.4 °C for maximum and minimum temperatures, respectively), while solar irradiance decreases only slightly, by about 3 Wh/m2; this warming is expected to reduce future heating energy consumption. In summer (November–January), the mean temperature rises by about 1.1 °C with no change in solar irradiance; the accompanying increase in minimum and maximum temperatures (around 0.6 °C and 1.3 °C, respectively) is expected to reduce the potential for night ventilation and worsen summer comfort conditions.
Figure 3.
(a) Monthly mean air temperature (°C) and (b) global solar irradiance on a horizontal surface (Wh/m2) for Santa Rosa city (TMY 2011–2025) and future scenarios SSP1-2.6, SSP2-4.5, SSP3-7.0, and SSP5-8.5. (c,d) Differences between future scenarios SSPs and the baseline period for the Future Weather Generator (1985–2014) in the mean monthly maximum and minimum air temperatures (°C) for Santa Rosa City.
The monthly variations in mean maximum and minimum temperatures in Figure 3c,d show that the largest seasonal change occurs in autumn (March–May), where maximum and minimum air temperatures increase by up to 3 °C, particularly under SSP5-8.5, raising the risk of overheating during this season. This finding expands the traditional “summer-only” focus of thermal resilience to include intermediate seasons, making the multi-objective approach even more relevant. The projected summer minimum air temperatures rising under SSP5-8.5 will reduce the diurnal temperature range, directly curtailing the convective potential of night natural ventilation, as the outdoor-indoor temperature gradient during the night is significantly reduced. This thermodynamic bottleneck explains the severe erosion of Heat Index Safe Hours () in the future, as the building’s thermal mass cannot be fully discharged.
3.2. Identification of Candidate Retrofit Solutions Under Present Climate Baseline
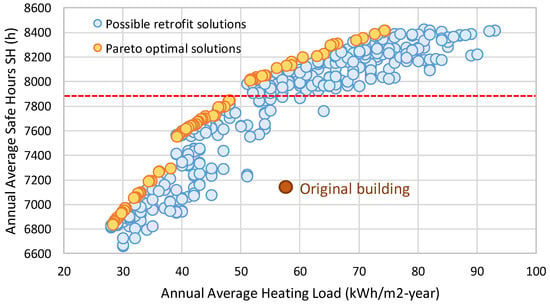
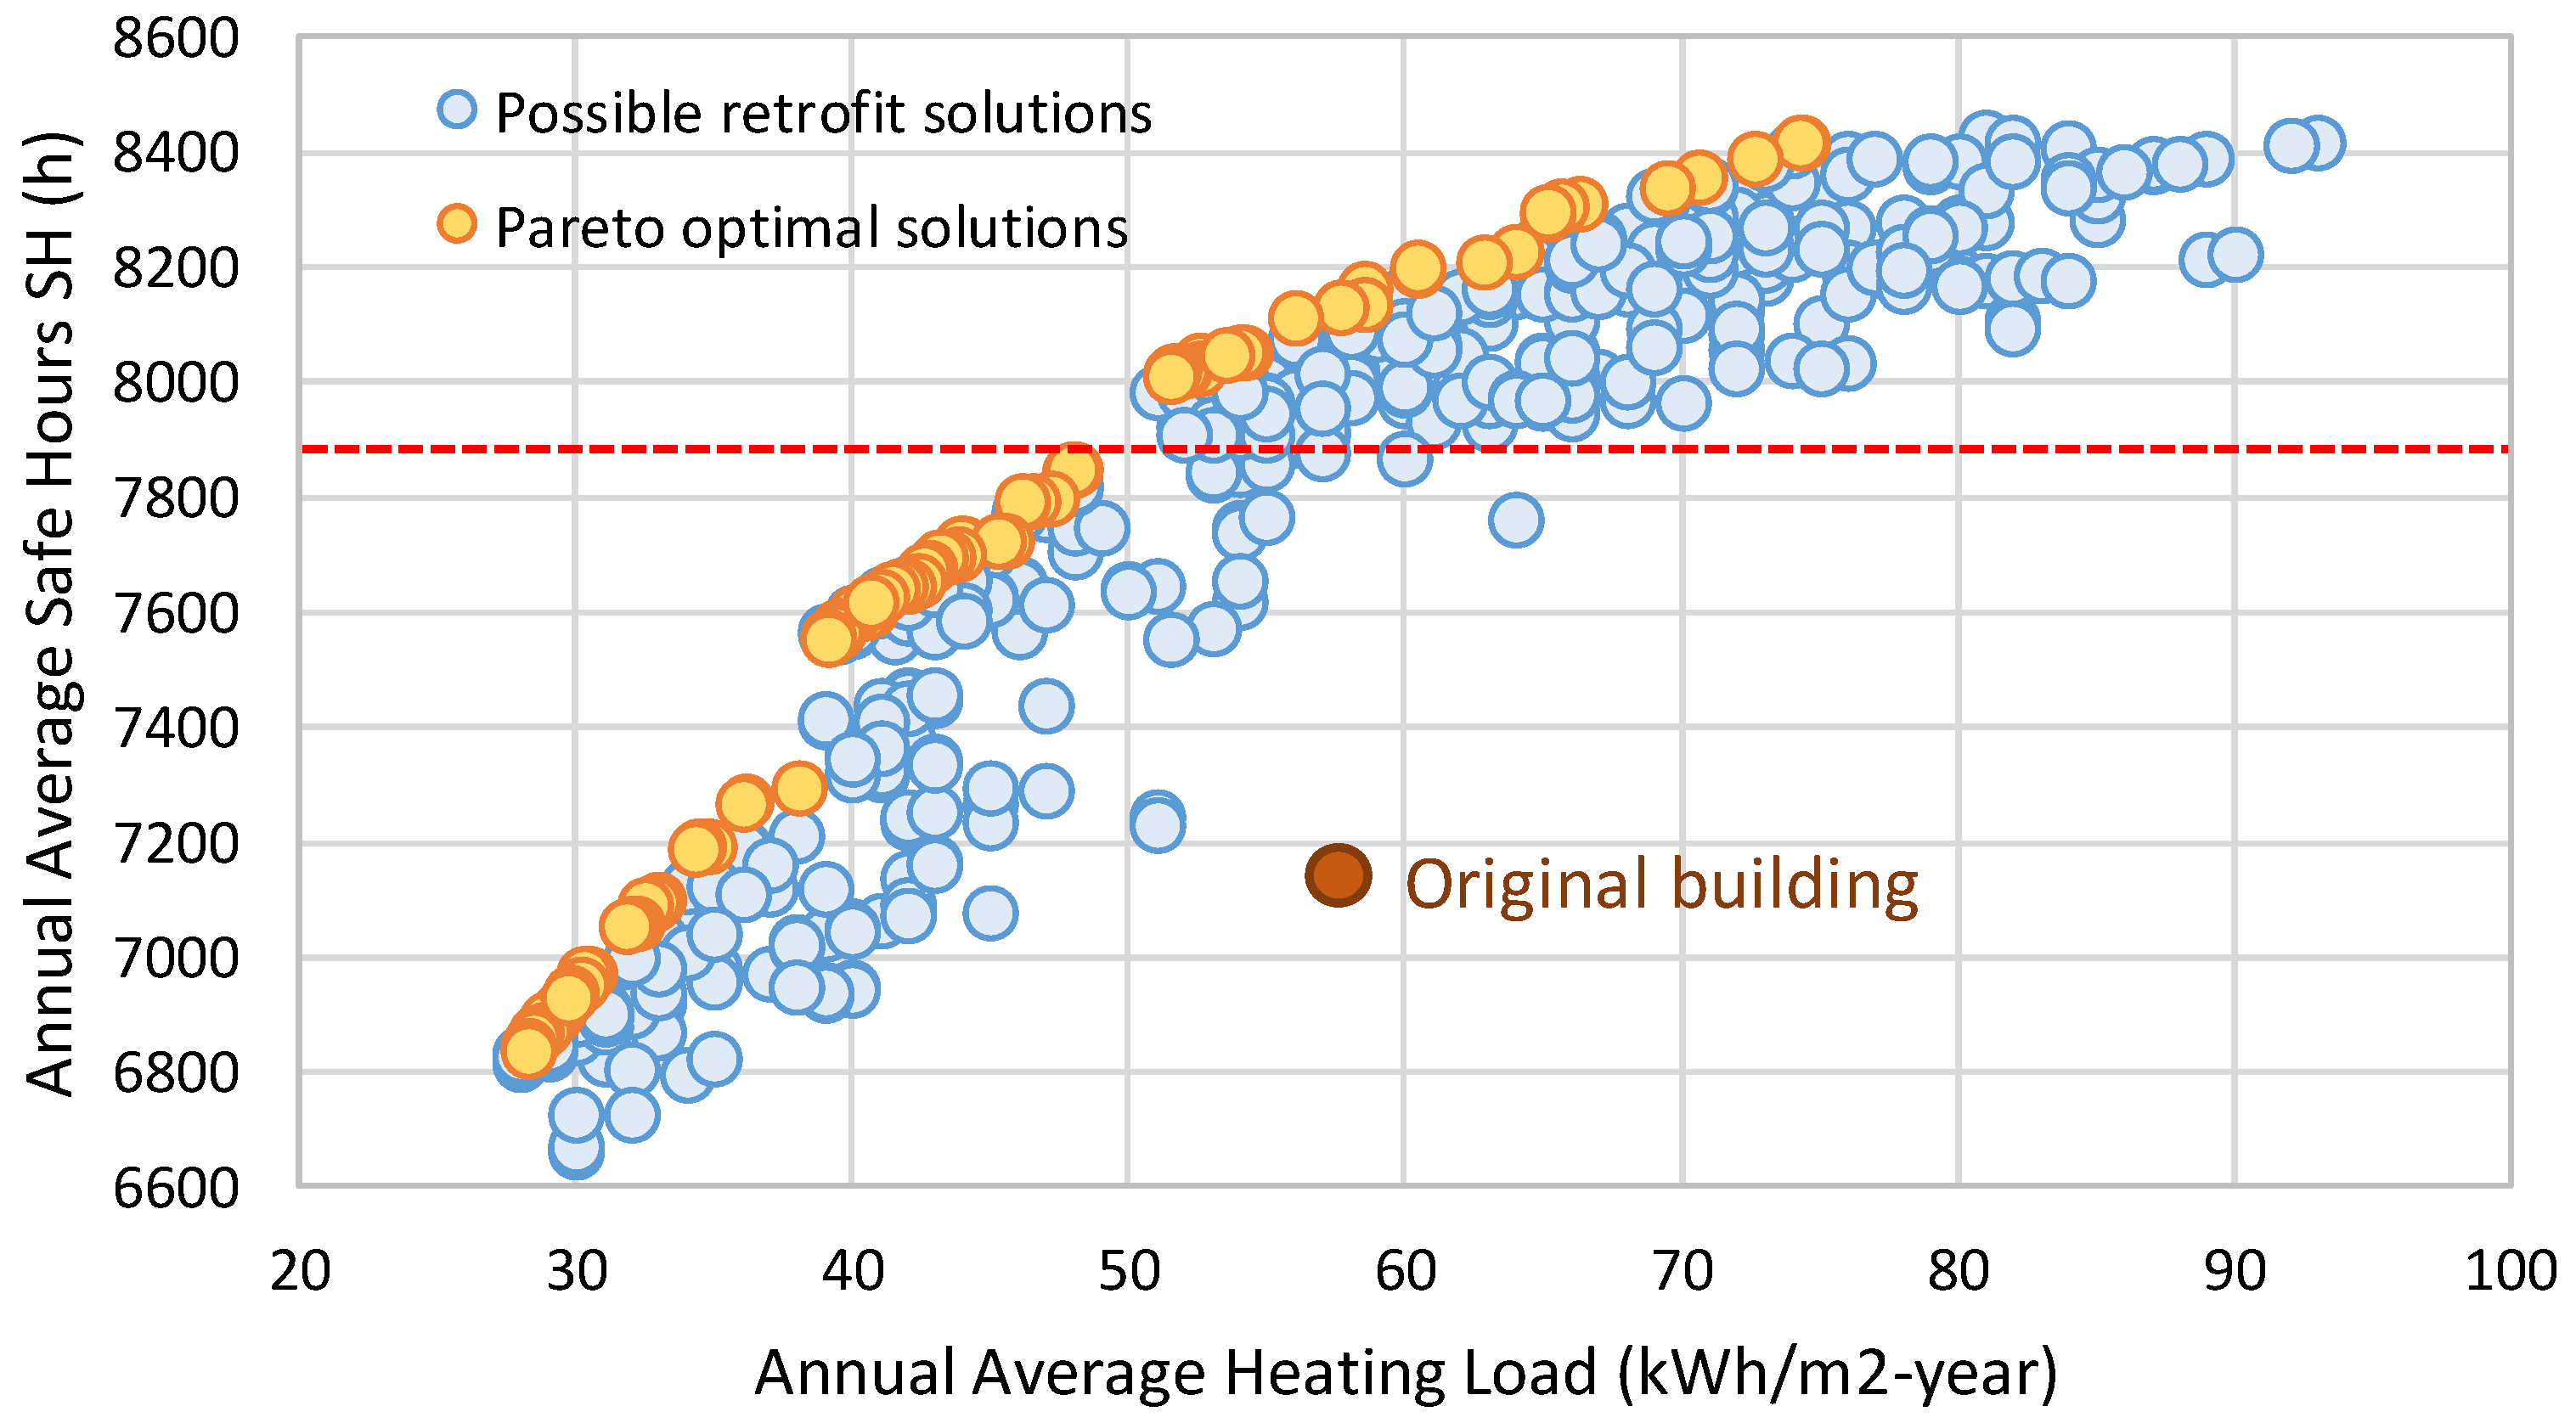
Figure 4 shows the results of the multi-objective optimization for present-day weather, with ranging roughly from 6600 to 8450 h and from 28 to 93 kWh/m2. The Pareto front confirms that the two objectives cannot be optimized simultaneously: higher Safe Hours can only be achieved at the expense of a higher Heating Load. This behavior aligns with findings by [20], who demonstrated that energy efficiency measures targeting heating demand reduction can inadvertently compromise summer thermal safety, even in temperate climates. Solutions with > 7884 h (red dashed line in Figure 4) are selected, corresponding to less than 10% annual overheating hours. In particular, the non-retrofitted building design (brown dot: 58.3 kWh/m2-year; 7142 h) is located far from the Pareto front and fails to meet the safety threshold of > 7884 h, confirming that the building is currently overheated and that improved designs exist.
Figure 4.
Results of the NSGA-II optimization of the building design for present-day weather (TMY 2011–2025). The optimal Pareto front is shown in yellow, and the original non-retrofitted building is shown in brown. The red dashed line corresponds to the limit of 7884 h (10% annual overheating hours).
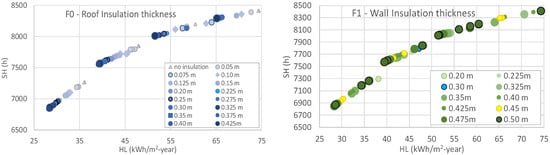
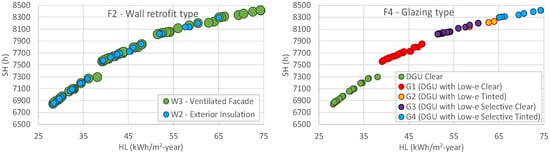
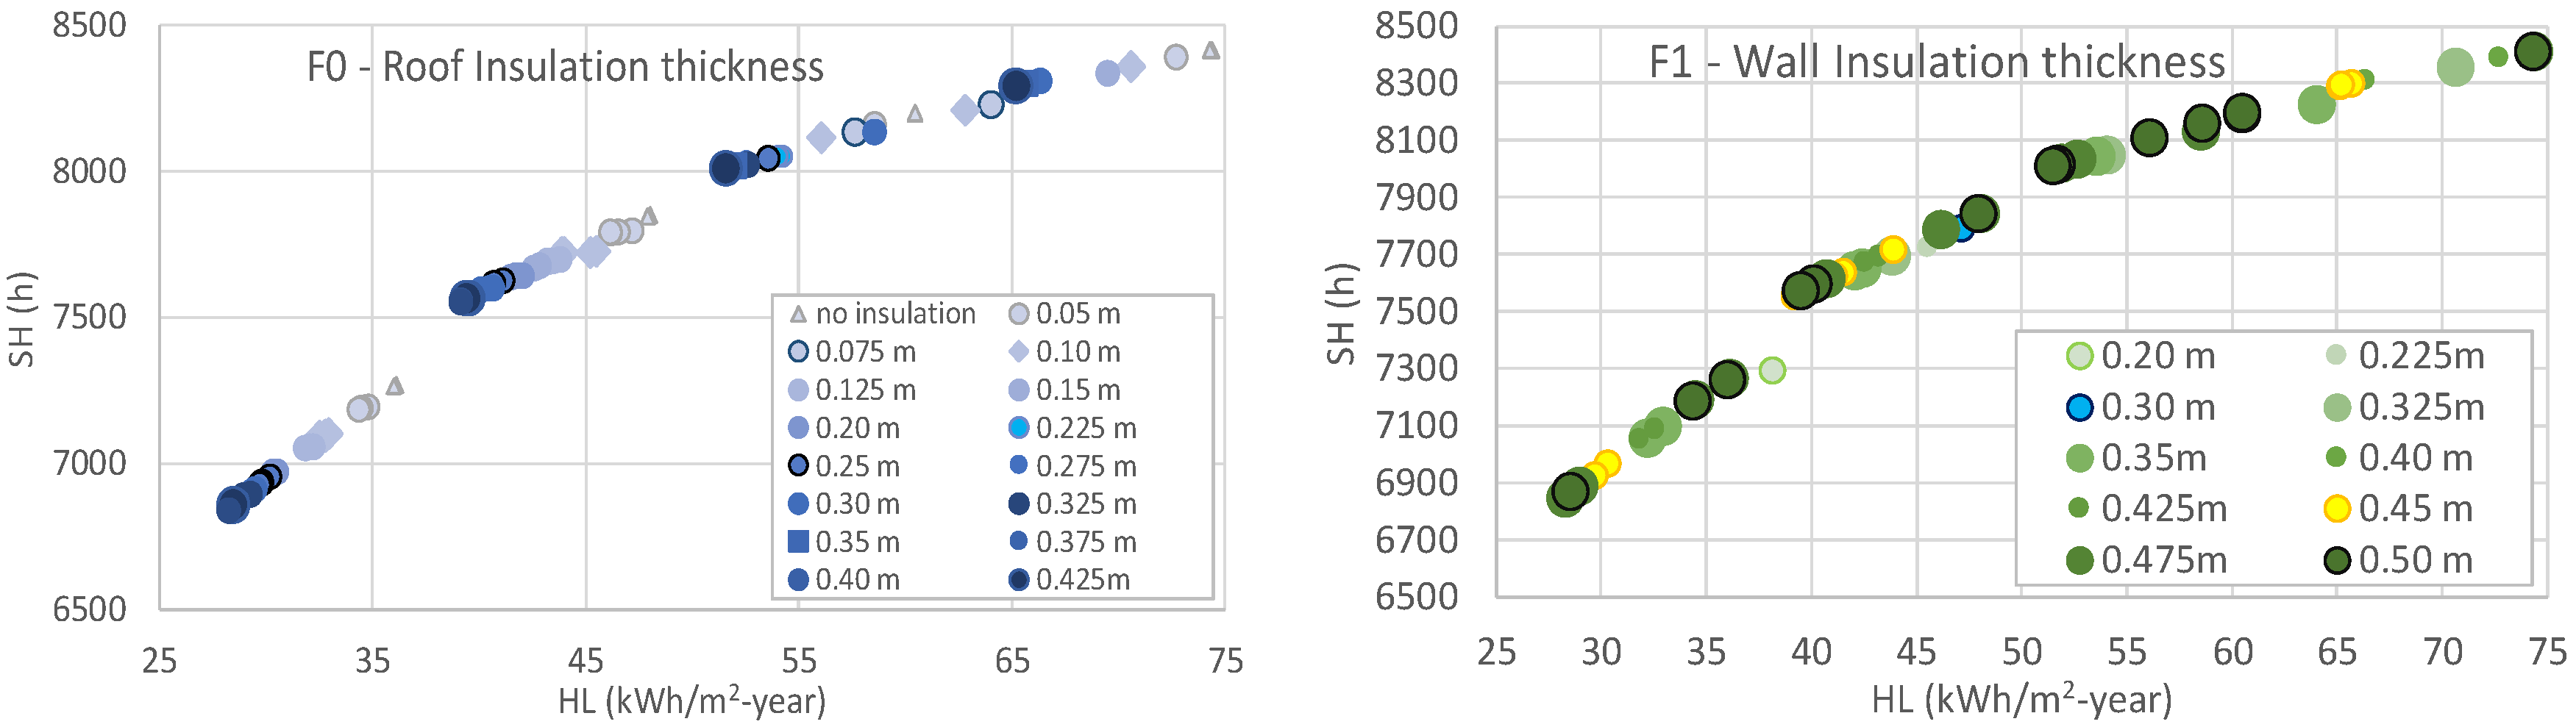
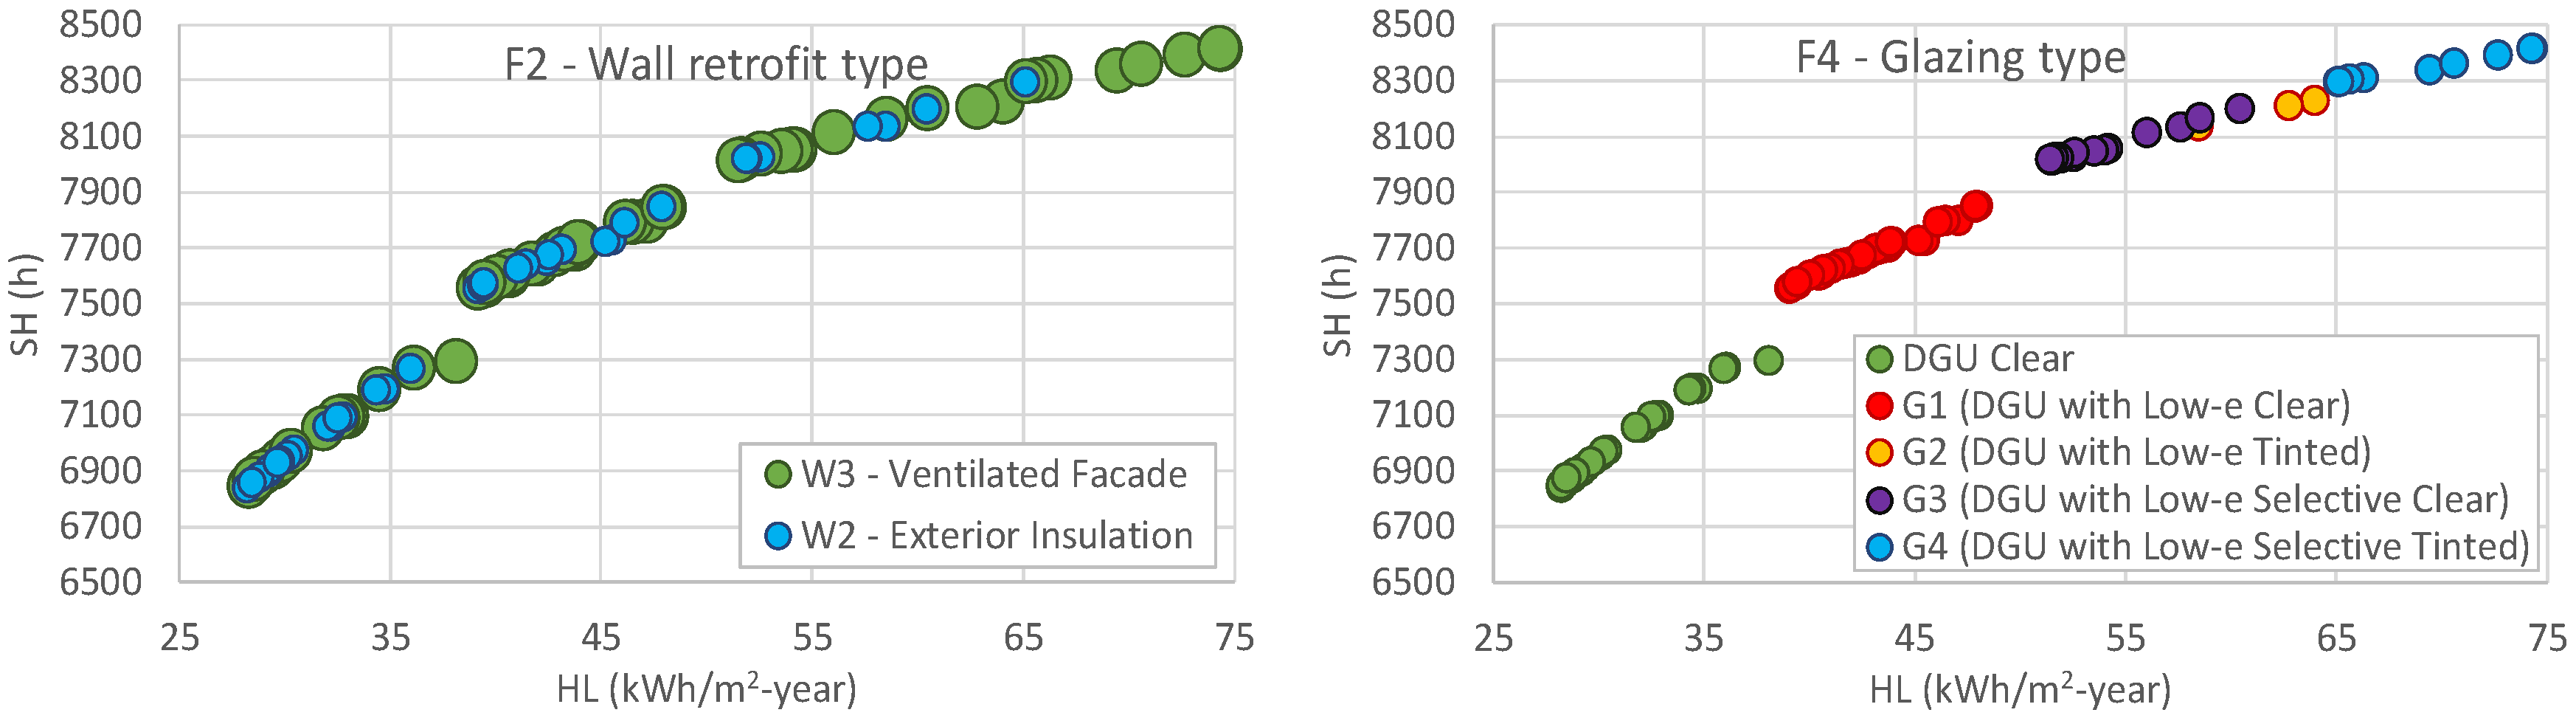
Figure 5 disaggregates the Pareto front by decision parameter. For the roof (F0, F3), the optimal parameter F3 was always R3 (radiative rooftop coating plus an insulated air space, Table 6), while the optimal insulation thickness F0 ranged from 0.025 to 0.475 m: thicker insulation favors winter performance (lower ), whereas thinner insulation favors summer Safe Hours. For the walls (F1, F2), the two optimal retrofit types were W2 and W3, both exterior facade retrofits, with insulation thickness varying from 0.2 to 0.5 m. For glazing (F4), the current clear DGU glazing minimizes the heating load but at the cost of summer overheating; avoiding overheating ( > 7884 h) requires replacing it with tinted or spectrally selective glazing (G2–G4). While the original building’s clear double-glazing (G0) minimizes the Annual Heating Load, it fails to provide adequate protection against summer overheating.
Figure 5.
Pareto front resulting from the NSGA-II optimization of the building design for present-day weather (TMY 2011–2025), differentiated by parameters: F0 (roof insulation thickness), F1 (wall insulation thickness), F2 (wall retrofit type), and F4 (glazing type).
Filtering the 91 Pareto solutions to those satisfying > 7884 h leaves 27 solutions (about 30% of the front) with heating load ranging from about 52 to 75 kWh/m2-year, which is carried forward to the future-scenario evaluation in Section 3.3. However, most of these present-day optimal solutions could not maintain this performance under future climate, underscoring the need to jointly consider present and future conditions when selecting a retrofit strategy.
3.3. Pareto Evolution and Multi-Scenario Robustness
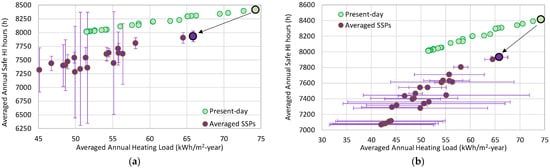
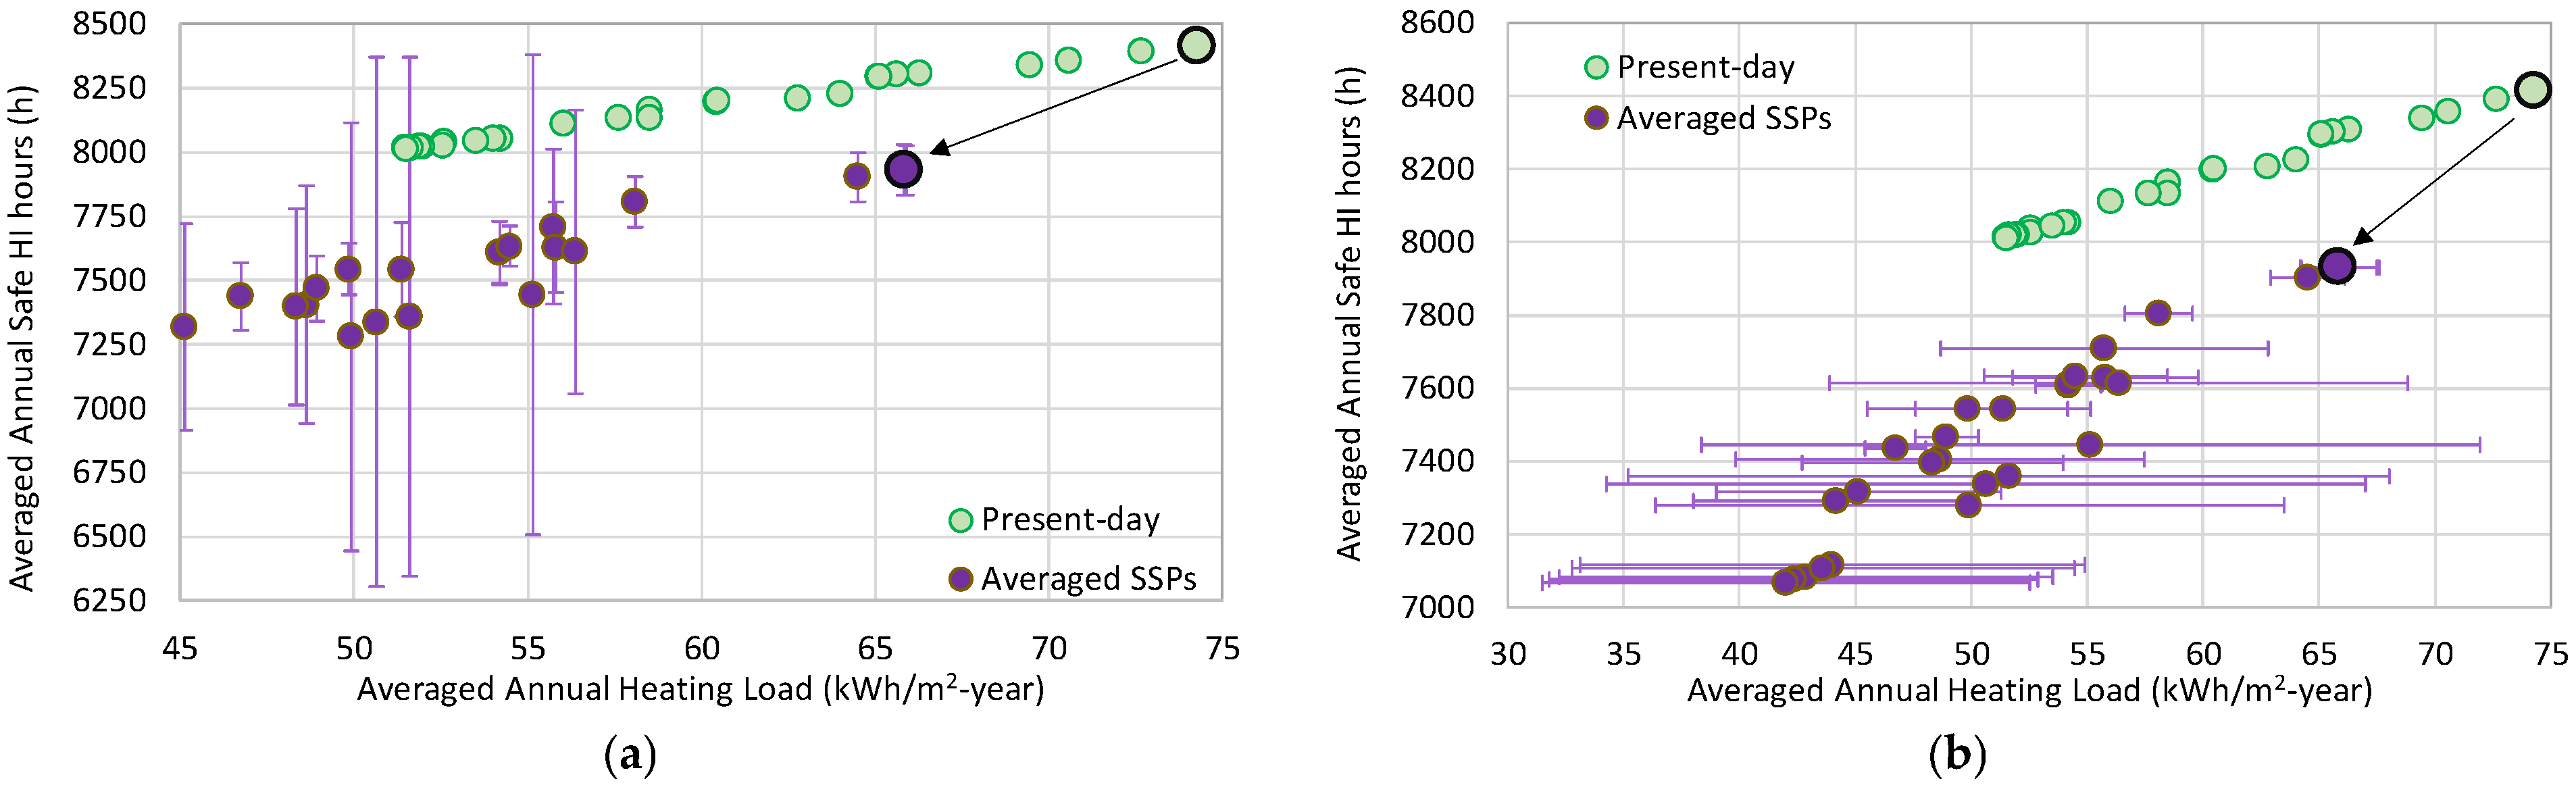
The 27 averaged Pareto-optimal solutions, together with their corresponding Standard Deviations, scores, and final ranking, are shown in Table 7. Their evolution toward the 2050 horizons, shown in Figure 6, reveals a clear shift toward the left (lower ) and downward (lower ) in the objective space, consistent with the approximately 0.8 °C winter warming and 0.6–1.3 °C summer warming reported in Section 3.1, which respectively reduce heating degree-hours and erode the potential for night-ventilation cooling. This behavior is consistent with the findings of [18], who reported that global warming shifts optimal design frontiers toward regions of increased thermal risk, where energy efficiency measures focused strictly on winter performance may inadvertently exacerbate summer overheating. The vertical and horizontal error bars in Figure 6 quantify the variability introduced by climate-model uncertainty across the four SSP scenarios. The solutions with smaller SD are more robust to this uncertainty. Notably, this downward dispersion in Safe Hours is driven primarily by SSP5-8.5, under which none of the 27 present-day-robust solutions remain above the safety threshold ( > 7884 h).
Table 7.
Averaged Pareto-optimal solutions for the studied building (Annual Heat Load and hours in Safe conditions ) with their corresponding Standard Deviations SD, individual rankings, weights calculated through Equation (1), composite score, and final ranking. In gray, the optimal solution.
Figure 6.
(a,b) Retrofit Pareto solutions for present climate (green) with > 7884 h and averaged Pareto solutions for future climate (SSP1-2.6, SSP2-4.5, SSP3-7.0, and SSP5-8.5). The optimal solutions obtained through the R-method are rounded by dark circles and arrows going from present to future scenarios. The vertical and horizontal bars indicate the Standard Deviation of and , respectively.
The R-method ranks Solution N°26 (F0 = 0 m, F1 = 0.50 m, F2 = W3, F3 = R3, F4 = G4) as the best compromise: a ventilated façade with 0.5 m external insulation (W3), a radiative rooftop coating with an additional uninsulated air space (R3), and Low-e spectrally selective, tinted DGU glazing (G4). A sensitivity analysis was conducted on the R-method weights to evaluate the stability of the selection. Reversing the priority, that is, assigning w = 0.6 to Heating Load and w = 0.4 to Safe Hours, results in the selection of Solution N°1. Although Solution N°1 reduces the average to 42.0 kWh/m2-year, its future thermal safety performance drops to an average of 7067 Safe Hours, failing to meet the mandatory health-related threshold of > 7884 h. This demonstrates that prioritizing heating efficiency compromises occupant health in the absence of active cooling.
Averaged across the four SSP scenarios, the optimal solution N°26 reaches a heating load of (65.8 ± 1.7) kWh/m2-year and (7932 ± 97) Safe Hours, a 36% increase in heating load and a 29% increase in Safe Hours relative to the future performance of the non-retrofitted building, a compromise well suited to a building with gas heating but no mechanical cooling, where winter discomfort can be corrected at moderate cost but summer overheating cannot.
To evaluate the climate robustness of the optimal retrofit strategy, the thermal performance of the optimal retrofit solution across the present-day baseline and the four projected 2050 emission pathways are summarized in Table 8. Under current climatic conditions, this strategy achieves a safety level with 8415 Safe Hours () and an Annual Heating Load () of 74.3 kWh/m2·year. When subjected to the 2050 horizons, the solution exhibits a clear translation in the objective space: winter warming of approximately 0.8 °C drives a systematic reduction in heating energy requirements, whereas higher summer and autumn temperatures cause a decline in Safe Hours.
Table 8.
Thermal performance and climate sensitivity of the optimal retrofit Solution N°26 across present and future (2050) scenarios, together with the Heating Degree Days (HDD, base 18 °C) and Cooling Degree Days (CDD, base 24 °C) for present and future scenarios.
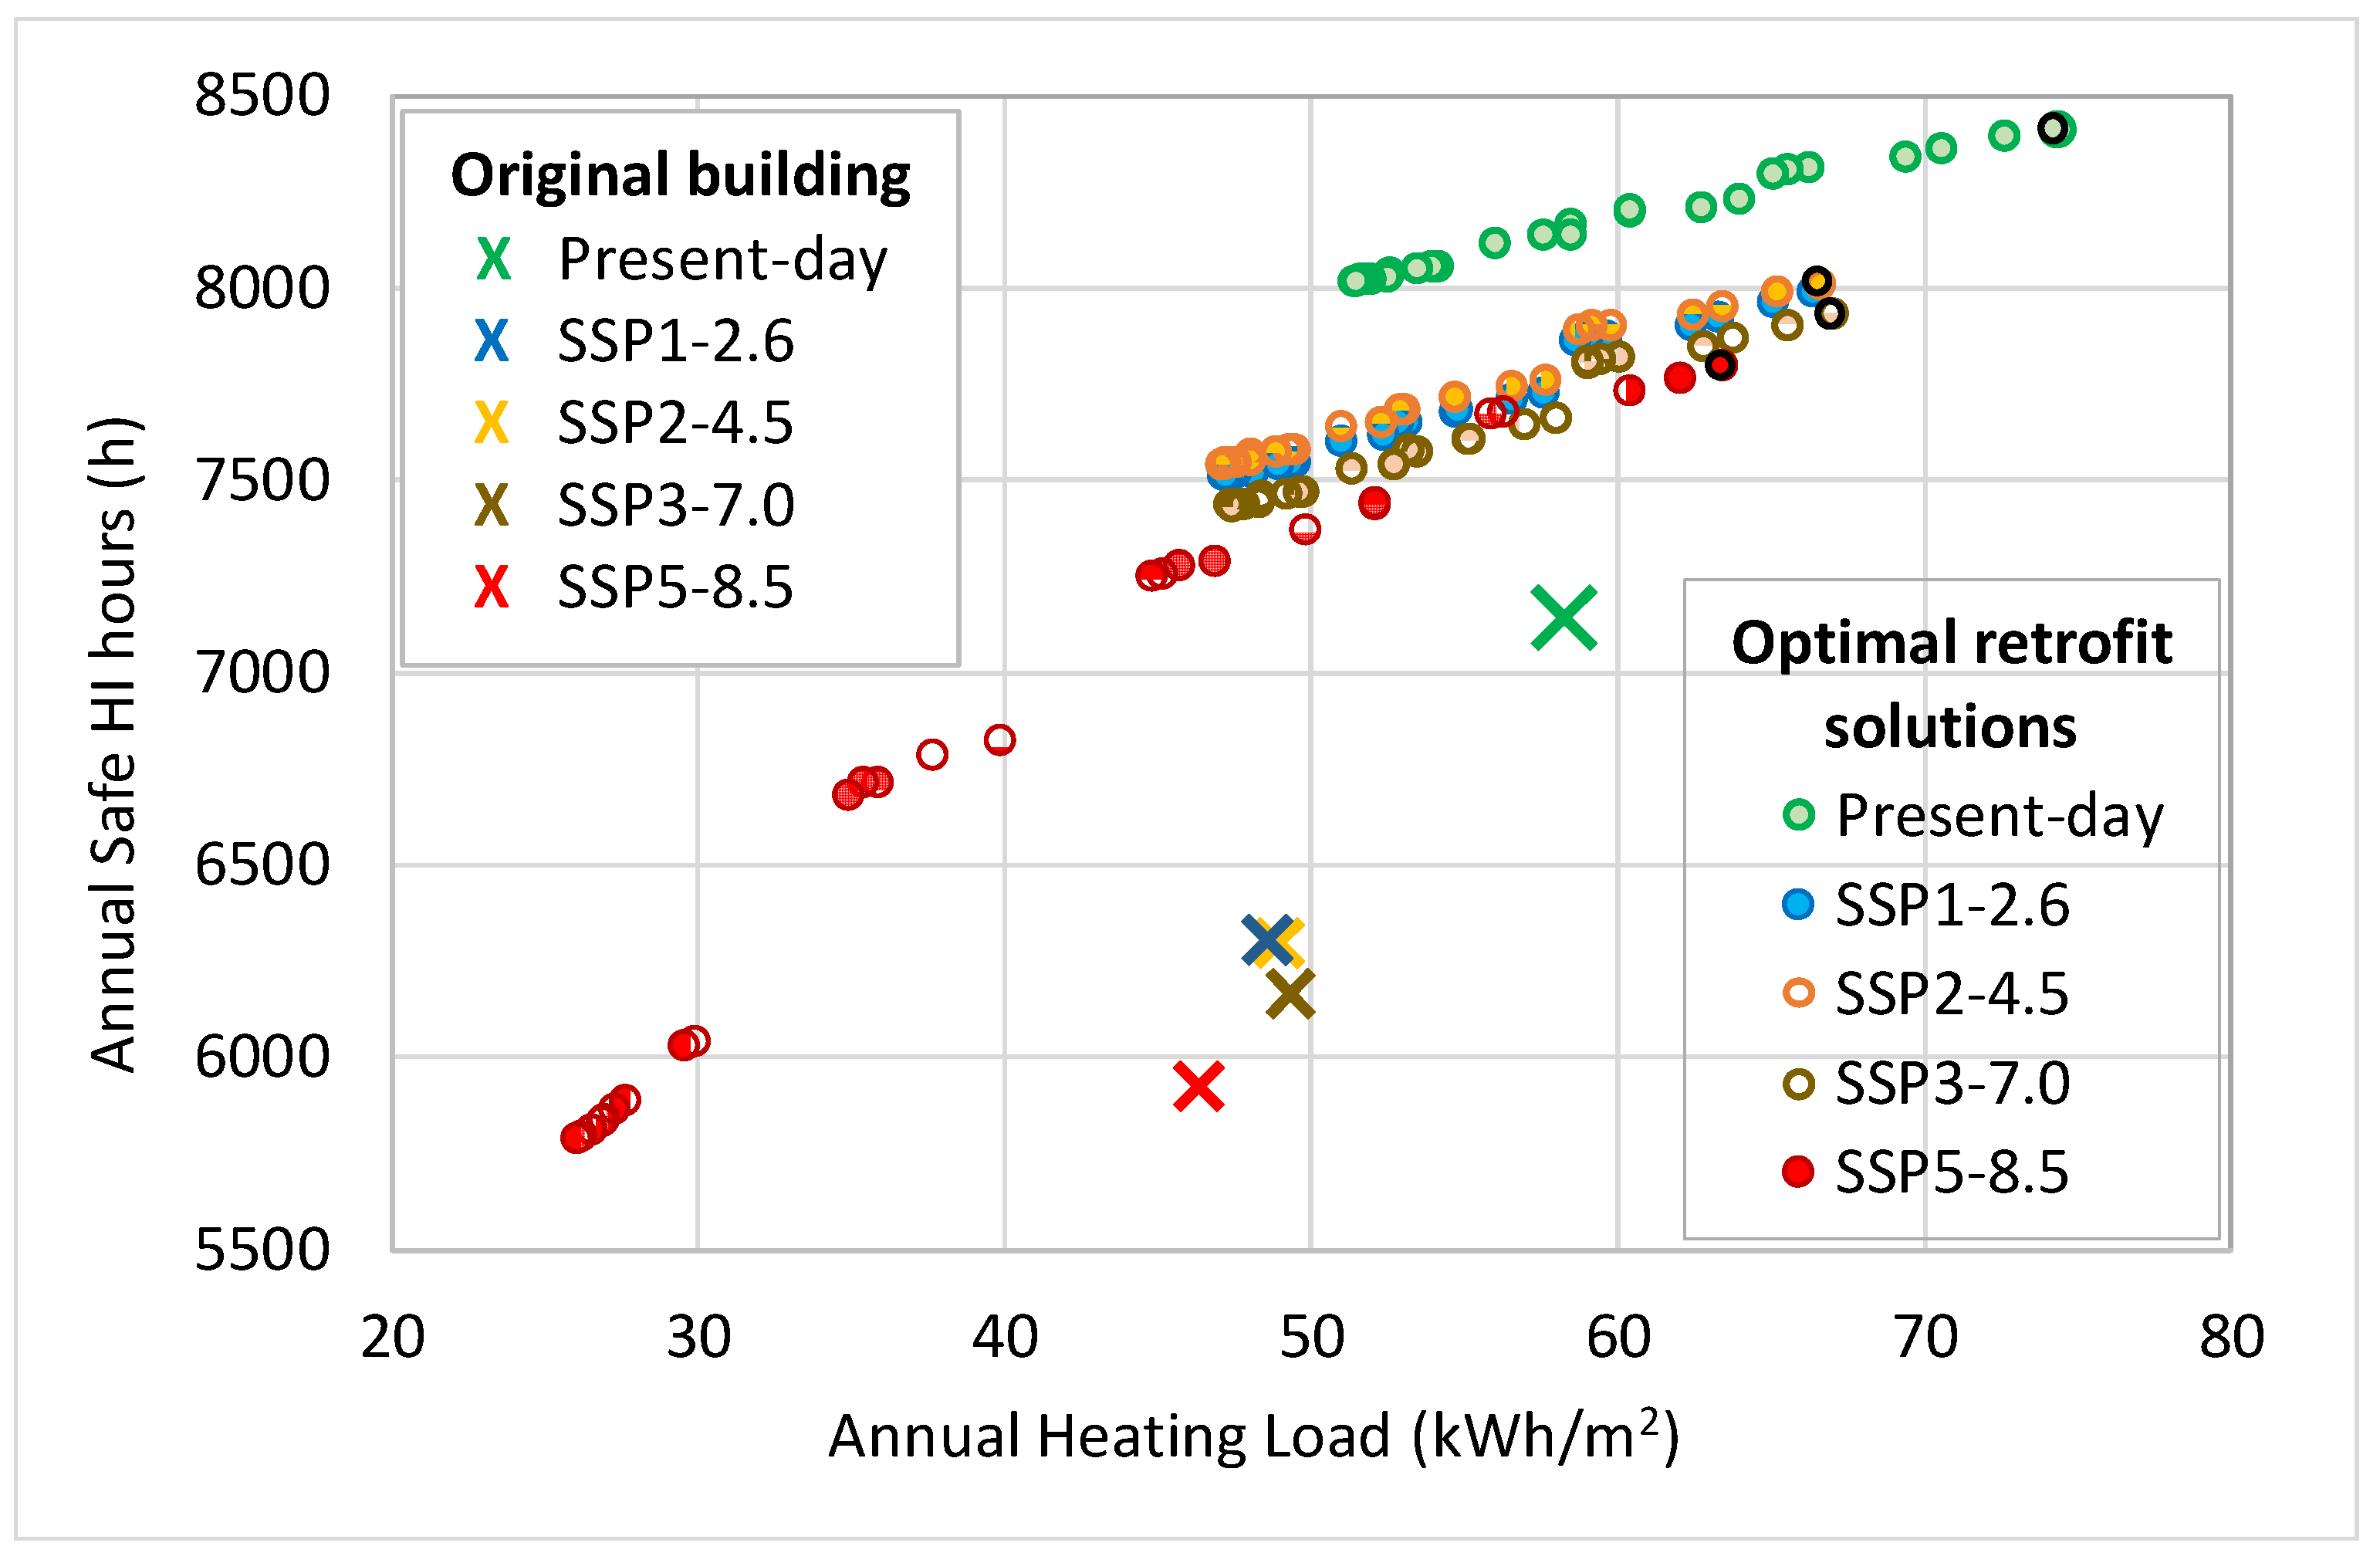
Under the moderate warming scenarios (SSP1-2.6, SSP2-4.5, and SSP3-7.0), the envelope-level modifications remain highly effective, maintaining indoor safety, with below 67.0 kWh/m2-year and staying above 7930 h. However, under the extreme SSP5-8.5 scenario, although further decreases to 63.4 kWh/m2-year, drops to 7796 h, failing to meet the safety threshold. This confirms that while passive envelope measures are highly robust against moderate warming, they hit an adaptive limit under extreme pathways, necessitating mechanical cooling support. Thus, the theoretical sensible cooling demand rises from 29.8 kWh/m2-year to a maximum of 48.3 kWh/m2-year under SSP5-8.5, confirming that summer thermal stress becomes thermodynamically significant and validating our methodological focus on maximizing Heat Index Safe Hours to ensure passive thermal safety.
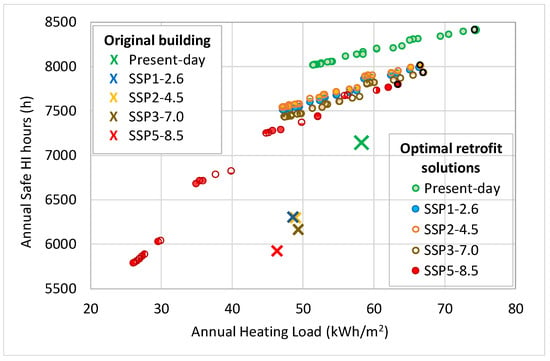
Figure 7 shows the 27 solutions by individual scenario rather than by their average. The solution set shifts left and down under all four scenarios, most severely under SSP5-8.5, consistent with its markedly higher year-round temperatures (Section 3.1). As explained before, under SSP1-2.6, SSP2-4.5, and SSP3-7.0, the optimal Solution N°26 avoids overheating. Critically, under SSP5-8.5 none of the 27 solutions avoids overheating. Notably, this is not a shortcoming specific to Solution N°26, since none of the 27 candidate solutions remain above the threshold under this scenario, meaning that while the proposed passive retrofits are robust under moderate global warming, the severity of the SSP5-8.5 signal exceeds the adaptive capacity of passive envelope measures alone, eventually requiring mechanical cooling support.
Figure 7.
Filtered retrofit strategies for present climate (green) and future climate (SSP1-2.6, SSP2-4.5, SSP3-7.0, and SSP5-8.5). The optimal solution obtained by the R-method is rounded by a dark circle (see Table 8).
Two mechanisms help explain this pattern. First, the decrease in Safe Hours is consistent with the higher summer nighttime minimum temperatures reported in Section 3.1, which reduce the cooling effect of passive night ventilation on heat accumulated during the day. Second, although global solar irradiance remains comparatively stable across the 2050 horizon (Section 3.1), glazing choice still proved decisive for climate robustness: with rising dry-bulb temperatures but roughly constant solar forcing, replacing the present clear glazing with a tinted, spectrally selective option (G2–G4, lower Solar Heat Gain Coefficient, SHGC) limits the additional solar heat gains that would otherwise compound the reduced night-ventilation effect, helping the selected solution remain above the safety threshold under the three moderate-warming scenarios. This is consistent with [21], which found that lower-SHGC glazing was part of the most balanced and lowest-risk retrofit solutions for the more solar-exposed rowhouse units in their study, although their more sheltered interior units tolerated moderately higher SHGC without a significant overheating penalty. It is also consistent with the broader finding that low-SHGC, low-U-value glazing improves building performance under future climate across multiple climate zones [22]. In this case study, the building’s north-facing glazing (Section 2.2.1), designed originally to maximize winter solar gain, is precisely the element that must now balance that same gain against summer overheating risk.
The progressive shift in the Pareto-optimal solutions toward the region of increased summer thermal risk strongly aligns with the recent international literature. Specifically, Adhikari et al. [20] demonstrated a similar behavior in non-air-conditioned Baltimore rowhouses, where envelope retrofits optimized strictly under present-day weather suffered a severe 140–421% increase in future overheating degree-hours, highlighting the critical danger of ‘winter-biased’ optimization in temperate regions. While their study reported a marginal 3–6% future reduction in heating energy for designs optimized for late-century conditions, the solution obtained in the present study achieves a far more balanced compromise under the 2050 ensembles, with a 29% increase in Safe Hours and a 36% increase in heating loads compared to the future un-retrofitted baseline.
Furthermore, the decisive role of low-SHGC glazing (G4) and ventilated facade (W3) found in this research is in line with Shen et al. [22], who identified advanced solar-control glazing and dynamic wall cavities as the most resilient passive strategies across mid-latitude climates. The decision-making process in this research, which integrates the Standard Deviations of multi-scenario re-simulations via the R-method, also agrees with the design philosophies discussed in [18].
3.4. Economic Assessment
Under the extreme macroeconomic volatility in Argentina, long-term financial forecasting (e.g., payback periods or life-cycle costs) would be highly speculative (i.e., fixed charges of residential gas tariffs in Santa Rosa rose by up to 2403% in 2024 alone [52], due to rapid regulatory shifts, monthly indexation of the PIST-Price at the Entry Point to the Transportation System-gas price, and drastic subsidy reductions). Therefore, in this research, the economic assessment exclusively included the capital cost of the optimal retrofit strategy (Solution N°26: 0.50 m insulated ventilated façade W3, radiative roof coating with ceiling air gap R3, and Low-E spectrally selective tinted glazing G4). Deploying public capital funds to upgrade the thermal envelope does not contradict the financial reality that vulnerable student residents cannot afford monthly air-conditioning bills. Because the university operates as a public state institution, it does not seek a direct monetary return on this investment; rather, it prioritizes its social return by reducing occupants’ exposure to thermal stress and associated health risks. Therefore, based on updated material unit rates (125.0 US$/m2 for W3 with 0.50 m EPS cladding, 40.0 US$/m2 for R3 cool roof assembly, and 180.0 US$/m2 for G4 spectrally selective glazing), the total capital investment for the 350 m2 university residence block was calculated at $31,000 US$. This corresponds to a specific retrofit cost of $88.6 US$/m2 of useful floor area ($5167 US$ per apartment), assuming ventilated cladding applied to the most thermally vulnerable East and West orientations.
Comparing these economic metrics with the prior regional energy retrofit literature reveals financial consistency and feasibility. For example, in the multivariate retrofit evaluation of Argentine social housing by Filippín et al. [53], vertical envelope retrofits ranged from $39.5 US$/m2 (W4 COAT base) to 97.0 US$/m2 (W2 double wall), representing a specific investment intensity of 71.9–176.6 US$/m2 of useful floor area for single-family prototypes, while full bioclimatic retrofits accounted for approximately 11.8% of initial construction costs (70–90 US$/m2). The specific cost of Solution N°26 (88.6 US$/m2) falls directly within this historical benchmark. This demonstrates that deploying advanced passive cooling strategies—specifically solar-control spectrally selective glazing and dynamic ventilated cavities—is economically comparable to traditional heavy thermal insulation measures while delivering vastly superior thermal safety and preventing severe summer overheating under mid-century CMIP6 climate projections.
3.5. Limitations of the Study
This study relies on Typical Meteorological Years (TMY) for both present-day and future weather representation, an approach that inherently averages out inter-annual variability and does not reproduce extreme events such as heatwaves. In addition, using TMYs can underestimate peak cooling loads relative to extreme-conditions files and underestimate indoor thermal stress hours compared with representative climate years that embed detected historical extremes. Furthermore, the morphing procedure used to generate future weather files, while based on a carefully selected high-resolution GCM ensemble and a period-consistent baseline, represents the central climate tendency only, and it does not resolve future changes in inter-annual variability, extreme-event frequency, or inter-variable consistency. In addition, the four future SSP scenarios were treated as equally probable in the averaging step, which is itself a simplifying assumption. Urban microclimate and urban heat island effects, which can further amplify local overheating risk, were also not represented.
Another limitation is that the proposed framework was demonstrated on a single building typology, with a retrofit decision space deliberately restricted to passive envelope measures (wall and roof insulation, glazing, and night ventilation). Two important factors were deliberately excluded given the variable income and high turnover of the student population: active cooling and occupant behavior. In the first case, the present results confirmed that no combination of the passive retrofit strategies evaluated avoided overheating under the most severe scenario (SSP5-8.5), so excluding active cooling and its impact on energy consumption could result in an under-optimized solution. If active cooling were to be integrated, the cooling energy consumption could be optimized as a third objective function, balancing the cooling energy penalty against passive thermal safety. In the second case, the potential behavioral adaptation of users to a changing climate was not captured.
The objective weights used in the R-method (0.6 for Safe Hours, 0.4 for Heating Load) reflect a single decision-maker’s judgment for this specific building and occupant profile; other stakeholders could reasonably assign different priorities. Finally, only two performance objectives, heating load and thermal safety, were optimized; retrofit cost and embodied carbon, which materially affect real-world implementation decisions, were not included in the case study demonstration.
4. Conclusions
This study confirms that optimal retrofit solutions derived under current-climate conditions cannot be assumed to remain optimal under future climate scenarios. To address both present and future weather without the computational burden of repeating a full multi-objective optimization for each climate horizon, this work proposed a simplified Pareto-evolution framework: the genetic-algorithm search (NSGA-II) is performed only once, under present-day weather, and the resulting Pareto-optimal solutions are subsequently re-simulated, rather than re-optimized, under four future IPCC CMIP6 scenarios (SSP1-2.6, SSP2-4.5, SSP3-7.0, and SSP5-8.5). This reduced the number of full optimization runs required from one per climate horizon to a single run, and a 75% reduction in computational optimization time was achieved.
Applied to an existing university residence in Santa Rosa, La Pampa, the framework showed that a range of present-day retrofit strategies achieved a substantial reduction in overheating (Safe Hours above the 7884 h threshold) with only a moderate increase in heating load; however, most of these strategies failed to maintain that performance once re-evaluated under future climate, particularly under the more severe SSP5-8.5 scenario, where no combination of the evaluated passive measures fully prevented overheating. This result is in line with the results of the literature that envelope-level renovation alone may be insufficient to fully eliminate overheating risk and that active cooling, while effective, carries a substantial energy penalty, in accordance with [54]. In this study, the retrofit strategies that remained more robust across present and future climates were consistently those that minimize heat gains: ventilated façades, additional roof insulation, and heat-mirror (spectrally selective) glazing. The optimal solution selected by the R-method increased future Safe Hours by 1760 h (29%) and heating load by 36% relative to the non-retrofitted building, a compromise that is justified given the building’s reliance on gas heating, where a moderate cost increase is manageable, and its complete lack of mechanical cooling, where overheating poses a direct health risk under the projected hotter summers.
The case study presented serves as a demonstrative proof of concept for the proposed framework. The decision to restrict the optimization variables to passive envelope measures reflects the specific free-running nature and budget constraints of the university student residence evaluated. This application choice does not constitute a limitation of the framework itself, which can seamlessly accommodate additional or alternative objective functions—such as active cooling demand or life-cycle costs—for buildings equipped with mechanical HVAC systems.
An important lesson learned from this study is that building design and retrofit must consider present and future weather. This bioclimatic building–and similarly other bioclimatic buildings designed in Argentina–prioritized winter conditions because decreasing heating loads was the dominant design objective and past meteorological records showed cooler summers amenable to night ventilation. However, in the present day and more markedly in the near future, indoor overheating is a concern as it will be driven mainly by the higher air temperatures in summer and in the intermediate seasons in the future scenarios. Therefore, the same design decisions that once optimized winter performance, North orientation and extensive glazed areas, are proving detrimental to present and future thermal behavior, underscoring that climate-adaptive design cannot rely on historical weather data alone.
The proposed framework offers a practical decision-support tool for selecting retrofit strategies that remain effective throughout a changing climate, rather than strategies optimized for a climate that will have already shifted by the time they are implemented.
To enhance the practical applicability of the proposed framework, future iterations can directly integrate (i) economic and environmental metrics, such as initial retrofit cost and life-cycle embodied carbon, by adding them as third and fourth objective functions in the initial NSGA-II run; (ii) occupant behavior, by replacing static schedules with stochastic occupancy profiles in EnergyPlus to capture user-adaptive actions like dynamic shading or occupant-driven window opening; and (iii) active cooling, by introducing a mixed-mode cooling schedule where active cooling is triggered only when indoor temperatures exceed the adaptive comfort envelope, allowing the optimization of hybrid cooling energy consumption.
Future extensions of this framework could replace or complement the TMY-based assessment with a Representative Meteorological Year (RMY) that embeds statistically detected historical extreme events, heat waves and cold spells, into the representative year while preserving its long-term statistical properties. As a lower-cost intermediate step, the “warmest year” output already available in Future Weather Generator could be used to test the final selected solutions. Coupling the building-scale simulation with urban microclimate or urban heat island models would also allow the framework to capture compounding local heat-stress effects not represented by site-level TMY files alone.
The main contribution of this investigation is a general decision-support framework that simplifies climate-adaptive building retrofit optimization. The case study in Santa Rosa demonstrates how the framework operates under strict passive and socio-economic constraints. However, because the framework is fully adaptable, future implementations can readily extend the decision space to include active cooling demand, renewable energy integration, thermal resilience, retrofit cost, and/or embodied carbon as additional optimization dimensions across evolving climate horizons.
Author Contributions
Conceptualization, S.F.-L. and C.F.; methodology, S.F.-L.; validation, C.F.; formal analysis, P.D.; data curation, P.D.; writing—original draft preparation, S.F.-L., C.F., and P.D.; writing—review and editing, P.D.; visualization, S.F.-L.; funding acquisition, S.F.-L. All authors have read and agreed to the published version of the manuscript.
Funding
This research was funded by the National University of Salta, CIUNSA A2909.
Data Availability Statement
The raw data supporting the conclusions of this article will be made available by the authors on request.
Acknowledgments
We thank the developers of the ‘Future Weather Generator’ and its funding institutions for making the application free and open to the public [https://future-weather-generator.adai.pt/ (accessed on 10 September 2026)].
Conflicts of Interest
The authors declare no conflicts of interest. The funders had no role in the design of the study; in the collection, analyses, or interpretation of data; in the writing of the manuscript; or in the decision to publish the results.
Abbreviations
| ASHRAE | American Society of Heating, Refrigerating and Air-Conditioning Engineers |
| CMIP6 | Coupled Model Intercomparison Project Phase 6 |
| CV | Coefficient of Variation |
| DGU | Double Glazing Unit |
| EPS | Expanded Polystyrene |
| EPW | EnergyPlus Weather |
| GCM | General Circulation Model |
| GRA | Gray Relational Analysis |
| HI | Heat Index, °C |
| HL | Annual Heating Load, kW/m2-year |
| HVAC | Heating, Ventilation, and Air Conditioning |
| IPCC | Intergovernmental Panel on Climate Change |
| LINMAP | Linear Programming Technique for Multidimensional Analysis of Preference |
| NMBE | Normalized Mean Bias Error |
| NSGA-II | Non-dominated Sorting Genetic Algorithm II |
| PMV | Predicted Mean Vote |
| PPD | Predicted Percentage Dissatisfied |
| RCP | Representative Concentration Pathways |
| RMS | Root-Mean-Square Error |
| SD | Standard Deviation |
| SH | Heat Index Safe Hours |
| SHGC | Solar Heat Gain Coefficient |
| SSP | Shared Socioeconomic Pathway |
| TMY | Typical Meteorological Year |
| TMYx | Typical Meteorological Year (Extended) |
| TOPSIS | Technique for Order of Preference by Similarity to Ideal Solution |
Appendix A
Table A1.
Comparative matrix of representative climate-adaptive building optimization frameworks.
Appendix B
Table A2.
Meteorological datasets, sources, periods, and technical roles across the research phases.
References
- IEA. World Energy Outlook 2025. 2025. Available online: https://www.iea.org/reports/world-energy-outlook-2025 (accessed on 14 September 2026).
- Santamouris, M.; Vasilakopoulou, K. Present and future energy consumption of buildings: Challenges and opportunities towards decarbonization. E-Prime-Adv. Electr. Eng. Electron. Energy 2021, 1, 100002. [Google Scholar] [CrossRef] [Scilit]
- IPCC. Sixth Assessment Report (AR6) of the Intergovernmental Panel on Climate Change. 2023. Available online: https://www.ipcc.ch/assessment-report/ar6/ (accessed on 14 September 2026).
- Mondal, N.; Anand, P.; Khan, A.; Georgescu, M.; Niyogi, D. Patterns, drivers, and trends of urban cooling demand across global cities. Nat. Commun. 2026, 17, 5455. [Google Scholar] [CrossRef] [Scilit]
- Khourchid, A.M.; Ajjur, S.B.; Al-Ghamdi, S.G. Building Cooling Requirements under Climate Change Scenarios: Impact, Mitigation Strategies, and Future Directions. Buildings 2022, 12, 1519. [Google Scholar] [CrossRef] [Scilit]
- Angeles, M.E.; González, J.E.; Ramírez, N. Impacts of climate change on building energy demands in the intra-Americas region. Theor. Appl. Clim. 2018, 133, 59–72. [Google Scholar] [CrossRef] [Scilit]
- Krelling, A.F.; Lamberts, R.; Malik, J.; Zhang, W.; Sun, K.; Hong, T. Defining weather scenarios for simulation-based assessment of thermal resilience of buildings under current and future climates: A case study in Brazil. Sustain. Cities Soc. 2024, 107, 105460. [Google Scholar] [CrossRef] [Scilit]
- Guarda, E.; Domingos, R.; Gabriel, E.; Durante, L.; Moreira, J.V.R.; Sanches, J. Use of thermal insulation in the envelope to mitigate energy consumption in the face of climate change for mid-western Brazil. IOP Conf. Ser. Earth Environ. Sci. 2020, 410, 012009. [Google Scholar] [CrossRef] [Scilit]
- Nunes, G.; Giglio, T. Effects of climate change in the thermal and energy performance of low-income housing in Brazil—Assessing design variable sensitivity over the 21st century. Renew. Sustain. Energy Rev. 2022, 168, 112885. [Google Scholar] [CrossRef] [Scilit]
- Santana Cruz, A.; López-Guerrero, R.E.; Freitas Mendes, V.; Castro Mendes, J.; Rosse Caldas, L.; Gonçalves Bastos, L.E. A simulation-based procedure for promoting climate-resilient building design in the global south context: The Latin America residential sector perspective. Energy Build. 2026, 353, 116915. [Google Scholar] [CrossRef] [Scilit]
- Coronato, T. Olas de Calor Estivales en el Centro-Este de Argentina: De la Física a Los Impactos. Ph.D. Thesis, Facultad de Ciencias Exactas y Naturales, Universidad de Buenos Aires, Buenos Aires, Argentina, 2022. Available online: https://bibliotecadigital.exactas.uba.ar/download/tesis/tesis_n7115_Coronato.pdf (accessed on 18 March 2024).
- Coronato, T.; Zaninelli, P.G.; Abalone, R.; Carril, A. Climate change projections for building energy simulation studies: A CORDEX-based methodological approach to manage uncertainties. Clim. Change 2024, 177, 43. [Google Scholar] [CrossRef] [Scilit]
- Flores-Larsen, S.; Filippín, C.; Barea, G. Impact of climate change on energy use and bioclimatic design of residential buildings in the 21st century in Argentina. Energy Build. 2019, 184, 216–229. [Google Scholar] [CrossRef] [Scilit]
- Sandberg, N.H.; Sartori, I.; Heidrich, O.; Dawson, R.; Dascalaki, E.; Dimitriou, S.; Vimm-r, T.; Filippidou, F.; Stegnar, G.; Zavrl, M.Š.; et al. Dynamic building stock modelling: Application to 11 European countries to support the energy efficiency and retrofit ambitions of the EU. Energy Build. 2016, 132, 26–38. [Google Scholar] [CrossRef] [Scilit]
- Li, J.; Zhai, Z.; Li, H.; Ding, Y.; Chen, S. Climate change’s effects on the amount of energy used for cooling in hot, humid office buildings and the solutions. J. Clean. Prod. 2024, 442, 140967. [Google Scholar] [CrossRef] [Scilit]
- EnergyPlus Software, V23.1.0; U.S. Department of Energy: Washington, DC, USA, 2024. Available online: http://www.eere.energy.gov/buildings/energyplus/ (accessed on 18 March 2024).
- Zhang, Y.; Jankovic, L. JEA, An Interactive Optimisation Engine for Building Energy Performance Simulation. In Proceedings of the IBPSA Building Simulation 2017, San Francisco, CA, USA, 7–9 August 2017; Available online: https://www.jeplus.org/wiki/lib/exe/fetch.php?media=docs:bs2017_607_interactive_optimisation_engine_final.pdf (accessed on 13 April 2026).
- Li, Z.; Zhao, Y.; Xia, H.; Xie, S. A multi-objective optimization framework for building performance under climate change. J. Build. Eng. 2023, 80, 107978. [Google Scholar] [CrossRef] [Scilit]
- Ascione, F.; Bianco, N.; De Masi, R.F.; Mauro, G.M.; Vanoli, G.P. Resilience of robust cost-optimal energy retrofit of buildings to global warming: A multi-stage, multi-objective approach. Energy Build. 2017, 153, 150–167. [Google Scholar] [CrossRef] [Scilit]
- Adhikari, R.; Gandara, G.; Sui, J.; Zuo, W. Balancing Energy Efficiency and Overheating Risks: Optimal Retrofit Pathways for Baltimore Rowhouses. In Proceedings of the 12th National Conference of IBPSA-USA SimBuild 2026, Minneapolis, MI, USA, 20–22 May 2026. [Google Scholar]
- Naderi, E.; Sajadi, B.; Behabadi, M.A.; Naderi, E. Multi-objective simulation-based optimization of controlled blind specifications to reduce energy consumption, and thermal and visual discomfort: Case studies in Iran. Build. Environ. 2020, 169, 106570. [Google Scholar] [CrossRef] [Scilit]
- Shen, P.; Braham, W.; Yi, Y.; Eaton, E. Rapid multi-objective optimization with multi-year future weather condition and decision-making support for building retrofit. Energy 2019, 172, 892–912. [Google Scholar] [CrossRef] [Scilit]
- Shen, P. Building retrofit optimization considering future climate and decision-making under various mindsets. J. Build. Eng. 2024, 96, 110422. [Google Scholar] [CrossRef] [Scilit]
- Shen, P.; Li, Y.; Gao, X.; Zheng, Y.; Huang, P.; Lu, A.; Gu, W.; Chen, S. Recent progress in building energy retrofit analysis under changing future climate: A review. Appl. Energy 2025, 383, 125441. [Google Scholar] [CrossRef] [Scilit]
- Escandón, R.; Ascione, F.; Bianco, N.; Mauro, G.M.; Suárez, R.; Sendra, J.J. Thermal comfort prediction in a building category: Artificial neural network generation from calibrated models for a social housing stock in southern Europe. Appl. Therm. Eng. 2019, 150, 492–505. [Google Scholar] [CrossRef] [Scilit]
- ESP-r Open-Source Building Performance Simulator, V13.3.18; University of Strathclyde: Glasgow, UK, 2025. Available online: https://www.strath.ac.uk/research/energysystemsresearchunit/applications/esp-r/ (accessed on 18 March 2026).
- TRNSYS. Transient System Simulation Program; University of Wisconsin: Madison, WI, USA, 2000. [Google Scholar]
- OpenStudio Application, V3.10.0; Open Studio: New York, NY, USA, 2025. Available online: https://openstudio.net/ (accessed on 27 August 2026).
- CCWorldWeatherGen. Climate Change World Weather File Generator for World-Wide Weather Data. University of Southampton. 2026. Available online: https://energy.soton.ac.uk/climate-change-world-weather-file-generator-for-world-wide-weather-data-ccworldweathergen/ (accessed on 1 February 2026).
- WeatherShift Software, Arup North America Ltd.: New York, NY, USA, 2026. Available online: https://weathershift.com/ (accessed on 15 April 2026).
- Meteonorm Software, V8.2.0.; Meteonorm: Bern, Switzerland, 2023. Available online: https://meteonorm.com/ (accessed on 2 March 2026).
- Rodrigues, E.; Fernandes, M.S.; Carvalho, D. Future weather generator for building performance research: An open-source morphing tool and an application. Build. Environ. 2023, 233, 110104. [Google Scholar] [CrossRef] [Scilit]
- Wang, Z.; Rangaiah, G.P. Application and Analysis of Methods for Selecting an Optimal Solution from the Pareto-Optimal Front obtained by Multiobjective Optimization. Ind. Eng. Chem. Res. 2017, 56, 560–574. [Google Scholar] [CrossRef] [Scilit]
- Rao, R.V.; Lakshmi, R.J. Ranking of Pareto-optimal solutions and selecting the best solution in multi- and many-objective optimization problems using R-method. Soft Comput. Lett. 2021, 3, 100015. [Google Scholar] [CrossRef] [Scilit]
- ISO 15927-4:2005; Hygrothermal Performance of Buildings—Calculation and Presentation of Climatic Data—Part 4: Hourly Data for Assessing the Annual Energy Use for Heating and Cooling. International Organization for Standardization: Geneva, Switzerland, 2005. Available online: https://www.iso.org/standard/41371.html (accessed on 14 August 2026).
- Crawley, D.; Lawrie, L. Climate Database. Available online: https://climate.onebuilding.org/ (accessed on 27 September 2026).
- NREL. NREL Data Catalog. Available online: https://data.nrl.gov/ (accessed on 6 October 2025).
- Canada. Historical Climate Data—Climate—Environment and Climate Change Canada. 2011. Available online: https://climate.weather.gc.ca/ (accessed on 6 October 2025).
- Filippín, C.; Flores Larsen, S.; Beascochea, A.; Lesino, G. Response of conventional and energy-saving buildings to design and human dependent factors. Sol. Energy 2005, 78, 455–470. [Google Scholar] [CrossRef] [Scilit]
- Filippín, C.; Flores Larsen, S.; Canori, M. Energy consumption of bioclimatic buildings in Argentina during the period 2001–2008. Renew. Sustain. Energy Rev. 2010, 14, 1216–1228. [Google Scholar] [CrossRef] [Scilit]
- Filippín, C.; Flores Larsen, S.; Canori, M. Energy use, health, and sleep in a bioclimatic university residence: A case study from 20 years of use. Acad. Green Energy 2024, 1, 2. [Google Scholar] [CrossRef] [Scilit]
- IRAM 11604:2004; Aislamiento Térmico de edificios. Verificación de sus Condiciones Higrotérmicas. Ahorro de Energía en Calefacción. Coeficiente Volumétrico G de Pérdidas de Calor. Cálculo y Valores Límites. Instituto Argentino de Normalización y Certificación (IRAM): Buenos Aires, Argentina, 2004. Available online: https://catalogo.iram.org.ar/#/normas/detalles/575 (accessed on 10 September 2026).
- American Society of Heating, Refrigerating and Air-Conditioning Engineers, Inc. ASHRAE Guideline 14: Measurement of Energy, Demand, and Water Savings; American Society of Heating, Refrigerating and Air-Conditioning Engineers, Inc.: Peachtree Corners, GA, USA, 2014; Available online: https://webstore.ansi.org/standards/ashrae/ashraeguideline142014 (accessed on 27 September 2026).
- Laouadi, A.; Bartko, M.; Lacasse, M.A. A new methodology of evaluation of overheating in buildings. Energy Build. 2020, 226, 110360. [Google Scholar] [CrossRef] [Scilit]
- CIBSE—Chartered Institution of Building Services Engineers. Guide A: The Limits of Thermal Comfort: Avoiding Overheating in European Buildings; CIBSE—Chartered Institution of Building Services Engineers: London, UK, 2017. [Google Scholar]
- Swedberg, N. Robust Optimisation of Building Retrofits for Present versus Future Climate Scenarios in Humid Continental Climates (Dfb subtype) to Reduce Heating Demand and Mitigate Future Overheating Risk. E3S Web Conf. 2022, 362, 11002. [Google Scholar] [CrossRef] [Scilit]
- Rothfusz, L.P. 1990: The Heat Index ‘‘Equation’’ (or, More than You Ever Wanted to Know About Heat Index). NWS Southern Region Technical Attachment SR 90-23. Available online: https://www.weather.gov/media/ffc/ta_htindx.PDF (accessed on 12 June 2026).
- Anderson, G.B.; Bell, M.L.; Peng, R.D. Methods to Calculate the Heat Index as an Exposure Metric in Environmental Health Research. Environ. Health Perspect. 2013, 121, 1111–1119. [Google Scholar] [CrossRef] [Scilit]
- Flores-Larsen, S.; Bre, F. Night-time urban heat exposure: Overheating and thermal resilience of South American bedrooms. Build. Environ. 2026, 287, 113757. [Google Scholar] [CrossRef] [Scilit]
- Wang, N.; Lv, Y.; Zhao, D.; Zhao, W.; Xu, J.; Yang, R. Performance evaluation of radiative cooling for commercial-scale warehouse. Mater. Today Energy 2022, 24, 100927. [Google Scholar] [CrossRef] [Scilit]
- NREL. Window Glass Material Database (IDF Format). Available online: https://github.com/NREL/EnergyPlus/blob/develop/datasets/WindowGlassMaterials.idf (accessed on 14 August 2026).
- Observatorio Universitario de Economía (OUE-UNLPam). Informe Técnico: El Impacto del Aumento de Tarifas de gas en la Pampa: Precios Internacionales, Dolarización e Indexación. Estudio de Casos; Facultad de Ciencias Económicas y Jurídicas, Universidad Nacional de La Pampa: Santa Rosa, La Pampa, Argentina, 2024; Available online: https://www.eco.unlpam.edu.ar/wp-content/uploads/2024/07/Informe-Gas-Natural-OUE.pdf (accessed on 10 September 2026).
- Filippín, C.; Flores Larsen, S.; Ricard, F. Improvement of energy performance metrics for the retrofit of the built environment. Adaptation to climate change and mitigation of energy poverty. Energy Build. 2018, 158, 86–99. [Google Scholar] [CrossRef] [Scilit]
- Amaripadath, D.; Joshi, M.Y.; Hamdy, M.; Petersen, S.; Stone, B., Jr.; Attia, S. Thermal resilience in a renovated nearly zero-energy dwelling during intense heat waves. J. Build. Perform. Simul. 2026, 19, 86–105. [Google Scholar] [CrossRef] [Scilit]

Disclaimer/Publisher’s Note: The statements, opinions and data contained in all publications are solely those of the individual author(s) and contributor(s) and not of MDPI and/or the editor(s). MDPI and/or the editor(s) disclaim responsibility for any injury to people or property resulting from any ideas, methods, instructions or products referred to in the content. |
© 2026 by the authors. Licensee MDPI, Basel, Switzerland. This article is an open access article distributed under the terms and conditions of the Creative Commons Attribution (CC BY) license.