


Abstract
This study presents a transient two-dimensional model devised to predict frost build-up, pressure drop, and sensible and latent heat transfer rates in tube-fin evaporators, commonly used in ‘frost-free’ refrigerators. Based on the first principles of mass, momentum, and energy conservation for the airflow and the frost layer, the model accurately simulates evaporator blockage over time. Furthermore, it incorporates the interaction between the heat exchanger air-side impedance and the fan performance characteristic curve, using an iterative fluid-dynamic sub-model that predicts airflow reduction and redistribution in an evaporator with three fin densities. Frost accretion experiments were conducted using a purpose-built test setup consisting of a bottom-mount refrigerator cabinet maintained at controlled temperature and humidity in both the fresh and frozen-food compartments. Model validation demonstrated that the predicted results closely matched experimental observations. The results show that localized frost accumulation at fin density transitions causes severe airflow blockage, resulting in a 75% reduction in effective heat transfer area due to uneven air distribution. Finally, an analysis of two dimensionless competing indices demonstrates that fin density selection involves a critical trade-off between the initial cooling capacity and long-term frost resilience.
1. Introduction
Frost accumulation on evaporator coils remains a persistent challenge in refrigeration and heat pump systems. It increases thermal resistance, restricts airflow, and ultimately reduces cooling capacity, necessitating periodic defrost cycles to melt the frost layer, eliminate the retained water [1] and restore performance [2,3]. Given its complexity and industrial significance, frosting continues to attract multidisciplinary research attention [4]. Investigations have spanned nucleation kinetics [5,6], heat and mass transfer within frost microstructures [7], and the influence of surface coatings and wettability on frost initiation [8,9]. Equally important are studies on frost growth modeling [10,11] and defrost optimization [12,13], both of which are critical for sustaining evaporator performance across extended operational cycles.
Frost formation on flat surfaces has been extensively investigated because it provides fundamental insight into the coupled heat and mass transfer mechanisms that govern frost growth and densification [2,14]. These studies have established the theoretical and experimental foundations required to understand frosting phenomena on more complex geometries, including the effects of surface curvature and fin spacing. Building upon this knowledge, frost formation on complex surfaces, such as finned-tube evaporators, has also been extensively studied [2,4]. The literature shows that thermo-hydraulic performance depends on the interplay between evaporator temperature, airflow psychrometric state, frost morphology, and fan characteristics [15,16]. Microchannel evaporators, already advantageous under dry conditions, are being increasingly investigated for frosting and defrosting scenarios due to their energy-efficiency potential [17,18].
Table 1 summarizes a selection of studies on frost formation in evaporators in the literature, highlighting key characteristics such as the year of publication, application type (household refrigerators, heat pumps, cryogenic refrigerators and industrial applications), and the methodology adopted (experimental or experimental combined with computational modeling). In addition, Table 1 indicates whether the studies presented computational models able to predict non-uniform air-side pressure drops and cooling capacity.
Table 1.
Summary of literature on frost formation in evaporators.
It is well established in the literature that, in domestic refrigeration systems, the airflow entering the evaporator is typically composed of a mixture of two air streams with distinct psychrometric properties, originating from the fresh-food and freezer compartments [20,28]. The interaction of these streams creates non-uniform boundary conditions at the evaporator inlet, which promotes spatially varying frost accumulation across the heat exchanger surface [28,30]. Despite its practical importance, the understanding of non-uniform frost distribution in tube-fin domestic evaporators remains limited (see Table 1). This is primarily due to the complex coupling between frost growth, airflow redistribution, and local heat and mass transfer processes, which continuously evolve during operation. As a result, accurately predicting frost patterns and their impact on evaporator performance remains a significant challenge for the design of heat exchanger geometries and the development of efficient defrost control strategies [30,31].
An analysis of Table 1 highlights a critical literature gap: while most frosting studies focus on heat pump applications, remarkably few have developed and validated models to predict spatially varying air-side pressure drops and cooling capacity. This deficiency is particularly acute in household refrigeration, a domain where such predictive modeling efforts remain scarce. Notably, among all the studies reviewed, only one developed a computational model capable of predicting the spatially varying cooling capacity of a domestic refrigeration evaporator [25]. Even in this case, the local air-side pressure drop predictions across the evaporator control volumes were not provided. Hence, literature still lacks comprehensive modeling tools capable of locally and simultaneously capturing the thermal and hydraulic impacts of non-uniform frost accumulation in domestic refrigeration evaporators.
Therefore, this study introduces a novel two-dimensional mathematical model for simulating the transient thermo-hydraulic performance of household evaporators under non-uniform frost formation conditions. The model was experimentally validated across six distinct humidity combinations within the fresh-food and freezer compartments, typical of domestic refrigerators. By accounting for localized heat transfer and air pressure drop coefficients, the model provides a tool for evaluating complex geometries with different fin density configurations.
2. Mathematical Model
The proposed model is based on the fundamental principles of mass, momentum, and energy conservation governing the airflow and frost layer, while incorporating the following key simplifying assumptions:
(i) Two-dimensional formulation: The evaporator is represented using a two-dimensional formulation that captures the dominant airflow redistribution, heat and mass transfer, and frost accumulation mechanisms, while neglecting three-dimensional effects such as end-wall phenomena, localized bypass flows, and other geometric irregularities that may become significant in specific evaporator configurations.
(ii) Negligible transverse air mixing: The airflow is assumed to remain confined to each computational region, neglecting transverse air mixing between adjacent regions of the evaporator.
(iii) Airflow modeling: The airflow is predicted by means of pressure-loss correlations coupled with the fan performance curve, rather than by directly solving the turbulent flow field.
(iv) Simplified frost morphology: The frost microstructure, including crystal growth orientation and individual crystal morphology, is not explicitly modeled. Instead, its effects are incorporated indirectly through a frost density correlation that depends on the frost surface temperature and the air dew-point temperature.
(v) Uniform frost thickness: The thickness of the frost layer is considered uniform within each control volume of the evaporator.
These simplifications were adopted to achieve a balance between an accurate macroscopic representation of the frost formation process and the computational cost required for transient simulations.
2.1. Geometry and Discretization
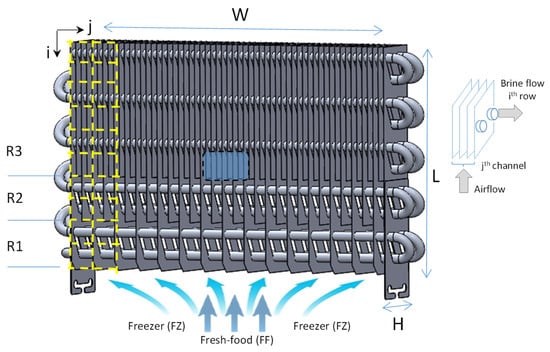
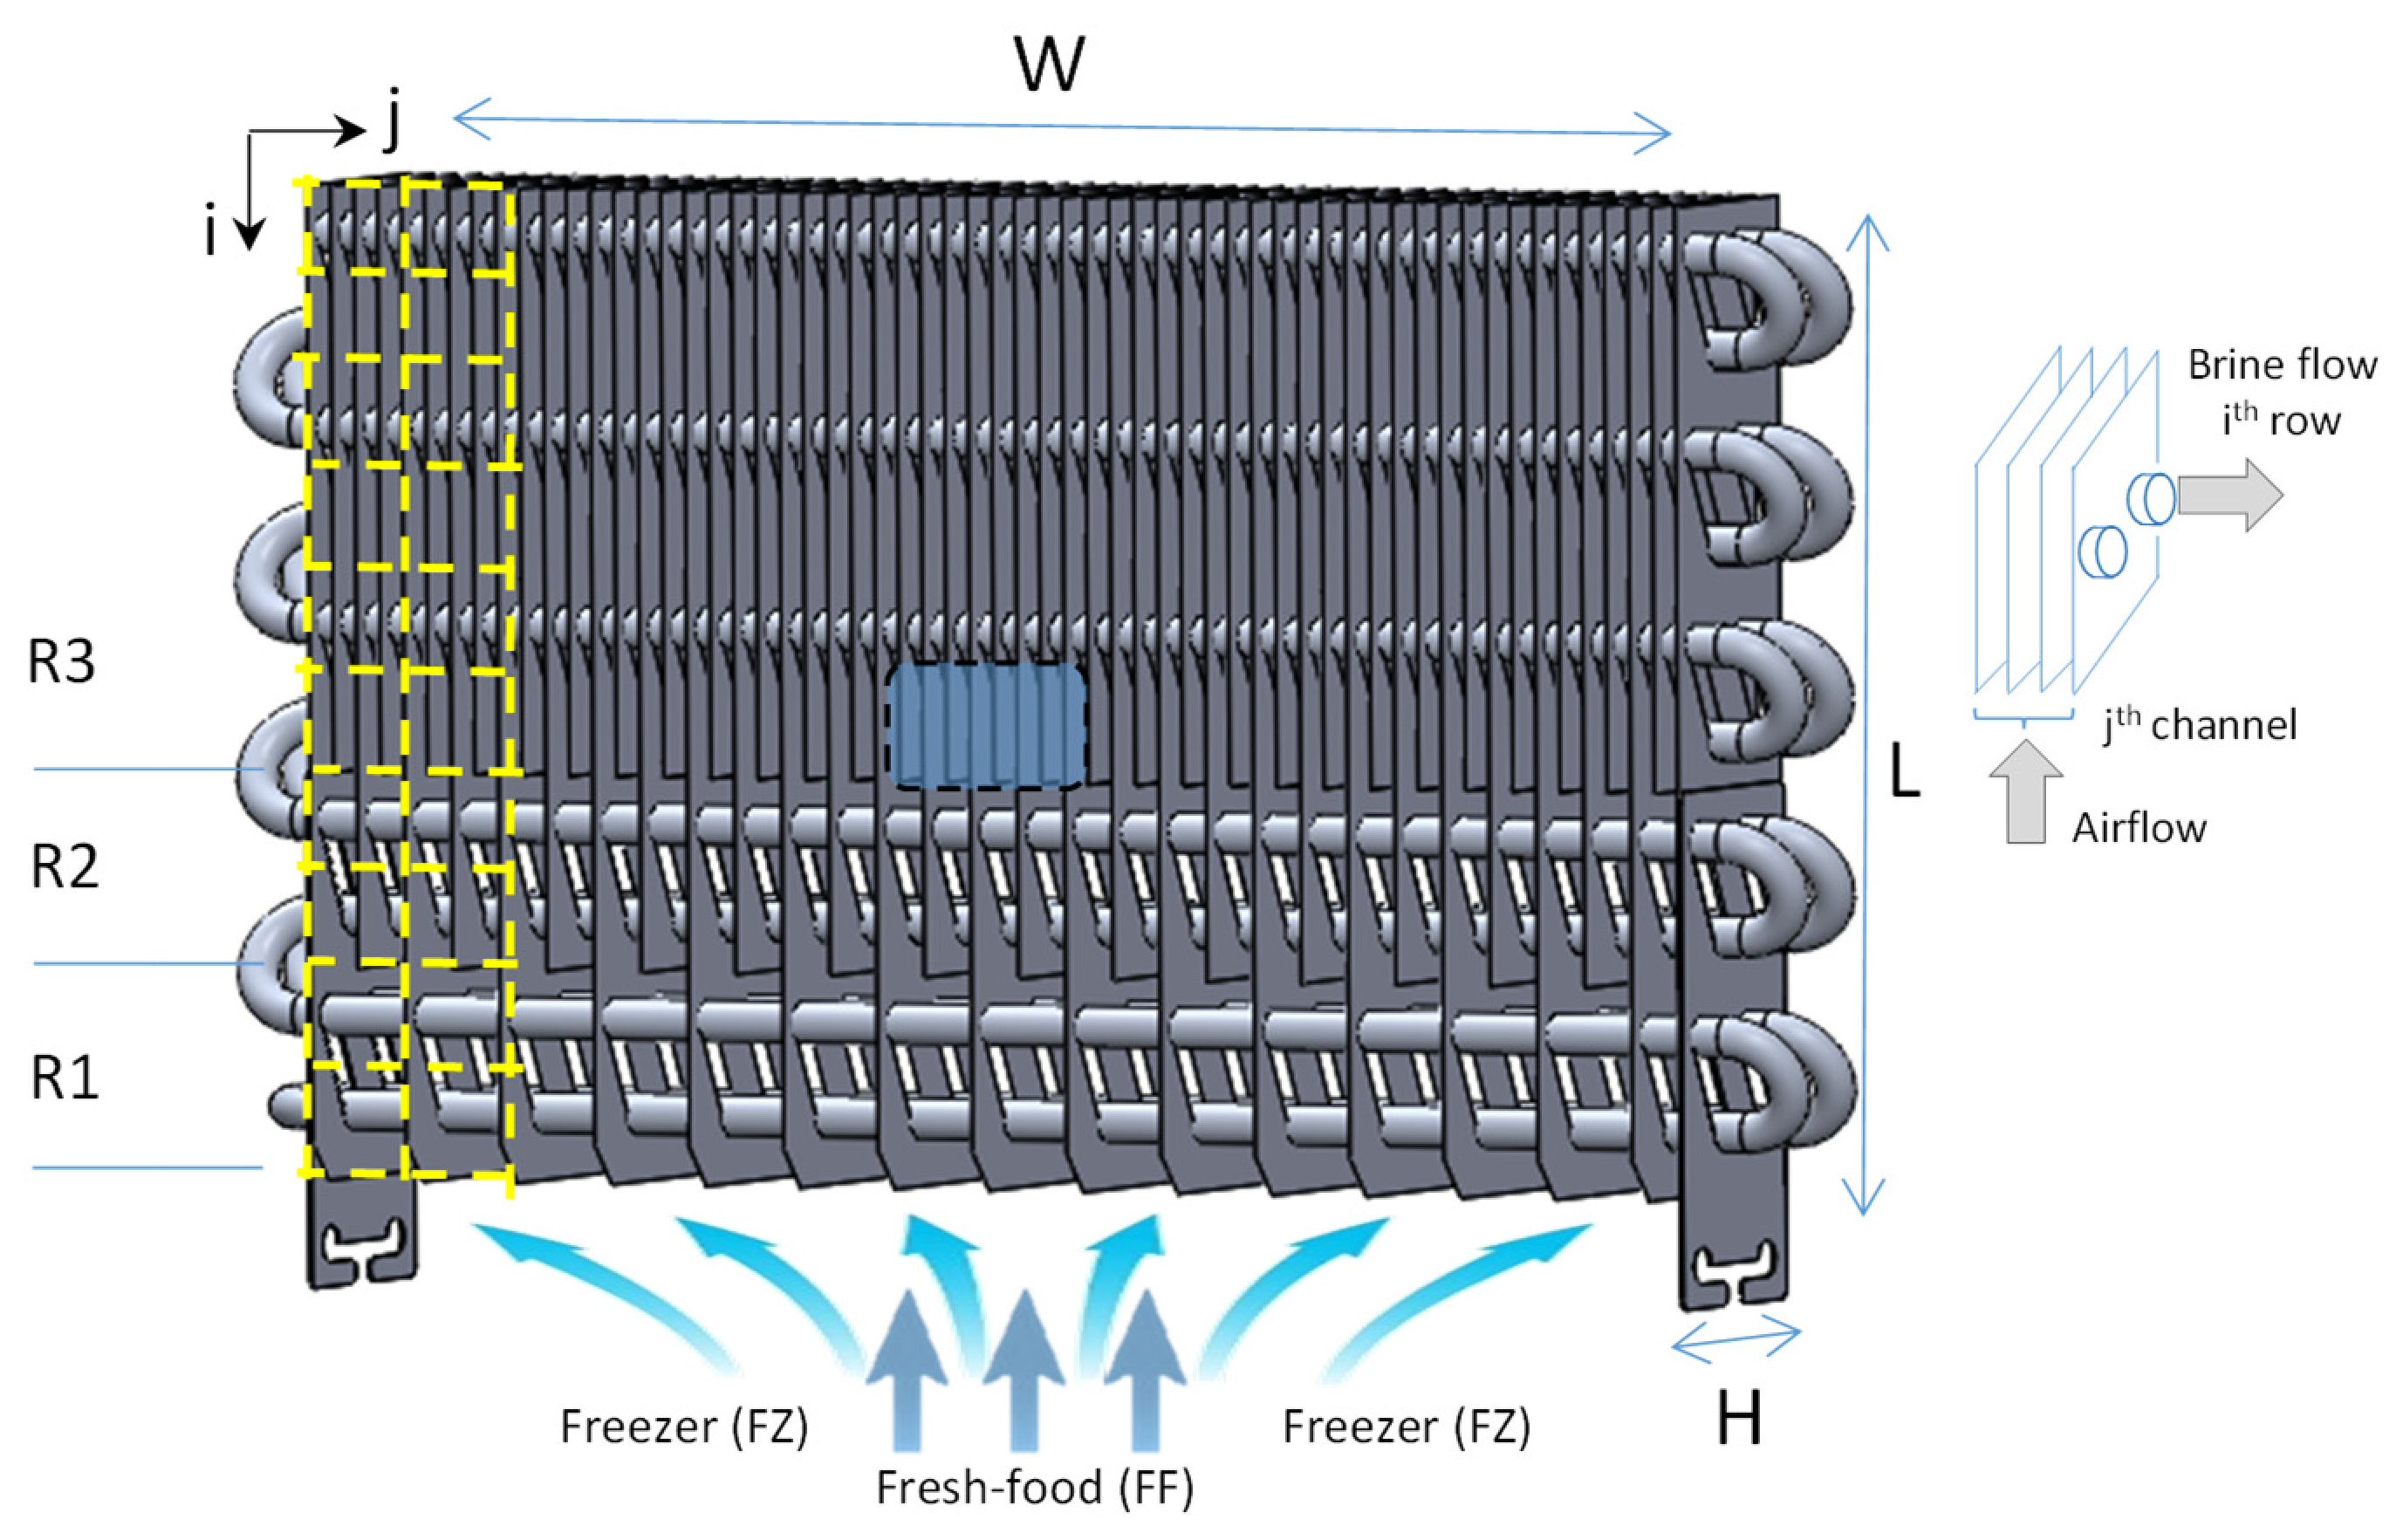
Figure 1 shows the geometric aspect of a typical ‘no-frost’ evaporator that features a relatively smaller face area and a greater length in the direction of airflow, initiating from the bottom and moving upward along dimension L. Its external dimensions are 194 mm in length (L), 286 mm in width (W), and 50 mm in height (H). It also features a staggered coil design with tubes with an external diameter of 7.62 mm, while the fin thickness is 0.13 mm. Both the fins and the tube are constructed from aluminum alloy. Additionally, the evaporator has three regions with distinct fin densities: 0.55 fins/cm (R1), 1.03 fins/cm (R2), and 2.06 fins/cm (R3). A gradual increase in fin density is generally used to prevent premature frost blockage at the air entrance. The central region (highlighted in blue), which likewise corresponds to the transition zone between R2 and R3, represents the area monitored by the borescope camera in the experimental setup.
Figure 1.
Schematic representation of the evaporator and detailed view of a control volume.
Figure 1 also presents, by yellow dashed lines, part of the two-dimensional discretization of the investigated evaporator, which is divided into 10 rows and 15 columns, forming a total of 150 control volumes. This specific spatial discretization was selected to provide an adequate representation of the local heat transfer, mass transfer, and fluid flow phenomena while maintaining a reasonable computational cost. For comparison, good agreement with experimental data has been reported for a 2D model of an evaporator with similar geometry using a discretization of 30 control volumes [28]. The subscripts j and i indicate the control volume position, representing the column (channel) and row number, respectively. For example, the control volume at j = 1 and i = 1 is located at the top left corner of the heat exchanger. A detailed schematic of airflow and brine solution flow within a control volume is shown on the right side of Figure 1. In this work, a brine solution was used to control the evaporator temperature.
2.2. Fluid Dynamic Submodel
The fluid dynamic submodel was made to predict the airflow redistribution over time. For this purpose, it considers the fan characteristic curve, the fin densities of each region and the local geometry that depends on the non-uniform pattern of frost accumulation (see Figure 1 and Figure 2). The evaporator airflow was provided by an axial fan, which was experimentally characterized in a wind tunnel facility, considering the constraints of the refrigerator ducts and the fan mounting position. Experimental results were used to regress the volumetric airflow rate [m3/h] of the fan as a function of the total air pressure drop [Pa]:
where the validity valid ranges of air flow rate (m3/h) and pressure drop (Δp) for Equation (1) are 15 to 60 m3/h and 12 to 38 Pa, respectively.
Figure 2.
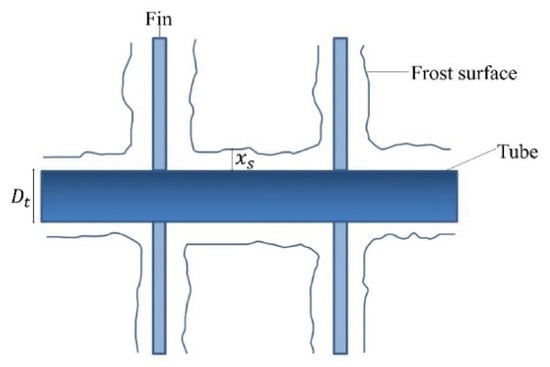
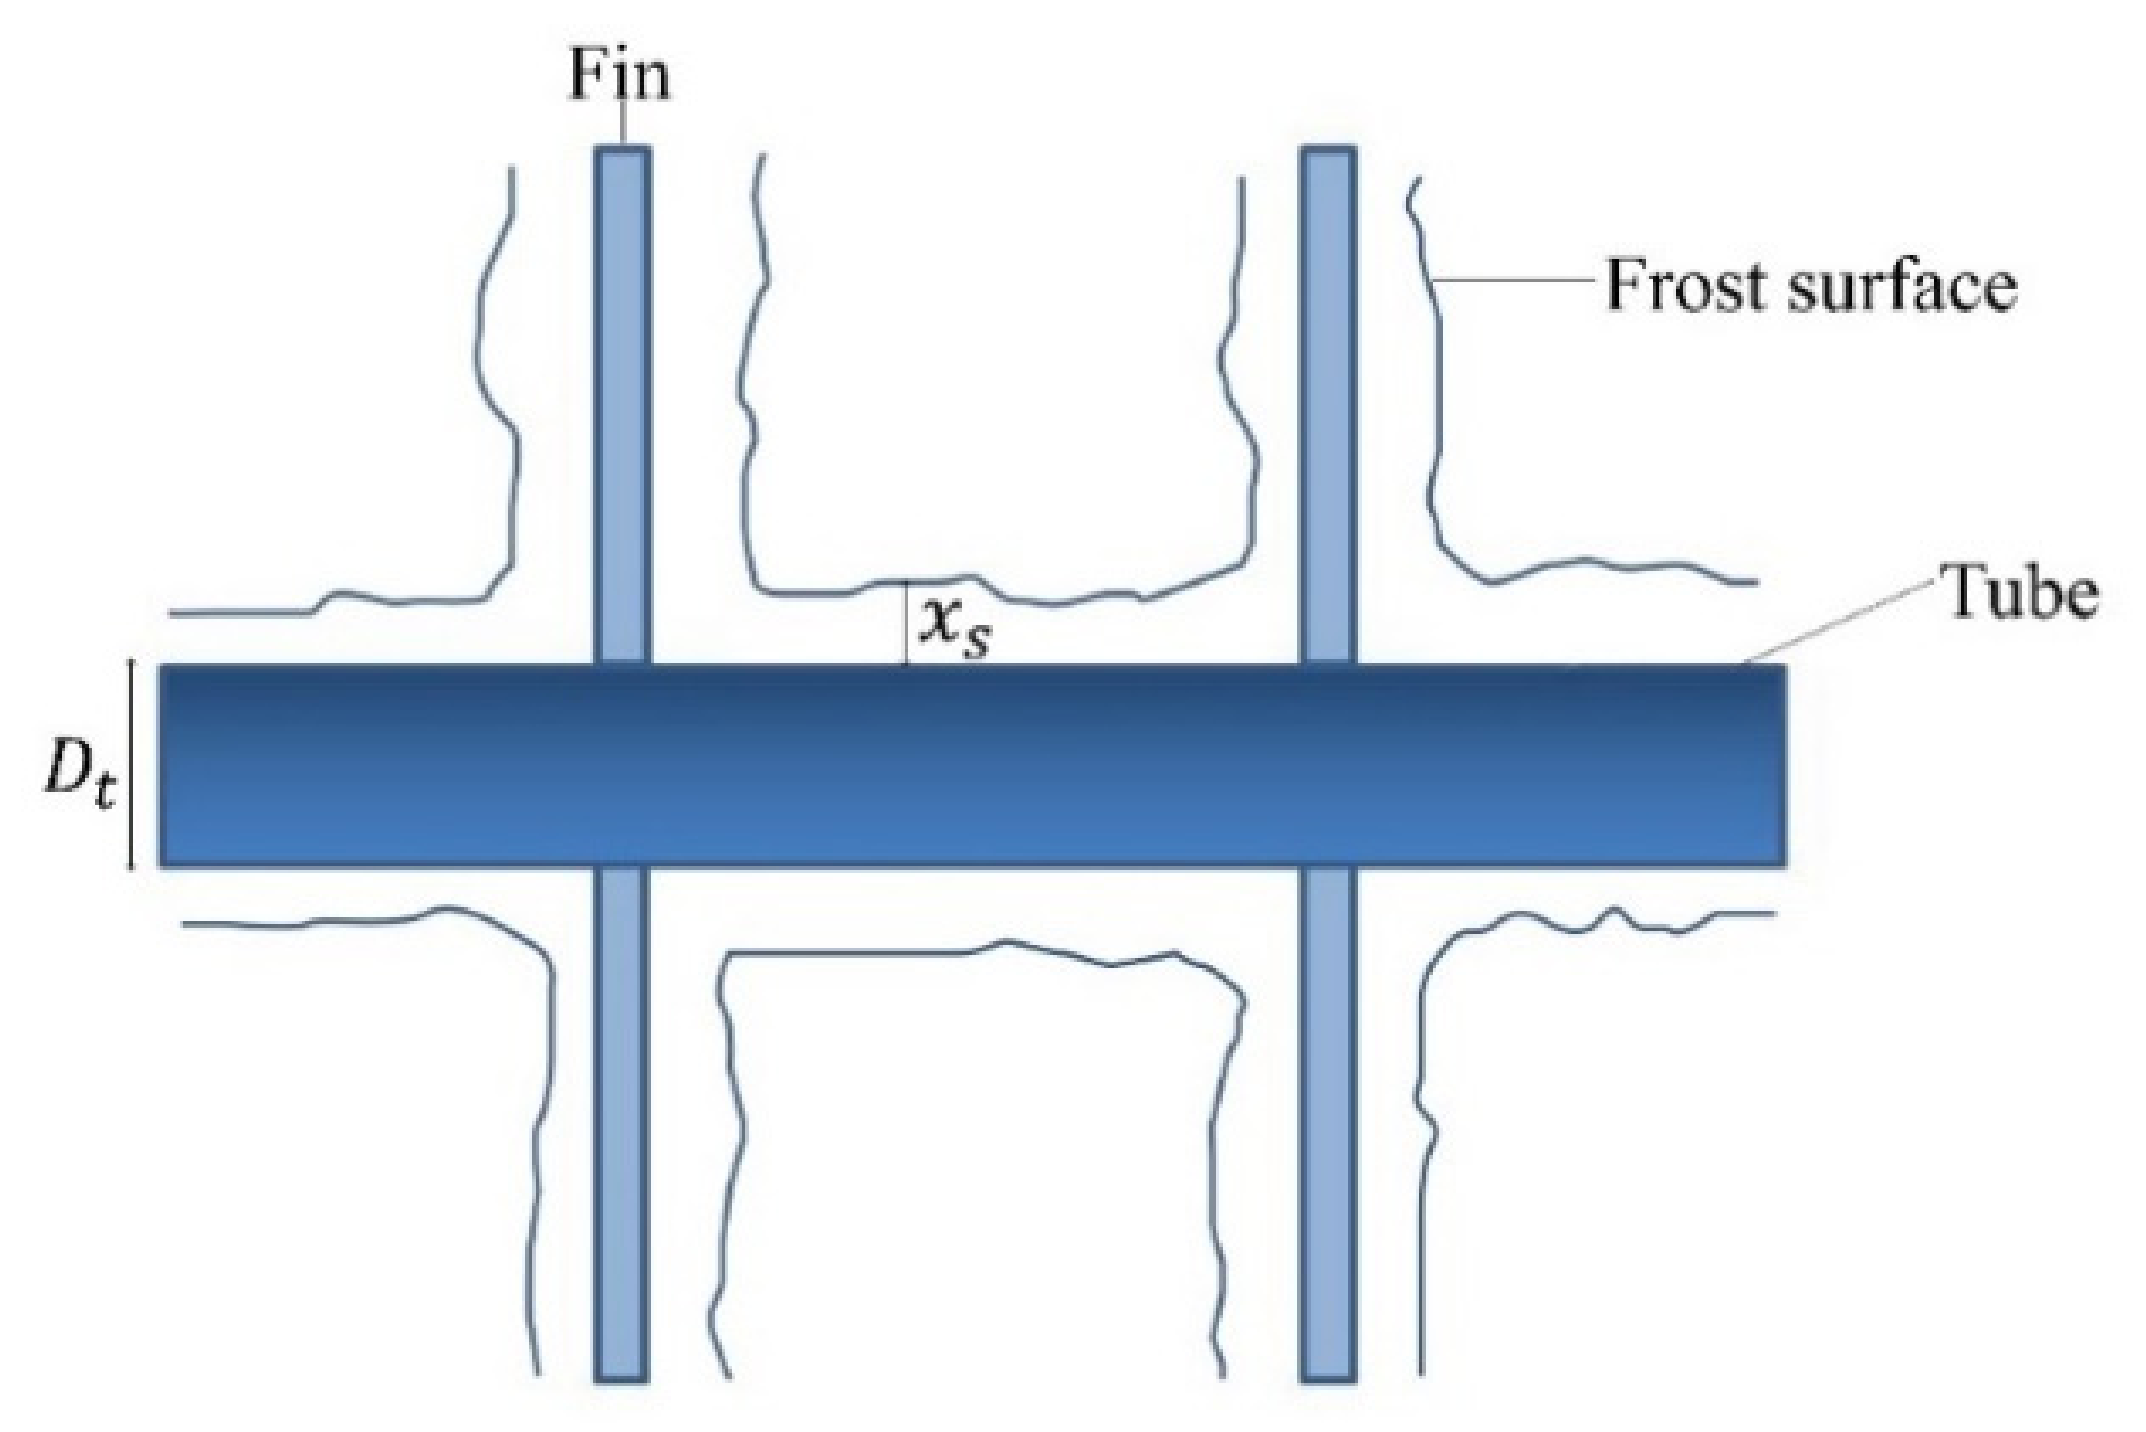
Schematic view of the frost layer deposition on the tube and fins surfaces.
The air flow of the evaporator was partitioned into 15 distinct channels to prevent mixing of the air streams along the evaporator length. Although some transverse air mixing may occur between adjacent regions, this effect was neglected and each channel was treated independently in the model. This simplification is justified by the predominance of the airflow in the main flow direction. The air-side pressure drop in each control volume was assessed from
where f(i,j) is the local friction factor, β(i,j) (Surface area(i,j)/Volume(i,j)) represents the local compactness factor, Ac,(i,j) is the local free flow area (core) and denotes the air mass flow rate at the j-th channel. The overall air mass flow rate across the evaporator is evaluated by adding up the local ones in the j-direction. Analogously, the total pressure drop in a channel is obtained by adding up the local pressure drops in the i-direction.
In turn, the additional air-side pressure drop associated with the air supply in the freezer and fresh-food system compartments was empirically evaluated using experimental data obtained over an airflow range of 15 to 60 m3/h and is expressed as
Therefore, the total pressure drop used to calculate the fan airflow in Equation (1) is the sum of the system pressure drop (Equation (3)) and the evaporator pressure drop (Equation (2)).
The complete solution of the fluid dynamic submodel is based on an iterative procedure, which is schematically represented in Figure 3. Initially, an estimated value for the total air mass flow rate () is proposed to obtain the local air mass flow rate () profile, which flows within each channel of the evaporator. As can be seen in the internal loop of Figure 3, a new local air mass flow rate () profile must be proposed until it satisfies the principles of momentum and mass conservation for all j-channels. After convergence being obtained, the air pressure drops across the whole evaporator (Equation (2)) and the system (Equation (3)) are summed and applied to the fan characteristic curve (Equation (1)) to determine a new total air mass flow rate (. If the difference between the new value and the initial estimate () exceeds a specified tolerance (ξ), the entire iterative procedure is repeated.
Figure 3.
Flowchart of the fluid dynamic submodel.
2.3. Transient Boundary Conditions at the Evaporator Inlet Region
As can be observed in Figure 1, the humid airflow from the freezer (FZ) compartment is supplied across the entire inlet region of the evaporator, whereas the airflow from the fresh-food (FF) compartment only mixes with the freezer stream in the central region. Consequently, the central flow region exhibits a higher moisture content. Since the thermodynamic state of the air at the evaporator inlet depends on the mixing of air streams from the fresh-food (FF) and freezer (FZ) compartments, which vary over time, a subroutine was implemented to account for this transient boundary condition. In the system under investigation, the airflow from the FZ compartment constitutes 90% of the total fan-driven airflow (. Therefore, after calculating the local air mass flow rate () for a given time step, balances of dry air mass, humidity, and energy were applied at the entrance of each jth-channel. This approach was essential to ensure the conservation and continuous updating of the total humidity from the compartments and to determine the psychrometric state of the air at the inlet of the evaporator’s 15 distinct channels.
2.4. Sensible and Latent Energy Balances
To take into account the local heat transfer between the air side (a) and brine side (b) of the evaporator, energy balances were applied in each control volume. Based on this, the total heat absorbed by the brine solution flowing inside the coil in a specific control volume was obtained from
where is the mass flow rate, c represents the specific heat, T is the temperature, is the overall heat transfer coefficient of the control volume, A(i,j) is the heat transfer area of the control volume, λ is frost latent heat of desublimation and ω is the air humidity ratio.
Similarly, the air-side sensible heat transfer in each control volume was evaluated as
where considers the set of thermal resistances and was locally evaluated as
The effect of the frost layer is considered through the local overall conductance UA(i,j), which incorporates the frost thermal resistance represented by the term xs/(kfAf) in Equation (6). Consequently, the calculated sensible heat transfer between the air and the refrigerant in each control volume directly accounts for the presence of the frost layer.
Local airflow dehumidification was evaluated by applying Chilton-Colburn analogy and mass balances in the control volumes [10], resulting in
Moreover, by implementing energy and mass balance inside and on surface of the frost layer, as illustrated in Figure 2, it is possible to assess the temperature of the frost surface on each control volume [10]:
where represents the sensible and latent heat flux rates evaluated by Equations (4) and (5), while indices s and w represent frost surfaces and coils, respectively. Additionally, D denotes the water vapor molecular diffusivity within the frost layer, whereas ε and τ represent the frost porosity and tortuosity, respectively. These latter parameters characterize the microstructure of the porous frost layer and influence the effective diffusion of water vapor within the frost layer [32].
2.5. Colburn j and f Factors
The computational model also relies on empirical correlations to assess the air flow pressure drop and heat transfer rate. Since the evaporator examined in this study contains regions with different fin densities (see Figure 1), each region was individually characterized using a wind-tunnel calorimeter facility. During the experiments, the airflow varied from 15 to 60 m3/h, corresponding to Reynolds numbers ranging from 200 to 900. Experimental results for heat transfer rate and air pressure drop were used to regress the Colburn j factor and the friction factor f [33] as power-law functions of the Reynolds number, expressed as
and
where the hydraulic diameter was calculated as 4Ac/P for each evaporator control volume, considering the corresponding channel formed by the adjacent fins and tubes.
2.6. Frost Formation Submodel
The frost formation model was employed to capture the transient behavior of the frost layer on the evaporator geometry, with its application adapted to each control volume of the evaporator [2]. This model states that the total moisture flux () from the air stream to the frost layer consists of two components, as follows:
where and represents the growth and densification of the frost layer, respectively. The combined effects of frost surface temperature (Ts) and the psychrometric state of the air on the frost density were expressed as [34]
The coefficients in Equation (12) were adjusted to the experimental data based on model predictions for frost thickness, total mass of frost, air pressure drop and cooling capacity of the evaporator. By relating Equation (11) to the heat and mass flux rates on the frost surface, an expression was derived to evaluate the frost layer growth rate () [10]:
Consequently, local frost thickness time evolution can be numerically computed using an explicit Euler integration method:
2.7. Solution Procedure
An iterative computational procedure was employed to solve the system of the previous equations. At each time step, the boundary conditions are updated to solve the fluid dynamics submodel, which governs the overall airflow supplied by the fan and its distribution within the evaporator’s channels (see Figure 3). This is followed by solving the heat transfer submodel to compute the heat and mass transfer values for each control volume. These results are then used to solve the frost formation submodel and update the geometries of each control volume of the evaporator (see Figure 2). Once convergence is reached, the algorithm is repeated for the next time until the final stopping criteria are met, which may be based on time, or the maximum air pressure drop. The transient simulations were performed using an explicit Euler scheme (Equation (14)) with a time-step of 30 s. This value satisfied the numerical stability requirements of the model and provided a suitable compromise between solution accuracy and computational efficiency.
3. Experimental Work
3.1. Experimental Apparatus
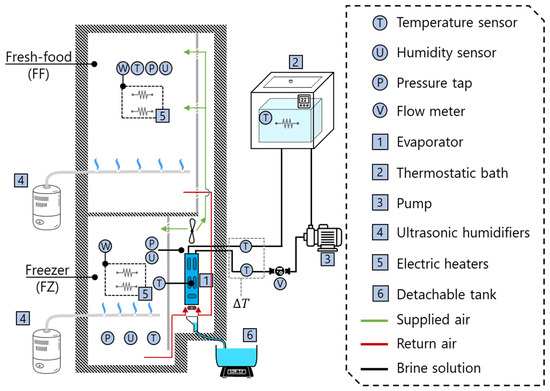
The experimental apparatus comprises a bottom-mount 125-L freezer (FZ) and a 275-L fresh-food (FF) compartment that was adapted and instrumented to operate at representative controlled operating conditions. A schematic representation of the experimental apparatus, which was installed inside a controlled environmental chamber, is shown on Figure 4. During the experiments, the temperature of the evaporator (1) was controlled by a cold brine solution supplied by a thermostatic bath (2). The brine solution was circulated by a pump (3) coupled to a variable-speed electric motor, allowing for control of the coolant flow rate. Moreover, a flow meter (V) was used to measure the volumetric flow rate of the brine solution.
Figure 4.
Schematic representation of the experimental apparatus.
The airflow entering the lower section of the evaporator (1) is a combination of two streams originating from the FZ and FF compartments, as depicted by the red lines in Figure 4. An axial fan, arranged in a draw-through configuration downstream of the evaporator (1), induces the airflow.
To control the air humidity inside the compartments, two ultrasonic humidifiers (4) were used. Similarly, electric heaters (5) were employed to dissipate heat within the compartments and regulate their temperatures separately. A detachable tank (6), located at the rear of the freezer and connected to a drain, collects condensate once the experiment is concluded.
A differential pressure transducer (P) was installed to measure the air pressure drop across the evaporator inlet and outlet. In addition, during the experiments, various parameters were measured, including the coil surface temperature of the evaporator, the volumetric flow rate of the brine solution, the coil temperature gradient, and the psychrometric properties of the air at both the inlet and outlet of the evaporator. The experimental uncertainties were determined to be ±0.5 °C for temperature, ±2.5% for air relative humidity, ±0.6 Pa for air pressure drop, ±15 W for the cooling capacity and ±15 g for the mass of defrost water. Moreover, to monitor frost thickness evolution on the evaporator surface, a borescope camera with a 67° field of view and a minimum focal length of 25 mm was installed at the center of region R3 (see Figure 1). The experimental uncertainty in frost thickness measurements was ±0.1 mm.
3.2. Experimental Procedure
The experimental procedure begins by setting operating temperatures of −25 °C on the evaporator coil, while the air temperatures in the freezer (FZ) and fresh-food (FF) compartments are maintained at −18 °C and 4 °C, respectively. Once steady-state conditions are achieved, the ultrasonic humidifiers (see Figure 4) are activated to introduce moisture into the FF and FZ compartments, which leads to frost accumulation on the evaporator. Relative humidity ranges of 40% to 90% in the FF compartment and 75% to 85% in the FZ compartment were investigated, resulting in six distinct humidity combinations. These conditions were selected to reflect typical household refrigerator operation in tropical and subtropical climates.
The frost buildup process is halted either based on time or when the air-side pressure drop across the evaporator reaches 23 Pa. Subsequently, the defrosting process is initiated by turning on a calrod heater positioned at the bottom of the evaporator and deactivating both the brine circulation pump and the axial fan. The resulting defrosted water is collected in a detachable tank (see Figure 4) and subsequently weighed. Although the moisture mass flux evaluated by Equation (11) is time-dependent, the experimental validation utilizes the total water mass collected post-defrost. While this cumulative approach cannot capture real-time, transient frost accumulation dynamics, it provides a reliable, non-intrusive validation of the total mass predicted over the entire cycle based on global mass conservation.
4. Results
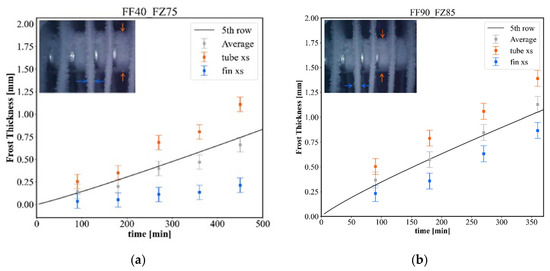
Figure 5 presents frost thickness evolution and magnified images captured via a borescope camera positioned at the center of region R3, specifically at the 5th tube row (see Figure 1). The arrows on the photos indicate the specific locations where the frost layer thickness was measured on both the fins and the tube. These images compare the results for the minimum (Figure 5a) and maximum (Figure 5b) humidity levels investigated in this study. For instance, the condition FF40/FZ75 depicted in Figure 5a denotes relative humidity levels of 40% and 75% in the fresh-food and freezer compartments, respectively. Experimental results indicate greater frost thickness in the tube region (orange) compared to the fin region (blue). This behavior is attributed to the lower surface temperatures and reduced thermal resistance of the primary tube surfaces relative to the extended fined surfaces. Moreover, Figure 5 shows that the proposed model accurately tracks the experimental trends, as the predicted frost thicknesses (solid lines) consistently align with the average values derived from the fin and tube measurements throughout the test duration. It is also observed that the increased humidity content evaluated in condition FF90/FZ85 (Figure 5b) enhances frost accumulation, reaching an average thickness of 1.00 mm at 400 min. This value is approximately twice the thickness observed for the FF40/FZ75 condition (Figure 5a) at the same time point.
Figure 5.
Visual observation and thickness evolution of the frost layer on the evaporator at −25 °C for humidity conditions: (a) FF40/FZ75 and (b) FF90/FZ85.
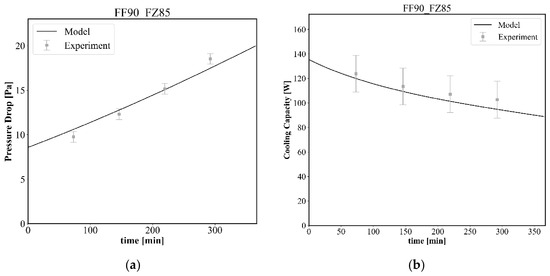
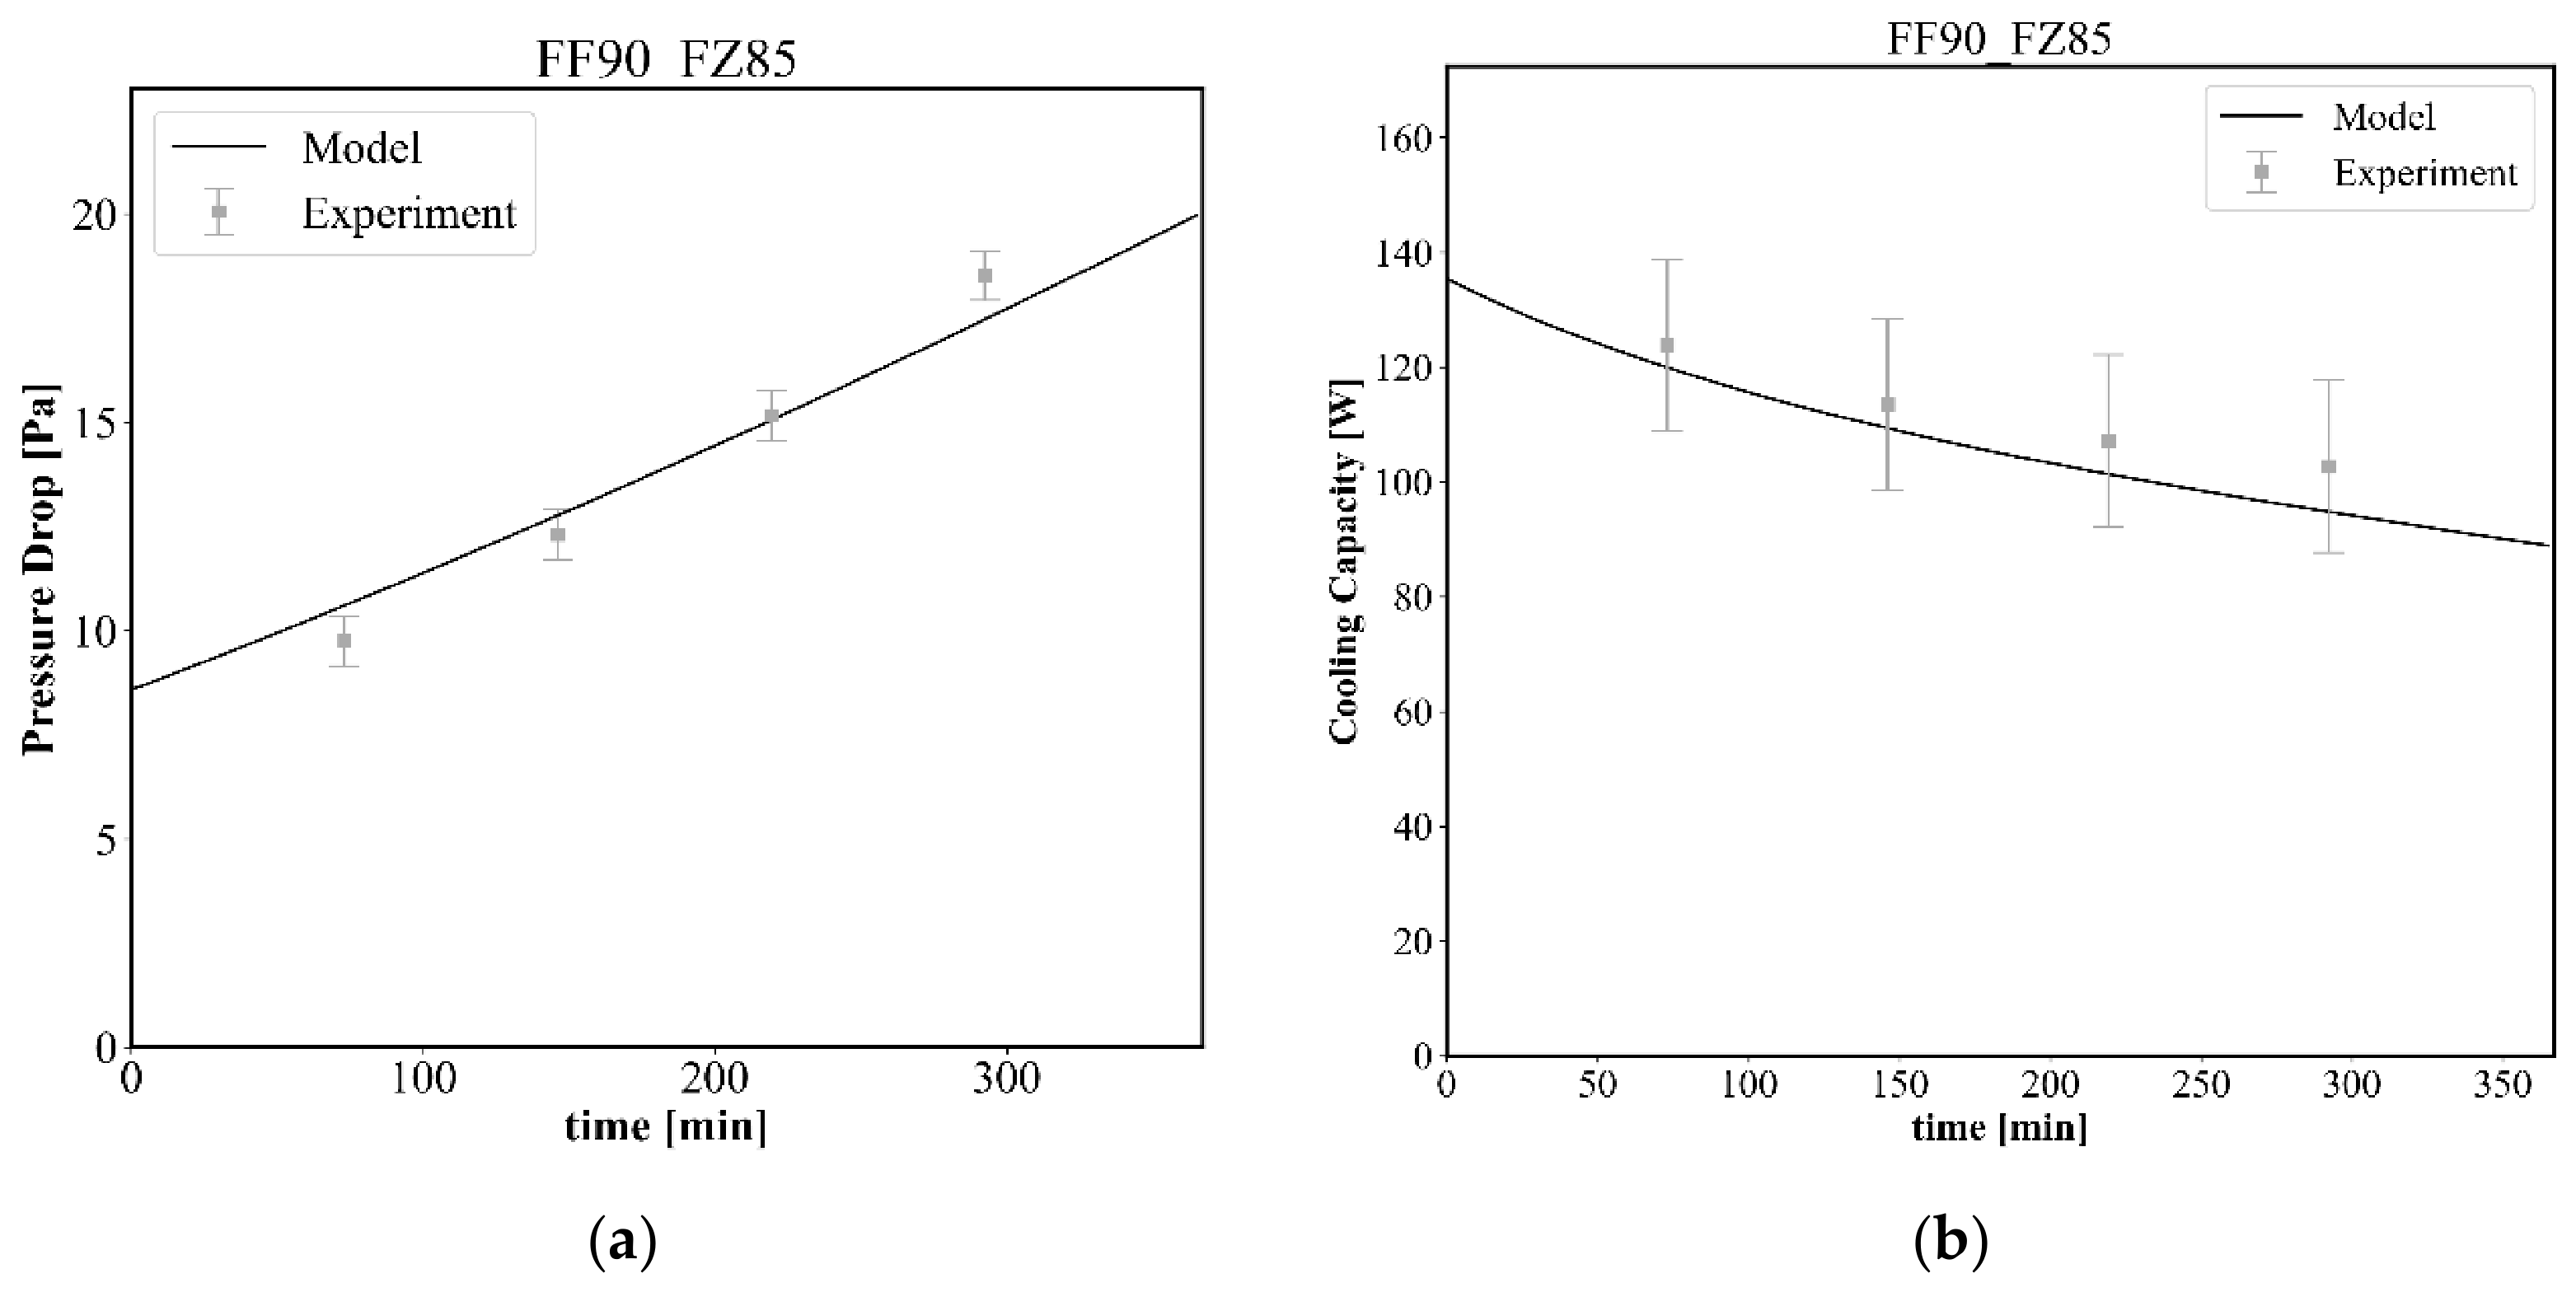
Continuing the model validation, Figure 6 compares the numerical predictions with experimental data for the air pressure drop and cooling capacity under the FF90/FZ85 condition. Error bars indicate experimental measurement uncertainty. The model demonstrates strong agreement with the experimental results across both metrics. As illustrated in Figure 6a, the air pressure drop across the evaporator increases gradually, due to frost accumulation, which subsequently reduces the airflow rate according to Equation (1). This reduction, combined with the increasing thermal insulation of the frost layer, drives a progressive decline in cooling capacity (Figure 6b). Consequently, a 35% reduction in thermal performance is observed after 400 min of operation.
Figure 6.
Comparison between experimental data and model predictions for (a) air pressure drop and (b) cooling capacity under condition FF90/FZ85.
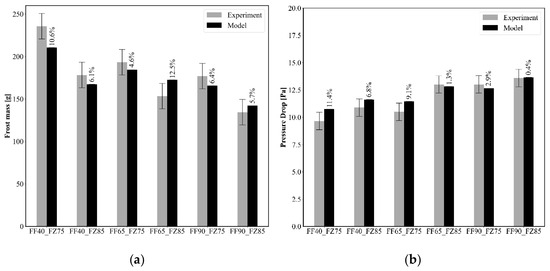
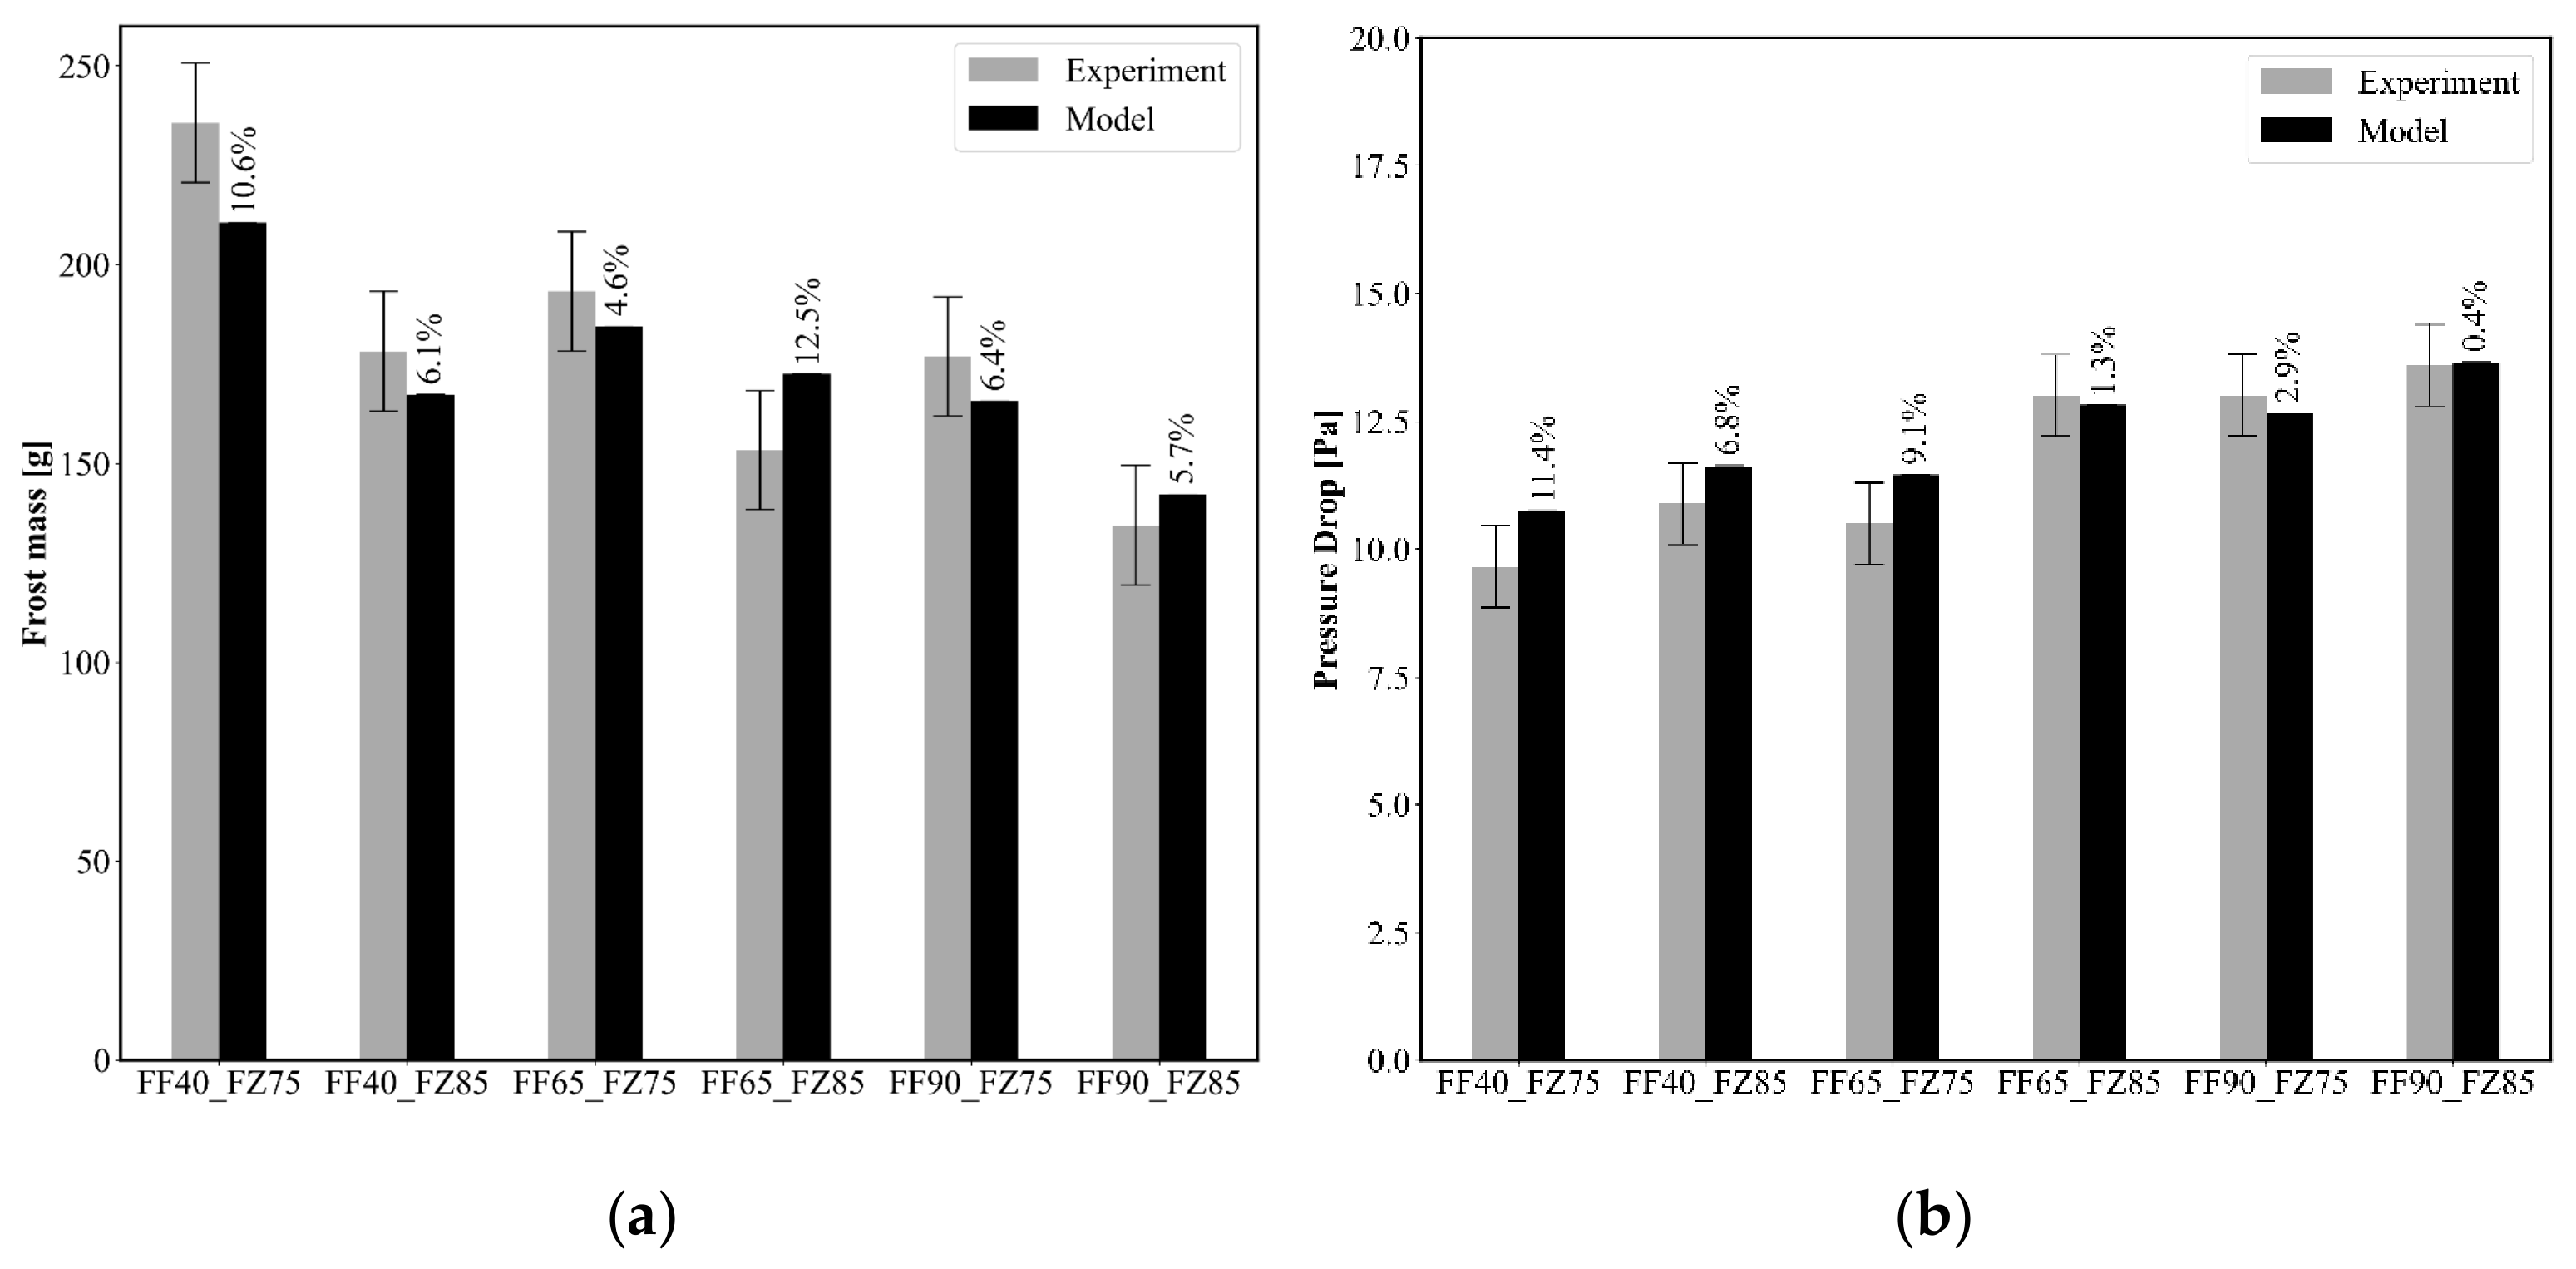
Figure 7 compares the accumulated frost mass (a) and evaporator air pressure drop (b) after 3 h across the six humidity conditions in the fresh-food (FF) and freezer (FZ) compartments. Error bars indicate experimental measurement uncertainty. As shown in Figure 7a, the proposed model accurately predicts the frost mass, with a maximum deviation of 12.5% observed for condition FF65/FZ85, while four out of the six conditions fall within the experimental uncertainty. Similarly, Figure 7b demonstrates that the model provides reliable predictions of the air pressure drop, with errors below 11.4% across all conditions.
Figure 7.
Model validation across all investigated humidity levels: comparison of measured and predicted (a) frost mass accumulation and (b) air pressure drop.
The matchup between the set of experimental data and the model predictions, regarding frost thickness, frost mass, air pressure drop and heat transfer rate, is evidence of the validity of the coefficients regressed in this work for Equation (12), which is used to evaluate the frost density. The regressed coefficients are = 917 kg/m3, = 0.115 °C−1, and = −0.06 °C−1. Notably, during the coefficient regression procedure, good agreement with the experimental data was achieved when using -coefficient close to the density of solid ice. Additionally, the experimental coefficients for the Colburn j-factor and friction f-factor (Equations (9) and (10)) are summarized in Table 2 for the three investigated evaporator regions.
Table 2.
Data for j and f calculations using mRen.
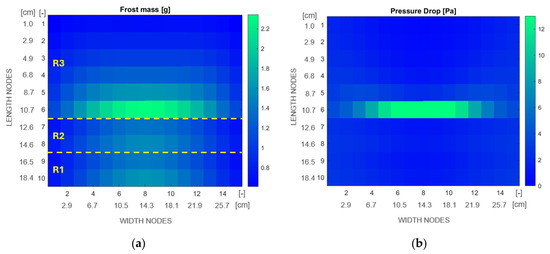
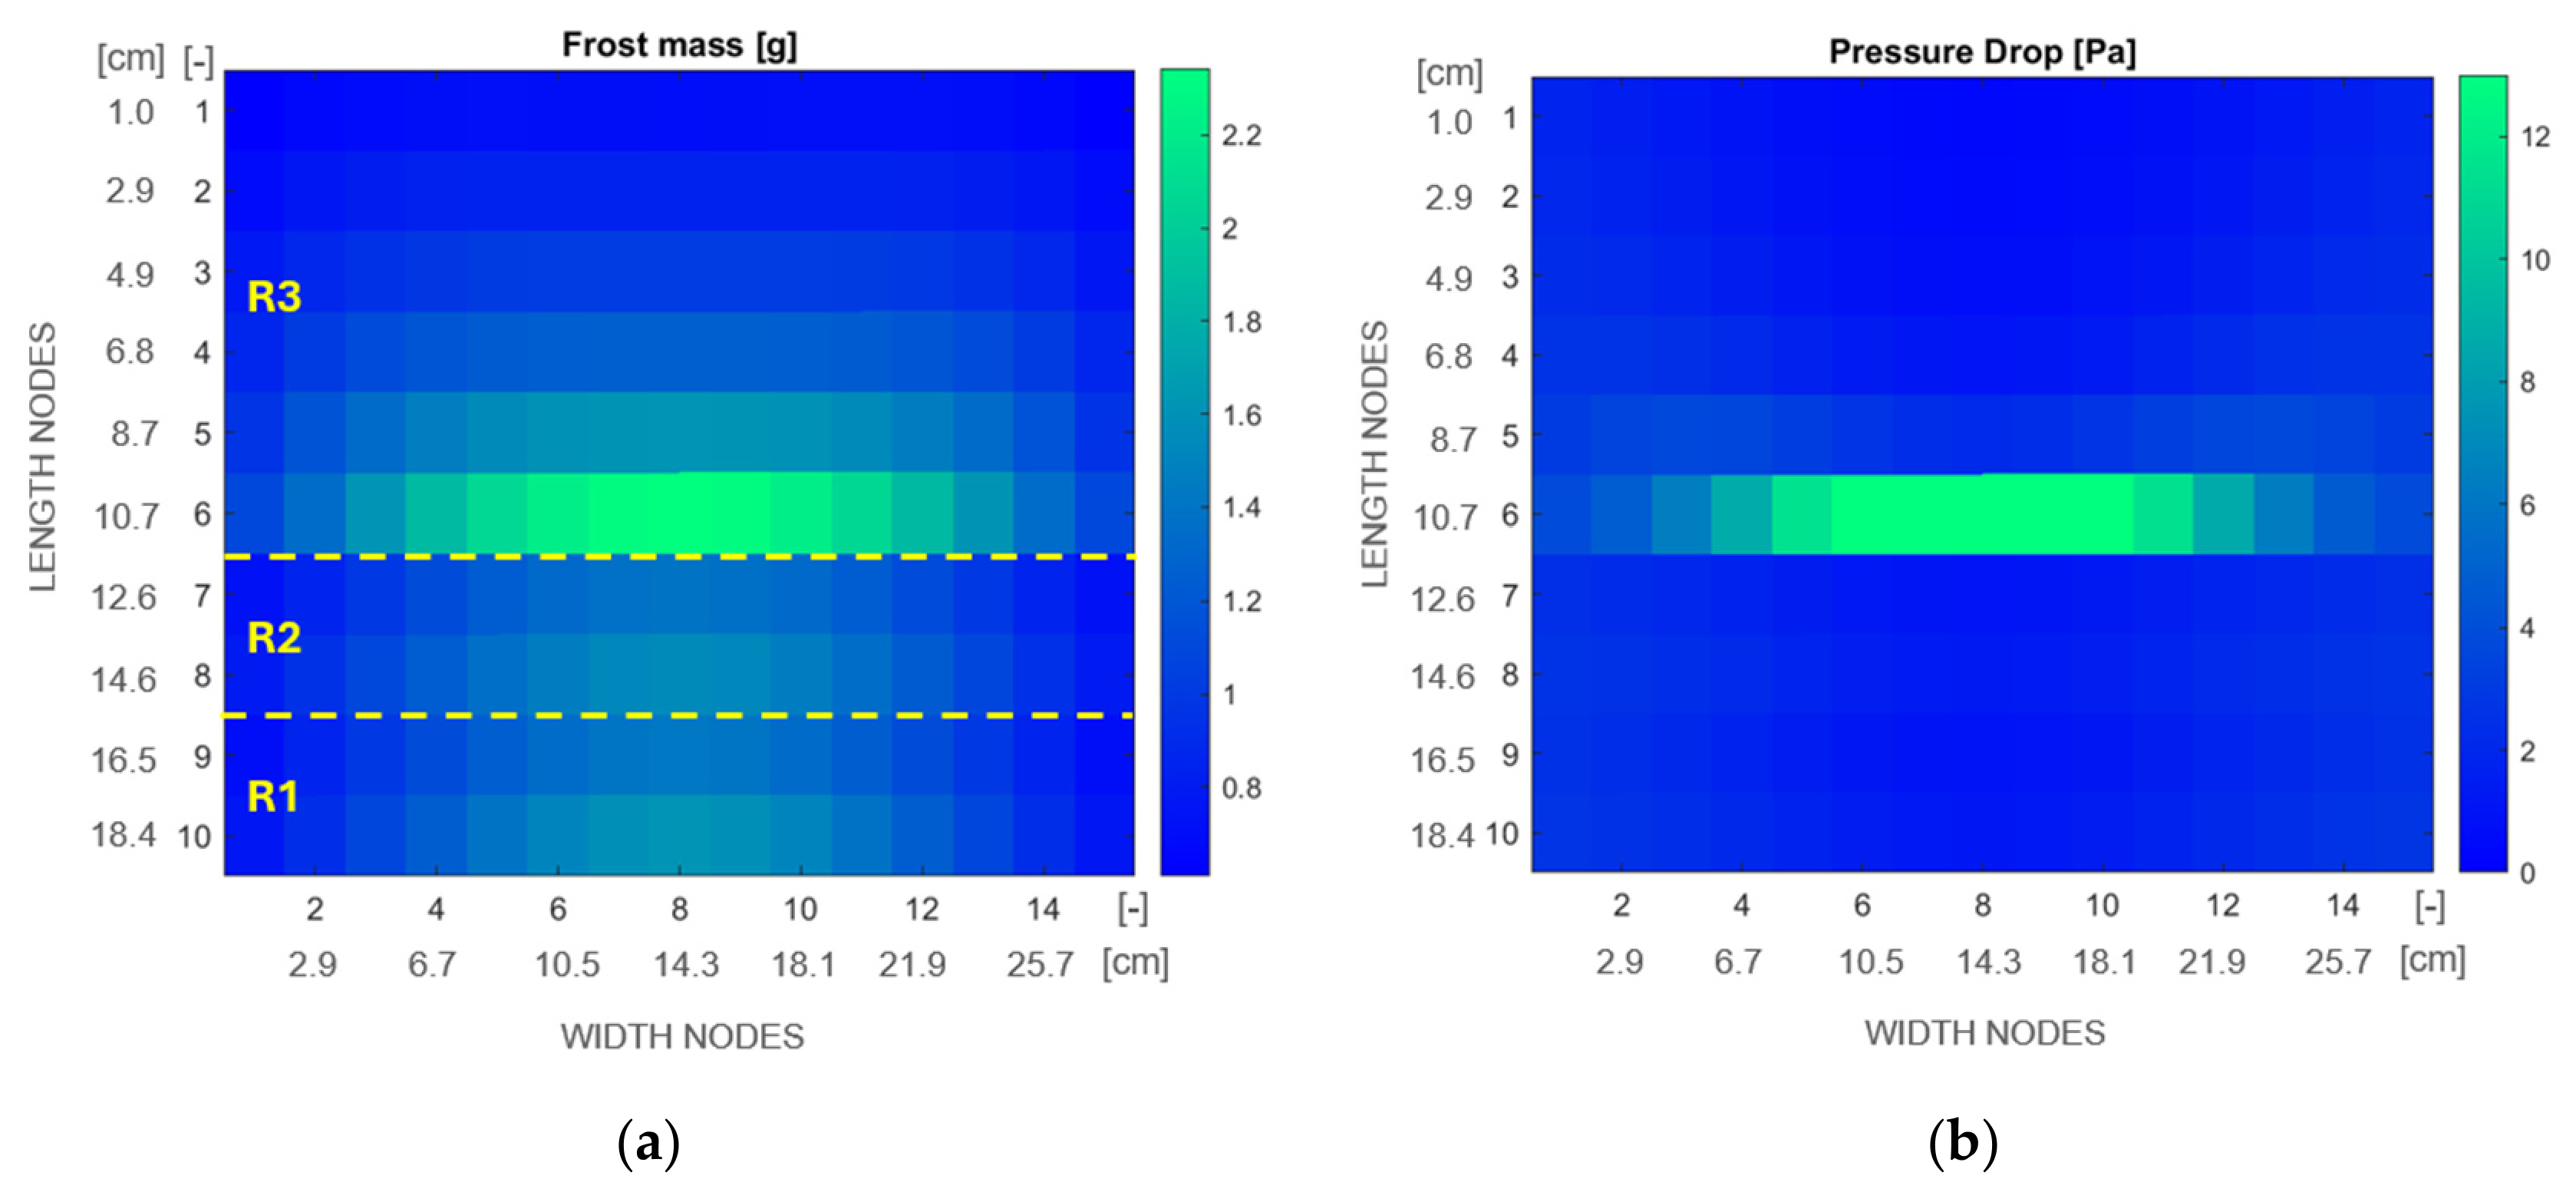
Following model validation, a spatially localized analysis was conducted across the entire evaporator surface. Figure 8 presents the simulation results obtained after 500 min, with FF65/FZ85 humidity levels, where the airflow is oriented from bottom to top. Figure 8a highlights a significant frost accumulation (>2.0 g) in the central portion of the evaporator 6th row, where a transition in fin density occurs. This outcome shows that the shift in fin density between regions R2 and R3 creates a bottleneck effect in this specific geometry, accelerating frost build-up and obstructing the channels prematurely. The observed behavior can be attributed to the reduction in the local free-flow area, which initially accelerates the airflow through the transition region, resulting in higher local air velocities. As indicated by Equation (9), the higher velocity enhances local heat transfer, which, in turn, promotes water vapor deposition according to Equation (7) and accelerates frost formation in the transition region R2 to R3. The resulting localized frost accumulation further reduces the available flow area, creating a positive feedback mechanism that intensifies airflow restriction and leads to premature local flow blockage, as indicated by the increased pressure drop in the central region shown in Figure 8b.
Figure 8.
Analysis of (a) local frost mass and (b) local air pressure drop.
Conversely, the frost mass in the upper section (rows 1, 2, and 3) and the lower right and left portions of the evaporator remained below 1.4 g. This uneven frost mass distribution is explained by the concentration of moist air from the fresh-food compartment in the central region (columns 6 to 10) of the bottom-most row (10th row), coupled with pre-dehumidification occurring before the air stream reaches row 4.
In turn, Figure 8b reveals that the substantial frost build-up in the evaporator’s central region results in an uneven air pressure drop distribution, with localized values reaching up to 13 Pa at the transition between regions R2 and R3, precisely where the highest frost accumulation is observed (see Figure 8a). At the same time, 90% of the evaporator control volumes show air pressure drops lower than 6 Pa.
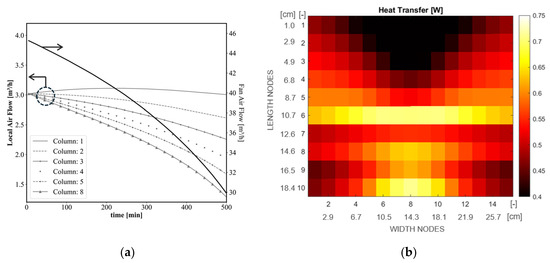
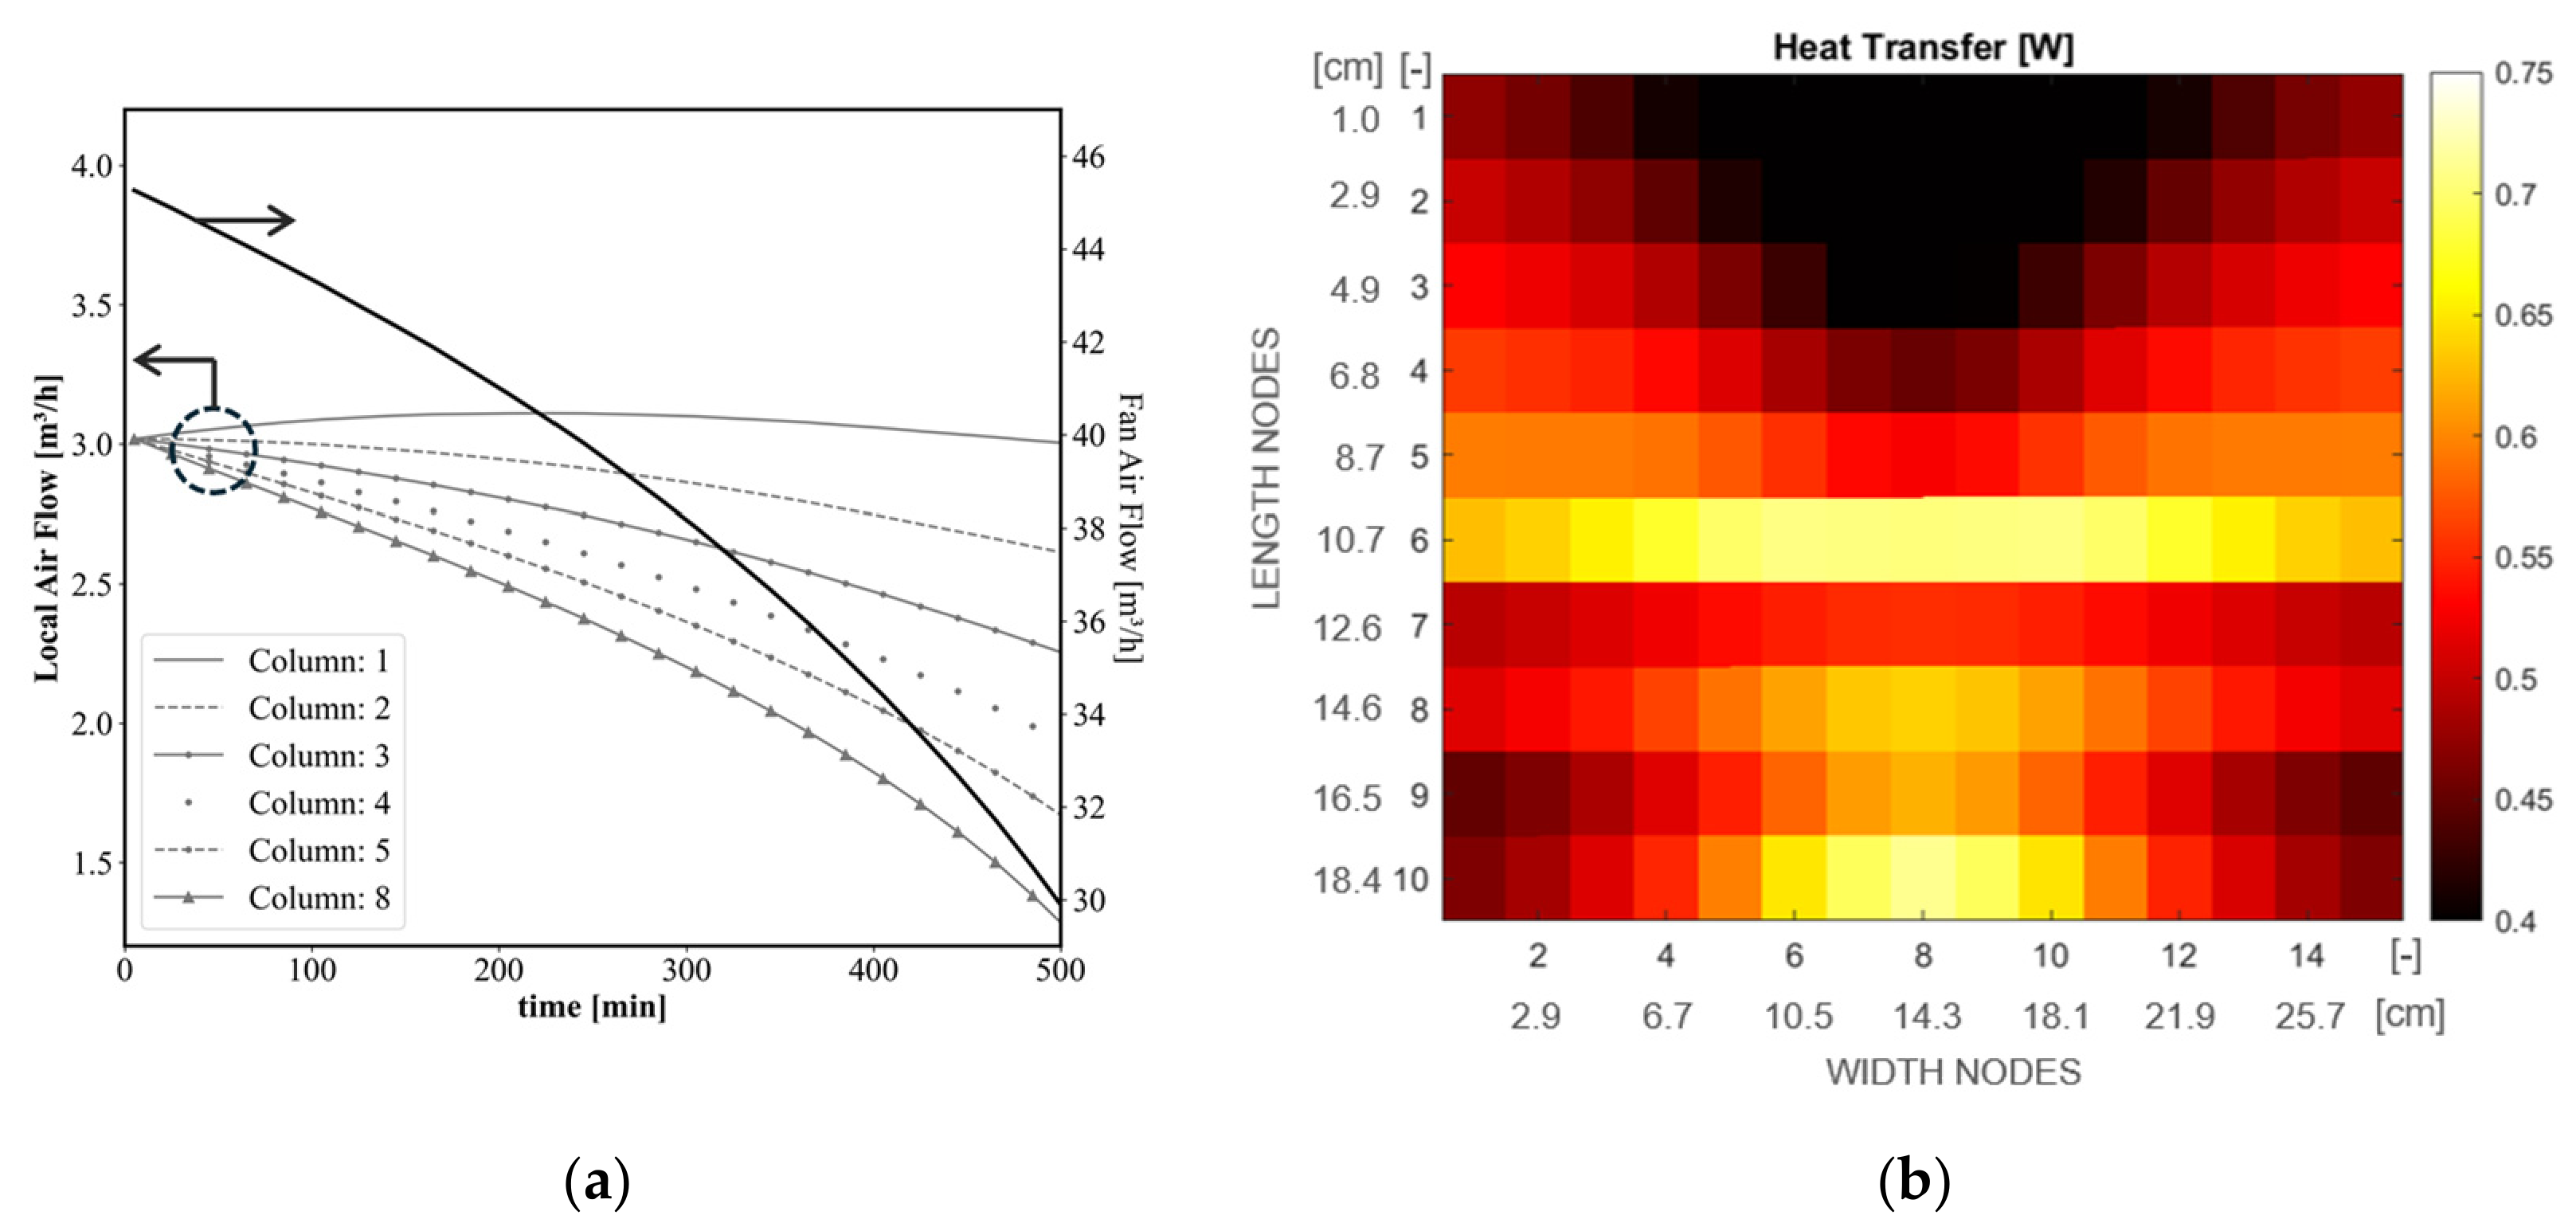
Still regarding the FF65/FZ85 condition, Figure 9a depicts the total fan airflow evolution on the secondary y-axis, alongside the predicted airflow redistribution for the evaporator channels in columns 1 through 8. The total fan airflow decreases from 45 m3/h to 30 m3/h, representing a 33% reduction compared to the initial frost-free operating condition. The local airflow comparison reveals a significant attenuation in channels 4, 5, and 8, whereas an initial augmentation in the airflow rate is observed on channel 1. Notably, after 500 min of operation, the airflow rate in channel 8 is lower than 1.0 m3/h, a 66.7% reduction. This trend stems from excessive frost accumulation in the evaporator’s central section (Figure 8a), which not only reduces the total air flow but also diverts a portion of the stream toward the lateral channels, leading to a significant airflow maldistribution. Figure 9b illustrates how this phenomenon impacts local heat transfer after 500 min. The upper central region experiences severe underutilization (<0.45 W), with about 75% of the total surface area exhibiting heat transfer rates below the threshold of 0.55 W.
Figure 9.
Analysis of (a) air flow and (b) local heat transfer rate.
With the aim of improving the evaporator frost robustness, the mathematical model was utilized to create a more gradual transition between regions R2 and R3. This was achieved by lowering the fin density in R3 from 2.06 to 1.37 fins/cm. However, to compensate for the resulting reduction in surface area, the evaporator width was increased from 286 to 400 mm, yielding an external surface area of 0.84 m2, equivalent to that of the original geometry. The performance of the redesigned geometry was also simulated under the FF65/FZ85 condition to provide a direct comparison with the baseline design.
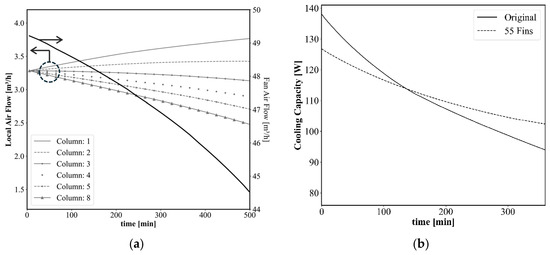
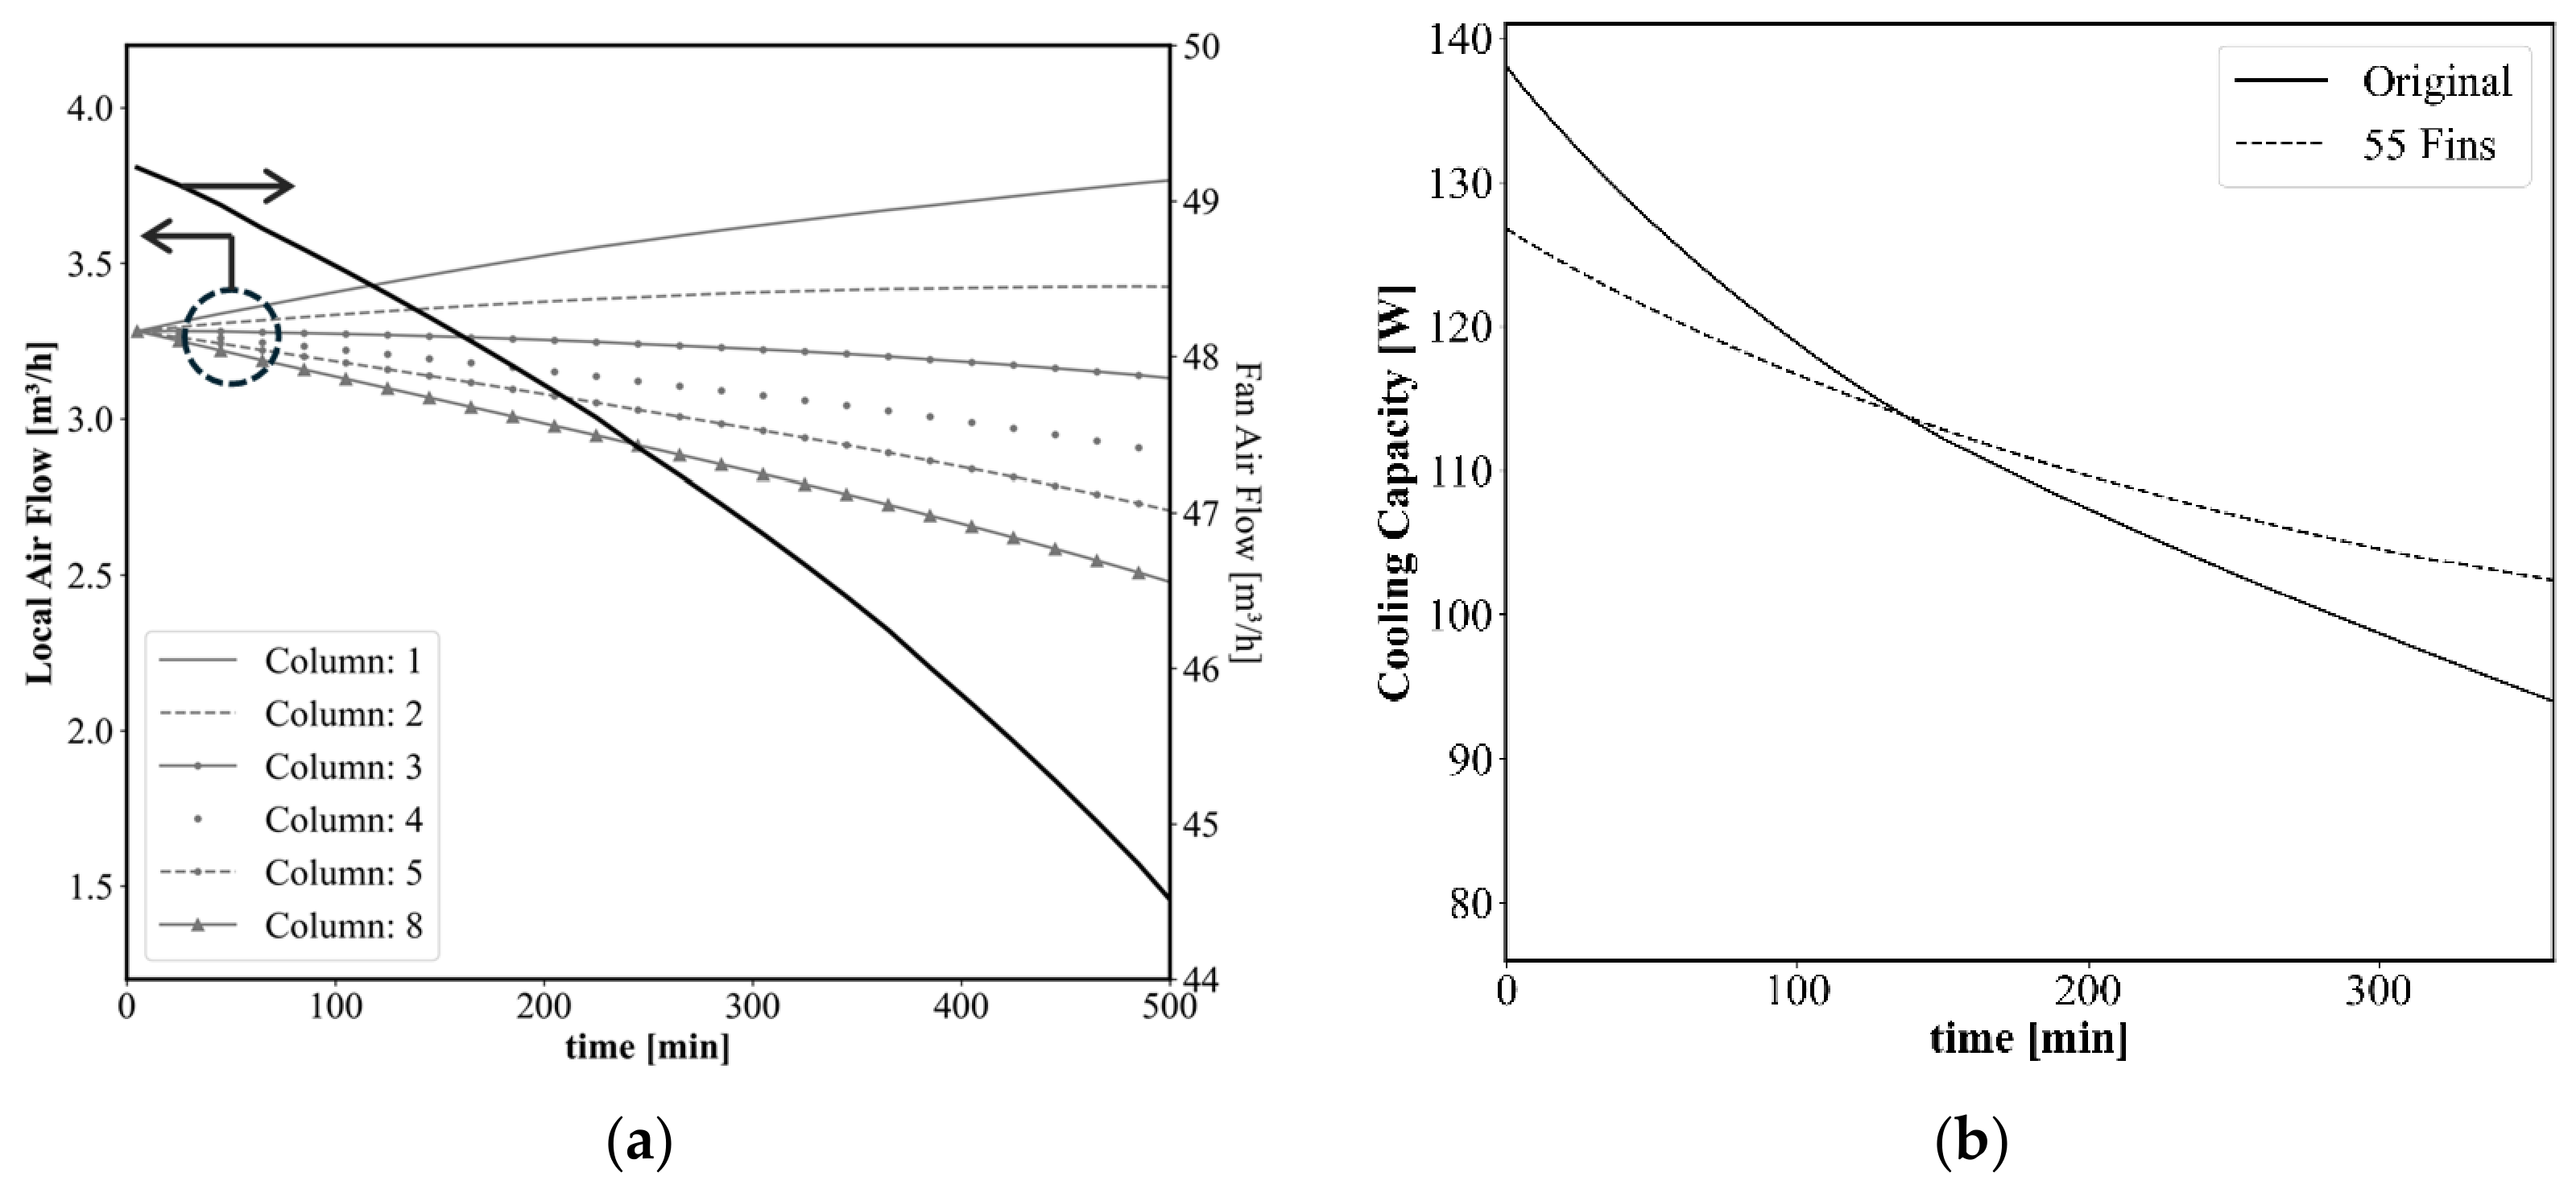
As illustrated in Figure 10a, the geometric modification increased the initial total fan airflow rate to 49 m3/h compared to 45 m3/h in the baseline case (Figure 9a), with the improvement primarily attributed to lower fin density in region R3. This modification directly enhanced the transient airflow distribution, delaying obstruction in channels 4, 5, and 8 while simultaneously increasing flow through lateral channels 1 and 2. This improved flow regime resulted in a significant enhancement of the net cooling capacity over time, as illustrated in Figure 10b. Although the initial cooling capacity of the new geometry is approximately 10 W lower than the baseline (137 W), the new configuration exhibits superior robustness against frost formation. This is evidenced by a lower thermal degradation rate compared to the original design. Notably, an operational crossover occurs at the 150-min mark, beyond which the cooling capacity of the new geometry (55 Fins) surpasses the baseline.
Figure 10.
Analysis of reduced R3 fin density: (a) air flow and (b) cooling capacity.
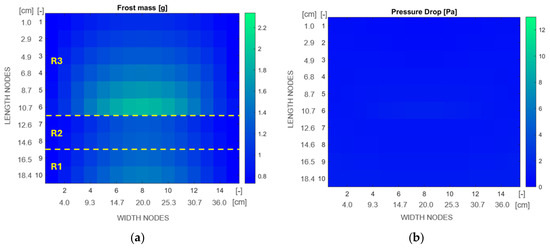
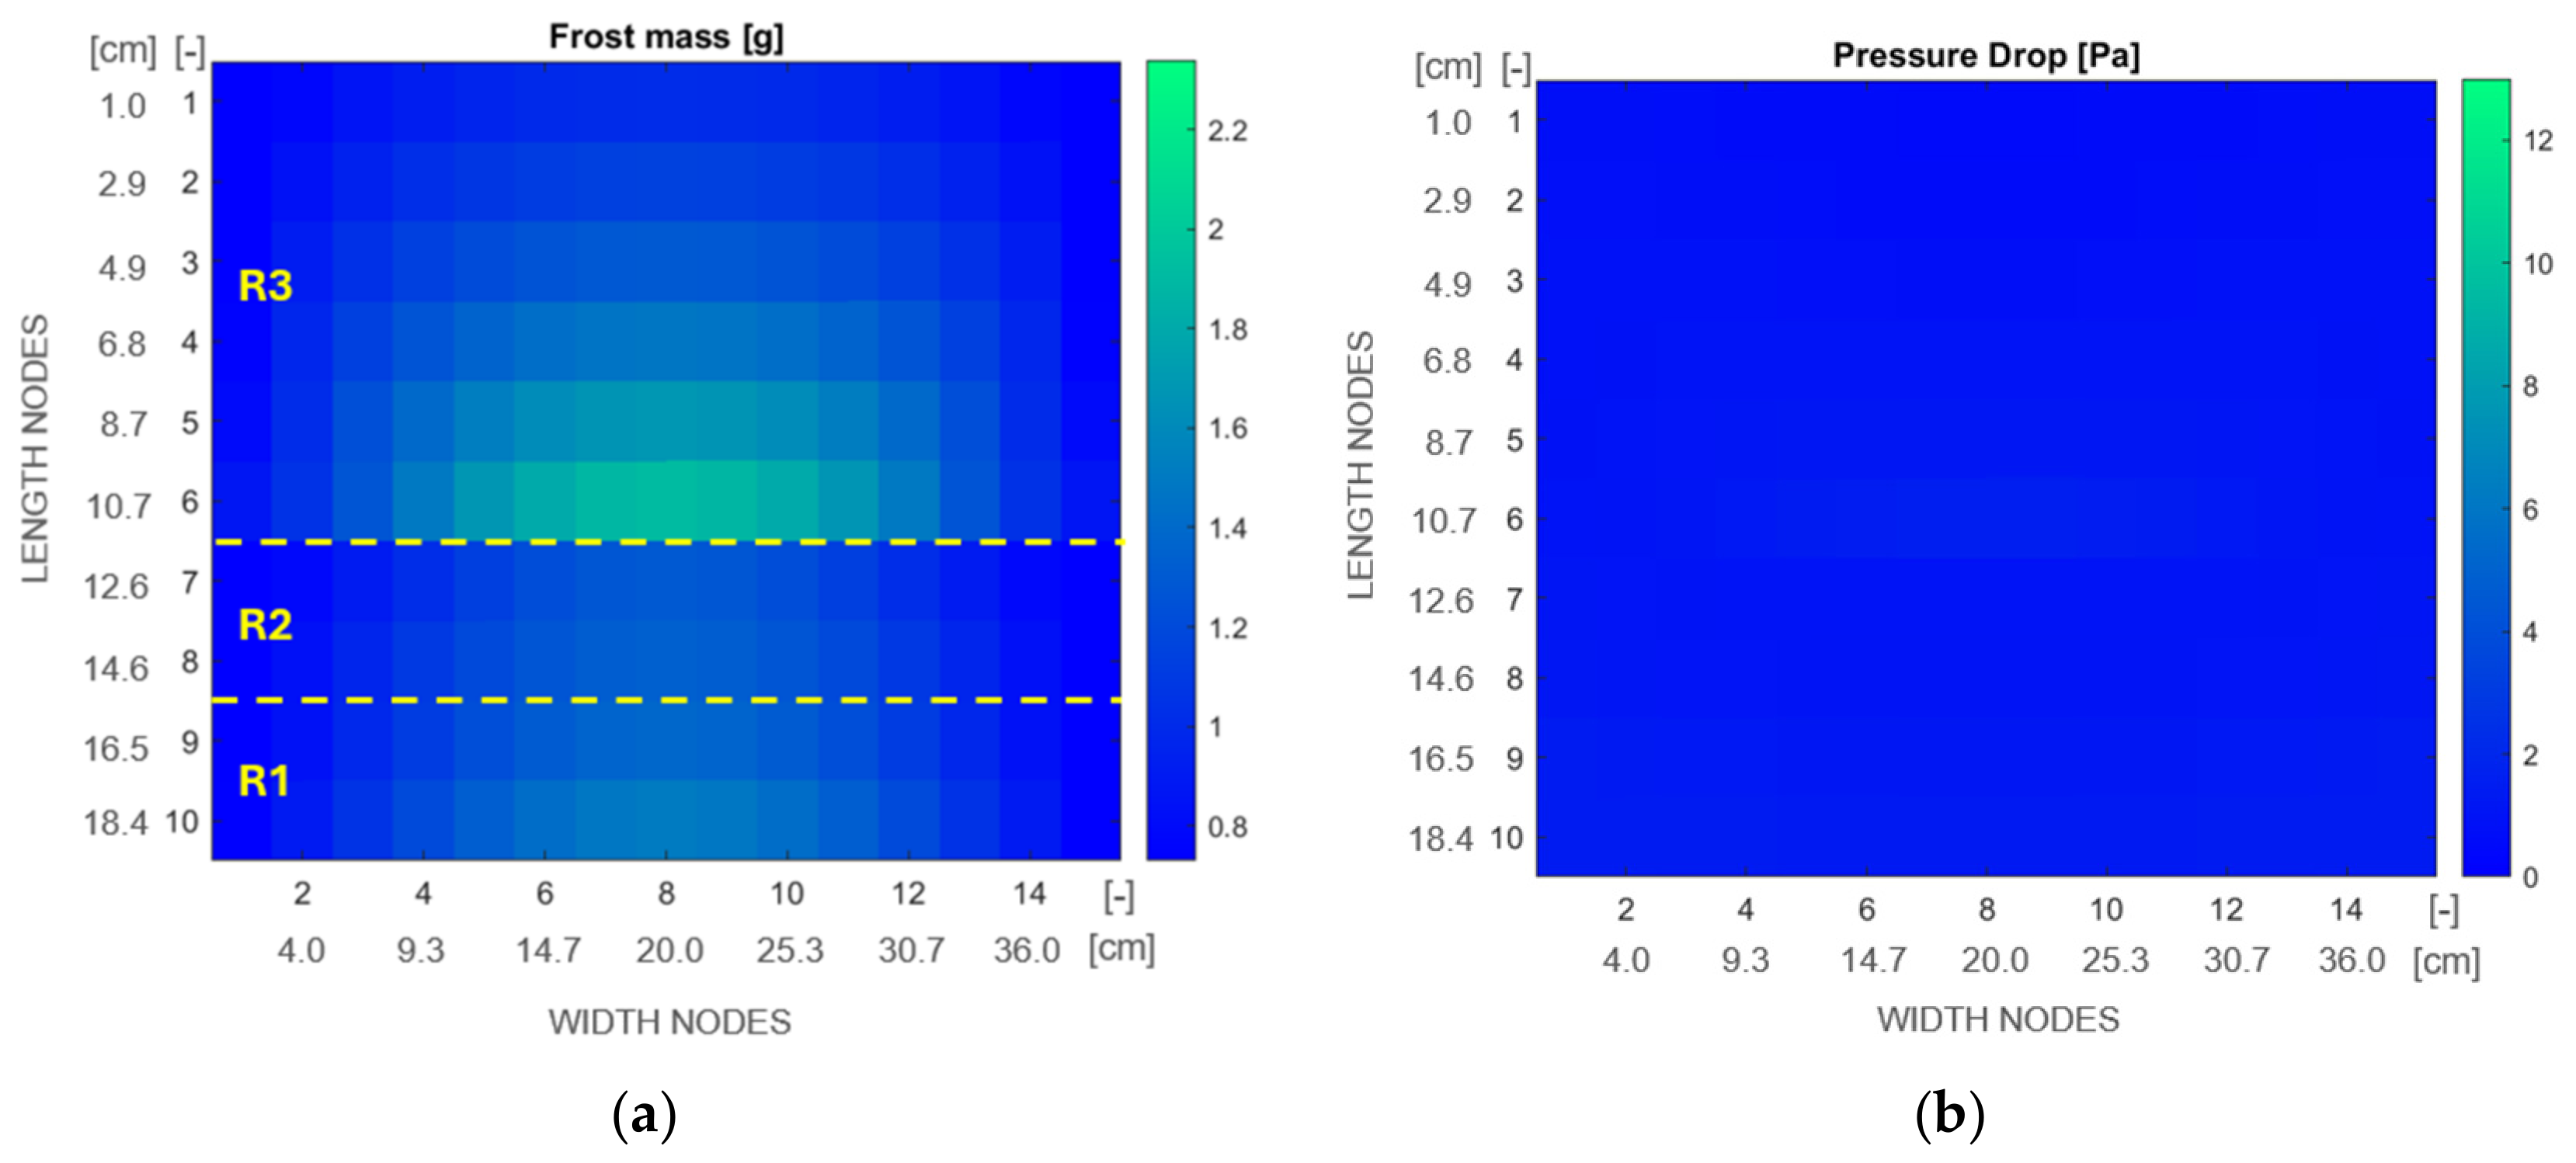
A localized analysis of the modified geometry after 500 min of operation is presented in Figure 11. Compared to the baseline (Figure 8a), the new configuration exhibits a more homogenized frost mass distribution (Figure 11a). Although the central section remains the primary site of accumulation, the peak frost mass was mitigated from 2.3 g to 1.8 g, allowing other regions of the evaporator to accommodate part of the frost mass, thereby delaying localized blockage. This reduction in localized blockage had a direct impact on the system hydraulic behavior; as illustrated in Figure 11b, the geometric modification attenuated the air pressure drop in the central region from 13 Pa (baseline, Figure 8b) to lower than 5 Pa.
Figure 11.
Analysis of reduced R3 fin density: (a) local frost mass and (b) air pressure drop.
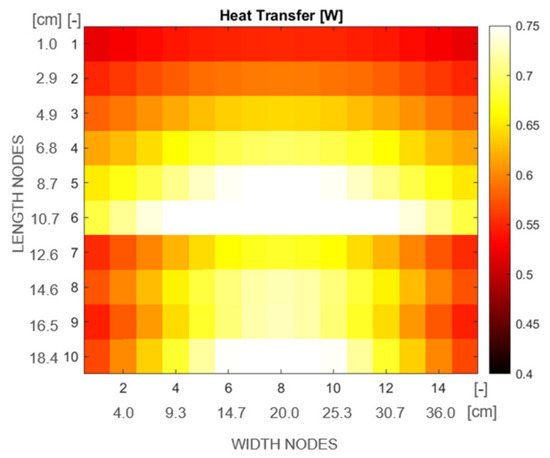
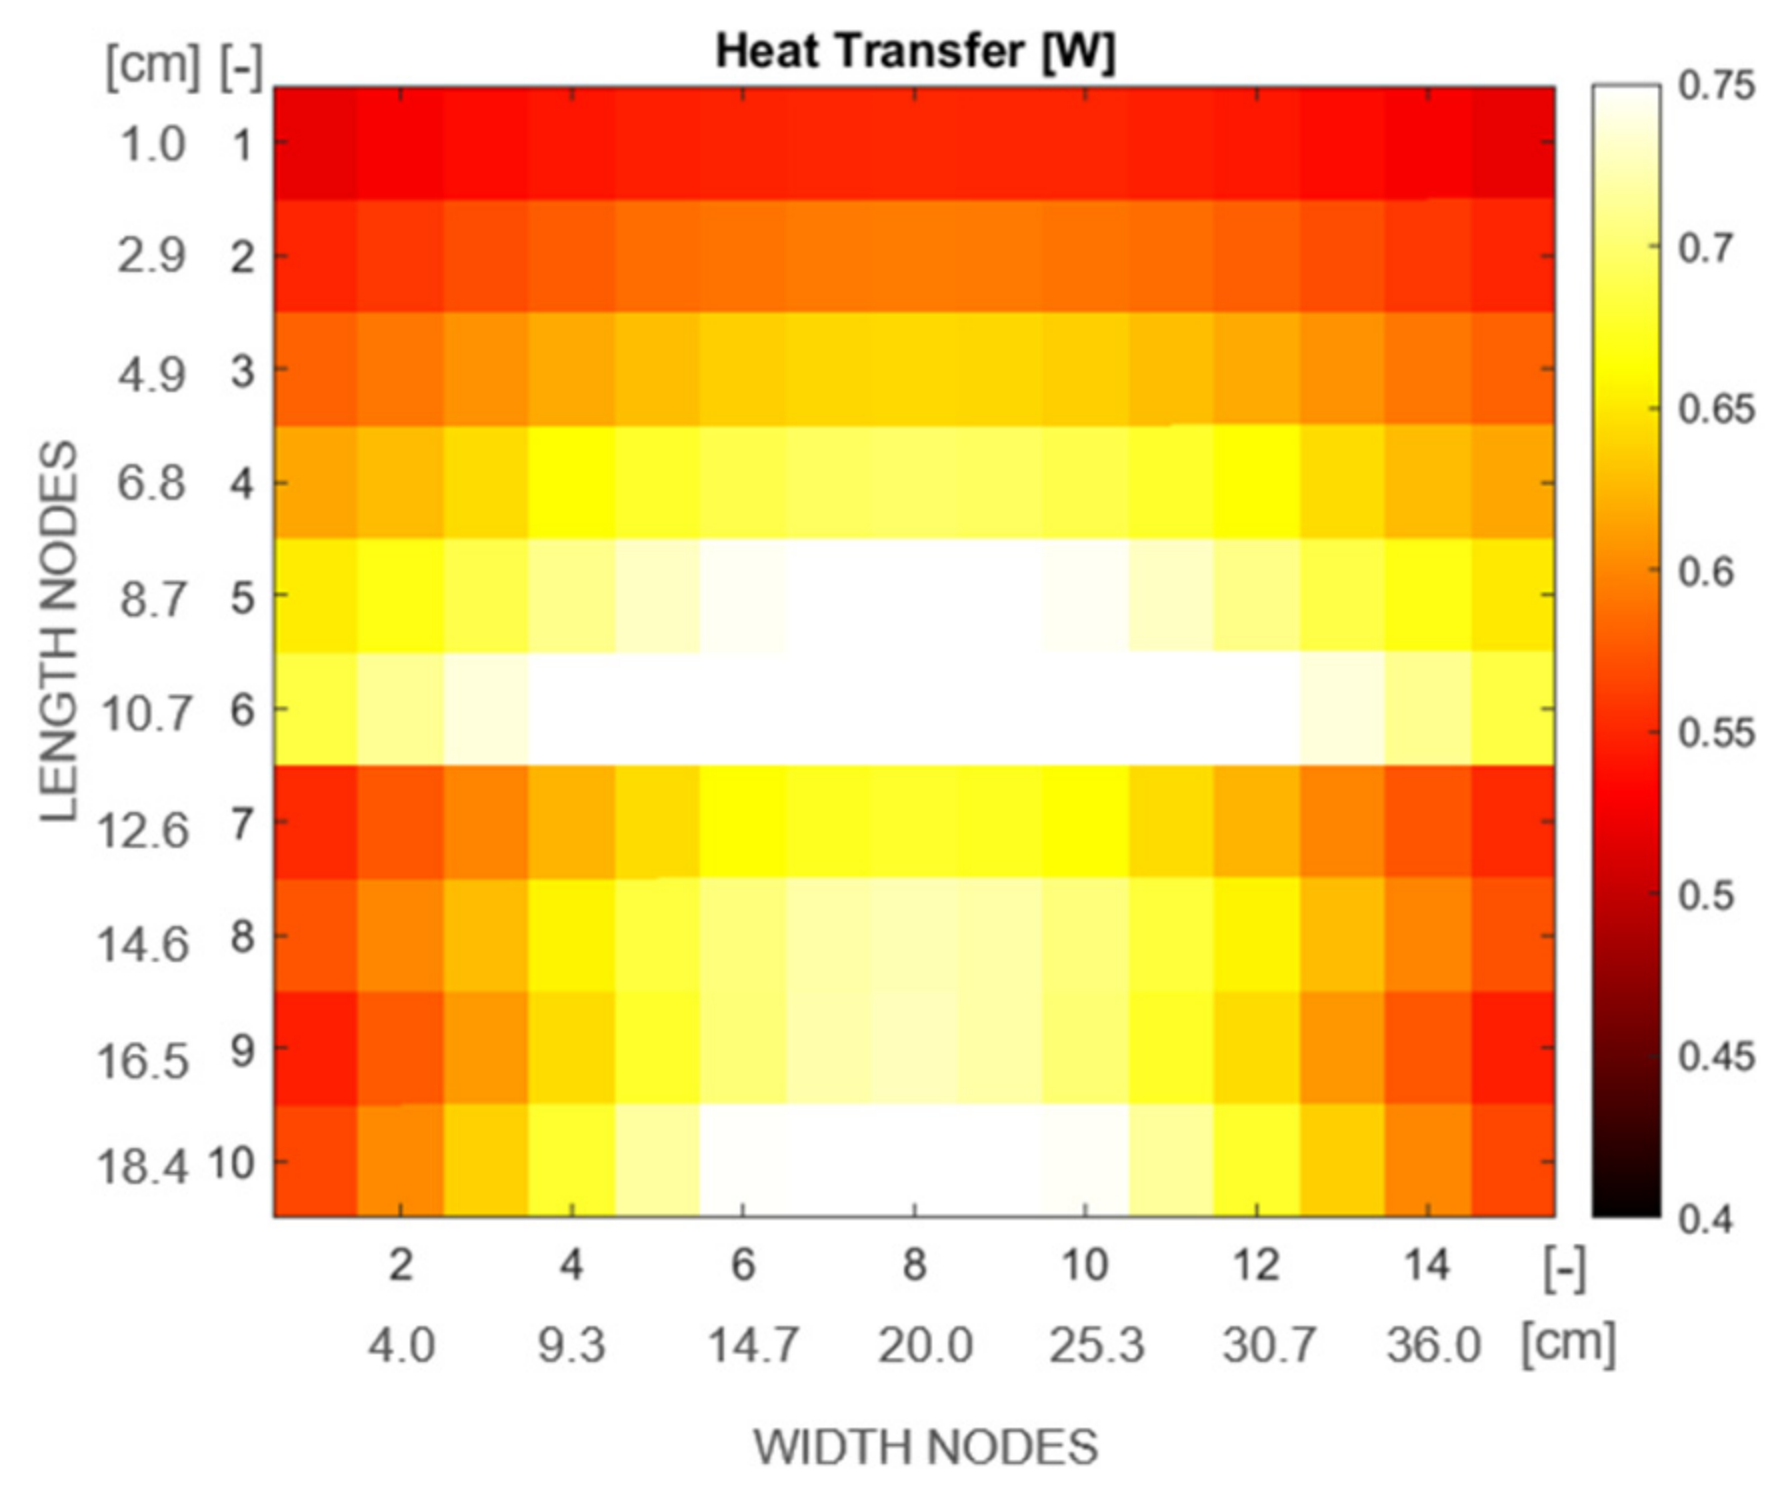
The collective impact of these characteristics resulted in the recovery of the previously underutilized heat transfer areas identified in the baseline (Figure 9b), promoting a more homogeneous thermal distribution across the evaporator surface, as can be observed in Figure 12. Notably, in contrast to the baseline results, the modified design ensures that no control volume presents a heat transfer rate lower than 0.55 W, effectively eliminating the dead zones observed in the original geometry.
Figure 12.
Local heat transfer rate for reduced R3 fin density.
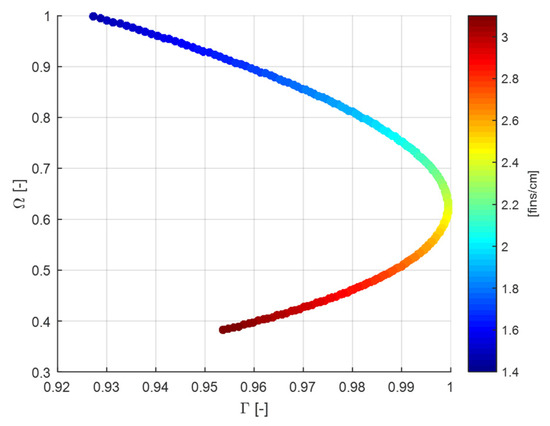
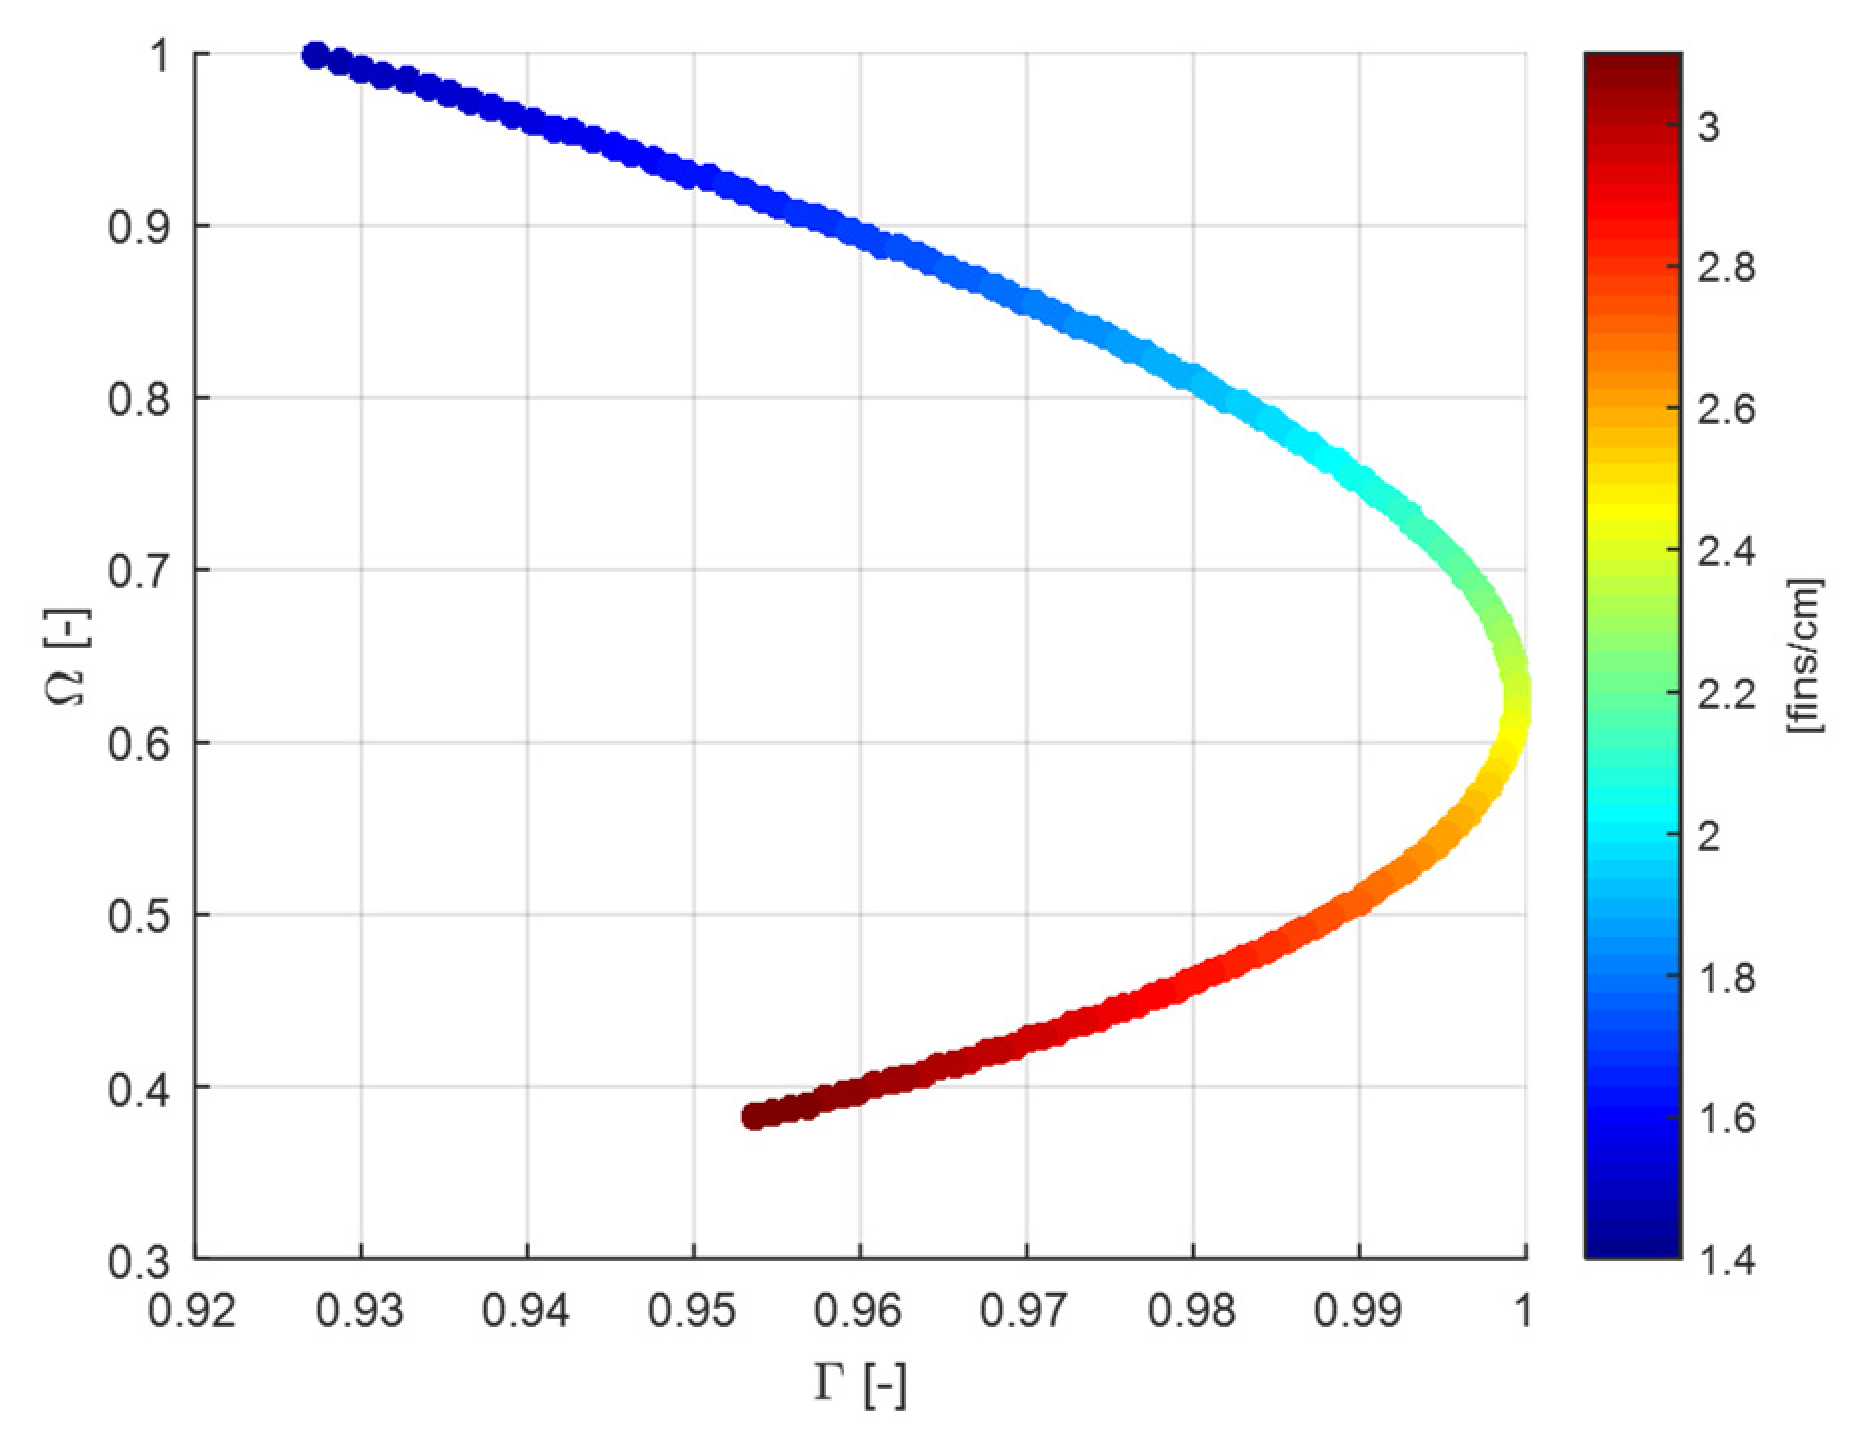
To conduct a more generalized assessment of the influence of region R3 geometry, a parametric study was performed by varying the fin density from 1.4 to 3.0 fins/cm while maintaining a constant total surface area of 0.84 m2. To evaluate the trade-off between early thermal performance and long-term frost resilience, the resulting evaporator performance was quantified using two normalized competing indices: Γ = Q0/Q0,max and Ω = θ100/θ100,max. Here, Γ quantifies the initial cooling performance relative to the best-case scenario, while Ω evaluates frost resilience by comparing the duration of effective operation, defined as the ratio between time until the capacity drops to a specific value (in this study, 100 W) to the maximum observed time.
The analysis of Figure 13 reveals that high fin densities (~3.0 fins/cm) constitute sub-optimal solutions; this is primarily attributed to accelerated frost blockage and the unfavorable interaction between the excessive air-side pressure drop and the fan characteristic curve, which results in lower values for both Γ and Ω. Reducing the fin density to 2.4 fins/cm produces a configuration that maximizes Γ while maintaining intermediate frost resilience (Ω ~0.65). Beyond this point lies a region of practical design interest. Selecting a geometry within this zone is advantageous as it balances the trade-off between initial cooling capacity and frost resilience, ensuring that performance gains in one objective do not lead to disproportionate losses in the other. This compromise is desirable to enable longer operating cycles of the refrigeration system to reduce defrost frequency.
Figure 13.
Sensitivity of the evaporator performance indices Γ and Ω to variations in the fin density of region R3.
5. Final Remarks
This study presented a two-dimensional computational model developed to analyze the effects of non-uniform frost accretion on the performance of evaporators of household refrigerators. The model considers three distinct fin densities regions, the fan characteristic curve and the mixture of air streams coming from both refrigerated and freezer compartments. Experimental tests were conducted to validate the computational model, including the visualization and measurement of the frost layer thickness, air pressure drop, accumulated mass of frost and heat transfer rate. While the proposed model demonstrated good agreement with experimental data across the investigated boundary conditions, it is important to acknowledge the role of simplifications and underlying empirical coefficients on the model general applicability. The main findings of this study are summarized as follows:
- Computational model analysis shows that abrupt transitions in fin density can create a bottleneck effect, inducing early and localized airflow blockage, as well as dead zones in terms of heat transfer rate.
- Geometries designed for uniform frost mass distribution significantly improve evaporator resilience by minimizing the negative impacts of frost buildup.
- The analysis using proposed dimensionless parameters showed that the selection of fin density in a ‘no-frost’ evaporator should seek an equilibrium between initial cooling capacity and robustness against frost formation.
- Excessive fin densities not only reduce initial cooling capacity, due to higher air pressure drops, but also promote premature frost blockage.
- On the other hand, low fin densities extend evaporator operation under frost formation conditions; however, they also result in lower initial cooling capacities.
Author Contributions
Conceptualization, C.J.L.H. and C.A.R.N.; methodology, C.J.L.H., D.L.D.S. and A.S.S.; formal analysis, D.L.D.S. and D.Z.C.S.; investigation, D.L.D.S. and D.Z.C.S.; resources, C.J.L.H. and A.S.S.; data curation, D.L.D.S. and D.Z.C.S.; writing—original draft preparation, D.L.D.S. and D.Z.C.S.; writing—review and editing, D.L.D.S. and C.J.L.H.; project administration, C.J.L.H.; funding acquisition, C.A.R.N. All authors have read and agreed to the published version of the manuscript.
Funding
The financial support from Electrolux and Embrapii (Grant No. PPOL-2206.0033) and the INCT Program (CNPq Grant No. 404023/2019-3; FAPESC Grant No. 2019TR0846) are duly acknowledged.
Data Availability Statement
The datasets presented in this article are not readily available because they are proprietary. Requests to access the datasets should be directed to carlos.richter@electrolux.com or hermes@polo.ufsc.br.
Acknowledgments
The authors are thankful to Marcelo Campani (Electrolux) for championing this research project, and to Breno Borges, Henrique Eberth and Rodrigo dos Reis (former undergrad students at POLO), for their help with the experimental work.
Conflicts of Interest
Author Carlos A. R. Nascimento was employed by the company Electrolux do Brasil S.A. The remaining authors declare that the research was conducted in the absence of any commercial or financial relationships that could be construed as a potential conflict of interest. The authors declare that this study received funding from Electrolux and Embrapii. The funder was not involved in the study design, collection, analysis, interpretation of data, the writing of this article or the decision to submit it for publication.
Nomenclature
| Roman Symbols | ||
| A | area | [m2] |
| c | specific heat | [J∙kg−1∙K−1] |
| coefficient | [as applicable] | |
| D | water vapor diffusivity | [m2∙s−1] |
| f | friction factor | [-] |
| FF | fresh-food | [-] |
| FZ | freezer | [-] |
| H | evaporator height | [m] |
| h | conv. heat transfer coefficient | [W∙m−2∙K−1] |
| L | latent heat of desublimation | [kJ∙kg−1] |
| j | Colburn j factor | [-] |
| k | thermal conductivity | [W∙m−1∙K−1] |
| L | evaporator length | [m] |
| Le | Lewis Number | [-] |
| m | mass flux | [kg∙m−2∙s−1] |
| mass flow | [kg∙s−1] | |
| P | perimeter | [m] |
| p | pressure | [Pa] |
| q | heat flux rate | [W∙m−2] |
| Q | cooling capacity | [W] |
| T | temperature | [°C] |
| t | time | [s] |
| U | overall heat transfer coefficient | [W∙K−1] |
| volumetric air flow | [m3∙h−1] | |
| W | evaporator width | [m] |
| x | thickness | [m] |
| Greek Symbols | ||
| β | surface area density | [m−1] |
| ε | frost porosity | [-] |
| Δ | variation | [-] |
| Γ | cooling capacity ratio | [-] |
| η | effectiveness | [-] |
| λ | latent heat of desublimation | [J∙kg−1] |
| θ | time | [s] |
| ρ | density | [kg∙m−3] |
| Ω | time ratio | [-] |
| τ | frost tortuosity | [-] |
| ω | humidity ratio | [kgv∙kg−1] |
| ξ | convergence tolerance | [-] |
| Subscripts | ||
| 0 | initial | |
| 100 | reference cooling capacity of 100 W | |
| a | air | |
| b | brine | |
| c | core | |
| d | densification | |
| dew | dew-point | |
| f | frost | |
| g | growth | |
| fan | fan | |
| i | vertical position | |
| j | horizontal position | |
| max | maximum | |
| s | frost surface | |
| sat | saturation | |
| sys | system | |
| w | evaporator wall | |
References
- Zhang, Y.; Liu, X.; Chen, H.; Wang, R. Experimental study on the effects of melted frost icing on the operating performances of air source heat pump. Appl. Therm. Eng. 2024, 238, 122136. [Google Scholar] [CrossRef] [Scilit]
- Hermes, C.J.L.; Boeng, J.; Da Silva, D.L.; Knabben, F.T.; Sommers, A.D. Evaporator Frosting in Refrigerating Appliances: Fundamentals and Applications. Energies 2021, 14, 5991. [Google Scholar] [CrossRef] [Scilit]
- Liu, S.; Li, P.; Pu, J.; Zhang, H.; Jiang, Y.; Wang, Y.; Wan, Z.; Wang, Z.; You, S.; Wu, Z. A real-time frost thickness prediction model via evaporator resistance identification. Energy Build. 2026, 354, 116964. [Google Scholar] [CrossRef] [Scilit]
- Krasota, D.; Błasiak, P.; Kolasiński, P. Literature Review of Frost Formation Phenomena on Domestic Refrigerators Evaporators. Energies 2023, 16, 2945. [Google Scholar] [CrossRef] [Scilit]
- Na, B.; Webb, R.L. A fundamental understanding of factors affecting frost nucleation. Int. J. Heat Mass Transf. 2003, 46, 3797–3808. [Google Scholar] [CrossRef] [Scilit]
- Gardner, D.B.; Wang, H. Critical review of modeling, measurement, and prediction of ice nucleation on surfaces. Int. J. Refrig. 2024, 163, 32–44. [Google Scholar] [CrossRef] [Scilit]
- Mao, N.; Nishimura, K.; Gong, J.; Takayashiki, M.; Sciazko, A.; Komatsu, Y.; Tang, J.; Shikazono, N. Prediction of heat and mass transfer inside 3D frost microstructure. Appl. Therm. Eng. 2024, 247, 122978. [Google Scholar] [CrossRef] [Scilit]
- Hermes, C.J.L.; Sommers, A.D.; Gebhart, C.W.; Nascimento, V.S. A semi-empirical model for predicting frost accretion on hydrophilic and hydrophobic surfaces. Int. J. Refrig. 2017, 87, 164–171. [Google Scholar]
- Bertelsen, J.M.; Lowrey, S.; Sommers, A.D. Facilitating water droplet removal from surfaces using air flow and wettability gradients. Appl. Therm. Eng. 2025, 258, 124590. [Google Scholar] [CrossRef] [Scilit]
- Hermes, C.J.L.; Piucco, R.O.; Barbosa, J.R.; Melo, C. A study of frost growth and densification on flat surfaces. Exp. Therm. Fluid Sci. 2009, 33, 371–379. [Google Scholar] [CrossRef] [Scilit]
- Hassan, H.; Akbar, H.; Malik, A.N.; Nawaz, T.; Elahi, H.; Rahman, H.U.; Lazoglu, I. Frost detection and thickness estimation using a transformer-based semantic segmentation model. Int. J. Refrig. 2026, 186, 106899. [Google Scholar] [CrossRef] [Scilit]
- Da Silva, D.L.; Hermes, C.J.L. Optimal defrost cycle for air coolers revisited: A study of fan-supplied tube-fin evaporators. Int. J. Refrig. 2018, 89, 142–148. [Google Scholar] [CrossRef] [Scilit]
- Braun, L.P.B.; Reis, R.G.; Nascimento, C.A.R.; Silveira, A.S.; Hermes, C.J.L. Experimental Study of the Cross-Influence of Frost Morphology and Defrost Strategy on the Performance of Tube-Fin Evaporators of Household Refrigerators. Thermo 2025, 5, 32. [Google Scholar] [CrossRef] [Scilit]
- Hayashi, Y.; Aoki, A.; Adachi, S.; Hori, K. Study of Frost Properties Correlating with Frost Formation Types. J. Heat Transf. 1977, 99, 239–245. [Google Scholar] [CrossRef] [Scilit]
- Da Silva, D.L.; Melo, C.; Hermes, C.J.L. Effect of frost morphology on the thermal-hydraulic performance of fan-supplied tube-fin evaporators. Appl. Therm. Eng. 2017, 111, 1060–1068. [Google Scholar] [CrossRef] [Scilit]
- Sarmiento, A.P.; de Sá Sarmiento, F.I.P.; Shooshtari, A.; Ohadi, M. A review of recent progress in active frost prevention/control techniques in refrigeration and HVAC systems. Appl. Therm. Eng. 2024, 253, 123680. [Google Scholar] [CrossRef] [Scilit]
- Xiong, T.; Liu, G.; Gao, Q.; Yan, G.; Yu, J. Thermal-hydraulic and drainage performance of microchannel heat exchangers for refrigeration and heat pump systems under frosting, defrosting, and wet conditions: A comprehensive review. J. Build. Eng. 2023, 64, 105654. [Google Scholar] [CrossRef] [Scilit]
- Luo, B.; Li, F.; Wu, S.; Shi, K.; Ding, Y.; Zhao, R.; Huang, D.; Shi, W. Experimental investigation on airside thermal-hydraulic performance of vertical-fin microchannel heat exchangers. Int. J. Refrig. 2025, 173, 167–179. [Google Scholar] [CrossRef] [Scilit]
- Liang, D.; Cui, W. Effects of Fin Length on Frosting and Defrosting Characteristics of Small-Diameter Copper Tube-Fin Heat Exchangers. Appl. Sci. 2026, 16, 4663. [Google Scholar] [CrossRef] [Scilit]
- Babadi, M.N.; Cho, Y.; Kang, S.; Yeom, E. Experimental and numerical analysis of frost formation in household refrigerators: Evaluating the effects of fin removal in front of the return duct. Int. J. Heat Mass Transf. 2025, 250, 127293. [Google Scholar] [CrossRef] [Scilit]
- Alarcón, D.; Marchante Avellaneda, J.; Hassan, A.H.; Navarro, E. Experimental study about frost formation and growth in the evaporator of an air-to-water heat pump. Int. J. Refrig. 2025, 179, 295–303. [Google Scholar] [CrossRef] [Scilit]
- Alvandifar, N.; Kristófersson, J.; Forooghi, P. Frost formation non-uniformity in a multi-circuit V-shape evaporator. Int. J. Refrig. 2024, 157, 137–149. [Google Scholar] [CrossRef] [Scilit]
- Wang, Q.; Li, H.; Zhao, Y.; Chen, X. Experimental study and performance evaluation of an air source heat pump (ASHP) system with a frost-free evaporator. J. Clean. Prod. 2024, 448, 141469. [Google Scholar] [CrossRef] [Scilit]
- Sui, Y.; Sui, Z.; Liang, G.; Wu, W. Superhydrophobic Microchannel Heat Exchanger for Electric Vehicle Heat Pump Performance Enhancement. Sustainability 2023, 15, 13998. [Google Scholar] [CrossRef] [Scilit]
- Wu, S.; Zhao, R.; Huang, D.; Sun, Y.; Wei, X. Effect of non-uniform temperature & humidity distribution in the frontal airflow on evaporator frosting performance of a frost-free refrigerator. Int. J. Refrig. 2021, 123, 150–158. [Google Scholar] [CrossRef] [Scilit]
- Yang, S.; Liu, Z.; Fu, B.; Chen, Y. Influence of Frost Growth and Migration in Cryogenic Heat Exchanger on Air Refrigerator. Appl. Sci. 2019, 9, 753. [Google Scholar] [CrossRef] [Scilit]
- Borges, B.N.; Melo, C.; Hermes, C.J.L. Transient simulation of a two-door frost-free refrigerator subjected to periodic door opening and evaporator frosting. Appl. Energy 2015, 147, 386–395. [Google Scholar] [CrossRef] [Scilit]
- Knabben, F.T.; Hermes, C.J.L.; Melo, C. In-situ study of frosting and defrosting processes in tube-fin evaporators of household refrigerating appliances. Int. J. Refrig. 2011, 34, 2031–2041. [Google Scholar] [CrossRef] [Scilit]
- Stoecker, W.F. How frost formation on coils affects refrigeration systems. Refrig. Eng. 1957, 65, 42–46. [Google Scholar]
- Silva, D.Z.C.; Eberth, H.; Richter, C.; Da Silva, D.L.; Hermes, C.J.L. Two-Dimensional First-Principles Model for Uneven Frost Accretion in ‘No-Frost’ Evaporators. In Proceedings of the 20th International Refrigeration and Air Conditioning Conference at Purdue, Herrick Conferences, West Lafayette, IN, USA, 15–18 July 2024. [Google Scholar]
- Wang, T.; Chen, H.; Qu, H.; Zhao, Y.; Lei, X.; Yang, P.; Liu, Y. Optimization of distributed defrost heaters for enhanced performance in frost-free refrigerators. Int. J. Refrig. 2026, 181, 293–305. [Google Scholar] [CrossRef] [Scilit]
- Negrelli, S.; Hermes, C.J.L. A semi-empirical correlation for the thermal conductivity of frost. Int. J. Refrig. 2015, 58, 243–252. [Google Scholar] [CrossRef] [Scilit]
- Kays, W.M.; London, A.L. Compact Heat Exchangers, 3rd ed.; McGraw-Hill: New York, NY, USA, 1984. [Google Scholar]
- Da Silva, D.L.; Hermes, C.J.L.; Melo, C. First-principles modeling of frost accumulation on fan-supplied tube-fin evaporators. Appl. Therm. Eng. 2011, 31, 2616–2621. [Google Scholar] [CrossRef] [Scilit]



Disclaimer/Publisher’s Note: The statements, opinions and data contained in all publications are solely those of the individual author(s) and contributor(s) and not of MDPI and/or the editor(s). MDPI and/or the editor(s) disclaim responsibility for any injury to people or property resulting from any ideas, methods, instructions or products referred to in the content. |
© 2026 by the authors. Licensee MDPI, Basel, Switzerland. This article is an open access article distributed under the terms and conditions of the Creative Commons Attribution (CC BY) license.