


Abstract
Bridging the gap between theoretical heat exchanger analysis and physical intuition remains a persistent challenge in engineering education, particularly when students are confronted with real-system effects such as pressure losses, measurement uncertainty, and deviations from simplified models. This work addresses this challenge through the coupled development of a pedagogical framework and an experimental platform. A modular heat exchanger test bench was conceived, designed, and constructed by graduate students within a structured project-based learning environment, in which competitive and cooperative phases were combined to emulate real engineering practice. This approach positions the test bench not only as a laboratory tool, but as the outcome of an active learning process that integrates system design, instrumentation, and modeling. The resulting platform enables the comparative study of multiple heat exchanger technologies—including three water-to-water heat exchangers (plate, shell-and-tube, and double-pipe) and one air-to-water fin-and-tube heat exchanger—under parallel, counterflow, and crossflow arrangements across a wide range of operating conditions. Comprehensive instrumentation (temperature, flow rate, and pressure measurements) supports rigorous energy balance analysis, effectiveness evaluation, and hydraulic performance assessment. Beyond undergraduate experimentation, the test bench provides a framework for advanced learning objectives, including uncertainty propagation, -NTU analysis, model development, and experimental validation. The confrontation between model predictions and experimental data, including observed discrepancies, is shown to play a central role in developing critical engineering judgment. The proposed approach demonstrates how the integration of project-based learning with a reconfigurable experimental platform can create a sustainable and scalable environment for heat transfer education.
1. Introduction
Heat exchangers play a central role in thermal and energy engineering systems, ranging from power generation and refrigeration to chemical processing and building services. Their analysis constitutes a fundamental component of mechanical, chemical, and energy engineering curricula, as it requires the combined application of thermodynamics, heat transfer, and fluid mechanics. Classical design and analysis rely on global energy balances, the -NTU formalism, and semi-empirical correlations for heat transfer and pressure losses [1,2].
In parallel, recent research has explored a wide range of approaches, including the development of advanced experimental test facilities [3] and detailed studies of heat transfer performance under varying operating conditions [4], as well as data-driven methods for monitoring and predicting heat exchanger behavior [5].
While these classical analysis tools are essential, students often struggle to develop physical intuition about real heat exchanger behavior, particularly when confronted with real-system effects such as pressure drop, heat losses to the surroundings, measurement uncertainty, and deviations from theoretical predictions. This difficulty is further exacerbated by the separation between theoretical instruction and experimental practice, where laboratory activities are often limited in scope or disconnected from system-level understanding. As a result, students may develop a formula-driven approach without fully grasping the underlying physical trade-offs encountered in real engineering systems.
Traditional teaching approaches that primarily rely on lectures and analytical exercises may reinforce a formula-driven view of heat exchanger analysis. Numerous studies have demonstrated that active and hands-on learning strategies significantly improve student engagement, conceptual understanding, and retention in engineering education [6,7]. In the context of heat transfer, laboratory-based activities that allow students to manipulate operating conditions and observe system responses have been shown to foster deeper understanding of thermal phenomena and modeling assumptions [8].
Over the last two decades, educational research has increasingly emphasized project-based learning (PBL), challenge-based learning (CBL), and cooperative learning frameworks as means to better align engineering education with professional practice. PBL has been widely adopted in engineering education as a means to expose students to open-ended problems, long-term planning, and the integration of multiple technical skills. In thermal and aerospace engineering contexts, PBL has been shown to enhance system-level understanding and student autonomy [9]. CBL further emphasizes problem-solving under constraints by framing learning activities as concrete challenges inspired by real-world engineering scenarios. Studies report that CBL can increase motivation and encourage iterative exploration, particularly when performance objectives are clearly defined [10].
Complementary to these approaches, cooperative learning frameworks focus on structured collaboration, shared responsibility, and peer interaction. Extensive evidence indicates that cooperative learning improves both academic performance and interpersonal skills in engineering programs [11]. Together, these pedagogical strategies aim to bridge the gap between academic instruction and professional engineering practice. In addition, competition-based learning has been explored as a mechanism to stimulate early engagement and motivation. When carefully integrated into a pedagogical design, competitive elements can promote initiative and rapid exploration without undermining collaboration [12]. Recent educational models increasingly advocate for hybrid structures that combine competitive and cooperative phases, thereby reflecting the dynamics of real engineering projects. Research demonstrates that mixed strategies combining both competitive and cooperative elements yield superior learning outcomes in project management education [13], with evidence from software engineering contexts showing that such hybrid approaches address the evolving demands of engineering teaching methodology [14]. However, these pedagogical approaches are most effective when supported by experimental platforms explicitly designed to reflect these learning objectives. In this context, the design of the experimental system itself becomes an integral part of the learning process, rather than a passive support for pre-defined laboratory activities.
In the specific case of heat exchanger education, several laboratory test benches have been proposed to support hands-on learning. Many existing setups focus on a single heat exchanger type, such as shell-and-tube or double-pipe configurations, and are primarily intended to validate theoretical heat transfer and effectiveness correlations [15]. Other platforms emphasize compact or low-cost designs suitable for undergraduate laboratories but remain limited in configurability and comparative capability [16]. While these experiments are pedagogically valuable, they often do not allow students to directly compare different heat exchanger technologies under similar boundary conditions, nor do they explicitly address the discrepancies between idealized models and experimental measurements. As a result, key engineering trade-offs—such as the balance between thermal effectiveness and hydraulic penalty, or the influence of flow arrangement on global performance—may remain insufficiently explored within a single coherent laboratory framework. Moreover, these platforms are rarely developed within a pedagogical framework that actively involves students in their design and implementation, thereby limiting opportunities to integrate system-level thinking, instrumentation, and modeling within a unified learning experience.
The novelty of this work lies in the explicit integration of three elements that are typically addressed separately: (i) a structured project-based learning methodology, (ii) the design and implementation of a multi-configuration experimental platform, and (iii) a wide range of laboratory activities through which students manipulate experiments and can confront model predictions with experimental data.
The present work introduces a modular heat exchanger test bench in which the design and construction of the experimental platform are treated as core elements of the educational process. The associated learning objectives are threefold. First, the system was designed and constructed by graduate students within a structured pedagogical framework evolving over the academic year: an initial competitive phase promotes engagement and exploration, followed by a cooperative phase in which the cohort operates as a single engineering team with self-assigned tasks of varying difficulty and duration. Second, the platform enables undergraduate students to investigate multiple heat exchanger technologies under different flow arrangements using a common measurement infrastructure. Third, graduate students gain hands-on experience in measurement techniques, uncertainty analysis, and data post-processing, while applying the -NTU approach, comparing results with manufacturer data, and developing and validating heat exchanger models. This perspective establishes a direct link between educational methodology and experimental capabilities, enabling students to engage with heat exchanger analysis at multiple levels of complexity, from fundamental principles to model-based validation.
The structure of the paper follows the aforementioned topics. Section 2 presents the newly developed project-based learning methodology. Section 3 describes the test-bench architecture, instrumentation, and the geometric characteristics of the studied heat exchangers. Section 4 discusses the hands-on laboratory sessions, for both graduate and undergraduate students, illustrating how experimental results can enhance understanding of heat exchanger performance, limitations, and trade-offs.
2. Design and Construction of a Laboratory Test Bench Through Project-Based Learning
The test bench was designed by graduate students, with a strong emphasis on technical development and hands-on practical work. The entire cohort of 18 students was tasked with designing and developing an educational test bench to illustrate heat transfer phenomena across various heat exchanger configurations. The main requirement was to develop a test bench capable of experimentally assessing the thermal and hydraulic performance of multiple heat exchanger technologies. During this course, a novel project-based learning strategy was implemented to mirror industry project management practices. The project was conceived and supervised by one academic and four teaching assistants. In addition, three other academics were invited to the students’ presentation to provide feedback and share their perspectives on the project.
2.1. Intended Learning Outcome
During this project, the students developed both technical and soft skills, such as:
- the ability to manage and to carry out a project in the energy field;
- the ability to establish synergy between theoretical and practical aspects;
- an applied sciences approach (report structure, critical thinking, literature review);
- the analysis and criticism of experimental measurements;
- the management of a group project (planning, cost tracking, …);
- collaboration with technicians;
- the search for creativity when facing new challenges.
2.2. Technical Requirements
The test bench main requirements were established with the educational aspect as the main focus:
- The test bench should be easy to handle, and its components should be easily identifiable, while ensuring students’ safety during its use.
- The test bench should allow testing four heat exchangers: a plate heat exchanger, a double-pipe heat exchanger, a shell-and-tube heat exchanger, and a fin-and-tube heat exchanger. The direction of water flow in the heat exchangers should be reversible to enable both parallel and counterflow configurations.
- The test bench should be instrumented to be able to verify the first principle of thermodynamics.
- The working temperature and/or the flow rate should be controllable to be able to set the heat transfer rate or implement sudden changes in temperature or flow rate to test various operating conditions.
- The total cost of the test bench must remain within the allocated budget (a total of 6000 € was allocated for purchasing new components), while encouraging the use of existing lab equipment.
- The energy and water consumption during the utilization phase should be minimized.
The remaining features were defined by the students themselves, following the benchmark described in Section 3.1.
2.3. Pedagogical Philosophy
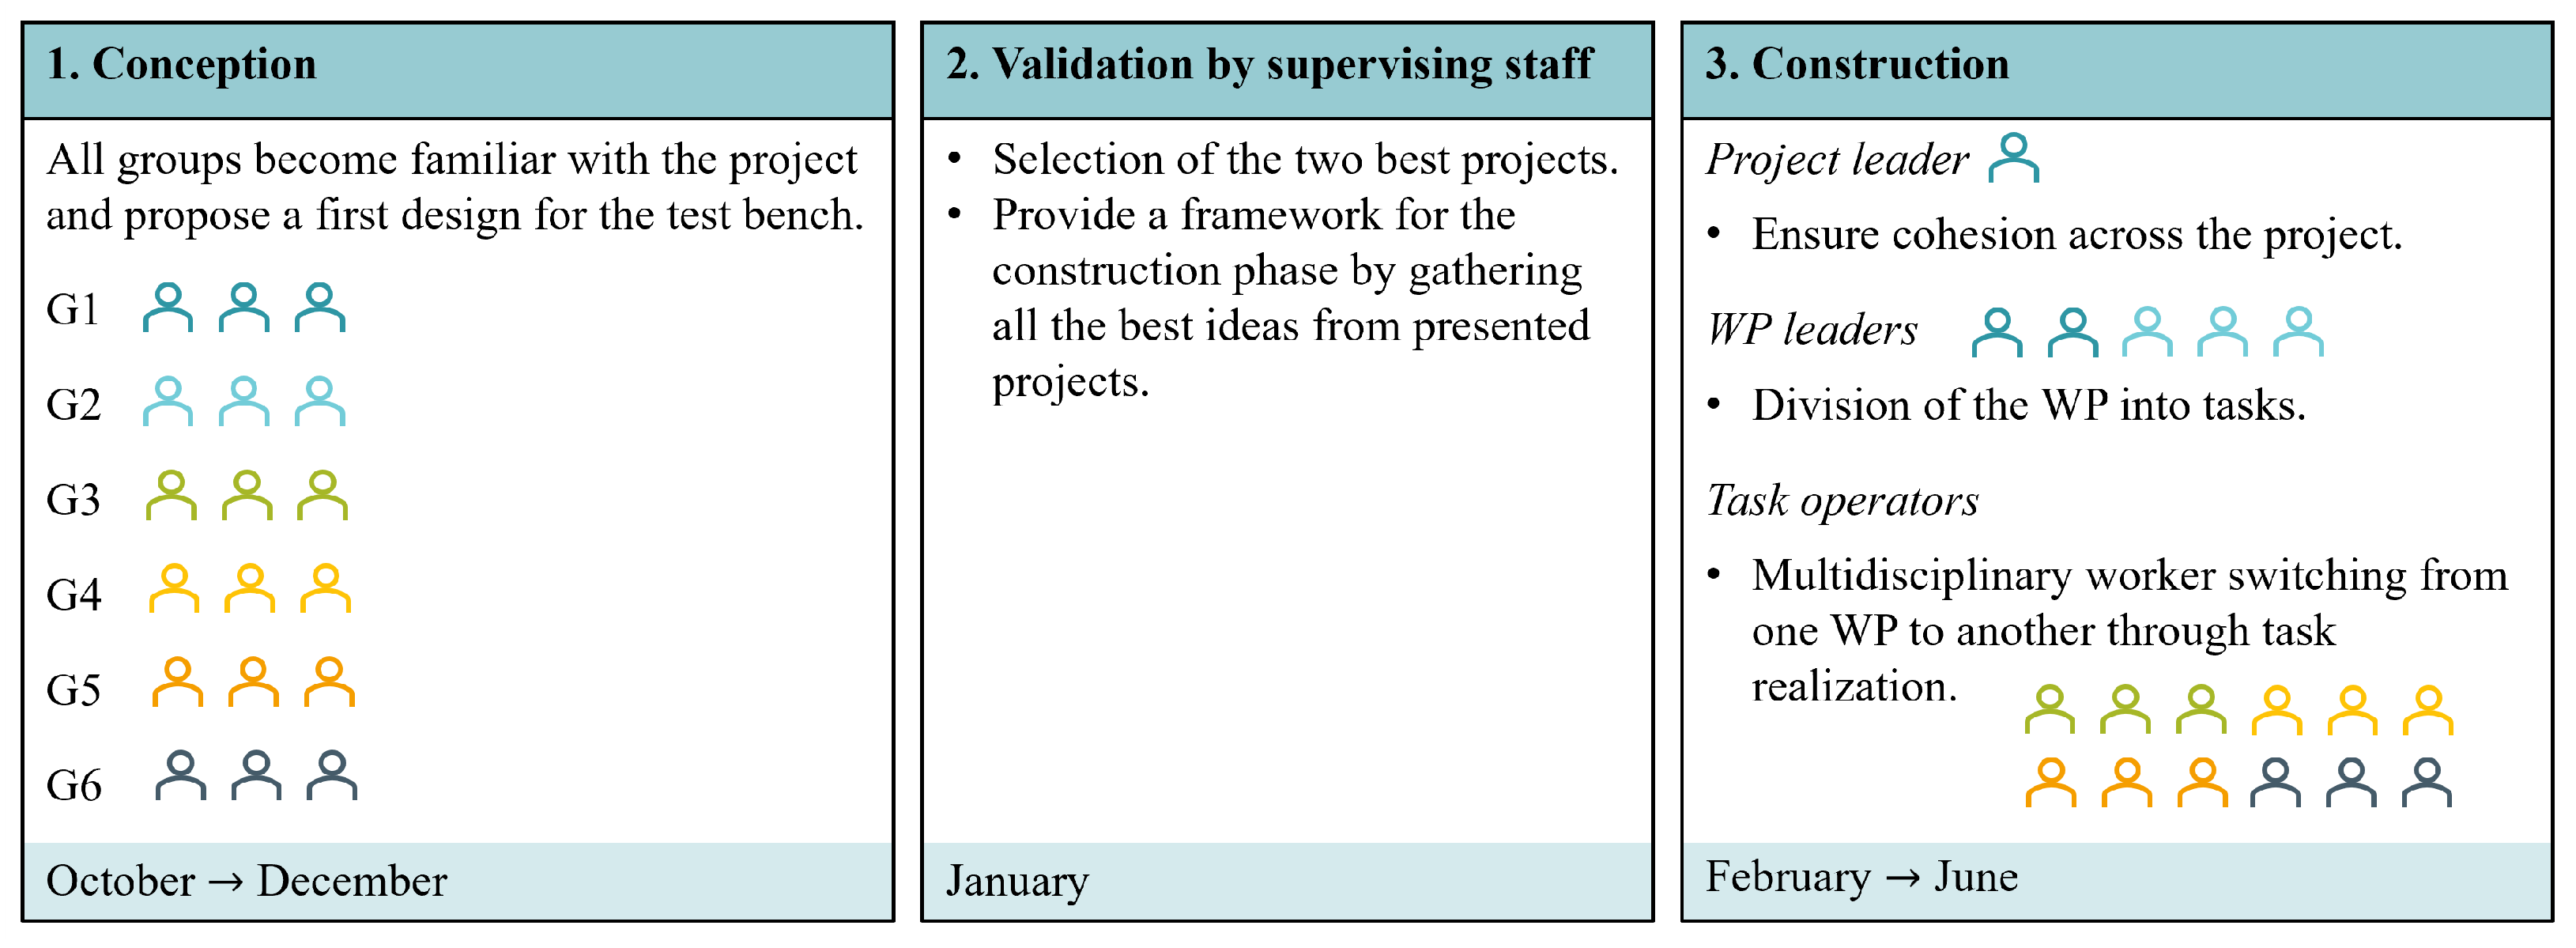
For this project, a novel pedagogical methodology was implemented, as illustrated in Figure 1. The project was divided into three main phases: design of the test bench by the students, validation of the design by the supervising staff, and construction of the test bench by the students, with assistance from technicians and academic staff. The project spanned a full academic year, with 3 months for the design phase, 1 month for the validation phase (which took place during the students’ exam period in the 1st semester), and 5 months for the construction phase.
Figure 1.
Illustration of the three major steps of the project according to the implemented pedagogical philosophy.
During the project’s design phase, the students worked in groups of three. Each group was asked to review the literature on existing educational test benches, prepare a P&ID, and present a first draft of the project budget. The design phase was organized as a contest between the groups to encourage creativity. The groups worked separately on their design, and the project drafts were evaluated independently. Finally, the best design was selected as the basis for the test bench.
Between the design and construction phases, the supervising staff reviewed all proposed designs and selected the groups whose proposals best met the defined criteria to serve as project leaders for the construction phase. Potential improvements in the students’ P&IDs were also suggested to ensure that all technical requirements were met.
During the construction phase, a project management strategy was implemented to achieve project objectives, foster cross-functional collaboration, and introduce students to team management. First, a project leader (PL) was designated from among the winners of the design phase. The PL was responsible for ensuring the smooth execution of the project and maintaining effective communication between its components. The project was divided into five work packages (WPs):
- WP1—Hardware: Construction of the test bench.
- WP2—Electrical Supply: Management of the test bench components’ electric supply.
- WP3—Data Acquisition: Development of the data acquisition chain, from sensor selection to real-time monitoring, using LabVIEW.
- WP4—Numerical Modeling: Development and validation of semi-empirical models for the heat exchangers under test.
- WP5—Educational Aspects: Design of laboratory sessions for undergraduate students and preparation of the associated laboratory notes.
Each WP was led by a work package leader (WPL), who was responsible for breaking the WP into tasks and ensuring the WP’s final goal was achieved. For each task, objectives and expected outputs were clearly defined. WPLs also provided supplementary information, including the estimated number of workers required, difficulty level, task priority within the project, and deadlines.
Students not assigned to management roles formed a multidisciplinary pool of workers called task operators (TOs). TOs could participate in tasks across any WP and were encouraged to work on at least three different WPs throughout the project to broaden their experience across various fields.
During the construction phase of the test bench, weekly meetings were held with students and supervising staff. During those meetings, each WPL had to present a flash report summarizing the status of their WP, provide updates on task completion, possibly request support for ongoing tasks, and discuss various issues with the supervising staff. The meetings were not necessarily long, but their weekly format allowed both students and supervising staff to monitor the project’s overall progress and maintain cohesion within the group.
2.4. Evaluation
The students’ final evaluation for the project included a common grade for the entire promotion to reflect the importance of teamwork, and an individual grade to account for their personal involvement in the project.
First, the grade was divided into two distinct components to reflect the work performed during the design and construction phases of the project. All grades, denoted G, were assigned on a 0–20 scale.
The final grade was computed from the grades obtained during the design () and construction () phases, with weights reflecting the amount of time spent on each phase during the year. The evaluation of the design phase was common to all students in the same group and was based on their written report and oral presentation of their work. The evaluation of the construction phase was less straightforward because the project included three distinct roles: project leader, work package leader, and task operator. The grade computation for each role is detailed below.
The assessment of task operators comprised an overall grade, , based on the final deliverables of all WPs, and an individual grade, , reflecting the completion of their assigned tasks:
Greater weight was assigned to task completion than to the overall project evaluation. While assessing the collective outcome remains necessary, greater emphasis was placed on individual contributions to ensure a fair evaluation of each student’s work.
The WPLs also had the opportunity to actively participate in task realization, thereby developing both technical and management skills. Their final evaluation combined a global assessment of the deliverables across all WPs with an individual assessment reflecting their leadership, overall achievements within their WP, and task completion. The project leader was evaluated using a similar approach, with an emphasis on their overall coordination and project management.
Unlike the task operators, the WPLs were primarily evaluated based on their management and the results of the corresponding WP. Task participation was also included in the global evaluation, but its weight was reduced because the WPLs had less time than the TOs to complete their tasks.
To evaluate the tasks, an equivalent number of worked hours was computed for each task:
The equivalent number of worked hours of student i for the task j thus depends on the total number of worked hours H for the considered task, which is then multiplied by several factors. P is a percentage reflecting the involvement of the considered student in the task, decided between the students themselves; D represents the task difficulty, estimated by the WPL on a scale from 1 to 5; R is the rating of the task by the WPL once finished by the task operators, on a scale from 1 to 5. When rating a task, the WPL should consider whether the task objectives have been achieved within the allocated time and the quality of the work.
The total evaluation of students’ tasks depends on the ratio of the total equivalent number of worked hours for their tasks to the maximum equivalent number of worked hours achieved by any student:
where is the number of tasks performed by student i, and N is the total number of students. This grading scheme implies that at least one student attains the maximum score for task completion, thereby establishing a reference level for the others. Its main advantage is that it fosters both competition and collaboration. The individual task rating, based on duration and difficulty, allows students to choose between completing numerous short tasks or focusing on fewer, more demanding ones. As a result, students are incentivized both to maximize their individual contributions and to ensure the successful completion of the overall project.
One potential concern is that the cohort may collectively minimize effort to limit increases in the equivalent worked hours counter, thereby maintaining higher relative grades. However, this is mitigated by the project leader and the work package leaders. As their evaluation is more strongly influenced by the overall project outcome and the progress of their respective WPs, and as they may also contribute to task execution, they have a direct incentive to sustain engagement and drive the group toward high performance.
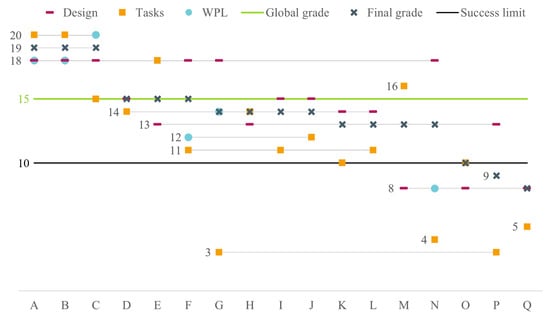
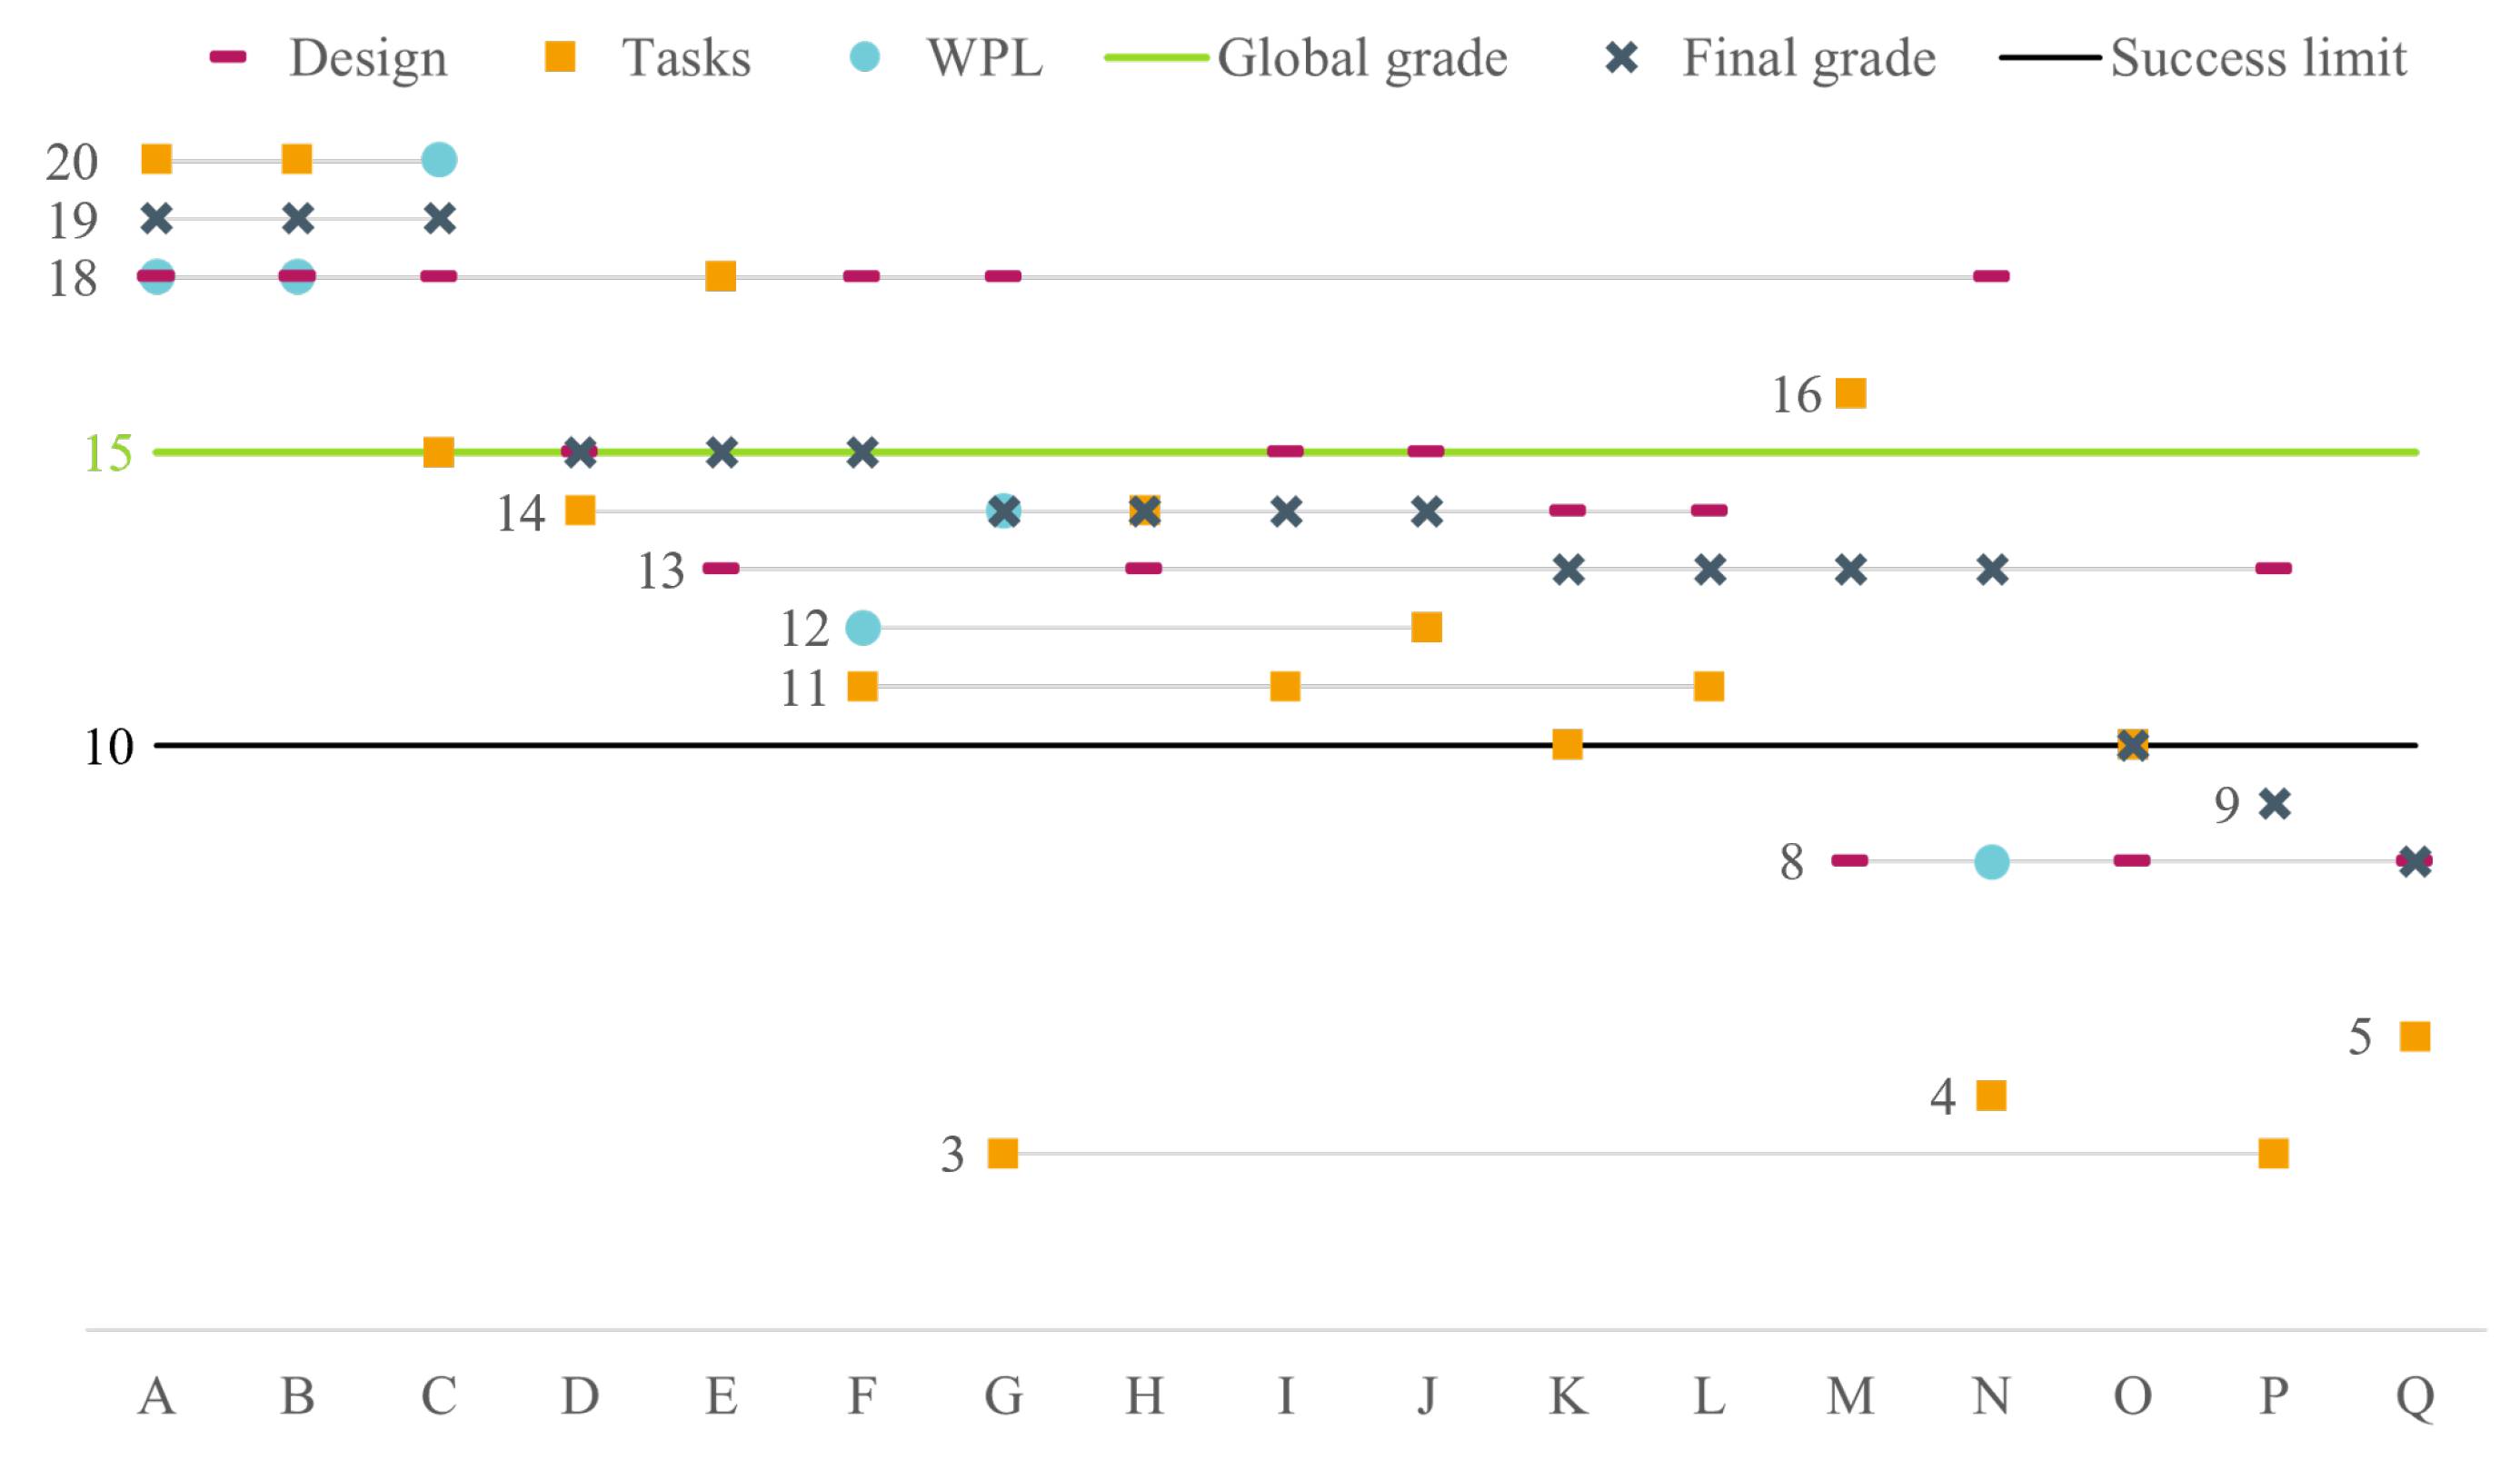
The grades obtained by the students at each step are shown in Figure 2. They are discussed below.
Figure 2.
Grades obtained by the students at each step.
- Students A, B, and C were among the top-performing students in the cohort. They conducted a thorough literature review and proposed a robust test bench design. They were subsequently appointed as project leader and Work Package Leaders (WPLs) for WPs 1 and 2 (test bench construction and electrical supply). They demonstrated strong leadership, and the objectives of both work packages were achieved by the end of the year. Overall group cohesion was maintained by the project leader, who successfully sustained student motivation and guided the project to completion.
- Students F, G, and N proposed the second most robust test bench design. They were subsequently appointed as Work Package Leaders (WPLs) for WPs 4, 5, and 3 (numerical modeling, educational aspects, and data acquisition), respectively. WPs 4 and 5 were effectively managed, although they were less critical to the overall project completion.
- Difficulties were encountered with Student N, whose engagement in leading WP 3 was limited. As a result, part of the leadership responsibilities for this work package was assumed by Student D. Despite obtaining insufficient grades for his own WP and task completion, Student N ultimately passed the course, benefiting from group performance during the first semester.
- Students M, O, and Q encountered difficulties during the test bench design phase, primarily due to limited group cohesion. However, two of these students subsequently demonstrated increased engagement in task completion, which contributed to an improvement in their overall grade.
- Students P and Q failed the course due to a major lack of implication in the project.
- The global grade of the project was 15/20, as the test bench was not entirely operable, mainly regarding data acquisition.
In summary, evaluating individual contributions through equivalent working hours produces a natural ranking of students, with grades that reflect their actual involvement in the project. Unlike standard project-based courses, this task-oriented approach enables the identification of students who might otherwise rely on their teammates’ work. Contributions are validated through task-level reporting, including the distribution of work among participants, ensuring that unsubstantiated involvement is not counted toward the total equivalent hours.
The main challenge of this grading approach lies in balancing the relative weights assigned to the design and construction phases. If the design phase is underweighted, students may lack incentive to develop a well-conceived test bench. Conversely, if it is overweighted, early contributions may be disproportionately rewarded, to the detriment of students who demonstrate significant engagement and progress during the construction phase of the project.
2.5. Students’ Perspective on the Experience
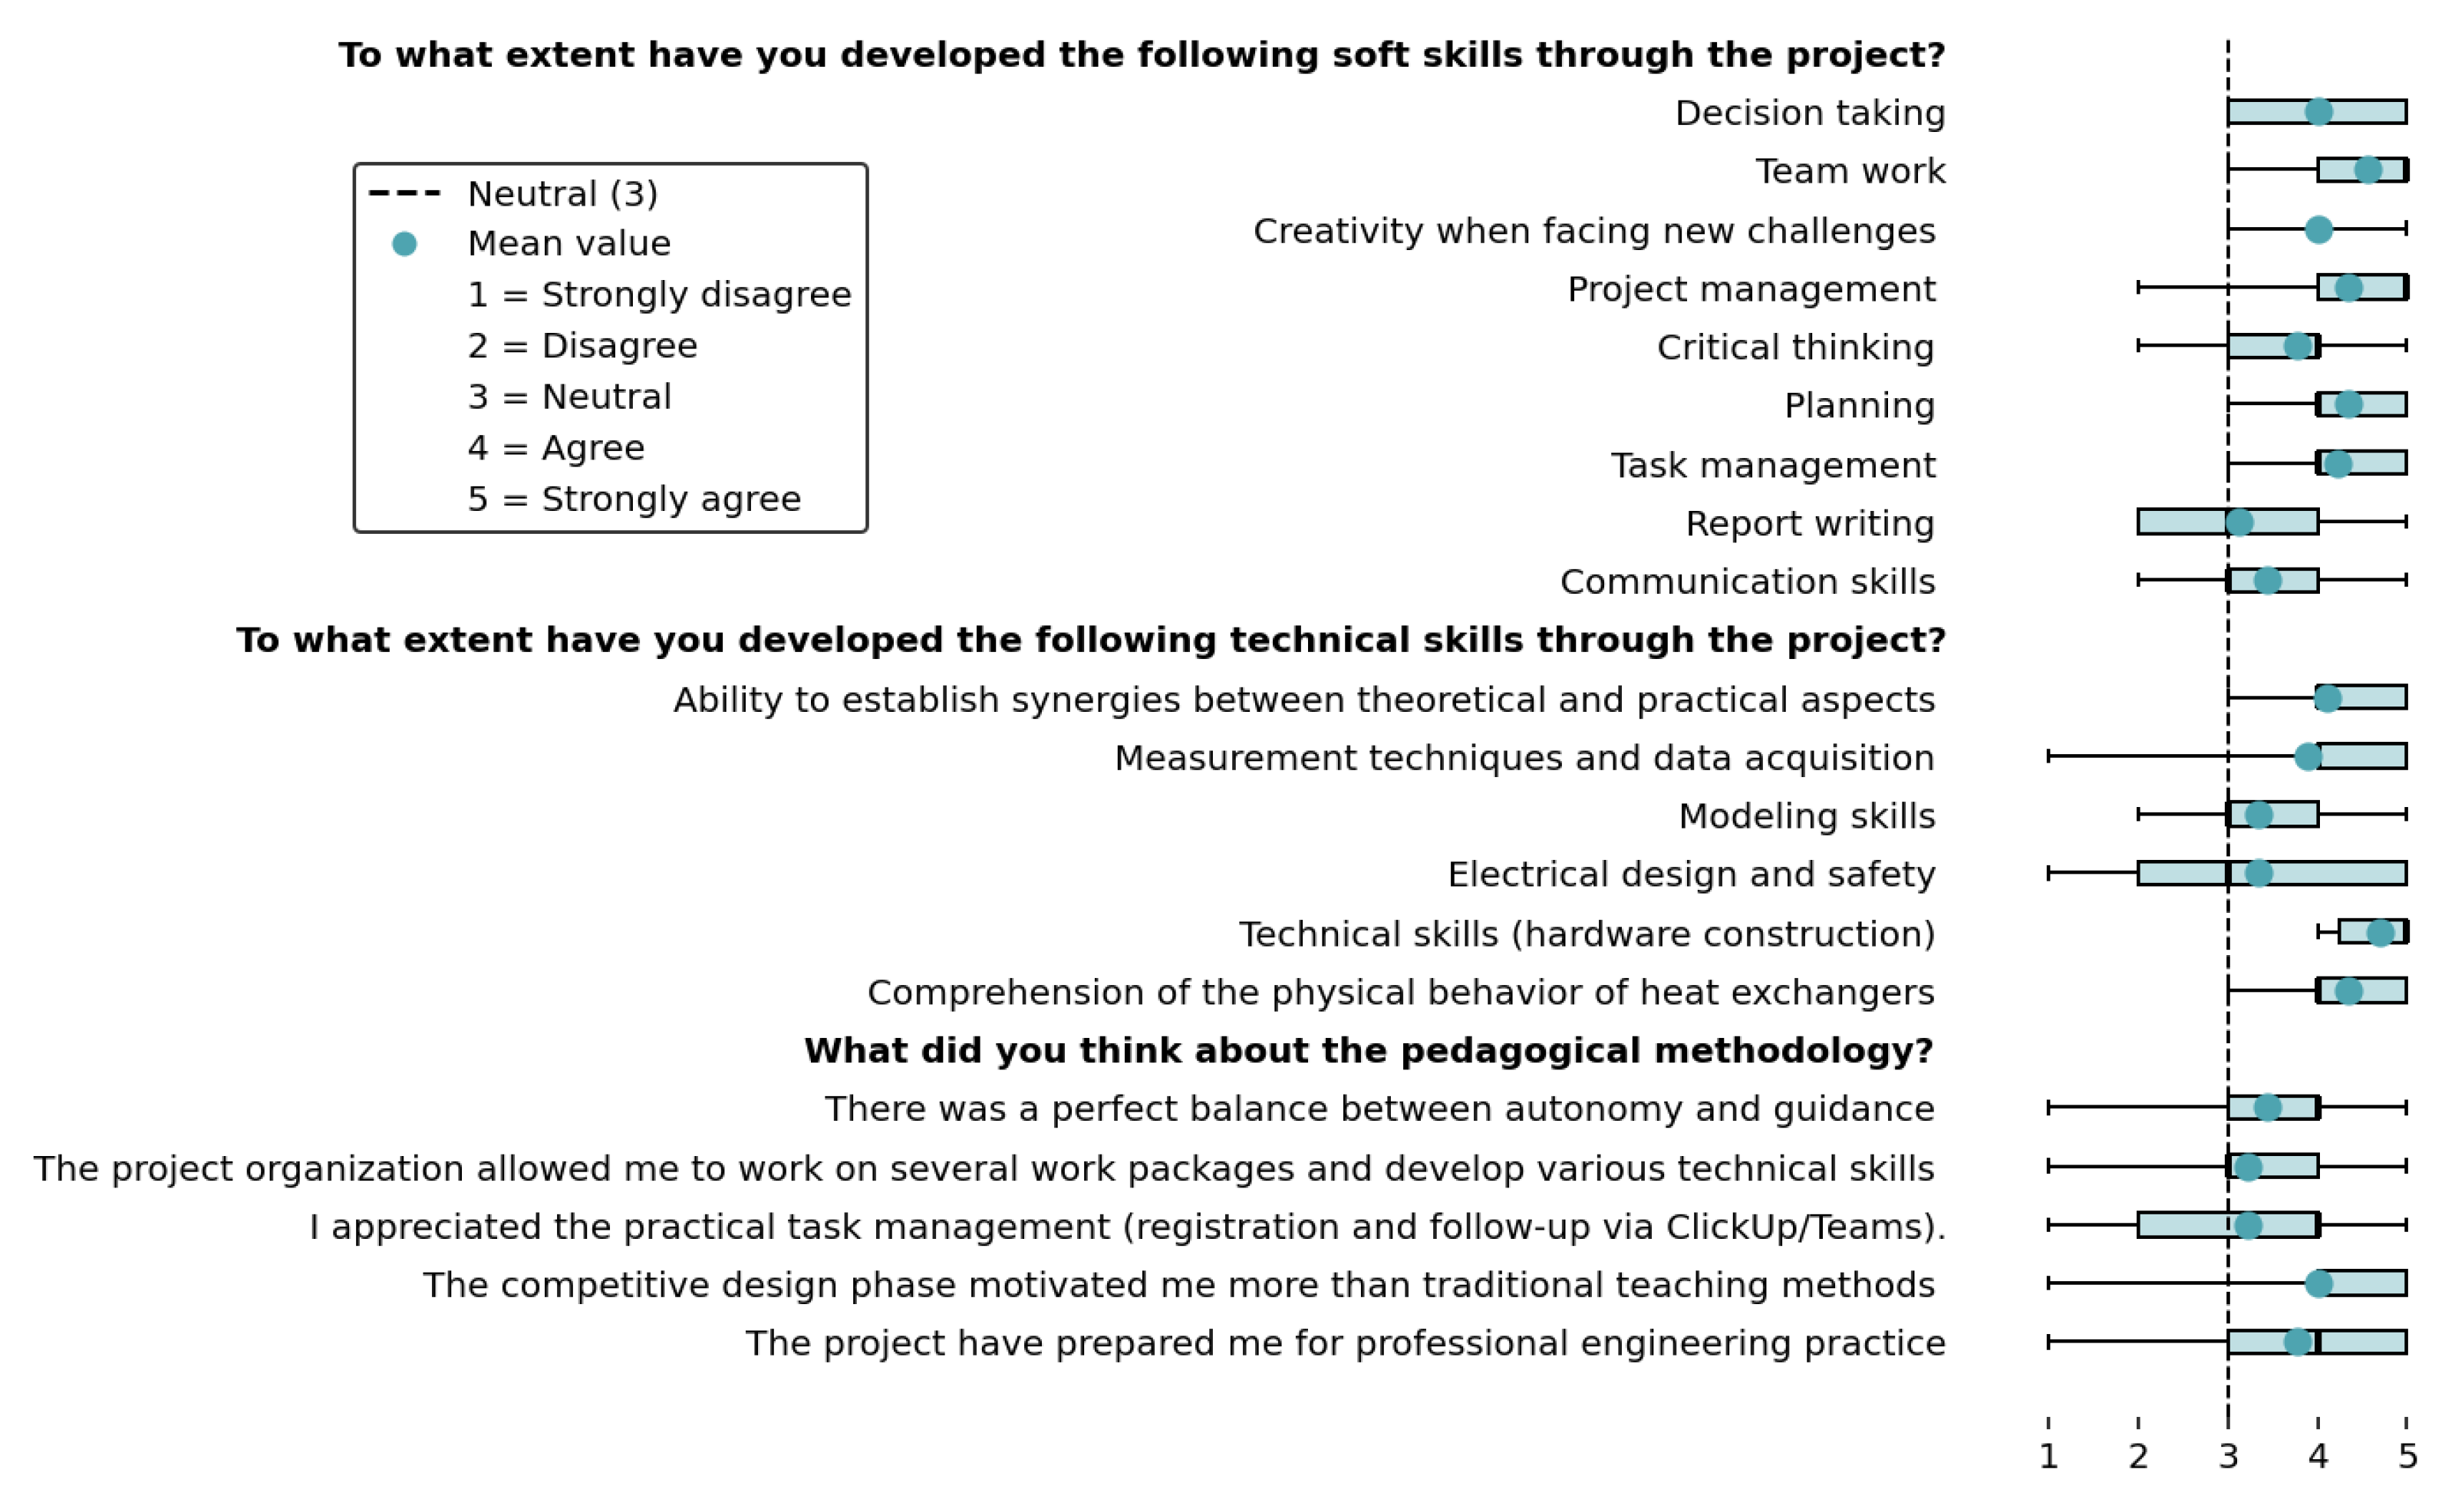
Students were asked to provide feedback on the overall experience through a Likert-scale survey, with 9 out of 18 students responding. The questions were grouped into three categories: soft skills, technical skills, and pedagogical methodology. A detailed presentation of the questions and responses is provided in Appendix A, while Table 1 summarizes the average scores for each category.
Table 1.
Average Likert-scale scores (1–5) for the three main survey categories.
Overall, the results indicate a positive perception of the experience across all categories, with mean values above the neutral level (3). The development of soft skills is particularly well rated, with high scores in teamwork, project management, and critical thinking, reflecting the impact of the structured roles and collaborative framework implemented during the project.
Technical skills are also positively evaluated, particularly in linking theoretical concepts to experimental observations and in understanding the physical behavior of heat exchangers. Slightly lower scores are observed for modeling and electrical design aspects, which may reflect varying levels of student involvement in some specific tasks. The breadth of activities made it difficult for students to be deeply involved in all tasks.
The pedagogical methodology consistently receives strong evaluations, particularly for motivation and perceived relevance to professional practice. The competitive design phase is identified as a key driver of engagement, while the task-based organization is appreciated for its contribution to both autonomy and accountability.
From a global perspective, these results support the effectiveness of the proposed approach in simultaneously developing and technical competencies. Moreover, the consistency between student feedback and the qualitative observations reported in Section 5 reinforces the validity of the pedagogical framework. However, the relatively small sample size limits the statistical significance of the results.
3. Test Bench Architecture and Features
This section describes the final test-bench configuration developed by the students, in accordance with the technical requirements defined in Section 2.2.
3.1. Educational Test Bench Benchmarking
One of the first tasks undertaken by the students was to conduct a benchmark study of off-the-shelf heat exchanger test benches provided by training equipment manufacturers. Table 2 summarizes the main experimental setups and their key characteristics.
Table 2.
Overview and benchmarking of educational heat exchanger test benches.
Based on the benchmark results, the following desirable features for the test bench were identified by the students:
- a fixed but mobile structure,
- closed-loop operation to reduce energy consumption,
- a real-time data acquisition and visualization system,
- the use of interchangeable heat exchangers was not considered appropriate due to the time required for reconfiguration by students,
- manually adjustable valves to control flow configuration and flow rates for pedagogical purposes,
- an informational panel to facilitate understanding of the operating principle, given the complexity of the system architecture.
- a transparent heat exchanger to allow flow visualization (considered a desirable feature but not a priority).
3.2. Set-Up Description
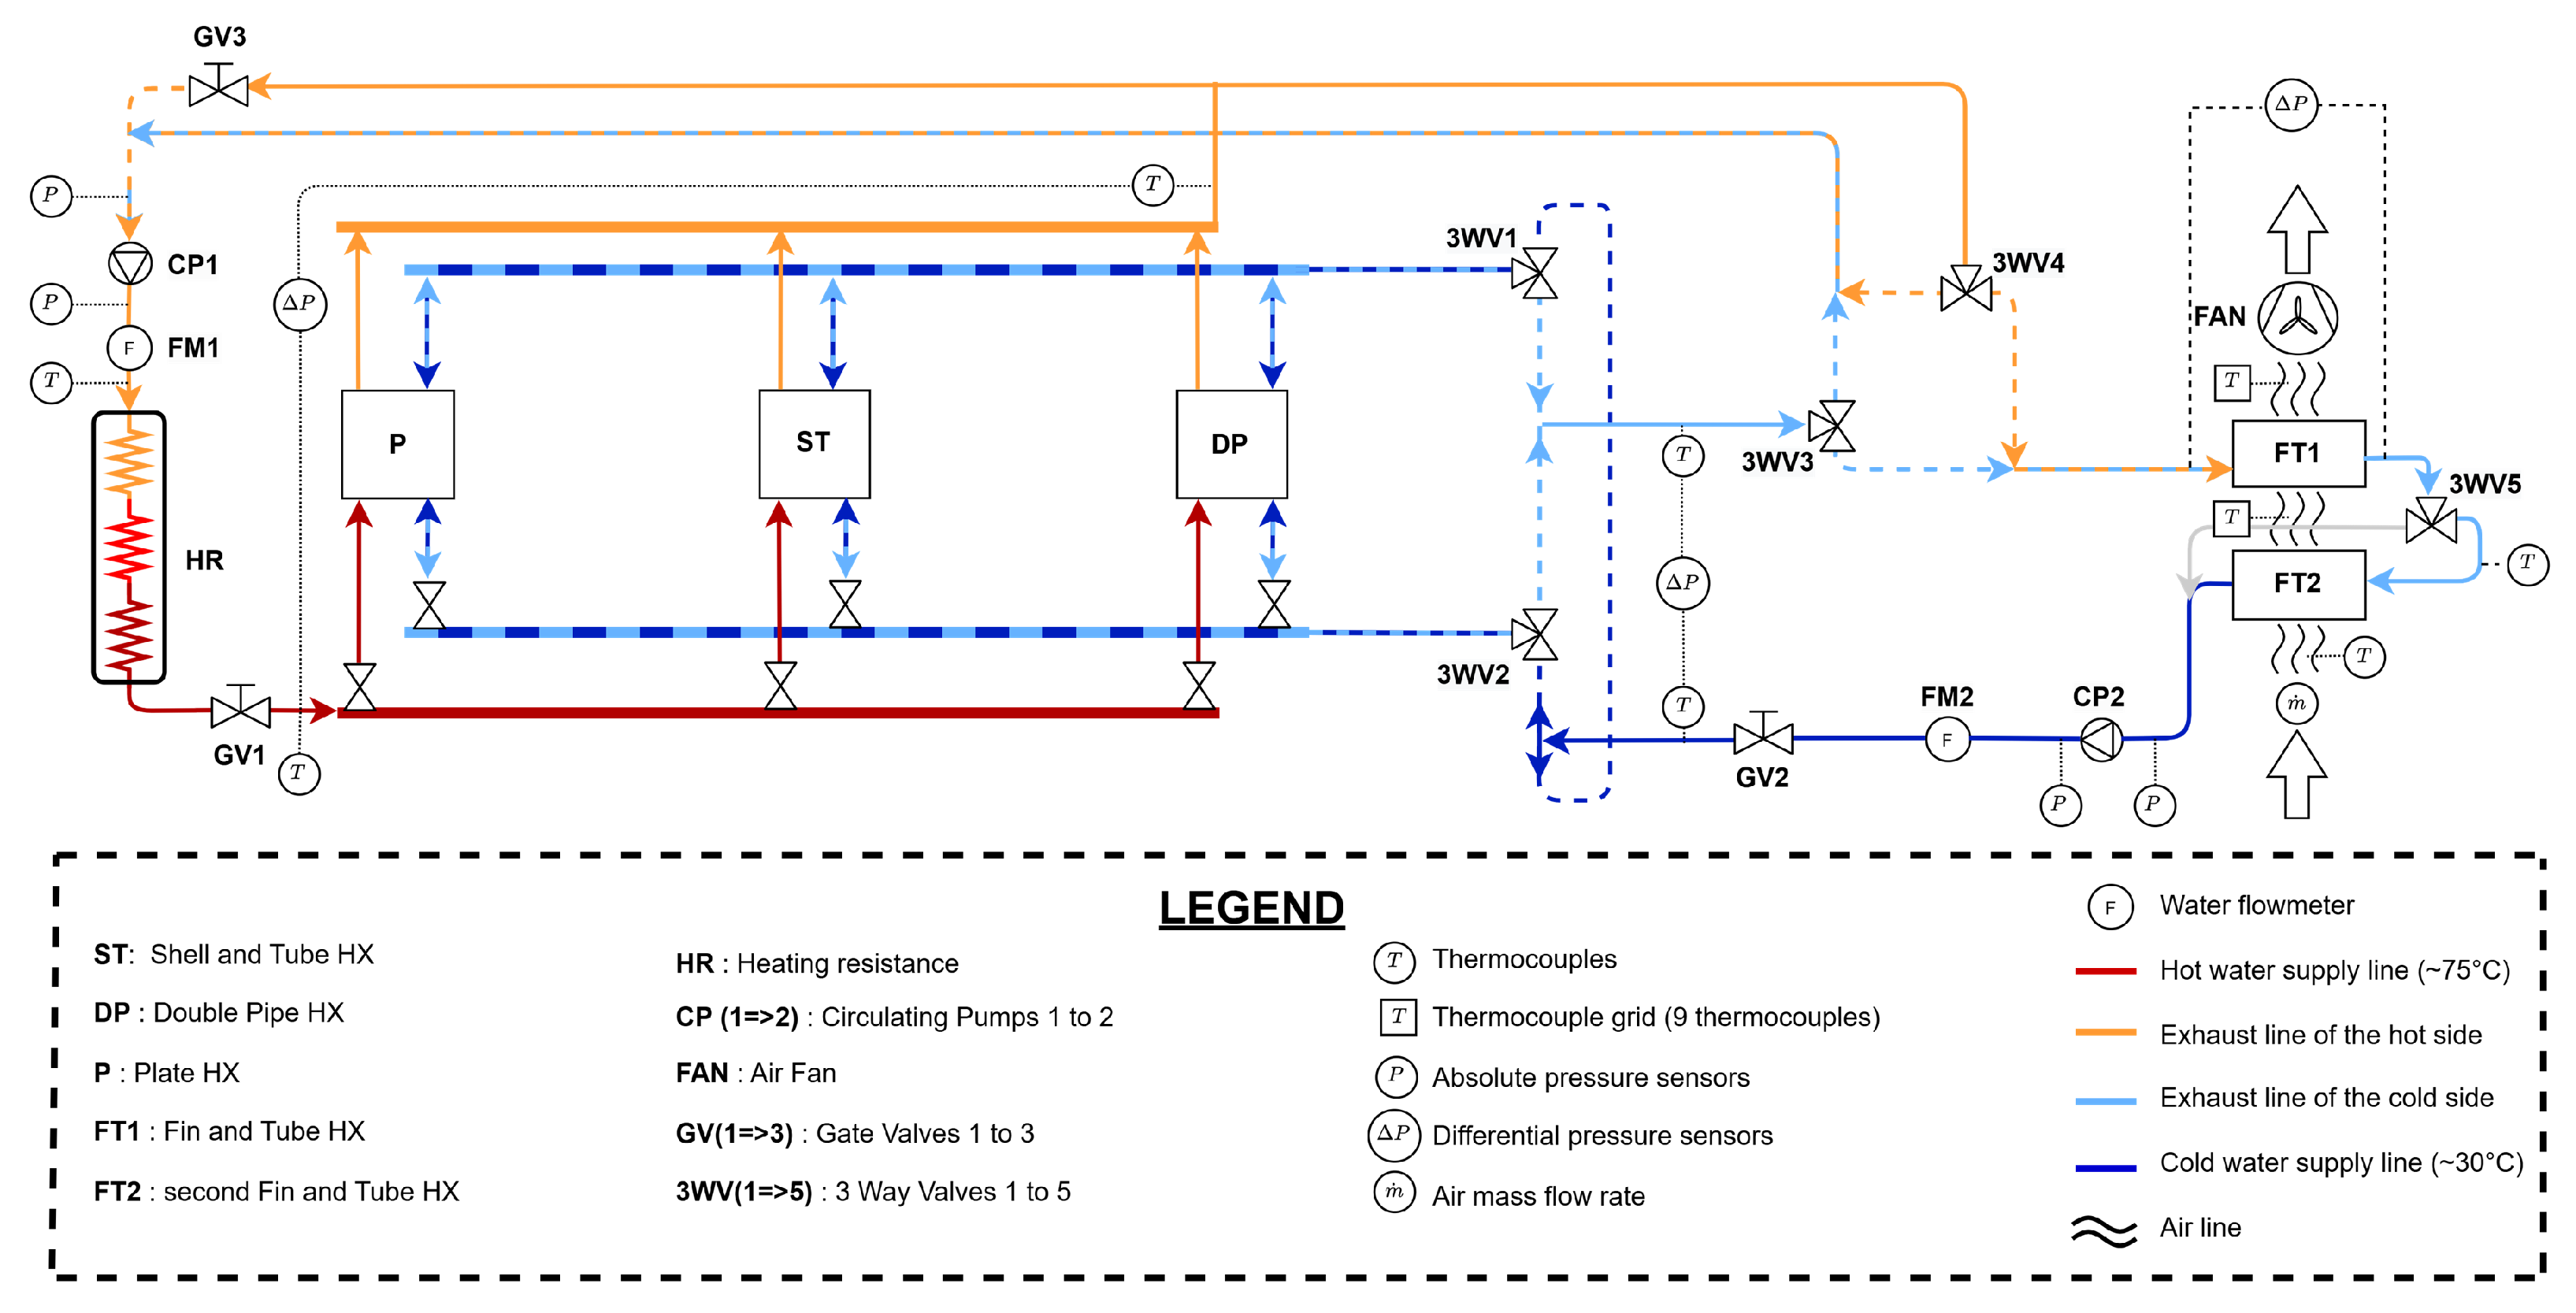
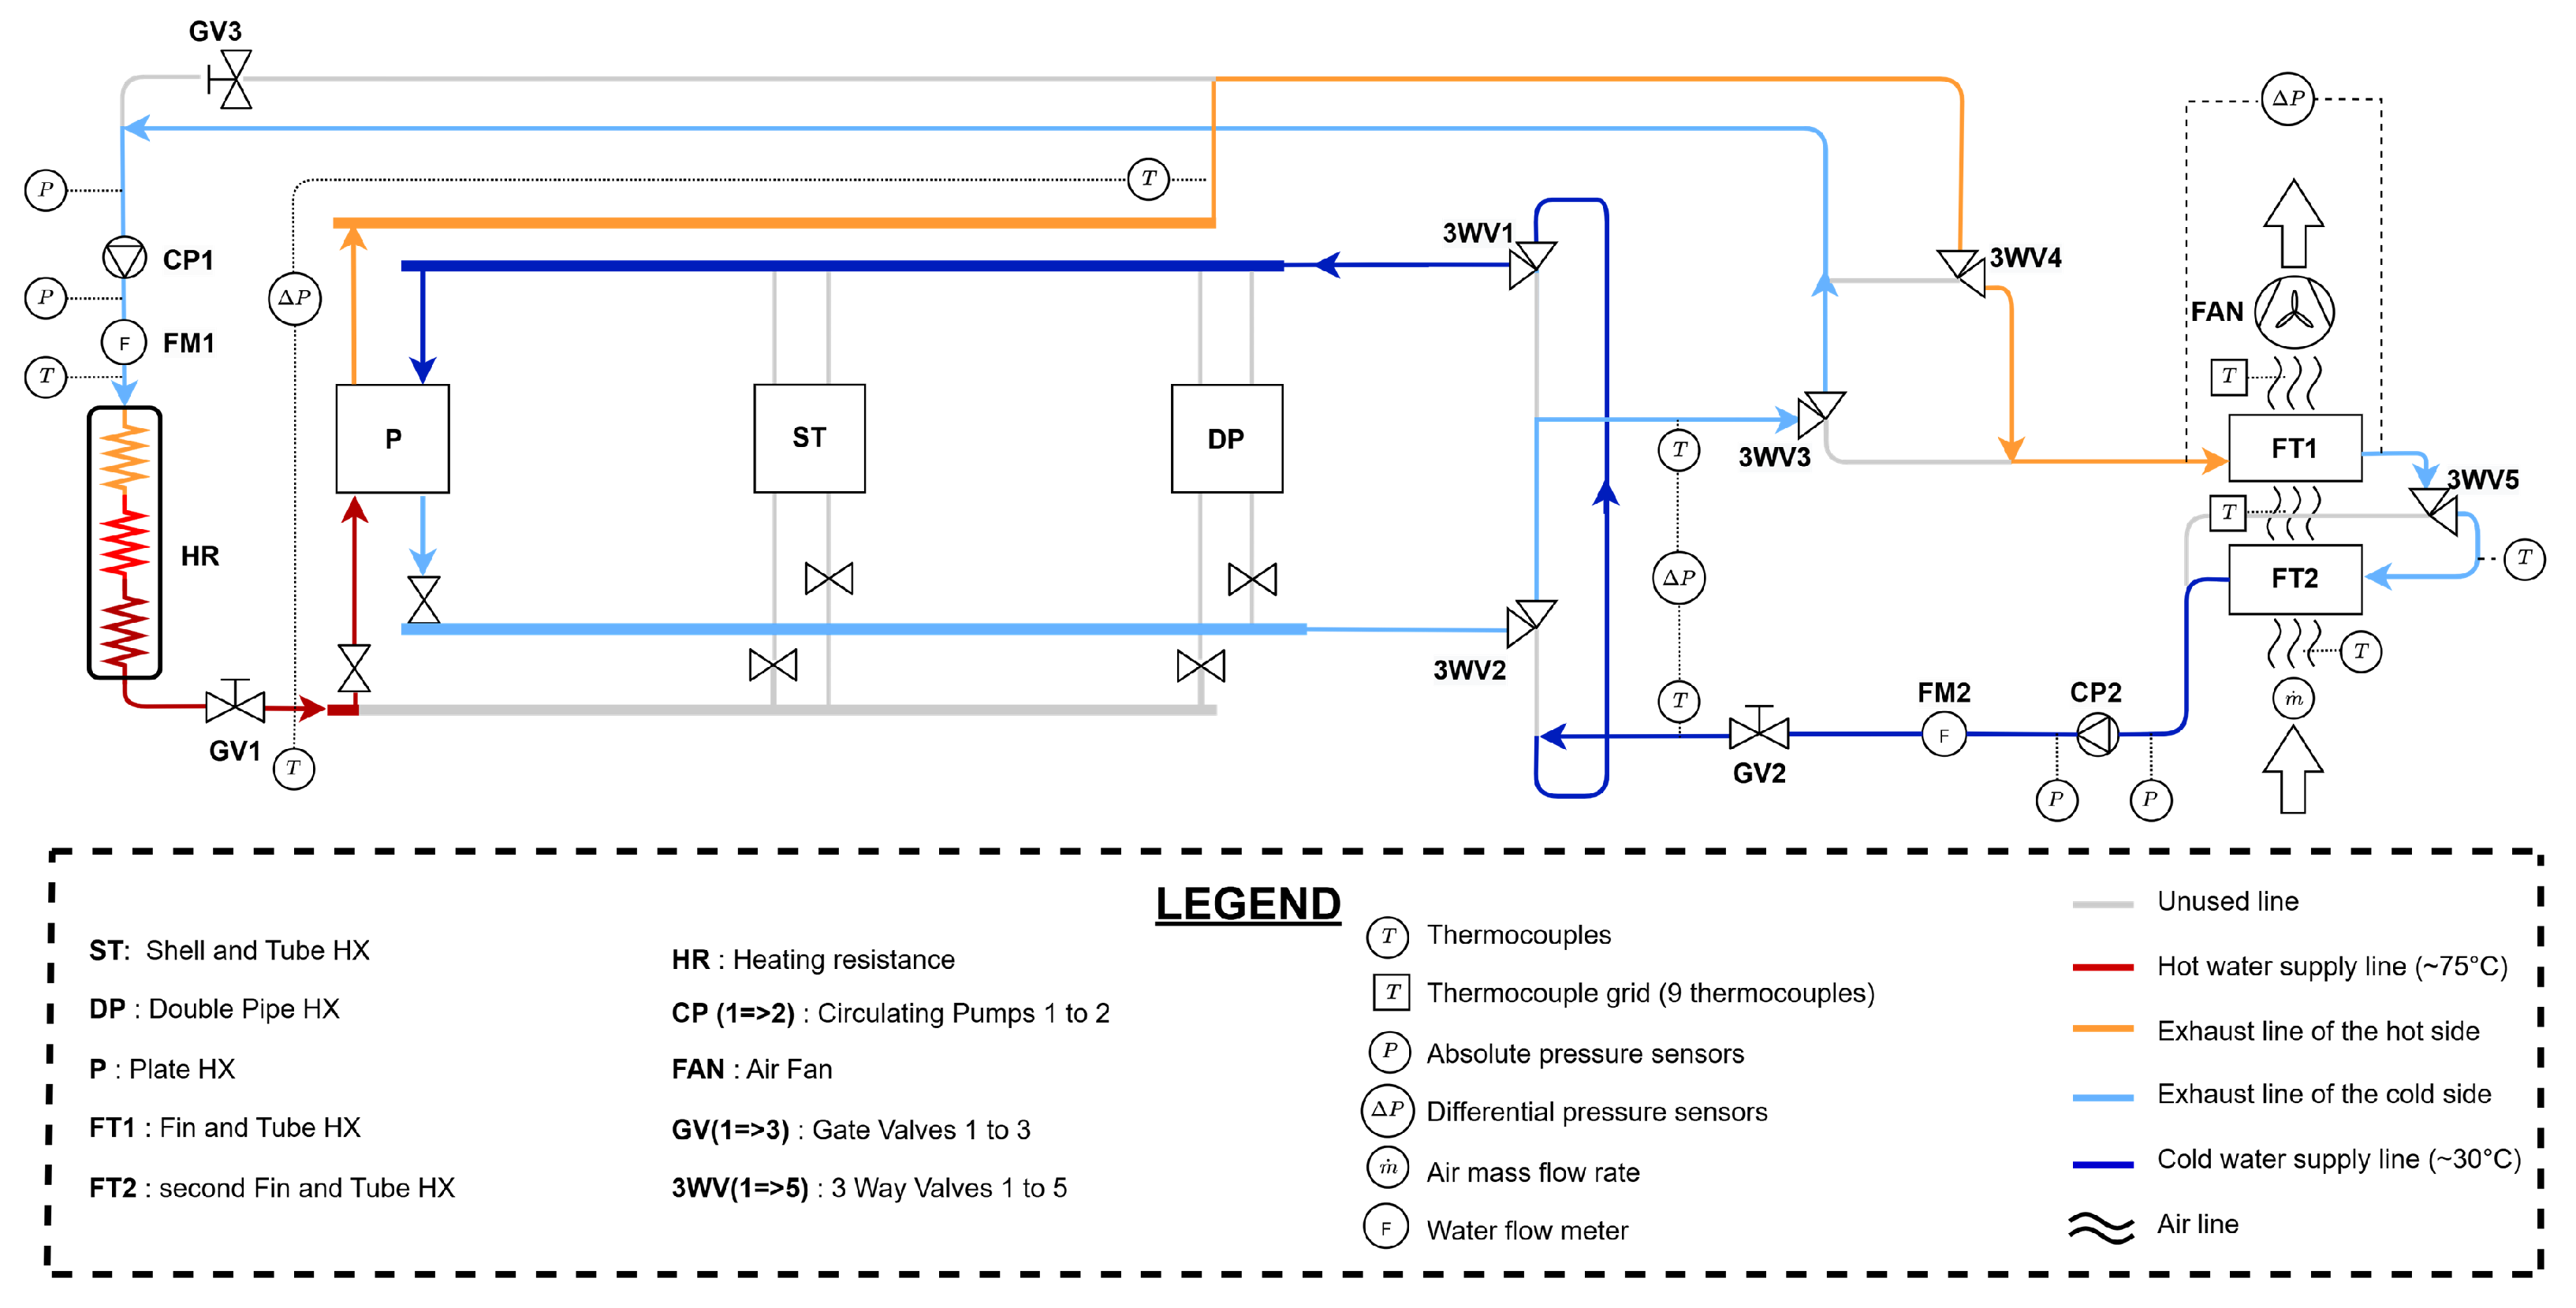
Following the technical requirements of the test bench specified in the project statement and the performed benchmark, the developed test bench enables testing of three water-to-water heat exchangers: a plate heat exchanger (P), a shell-and-tube heat exchanger (ST) and a double-pipe heat exchanger (DP). An electrical heater supplies heat to the water entering the hot side of the three exchangers, while the ambient air serves as the cold source using fin-and-tube heat exchangers (FT). The system operates in a closed-loop to prevent water wastage. The test bench is represented through a two-dimensional Piping and Instrumentation Diagram (P&ID), shown in Figure 3.
Figure 3.
Piping and Instrumentation Diagram of the test bench.
On the left side of the P&ID, the hot fluid conditioning circuit begins with a circulator pump (CP1) driving water through the heating loop. The flow rate is measured by a flow meter (FM1) before entering the heat exchangers and is regulated by a gate valve (GV1). A pressure sensor is installed at the heater outlet, and temperature sensors are located at the heater inlet and outlet to facilitate energy balance calculations. A differential pressure sensor determines the pressure drop occurring across the heat exchangers. A gate valve (GV3) upstream of the heater enables fine adjustment of the heat capacity ratio between the hot and cold sides.
In the central portion of the P&ID are the three water-to-water heat exchangers (P, ST, and DP), with six on–off valves allowing the selection of the exchanger under test. Two three-way valves (3WV1 and 3WV2) enable experiments to be performed in both counterflow and parallel-flow configurations, while pressure and temperature measurements are taken on the hot and cold sides of each heat exchanger. The sensors are installed in a common manifold to reduce the total number of sensors required.
The right section of the diagram corresponds to the cold-fluid conditioning loop, which includes two fan-cooled fin-and-tube heat exchangers (FT1 and FT2) acting as a sufficient cold source for the test bench. A three-way valve (3WV5) allows FT2 to be either engaged in series with FT1 or bypassed. This configuration enables investigation of the effect of adding a second fin-and-tube heat exchanger in series with the first. This loop mirrors the hot circuit and incorporates a circulator pump (CP2), a flow meter (FM2), and a gate valve (GV2) to generate, measure, and regulate flow. On the water side, pressure and temperature sensors are installed at the inlet and outlet of both fin-and-tube exchangers to support detailed thermal and hydraulic analyses. The final control elements comprise two three-way valves (3WV3 and 3WV4) that determine which outlet stream (hot or cold) is directed to the heater or the fin-and-tube exchangers. On the air side, the air mass flow rate is determined from the pressure drop measured across a calibrated nozzle placed in the air passage. Because the air temperature variation at the inlet of the heat exchanger is negligible, a single temperature measurement at the inlet of the upstream fin-and-tube heat exchanger (FT2) is considered sufficient. Furthermore, a grid consisting of nine thermocouples is installed at both the inlet and outlet of FT1, which is positioned upstream of the fan, to ensure accurate determination of the mean air temperature.
Depending on the heat exchanger under test, the cold-side outlet temperature may exceed the hot-side temperature; in such cases, the control system allows redirection of the hotter flow to the heater and the cooler flow to the fin-and-tube units. This adaptive configuration minimizes the heater’s electrical consumption across all testing conditions.
3.3. Test Bench Configuration for Counterflow Plate Heat Exchanger with Balanced Mass Flow Rates
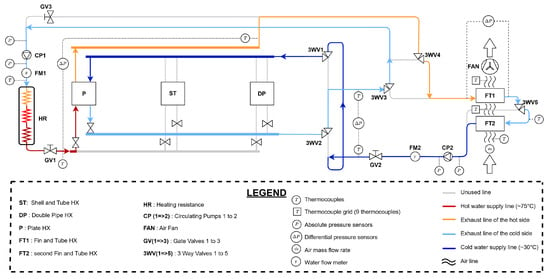
The test bench has been designed to allow each heat exchanger to be investigated separately over a wide range of operating conditions. For the sake of completeness and to facilitate the reader’s understanding, Figure 4 illustrates the configuration in which the plate heat exchanger operates in a counterflow arrangement with balanced mass flow rates. In this configuration, all on–off valves are closed except those on the plate heat exchanger line. The three-way valves 3WV (1 to 4) are set to direct the hot-fluid exhaust flow toward the fin-and-tube heat exchanger. Since the plate heat exchanger is highly effective (>50%), the hot-fluid outlet temperature is lower than that of the cold fluid. Consequently, this routing reduces the heater’s electrical power consumption. Balanced mass flow rates are ensured by fully closing valve GV3. Only one fin-and-tube heat exchanger is used, as valve 3WV5 is closed.
Figure 4.
Test bench configuration for plate heat exchanger in counterflow with balanced mass flow rates.
3.4. Range and Accuracy of the Measurement Devices
All sensor measurement accuracies and operating ranges are summarized in Table 3. The experimental data are acquired, displayed, recorded, and processed using a dedicated data acquisition system from National Instruments.
Table 3.
Summary of the range and accuracy of the measurement devices.
3.5. Heat Exchangers Characteristics
This section describes the characteristics of the four heat exchangers studied.
3.5.1. Plate Heat Exchanger
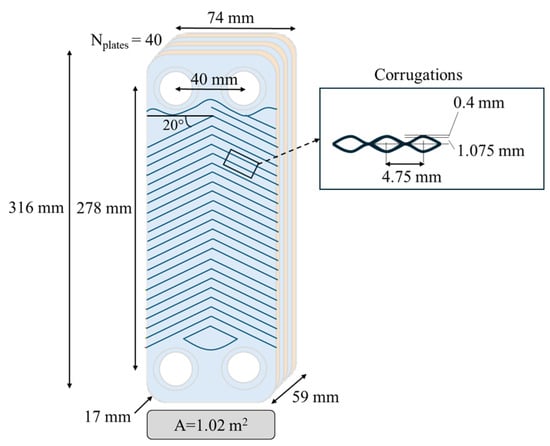
Figure 5 summarizes the main geometrical and operational characteristics of the heat exchanger, including its plate geometry. These parameters can be used to guide the selection of appropriate correlations for the convective heat transfer coefficient and the friction factor.
Figure 5.
Plate heat exchanger characteristics and dimensions.
3.5.2. Double-Pipe Heat Exchanger
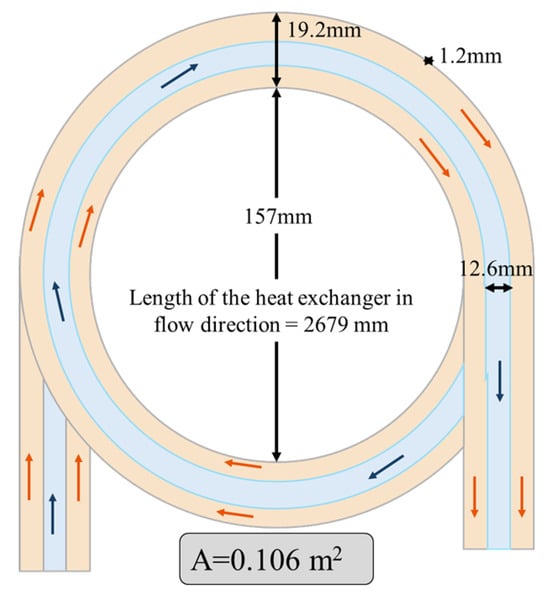
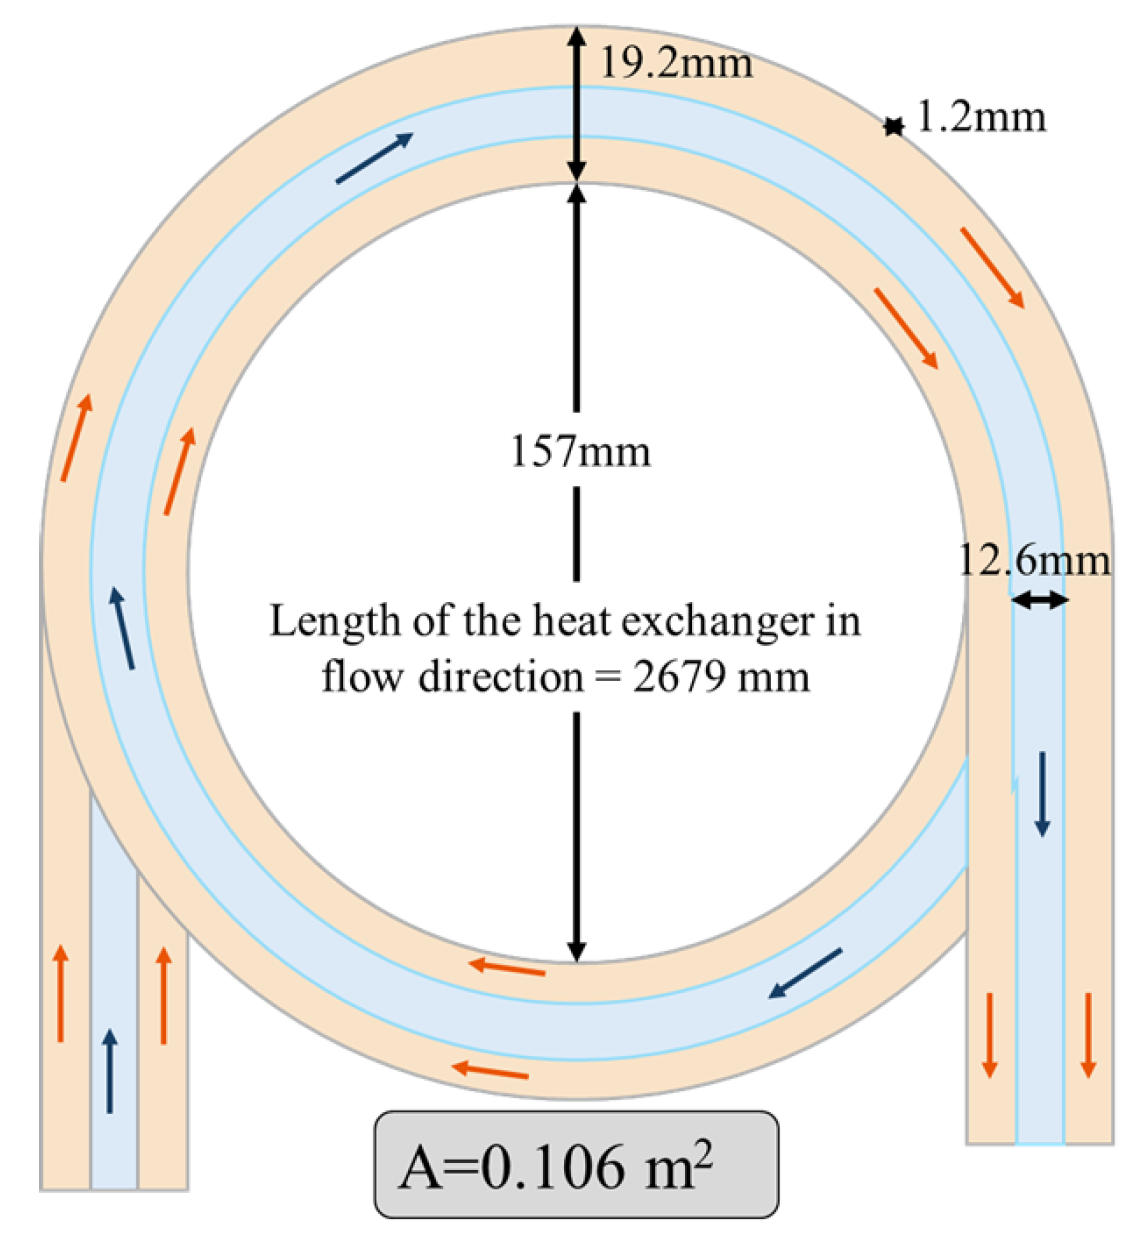
In this type of heat exchanger, two fluids circulate in concentric tubes. One fluid flows through the inner tube, and the other moves through the annular space between them. The model of this arrangement is illustrated in Figure 6 and shows a total heat transfer area of 0.106 m2.
Figure 6.
Double pipe heat exchanger characteristics and dimensions.
3.5.3. Shell and Tube Heat Exchanger
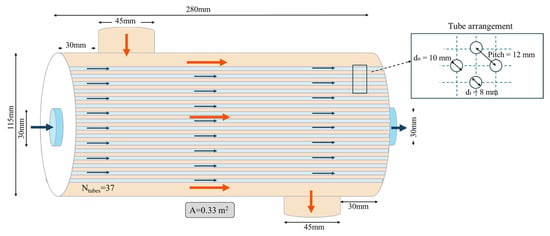
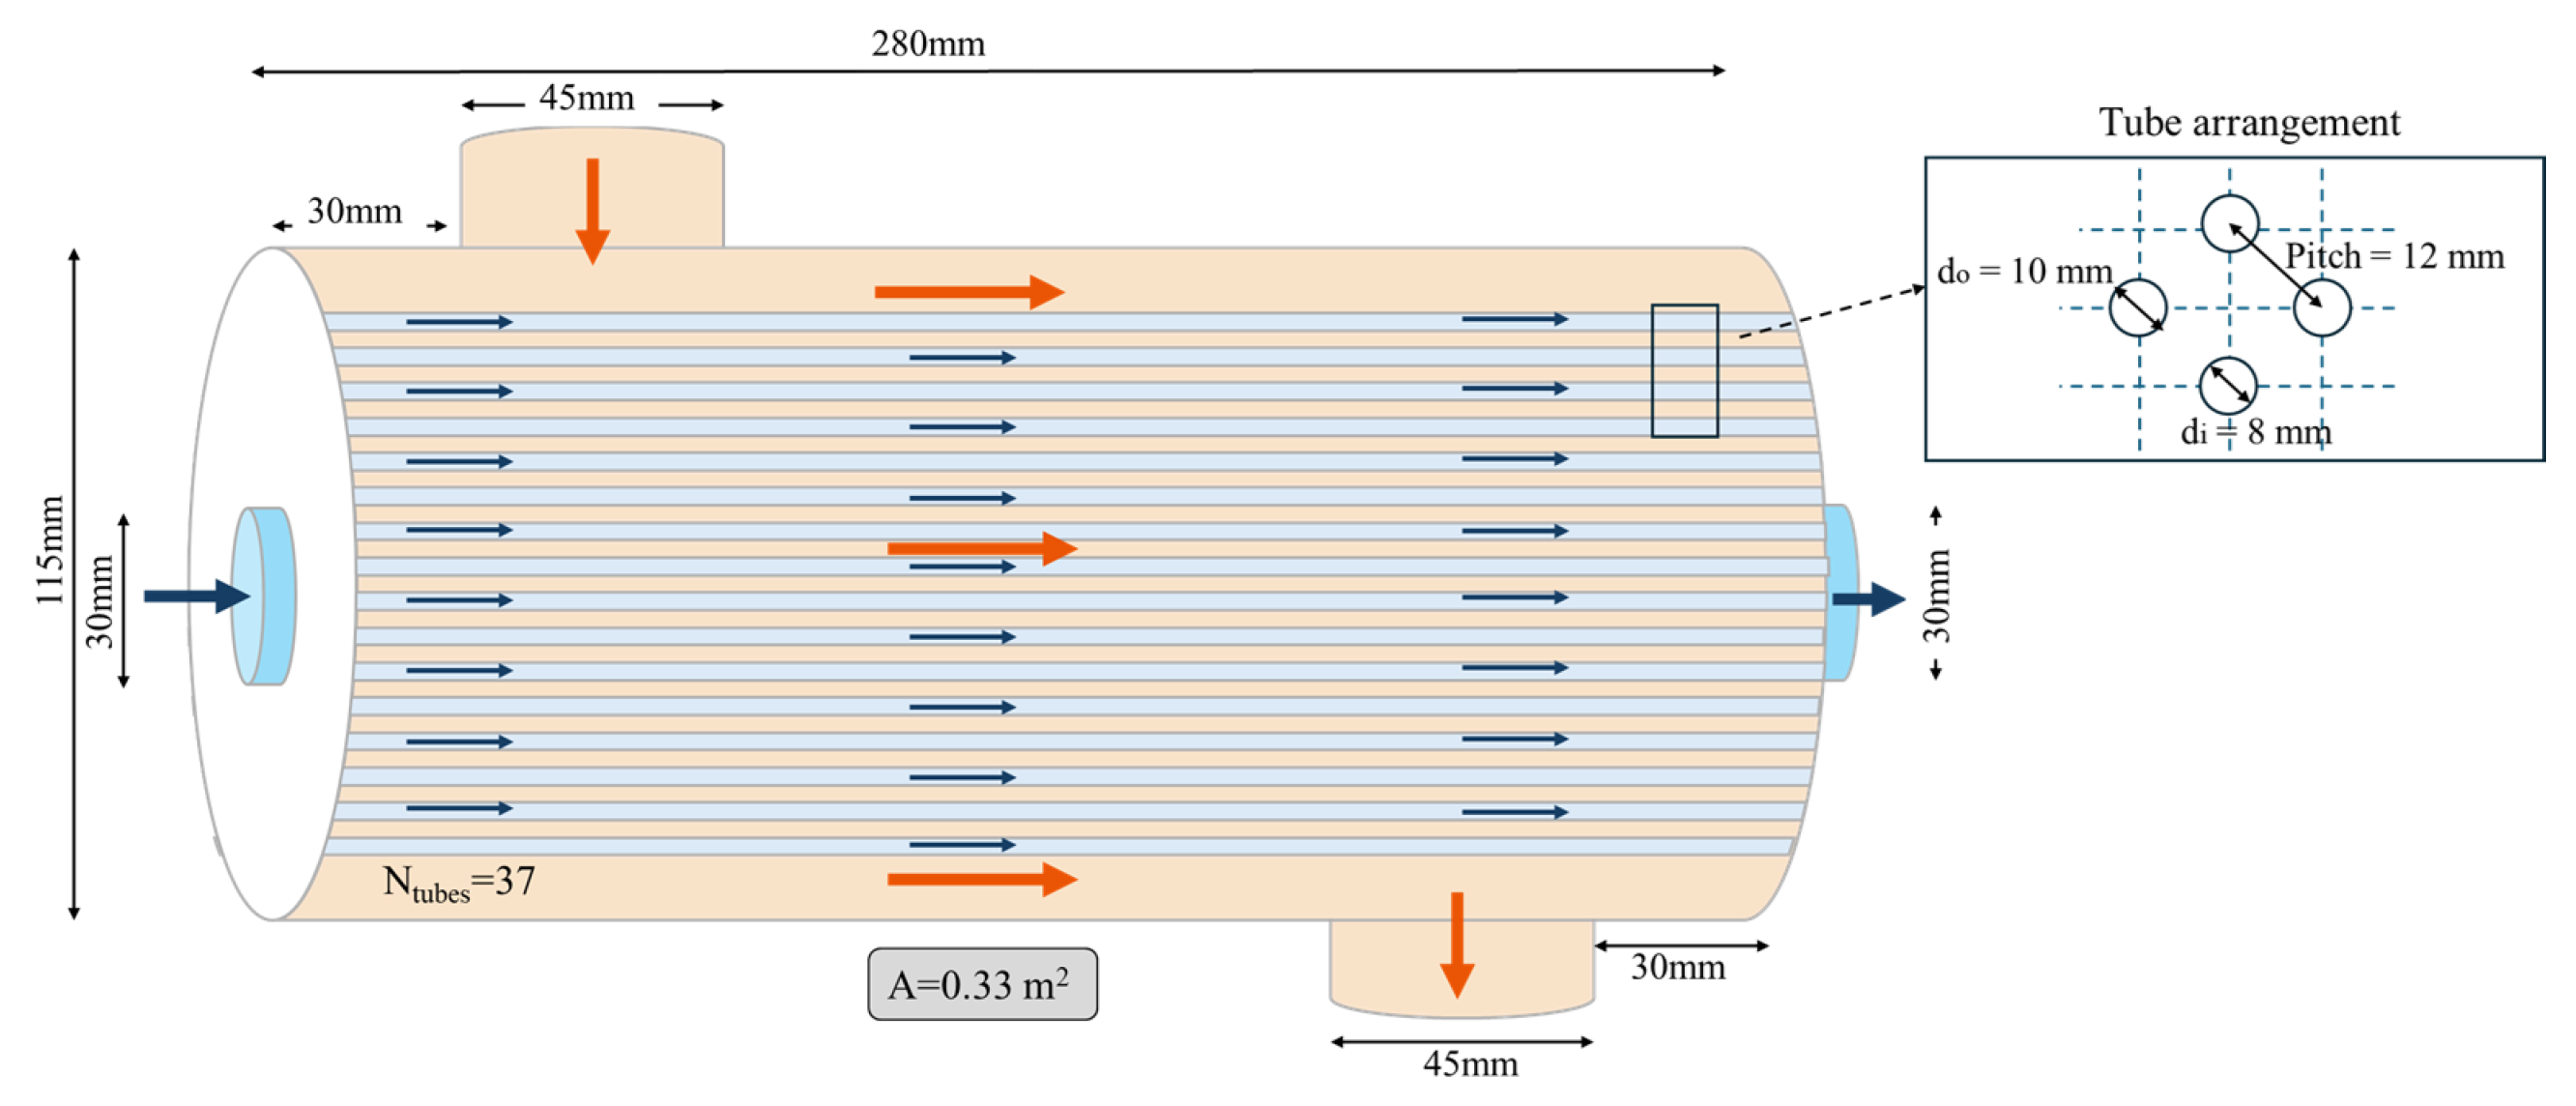
This shell-and-tube heat exchanger consists of a fluid flowing through the shell across a bundle of tubes that carry another fluid. The studied exchanger operates in a single-pass arrangement and includes no baffles. The 37 tubes are arranged in a reversed-square geometry, which promotes more uniform fluid distribution within the shell. The dimensions of the studied heat exchanger are summarized in Figure 7, resulting in a total heat transfer area of 0.3 m2.
Figure 7.
Shell-and-tube characteristics and dimensions.
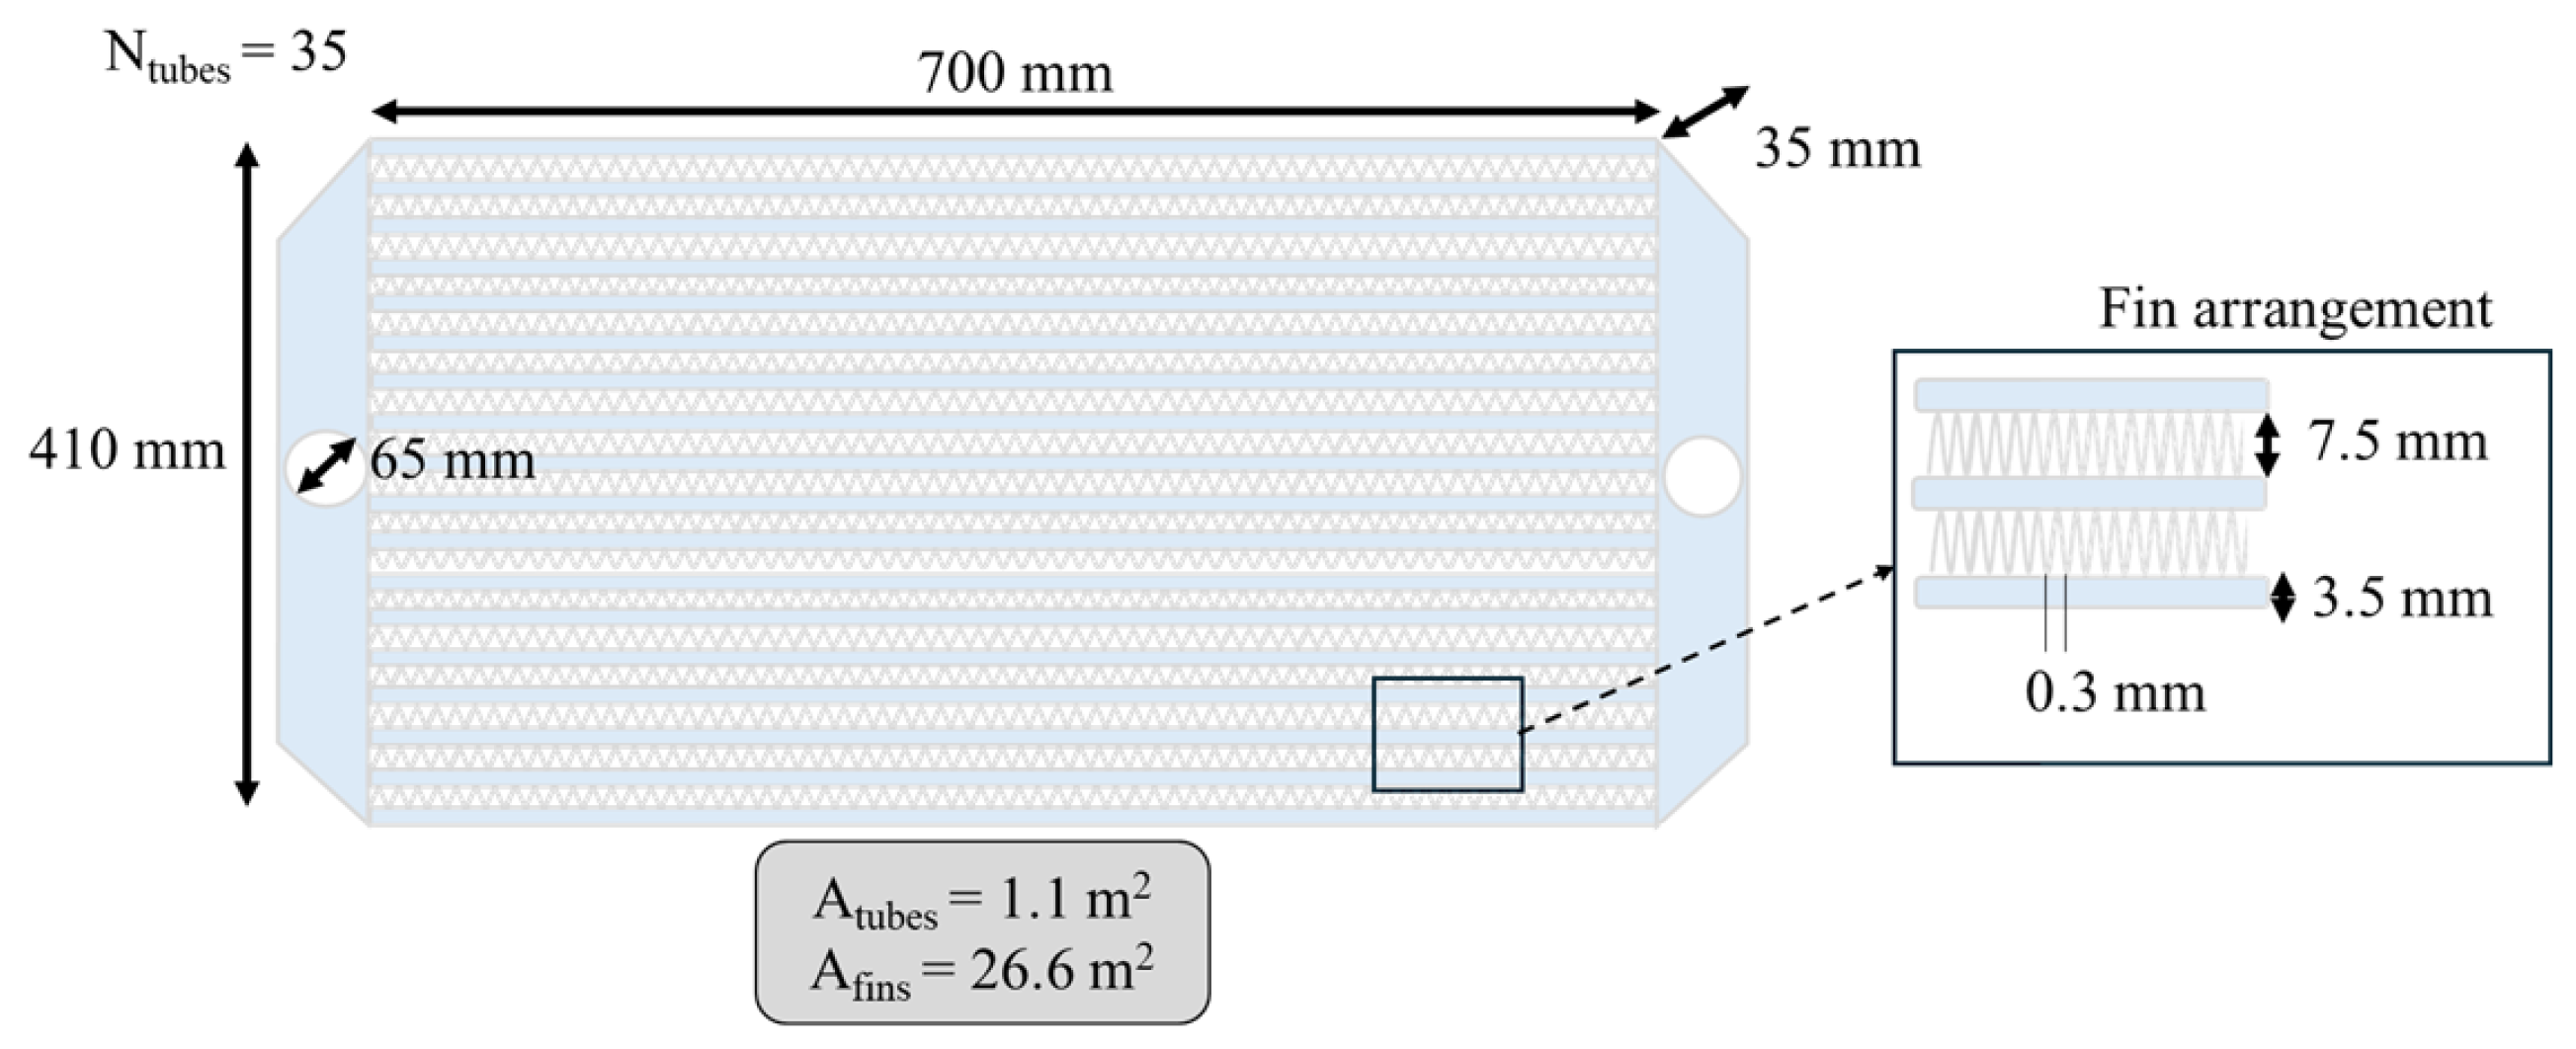
3.5.4. Fin-and-Tube Heat Exchanger
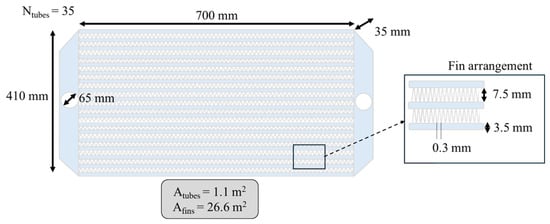
This is the only heat exchanger presented that operates in crossflow. One fluid (water) flows inside finned tubes, which provide an increased heat-transfer surface area, while the other fluid (air) flows transversely across the tube bundle. The characteristics of the studied heat exchanger are given in Figure 8.
Figure 8.
Fin-and-tube characteristics and dimensions.
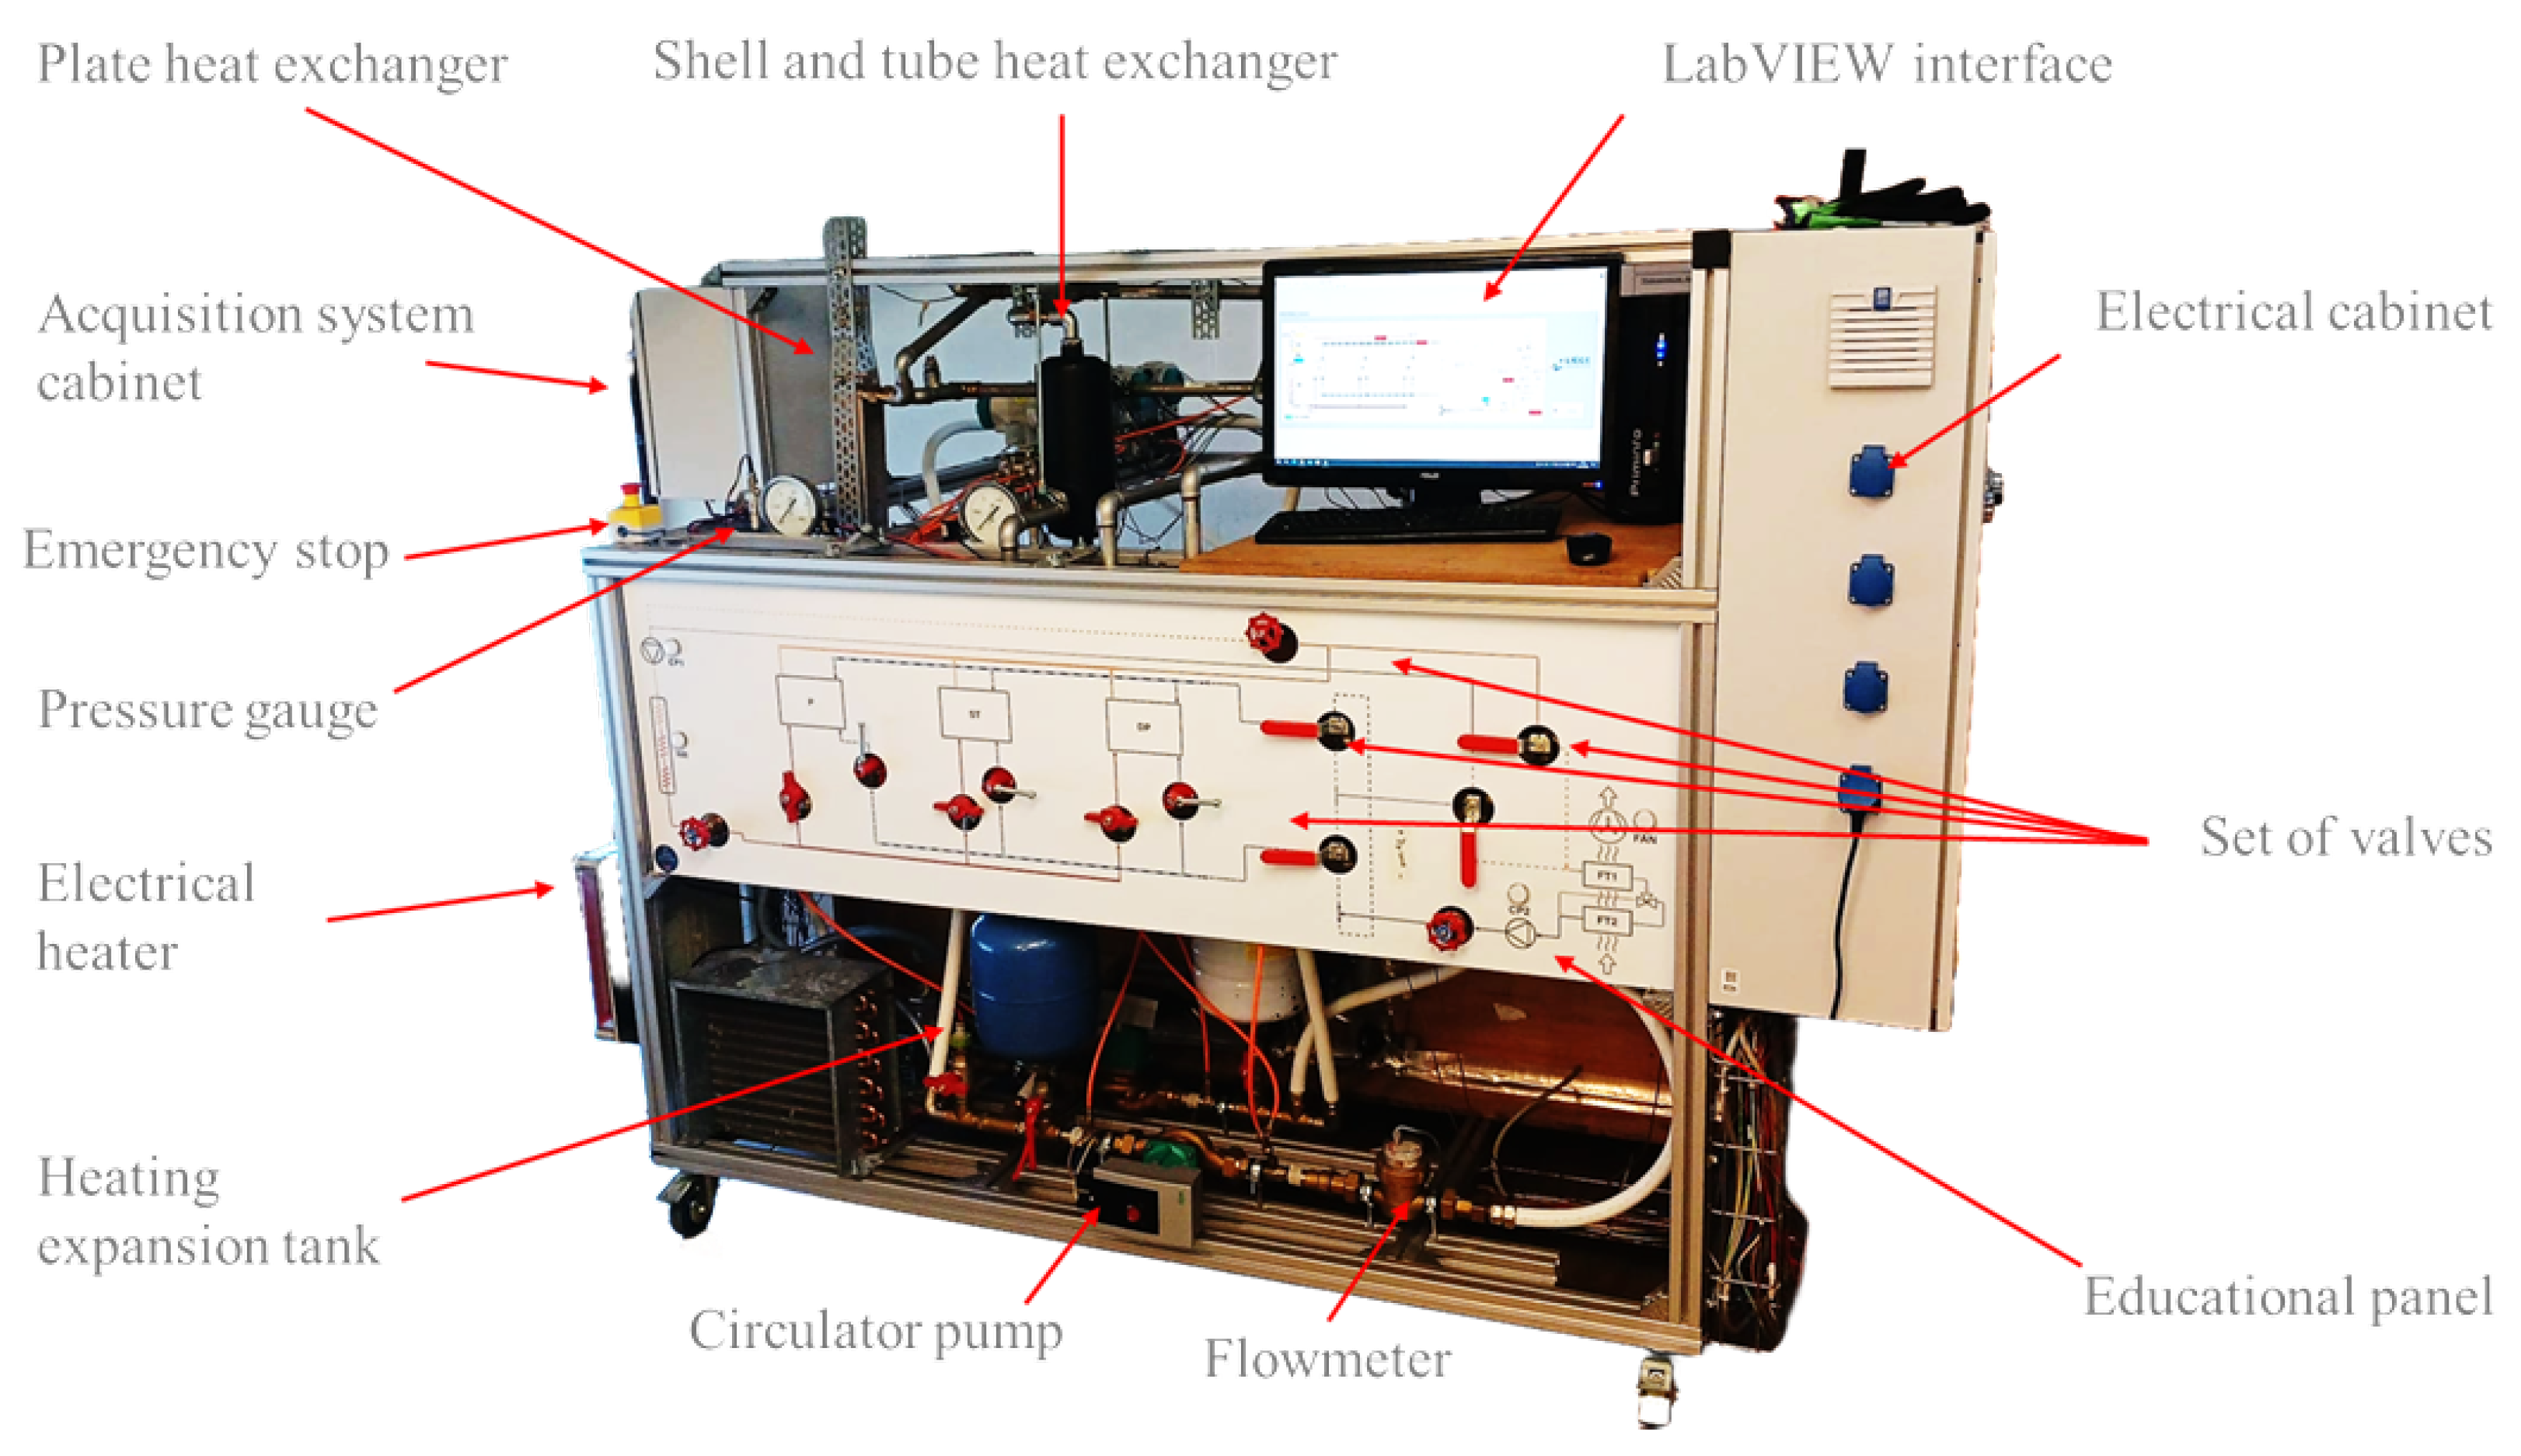
3.6. Final Test Bench
Figure 9 shows the final test bench as implemented in practice.
Figure 9.
Practical implementation of the final test bench.
4. Hands-On Test Bench Sessions
As mentioned, the primary aim of developing the test bench was to encourage graduate students to participate in a collaborative project. However, its ultimate purpose is to provide students with hands-on laboratory sessions. This section outlines the key learning outcomes delivered by the test bench, depending on whether the students are undergraduates or graduates. For clarity and conciseness, only selected experimental results are presented; investigations for all heat exchangers are not included. All data post-processing files and heat exchanger modelling codes are available, or will be made available, in a dedicated GitHub repository https://github.com/SamuelGendebien/HXs-test-bench (accessed on 30 March 2026). An example of laboratory session notes to help the students to prepare their laboratory sessions can be found on the Laboratory website https://www.labothap.uliege.be/cms/c_12821542/en/heat-exchangers-characterization (accessed on 30 March 2026).
4.1. Practical Implementation Details
4.1.1. Session Logistics
Before the lab session, students are asked to carefully read the laboratory notes, which describe the test bench in detail and provide theoretical reminders regarding heat exchangers.
Each lab session is organized for a group of three students and is supervised by a graduate or PhD student, referred to as the supervisor. The supervisor’s role is to guide students throughout the lab session. They must ensure students’ understanding while allowing them a degree of autonomy. The actual lab session is organized as follows:
- Students must be aware of the safety instructions and follow them with caution.
- Students should identify the components of the test bench and validate their comprehension of the test bench behavior with the supervising staff.
- The test bench can be started by the students under the surveillance of the supervising staff.
- Depending on the students’ level (undergraduate or graduate), they have to perform different manipulations to test various theoretical concepts. The theoretical concepts that can be illustrated with the test bench are described below, first for undergraduate students, then for graduate students.
- During the whole session, students have to complete a questionnaire with their measurements.
After the lab session, students are expected to analyze the measurements they collected. Depending on the course, they may be required to apply similar reasoning in a final written exam or in a report to demonstrate their understanding of the test bench.
4.1.2. Energy Costs of a Lab Session
As mentioned, the test bench operates in a closed loop, resulting in no water consumption. Regarding electricity costs, a conservative assumption is that the test bench consumes approximately 10 kWh over a 2-h laboratory session, leading to an estimated cost of between 3 and 4 €, based on the average electricity price in Belgium.
4.1.3. User Guide and Safety Procedure
Prior to attending any laboratory session, students must read the Test bench user Guide, which includes safety procedures for the test bench. These instructions are also reiterated orally by the supervising staff before the operation. The main safety guidelines are summarized below:
- Safety goggles must be worn at all times.
- Any modification of the operating conditions must be performed by the supervising staff or under their direct supervision.
- The location of the emergency stop buttons must be identified prior to operation.
- Direct contact with piping should be avoided, as surfaces may be hot; thermally insulated gloves are available if needed.
- Contact with electrical wiring is strictly prohibited.
- Particular caution is required when the fan is operating, despite the presence of a protective grid.
- Physical interaction with the test bench should be limited to actions explicitly authorized during the experiment.
- The test bench must not be operated if the electrical cabinet is open.
4.1.4. LabVIEW Interface
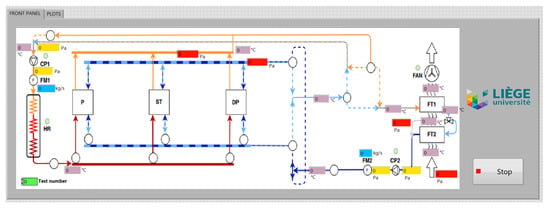
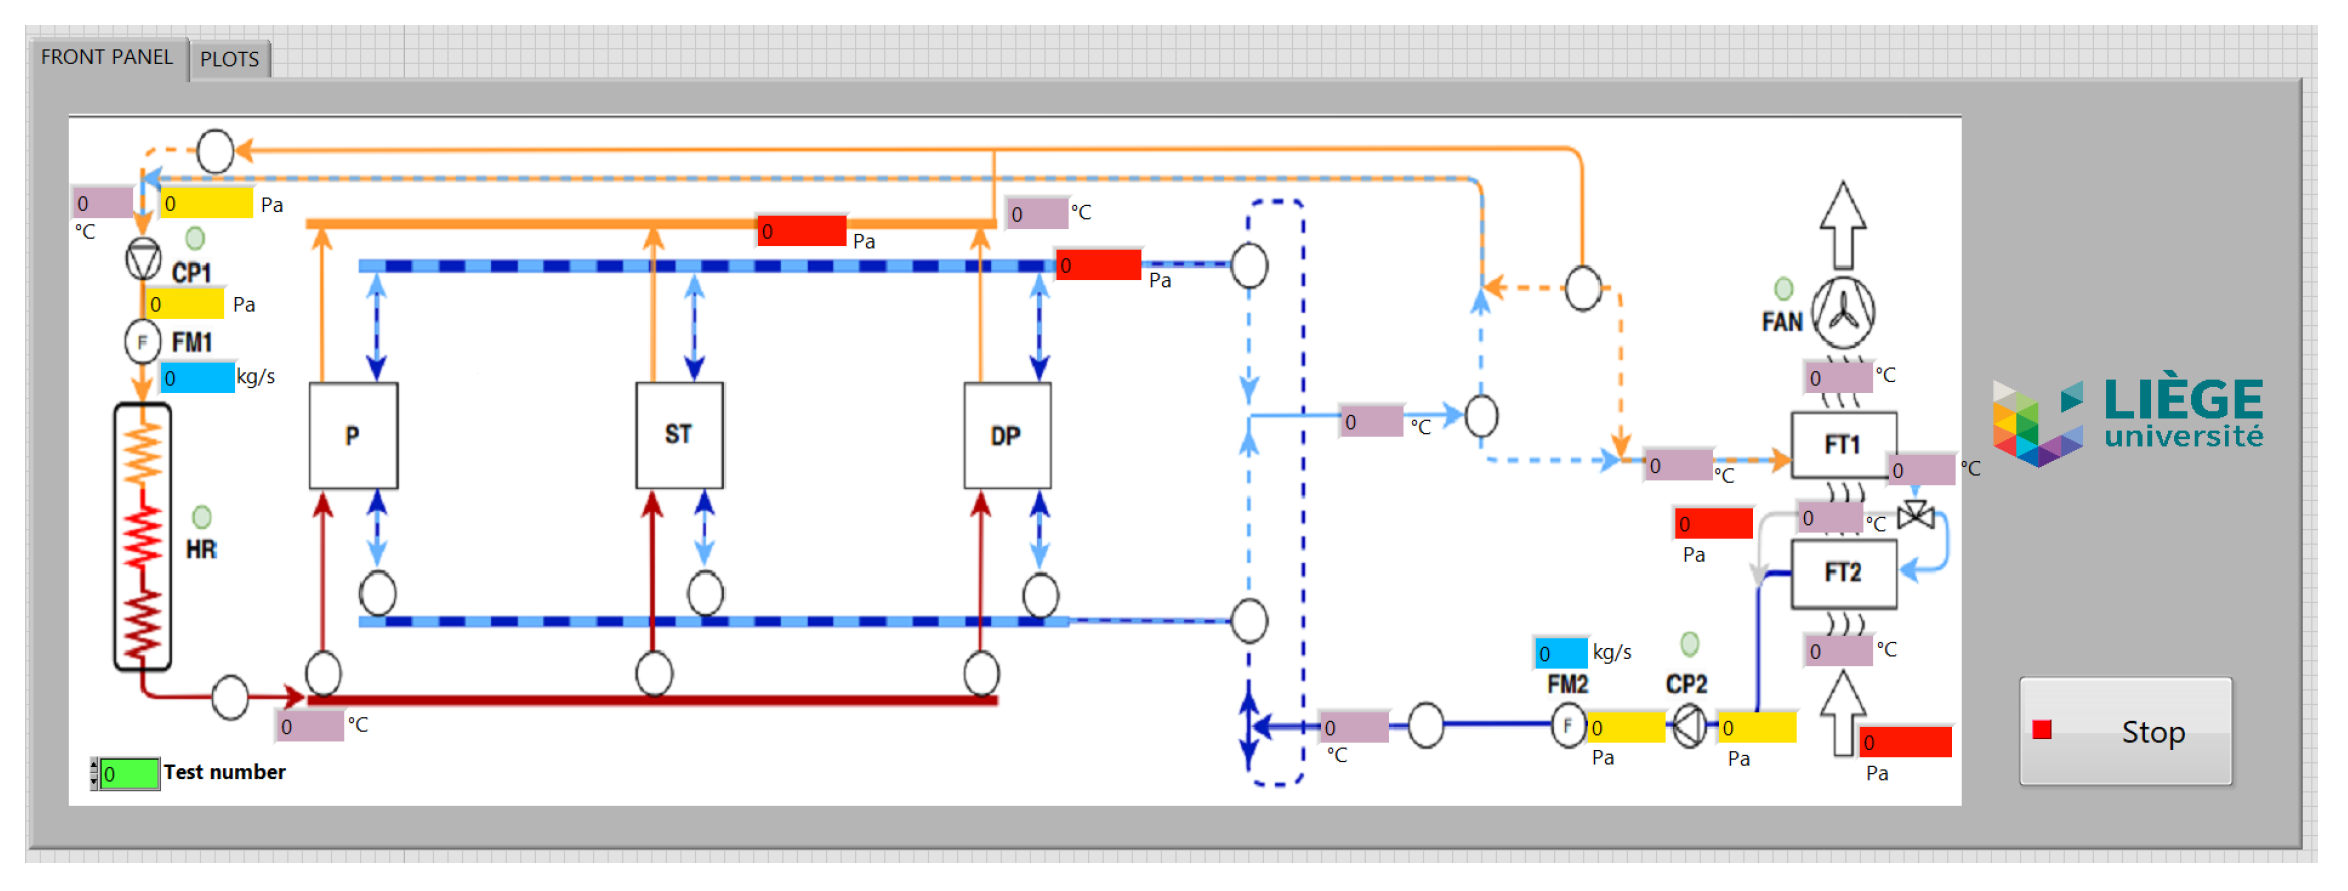
A dedicated data acquisition and visualization interface was developed using the National Instruments CompactRIO platform and the LabVIEW environment to enable real-time monitoring, data logging, and safe operation of the test bench. The interface, shown in Figure 10, provides a simplified schematic inspired by the P&ID, allowing measured quantities to be directly associated with their physical locations.
Figure 10.
LabVIEW-based user interface for real-time monitoring and data acquisition of the heat exchanger test bench.
All sensor signals (temperature, pressure, and mass flow rate) are acquired at a sampling time of 1 s, balancing the need to capture system dynamics with the requirement for stable averaged measurements under quasi-steady-state conditions, typically reached within a few minutes, while remaining suitable for future dynamic analyses.
The interface displays real-time values directly on the system schematic, enabling visualization of thermal and hydraulic states and facilitating the identification of temperature gradients, pressure losses, and flow configurations. All variables are continuously recorded and exported for post-processing, enabling time averaging, heat transfer rate and effectiveness computation, and uncertainty analysis.
Overall, the LabVIEW interface acts as a bridge between raw sensor data and engineering interpretation, supporting both undergraduate and graduate learning objectives.
4.2. Intended for Undergraduate Students
4.2.1. Prerequisites
The prerequisites for undergraduate students to attend the laboratory sessions are as follows: basic concepts in general thermodynamics, fluid mechanics, heat transfer, energy transfer between a system and its environment, the first law applied to closed systems (extended to open systems), and the properties of pure substances.
4.2.2. Energy Balance
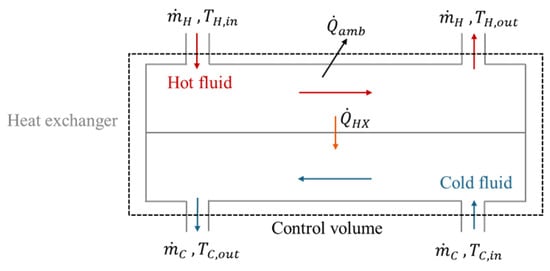
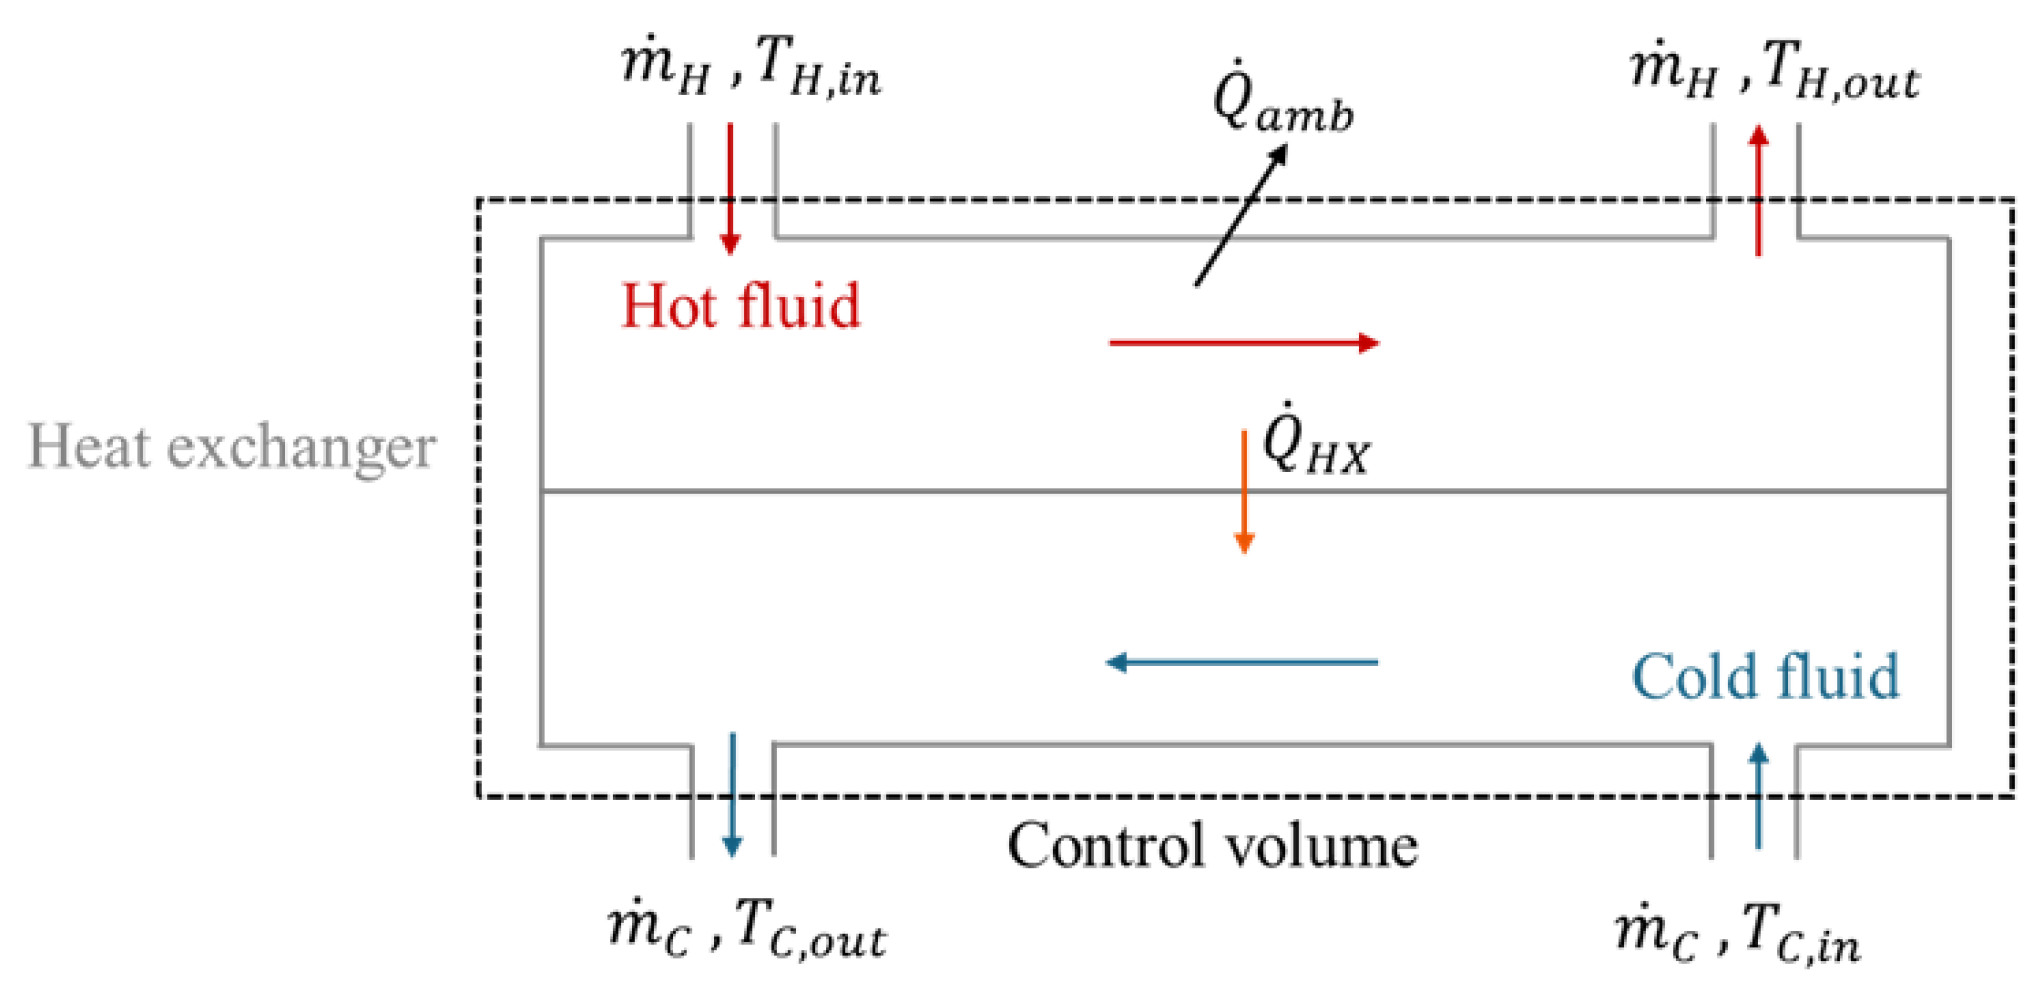
As illustrated in Figure 11, the first concept demonstrated through the laboratory sessions is energy conservation and the use of control volumes.
Figure 11.
Energy balance and control volume.
Regardless of the configuration, an overall energy balance can be written for the heat exchanger control volume:
Two key assumptions simplify the analysis: the fluids’ specific heat capacities are constant over the relevant temperature range, and the heat exchanger is externally adiabatic, with no heat exchanged with the surroundings. While some heat losses may occur in practice, these can be discussed during the laboratory session.
Under these assumptions, the heat transfer rate can be represented as:
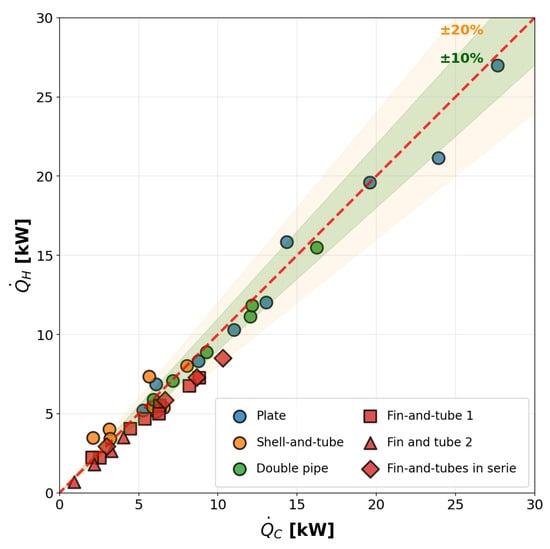
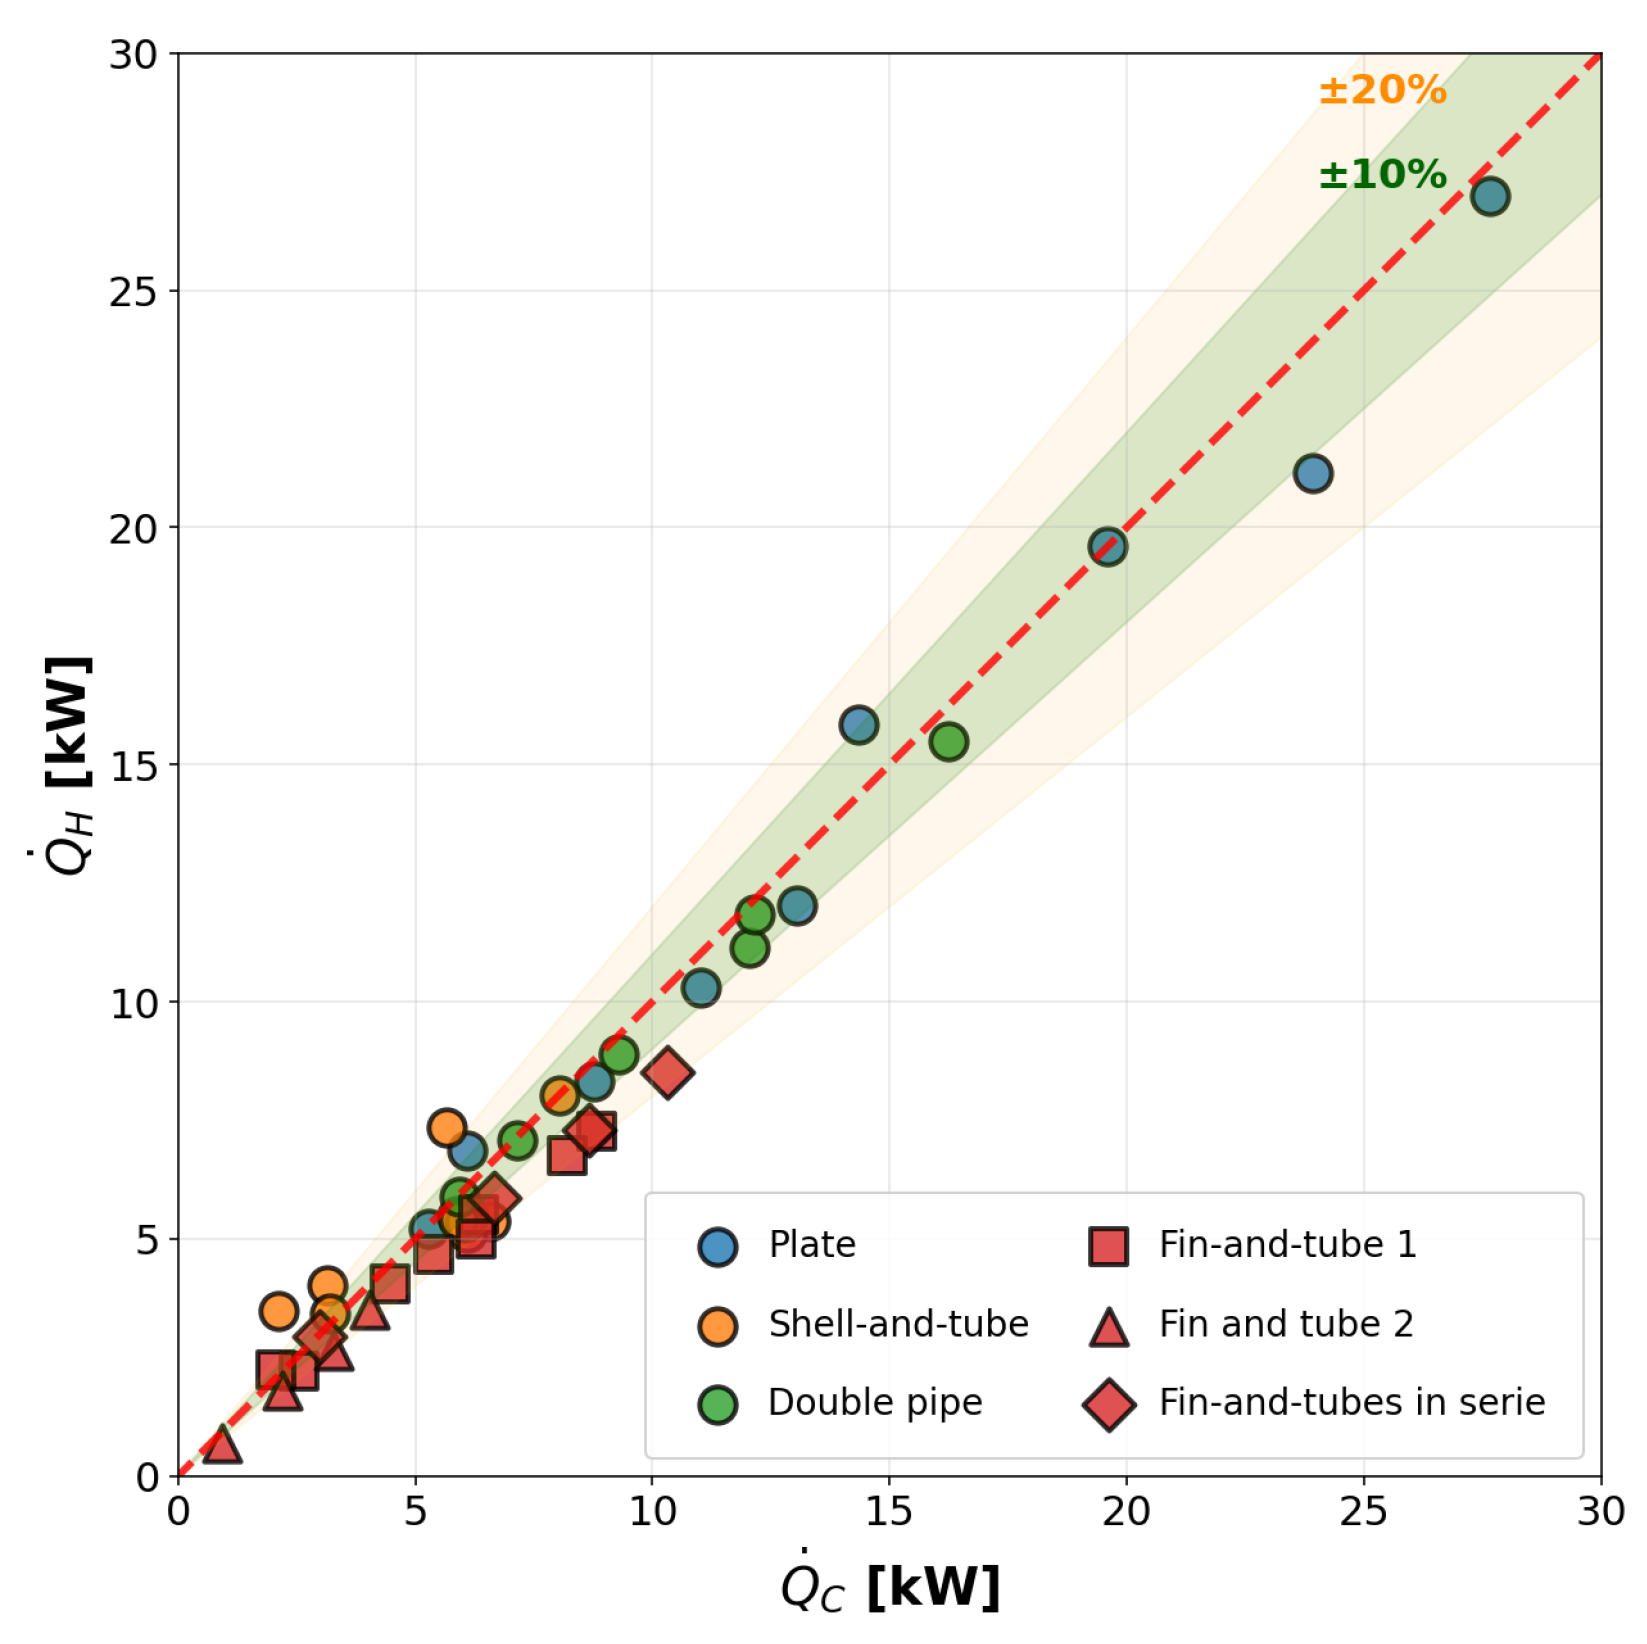
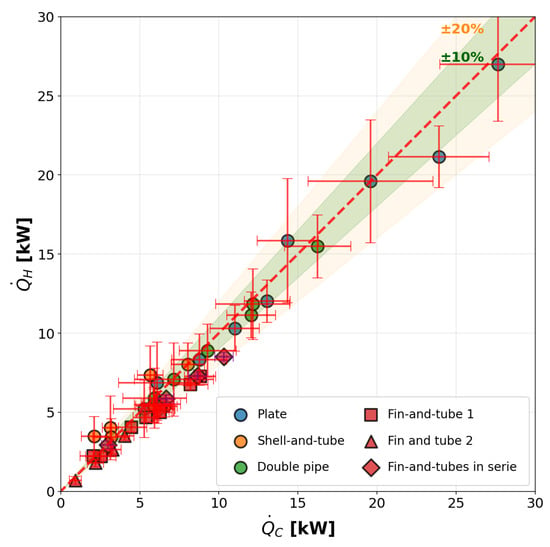
Figure 12 shows the type of results that can be obtained from the test bench for several tested heat exchangers under a wide range of operating conditions (parallel and counterflow arrangement, balanced and unbalanced mass flow rate, wide range of temperatures…).
Figure 12.
Parity plot comparing the heat transfer rate measured on the hot and cold sides for all tested heat exchangers.
A similar energy balance can be performed by considering a control volume encompassing the entire test bench, comparing the electrical energy supplied to the heating resistance with the energy dissipated by the fin-and-tube heat exchangers .
4.2.3. Heat Exchanger Thermal Performance
Another concept that can be demonstrated using the test bench is heat exchanger effectiveness. The LMTD method can also be explored in the laboratory sessions, but it is not detailed here for the sake of concision.
The -NTU method relates the actual heat transfer rate to the maximum possible heat transfer between the two fluids, which occurs when the fluid with the minimum heat capacity rate undergoes the maximum possible temperature change. The effectiveness serves as a dimensionless measure of the heat exchanger’s performance:
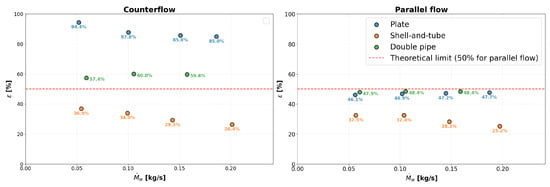
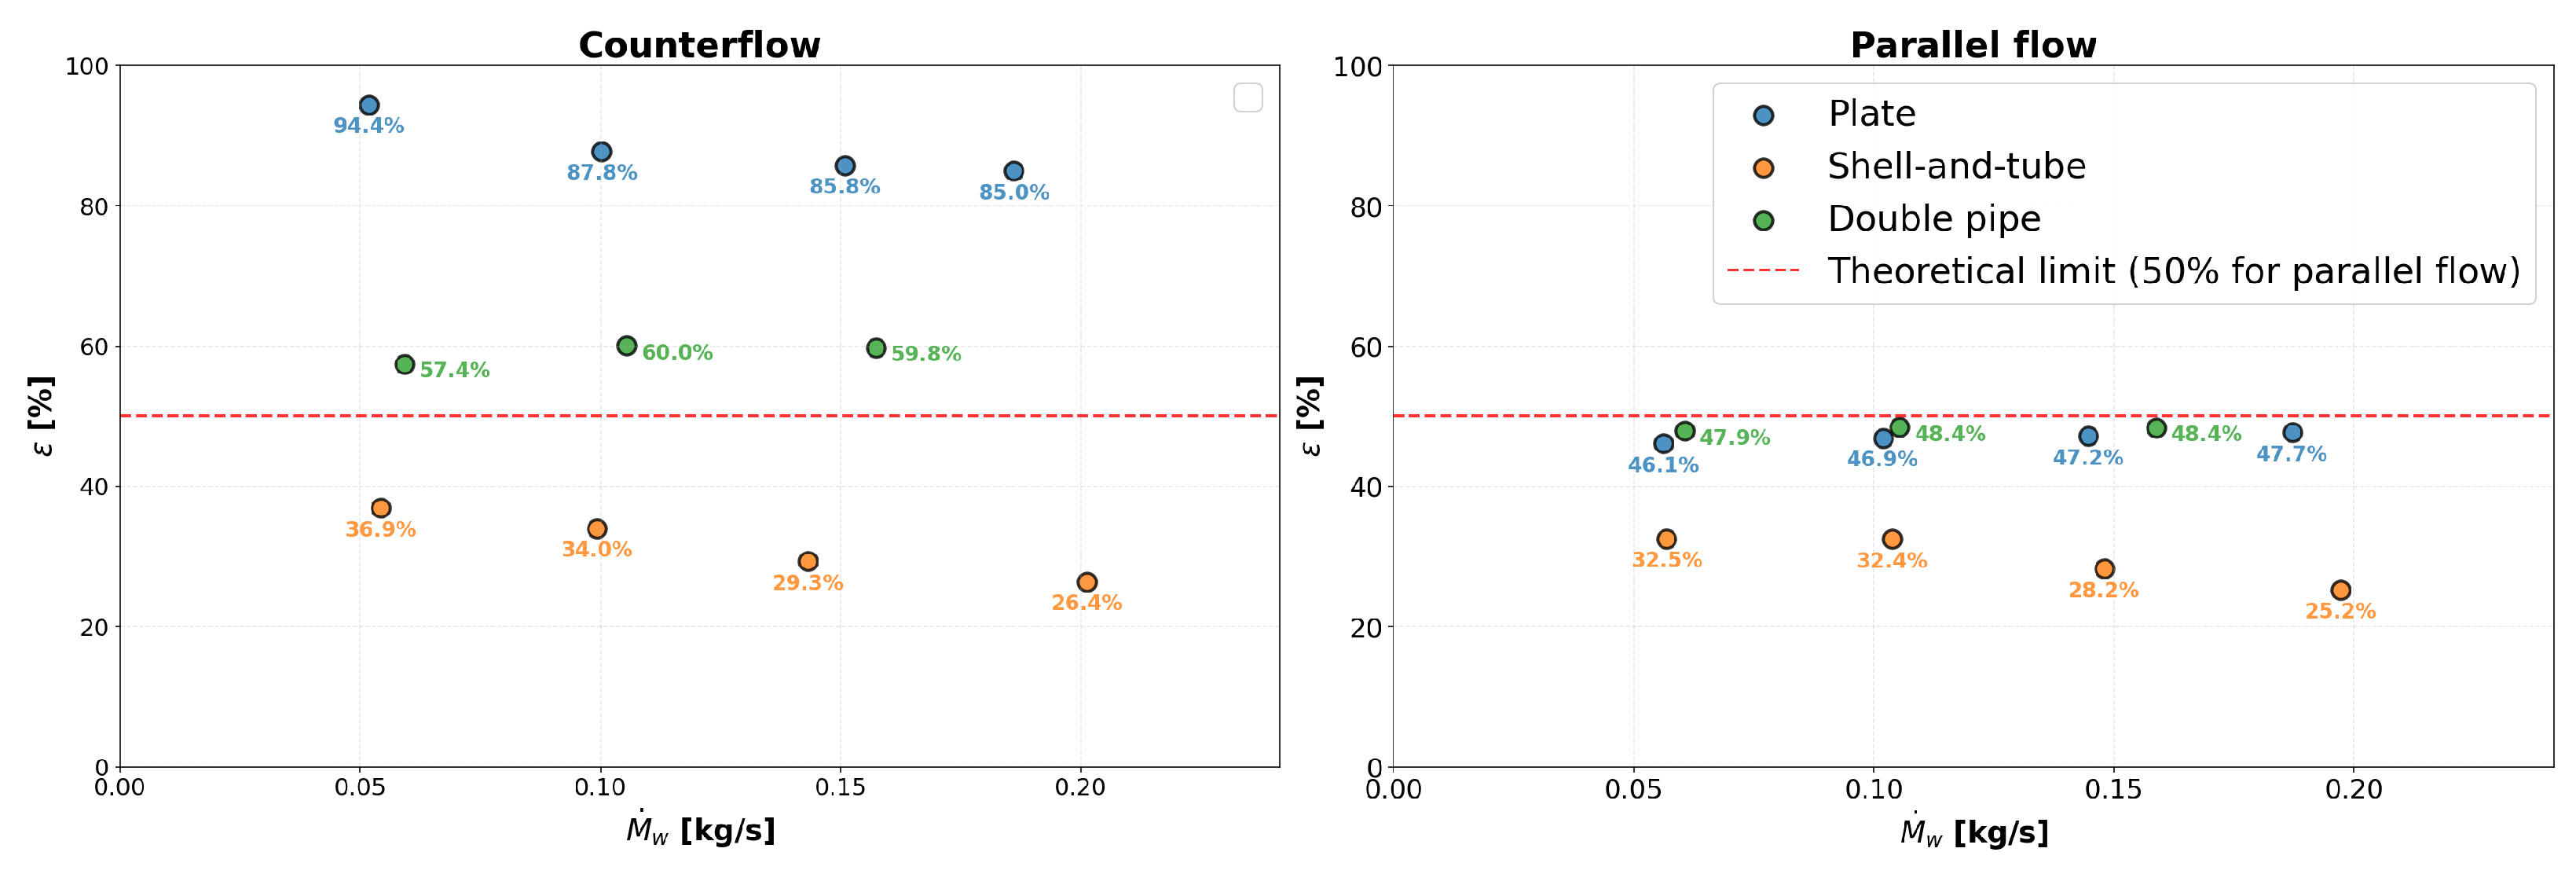
The test bench was designed to test different water-to-water heat exchangers under identical operating conditions. As shown in Figure 13, the setup highlights differences in effectiveness due to the heat exchangers’ geometries, providing a basis for discussions on heat exchanger design.
Figure 13.
Comparison of water-to-water heat exchanger effectiveness in counterflow (left) and parallel-flow (right) arrangements for balanced flow rates.
4.2.4. Flow Arrangement
Another concept that can be illustrated by the test bench is the impact of the flow arrangement on the heat exchanger thermal performance. As expressed in many reference books [1,23,24], the flow configuration can have a large effect on the performance of direct transfer heat exchangers, as energy is removed from hot fluid and added to the cold fluid, causing their temperatures to change, affecting the temperature difference that drives the heat transfer process. The test bench allows investigation of three configurations: parallel flow and counterflow for water-to-water heat exchangers (both of which can be selected and set by the user) and crossflow for air-to-water heat exchangers. Figure 13 illustrates a typical investigation that can be conducted on water-to-water heat exchangers.
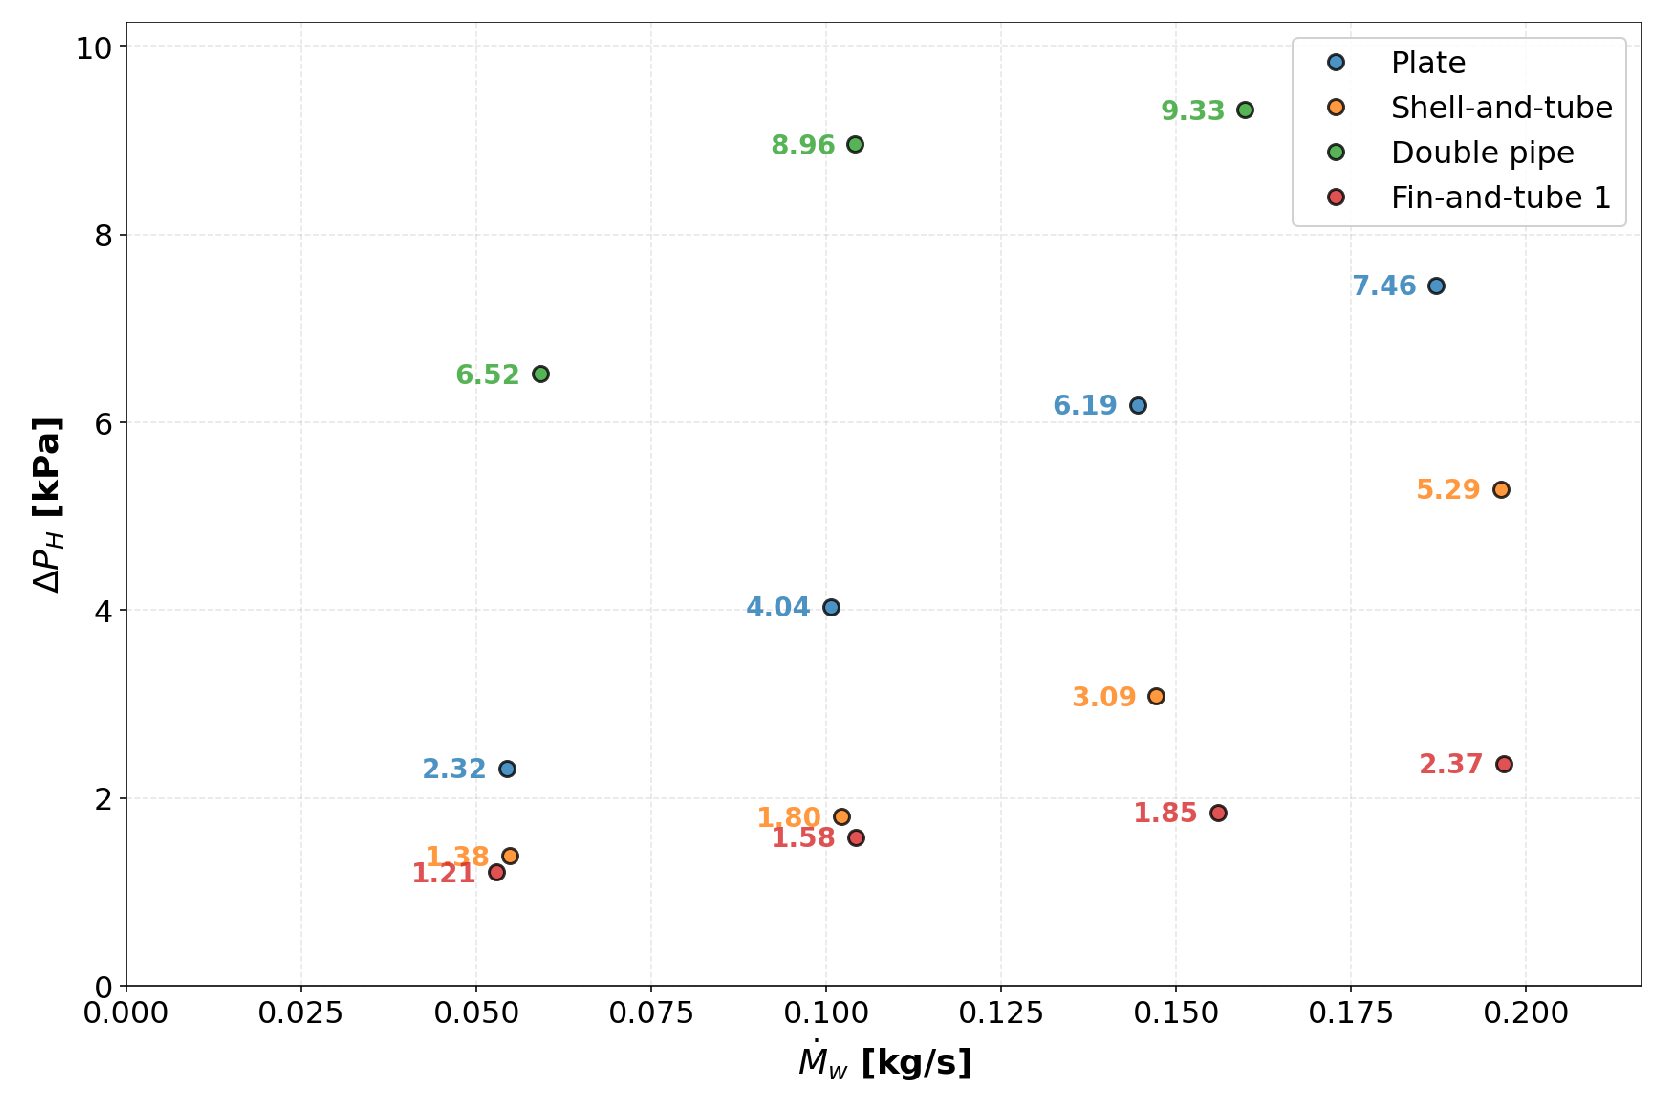
4.2.5. Trade-Off Between Thermal and Hydraulic Performance
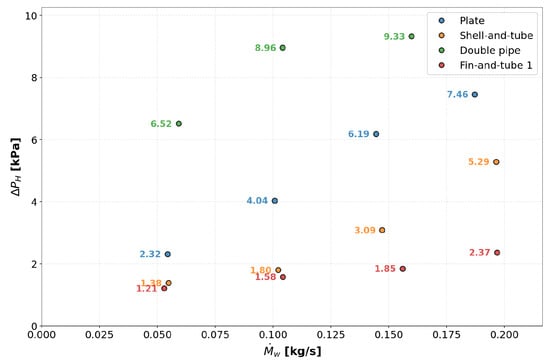
In a heat exchanger, the pressure drop is the loss of fluid pressure as it flows through the device channels or tubes. The pressure drop increases with flow velocity, fluid viscosity, and the length and roughness of the flow path. From a design perspective, minimizing pressure drop is important because it directly determines the pumping or fan power required to maintain a given flow rate. However, enhancing heat transfer typically requires higher velocities or increased turbulence, which also increases pressure losses. Engineers must therefore balance thermal performance and hydraulic losses when sizing and configuring a heat exchanger. Figure 14 shows the evolution of the pressure drop for the different water-to-water heat exchangers.
Figure 14.
Comparison of the pressure drop evolution as a function of the water mass flow rates for the different types of tested heat exchangers.
4.3. Intended for Graduate Students
4.3.1. Prerequisites
The prerequisites for graduate students attending the laboratory sessions are: applied thermodynamics, basic measurement techniques, fundamentals of heat exchanger modeling, and an understanding of key irreversibilities (e.g., finite temperature differences, pressure drops in heat exchangers, and friction losses).
4.3.2. Introduction to Measurement Technique, Uncertainty Analysis, and Data Post-Processing
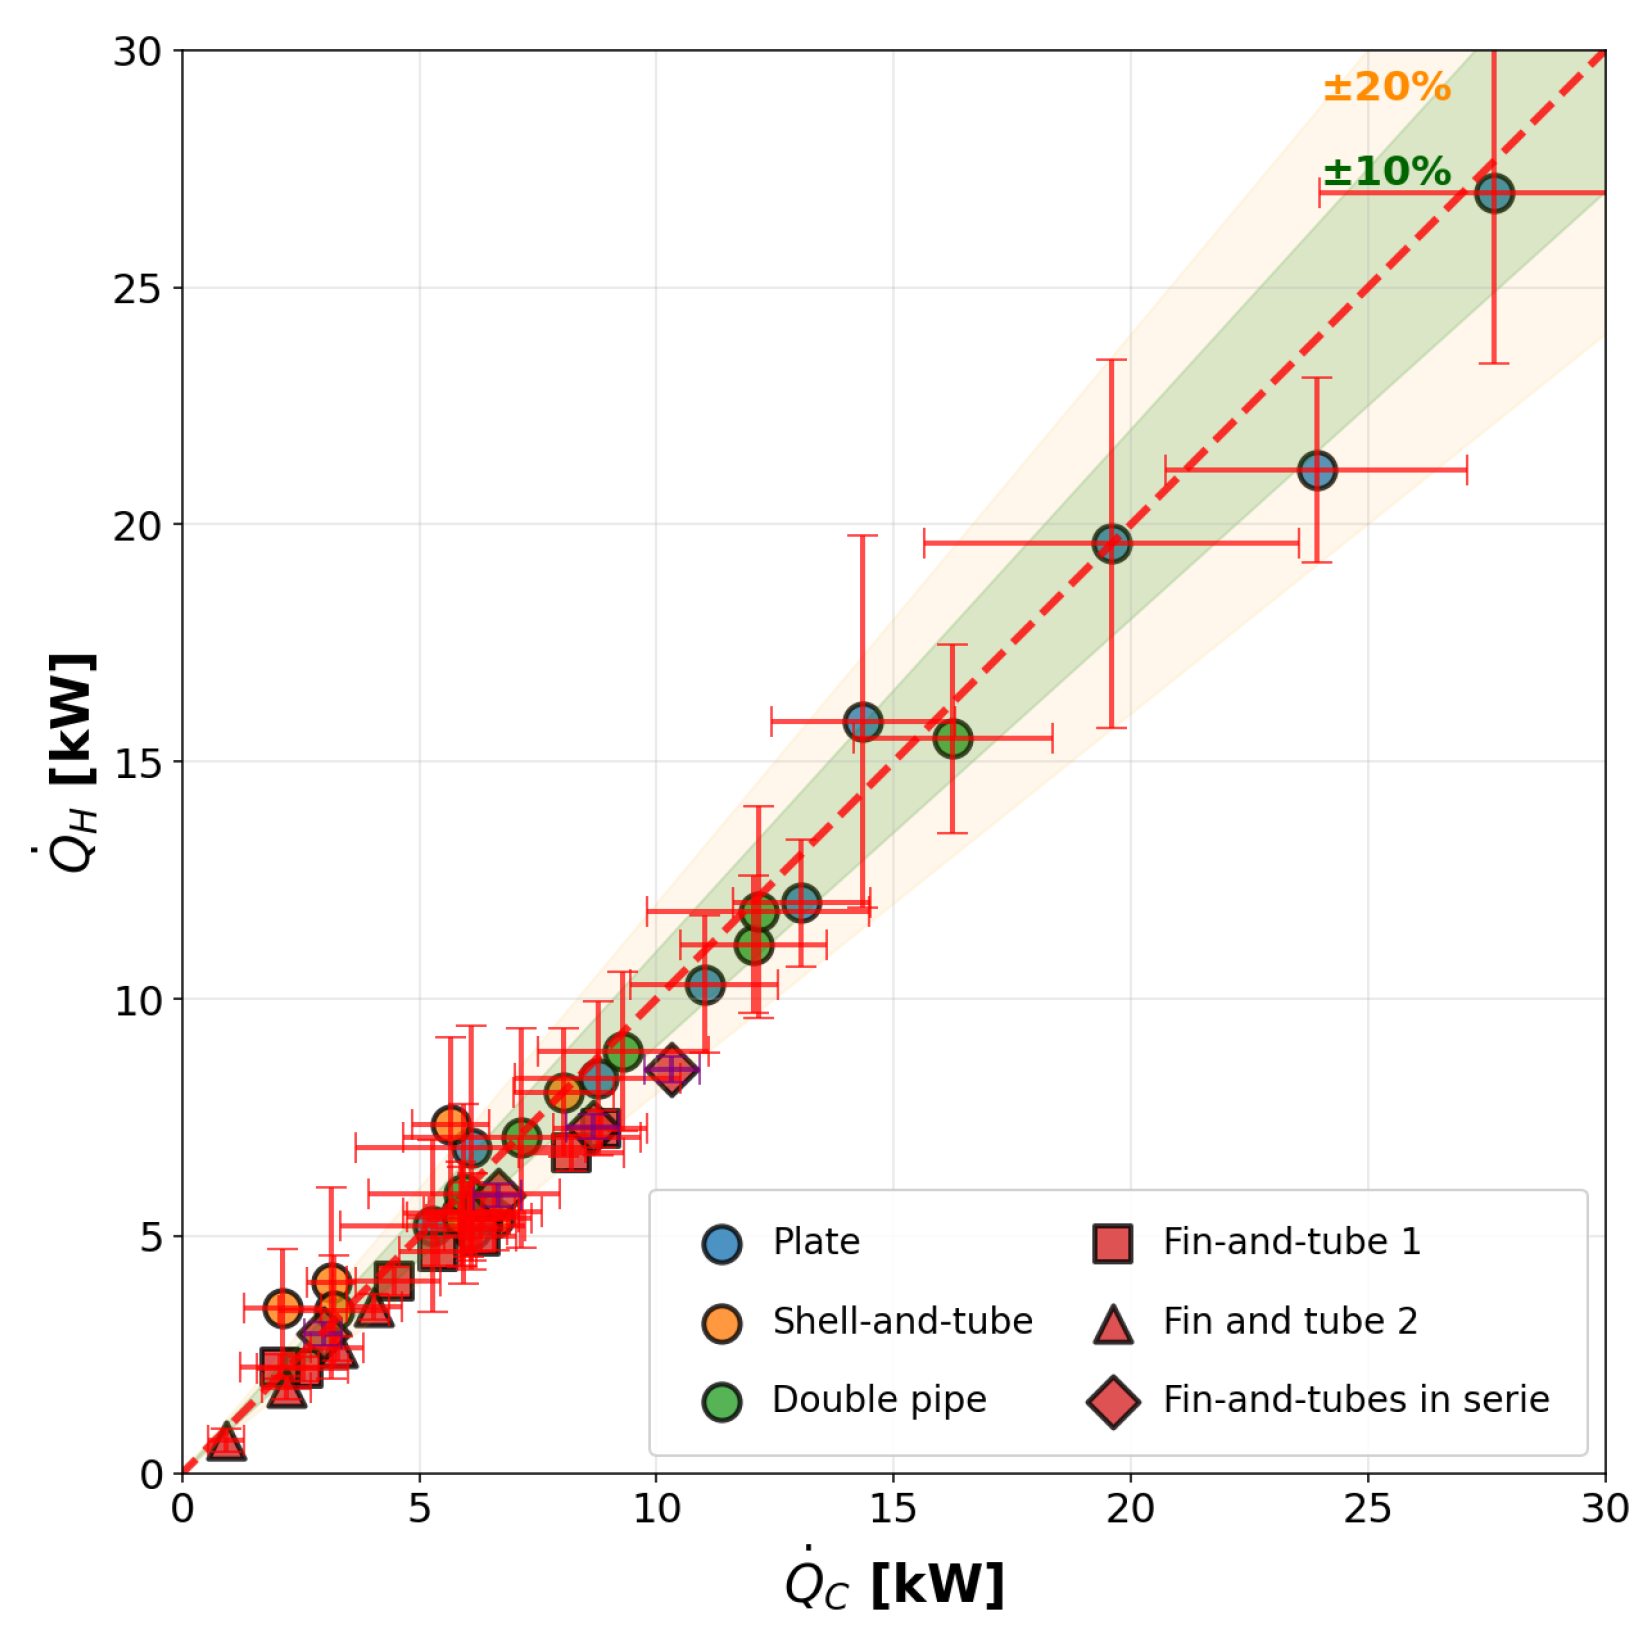
The test bench provides a practical setting in which students can familiarize themselves with measurement techniques (temperature measurement using thermocouples, air flow rate determination via a head-type flow meter, and pressure measurement) and apply the concept of uncertainty propagation to experimentally derived quantities. Since quantities of interest, such as heat transfer rate or overall heat transfer coefficient, are derived from primary sensor readings, their uncertainties must be rigorously propagated before any meaningful comparison with model predictions or proper energy balance can be made. The uncertainties of the reported findings are therefore evaluated from the known sensor accuracies following the NIST method [25], in which the uncertainty of a calculated quantity is obtained from the individual measured uncertainties via:
As an example, applying this propagation framework to the energy balance equations yields a more comprehensive representation of the experimental results. Uncertainty can therefore be included in Figure 15, leading to a more appropriate representation of the energy balance.
Figure 15.
Parity plot comparing the heat transfer rate and its related uncertainties measured on the hot and cold sides for all tested heat exchangers.
The test bench also enables students to perform their own data post-processing, including time-averaging the acquired signals and extracting the quantities of interest from the raw measurements.
4.4. Illustration of the -NTU Approach
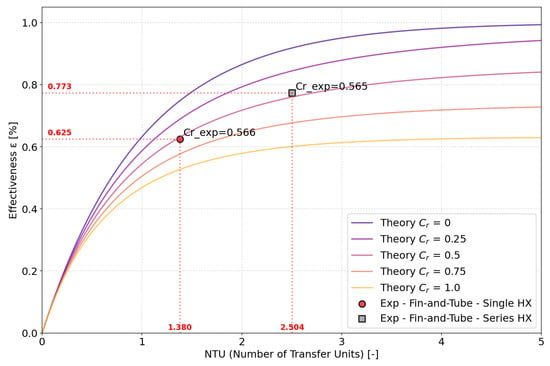
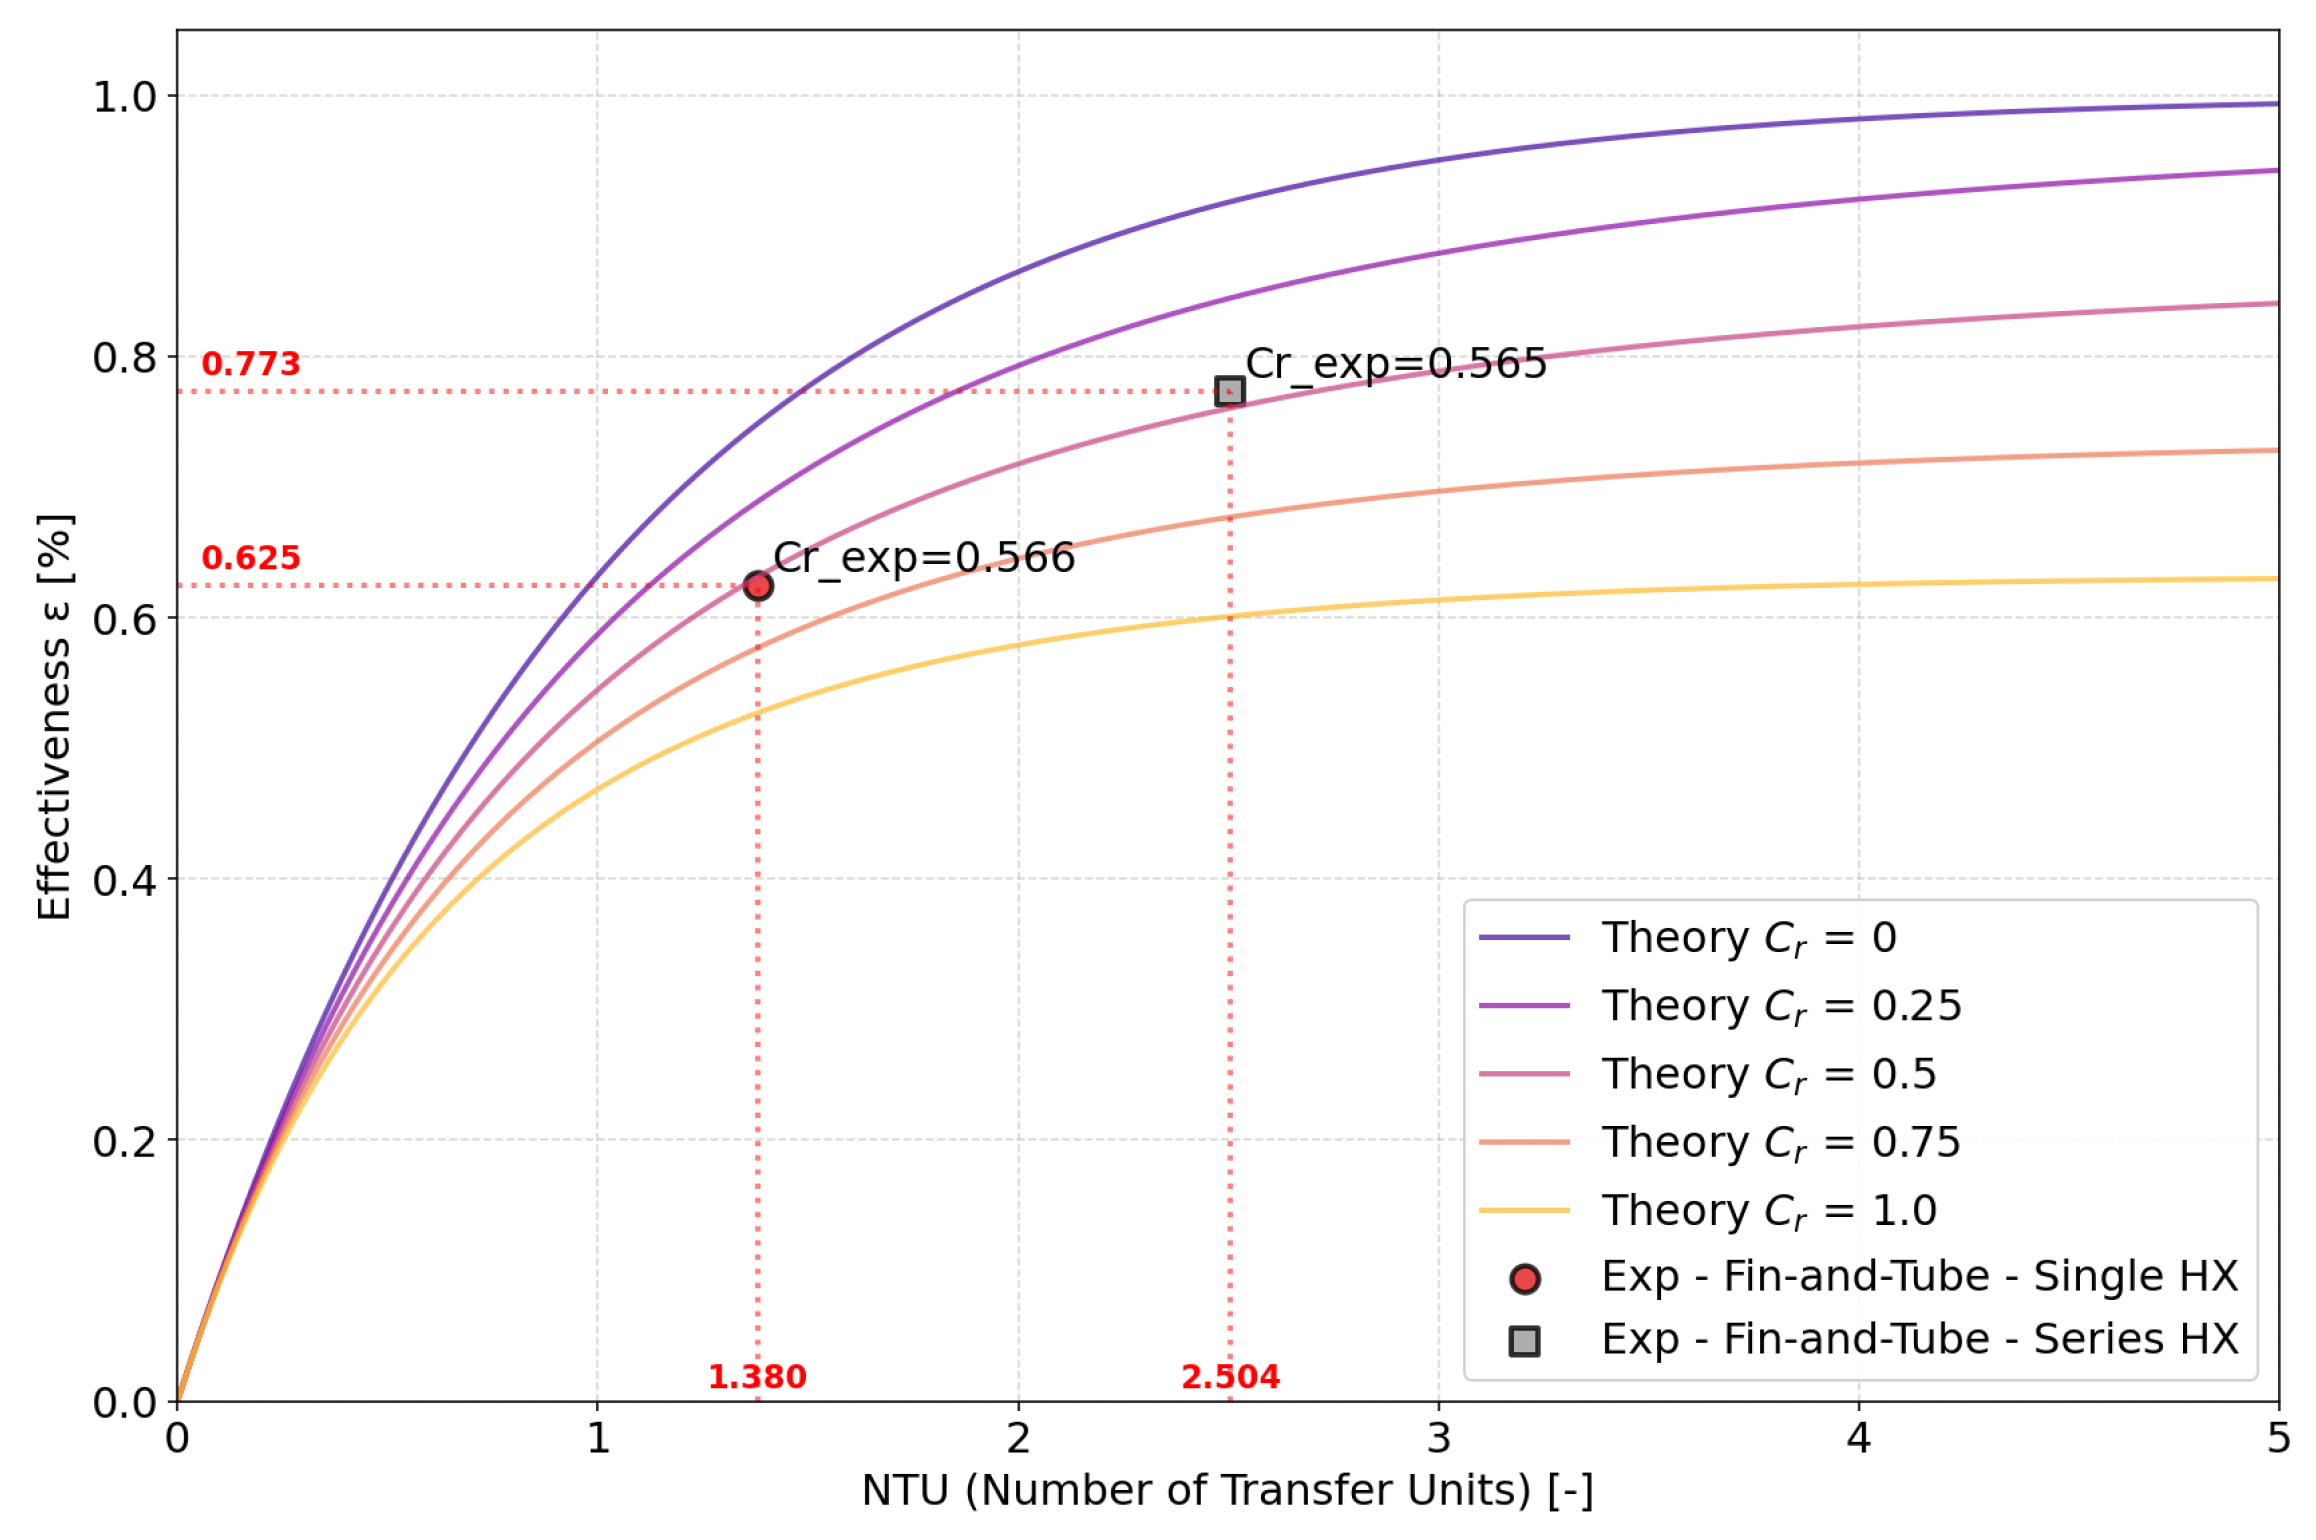
For graduate students, the -NTU method can be addressed in greater depth rather than being limited to a simple effectiveness measure. One feature of the test bench is the possibility of using one or two fin-and-tube heat exchangers in series. By maintaining identical water and air flow rates, the heat transfer area can be doubled while the heat capacity rates remain unchanged, thereby doubling the NTU. As illustrated in Figure 16, this configuration enables comparison between the experimentally determined effectiveness and the theoretical prediction through the -NTU relationship:
Figure 16.
Effect of NTU Doubling on Heat Exchanger Effectiveness: Illustration Using One or Two Fin-and-Tube Heat Exchangers in Series.
4.5. Modelling
The test bench provides access to various exchanger geometries and controlled operating conditions, allowing students to develop, assess, and calibrate their models. Comparing model predictions with measured outlet temperatures, heat duties, and pressure drops enables quantification of errors and identification of critical assumptions.
Heat exchanger modelling spans a hierarchy of fidelity. Zero-dimensional (0D) models describe the exchanger with global quantities—conductance , number of transfer units , and effectiveness —at mean conditions. One-dimensional (1D) models resolve temperatures along the flow direction, while higher-dimensional (2D, 3D) models capture additional effects at greater computational cost.
For shell-and-tube exchangers, the Kern method treats the shell-side flow simply but neglects leakage and bypass streams, causing systematic errors. The Bell–Delaware method corrects for these effects with explicit shell-side factors, improving accuracy at the cost of added complexity [23].
4.5.1. Plate Heat Exchanger 0D Modelling
A typical 0D model of a plate heat exchanger is presented below to illustrate the modelling and validation procedure. This serves as an example of the type of investigation and experimental validation that can be implemented.
Geometry
The geometric parameters and derived relations for the plate heat exchanger, including the surface enlargement factor, effective heat transfer area, and hydraulic diameter, are calculated following the methodology presented by [26].
Fluid Properties
Thermophysical properties are evaluated at the arithmetic mean of the inlet and outlet temperatures on each side and at the corresponding operating pressure, using the CoolProp equation-of-state library [27]. The thermal conductivity of the stainless-steel wall is treated as a temperature-dependent function evaluated at the overall mean wall temperature. Since the fluid properties depend on the yet-unknown outlet temperatures, the model is solved iteratively.
Convective Heat-Transfer Coefficients
Convective coefficients are obtained from the Wanniarachchi [28] correlation, which gives the Nusselt number for corrugated chevron plates as:
with
where denotes the chevron angle in degrees. The convective coefficient is .
Overall Heat-Transfer Coefficient and Thermal Conductance
The overall heat-transfer coefficient is calculated using a one-dimensional series thermal resistance model including convection on both fluid sides and conduction through the plate wall, while fouling resistances are neglected:
Effectiveness–NTU Method
The number of transfer units is defined as:
The heat exchanger effectiveness is related to and the heat-capacity ratio through standard analytical expressions that depend on the flow arrangement [1]. Once the effectiveness and the maximum possible heat transfer rate are assessed, the predicted heat transfer rate is obtained from Equation (9).
Solution Procedure
The problem is nonlinear because depends on the outlet temperatures. It is expressed as two algebraic equations enforcing energy conservation:
where the predicted heat transfer rates depends on the outlet temperatures. The system is solved iteratively for the outlet temperatures starting from physically reasonable guesses.
Pressure Drop
Fanning friction factors are evaluated at mean-temperature conditions using the Wanniarachchi correlation [28]:
The single-pass pressure drop is given by:
4.6. Manufacturer Data Cross-Check
For graduate students, another key aspect is to cross-check their obtained results against the manufacturer’s data or design specifications, such as the heat transfer area or nominal heat duty, to validate the experimental findings. It also provides an opportunity for students to process data and extract key parameters from multiple datasheets, since manufacturers typically supply one file per operating condition.
4.7. Experimental Validation
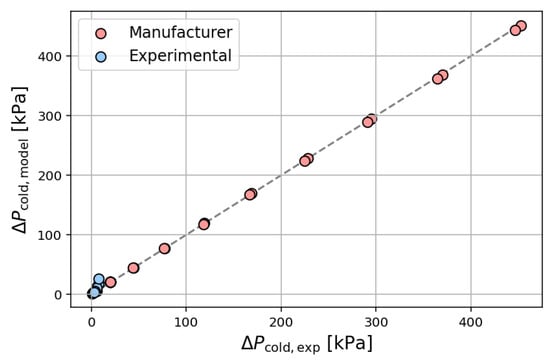
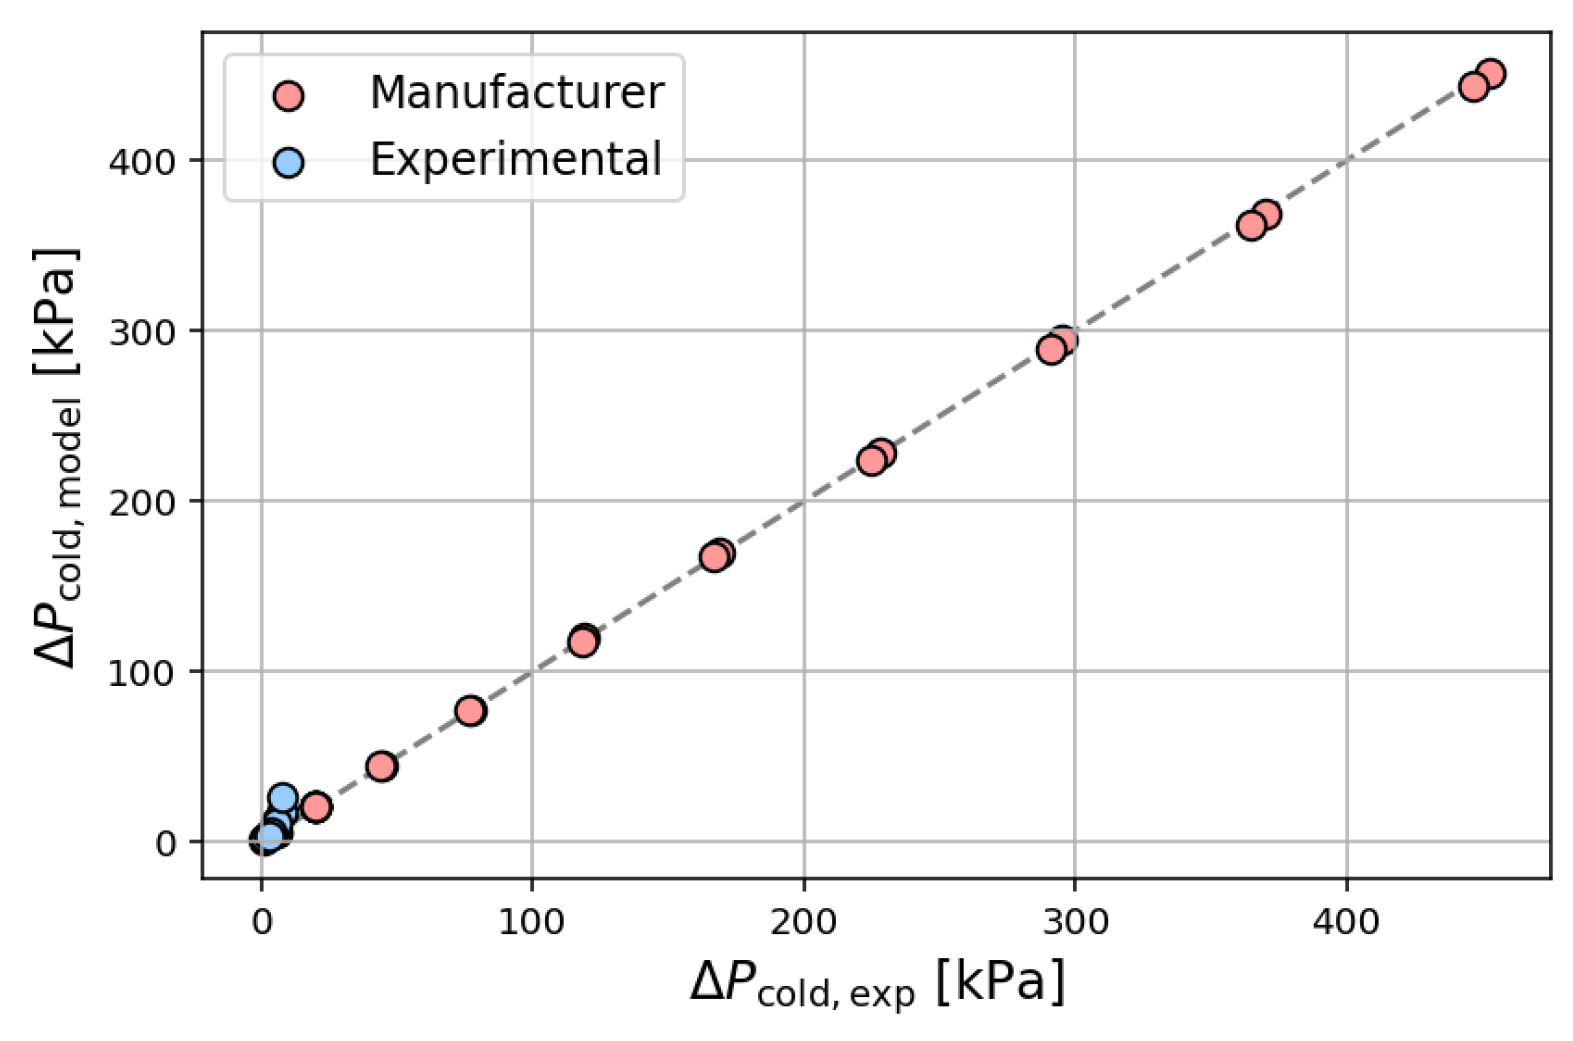
After gathering datasets from both the experimental campaign and manufacturer data, the model parameters were calibrated and subsequently validated against measured heat transfer rates and pressure drops. The Wanniarachchi correlation [28] was found to accurately predict heat transfer without additional tuning, whereas a correction factor of 1.3 was applied to the pressure drop correlation (Equation (17)) to improve agreement with experimental observations. Since the objective of the present study was not to establish a fully systematic parameter-identification procedure, but rather to illustrate the type of model–experiment confrontation enabled by the test bench, the correction factor was obtained through manual adjustment against the cold-side pressure-drop parity plot shown in Figure 20. The correction factor was kept constant over the full Reynolds number range investigated.
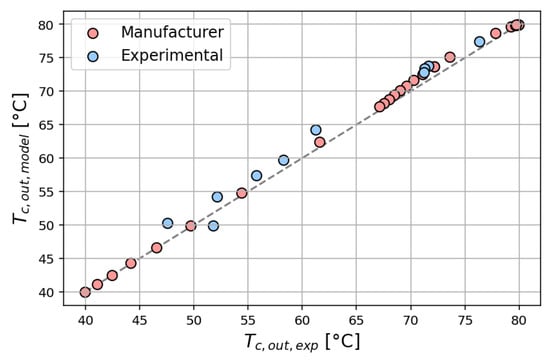
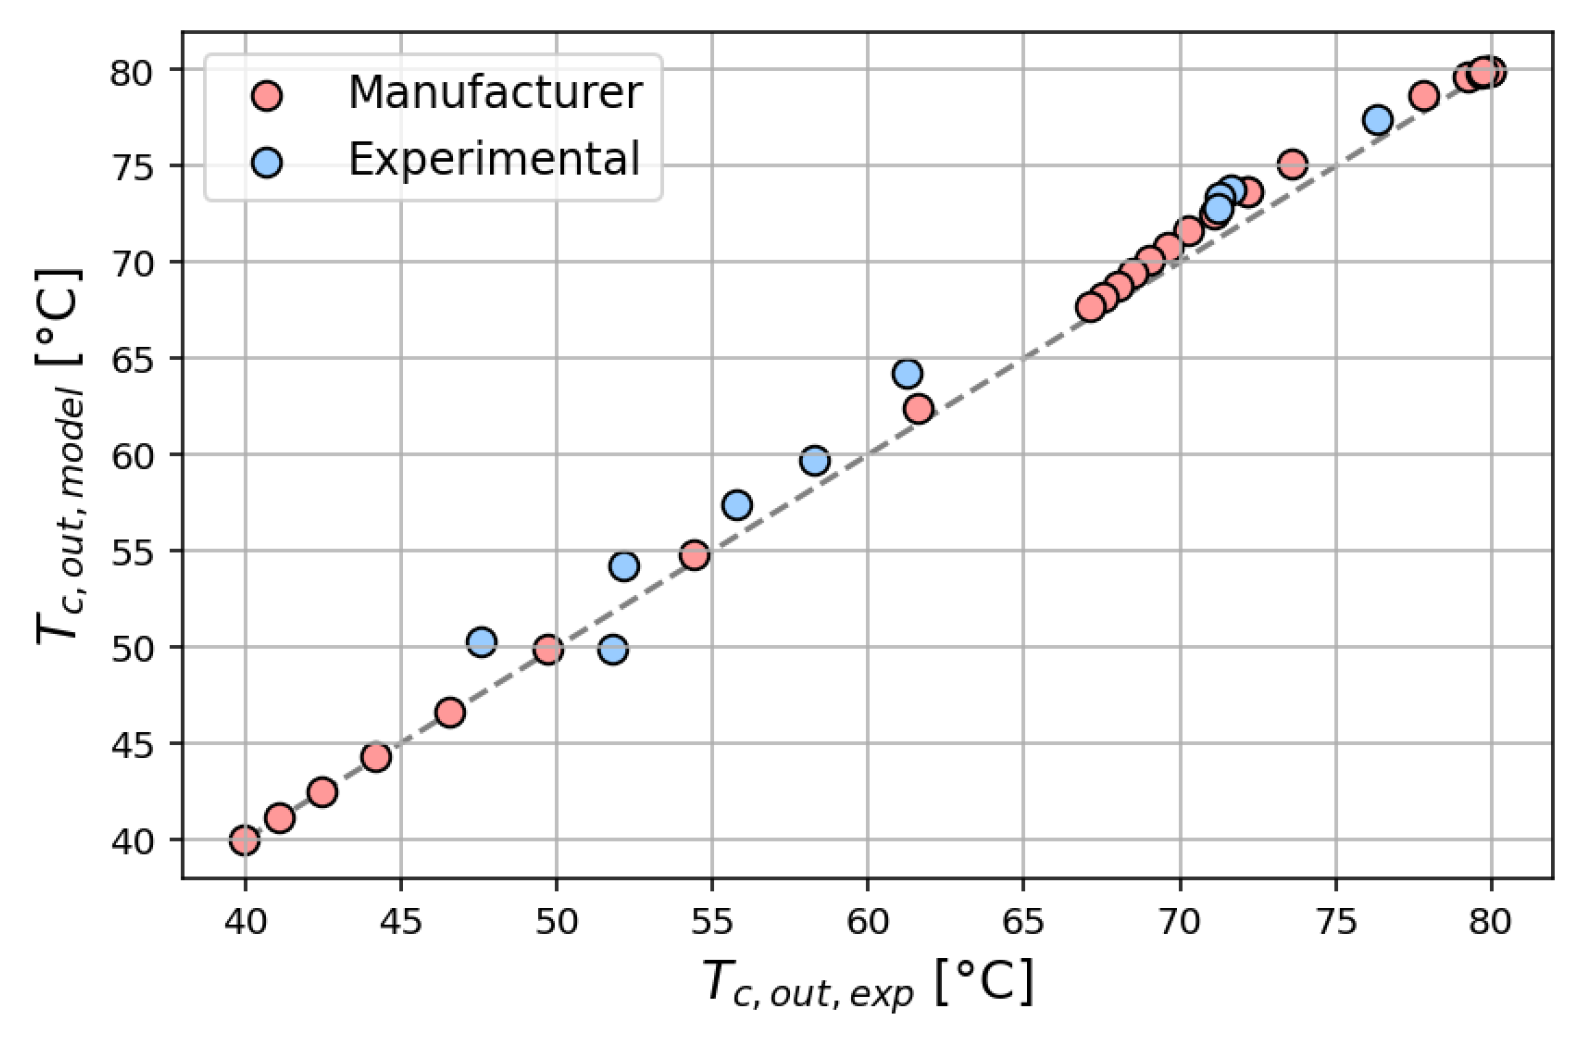
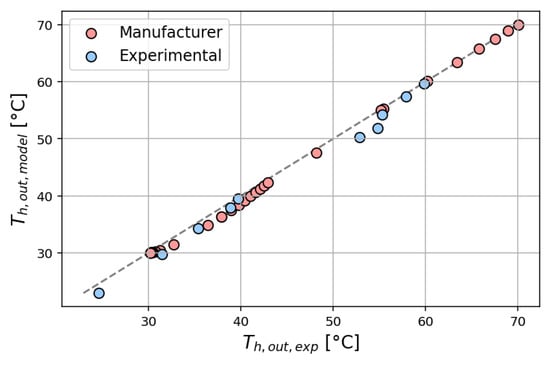
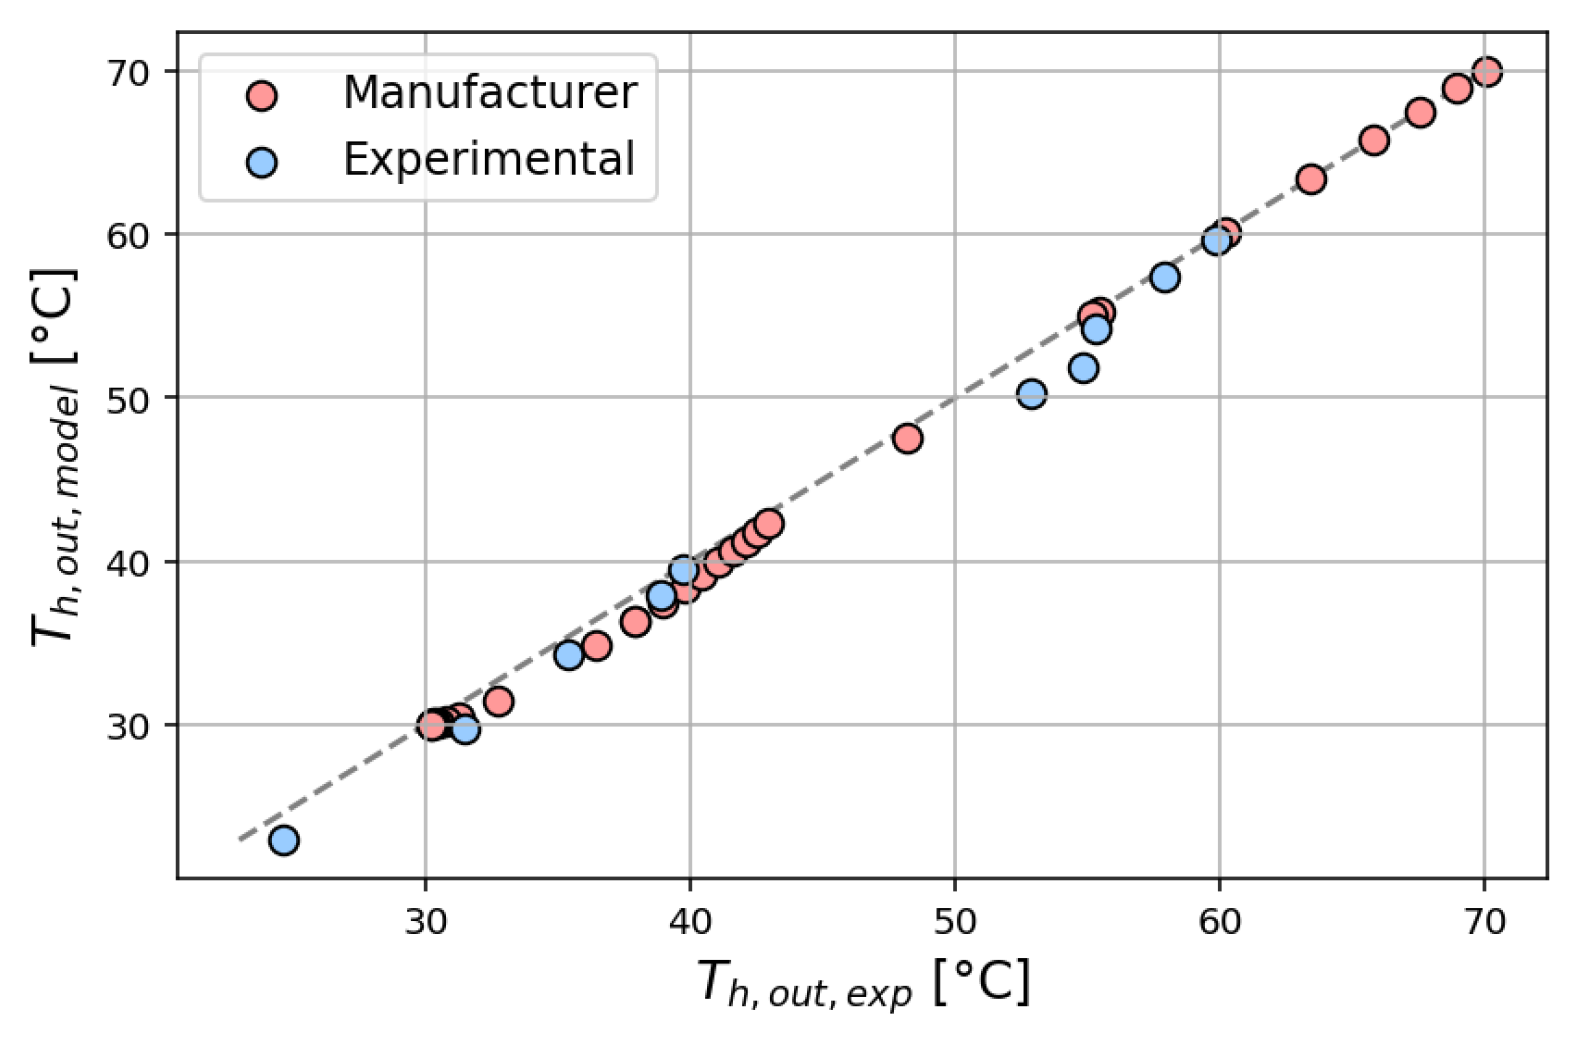
Figure 17 and Figure 18 present parity plots comparing predicted and measured outlet temperatures for the cold and hot sides, respectively. In both cases, the data points closely follow the parity line, indicating good agreement between the model and the experiment over the full range of operating conditions. The limited scatter observed reflects measurement uncertainty and deviations from ideal heat exchanger assumptions, including heat losses and non-uniform flow distribution. From an educational perspective, these results illustrate that simplified models can capture the dominant thermal behavior while still exhibiting small but meaningful discrepancies.
Figure 17.
Comparison of model predictions and experimental results for the cold side outlet temperature.
Figure 18.
Comparison of model predictions and experimental results for the hot side outlet temperature.
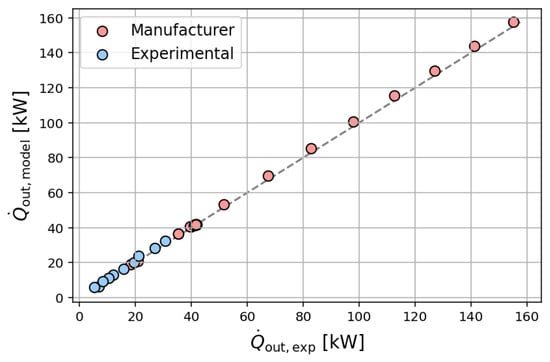
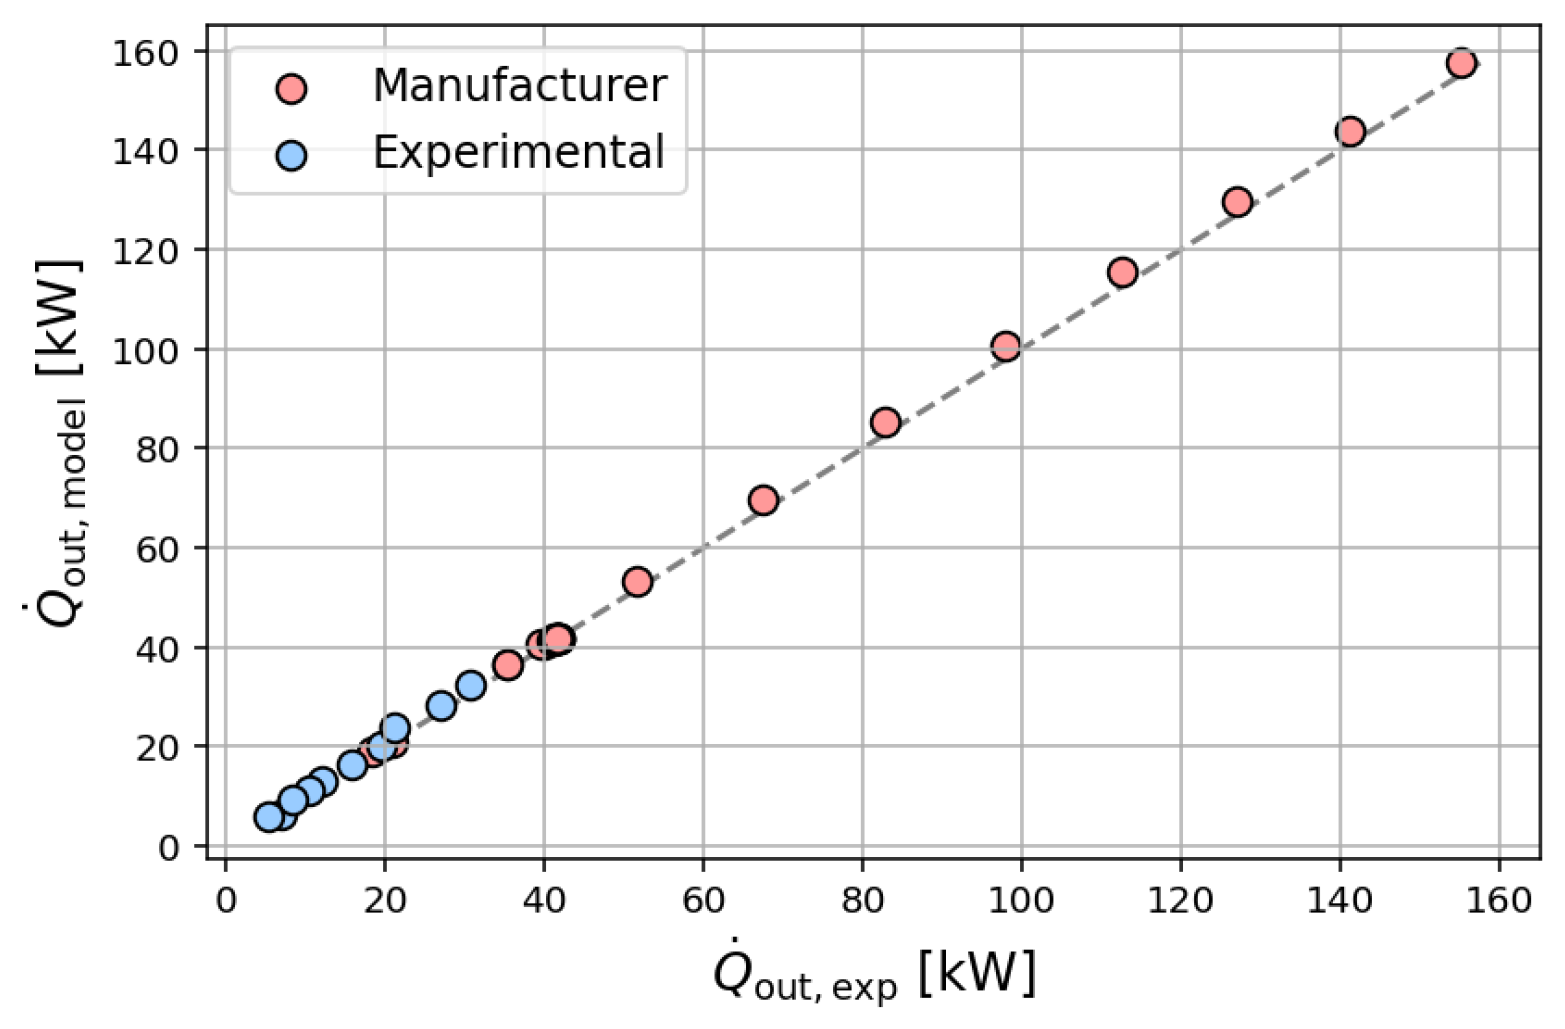
The comparison of heat transfer rates shown in Figure 19 further confirms the validity of the modeling approach. Both experimental and manufacturer data collapse well onto the identity line, demonstrating that the -NTU framework, combined with the selected heat transfer correlation, provides a consistent estimation of the global heat duty.
Figure 19.
Comparison of model predictions and experimental results for heat transfer rate.
Figure 20 shows the comparison between model predictions and experimental results in terms of hydraulic performance. In contrast to the heat transfer predictions, the pressure drop model required calibration through the introduction of a tuning factor of 1.3 applied to the empirical correlations. With this adjustment, good agreement with the experimental data is obtained, comparable to that observed for thermal quantities. This behavior highlights the sensitivity of pressure-drop predictions to empirical correlations. This represents an important learning outcome, as students observe that hydraulic performance can require calibration to achieve reliable predictive accuracy.
Figure 20.
Comparison of model predictions and experimental results for the cold-side pressure drop.
Overall, the validation results demonstrate that the proposed model reliably predicts heat exchanger performance while maintaining a level of simplicity suitable for educational purposes. The comparison between model and experiment not only validates the test bench but also serves as a valuable pedagogical tool, highlighting the strengths and limitations of classical heat exchanger models.
5. Discussion
This section examines lessons learned from implementing the project-based learning framework and from experimental use of the test bench, highlighting their technical performance and pedagogical implications.
5.1. Pedagogical Observations During the Construction Phase
The implementation of a hybrid pedagogical framework combining competitive and cooperative phases proved effective in sustaining student engagement throughout the project. The initial competitive phase stimulated rapid exploration and creativity, leading all six groups to produce technically consistent P&ID proposals. The subsequent transition to a cooperative structure enabled convergence toward a single, feasible design while fostering cross-disciplinary collaboration.
The structured role distribution (project leader, work package leaders, and task operators) reproduced key elements of industrial project organization. Students reported that this structure enhanced both accountability and autonomy, while exposing them to realistic constraints such as task coordination, time management, and interdependency between subsystems.
An important observation is that the framework naturally revealed differences in student engagement, allowing individual contributions to be more accurately assessed compared to conventional group-based projects. The successful replication of this methodology in a separate student project further suggests that the approach is transferable and not specific to the present case study.
5.2. Test Bench Capabilities
The experimental results demonstrate that the test bench provides reliable and physically consistent measurements across a wide range of operating conditions. The energy balance closure presented in Figure 12 remains within a ±10% band, which is consistent with the propagated measurement uncertainties reported in Table 3. This confirms the robustness of the instrumentation chain and the suitability of the setup for quantitative analysis.
The comparative analysis of heat exchanger performance (Figure 13) highlights clear differences among technologies under identical boundary conditions. The plate heat exchanger exhibits the highest effectiveness due to its high surface-area density and enhanced turbulence, whereas the shell-and-tube configuration shows lower performance. The double-pipe heat exchanger, despite its limited heat-transfer area, achieves intermediate effectiveness due to higher convective coefficients resulting from increased pressure drops. These observations illustrate a key engineering concept: thermal performance is governed by the overall conductance , not by surface area alone.
The pressure drop trends (Figure 14) further emphasize the trade-off between thermal and hydraulic performance. Configurations that enhance heat transfer by increasing turbulence also induce higher pressure losses, directly affecting pumping power requirements. This trade-off, often introduced theoretically in textbooks, becomes directly observable through the experimental platform.
From a modeling perspective, the comparison between experimental data and predictions (Section 4.7) shows that classical correlations accurately capture thermal behavior but are less reliable for pressure drop estimation without calibration. This discrepancy constitutes a central pedagogical outcome: students are exposed to the limitations of empirical correlations and are encouraged to critically assess modeling assumptions.
More broadly, the ability to compare multiple heat exchanger technologies under consistent boundary conditions represents a key added value of the test bench. Unlike conventional laboratory setups that focus on a single configuration, this platform enables students to explore design trade-offs and system-level behavior within a unified framework. This suggests that similar multi-configuration platforms could be extended to other domains of thermal and energy systems education.
5.3. Hands-On Laboratory Sessions
The experimental platform provides students with direct access to system behavior that is typically introduced only through theoretical models. The ability to manipulate operating conditions (e.g., flow rates, flow configuration) and observe the resulting changes in temperature profiles, heat transfer rates, and pressure drops enables a more intuitive understanding of heat exchanger performance.
In particular, the experimental results presented in Section 4 highlight the consistency between measured data and theoretical predictions (e.g., -NTU framework), while also revealing systematic deviations due to non-ideal effects such as heat losses and measurement uncertainty. This dual observation plays a central pedagogical role: students not only validate theoretical models but also learn to question their underlying assumptions.
The progressive use of the test bench across different stages of the curriculum further can enhance learning outcomes. At the undergraduate level, the focus is placed on energy balances and effectiveness, while at the graduate level, students engage with uncertainty propagation, model calibration, and validation. This layered approach allows students to revisit the same system with increasing levels of complexity, reinforcing both conceptual understanding and critical thinking.
6. Conclusions
This work presented a heat exchanger test bench developed within a project-based learning framework, where the experimental platform itself emerged from the educational process. The novelty lies in the integration of pedagogy, experimental system design, and model–data confrontation within a single coherent framework.
The combination of competitive and cooperative phases proved effective in fostering engagement, collaboration, and individual accountability, while exposing students to constraints representative of real engineering practice. The resulting platform enables the comparative analysis of multiple heat exchanger technologies under consistent boundary conditions, with sufficient accuracy to support quantitative interpretation.
A key outcome is the direct confrontation between theoretical models and experimental data, including observed discrepancies, which promotes critical engineering judgment and a deeper understanding of modeling assumptions. This shows that the educational value of laboratory platforms does not lie only in their technical performance, but in how they are used to connect theory, experimentation, and interpretation.
The proposed approach provides a transferable framework for heat transfer education, enabling students to transition from theoretical analysis to experimental validation and model-based reasoning.
Future work will focus on the extension and dissemination of the modeling and experimental framework.
Author Contributions
Conceptualization, S.G. and A.Z.; methodology, A.H., A.Z. and S.G.; software, A.H.; validation, S.G.; formal analysis, S.G., A.Z. and A.H.; investigation, S.G. and A.H.; resources, A.Z. and A.H.; data curation, S.G.; writing—original draft preparation, A.H. and A.Z.; writing—review and editing, S.G.; visualization, S.G.; supervision, S.G.; project administration, S.G.; funding acquisition, S.G. All authors have read and agreed to the published version of the manuscript.
Funding
This research received no external funding.
Institutional Review Board Statement
Not applicable.
Informed Consent Statement
Not applicable.
Data Availability Statement
All experimental data, post-processing files, and heat exchanger modelling codes are publicly available in the following GitHub repository https://github.com/SamuelGendebien/HXs-test-bench (accessed on 30 March 2026).
Acknowledgments
The authors gratefully acknowledge the Applied Sciences Faculty of the University of Liège for its partial financial support in the development of the test bench.
Conflicts of Interest
The authors declare no conflicts of interest.
Nomenclature
The following Nomenclature is used in this manuscript:
| Nomenclature | |||
| A | Heat transfer area (m2) | Subscripts | |
| Heat capacity rate (W/K) | a | Air | |
| Heat capacity rate ratio (-) | amb | Ambient | |
| Specific heat capacity (J/kg K) | C | Cold fluid | |
| D | Task difficulty (-) | c | Construction phase |
| Hydraulic diameter (m) | d | Design phase | |
| Pressure drop (Pa) | elec | Electricity | |
| G | Grade (-) | eq | Equivalent |
| H | Number of hours (-) | H | Hot fluid |
| h | Convective heat transfer coefficient | HX | Heat exchanger |
| (W/m2K) | i | Student index | |
| h | Specific enthalpy (J/kg) | in | Inlet |
| k | Conductivity (W/m K) | j | Task index |
| L | Length (m) | max | Maximum |
| m | Nusselt correlation parameter (-) | out | Outlet |
| Mass flow rate (kg/s) | tot | Total | |
| Nusselt number (-) | w | Wall or Water | |
| P | Task participation percentage (%) | ||
| p | Friction factor correlation parameter | Abbreviations | |
| (-) | 3WV | Three-way valve | |
| Prandtl number (-) | CFD | Computational fluid dynamics | |
| Heat transfer rate (W) | CP | Circulator pump | |
| R | Task rating (-) | DP | Double-pipe heat exchanger |
| Reynolds number (-) | FT | Fin-and-tube heat exchanger | |
| T | Temperature (°C) | FM | Flow meter |
| U | Uncertainty (-) | GV | Gate valve |
| Overall conductance (W/K) | HR | Heating resistance | |
| u | Velocity (m/s) | LMTD | Log-mean temperature difference |
| Power (W) | NTU | Number of Transfer Unit | |
| x | Measured variable (-) | PBL | Project-based learning |
| y | Calculated quantity (-) | P&ID | Piping and instrumentation diagram |
| PL | Project leader | ||
| Greek symbols | ST | Shell-and-tube heat exchanger | |
| Corrugation angle (deg) | TO | Task operator | |
| Thickness (m) | WP | Work package | |
| Effectiveness (-) | WPL | Work package leader | |
| Enlargement factor (-) | |||
| Density (kg/m3) | |||
Appendix A. Students Perspective on the Experience
The questions and the analysis of the responses are presented in Figure A1.
Figure A1.
Survey questions and students answers.
References
- Incropera, F.P.; DeWitt, D.P.; Bergman, T.L.; Lavine, A.S. Fundamentals of Heat and Mass Transfer, 6th ed.; John Wiley & Sons: Hoboken, NJ, USA, 2007. [Google Scholar]
- Kays, W.M.; London, A.L. Compact Heat Exchangers, 3rd ed.; McGraw–Hill: Columbus, OH, USA, 1984. [Google Scholar]
- Yun, W.; Ha, M.; Kim, K.; Lee, G. Design of a Thermal Performance Test Equipment for a High-Temperature and High-Pressure Heat Exchanger in an Aero-Engine. Machines 2024, 12, 794. [Google Scholar] [CrossRef] [Scilit]
- Han, T.; Li, Q.; Shang, L.; Chen, X.; Zhou, F.; Li, W. Study on the Influence of Reynolds Number on Heat Exchange Performance and Nusselt Number of Spray Coil Heat Exchanger. Processes 2025, 13, 588. [Google Scholar] [CrossRef] [Scilit]
- Hou, G.; Zhang, D.; Yan, Q.; Wang, S.; Ma, L.; Jiang, M. Application of machine learning algorithms in real-time fouling monitoring of plate heat exchangers. Int. Commun. Heat Mass Transf. 2025, 164, 108809. [Google Scholar] [CrossRef] [Scilit]
- Prince, M. Does Active Learning Work? A Review of the Research. J. Eng. Educ. 2004, 93, 223–231. [Google Scholar] [CrossRef] [Scilit]
- Freeman, S.; Eddy, S.L.; McDonough, M.; Smith, M.K.; Okoroafor, N.; Jordt, H.; Wenderoth, M.P. Active learning increases student performance in science, engineering, and mathematics. Proc. Natl. Acad. Sci. USA 2014, 111, 8410–8415. [Google Scholar] [CrossRef] [Scilit] [PubMed]
- Diller, T.E.; Bairaktarova, D. Evaluation of the effectiveness of individual hands-on workshops in heat transfer classes to specific student learning outcomes. Int. J. Eng. Educ. 2024, 40, 5–15. [Google Scholar]
- Rodríguez, J.; Laverón-Simavilla, A.; del Cura, J.M.; Ezquerro, J.M.; Lapuerta, V.; Cordero-Gracia, M. Project based learning experiences in space engineering education. Adv. Space Res. 2015, 56, 1319–1330. [Google Scholar] [CrossRef] [Scilit]
- Membrillo-Hernández, J.; Ramírez-Cadena, M.J.; Caballero-Valdés, C.; Ganem-Corvera, R.; Bustamante-Bello, R.; Elizalde-Siller, H. Challenge-based learning: The case of sustainable development engineering. Int. J. Eng. Pedagog. 2017, 7, 137–144. [Google Scholar]
- Johnson, D.W.; Johnson, R.T.; Smith, K.A. Cooperative learning returns to college: What evidence is there that it works? Change Mag. High. Learn. 1998, 30, 26–35. [Google Scholar] [CrossRef] [Scilit]
- Burguillo, J.C. Using game theory and competition-based learning to stimulate student motivation and performance. Comput. Educ. 2010, 55, 566–575. [Google Scholar] [CrossRef] [Scilit]
- Nembhard, D.A.; Yip, K.K.; Shtub, A. Comparing Competitive and Cooperative Strategies for Learning Project Management. J. Eng. Educ. 2009, 98, 181–192. [Google Scholar] [CrossRef] [Scilit]
- Boiangiu, C.A.; Constantin, A.; Deliu, D.; Mirion, A.T.; Firculescu, A.C. Balancing Competition and Collaboration in a Mixed Learning Method. Int. J. Educ. Inf. Technol. 2016, 10, 53–58. [Google Scholar]
- Furlong, A.J.; Pegg, M.J. Low-cost heat exchanger benches for remote operation. Educ. Chem. Eng. 2023, 44, 14–20. [Google Scholar] [CrossRef] [Scilit]
- Mohamed Nazim, N.A.N.; Seah, S.Y.; Jumat, M.Z.; Low, Y.B.; Thio, B.J.R.; Wong, S.Y. Design and implementation of a portable heat exchanger kit in an undergraduate engineering heat and mass transfer course. Educ. Chem. Eng. 2023, 45, 130–140. [Google Scholar] [CrossRef] [Scilit]
- TecQuipment Ltd. Heat Exchanger Service Module TD360; TecQuipment Ltd.: Nottingham, UK, 2026. [Google Scholar]
- Gunt Hamburg. WL 110 Heat Exchanger Service Unit; G.U.N.T. Gerätebau GmbH: Göttingen, Germany, 2026. [Google Scholar]
- Gunt Hamburg. WL 315C Comparison of Various Heat Exchangers; G.U.N.T. Gerätebau GmbH: Göttingen, Germany, 2026. [Google Scholar]
- Deltalab, S.L. MP104 Heat Exchanger Test Bench; Deltalab S.L.: Paris, France, 2026. [Google Scholar]
- Edibon International. TIUSB Base Service Unit—Heat Exchanger Training System; Edibon International S.A.: Madrid, Spain, 2026. [Google Scholar]
- Bayport Technical. Circulation Trainer—Shell and Tube Heat Exchanger Demonstrator; Bayport Technical: League City, TX, USA, 2026. [Google Scholar]
- Kakac, S.; Liu, H.; Pramuanjaroenkij, A. Heat Exchangers: Selection, Rating and Thermal Design, 2nd ed.; CRC Press: Boca Raton, FL, USA, 2002. [Google Scholar]
- Nellis, G.; Klein, S. Heat Transfer, 1st ed.; Cambridge University Press: Cambridgem, UK, 2008. [Google Scholar]
- Taylor, B.N.; Kuyatt, C.E. Guidelines for Evaluating and Expressing the Uncertainty of NIST Measurement Results; NIST Technical Note 1297; National Institute of Standards and Technology (NIST): Gaithersburg, MD, USA, 1994. [CrossRef] [Scilit]
- Ayub, Z.H. Plate Heat Exchanger Literature Survey and New Heat Transfer and Pressure Drop Correlations for Refrigerant Evaporators. Heat Transf. Eng. 2003, 24, 3–16. [Google Scholar] [CrossRef] [Scilit]
- Bell, I.H.; Wronski, J.; Quoilin, S.; Lemort, V. Pure and pseudo-pure fluid thermophysical property evaluation and the open-source thermophysical property library CoolProp. Ind. Eng. Chem. Res. 2014, 53, 2498–2508. [Google Scholar] [CrossRef] [Scilit] [PubMed]
- Wanniarachchi, A.S.; Ratnam, U.; Tilton, B.E.; Dutta-Roy, K. Approximate correlations for chevron-type plate heat exchangers. Proc. ASME Natl. Heat Transf. Conf. 1995, 12, 145–151. [Google Scholar]

Disclaimer/Publisher’s Note: The statements, opinions and data contained in all publications are solely those of the individual author(s) and contributor(s) and not of MDPI and/or the editor(s). MDPI and/or the editor(s) disclaim responsibility for any injury to people or property resulting from any ideas, methods, instructions or products referred to in the content. |
© 2026 by the authors. Licensee MDPI, Basel, Switzerland. This article is an open access article distributed under the terms and conditions of the Creative Commons Attribution (CC BY) license.