Abstract
Acrylamide is a small conjugated organic compound widely used in industrial processes and agriculture, generally in the form of a polymer. It can also be formed from food and tobacco as a result of Maillard reaction from reducing sugars and asparagine during heat treatment. Due to its toxicity and possible carcinogenicity, there is a risk in its release into the environment or human intake. In order to provide molecular and energetic information, we use synchrotron radiation to record the UV and X-ray photoelectron and photoabsorption spectra of acrylamide. The data are rationalized with the support of density functional theory and ab initio calculations, providing precise assignment of the observed features.
1. Introduction
Acrylamide, or prop-2-enamide in IUPAC notation, is a small organic compound widely used in industrial and laboratory processes. The monomer is incorporated into grout and soil-stabilizer products, is used in the synthesis of dyes, and serves as a precursor of a series of homo- and co-polymers whose properties strongly depend on the non-ionic, anionic, or cationic features.
Polyacrylamides are exploited in a wide range of applications [1,2,3,4]. They are used as flocculant or coagulant agents in drinking water and wastewater treatment and in mining processes, as binder and retention supports for fibres and pigments in paper production, for enhanced oil recovery, as drift control agents in commercial herbicide mixtures, as gel supports for chromatography and electrophoresis, in thickeners, in permanent-press fabrics, for contact lenses, in food-packaging adhesives, paper, and paperboard, to wash or peel fruits and vegetables, for water retention in diapers, as stabilizers and binder in cosmetic products, as media for hydroponic crops, as granules in arable lands to reduce the need of irrigation. Although polyacrylamides are quite stable, a small release of the monomer (present as residual of the polymerization process or formed by degradation) in the environment cannot be excluded [4,5]. This constitutes a potential hazard to health since acrylamide is a peripheral nerve toxin to man and to animals and causes birth defects and cancer in animals [6].
Moreover, acrylamide is present in the smoke of cigarettes [7], and it is formed from food components during heat treatment ( K, 120 °C) as a result of the Maillard reaction between the aminoacid asparagine (COOH−CHNH2−CH2−CONH2) and reducing sugars [8]. Although it is not clear exactly what risk acrylamide poses to humans, in 2016, the Food and Drug Administration developed a Guidance for Industry (Docket Number: FDA-2013D-0715) that outlines strategies to help growers, manufacturers, and food service operators reduce acrylamide in the food supply. Similarly, in the European Union, the Commission Regulation (EU) 2017/2158 establishes mitigation measures and benchmark levels for the reduction of the presence of acrylamide in food.
Many spectroscopic studies are reported for acrylamide, but to the best of our knowledge, only a few of them concern the molecule in the isolated phase. The studies cover the rotational (20–60.5 GHz [9], 75–480 GHz [10]), far infrared (50–665 cm [11]) and photoelectron (7–27 eV [12]) spectral ranges. The scope of the present work is to investigate the behaviour of acrylamide by means of synchrotron-light techniques and quantum mechanical calculations. Here, we report new data on the inner shell photoionization and photoabsorption processes and also reinvestigate the valence band photoelectron spectrum of acrylamide. This study will enhance our understanding of the fundamental properties of this molecule which is in the spotlight because of its versatility and miscellaneous applications but also because of the global ecological risk posed by it.
2. Materials and Methods Details
2.1. Experimental Methods
Photoionization and photoabsorption spectra of acrylamide were recorded at the Gas Phase beamline [13] at the Elettra synchrotron light source (Trieste, Italy) using an electron energy analyser described previously [14]. Acrylamide purchased from Alfa Aesar (purity 98%) was introduced into the experimental chamber without further purification. The sample appears as white crystalline flakes at room temperature, with melting point = 357 K and boiling point = 398 K/25 mmHg. It was sublimated using a custom-built, resistively heated furnace, based on a stainless steel crucible, a Thermocoax® heating element, and a type K thermocouple. The temperature was increased up to 308 K (35 °C), reaching pressure of about p = 0.256(2) mPa. The vapour pressure estimated at the same temperature by graphical interpolation of the data reported by Carpenter and Davis [15] is 2.25(10) Pa. During the whole experiment, the pressure in the ionization region remained constant and no evidence of contamination or thermal decomposition was found. The photoionization spectra were recorded using a VG-Scienta SES-200 photoelectron analyzer [16] mounted at the magic angle (54.7). The use of this angle allows us to record spectra in which the intensities of all peaks is proportional to the angle-integrated intensity, that is, angular effects are eliminated. Thus, the intensity of the photoemission bands is proportional to the angle-integrated intensity, and angular effects are eliminated. The photoabsorption spectra were acquired in total ion yield mode, by means of channel electron multiplier placed near the ionization region.
2.2. Computational Methods
Geometry optimizations [17] and subsequent vibrational frequency calculations in the harmonic approximation to determine the nature of the stationary points were run both at the ab initio MP2 and density-functional theory (DFT) B3LYP and B2PLYP levels of calculation using the aug-cc-pVTZ basis set. The time-dependent (TD [18]) DFT approach was used in the case of electronic excited states. The ab initio geometries were used for the estimation of the vertical ionization energies by means of the Symmetry Adapted Cluster/Configuration Interaction method (SAC-CI [19]) with the cc-pVTZ basis set of the Electron Propagator Theory (EPT [20,21]) with the aug-cc-pVTZ basis, by applying the Outer Valence Green’s Function (OVGF [22,23,24]) and the Partial Third Order (P3 [25]) self-energy approximations. The SAC-CI/cc-pVTZ approach was also used for the estimation of the core shell excitation energies. All the above quantum mechanical calculations were performed using the gaussian16™ (Gaussian is a registered trademark of Gaussian, Inc., 340 Quinnipiac St. Bldg. 40, Wallingford, CT, USA) software package (G16, Rev. A.03).
The vibronic structure associated with each ionization in the low energy region of the photoelectron spectrum was simulated including the Franck–Condon activities [26], namely by computing the Franck–Condon factors () for each vibrational mode k with frequency . These were determined by the evaluation of the Huang–Rhys factors [27] as:
where is the dimensionless displacement parameter defined, assuming the harmonic approximation, and neglecting Duschinsky rotation [28], as:
where (or ) is the dimensional vector of the equilibrium Cartesian coordinates of the i (or j) electronic state (here i is the neutral and j is the cationic state), M is the diagonal matrix of atomic masses, and is the dimensional vector describing the kth normal coordinate of the j (cationic) state in terms of mass weighted Cartesian coordinates. While the approach is less rigorous than that discussed in recent work [29,30,31], it is justified by the minor changes computed for the active vibrational modes upon ionization. For each normal mode k, the Franck–Condon factor for a transition from a vibrational level m (of the neutral molecule) to the vibrational level n (of the cation) is [27]:
where L is a Laguerre polynomial. The intensity of the m to n transition for the normal mode k is given by the factor, weighted for the population of the vibrational state m:
with being the Boltzmann constant, T is the temperature, and Z is the partition function. The total intensity of the multimode vibrational transition, including all the active normal modes, is the simple product of the monodimensional intensities [27]. Photoelectron spectra were simulated at T = 0 K and a Gaussian broadening function with = 80 and 440 cm was convoluted with each computed intensity.
3. Results and Discussion
3.1. Conformational Analysis
Acrylamide is the smallest conjugated amide. It is formed by the vynil and amide planar frames connected by a rotatable bond: CH2=CH−CONH2. Its conformation is usually described by the relative orientation of the carbon–carbon double bond and the carbonyl, through the CCCO torsional dihedral angle (). We explored the conformational space of acrylamide by running a series of quantum mechanical calculations where was constrained to fixed values ( = 0–360, = 10), whereas all the other parameters were freely optimized. The results achieved at three levels of calculation (B3LYP/aug-cc-pVTZ, B2PLYP/aug-cc-pVTZ and MP2/aug-cc-pVTZ) are qualitatively similar, as can be seen in Figure 1.
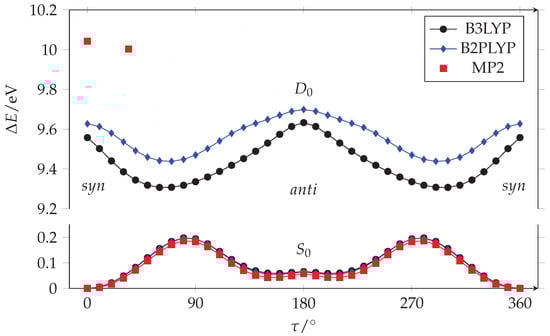
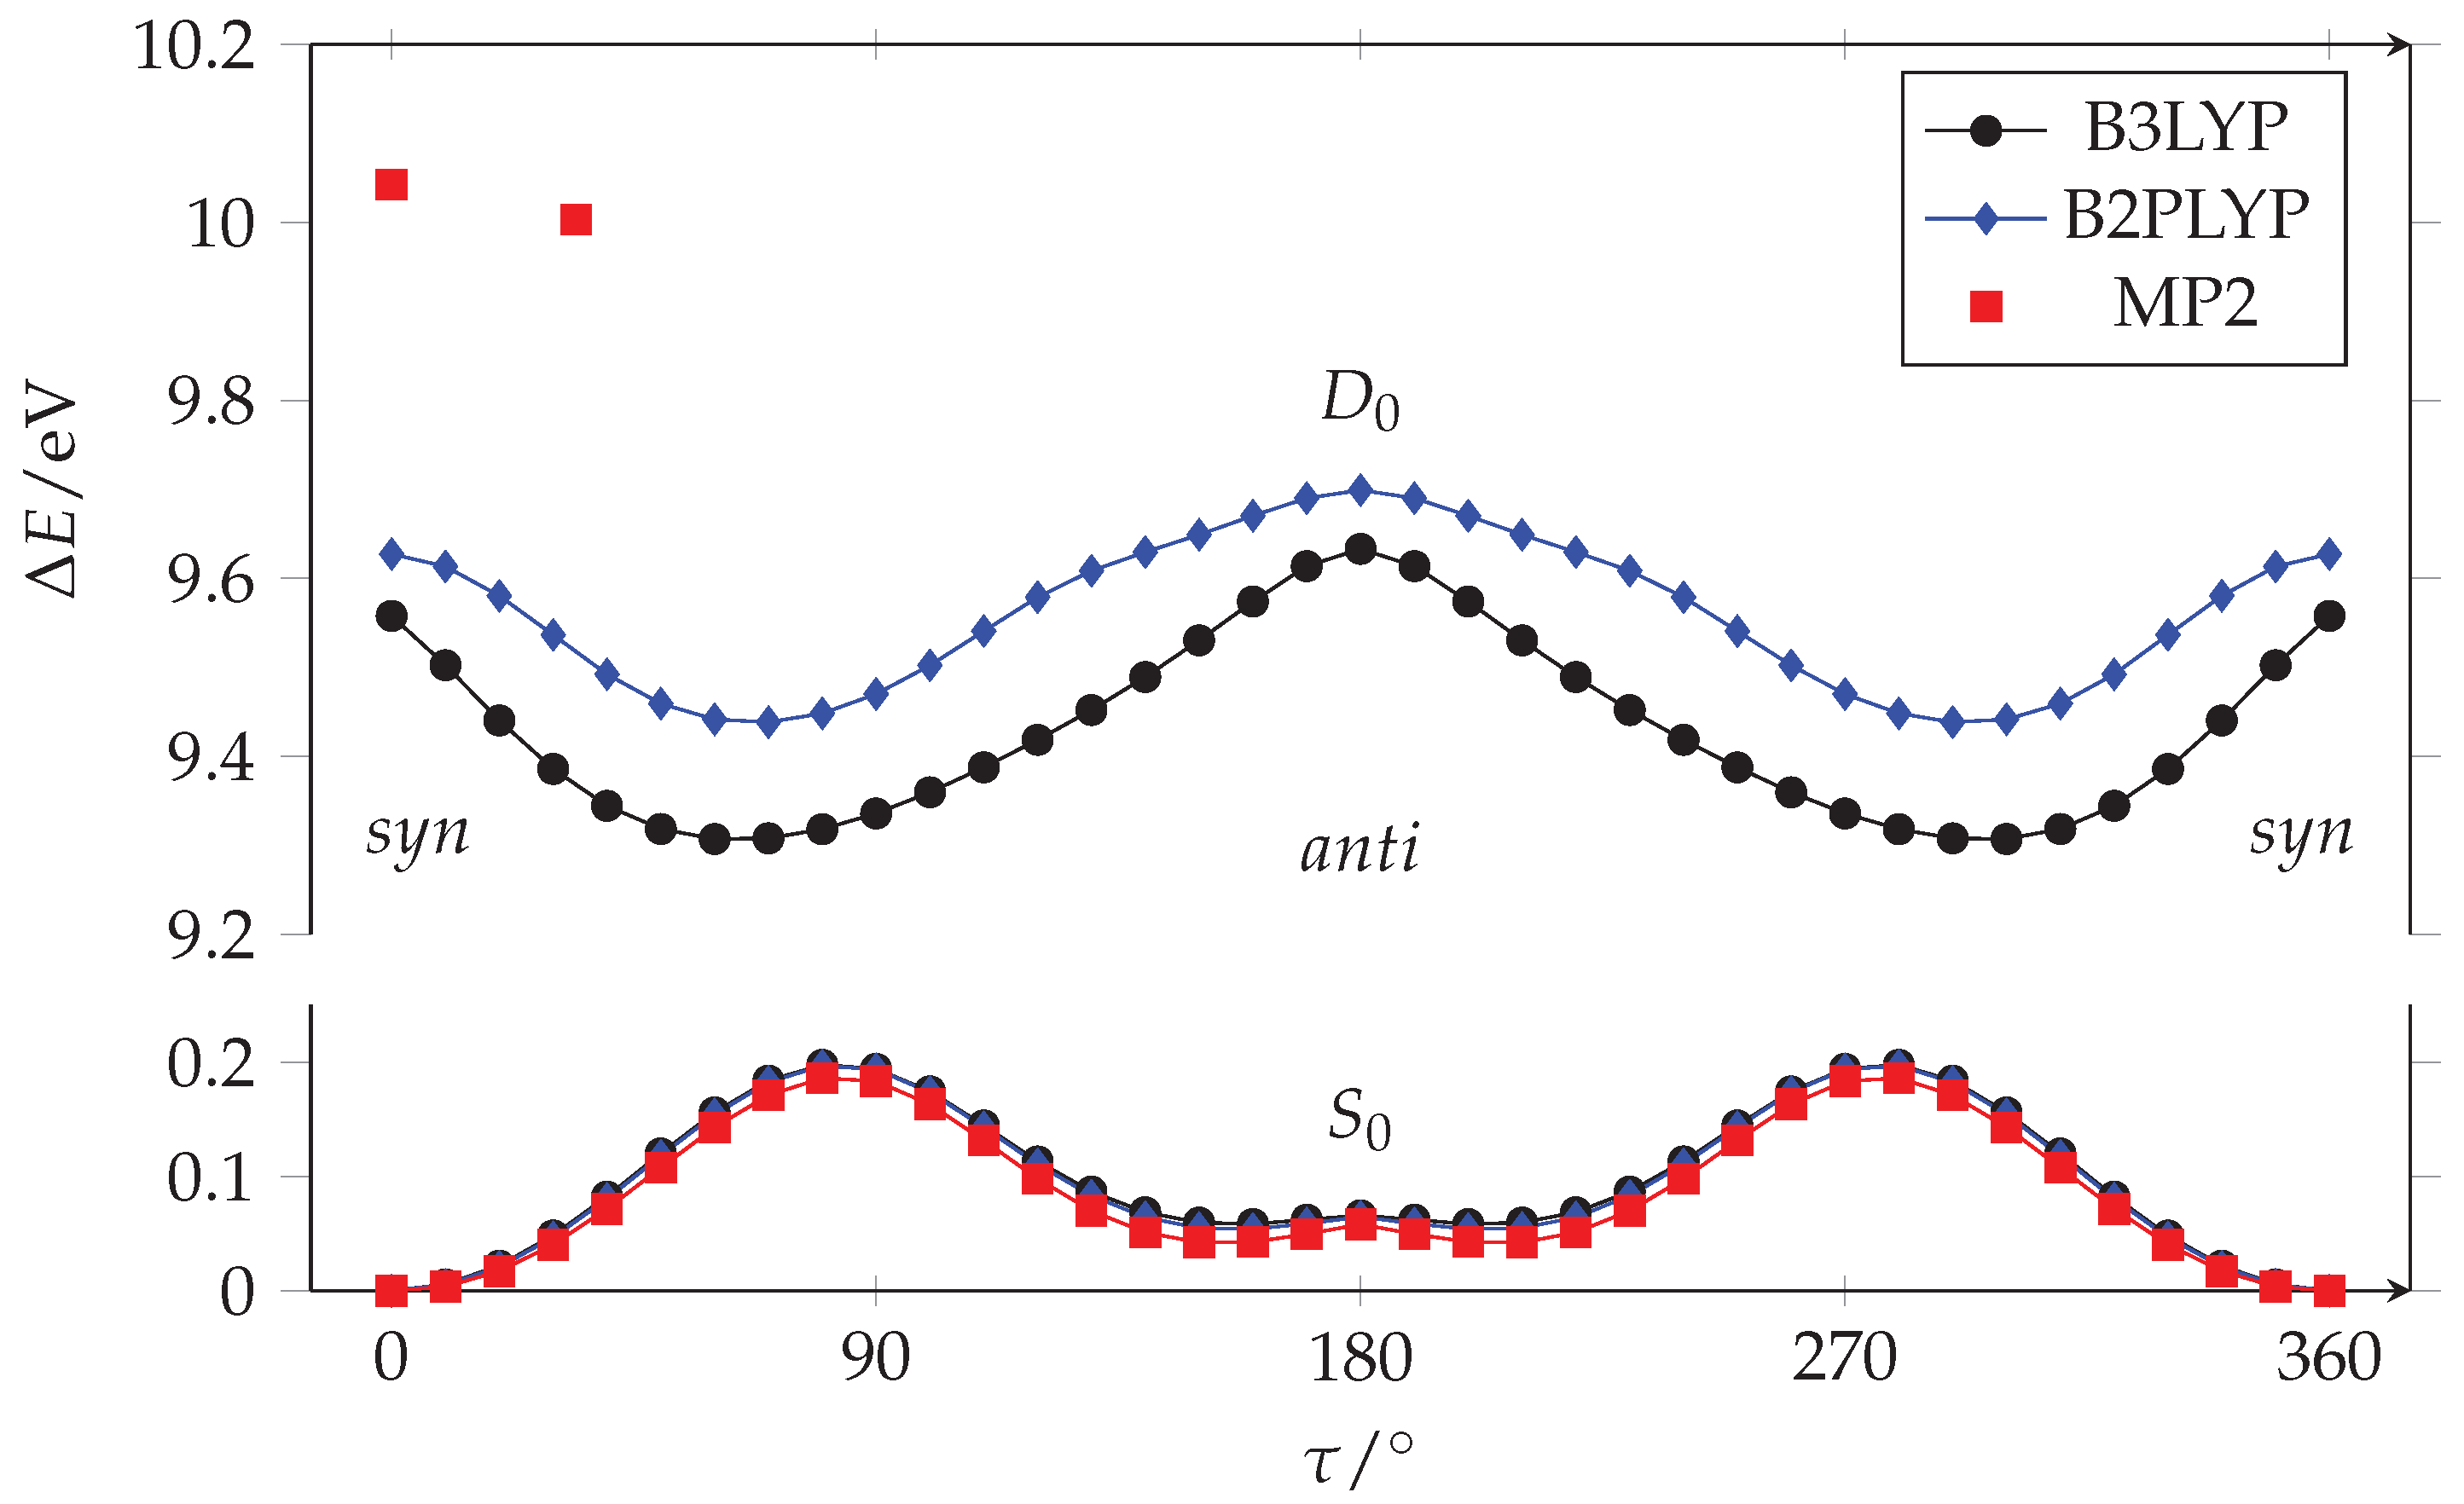
Figure 1.
Fully relaxed PESs along the C-C torsion of acrylamide in its neutral ground state () and cation neutral () states calculated with aug-cc-pVTZ basis set. Only two stationary points are given for the state at the MP2/aug-cc-pVTZ level of calculation.
The potential energy surface (PES) of acrylamide in its neutral ground state () evidences the presence of two non-equivalent minima, see Figure 2. The global minimum is planar with the double bonds in orientation (). The other local minimum has an arrangement, which is typical of amides in peptides and protein, and lies at 5.6/5.2/4.0 kJ mol, while the to barrier is about 19/19/18 kJ mol (B3LYP/B2PLYP/MP2).
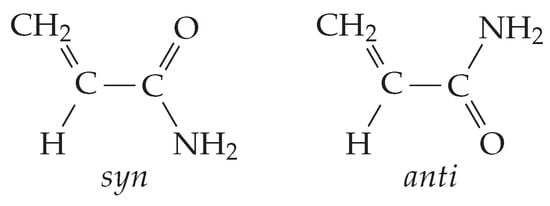
Figure 2.
Conformers of acrylamide in its neutral ground state.
Taking into account the vibrational zero-point energy correction, this energy difference increases, becoming 6.2/6.2/5.6 kJ mol (B3LYP/B2PLYP/MP2). Because of the steric hindrance between the CH and NH groups, the geometry is slightly non planar as indicated by the presence of two equivalent minima at in the curve. Since the interconversion barrier between the equivalent conformations is quite low (0.75/1.08/1.61 kJ mol (B3LYP/B2PLYP/MP2) at = 180) due to tunnel effect, the ground vibrational state is expected to be observed in the form of a doublet. These results are in agreement with the rotational spectroscopy data of Marstokk et al. [9] and Kolesniková et al. [10]; indeed, the authors (i) assigned the transition lines of both the and conformers, (ii) estimated the conformers energy difference to be 6.5(6) kJ mol [9], and (iii) determined the doubling splitting energy of the anti conformer as 13.844586(2) cm [10]. In the crystal phase only, the species has been identified [32]. According to the Boltzmann distribution, and taking into account the effect of the degeneracy of species, the relative population of the two conformers at the experimental working temperature (T = 308 K) is = 0.16(4).
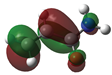
We used the same approaches to calculate the PES of the acrylamide cation in its ground state (), where the single occupied molecular orbital () is a -type non bonding orbital centered on the oxygen (). The DFT results plotted in Figure 1 show that, for the cation, the and arrangements correspond to maxima while the minima correspond to two non-planar equivalent species with = 64/67 (B3LYP/B2PLYP). Unfortunately, we did not succeed in determining the whole path also at the MP2/aug-cc-pVTZ level, but we successfully optimized the geometries of the minimum and the arrangement (red squares in Figure 1). As in the case of DFT, the planar structure displays an imaginary frequency, albeit considerably smaller (i120 cm) than that determined at the B3LYP level (i436 cm), indicating a much shallower PES along the torsion axis. Thus, although the ab initio result predicts a non-planar minimum similar to DFT, such a minimum corresponds to a remarkably decreased torsion angle ( = 34) accompanied by a drastically reduced stabilization compared to DFT. More precisely, DFT finds the form 24/18 kJ mol (B3LYP/B2PLYP) above the minimum, whereas the ab initio energy difference is only 3.8 kJ mol. The DFT and ab initio landscapes are remarkably different, with the small energy difference predicted by MP2 calculations clearly suggesting a reduced relevance of twisting. This is further demonstrated by the almost unchanged bond lengths of the planar and twisted structures (Table 1), in contrast to the remarkable C=O bond length shortening occurring in the twisted DFT structures. Furthermore, the small energy difference predicted between the planar and twisted structures at the ab initio level is within the error of the method. As will be shown below, the simulation of vibronic structure strongly supports a planar or negligibly twisted structure.

Table 1.
Energy and structure parameters of acrylamide calculated using the aug-cc-pVTZ basis set.
Finally, we used TD-B3LYP/aug-cc-pTZVP to calculate the structure of the first excited state of the acrylamide cation (), where the singly occupied is a -type orbital composed of the non bonding out-of-plane p orbitals of nitrogen and oxygen (). The optimized geometry is found to be planar as in the case of the neutral species. The energy and structure parameters related to the calculated stationary points are summarized in Table 1.
3.2. UPS
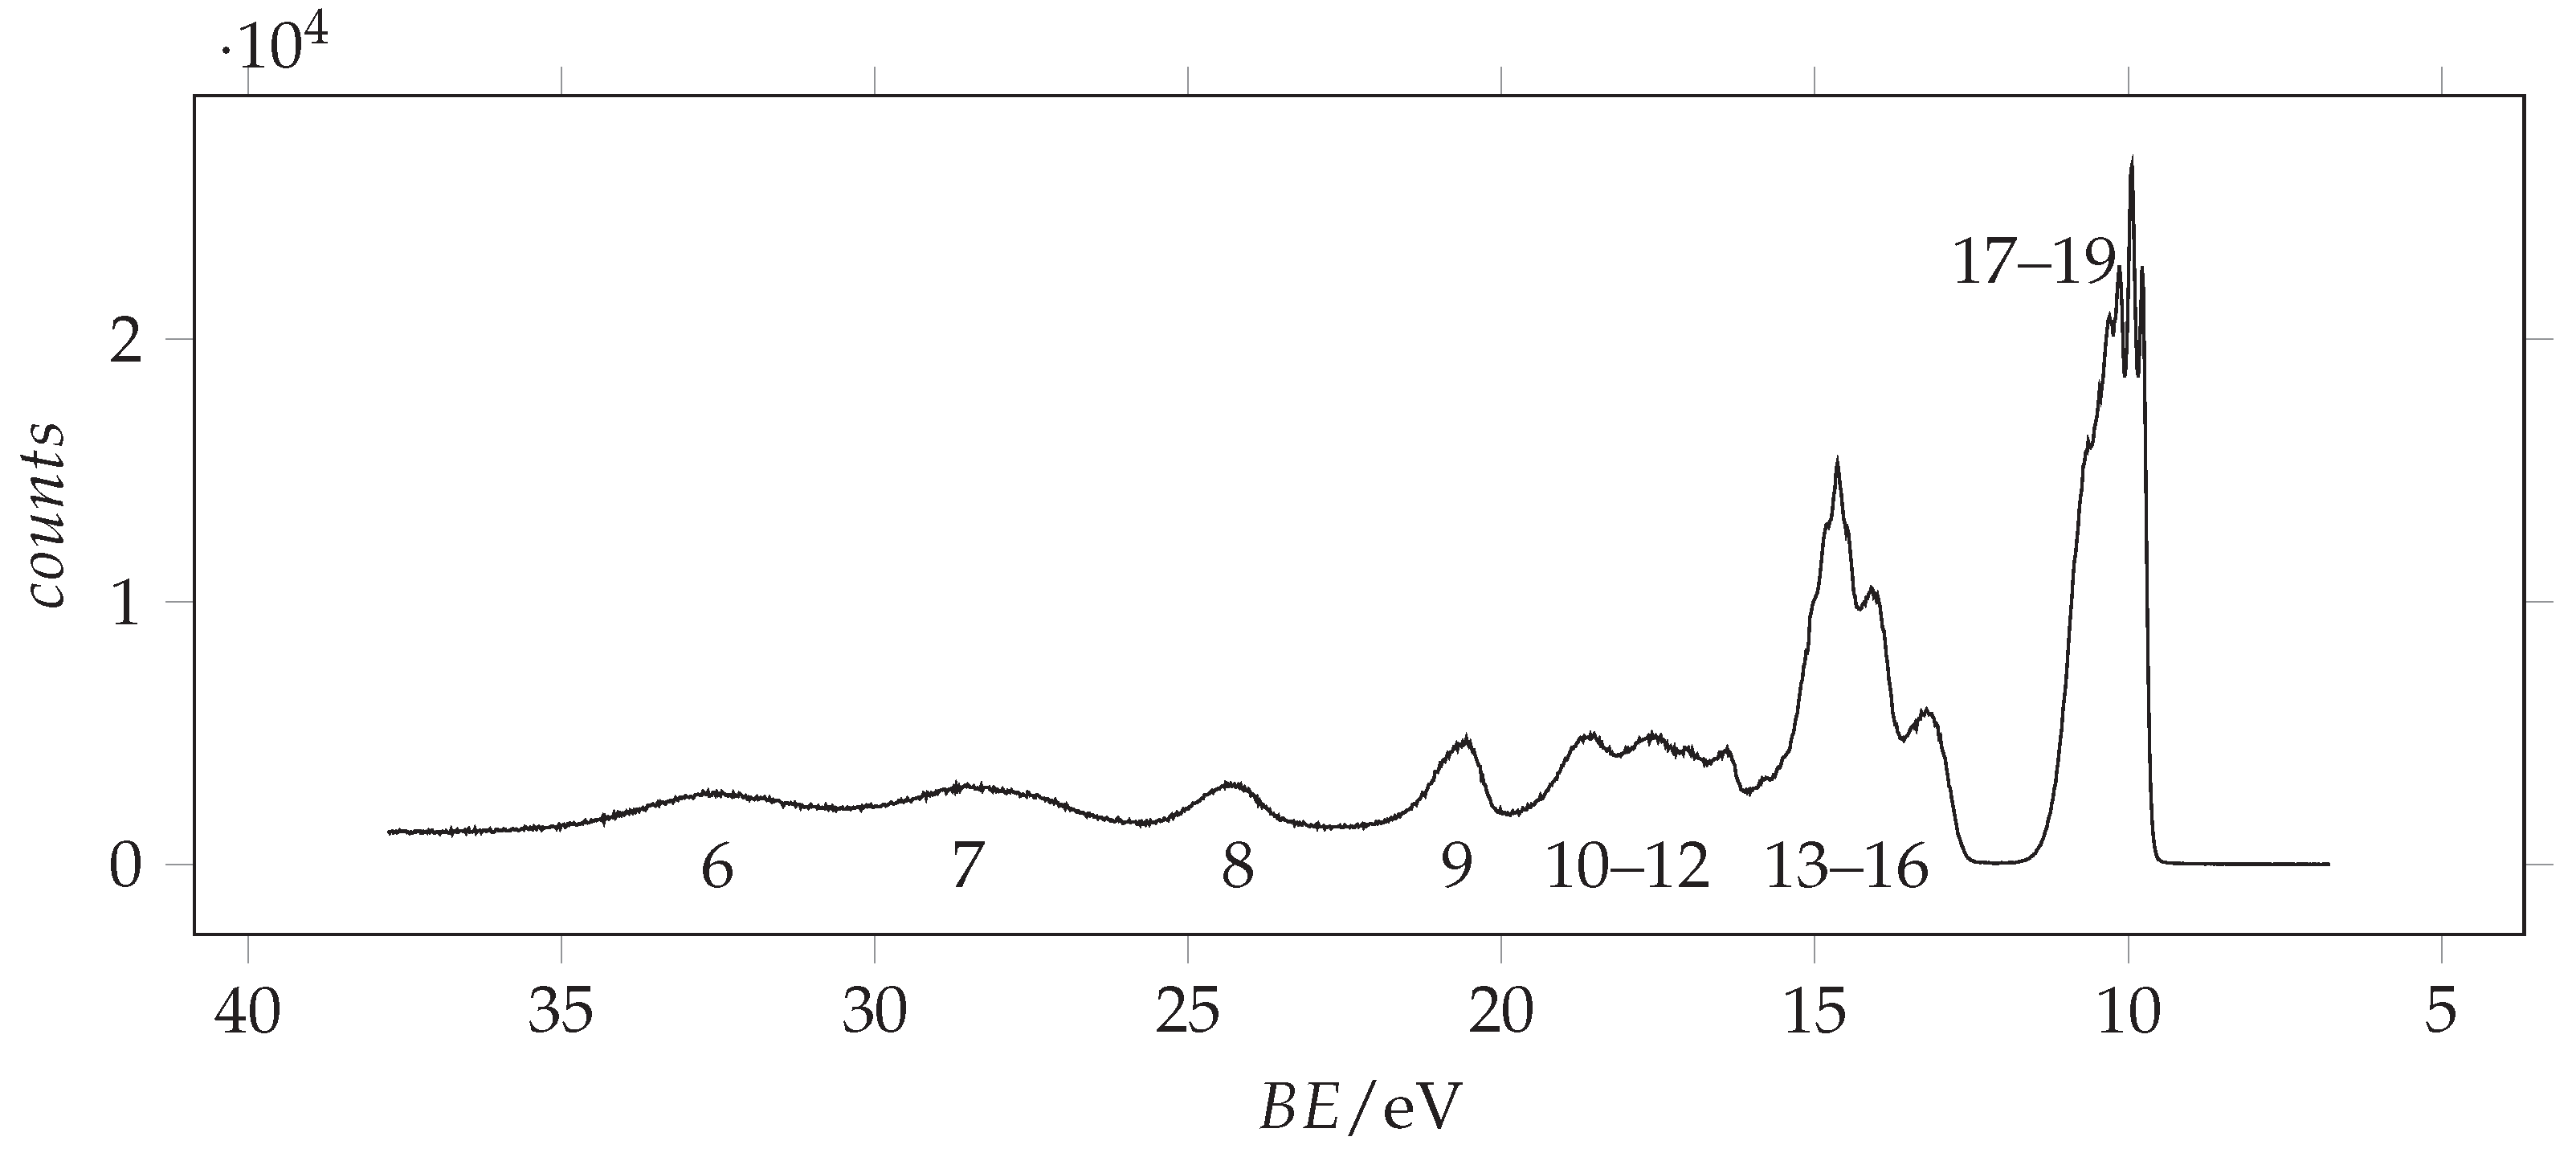
The photoionization spectrum of acrylamide has been recorded in the 6.5–26.5 eV spectral range using a 30.4 nm He(II) source by [12]. Here, we extend the investigation up to 37 eV, using 98 eV energy photons. The measured spectrum is shown in Figure 3.
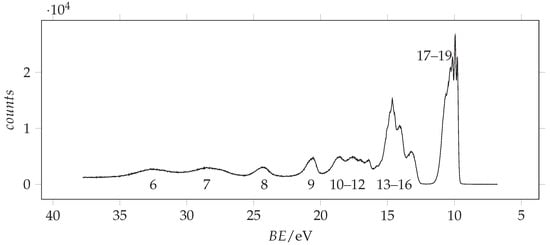
Figure 3.
Full valence band photoemission spectrum of acrylamide recorded with 98 eV photon energy and 0.090 eV resolution and calibrated with the 3p Ar line at 15.76 [33]. The molecular orbitals are labelled according to Figure 4.
According to the Koopmans’ theorem [34], a rough correlation can be found between the observed ionization energies and the calculated energy of the occupied of the most stable conformer, whose shapes and energies are given in Figure 4 and in Table 2, respectively.
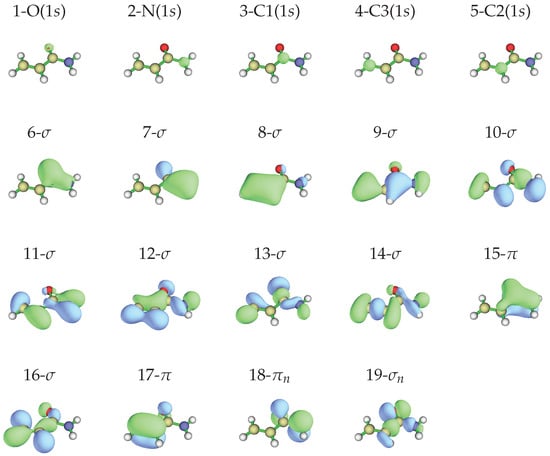
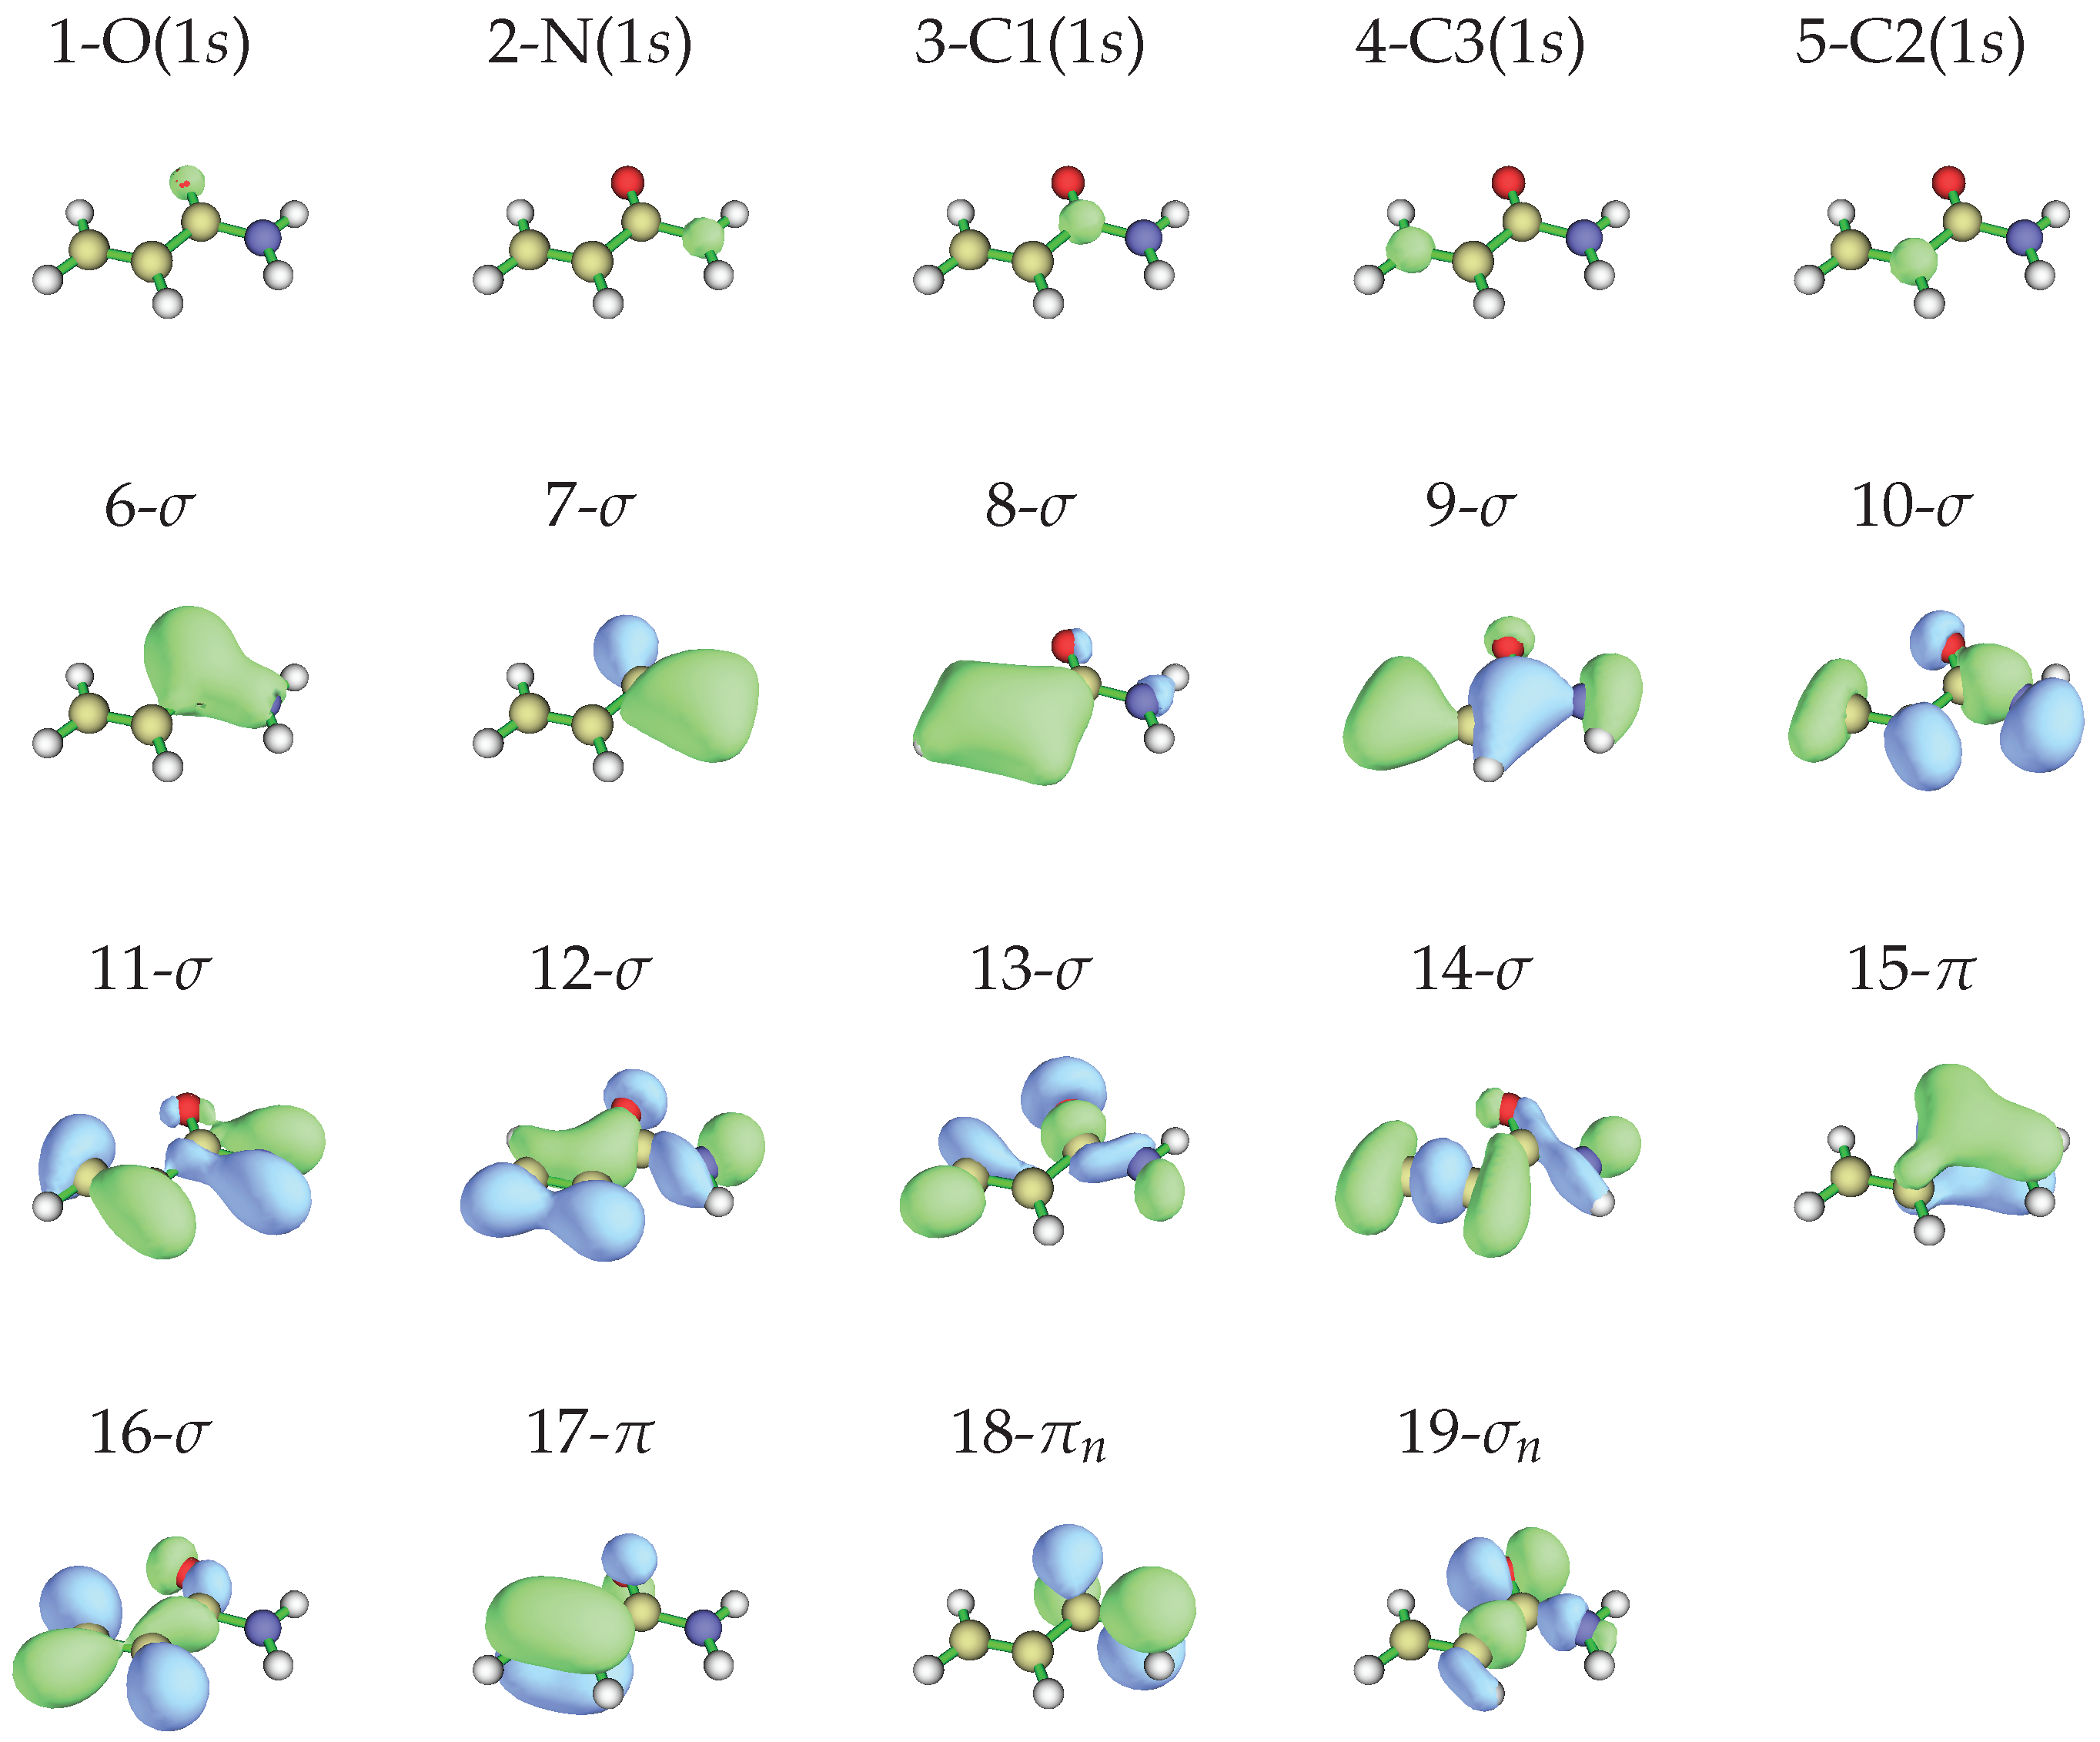
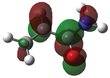
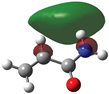
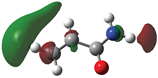
Figure 4.
Occupied molecular orbitals of -acrylamide in the neutral ground state obtained at the MP2/aug-cc-pVTZ//HF/aug-cc-pVTZ level of calculation, isodensity surface at 0.05 a.u.
Table 2.
Theoretical molecular orbital energy (, eV), vertical binding energy (, eV) and pole strength () values of -acrylamide compared to the experimental peaks’ ionization energies.
We observe that, concerning the outer valence band, different methods provide different ordering of the . However, using more sophisticated calculations, it is possible to obtain more reliable predictions. The vertical ionization energies obtained using the SAC-CI and EPT (P3 and OVGF) methods are compared to the energy values in Table 2 and are used for the assignment of the observed peaks, whose energy values are given in the same table. Notably, all these methods find that the lower ionization energy is associated with the orbital (n. 19), followed by the ionization of (n. 18) and (n. 17). The assignment of Åsbrink et al. [12] follows the same order, involving the features lying at 10.0, 10.3 and 10.7 eV. Since the first peak observed in our ionization spectrum has a lower energy (9.8 eV) and the spectral region between 9.5 and 11.5 eV appears quite crowded, we decided to record the spectrum at higher resolution. The resulting spectrum is shown in Figure 5 with the theoretical vertical ionization energies related to the three outer valence orbitals.
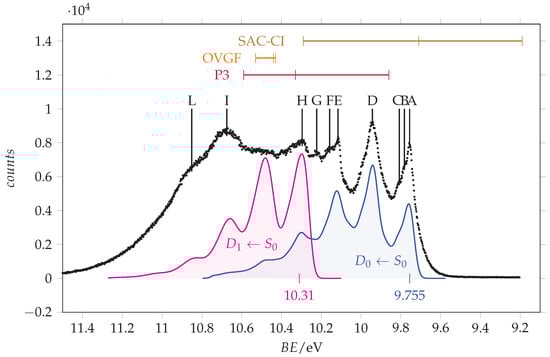
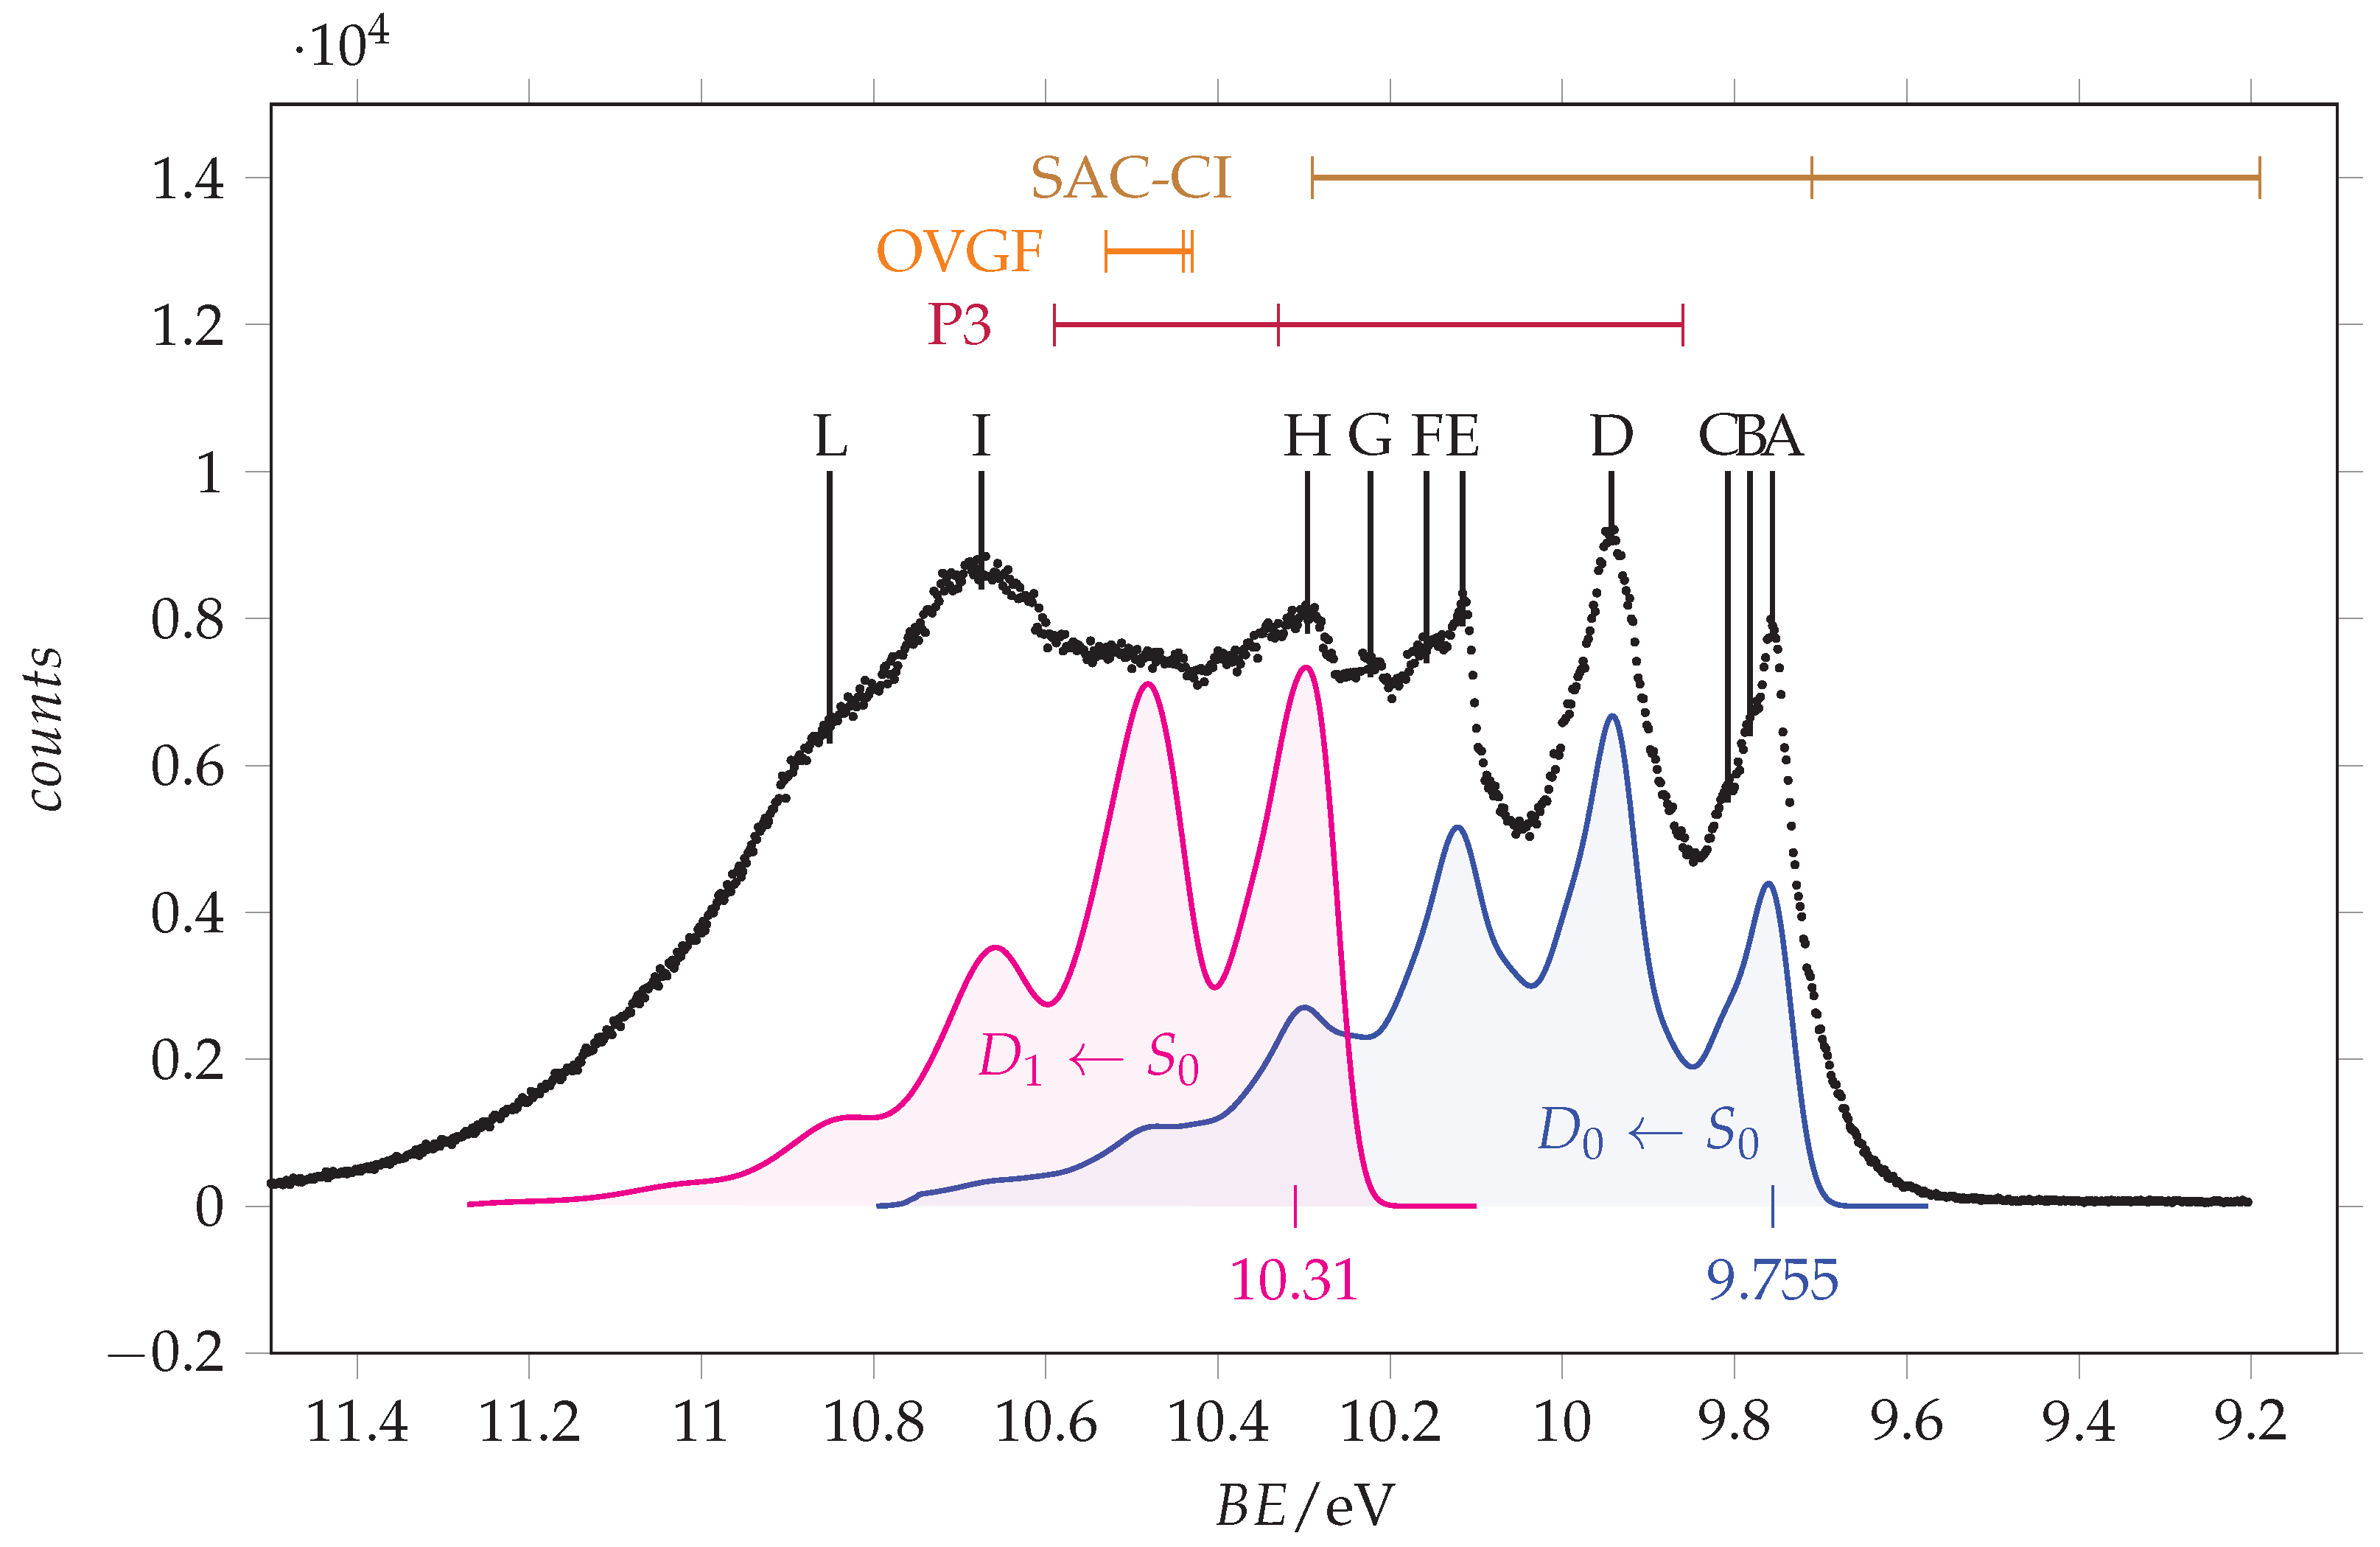
Figure 5.
Outer valence band photoemission spectrum of acrylamide recorded with 25 eV photon energy and 0.011 eV resolution and calibrated according with the 3p Ar line at 15.76 [33]. Measured energy values: A = 9.756 eV, B = 9.782 eV, C = 9.808 eV, D = 9.943 eV, E = 10.116 eV, F = 10.158 eV, G = 10.223 eV, H = 10.296 eV, I = 10.675 eV, L = 10.851 eV. The theoretical vertical ionization energies for the three outer valence orbitals (17–19, from left to right) of -acrylamide are indicated in the top part. Blue and magenta traces are the and simulated vibrational resolved bands obtained at T = 0 K using a broadening Gaussian function ( = 440 cm/54.6 meV). Their origins have been placed at 9.755 and 10.31 eV, respectively.
The lower energy peak (labelled as A in Figure 5) lies at 9.756 eV. It has two shoulders (B and C) likely due to vibrational contributions: indeed, the energy differences are B-A = 27 meV and C-A = 52 meV, which are consistent with low frequency normal modes. Two strong peaks (D and E) are found at 9.943 and 10.116 eV. For the hypothesis of a vibrational progression starting from peak A, the involved quanta will be 187 meV (ca. 1508 cm) and 173 meV (ca. 1395 cm). A similar trend was also observed in the spectrum of formamide [35], and it was tentatively assigned to the asymmetric stretching of the N-C=O frame, an interpretation supported by recently reported vibronic structure simulations [36]. According to this interpretation, we observe that the shape of peak “D” is akin to that of “A”.
To support this analysis, we modelled the vibronic structure of the and transitions using MP2/aug-cc-pVTZ and TD-B3LYP/aug-cc-pVTZ calculated geometries and vibrational normal coordinates to evaluate the Huang–Rhys factors governing vibronic progressions. As discussed above, the MP2 results for the state suggest a limited stabilization of the non-planar structure with a modest twisting and almost unchanged bond lengths. Thus, we simulated the vibronic structure taking the planar structure as a reference. The vibronically active vibrational frequencies and corresponding Huang–Rhys factors are listed in Table 3, while the calculated spectra are compared to the experimental ones in Figure 5 and Figure 6.
Table 3.
Calculated wavenumbers and Huang–Rhys factors for the vibrational normal modes of the (MP2/aug-cc-pVTZ) and (TD-B3LYP/aug-cc-pVTZ) transitions of -acrylamide.

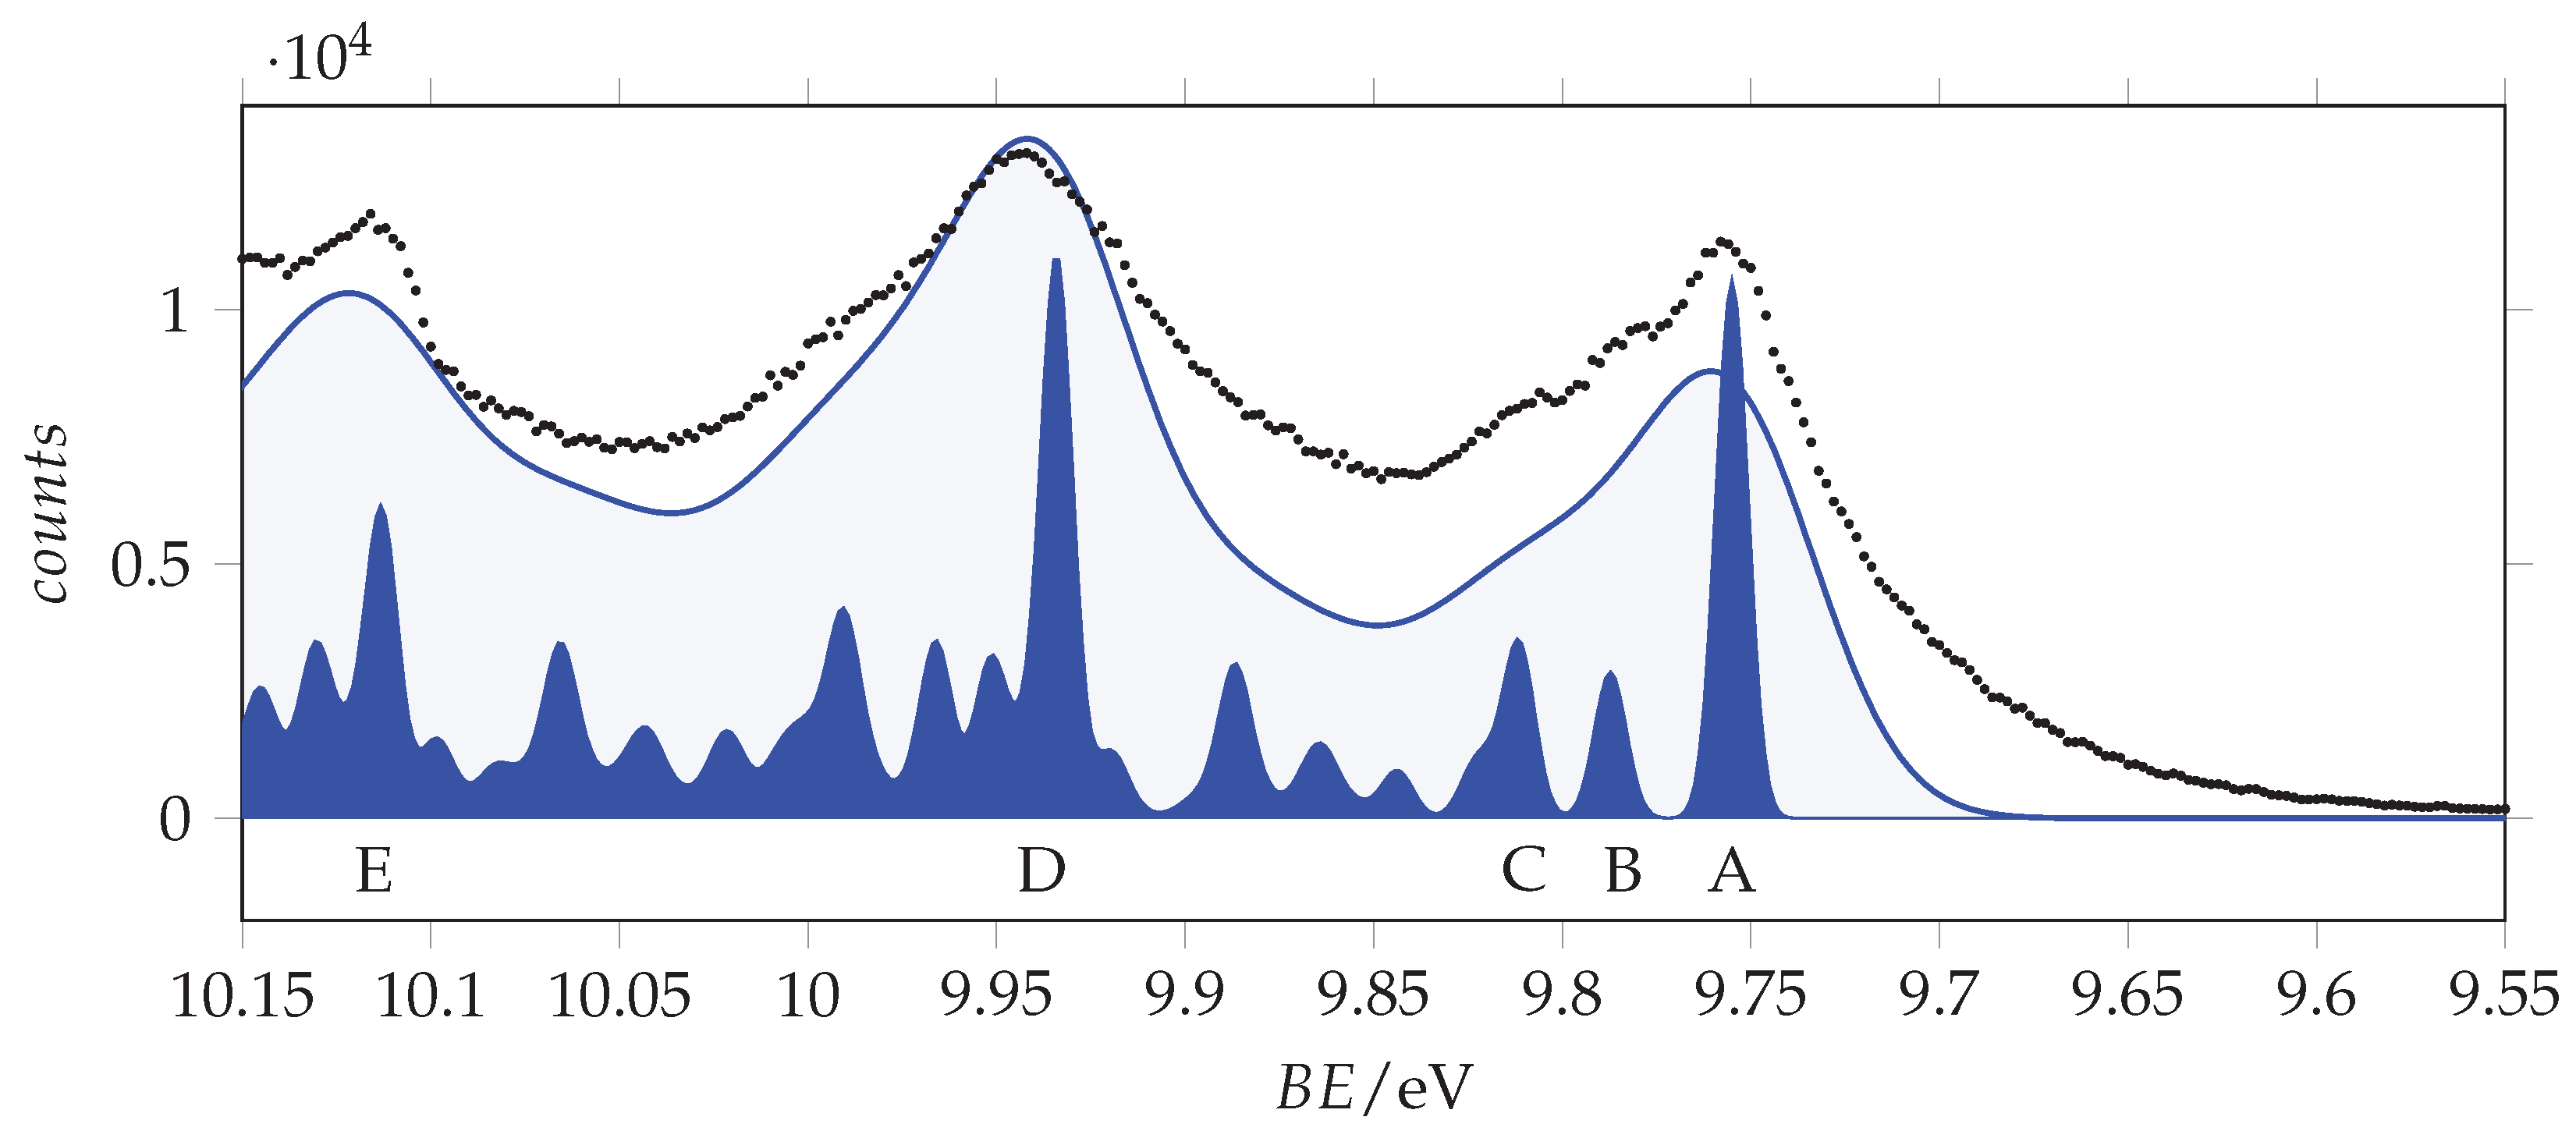
Figure 6.
Outer valence band photoemission spectrum of acrylamide compared to the simulated vibrational resolved bands of -acrylamide obtained at T = 0 K using broadening Gaussian functions with = 440 and 80 cm (54.6 and 9.9 meV). Labels A–E are the same as in Figure 5.
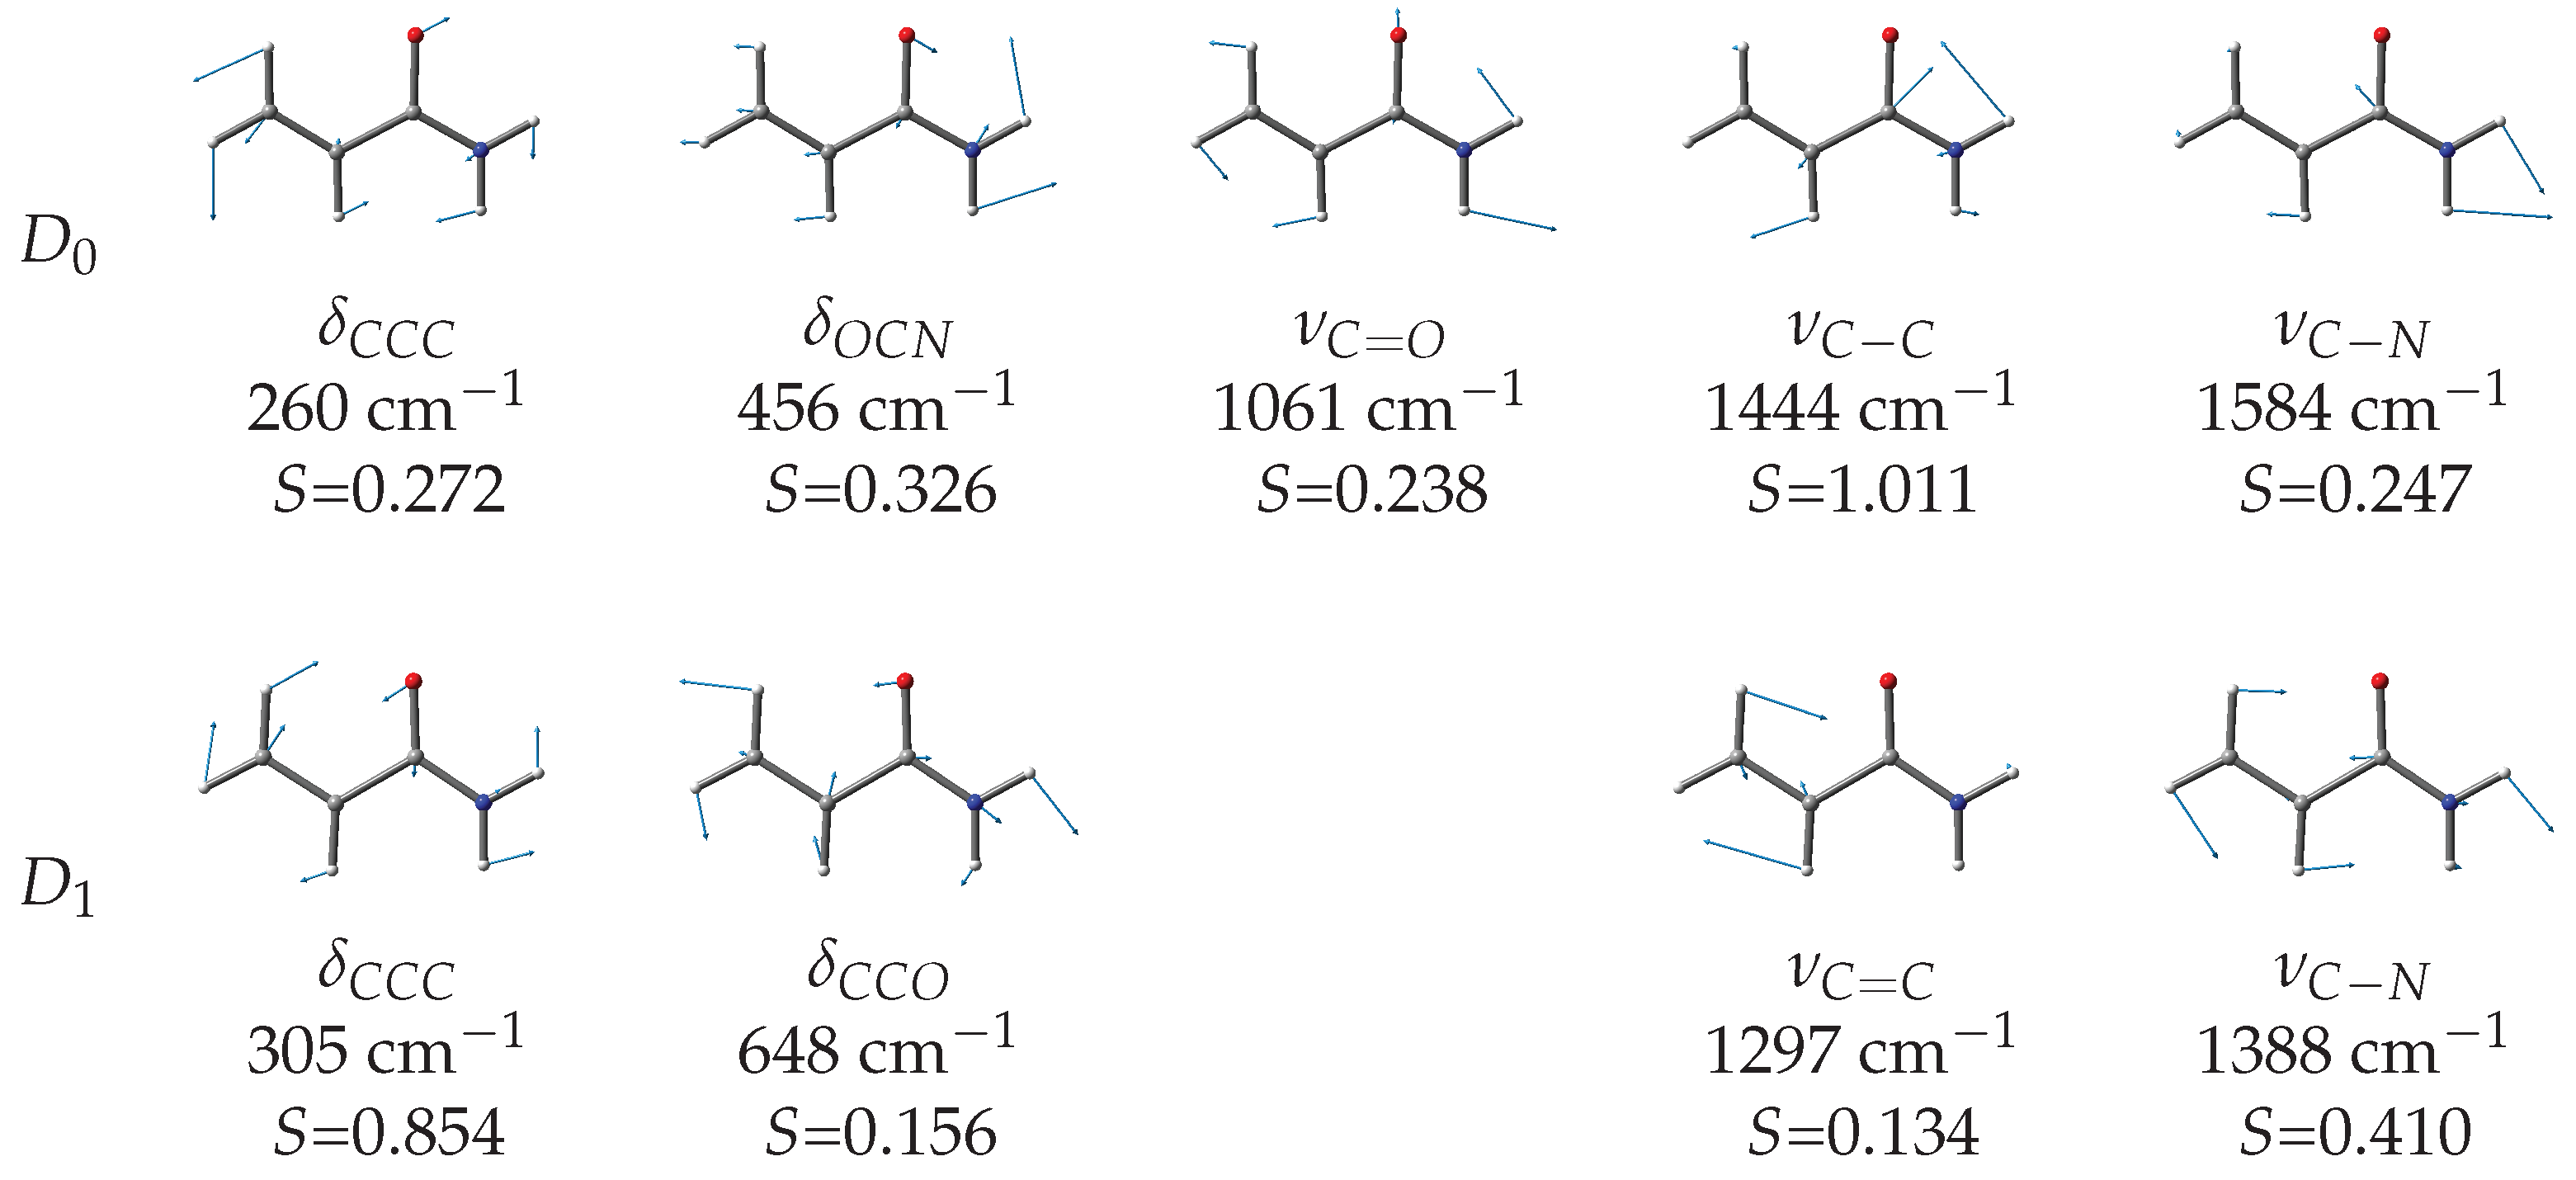
The simulated vibronic profiles of both the (blue trace in Figure 5) and (pink trace in Figure 5) transitions show a resolved structure with major vibronic peaks separated by about 200 meV, which is in agreement with the experimental observation. However, the shape and relative intensity of the vibronic bands are different for the two ionizations and comparison with the detected spectrum suggests that the two lower energy peaks must be assigned to the transition. By aligning the calculated and experimental spectra, we determine the adiabatic ionization energies to the state as = 9.755 eV. This value is 0.475 eV smaller than that of formamide (10.23(6) eV [36]) and 0.021 eV greater than that of acetamide (9.734(8) [36]). According to the Huang–Rhys factors (Figure 7), the main vibrational structure is related to the skeletal stretching motions associated with the largest geometry changes upon ionization, specifically = 179 meV (1444 cm), = 196 meV (1584 cm) and = 132 meV (1061 cm). Notably, the C=O stretching displays a considerably reduced frequency as a result of the remarkable bond length elongation in the cation (compare 1.224 Å in with 1.29 Å in , see Table 1). The “B” and “C” features of the lower energy peak can be associated with the = 32 meV (260 cm) and = 57 meV (456 cm) bending motions, respectively.
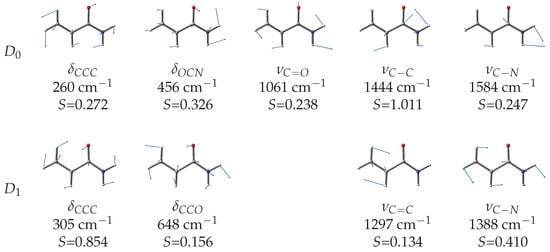
Figure 7.
Calculated wavenumbers and Huang–Rhys factors for the vibrational normal modes of the (MP2/aug-cc-pVTZ) and (TD-B3LYP/aug-cc-pVTZ) transitions of -acrylamide.
The positioning of the transition is more challenging. In Figure 5, we propose a tentative assignment with an adiabatic ionization energy = 10.31 eV, corresponding to peak H. This value is 0.033 eV smaller than that of formamide (10.64(2) eV [36]) and very close to that of acetamide (10.28(2) [36]). According to the Huang–Rhys factors (Figure 7), the most active normal modes are = 38 meV (306 cm), = 172 meV (1388 cm), = 80 meV (648 cm), and = 161 meV (1297 cm). Notably, different vibration modes are active in the ionization to compared to , on account of the different geometry changes documented in Table 1 for the and transitions.
Finally, the peaks “I” and “L” can be reasonably assigned to the resolved ionization band of the C=C -type orbital, their energy difference being 176 meV, a value very similar to that of the previously considered transitions.
3.3. XPS
The inner shell photoemission spectra of acrylamide are shown in Figure 8, Figure 9 and Figure 10, with the values predicted at the SAC-CI/cc-pVTZ level of calculation for -acrylamide.
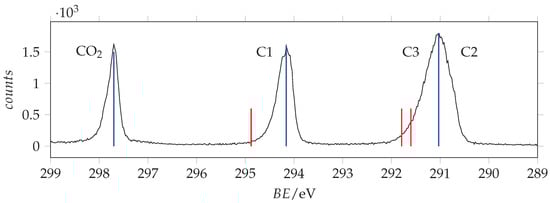
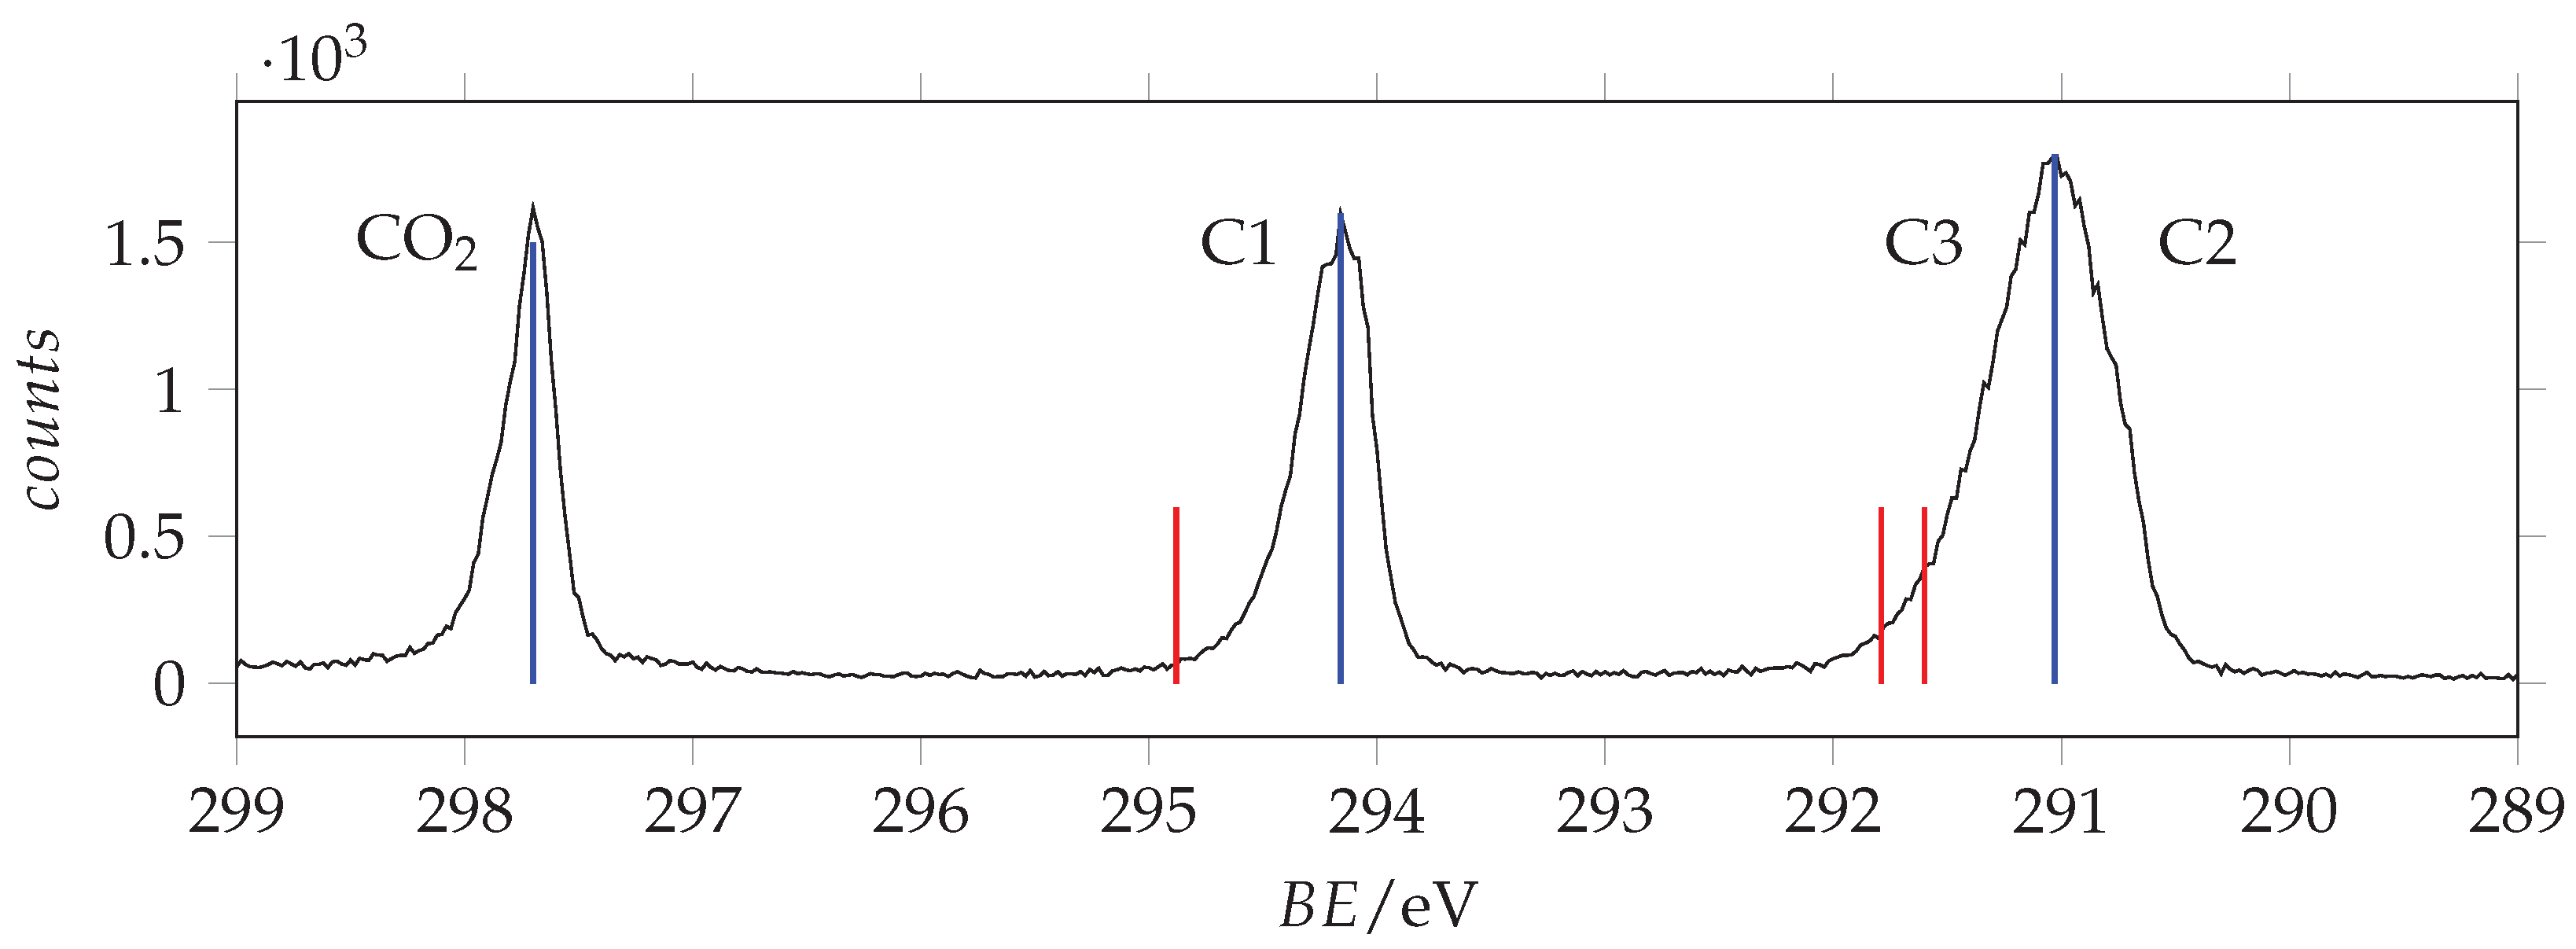
Figure 8.
C(1s) photoemission spectrum of acrylamide and calibrant CO recorded with photon energy 382 eV and resolution 0.22 eV. The calibrant line lies at 297.7 eV [37]. Blue and red lines are the measured and SAC-CI/cc-pVTZ predicted binding energy values.

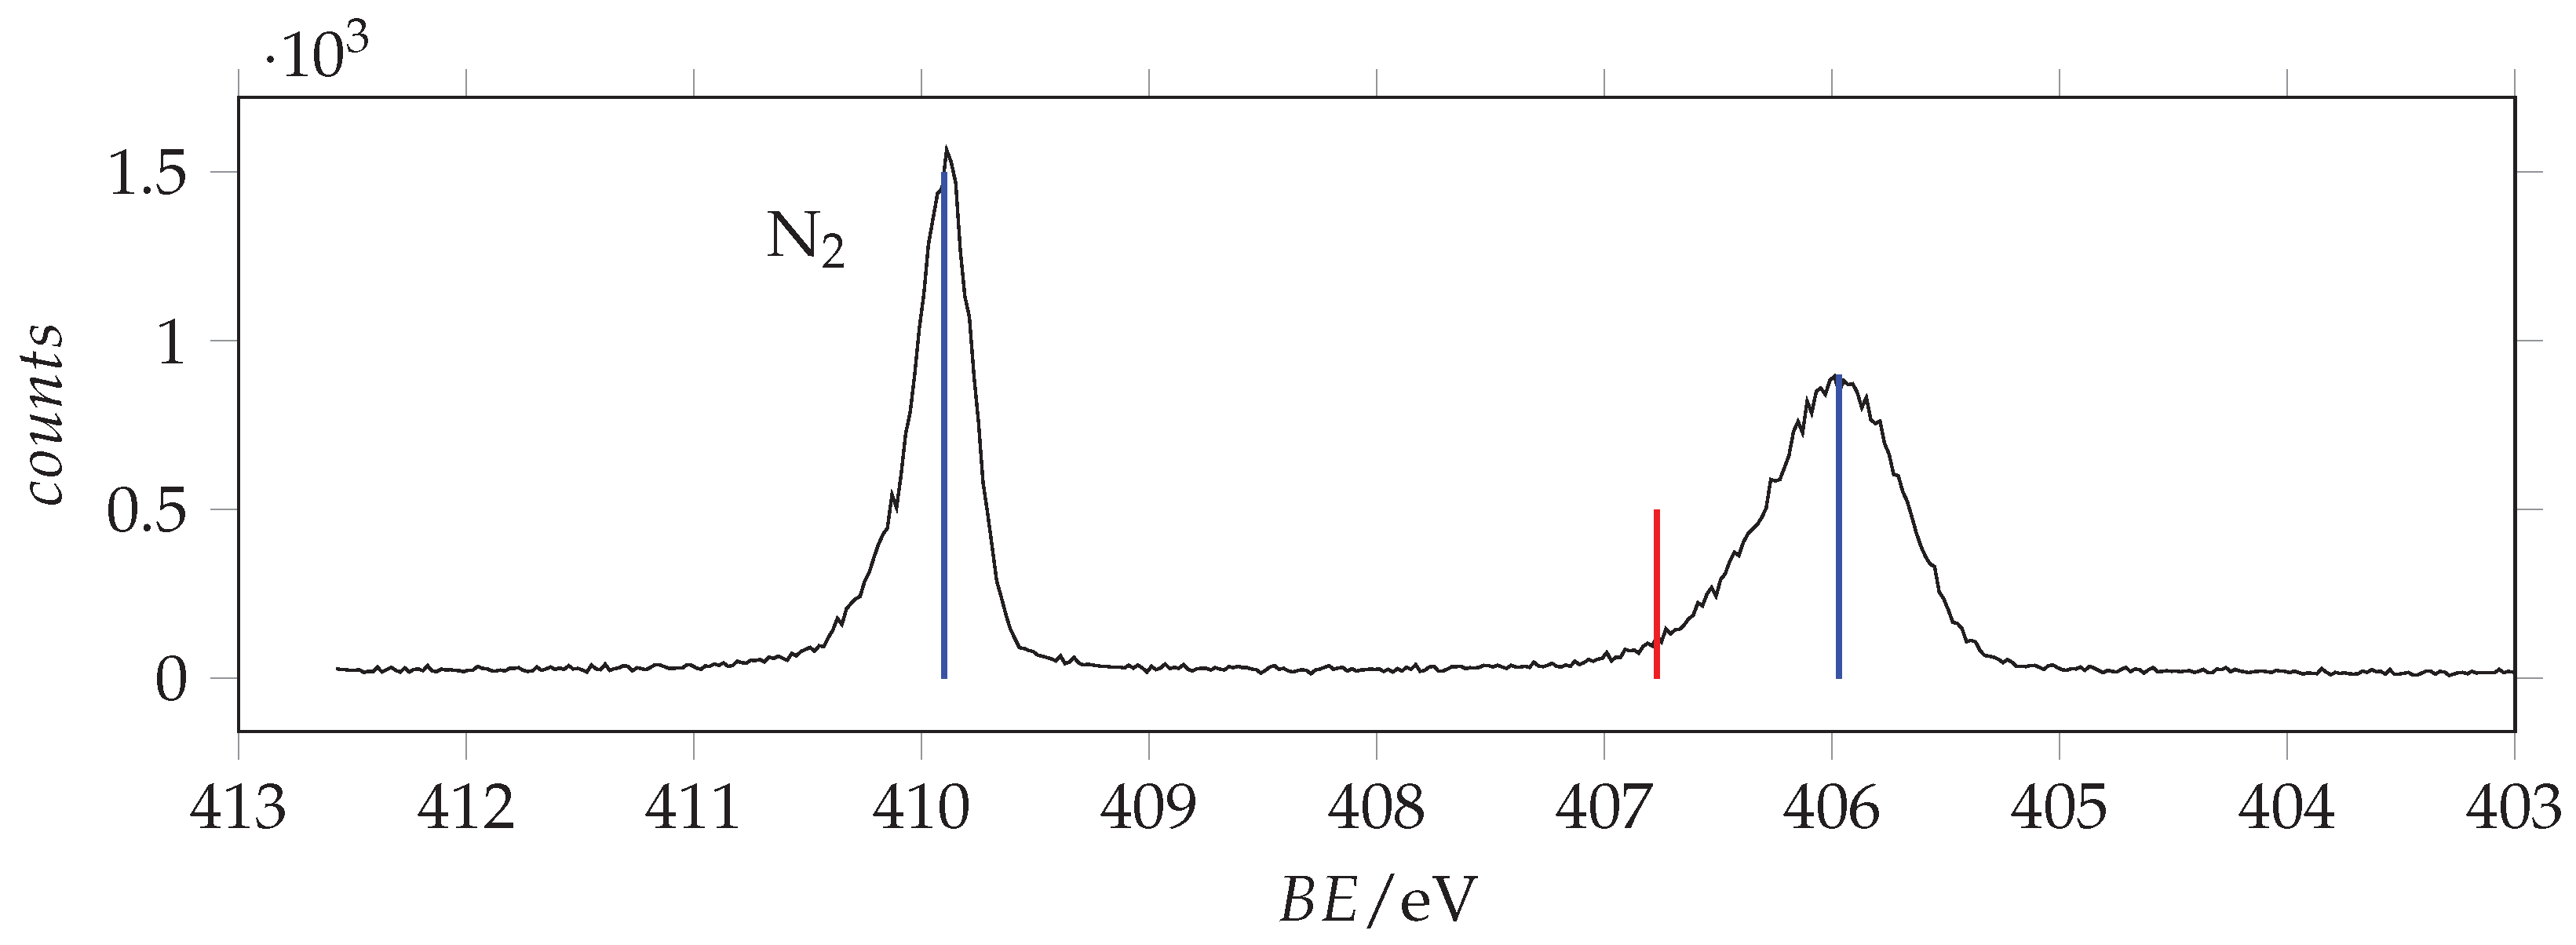
Figure 9.
N(1s) photoemission spectrum of acrylamide and calibrant N recorded with photon energy 495 eV and resolution 0.24 eV. The calibrant line lies at 409.9 eV [37]. Blue and red lines are the measured and SAC-CI/cc-pVTZ predicted binding energy values.
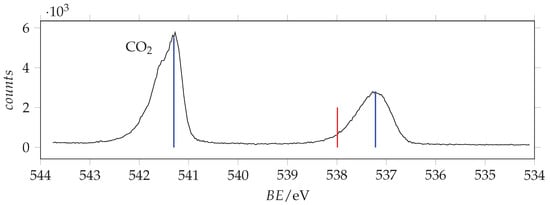
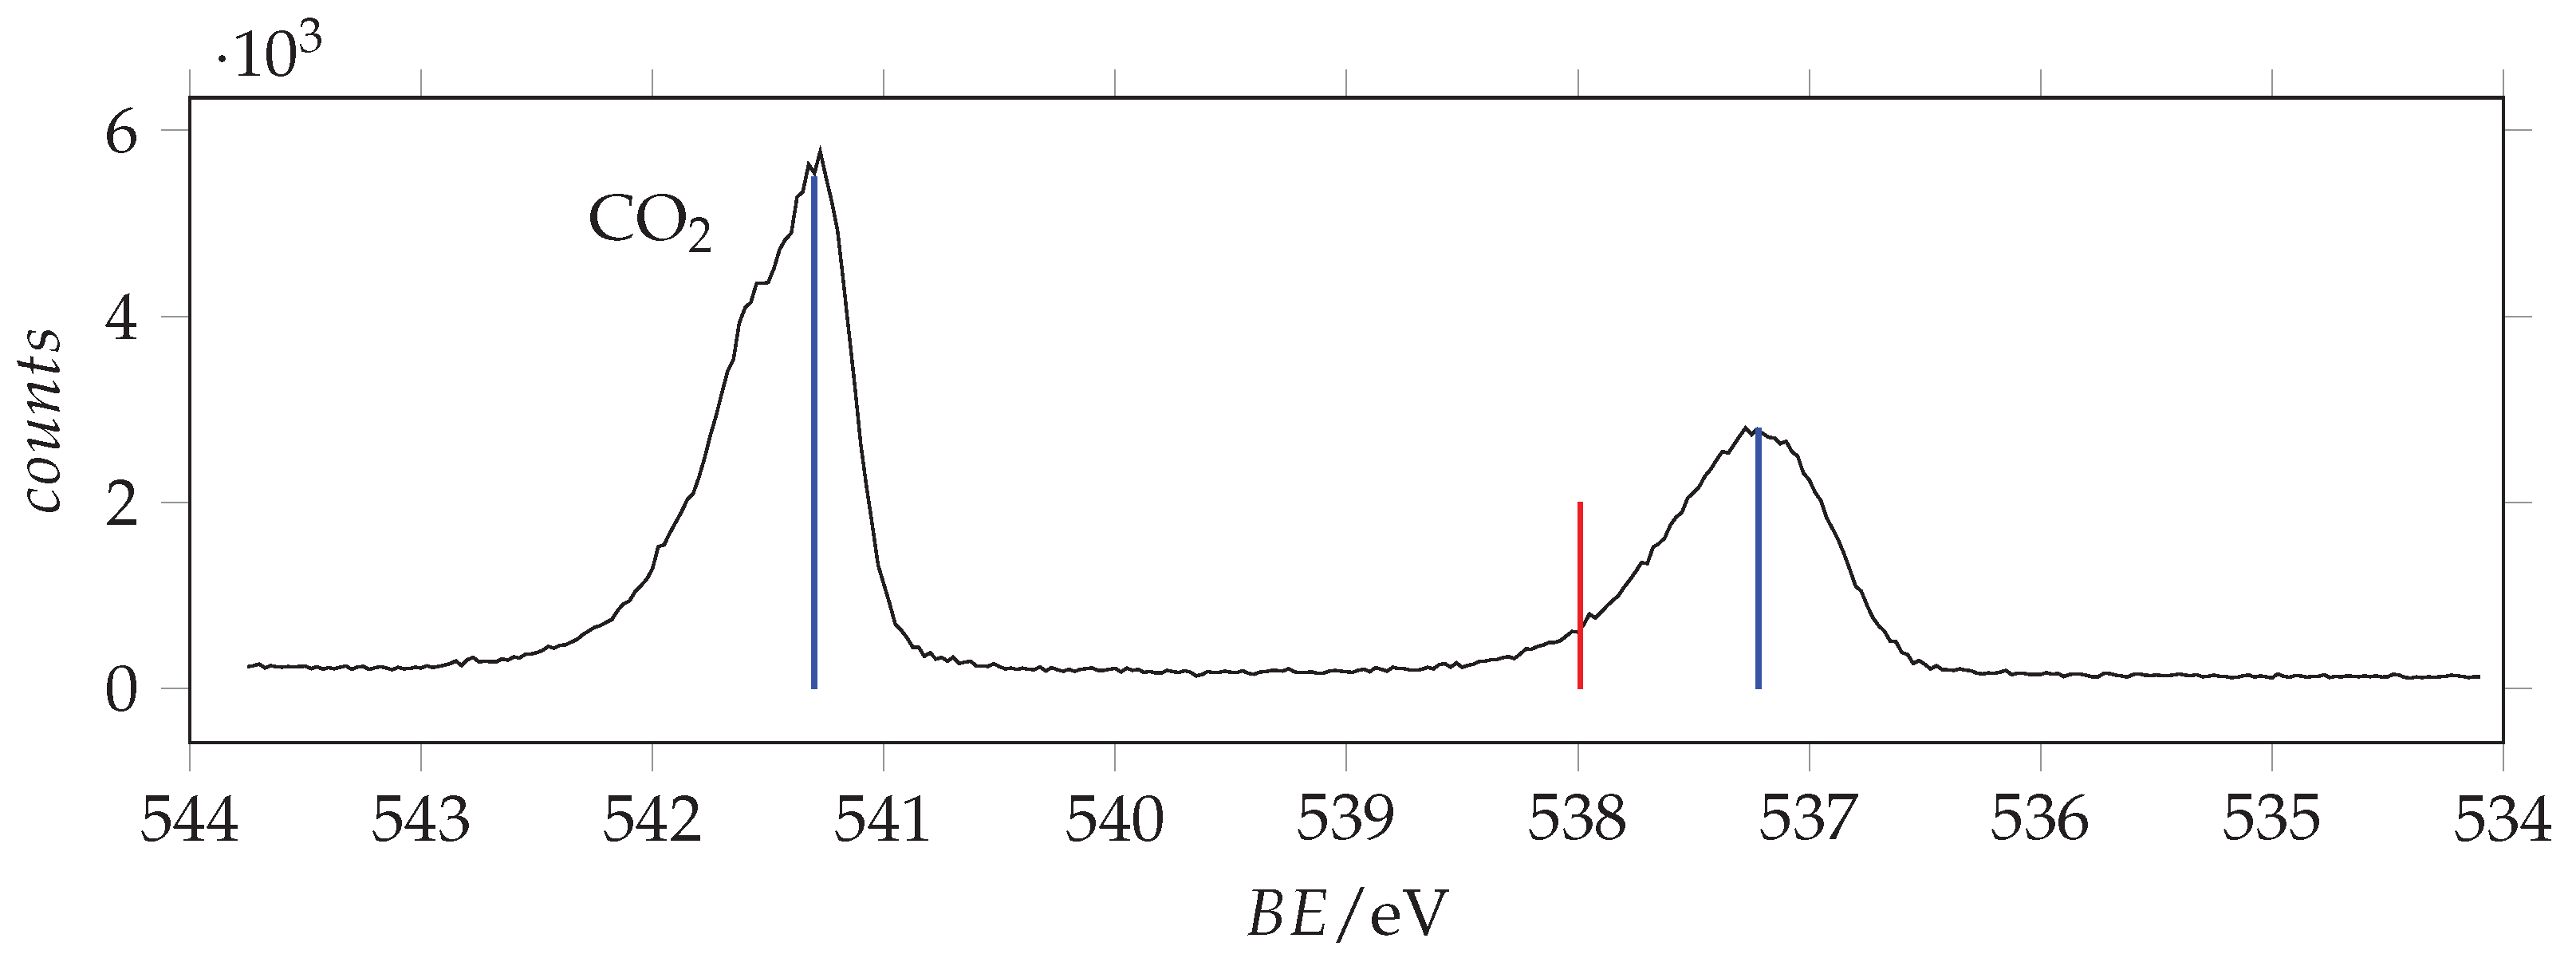
Figure 10.
O(1s) photoemission spectrum of acrylamide and calibrant CO recorded with photon energy 628 eV and resolution 0.38 eV. The calibrant line lies at 541.3 eV [37]. Blue and red lines are the measured and SAC-CI/cc-pVTZ predicted binding energy values.
The measured and theoretical ionization are listed in Table 2. The predictions are overestimated by about 0.7–0.8 eV with respect to the observations. As regards the amide frame, the observed binding energies are smaller (O(1s) −0.5 eV, N(1s) −0.5 eV, C1(1s) −0.3 eV) than those of formamide [38] suggesting an overall electron donating effect of the vinylic electron cloud. Differently, the observed acrylamide binding energies are greater (O(1s) +0.2 eV, N(1s) +0.2 eV, C1(1s) +0.4 eV) than those of N-methylacetamide [39]. In addition, in the case of 3-carbamoyl-2,2,5,5-tetramethyl-3-pyrrolin-1-oxyl (C9H15N2O2) that for our purposes can be described as an acrylamide frame embedded in cyclic nitroxyl radical through the C=C bond, the binding energies of acrylamide are blue shifted: O(1s) +0.32 eV, N(1s) +0.07 eV, C1(1s) +0.16 eV and C2/C3(1s) +0.33 [40]. Comparison with pyridin-2-one, where the amide frame is embedded in a conjugate ring system, shows that the O(1s) binding energy of acrylamide is +0.6 eV greater, whereas the N(1s) binding energies is −0.4 eV smaller [41].
3.4. NEXAFS
The observed K-edge photoabsorption spectra of acrylamide are given in Figure 11, Figure 12 and Figure 13.
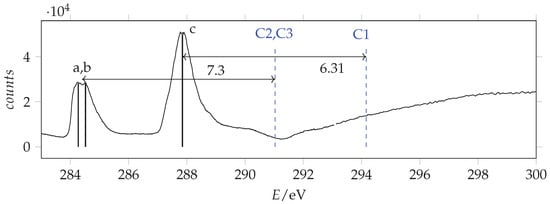
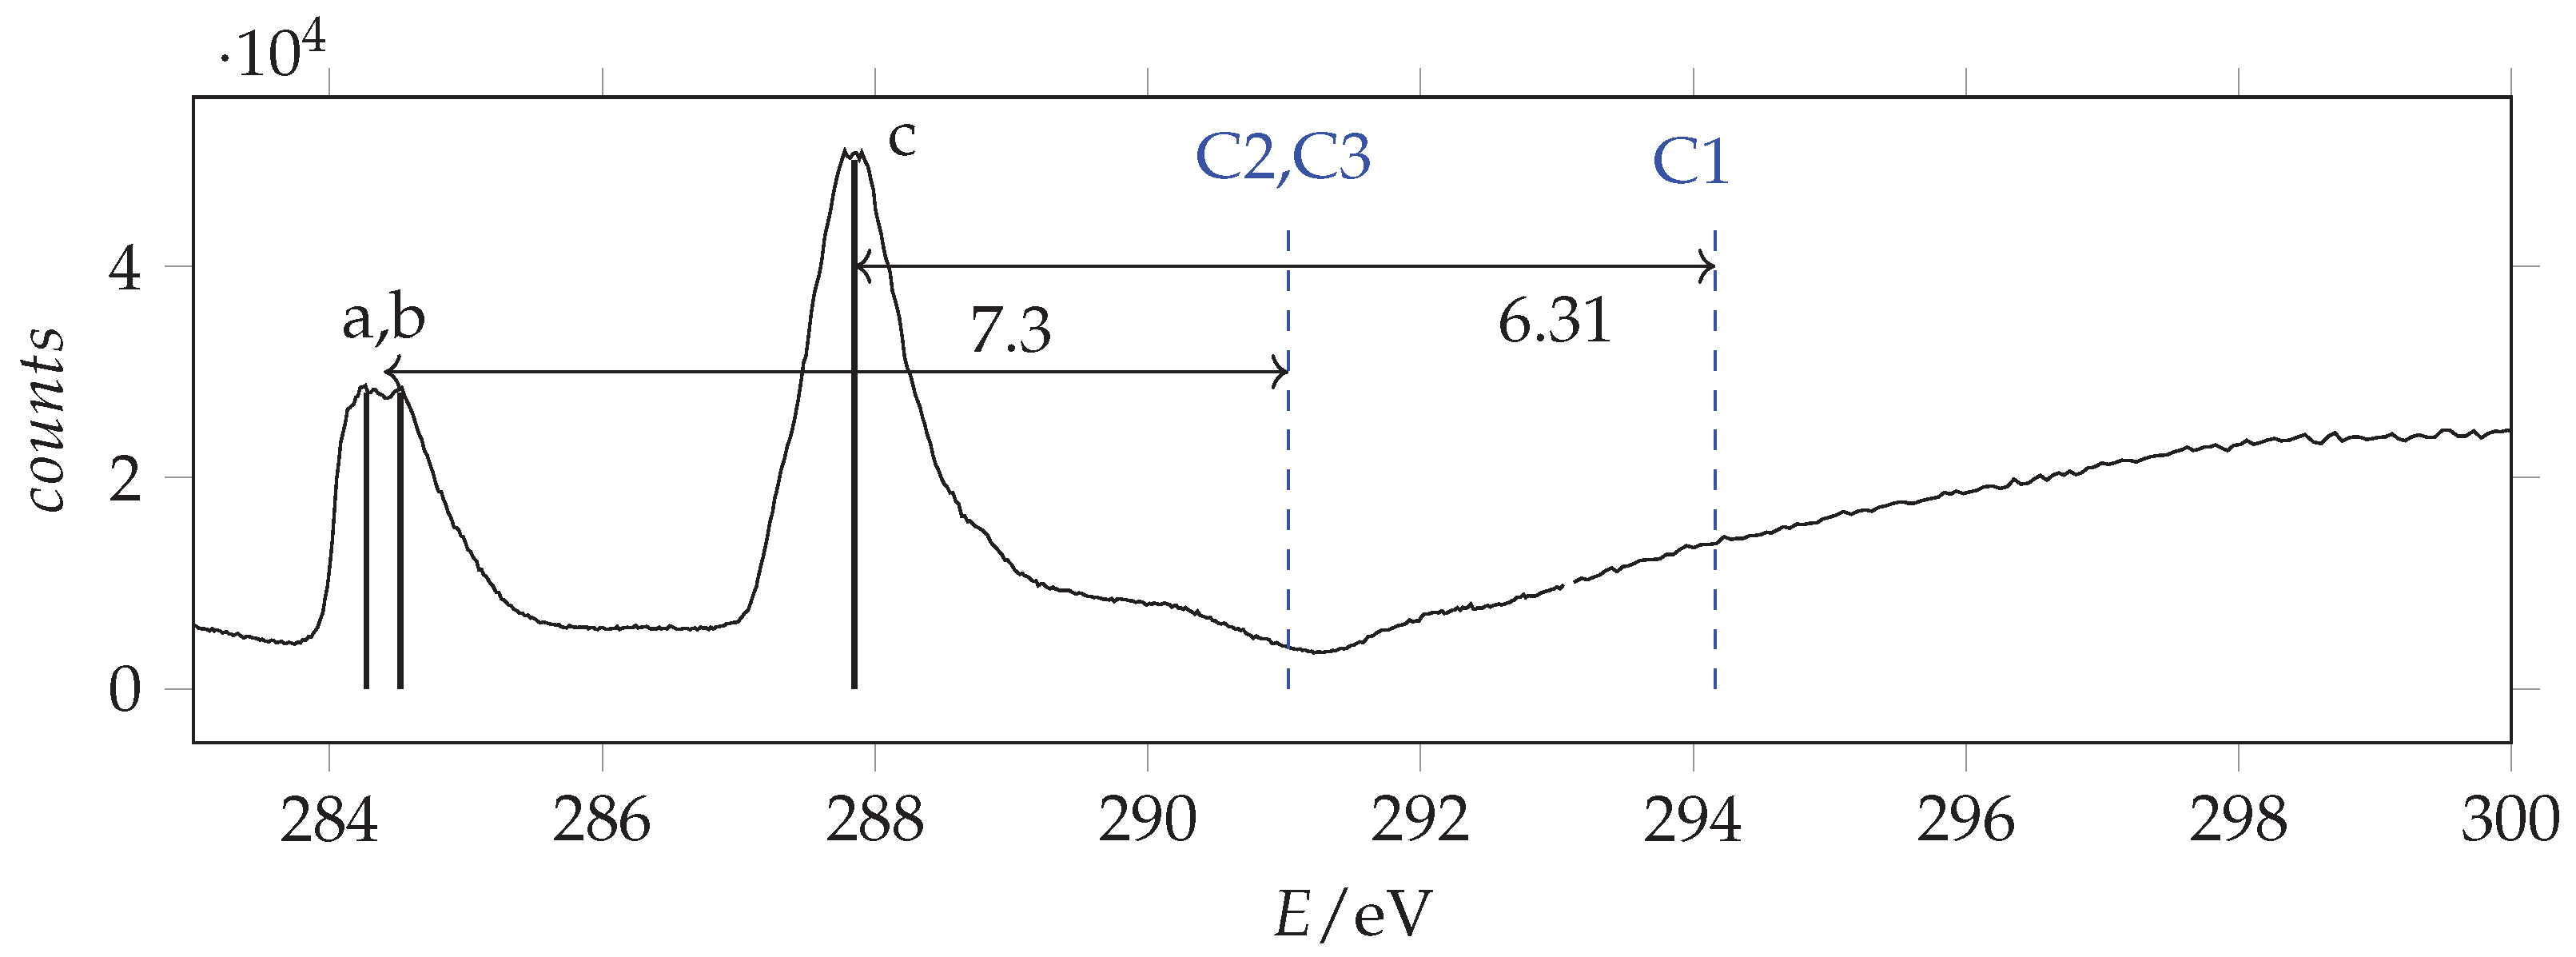
Figure 11.
Photoabsorption spectrum of acrylamide in the region of C(1s) excitation recorded with 288 eV and 296 eV photon energy and 0.065 eV resolution and calibrated using the * CO line at 290.77 eV [42]. The dashed vertical lines indicate the location of the ionization thresholds. Continuous lines identify the measured energies.
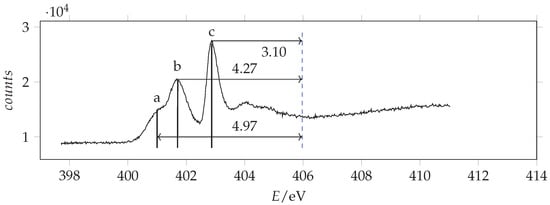
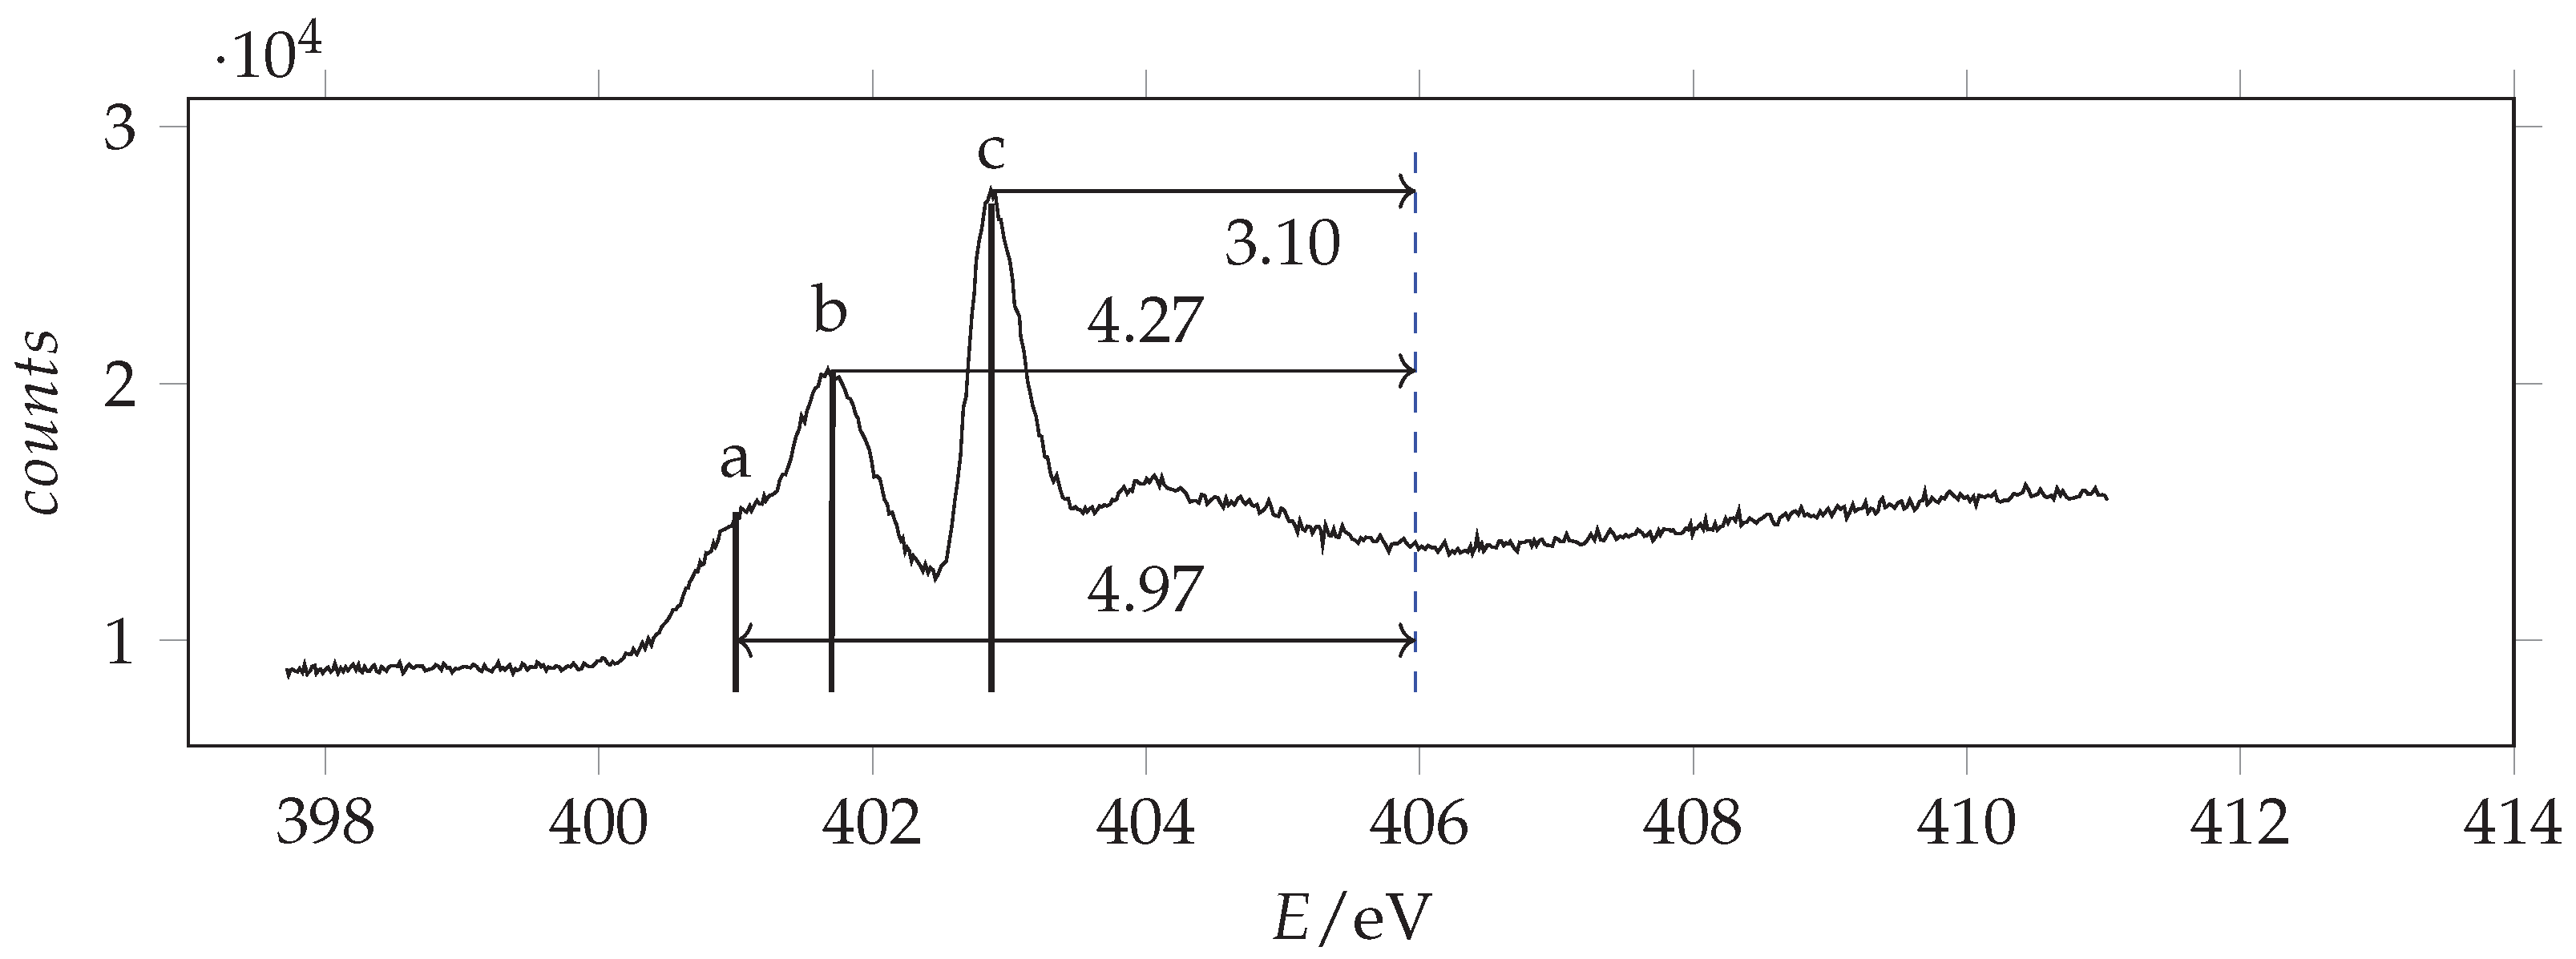
Figure 12.
Photoabsorption spectrum of acrylamide in the region of N(1s) excitation recorded with 401 eV photon energy and 0.070 eV resolution and calibrated with respect to the * N line at 401.10 eV [43]. The dashed vertical line indicates the location of the ionization threshold. Continuous vertical lines identify the measured energies.
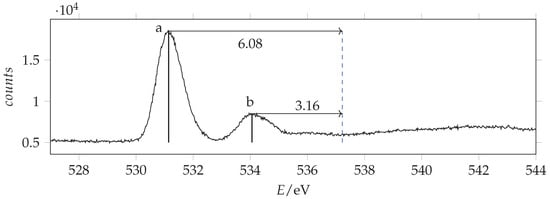
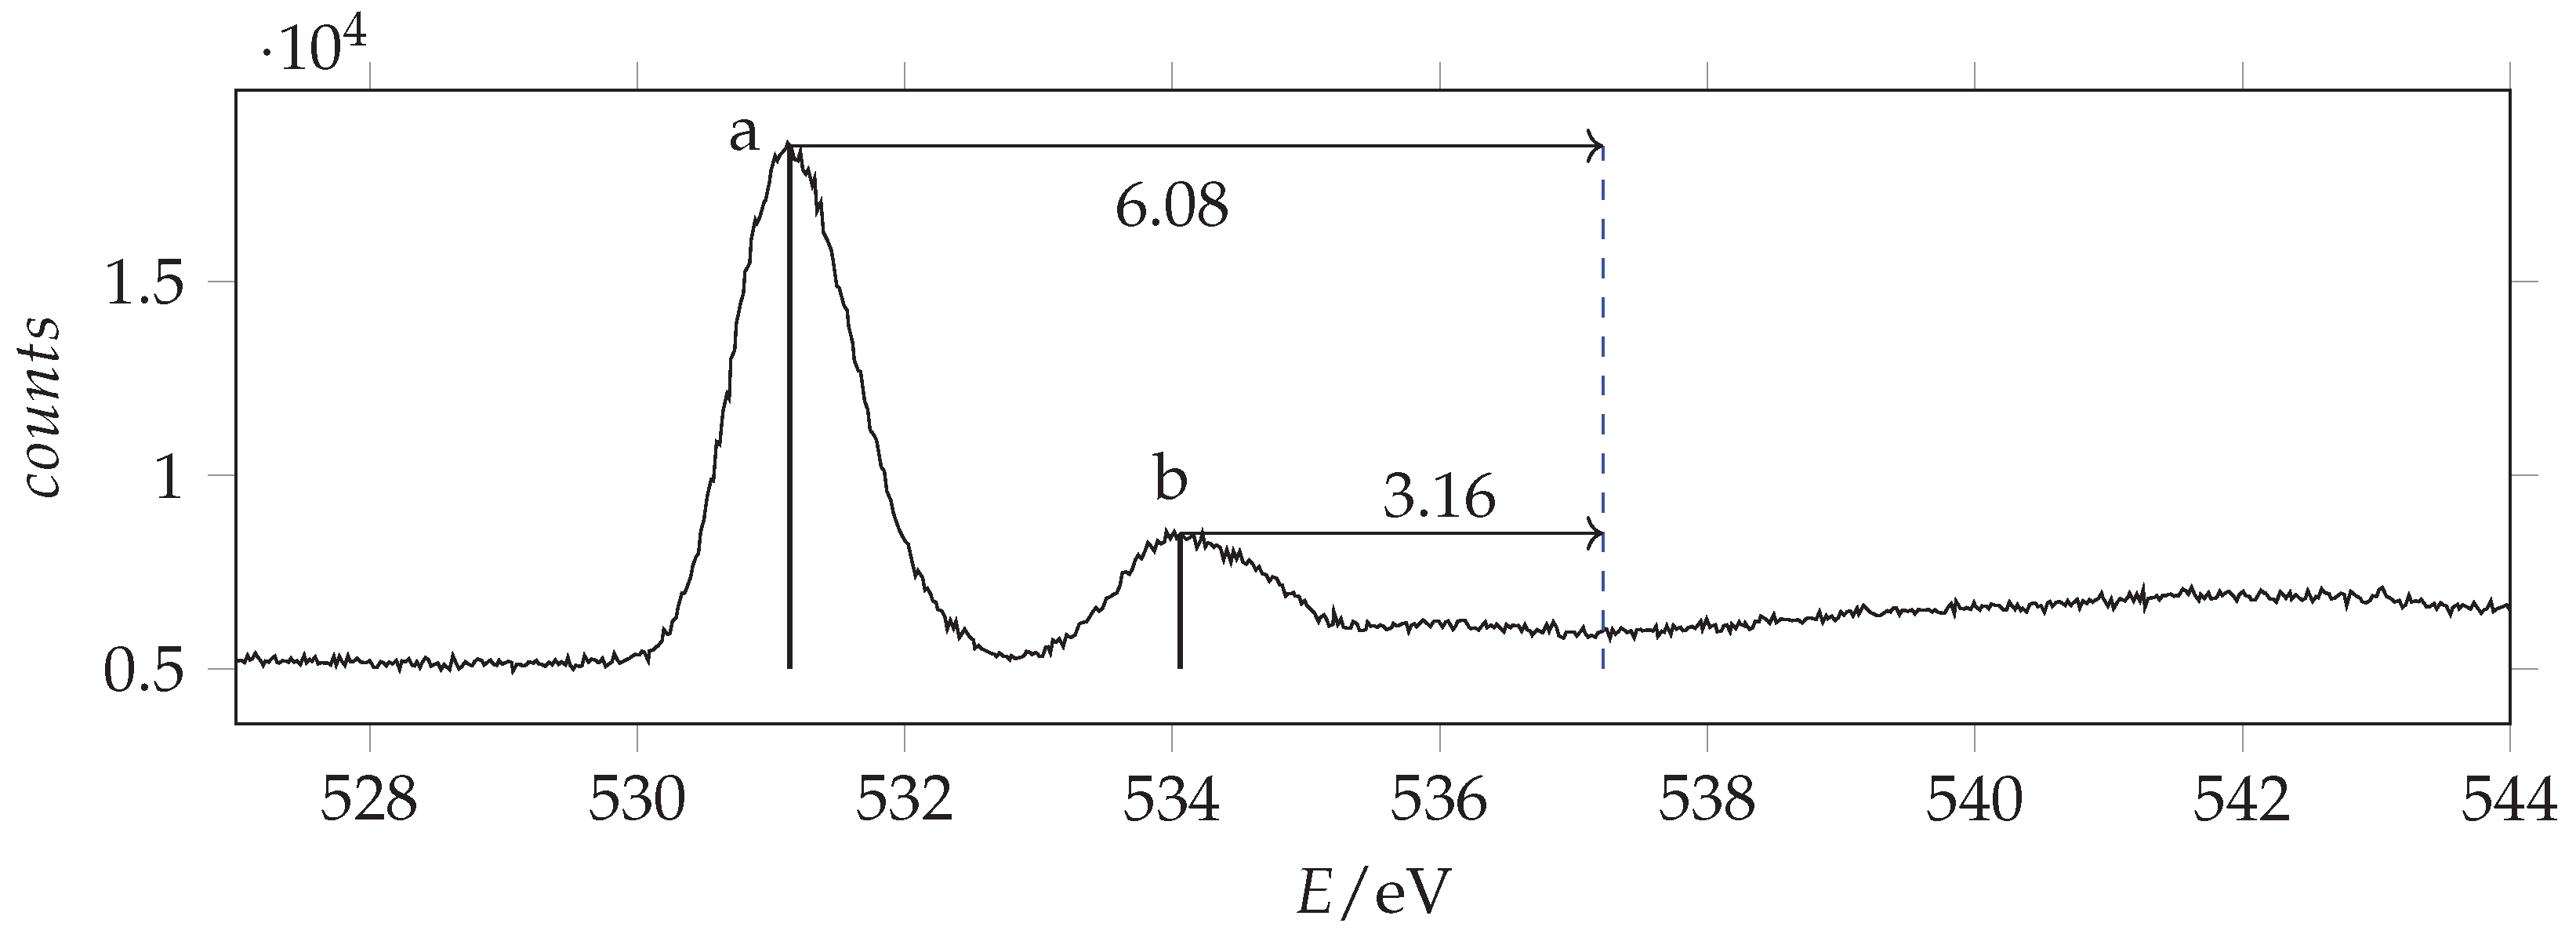
Figure 13.
Photoabsorption spectrum of acrylamide in the region of O(1s) excitation recorded with 536 eV photon energy and 0.130 eV resolution and calibrated with respect to the * CO line at 535.4 eV [44]. The dashed vertical line indicates the location of the ionization threshold. Continuous vertical lines identify the measured energies.
The photoabsorption energy values of the main peaks are listed in Table 4 with the term values calculated as difference with the ionization energy:
Table 4.
Energies (E/eV), term values (T/eV) and assignment for the main features observed in K-shell spectra of acrylamide and analogous compounds. Calculated (SAC-CI/cc-pVTZ) energy values, term values, oscillator strengths (f) and shape of selected unoccupied of -acrylamide are also given.
In the same table, we report the assigned features of related molecular systems formamide (NH2−CHO [45]), acrolein (CH2=CH−CHO [46]) and 3-carbamoyl-2,2,5,5-tetramethyl-3-pyrrolin-1-oxyl (C9H15N2O2 [47,48]), as well as the results of the theoretical simulation.
Most of the observed peaks can be assigned to transitions from the atomic orbital to the first unoccupied * orbital. The predictions are overestimated by about 0.6–1.2 eV with respect to the observations the shifts increasing in going from C to O. The * absorption energies of acrylamide are smaller than formamide and larger than acrolein. As regards the other features, by comparison with acrolein, the observed peak O(b) can be assigned to the * transition. We note that in this case the calculated value is considerably overestimated. Besides the * peak, N(b), the nitrogen NEXAFS spectrum shows two other significant signals: a shoulder at lower energy, N(a), and an intense peak at higher energy, N(c). The same spectral profile has been observed in 3-carbamoyl-2,2,5,5-tetramethyl-3-pyrrolin-1-oxyl [47,48], although the shoulder is clearly overlapped with the vibrational resolved band of N2, used as calibrant. Actually, in the spectrum of acrylamide, the N(a) signal does not show any additional vibrational structure. Thus, we infer that it pertains to acrylamide itself. Accordingly, calculations predict a lower energy, less intense * transition that can be related to N(a) and a higher energy more intense * transition that can be related to N(c). Despite comparison with other analogous molecular systems (see Table 4) support the assignment of peak N(b) to the * transition, we observe that, based exclusively on the predicted energy values, the assignment of peaks N(a) and N(b) should be inverted. However, the predicted absorption intensities are in good agreement with the first proposed assignment.
4. Conclusions
We have performed an extensive core and valence level investigation of acrylamide and reported the theoretical and experimental photoelectron and photoabsorption spectra, as well as calculated along the C-C torsion and structural data of the ground and electronic excited states. Concerning the valence photoelectron spectra, most vibronic peaks have been successfully assigned on the basis of quantum-chemically computed geometry changes associated with ionization of the highest energy occupied orbital and the following -orbital. We find that ab initio and DFT results predict rather different equilibrium structures for the state, with the former level of theory indicating an almost negligible energy difference between planar and twisted structures, in contrast with DFT. Interestingly, the simulated vibronic structure based on the ab initio results agrees very closely with the observed spectra and is in line with recently reported vibronic structure simulations for the smaller formamide.
As regards the core photoelectron spectra, SAC-CI/cc-pVTZ calculations provide predictions slightly overestimated (about 2%) with respect to the experimental values. It is worth noting that the values of the inner shell orbitals calculated at the B2PLYP/aug-cc-pVTZ are of the same order of magnitude of the corresponding binding energies. SAC-CI/cc-pVTZ calculations were also useful to assign the core photoabsorption spectra. Thus, we find generally good agreement between theory and experiment, with few discrepancies that will be the subject of future investigations. More specifically, further investigation of the N(1s) absorption spectrum is warranted, and Resonant Auger–Meitner or angular resolved photoemission spectroscopy experiments could provide additional information for a refined assignment of the outer valence UPS spectrum.
Author Contributions
Conceptualization, A.M.; methodology, L.E., S.M., F.N., M.C., K.C.P. and A.M.; investigation, L.E., S.M., F.N., M.C., K.C.P. and A.M.; writing—original draft preparation, A.M.; writing—review and editing, L.E., S.M., F.N., M.C., K.C.P. and A.M.; funding acquisition, L.E., S.M. and A.M. All authors have read and agreed to the published version of the manuscript.
Funding
This work was supported by the Italian MIUR (Attività Base di Ricerca) and the University of Bologna (Ricerca Fondamentale Orientata). L.E. and A.M. acknowledge Elettra Sincrotrone Trieste for providing financial support as Italian Funded Users to attend shifts assigned to the Proposal No. 20195417 at the gas phase beamline.
Institutional Review Board Statement
Not applicable.
Informed Consent Statement
Not applicable.
Data Availability Statement
Not applicable.
Acknowledgments
We acknowledge the CINECA award under the ISCRA initiative, for the availability of high-performance computing resources and support.
Conflicts of Interest
The authors declare no conflict of interest.
References
- Smith, E.; Prues, S.; Oehme, F. Environmental Degradation of Polyacrylamides. 1. Effects of Artificial Environmental Conditions: Temperature, Light, and pH. Ecotoxicol. Environ. Saf. 1996, 35, 121–135. [Google Scholar] [CrossRef] [PubMed]
- Huang, S.Y.; Lipp, D.; Farinato, R. Acrylamide polymers. In Encyclopedia of Polymer Science and Technology; American Cancer Society: Atlanta, GA, USA, 2001. [Google Scholar] [CrossRef]
- NTP (National Toxicology Program). Report on Carcinogens, 14th ed.; U.S. Department of Health and Human Services, Public Health Service: Research Triangle Park, NC, USA, 2016.
- Xiong, B.; Loss, R.; Shields, D.T.; Pawlik, R.H.; Zydney, A.; Kumar, M. Polyacrylamide degradation and its implications in environmental systems. NPJ Clean Water 2018, 1, 17. [Google Scholar] [CrossRef]
- Tepe, Y.; Çebi, A. Acrylamide in Environmental Water: A Review on Sources, Exposure, and Public Health Risks. Expos. Health 2019, 11, 3–12. [Google Scholar] [CrossRef]
- Exon, J.H. A Review of the Toxicology of Acrylamide. J. Toxicol. Environ. Heal. Part B 2006, 9, 397–412. [Google Scholar] [CrossRef] [PubMed]
- Moldoveanu, S.; Gerardi, A. Acrylamide Analysis in Tobacco, Alternative Tobacco Products, and Cigarette Smoke. J. Chromatogr. Sci. 2011, 49, 234–242. [Google Scholar] [CrossRef]
- Mottram, D.; Wedzicha, B.; Dodson, A. Acrylamide is formed in the Maillard reaction. Nature 2002, 419, 448–449. [Google Scholar] [CrossRef]
- Marstokk, K.M.; Møllendal, H.; Samdal, S. Microwave spectrum, conformational equilibrium, 14N quadrupole coupling constants, dipole moment, vibrational frequencies and quantum chemical calculations for acrylamide. J. Mol. Struct. 2000, 524, 69–85. [Google Scholar] [CrossRef]
- Kolesniková, L.; Belloche, A.; Koucký, J.; Alonso, E.R.; Garrod, R.T.; Luková, K.; Menten, K.M.; Müller, H.S.P.; Kania, P.; Urban, S. Laboratory rotational spectroscopy of acrylamide and a search for acrylamide and propionamide toward Sgr B2(N) with ALMA. Astron. Astrophys. 2022, 659, A111. [Google Scholar] [CrossRef]
- Kydd, R.; Dunham, A. The infrared spectra and structure of acetamide and acrylamide. J. Mol. Struct. 1980, 69, 79–88. [Google Scholar] [CrossRef]
- Åsbrink, L.; Svensson, A.; von Niessen, W.; Bier, G. 30.4-nm He(II) photoelectron spectra of organic molecules: Part V. Hetero-compounds containing first-row elements (C, H, B, N, O, F). J. Electron Spectrosc. Relat. Phenom. 1981, 24, 293–314. [Google Scholar] [CrossRef]
- Prince, K.C.; Blyth, R.R.; Delaunay, R.; Zitnik, M.; Krempasky, J.; Slezak, J.; Camilloni, R.; Avaldi, L.; Coreno, M.; Stefani, G.; et al. The gas-phase photoemission beamline at Elettra. J. Synchrotron Radiat. 1998, 5, 565–568. [Google Scholar] [CrossRef] [PubMed]
- Lüder, J.; de Simone, M.; Totani, R.; Coreno, M.; Grazioli, C.; Sanyal, B.; Eriksson, O.; Brena, B.; Puglia, C. The electronic characterization of biphenylene-Experimental and theoretical insights from core and valence level spectroscopy. J. Chem. Phys. 2015, 142, 074305. [Google Scholar] [CrossRef] [PubMed] [Green Version]
- Carpenter, E.; Davis, H. Acrylamide. Its preparation and properties. J. Appl. Chem. 1957, 7, 671–676. [Google Scholar] [CrossRef]
- Mårtensson, N.; Baltzer, P.; Brühwiler, P.; Forsell, J.O.; Nilsson, A.; Stenborg, A.; Wannberg, B. A very high resolution electron spectrometer. J. Electron Spectrosc. Relat. Phenom. 1994, 70, 117–128. [Google Scholar] [CrossRef]
- Li, X.; Frisch, M.J. Energy-Represented Direct Inversion in the Iterative Subspace within a Hybrid Geometry Optimization Method. J. Chem. Theory Comput. 2006, 2, 835–839. [Google Scholar] [CrossRef]
- Runge, E.; Gross, E.K.U. Density-Functional Theory for Time-Dependent Systems. Phys. Rev. Lett. 1984, 52, 997–1000. [Google Scholar] [CrossRef]
- Ehara, M.; Hasegawa, J.; Nakatsuji, H. SAC-CI method applied to molecular spectroscopy. In Theory and Applications of Computational Chemistry. The First Forty Years.; Elsevier: Amsterdam, The Netherlands, 2005; pp. 1099–1141. [Google Scholar] [CrossRef]
- Linderberg, J.; Öhrn, Y. Propagators in Quantum Chemistry, 2nd ed.; John Wiley and Sons, Inc.: Hoboken, NJ, USA, 2004. [Google Scholar]
- Danovich, D. Green’s function methods for calculating ionization potentials, electron affinities, and excitation energies. Wiley Interdiscip. Rev. Comput. Mol. Sci. 2011, 1, 377–387. [Google Scholar] [CrossRef]
- Cederbaum, L.S. One-body Green’s function for atoms and molecules: Theory and application. J. Phys. B Atom. Mol. Phys. 1975, 8, 290–303. [Google Scholar] [CrossRef]
- von Niessen, W.; Schirmer, J.; Cederbaum, L. Computational methods for the one-particle green’s function. Comput. Phys. Rep. 1984, 1, 57–125. [Google Scholar] [CrossRef]
- Zakrzewski, V.; Ortiz, J.; Nichols, J.; Heryadi, D.; Yeager, D.; Golab, J. Comparison of perturbative and multiconfigurational electron propagator methods. Int. J. Quantum Chem. 1996, 60, 29–36. [Google Scholar] [CrossRef]
- Ortiz, J.V. Partial third-order quasiparticle theory: Comparisons for closed-shell ionization energies and an application to the Borazine photoelectron spectrum. J. Chem. Phys. 1996, 104, 7599–7605. [Google Scholar] [CrossRef]
- Negri, F.; Zgierski, M. Franck–Condon analysis of the S0->T1 absorption and phosphorescence spectra of biphenyl and bridged derivatives. J. Chem. Phys. 1992, 97, 7124–7136. [Google Scholar] [CrossRef]
- Malagoli, M.; Coropceanu, V.; da Silva Filho, D.; Brédas, J. A multimode analysis of the gas-phase photoelectron spectra in oligoacenes. J. Chem. Phys. 2004, 120, 7490–7496. [Google Scholar] [CrossRef] [Green Version]
- Duschinsky, F. The importance of the electron spectrum in multi atomic molecules. Concerning the Franck–Condon principle. Acta Physicochim. URSS 1937, 7, 551–566. [Google Scholar]
- Santoro, F.; Lami, A.; Improta, R.; Bloino, J.; Barone, V. Effective method for the computation of optical spectra of large molecules at finite temperature including the Duschinsky and Herzberg–Teller effect: The Qx band of porphyrin as a case study. J. Chem. Phys. 2008, 128, 224311. [Google Scholar] [CrossRef]
- Dierksen, M.; Grimme, S. An efficient approach for the calculation of Franck–Condon integrals of large molecules. J. Chem. Phys. 2005, 122, 244101. [Google Scholar] [CrossRef] [PubMed]
- Barone, V.; Bloino, J.; Biczysko, M.; Santoro, F. Fully Integrated Approach to Compute Vibrationally Resolved Optical Spectra: From Small Molecules to Macrosystems. J. Chem. Theory Comput. 2009, 5, 540–554. [Google Scholar] [CrossRef]
- Udovenko, A.; Kolzunova, L. Crystal structure of acrylamide. J. Struct. Chem. 2008, 49, 961–964. [Google Scholar] [CrossRef]
- Velchev, I.; Hogervorst, W.; Ubachs, W. Precision VUV Spectroscopy of Ar I at 105 nm. J. Phys. B 1999, 32, L511–L516. [Google Scholar] [CrossRef]
- Koopmans, T. Über die Zuordnung von Wellenfunktionen und Eigenwerten zu den einzelnen Elektronen eines Atoms. Physica 1934, 1, 104–113. [Google Scholar] [CrossRef]
- Siegbarn, H.; Asplund, L.; Kelfve, P.; Hamrin, K.; Karlsson, L.; Siegbahn, K. ESCA applied to liquids. II. Valence and core electron spectra of formamide. J. Electron Spectrosc. Relat. Phenom. 1974, 5, 1059–1079. [Google Scholar] [CrossRef]
- Bodi, A.; Hemberger, P. Low-Energy Photoelectron Spectrum and Dissociative Photoionization of the Smallest Amides: Formamide and Acetamide. J. Phys. Chem. A 2019, 123, 272–283. [Google Scholar] [CrossRef] [PubMed]
- Thomas, T.D.; Shaw, R.W. Accurate core ionization potentials and photoelectron kinetic energies for light elements. J. Electron Spectrosc. Relat. Phenom. 1974, 5, 1081–1094. [Google Scholar] [CrossRef]
- Jolly, W.; Bomben, K.; Eyermann, C. Core-electron binding energies for gaseous atoms and molecules. At. Data Nucl. Data 1984, 31, 433–493. [Google Scholar] [CrossRef]
- Li, C.; Salén, P.; Yatsyna, V.; Schio, L.; Feifel, R.; Squibb, R.; Kamińska, M.; Larsson, M.; Richter, R.; Alagia, M.; et al. Experimental and theoretical XPS and NEXAFS studies of N-methylacetamide and N-methyltrifluoroacetamide. Phys. Chem. Chem. Phys. 2016, 18, 2210–2218. [Google Scholar] [CrossRef] [PubMed]
- Kovač, B.; Ljubić, I.; Kivimäki, A.; Coreno, M.; Novak, I. Characterisation of the electronic structure of some stable nitroxyl radicals using variable energy photoelectron spectroscopy. Phys. Chem. Chem. Phys. 2014, 16, 10734–10742. [Google Scholar] [CrossRef] [PubMed]
- Melandri, S.; Evangelisti, L.; Canola, S.; Sa’adeh, H.; Calabrese, C.; Coreno, M.; Grazioli, C.; Prince, K.; Negri, F.; Maris, A. Chlorination and tautomerism: A computational and UPS/XPS study of 2-hydroxypyridine-2-pyridone equilibrium. Phys. Chem. Chem. Phys. 2020, 22, 13440–13455. [Google Scholar] [CrossRef]
- Tronc, M.; King, G.; Read, F. Carbon K-shell excitation in small molecules by high-resolution electron impact. J. Phys. B At. Mol. Phys. 1979, 12, 137–157. [Google Scholar] [CrossRef]
- Sodhi, R.; Brion, C. Reference energies for inner shell electron energy-loss spectroscopy. J. Electron Spectrosc. Relat. Phenom. 1984, 34, 363–372. [Google Scholar] [CrossRef]
- Wight, G.; Brion, C. K-Shell energy loss spectra of 2.5 keV electrons in CO2 and N2O. J. Electron Spectrosc. Relat. Phenom. 1974, 3, 191–205. [Google Scholar] [CrossRef]
- Ishii, I.; Hitchcock, A. A quantitative experimental study of the core excited electronic states of formamide, formic acid, and formyl fluoride. J. Chem. Phys. 1987, 87, 830–839. [Google Scholar] [CrossRef]
- Duflot, D.; Flament, J.P.; Walker, I.C.; Heinesch, J.; Hubin-Franskin, M.J. Core shell excitation of 2-propenal (acrolein) at the O 1s and C 1s edges: An experimental and ab initio study. J. Chem. Phys. 2003, 118, 1137–1145. [Google Scholar] [CrossRef]
- Ljubić, I.; Kivimäki, A.; Coreno, M. An experimental NEXAFS and computational TDDFT and ΔDFT study of the gas-phase core excitation spectra of nitroxide free radical TEMPO and its analogues. Phys. Chem. Chem. Phys. 2016, 18, 10207–10217. [Google Scholar] [CrossRef]
- Totani, R.; Ljubić, I.; Ciavardini, A.; Grazioli, C.; Galdenzi, F.; de Simone, M.; Coreno, M. Frontier orbital stability of nitroxyl organic radicals probed by means of inner shell resonantly enhanced valence band photoelectron spectroscopy. Phys. Chem. Chem. Phys. 2022, 24, 1993–2003. [Google Scholar] [CrossRef] [PubMed]

Publisher’s Note: MDPI stays neutral with regard to jurisdictional claims in published maps and institutional affiliations. |
© 2022 by the authors. Licensee MDPI, Basel, Switzerland. This article is an open access article distributed under the terms and conditions of the Creative Commons Attribution (CC BY) license (https://creativecommons.org/licenses/by/4.0/).