


Abstract
Undershirts are worn under athletic apparel in hot environments, but their effects on the skin-clothing microclimate and thermoregulation remain unclear. We investigated whether undershirt use and breathability affect intra-clothing environments and thermoregulatory responses during exercise. Thirteen male runners completed two 30 min treadmill bouts at moderate and high intensities, separated by a 10 min break (32 °C, 50% relative humidity, and 0.8 m/s). They wore a polyester T-shirt with a regular polyester undershirt (CON), an undershirt with greater air permeability under wet conditions (Dry Aeroflow, DAF), or no undershirt (NU) in a randomized crossover manner. Compared with NU, wearing undershirts increased chest intra-clothing humidity by up to 7% (all p ≤ 0.005). Overall, back sweat rate, wear discomfort, and trunk skin temperatures were ~0.1 mg/cm2/min, ~0.5, and ~0.5 °C higher, respectively, in CON and DAF than in NU (all p ≤ 0.043). Compared with CON, DAF reduced back sweat rate by ~0.06 mg/cm2/min and back intra-clothing temperature by ~0.22 °C (both p ≤ 0.014). No significant differences were detected in rectal temperature, mean skin temperature, heart rate, or body mass loss (all p ≥ 0.067). Collectively, undershirts altered local intra-clothing environments and physiological/perceptual responses, whereas DAF partially alleviated these local responses without altering whole-body physiological responses.
1. Introduction
Heat stress increases thermal strains during exercise, which can impair performance and elevate the risk of heat-related illness. During exercise in the heat, sweat evaporation is the primary physiological pathway for heat dissipation [1], which is influenced by air movement and the vapor pressure gradient from the skin to the environment [2]. When clothing covers the skin, the transfer of heat and moisture to the environment is restricted, modulating the microclimate formed between the skin and garment [3]. Mechanical assessments of fabrics have shown that adding garment layers reduces breathability and thermal transmittance, regardless of fiber composition or knit structure [4,5]. Therefore, clothing layering may hinder heat and moisture transport, potentially leading to increased skin temperatures and elevated microclimate humidity.
Sports undershirts are widely used as base-layer garments beneath athletic apparel. However, research in summer sportswear has primarily focused on single-layer garments [6,7,8,9], and little is known about how wearing an undershirt influences the skin-clothing microclimate and thermoregulatory responses during exercise in hot conditions. Traditionally, research on clothing layering has focused on thermal insulation under cool to cold conditions (e.g., below 20 °C) [10,11,12,13,14] or on protective clothing designed for extreme occupational heat, such as firefighting, military activity, and mining [15,16]. Studies examining sports undershirts or related products have shown that wearing compression garments under standard hockey uniforms increases mean skin temperature without affecting core body temperature (Tco) in a temperate (~17 °C) condition [17]. Roberts et al. [18] compared nude and various single-layer lightweight clothing conditions, including base layers and a T-shirt, during exercise at ~20 °C and reported that clothing condition altered mean skin temperature, whereas Tco remained unchanged. In addition, sports bra use has been suggested to attenuate local heat dissipation from the breast region, although Tco was not reported [19]. Therefore, light clothing layers may affect local thermoregulatory responses (e.g., local skin temperature), but the thermoregulatory effects of base layers under light sportswear (e.g., T-shirt) during exercise in hot conditions remain unclear.
Fabric breathability is also a key factor modulating thermophysiological responses. Recent studies showed that, compared with standard polyester, a breathable T-shirt reduces local intra-clothing humidity and skin temperature during exercise in controlled indoor [20] and uncontrolled outdoor [21] hot conditions without altering Tco, mean skin temperature, or whole-body sweat loss. However, while layering may modify airflow and moisture transport through the clothing system, it remains unclear whether these effects related to the fabric difference are preserved when the fabric is positioned beneath a T-shirt.
The present study aimed to determine whether wearing an undershirt and differences in fabric characteristics alter intra-clothing environments and physiological responses during exercise in hot conditions. We hypothesized that layering an undershirt beneath a polyester T-shirt would increase intra-clothing temperature and humidity and elevate local skin temperatures compared with wearing a T-shirt alone, while an undershirt with greater air permeability would attenuate these responses. We also expected that any clothing effects would be mainly local, with limited differences in whole-body physiological responses, including Tco, mean skin temperature, and whole-body sweat loss.
2. Materials and Methods
2.1. Participants
We recruited 13 healthy male runners who were habitually trained five or six times per week, and all were nonsmokers. The participants had an average age, height, body mass, and peak oxygen uptake (VO2peak) of 21 ± 1 years, 1.72 ± 0.04 m, 59.7 ± 5.1 kg, and 51.6 ± 7.3 mL/kg/min, respectively. The study received approval from the human ethics committee of Niigata University (reference #: 2021-0195) and adhered to the latest version of the Declaration of Helsinki. Written informed consent was obtained from all participants before the experimental sessions.
Sample size was determined using simulation-based open-source software (https://arcaldwell49.shinyapps.io/anova-exact/, accessed on 12 July 2023) [22]. Based on a previous study assessing the effects of a DAF T-shirt on thermoregulation [20], we assumed that wearing an undershirt beneath a T-shirt would increase local skin temperature by 1 °C during exercise (e.g., 34 °C to 35 °C), while a DAF-made undershirt would mitigate this response (e.g., 34.5 °C) with common standard deviations of 1.0 °C. Using a two-way repeated-measures analysis of variance with estimated effect sizes (partial η2) of 0.4 and assuming a repeated-measures correlation coefficient (r) of 0.5, the required sample size was calculated to be at least 10 participants to achieve a statistical power greater than 80% (α = 0.05).
2.2. Test Garments
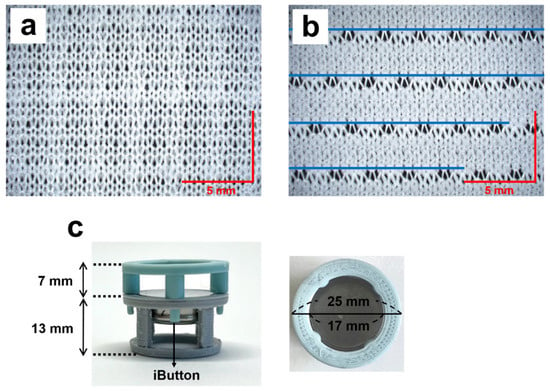
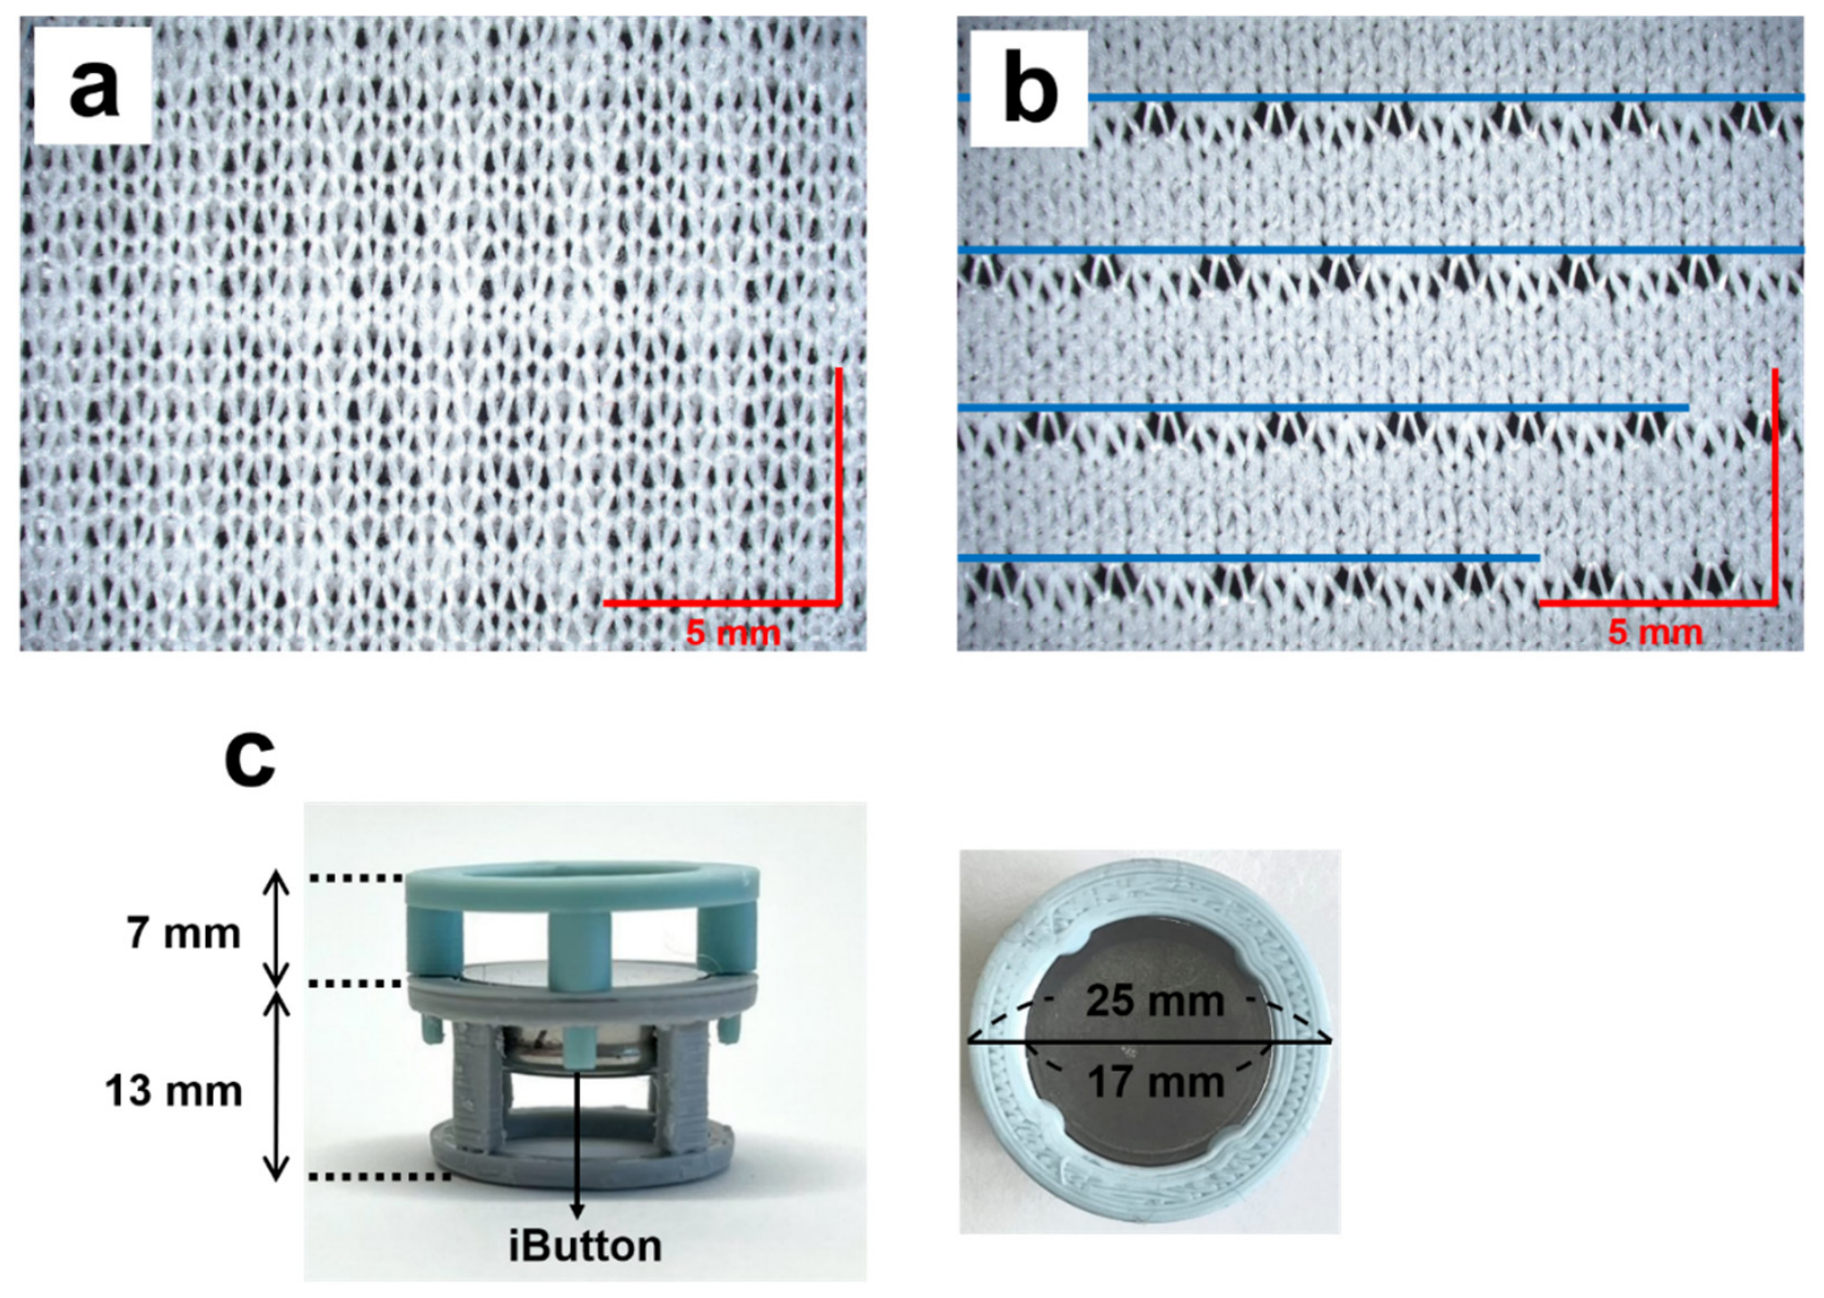
We used short-sleeved T-shirts and two types of undershirts, all made of 100% polyester with a regular fit. The undershirts were identical in design and color (white). Participants were assigned to one of three clothing conditions: no undershirt (NU), where participants wore the short-sleeved T-shirt alone; the control undershirt (CON, Mizuno, Osaka, Japan) under the short-sleeved T-shirt; and the experimental undershirt with improved breathability (DAF, Mizuno, Osaka, Japan) under the short-sleeved shirt. The order of the clothing conditions was randomized in a crossover design. Although participants were aware of whether an undershirt was present, CON and DAF undershirts were not visually distinguishable. Both the short-sleeved T-shirts and CON were made of hydrophilic yarn only, whereas DAF was made with both hydrophilic and water-repellent yarn surrounding the fabric gap holes (Figure 1a,b).
Figure 1.
Photographs of the fabrics and an iButton-integrated plastic frame chamber. The fabric image is captured at ×20 magnification. (a) Control undershirt; and (b) Dry Aeroflow (DAF). The blue lines indicate the threads blended with hydrophobic and water-repellent chemicals. The red line indicates a scale of 5 mm. (c) An iButton integrated into a plastic frame chamber to assess intra-clothing microclimate. Left: side view; right: top view.
The physical characteristics of the fabric are summarized in Table 1. DAF and CON were similar in fabric structure, mass, thickness, air permeability under dry conditions, water absorption, diffusive residual moisture content, and thermal insulation. However, after water immersion, the air flow resistance of DAF was approximately one-fourth that of CON, indicating that DAF better maintained air permeability under damp conditions (Table 1).
Table 1.
Physical characteristics of the fabrics used in this study.
2.3. Experimental Protocol
Before the main experiment, participants underwent an incremental running test on a treadmill to determine their VO2peak. The running speed started at 12 km/h and increased by 1 km/h each minute until it reached 20 km/h, after which the incline was raised by 1% per minute until the participants reached voluntary exhaustion [23]. VO2 was averaged every 10 s during the test, and the average of the three peak VO2 values was used to determine VO2peak. The VO2peak values were used to determine individual running speeds for the prescribed relative exercise intensities in the main experiment. Exercise intensity was determined based on similar thermoregulation studies using moderate and high intensity with approximately 50 to 60% [6,24] and 70 to 80% [25,26] VO2peak, respectively. We initially planned to use 60% and 80% of VO2peak for all participants. However, based on pilot testing and participants’ self-reported ability to complete the protocol, the exercise intensities were reduced to 50% and 70% of VO2peak for five participants, while the remaining eight participants performed exercise at 60% and 80% of VO2peak. For each participant, the same exercise intensities and running speeds were used across all three garment conditions.
For the main experiments, participants completed three running trials on different days, under NU, CON, or DAF conditions, with a minimum interval of 5 days between trials. Randomization was performed by the investigator using random number generation in Microsoft Excel. Participants were instructed to refrain from strenuous exercise and consumption of caffeine and alcohol for 24 h before testing. They were also instructed to drink at least 500 mL of water the night before testing and approximately 2 h before arriving at the laboratory. Upon arrival, urine samples were collected, and hydration status was assessed by measuring urine-specific gravity. A urine-specific gravity of >1.025 was considered to indicate underhydration [27]. Participants inserted a rectal probe to assess their rectal temperature as an index of Tco. The participants wore running shorts, and their body mass (DP7800PW; Yamato, Akashi, Japan) and height (YS501-P; Sanyu, Tokyo, Japan) were measured. They did not consume fluids during the trial. A Polar heart rate (HR) monitor (H10; Polar Electro Oy, Kempele, Finland) was fitted around their chest. Skin temperature sensors were placed on seven skin sites: the upper arm, chest, thigh, lower leg, abdomen, back, and waist. The 3D-printed iButton-integrated plastic frame chamber (Figure 1c) was applied to the chest and back using a topical adhesive (collodion; Kanto Chemical, Tokyo, Japan), and the temperature and relative humidity between the skin and clothing were evaluated. Additionally, a plastic sweat capsule was affixed to the chest and back with collodion to measure local sweat rate. Subsequently, the participants wore the test garment and entered an environmental chamber (FLC-15S; Fuji Medical Science, Chiba, Japan) maintained at 32 °C and 50% relative humidity.
Participants rested for 20 min in the environmental chamber to establish baseline (BL) values of physiological variables, and BL values were recorded during the final 5 min. They then completed two 30 min treadmill running bouts separated by a 10 min break. The first bout was performed at a moderate intensity, either 50% or 60% VO2peak, and the second bout was performed at a higher intensity (i.e., +20% VO2peak), corresponding to 70% or 80% VO2peak, respectively. An electric fan was placed in front of the participants to provide controlled air movement over the body, and the wind speed, measured at chest height, was set at 0.8 m/s. After the first and second exercise bouts, the participants rested in a seated position for 10 and 20 min, respectively. The electric fan was turned off during the rest periods. Participants reported the upper-body thermal sensation, wetness, stickiness, and texture of the T-shirts, as well as wear discomfort, during each post-exercise period. At the end of the experimental protocol, the participants’ body weight was measured while wearing running shorts alone. Sweat on the running shorts was absorbed as much as possible with a dry towel before weighing.
2.4. Measurements
Rectal temperature was continuously measured using a thermistor probe (401J; Nikkiso-thermo, Tokyo, Japan) inserted 12 cm beyond the anal sphincter and recorded at 1 s intervals with a data storage device (Model N543; Nikkiso-Thermo, Tokyo, Japan). Urine-specific gravity was measured using a refractometer (UG-D; Atago, Tokyo, Japan). HR was continuously monitored using a telemetry transmitter strapped around the chest (H10; Polar Electro Oy).
Skin temperature was measured using wireless sensors (iButtons DS1922L-F5; Maxim Integrated Products, San Jose, CA, USA) affixed to seven skin sites on the chest, upper arm, thigh, lower leg, abdomen, back, and waist. Mean skin temperature was calculated using four skin temperature measurements [28]: chest, 30%; upper arm, 30%; thigh, 20%; and lower leg, 20%. Microclimate temperature and humidity between the skin and garment (i.e., undershirts or T-shirt) on the chest and back were measured using wireless sensors (iButtons DS1923-F5; Maxim Integrated Products, San Jose, CA, USA) within a plastic frame chamber (ASE Giken, Nagoya, Japan) integrated with the iButton (Figure 1c). The 3D-printed frame created a 20 mm gap between the skin and garment (13 mm + 7 mm; Figure 1c) and had an outer diameter of 25 mm with a central opening diameter of 17 mm. Sensor locations were standardized using anatomical landmarks. Before each trial, the placement sites were determined by measuring fixed distances from the bony landmarks. Skin temperature and microclimate data were recorded at 5 s intervals.
Local sweat rate was continuously measured using the ventilated capsule method. A 4.52-cm2 plastic capsule was affixed to each site with collodion (Kanto Chemical). Dry nitrogen gas was passed through each capsule over the skin surface at 1.5 L/min, and water content from the effluent air was measured using a capacitance hygrometer (HMT333; Vaisala, Helsinki, Finland). Sweat rate was recorded at 1 s intervals using a data logger system (MX100; Yokogawa, Tokyo, Japan). Whole-body sweat loss was assessed by measuring body mass loss before and after exercise.
Participants rated their thermal sensation, stickiness, texture, wetness perception, and wear discomfort at BL and the end of each exercise bout using Likert scales reported in previous studies [29,30,31,32]. Thermal sensation was scored on a scale from −10 (cool) to 25 (very hot), modified from the original scale of −10 (cool) to 20 (hot) [32] for consistency with other scales that included “very”. Wetness perception was scored on a scale from 0 (extremely dry) to 30 (extremely wet). Stickiness sensation was scored on a scale from 0 (not sticky) to 12 (extremely sticky). Texture sensation was scored on a scale from −9 (very smooth) to 9 (very rough). Wear discomfort was scored on a scale from 1 (comfortable) to 7 (very uncomfortable). The Borg scale was also used to assess perceived exertion (RPE) at the end of each exercise bout [33].
2.5. Data and Statistical Analyses
BL data were averaged over a 5 min resting period before exercise. All continuously recorded variables were averaged at 5 min intervals during exercise and post-exercise. For statistical analyses and figures, the 5 min averages immediately preceding each 10 min time point were used. Missing data occurred because of measurement failures during the experiment. Missing values were not imputed, and the linear mixed-effects models were fitted using the available observations. Linear mixed-effects models with repeated factors for time (10 levels: BL and exercise/rest bouts) and test garments (3 levels: CON, DAF, and NU) were used to analyze Tco, HR, local skin temperatures, mean skin temperature, and garment intra-microclimate. A two-way repeated-measure analysis of variance (ANOVA) with repeated factors for time (10 levels: BL and exercise/rest bouts) and test garments (3 levels: CON, DAF, and NU) was used to analyze the local sweat rate. Subjective evaluations were analyzed using a two-way repeated-measure ANOVA with the protocol stage (four levels: BL, two exercise bouts, and the end of the protocol) and test garments (3 levels: CON, DAF, and NU) as the repeated factors. A one-way repeated-measure ANOVA with repeated factors for test garments (3 levels: CON, DAF, and NU) was used to assess whole-body sweat loss among garments. The Geisser–Greenhouse correction was applied if the assumption of sphericity was violated. A normal distribution was confirmed based on a Q–Q plot assessment. Post hoc analysis was performed using the Tukey correction for multiple comparisons. The data are presented as means ± standard deviations, and statistical significance was set at 0.05. After completing data collection, all statistical analyses were performed using Prism (version 8.1.2, GraphPad Software, San Diego, CA, USA). Effect sizes for the main effects and interactions in the mixed-effects models were expressed as partial η2 [22]. Values of 0.01, 0.06, and 0.14 were interpreted as small, medium, and large effects, respectively [34]. For selected primary outcomes, estimated between-condition differences with 95% confidence intervals are provided in Supplementary Tables. The statistical analysis plan was determined before examination of the study results but was not formally preregistered. The study protocol was not prospectively registered in a public registry.
3. Results
Urine-specific gravity before the experiments did not differ among CON, DAF, and NU (p = 0.361; 1.012 ± 0.009, 1.008 ± 0.009, and 1.014 ± 0.008, respectively).
3.1. Microclimates Inside the Clothing
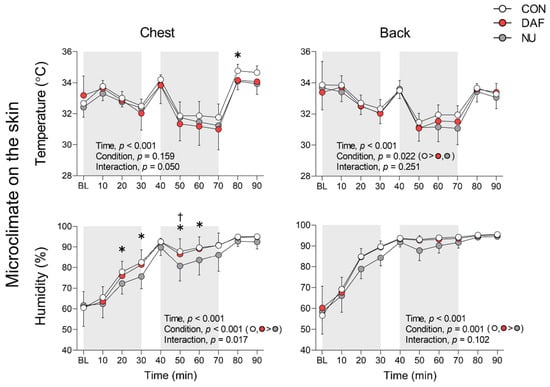
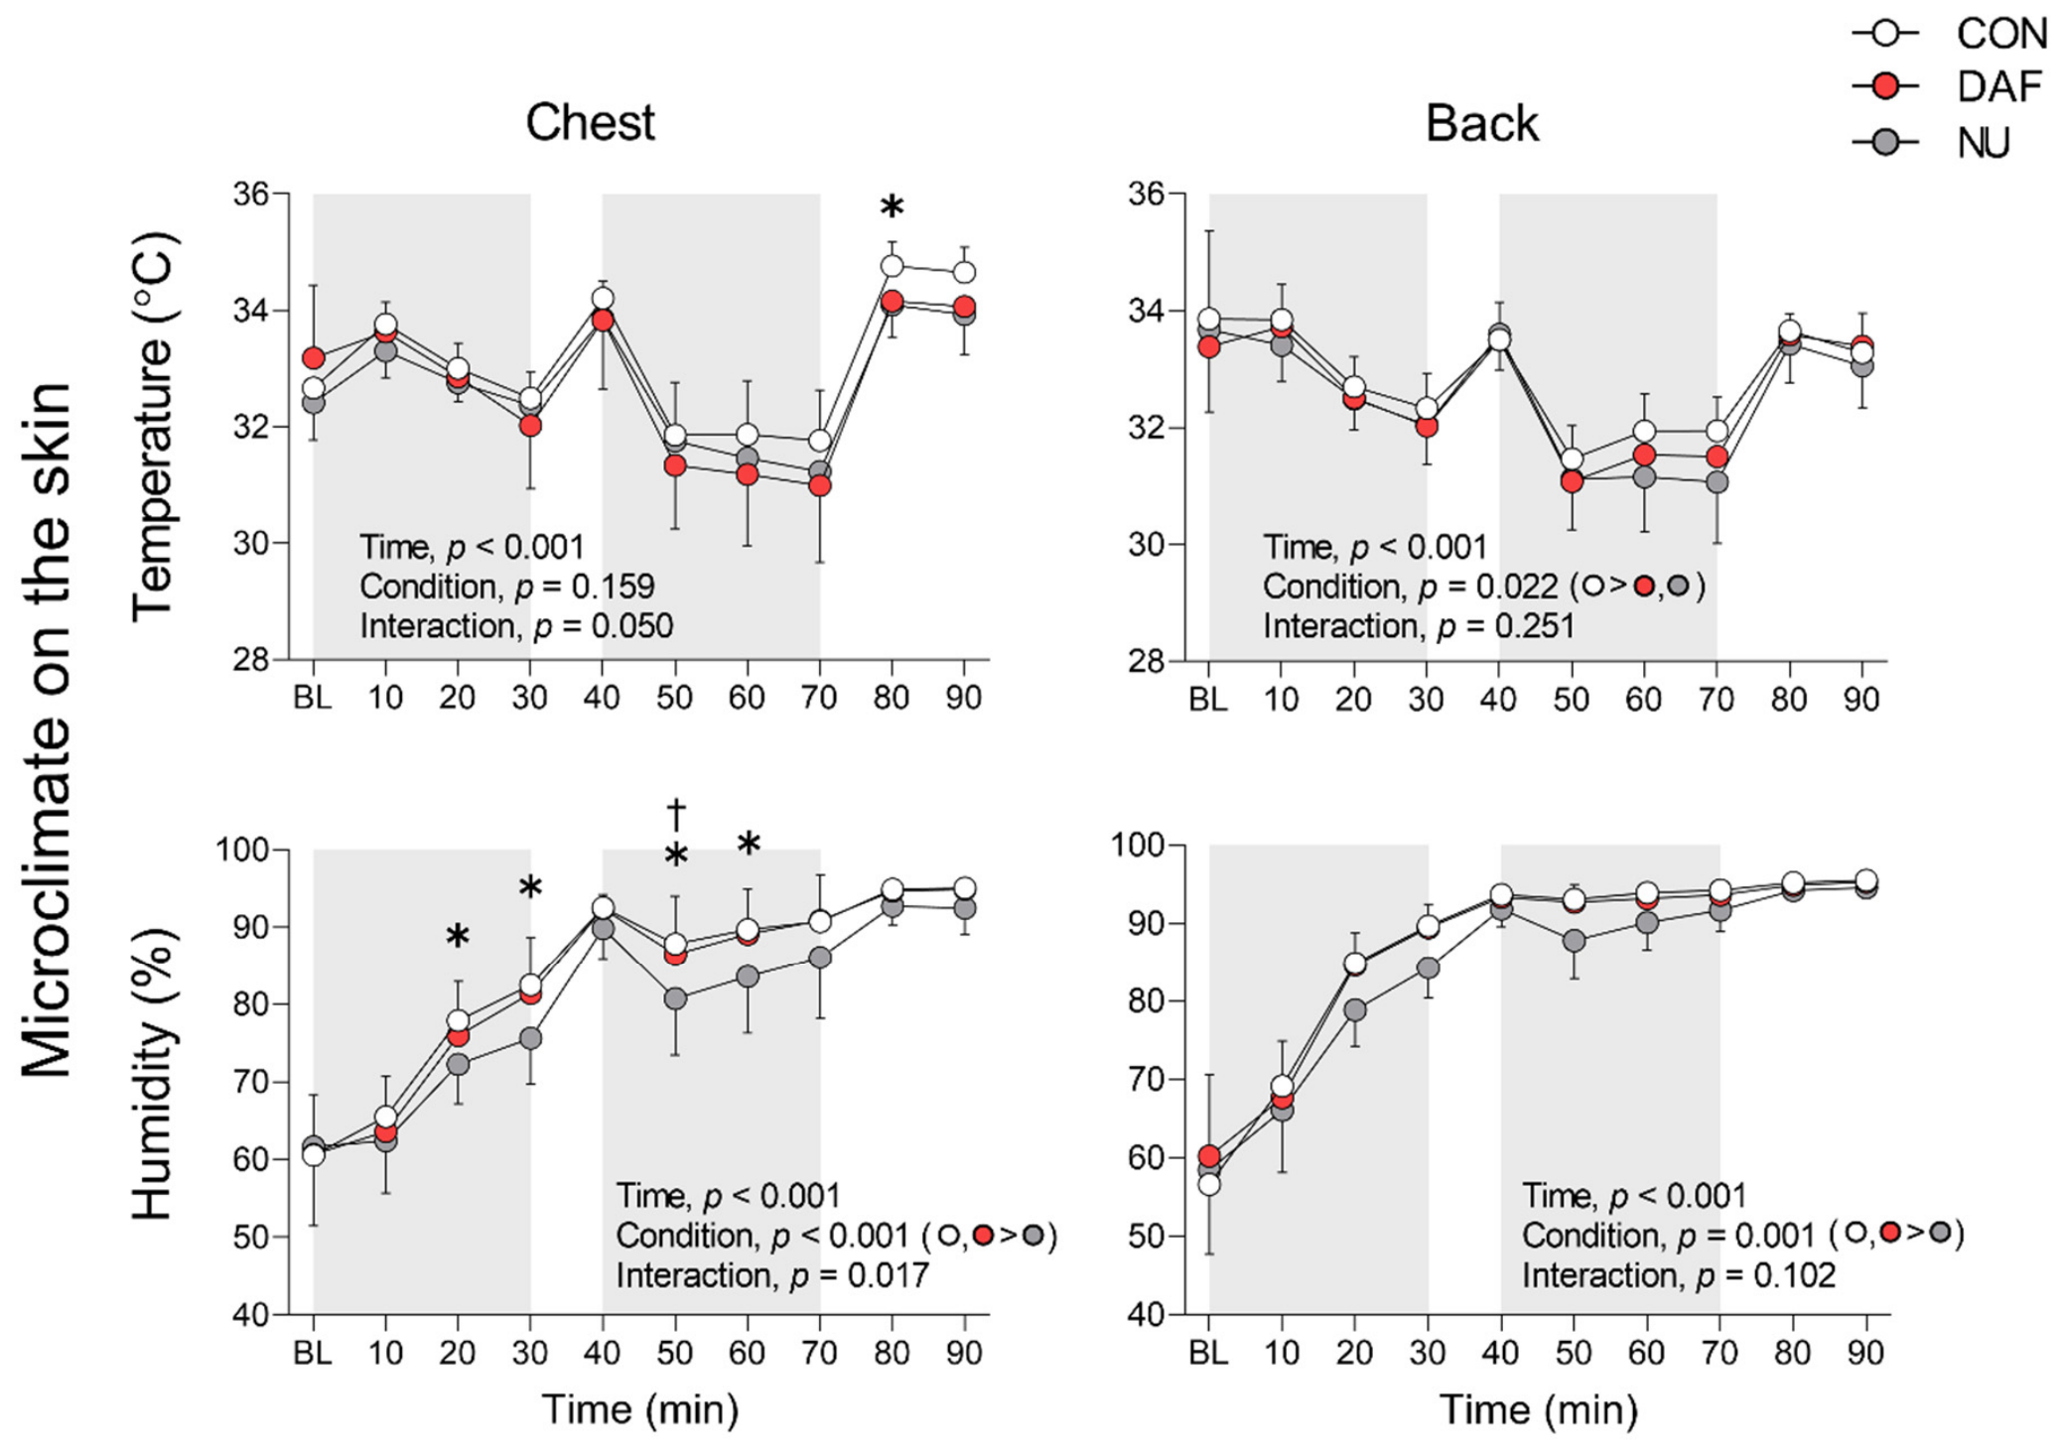
The microclimate temperature on the chest showed a significant interaction between garment and time (p = 0.050, partial η2 = 0.19), with higher values in CON than in NU at 80 min of the protocol (p = 0.011; Figure 2 and Table S1). On the back, a significant main effect of garment was observed (p = 0.022, partial η2 = 0.27), with higher values in CON than in NU (p < 0.001) and DAF (p = 0.003; Figure 2 and Table S2). The microclimate humidity on the chest showed a significant main effect of garment (p < 0.001, partial η2 = 0.58) and an interaction between garment and time (p = 0.017, partial η2 = 0.22), with higher values in CON than in NU at 20, 30, 50, and 60 min (all p ≤ 0.005) and in DAF than in NU at 50 min (p = 0.010; Figure 2 and Table S1). Back humidity showed a significant main effect of garment (p = 0.001, partial η2 = 0.44), with higher values in CON and DAF than in NU (both p < 0.001; Figure 2 and Table S2).
Figure 2.
Microclimate temperature and humidity on the chest and back. The gray area indicates exercise bouts at moderate (first bout) and high (second bout) intensities. BL, baseline; CON, control undershirt with regular T-shirt; DAF (Dry Aeroflow), breathable undershirt with regular T-shirt; and NU, no undershirt (regular T-shirt alone). Each data point represents the average over the preceding 5 min interval. *, p < 0.05, CON vs. NU; †, p < 0.05, DAF vs. NU.
3.2. Physiological Variables
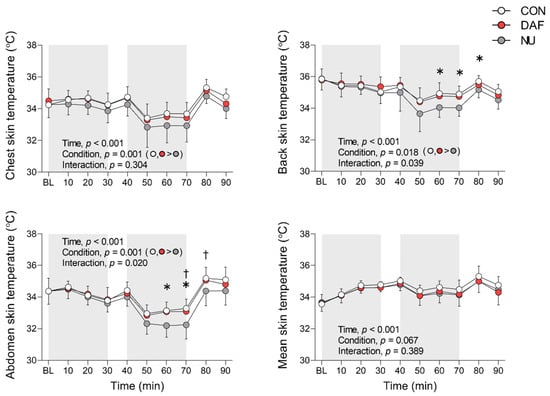
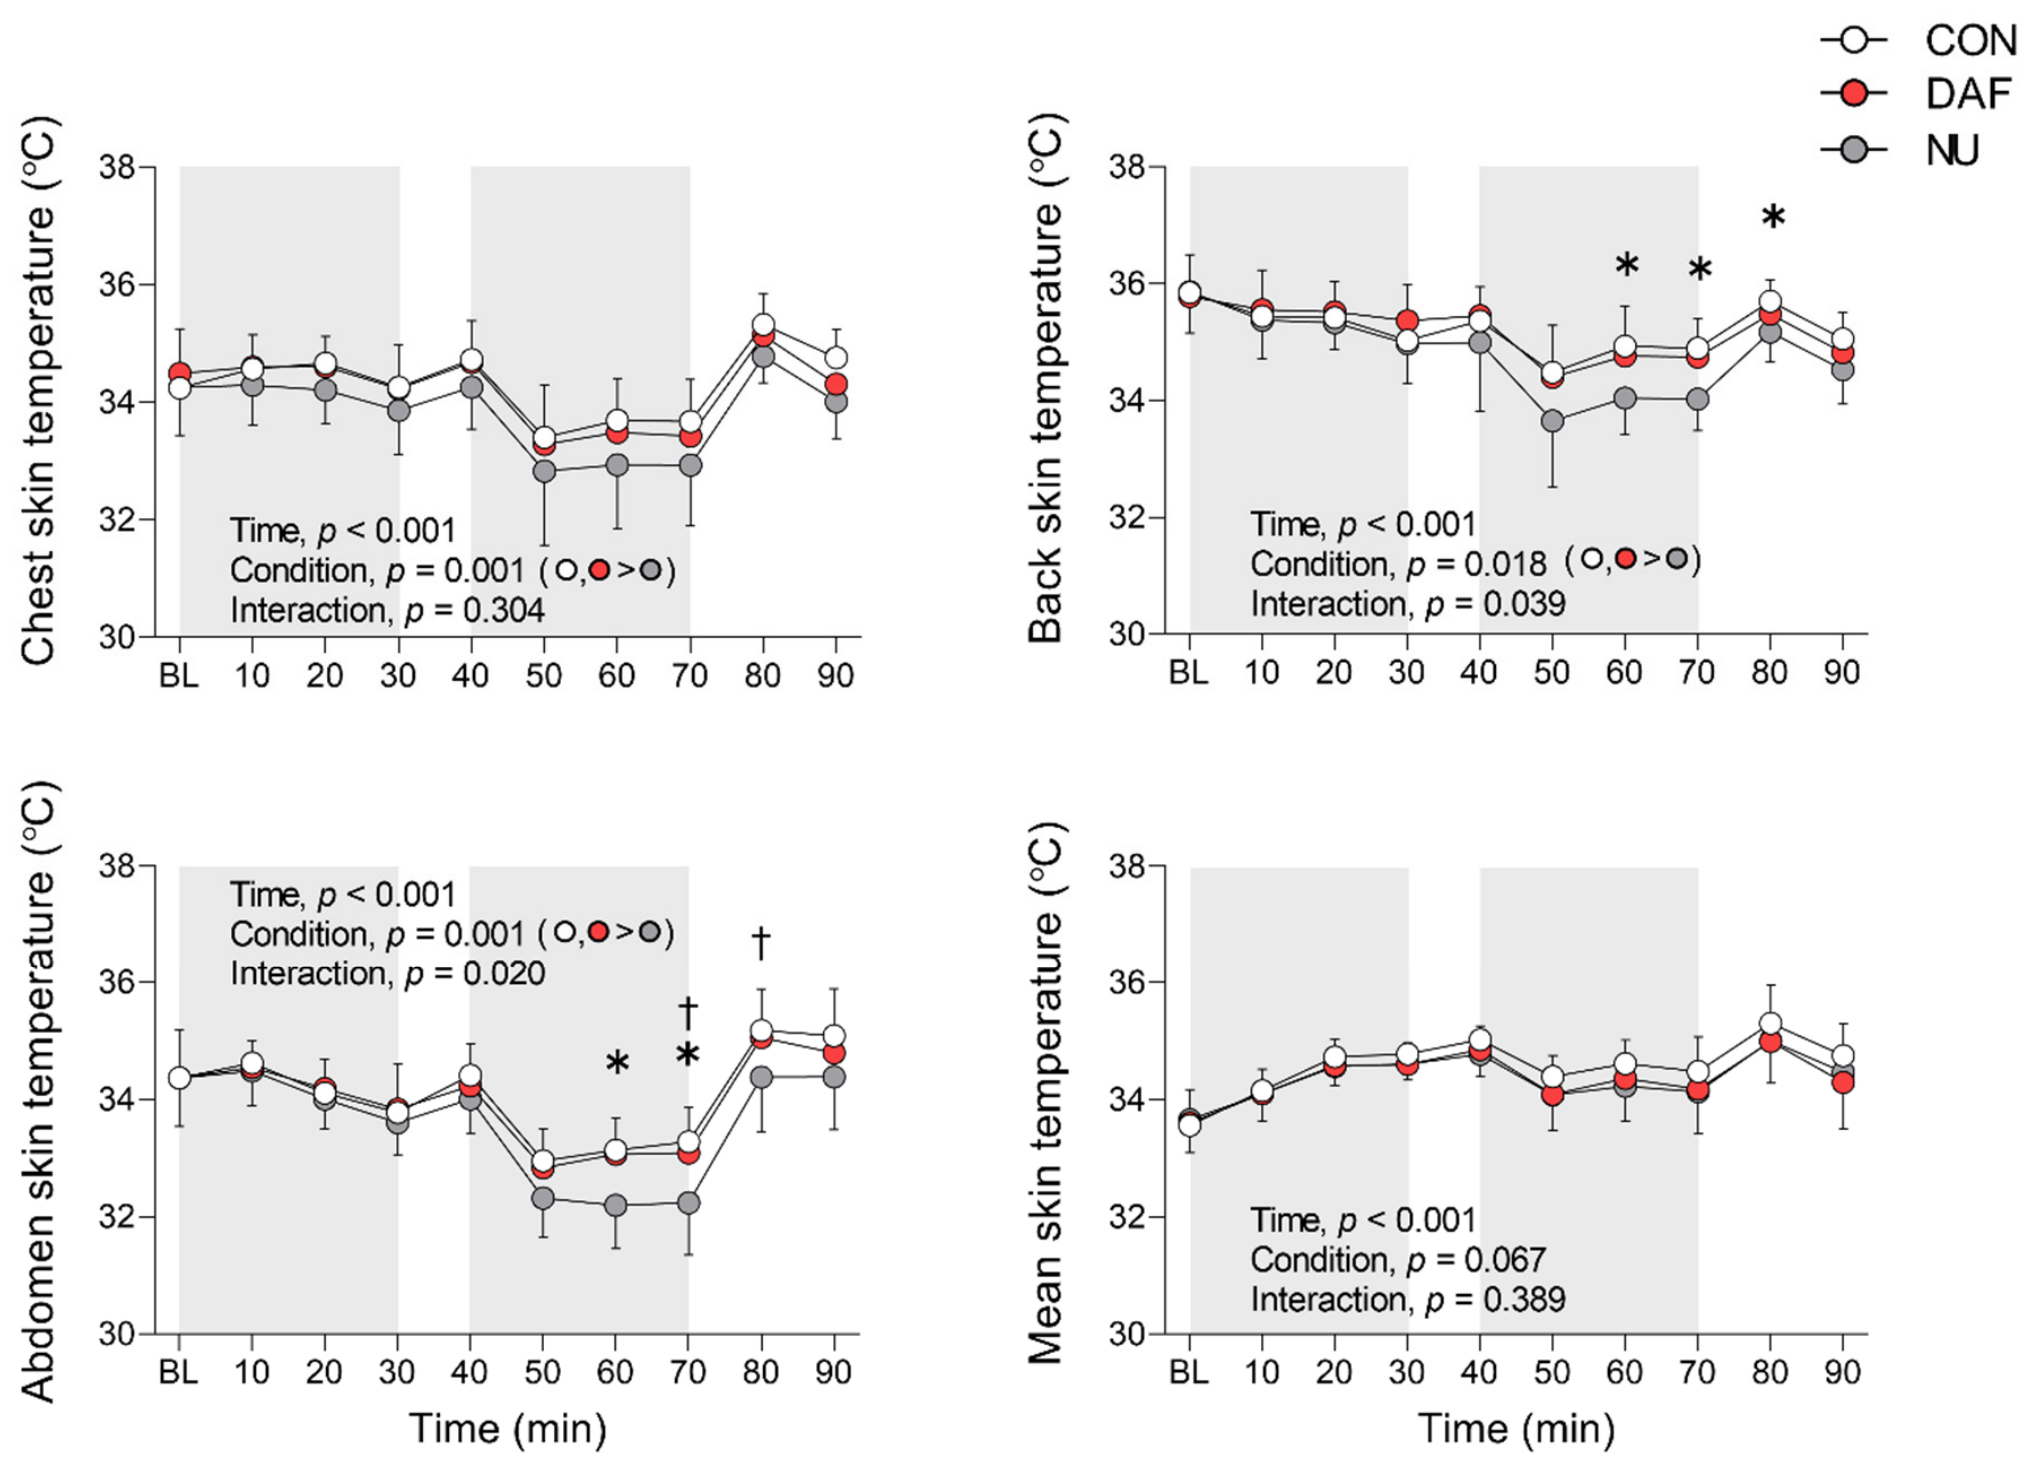
Chest skin temperature showed a significant main effect of garment (p = 0.001, partial η2 = 0.44), with higher values in CON and DAF than in NU (both p < 0.001; Figure 3 and Table S2). Back skin temperature showed a significant main effect of garment (p = 0.018, partial η2 = 0.31) and an interaction (p = 0.039, partial η2 = 0.20), with higher values in CON than in NU at 60–80 min (all p ≤ 0.041; Figure 3 and Table S1). Similarly, abdomen skin temperature showed a significant main effect of garment (p = 0.001, partial η2 = 0.46) and an interaction (p = 0.020, partial η2 = 0.21), with higher values in CON than in NU at 60 and 70 min (p ≤ 0.043) and in DAF than in NU at 70 and 80 min (p ≤ 0.010; Figure 3 and Table S1).
Figure 3.
Local and mean skin temperatures. The gray area indicates exercise bouts at moderate (first bout) and high (second bout) intensities. BL, baseline; CON, control; DAF, Dry Aeroflow; NU, No undershirt. Each data point represents the average over the preceding 5 min interval. *, p < 0.05, CON vs. NU; †, p < 0.05, DAF vs. NU.
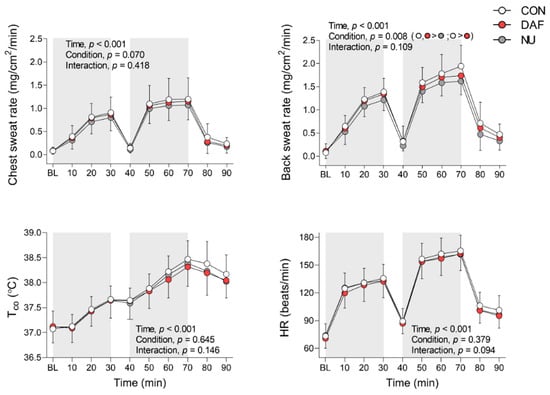
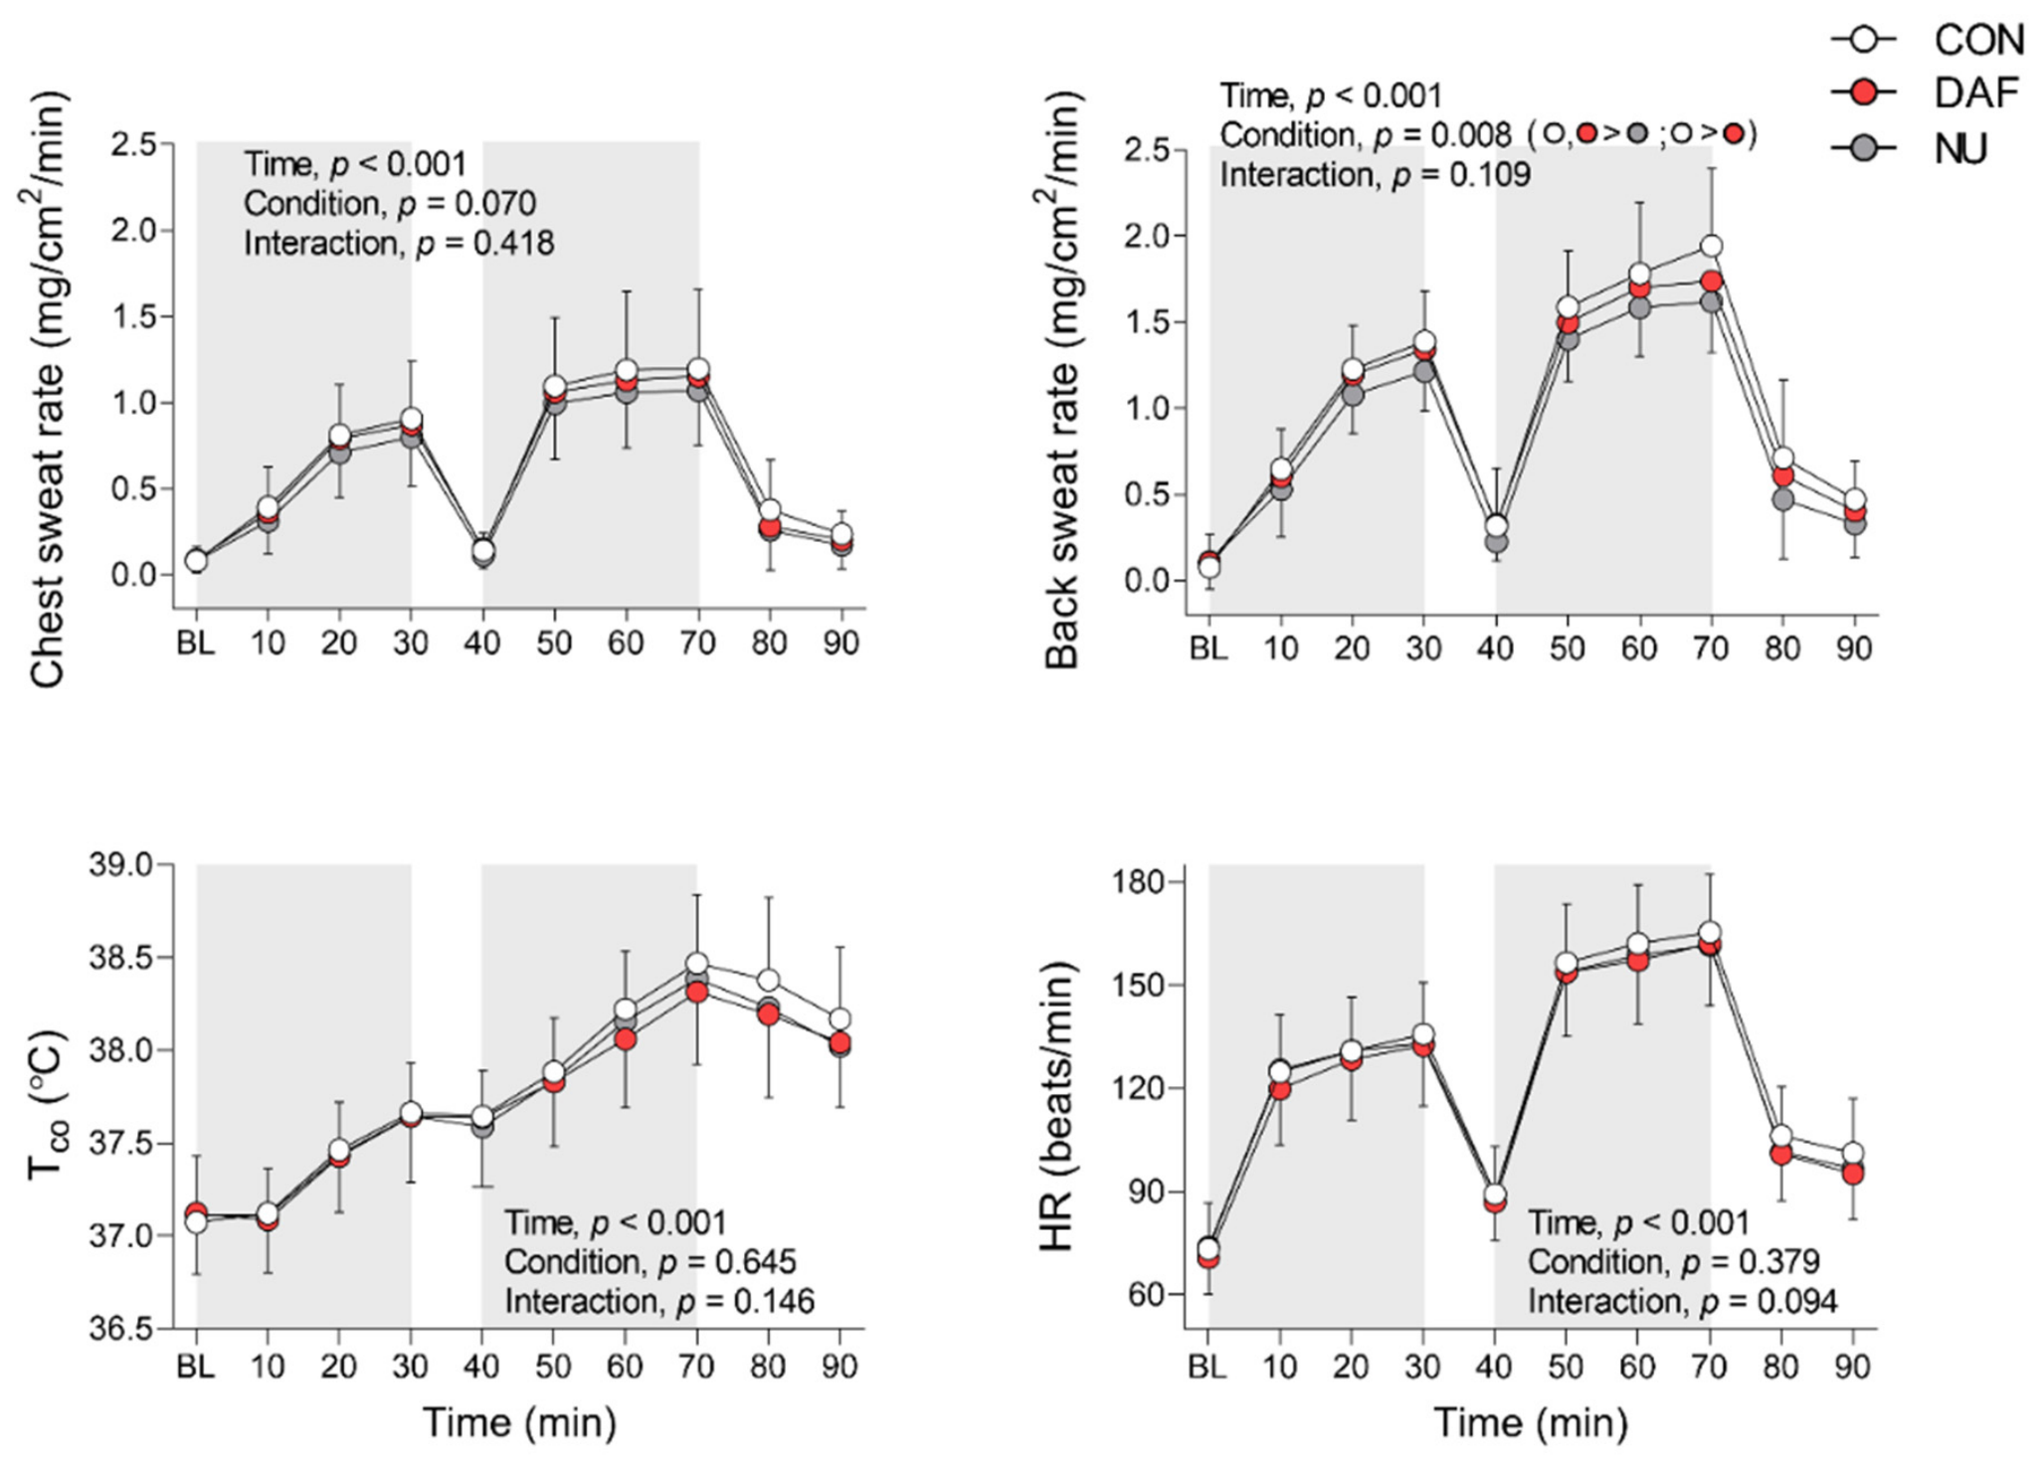
Other local and mean skin temperatures did not differ among garment conditions (all p ≥ 0.067 for the main effect of garment and the interaction; Figure 3). There was a significant main effect of garment on local sweat rate on the back (p = 0.008, partial η2 = 0.33; Figure 4), with higher rates in CON and DAF than in NU (both p < 0.001; Figure 4 and Table S2), and in CON than in DAF (p = 0.014; Figure 4 and Table S2). No differences were found among garments in Tco, HR, chest sweat rate (all p ≥ 0.070; Figure 4), or whole-body sweat loss (1.20 ± 0.18, 1.19 ± 0.25, 1.16 ± 0.19 kg for CON, DAF, and NU, respectively, p = 0.687) during exercise.
Figure 4.
Local sweat rate on the chest and back, core body temperature (Tco), heart rate (HR). The gray area indicates exercise bouts at moderate (first bout) and high (second bout) intensities. BL, baseline; CON, control; DAF, Dry Aeroflow; NU, No undershirt. Each data point represents the average over the preceding 5 min interval.
3.3. Subjective Sensations
No significant main effects of garment or interactions were observed for the perceptions of warmth, wetness, stickiness, texture, or RPE (all p ≥ 0.093; Table 2). However, a significant main effect of garment was observed for wear discomfort (p = 0.047, partial η2 = 0.25), with lower values (i.e., greater comfort) in NU than in CON (p = 0.013) and DAF (p = 0.005), and no significant difference between CON and DAF (p = 0.811; Table 2 and Table S2).
Table 2.
Perceptual responses at BL, first and second exercise bouts, and recovery.
4. Discussion
We showed that wearing undershirts increased intra-clothing humidity by 7%, local sweat rate on the back by ~0.1 mg/cm2/min, and local skin temperatures by 1.0 °C, which may attenuate wearing comfort. DAF attenuated some local responses, with lower back sweat rate and the back intra-clothing temperature than CON. No detectable differences in Tco, mean skin temperature, HR, and whole-body sweat loss were observed among clothing conditions during exercise. These results suggest that undershirt use during exercise in the heat worsens local intra-clothing environments and some local physiological responses and comfort, while undershirts with greater air permeability can partially alleviate these influences. Despite the material differences, the observed between-condition differences were mainly local, with no detectable differences in whole-body physiological responses among clothing conditions. Unlike our previous studies evaluating DAF as a single-layer T-shirt, the present study examined the effects of undershirt layering and fabric breathability on the intra-clothing microclimate and physiological responses during exercise in the heat.
4.1. Microclimates Inside the Clothing
Mechanical evaluations of fabrics have shown that two layers of the same material exhibit substantially reduced breathability (−45%) and markedly increased thermal resistance (+465%) compared with a single layer [5]. Indeed, Park and Yoo [14] reported that the addition of clothing layers (e.g., single vs. double training wear layers) elevated microclimate temperature by 1.4 °C without altering humidity under windless, temperate resting conditions. However, direct evidence quantifying changes in both temperature and humidity within the clothing microclimate under exercise conditions remains limited. We showed that the addition of an undershirt beneath a T-shirt increased intra-clothing humidity, suggesting that clothing layering can alter the local clothing microclimate even when light sportswear is worn during exercise in the heat.
Replacing the CON undershirt with DAF attenuated the elevation of intra-clothing temperature without altering the humidity. This result differs from our previous study using a single-layer DAF T-shirt, in which DAF reduced intra-clothing humidity but not intra-clothing temperature [20]. This suggests that responses associated with DAF could differ depending on how it is used. The precise reasons for the inconsistent effects of DAF on the microclimate between the undershirt and single layer T-shirt conditions remain unclear, but the difference in breathability, as indicated by wet airflow resistance (Table 1), was greater for the T-shirt than for the undershirt. In the previous studies, wet airflow resistance differed by at least 500-fold between the fabrics [20,21], whereas the difference was at least fourfold in the present study. Consequently, the potential effects of undershirt DAF on moisture transport may have been too small to affect intra-clothing humidity relative to CON. Moreover, the frontal airflow from the fan primarily contacted the outer T-shirt, thereby diminishing the direct influence of airflow on the undershirt layer, possibly limiting the functional advantage of the DAF fabric. While we were unable to explain the precise reason(s) for inconsistent effects of DAF on microclimates between undershirt and single-layer T-shirt uses, using a breathable undershirt may produce advantages in local microclimates during exercise in hot conditions.
4.2. Local and Whole-Body Physiological Responses
Wearing undershirts increased local skin temperature by 0.4–1.0 °C at specific time points, possibly associated with changes in the intra-clothing microclimate. Park and Yoo [14] demonstrated that wearing two layers of long-sleeved T-shirts at rest in a cool environment (15 °C) attenuated reductions in mean skin (0.2 °C) and Tco (0.1 °C) compared with a single layer, indicating increased thermal insulation. Moreover, during exercise in the heat, wearing more insulating clothing (work coveralls) has been shown to elevate Tco (~0.3 °C) without altering mean skin temperature [15]. In contrast to these previous studies, the lightweight sportswear and undershirt layering employed in the present study more closely reflect competitive or recreational sports conditions. Although undershirts use increased local skin temperature, these changes were not accompanied by detectable differences in mean skin temperature, Tco, or whole-body sweat loss under the present experimental conditions. Therefore, the thermoregulatory effects of wearing an undershirt under lightweight sportswear conditions were primarily localized in contrast to a long-sleeved T-shirt at rest [14] and work coveralls during exercise [15]. The present finding that the observed differences remained localized is consistent with earlier findings showing that approximately 0.5–1.0 °C differences in skin temperature induced by garment characteristics (e.g., clothing fabric, construction, material property, etc.) were not accompanied by detectable changes in Tco, HR, or whole-body sweat loss [18,35,36].
Our previous single-layer T-shirt study showed that DAF significantly reduced chest skin temperature by ~2 °C when frontal airflow directly contacted the fabric [20]. However, the undershirt differences in DAF and CON did not yield such effects. Presumably, frontal airflow primarily affects the outermost garment [37], and layering a T-shirt likely reduces airflow to the innermost fabric, thereby limiting direct ventilation of the undershirt and cooling effects of DAF. On the other hand, we observed that wearing a DAF undershirt reduced back sweat rate relative to CON. Although the physiological reasons for the observed reduction in back sweating remain unclear, the lack of differences in back skin temperature suggests that local skin temperature does not explain the reduction in sweating.
4.3. Subjective Sensations
Sweat accumulation is a major contributor to clothing discomfort by enhancing sensations of wetness and stickiness, particularly during exercise in the heat [37,38,39]. However, undershirt use did not alter thermal sensation, wetness, stickiness, or texture despite increases in local sweat rate and skin temperature. Previous studies have shown that heavier or additional clothing layers can induce perceptible changes in thermal sensation, particularly under cool or resting conditions [14,15,40]. In contrast, under the light sportswear conditions used in the present study, the exercise-induced thermal strain likely outweighed the effects of clothing layering, thereby limiting the effects of the undershirt per se. These observations provide important insights into the use of an undershirt during exercise in hot conditions, as it does not compromise perceptual thermal responses.
4.4. Practical Implications
Undershirts are worn beneath team uniforms or T-shirt in sports settings (e.g., football). Athletes may also wear undershirts to reduce clothing-skin friction, manage sweat, and improve comfort. The present study provides useful insights into the use of undershirts under light sportswear during running in the heat. Although relatively large statistical effect sizes were observed for some local responses, the absolute differences between clothing conditions were small, and their practical significance remains uncertain. Further studies are needed to determine whether these local differences have meaningful effects under real-world sporting conditions. Our observations may also contribute to optimizing sportswear design and developing evidence-based clothing recommendations for athletes.
4.5. Limitations
Several limitations should be considered. First, the participants were young, trained male runners, and the findings may not be directly generalizable to females, older adults, untrained individuals, or athletes from other sports. In addition, although exercise intensities were standardized within each participant across clothing conditions, the use of two different exercise-intensity protocols may have introduced variability in thermoregulatory responses among participants. Second, the iButton sensors were individually calibrated by the manufacturer, with a manufacturer-specified temperature accuracy of ±0.5 °C. Thus, the small differences in local skin temperature observed in the present study may have been influenced by measurement errors and should be interpreted with caution. Future studies should include additional laboratory calibration to confirm the reliability of these small differences. The 3D-printed sensor frames may have altered the local air gap between the skin and clothing. Previous studies have reported air gap thicknesses of approximately 6–13 mm for undershirts and close-fitting clothing, although these values vary depending on clothing fit and body region [41,42,43]. Since the frames were 20 mm high, they may have increased the local air gap around the sensors, potentially affecting skin–clothing contact, airflow, moisture transport, and measured temperature and humidity. Furthermore, air gap thickness and skin–clothing contact area may change dynamically during exercise due to body movement and sweat accumulation [42,44]. Therefore, the 20 mm high sensor frames may have restricted these dynamic changes, potentially affecting the measured intra-clothing temperature and humidity. Although the same measurement setup was used across all clothing conditions, the influence of the frames on the measurements cannot be excluded. Third, the evaporative resistance of the clothing assemblies, actual sweat evaporation, and garment moisture retention were not measured. Thus, we cannot determine whether differences in fabric characteristics affected sweat evaporation and subsequent evaporative heat loss. Future studies should measure these parameters to better understand the mechanisms. Finally, exercise performance was not evaluated in this study. Therefore, the practical significance of the observed local differences for exercise performance remains unclear.
5. Conclusions
Wearing undershirts, regardless of fabric type, increased intra-clothing humidity, local skin temperature, local sweat rate, and perceived wear discomfort during exercise, and DAF partially mitigated some of these increases. However, no statistical differences were detected in the measured whole-body physiological responses among garment conditions under the present experimental conditions.
Supplementary Materials
The following supporting information can be downloaded at https://www.mdpi.com/article/10.3390/textiles6040141/s1, Table S1: Post hoc comparisons at each time point; Table S2: Post hoc pairwise comparisons for the main effect of garment.
Author Contributions
Conceptualization, H.K., K.T., A.S. (Ai Shiramoto), A.S. (Atsushi Shiraishi) and T.A.; Methodology, H.K., K.T., A.S. (Ai Shiramoto), A.S. (Atsushi Shiraishi) and T.A.; Formal Analysis, H.K.; Investigation, H.K.; Resources, K.T., A.S. (Ai Shiramoto) and A.S. (Atsushi Shiraishi); Data Curation, H.K.; Writing—Original Draft Preparation, H.K. and T.A.; Writing—Review and Editing, H.K., K.T., A.S. (Ai Shiramoto), A.S. (Atsushi Shiraishi) and T.A.; Visualization, H.K.; Supervision, T.A.; Project Administration, T.A.; Funding Acquisition, T.A. All authors have read and agreed to the published version of the manuscript.
Funding
This study was supported by a grant from Mizuno Corporation and Grant-in-Aid for Scientific Research (nos. 24K02828 and 21H03317) from the Japan Society for the Promotion of Science from the Ministry of Education, Culture, Sports, Science, and Technology of Japan.
Institutional Review Board Statement
The study was conducted in accordance with the Declaration of Helsinki, and the protocol was approved by the Human Ethics Committee of Niigata University (reference #: 2021-0195) on [24 November 2022].
Informed Consent Statement
Written informed consent for participation was obtained from all participants involved in the study.
Data Availability Statement
Source data for this study are openly available at https://figshare.com/s/a64364ff0deb2869e932 (accessed on 6 February 2026).
Acknowledgments
We thank our volunteer subjects for participating in this study.
Conflicts of Interest
Kazuya Tajima, Atsushi Shiraishi, and Ai Shiramoto are employees of Mizuno Corporation. The views expressed in this manuscript do not represent those of the company. T-shirts and undershirts were supplied by Mizuno Corporation.
Abbreviations
| CON | Conventional undershirt |
| DAF | Dry Aeroflow |
| NU | No undershirt |
| Tco | Core temperature |
| VO2peak | Peak oxygen uptake |
| Partial η2 | Partial eta squared |
| BL | Baseline |
| HR | Heart rate |
| RPE | Perceived exertion |
| ANOVA | Analysis of variance |
References
- Havenith, G.; Richards, M.G.; Wang, X.; Brode, P.; Candas, V.; den Hartog, E.; Holmer, I.; Kuklane, K.; Meinander, H.; Nocker, W. Apparent latent heat of evaporation from clothing: Attenuation and “heat pipe” effects. J. Appl. Physiol. 2008, 104, 142–149. [Google Scholar] [CrossRef] [Scilit]
- Berglund, L.G.; Gonzalez, R.R. Evaporation of sweat from sedentary man in humid environments. J. Appl. Physiol. 1977, 42, 767–772. [Google Scholar] [CrossRef] [Scilit]
- Dai, X.Q.; Imamura, R.; Liu, G.L.; Zhou, F.P. Effect of moisture transport on microclimate under T-shirts. Eur. J. Appl. Physiol. 2008, 104, 337–340. [Google Scholar] [CrossRef] [Scilit]
- Epps, H.H. Insulation Characteristics of Fabric Assemblies. J. Coat. Fabr. 1988, 17, 212–218. [Google Scholar] [CrossRef] [Scilit]
- Laing, R.M.; Gore, S.E.; Wilson, C.A.; Carr, D.J.; Niven, B.E. Standard Test Methods Adapted to Better Simulate Fabrics in Use. Text. Res. J. 2010, 80, 1138–1150. [Google Scholar] [CrossRef] [Scilit]
- Davis, J.; Laurent, C.; Allen, K.; Zhang, Y.; Stolworthy, N.; Welch, T.; Nevett, M. Influence of clothing on thermoregulation and comfort during exercise in the heat. J. Strength Cond. Res. 2017, 31, 3435–3443. [Google Scholar] [CrossRef] [Scilit]
- Varadaraju, R.; Srinivasan, J. Design of sports clothing for hot environments. Appl. Ergon. 2019, 80, 248–255. [Google Scholar] [CrossRef] [Scilit]
- Ozkan, E.T.; Kaplangiray, B.; Sekir, U.; Sahin, S. Effect of different garments on thermophysiological and psychological comfort properties of athletes in a wear trial test. Sci. Rep. 2023, 13, 14883. [Google Scholar] [CrossRef] [Scilit]
- Ioannou, L.G.; Tsoutsoubi, L.; Gkiata, P.; Brown, H.A.; Periard, J.D.; Mekjavic, I.B.; Kenny, G.P.; Nybo, L.; Flouris, A.D. Effect of sportswear on performance and physiological heat strain during prolonged running in moderately hot conditions. Scand. J. Med. Sci. Sports 2024, 34, e14520. [Google Scholar] [CrossRef] [Scilit]
- Nielsen, R.; Endrusick, T.L. Thermoregulatory responses to intermittent exercise are influenced by knit structure of underwear. Eur. J. Appl. Physiol. 1990, 60, 15–25. [Google Scholar] [CrossRef] [Scilit]
- Bakkevig, M.K.; Nielsen, R. The impact of activity level on sweat accumulation and thermal comfort using different underwear. Ergonomics 1995, 38, 926–939. [Google Scholar] [CrossRef] [Scilit]
- Ha, M.; Tokura, H.; Gotoh, J.; Holmér, I. Effects of Two Kinds of Underwear on Metabolic Heat Production during 60 Min Recovery after 30 Min Severe Exercise in the Cold. Appl. Hum. Sci. 1998, 17, 173–179. [Google Scholar] [CrossRef] [Scilit]
- Park, S.-J.; Chang, J.-H.; Tokura, H. Thermophysiological Responses to the Alternation of Exercise and Rest at 20 °C when Wearing Underwear made of Cotton or Wool. Int. J. Hum. Ecol. 2005, 6, 1–9. [Google Scholar]
- Park, J.; Yoo, S. Layering Effects on Clothing Microclimate, Clothing Insulation and Physiological Responses. Int. J. Hum. Ecol. 2013, 14, 93–103. [Google Scholar] [CrossRef] [Scilit]
- Stapleton, J.M.; Hardcastle, S.G.; Kenny, G.P. The influence of activewear worn under standard work coveralls on whole-body heat loss. J. Occup. Environ. Hyg. 2011, 8, 652–661. [Google Scholar] [CrossRef] [Scilit]
- Geršak, J.; Marčič, M. The Effect of Clothing on Thermoregulatory Responses of Human Body in a Hot Environment. J. Fiber Bioeng. Inf. 2017, 10, 1–12. [Google Scholar] [CrossRef] [Scilit]
- Houghton, L.A.; Dawson, B.; Maloney, S.K. Effects of wearing compression garments on thermoregulation during simulated team sport activity in temperate environmental conditions. J. Sci. Med. Sport 2009, 12, 303–309. [Google Scholar] [CrossRef] [Scilit]
- Roberts, B.C.; Waller, T.M.; Caine, M.P. Thermoregulatory Response to Base-layer Garments During Treadmill Exercise. Int. J. Sports Sci. Eng. 2007, 1, 29–38. [Google Scholar]
- Ayres, B.; White, J.; Hedger, W.; Scurr, J. Female upper body and breast skin temperature and thermal comfort following exercise. Ergonomics 2013, 56, 1194–1202. [Google Scholar] [CrossRef] [Scilit]
- Kato, H.; Okamoto, Y.; Otsuka, J.; Tajima, K.; Shiraishi, A.; Shiramoto, A.; Amano, T. Wearing a breathable T-shirt does not affect thermoregulatory responses during exercise under hot conditions. Hum. Factors Ergon. Manuf. Serv. Ind. 2024, 34, 471–480. [Google Scholar] [CrossRef] [Scilit]
- Kato, H.; Okamoto, Y.; Otsuka, J.; Yokoyama, S.; Oshima, S.; Tajima, K.; Shiraishi, A.; Shiramoto, A.; Amano, T. Does wearing a breathable T-shirt improve the microclimate and thermoregulatory responses during a hot outdoor running? Fash. Text. 2025, 12, 15. [Google Scholar] [CrossRef] [Scilit]
- Lakens, D.; Caldwell, A.R. Simulation-Based Power Analysis for Factorial Analysis of Variance Designs. Adv. Methods Pract. Psychol. Sci. 2021, 4, 1–14. [Google Scholar] [CrossRef] [Scilit]
- Wadsworth, D.P.; Walmsley, A.; Rowlands, D.S. Aquatitan garments extend joint range of motion without effect on run performance. Med. Sci. Sports Exerc. 2010, 42, 2273–2281. [Google Scholar] [CrossRef] [Scilit]
- De Sousa, J.; Cheatham, C.; Wittbrodt, M. The effects of a moisture-wicking fabric shirt on the physiological and perceptual responses during acute exercise in the heat. Appl. Ergon. 2014, 45, 1447–1453. [Google Scholar] [CrossRef] [Scilit]
- Periard, J.D.; Thompson, M.W.; Caillaud, C.; Quaresima, V. Influence of heat stress and exercise intensity on vastus lateralis muscle and prefrontal cortex oxygenation. Eur. J. Appl. Physiol. 2013, 113, 211–222. [Google Scholar] [CrossRef] [Scilit]
- Sperlich, B.; Born, D.-P.; Lefter, M.D.; Holmberg, H.-C. Exercising in a Hot Environment: Which T-shirt to Wear? Wilderness Environ. Med. 2013, 24, 211–220. [Google Scholar] [CrossRef] [Scilit]
- Kenefick, R.W.; Cheuvront, S.N. Hydration for recreational sport and physical activity. Nutr. Rev. 2012, 70, S137–S142. [Google Scholar] [CrossRef] [Scilit]
- Ramanathan, N.L. A new weighting system for mean surface temperature of the human body. J. Appl. Physiol. 1964, 19, 531–533. [Google Scholar] [CrossRef] [Scilit]
- Raccuglia, M.; Hodder, S.; Havenith, G. Human wetness perception in relation to textile water absorption parameters under static skin contact. Text. Res. J. 2017, 87, 2449–2463. [Google Scholar] [CrossRef] [Scilit]
- Raccuglia, M.; Heyde, C.; Lloyd, A.; Hodder, S.; Havenith, G. Spatial and temporal migration of sweat: From skin to clothing. Eur. J. Appl. Physiol. 2018, 118, 2155–2169. [Google Scholar] [CrossRef] [Scilit]
- Raccuglia, M.; Pistak, K.; Heyde, C.; Qu, J.; Mao, N.; Hodder, S.; Havenith, G. Human wetness perception of fabrics under dynamic skin contact. Text. Res. J. 2018, 88, 2155–2168. [Google Scholar] [CrossRef] [Scilit]
- Raccuglia, M.; Sales, B.; Heyde, C.; Havenith, G.; Hodder, S. Clothing comfort during physical exercise-Determining the critical factors. Appl. Ergon. 2018, 73, 33–41. [Google Scholar] [CrossRef] [Scilit]
- Borg, G. Perceived exertion as an indicator of somatic stress. J. Rehabil. Med. 1970, 2, 92–98. [Google Scholar] [CrossRef] [Scilit]
- Cohen, J. Statistical Power Analysis for the Behavioral Sciences; Lawrence Erlbaum Associates: Hillsdale, NJ, USA, 1988. [Google Scholar] [CrossRef] [Scilit]
- Ha, M.; Tokura, H.; Yanai, Y.; Moriyama, T.; Tsuchiya, N. Combined effects of fabric air permeability and moisture absorption on clothing microclimate and subjective sensation during intermittent exercise at 27 degrees C. Ergonomics 1999, 42, 964–979. [Google Scholar] [CrossRef] [Scilit]
- Gonzales, B.R.; Hagin, V.; Guillot, R.; Placet, V.; Groslambert, A. Effects of polyester jerseys on psycho–physiological responses during exercise in a hot and moist environment. J. Strength Cond. Res. 2011, 25, 3432–3438. [Google Scholar] [CrossRef] [Scilit]
- Havenith, G. Interaction of Clothing and Thermoregulation. Exog. Dermatol. 2002, 1, 221–230. [Google Scholar] [CrossRef] [Scilit]
- Fukazawa, T.; Havenith, G. Differences in comfort perception in relation to local and whole body skin wettedness. Eur. J. Appl. Physiol. 2009, 106, 15–24. [Google Scholar] [CrossRef] [Scilit]
- Gerrett, N.; Redortier, B.; Voelcker, T.; Havenith, G. A comparison of galvanic skin conductance and skin wettedness as indicators of thermal discomfort during moderate and high metabolic rates. J. Therm. Biol. 2013, 38, 530–538. [Google Scholar] [CrossRef] [Scilit]
- Corbett, J.; Barwood, M.J.; Tipton, M.J. Physiological cost and thermal envelope: A novel approach to cycle garment evaluation during a representative protocol. Scand. J. Med. Sci. Sports 2015, 25, 152–158. [Google Scholar] [CrossRef] [Scilit]
- Psikuta, A.; Frackiewicz-Kaczmarek, J.; Frydrych, I.; Rossi, R. Quantitative evaluation of air gap thickness and contact area between body and garment. Text. Res. J. 2012, 82, 1405–1413. [Google Scholar] [CrossRef] [Scilit]
- Frackiewicz-Kaczmarek, J.; Psikuta, A.; Bueno, M.-A.; Rossi, R.M. Air gap thickness and contact area in undershirts with various moisture contents: Influence of garment fit, fabric structure and fiber composition. Text. Res. J. 2015, 85, 2196–2207. [Google Scholar] [CrossRef] [Scilit]
- Młynarczyk, M.; Orysiak, J.; Jankowski, J. Effect of Workwear Fit on Thermal Insulation: Assessment Using 3D Scanning Technology. Materials 2025, 18, 2098. [Google Scholar] [CrossRef] [Scilit]
- Mert, E.; Psikuta, A.; Arévalo, M.; Charbonnier, C.; Luible-Bär, C.; Bueno, M.-A.; Rossi, R.M. A validation methodology and application of 3D garment simulation software to determine the distribution of air layers in garments during walking. Measurement 2018, 117, 153–164. [Google Scholar] [CrossRef] [Scilit]

Disclaimer/Publisher’s Note: The statements, opinions and data contained in all publications are solely those of the individual author(s) and contributor(s) and not of MDPI and/or the editor(s). MDPI and/or the editor(s) disclaim responsibility for any injury to people or property resulting from any ideas, methods, instructions or products referred to in the content. |
© 2026 by the authors. Licensee MDPI, Basel, Switzerland. This article is an open access article distributed under the terms and conditions of the Creative Commons Attribution (CC BY) license.