


Abstract
When glass filaments are bundled as a yarn and impregnated with a polymer, the analysis of the strength distribution becomes complex, as filament load-sharing and coating efficiency govern rupture, especially under alkali attack. This study investigates the tensile strength and its statistical characteristics of acrylic-impregnated E-glass yarns, containing 4200 filaments of 17 μm in diameter and a polymer content of 17%, before and after alkaline exposure, along with the corresponding uncoated yarn. The tensile strength of the uncoated yarn is found to be lower than that estimated for a single filament, with a gradual reduction in stiffness due to progressive filament failure originating at 40% of the yarn strength. Both the uncoated and impregnated yarns exhibited Weibull strength distributions, with the latter having a substantially higher Weibull modulus. Importantly, the coating leads to yarn strength much beyond that of the greige and about 10% higher than the estimated single filament strength while maintaining the stiffness up to failure, indicating that the polymer matrix governs filament load-sharing and failure. This could be attributed to the higher Weibull modulus of the impregnated yarn (i.e., 18 for coated yarn versus 9 and 7 for the greige and single filament, respectively). The impregnated yarns were also tested after exposure to an alkaline solution with pH 13 for 7, 28, and 56 days. Such attack caused only marginal strength loss after 7 days but later reduced the mean yarn strength by 33% after 56 days. Despite such degradation, the elastic modulus, coefficient of variation of the strength, and Weibull modulus remained unchanged throughout the exposure period. The results suggest that alkaline exposure predominantly leads to propagation of existing flaws rather than introducing new, larger defects. The findings through the Weibull analysis demonstrate that polymer-impregnation of E-glass yarn increases strength, lowers variability and promotes stiffness retention until rupture. Moreover, alkaline degradation shifts the strength distribution toward lower values without substantially increasing its scatter.
1. Introduction
Understanding the statistical distribution of textile yarn characteristics is crucial for the efficient design of textile-reinforced composites. In the case of brittle materials, such as glass, the tensile strength is governed by the growth of flaws, and, consequently, the statistical distribution of their strength depends considerably on the distribution and magnitude of the flaws [1,2,3,4]. In the case of filament bundles (i.e., yarns), the statistical distribution of tensile strength, with equal load-sharing, is likely to transition from Weibull to Gaussian as the number of filaments tends to infinity [5]. Consequently, expressions for estimating the mean strength and standard deviation of yarns can be derived using the Weibull parameters of the filaments. This theory has been extended to glass-reinforced composites by Rosen [6], considering the bundle of brittle filaments to be embedded in a matrix of lower strength and stiffness, typical of impregnated yarns and fiber-reinforced polymers. Despite the challenges associated with the modelling of the local load-sharing (LLS) mechanisms, it has been shown that the strength of impregnated fiber bundles can be adequately represented by a Weibull distribution [7,8,9,10,11].
More importantly, glass filaments are susceptible to chemical degradation when exposed to acidic or alkaline environments. Such degradation involves dissolution and alteration of the silica network, which progressively deteriorates their properties and load-carrying capacity. Experimental work by Evans et al. [12] on uncoated E-glass fiber bundles exposed to acidic environments demonstrated a progressive reduction in both bundle strength and elastic modulus as exposure time increased. However, no consistent trend was observed in the Weibull modulus of the filaments estimated from the strength data, and it remained comparable to that of as-received filaments. Similarly, studies on the influence of alkaline degradation have shown a reduction in strength with ageing; however, the effect on the Weibull modulus remains inconclusive, and in most cases, it was found to be similar to that of as-received filaments [13,14,15]. This suggests that the influence of chemical degradation on the statistical variability of filament strength is complex. Furthermore, reports in the literature focus primarily on the statistical strength of individual filaments, whereas the effect of degradation on the statistical strength distribution of yarns, uncoated or impregnated, has received little attention.
The present study investigates the mechanical properties and their statistical distribution in acrylic-coated E-glass yarns, along with the (greige) uncoated yarns. Furthermore, the effects of alkali-induced degradation, representative of cementitious systems, on coated yarns are assessed to understand the influence on strength, as well as its statistical distribution.
2. Experimental Studies
2.1. Yarns Tested
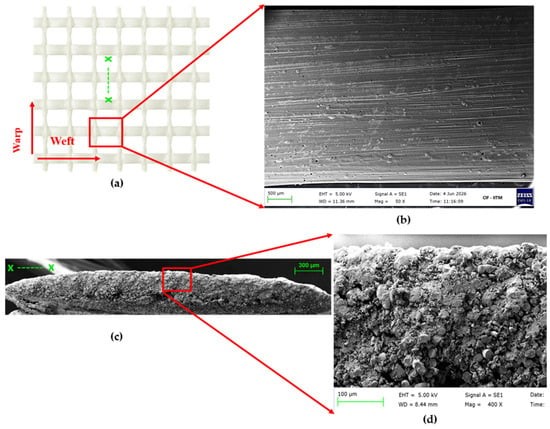
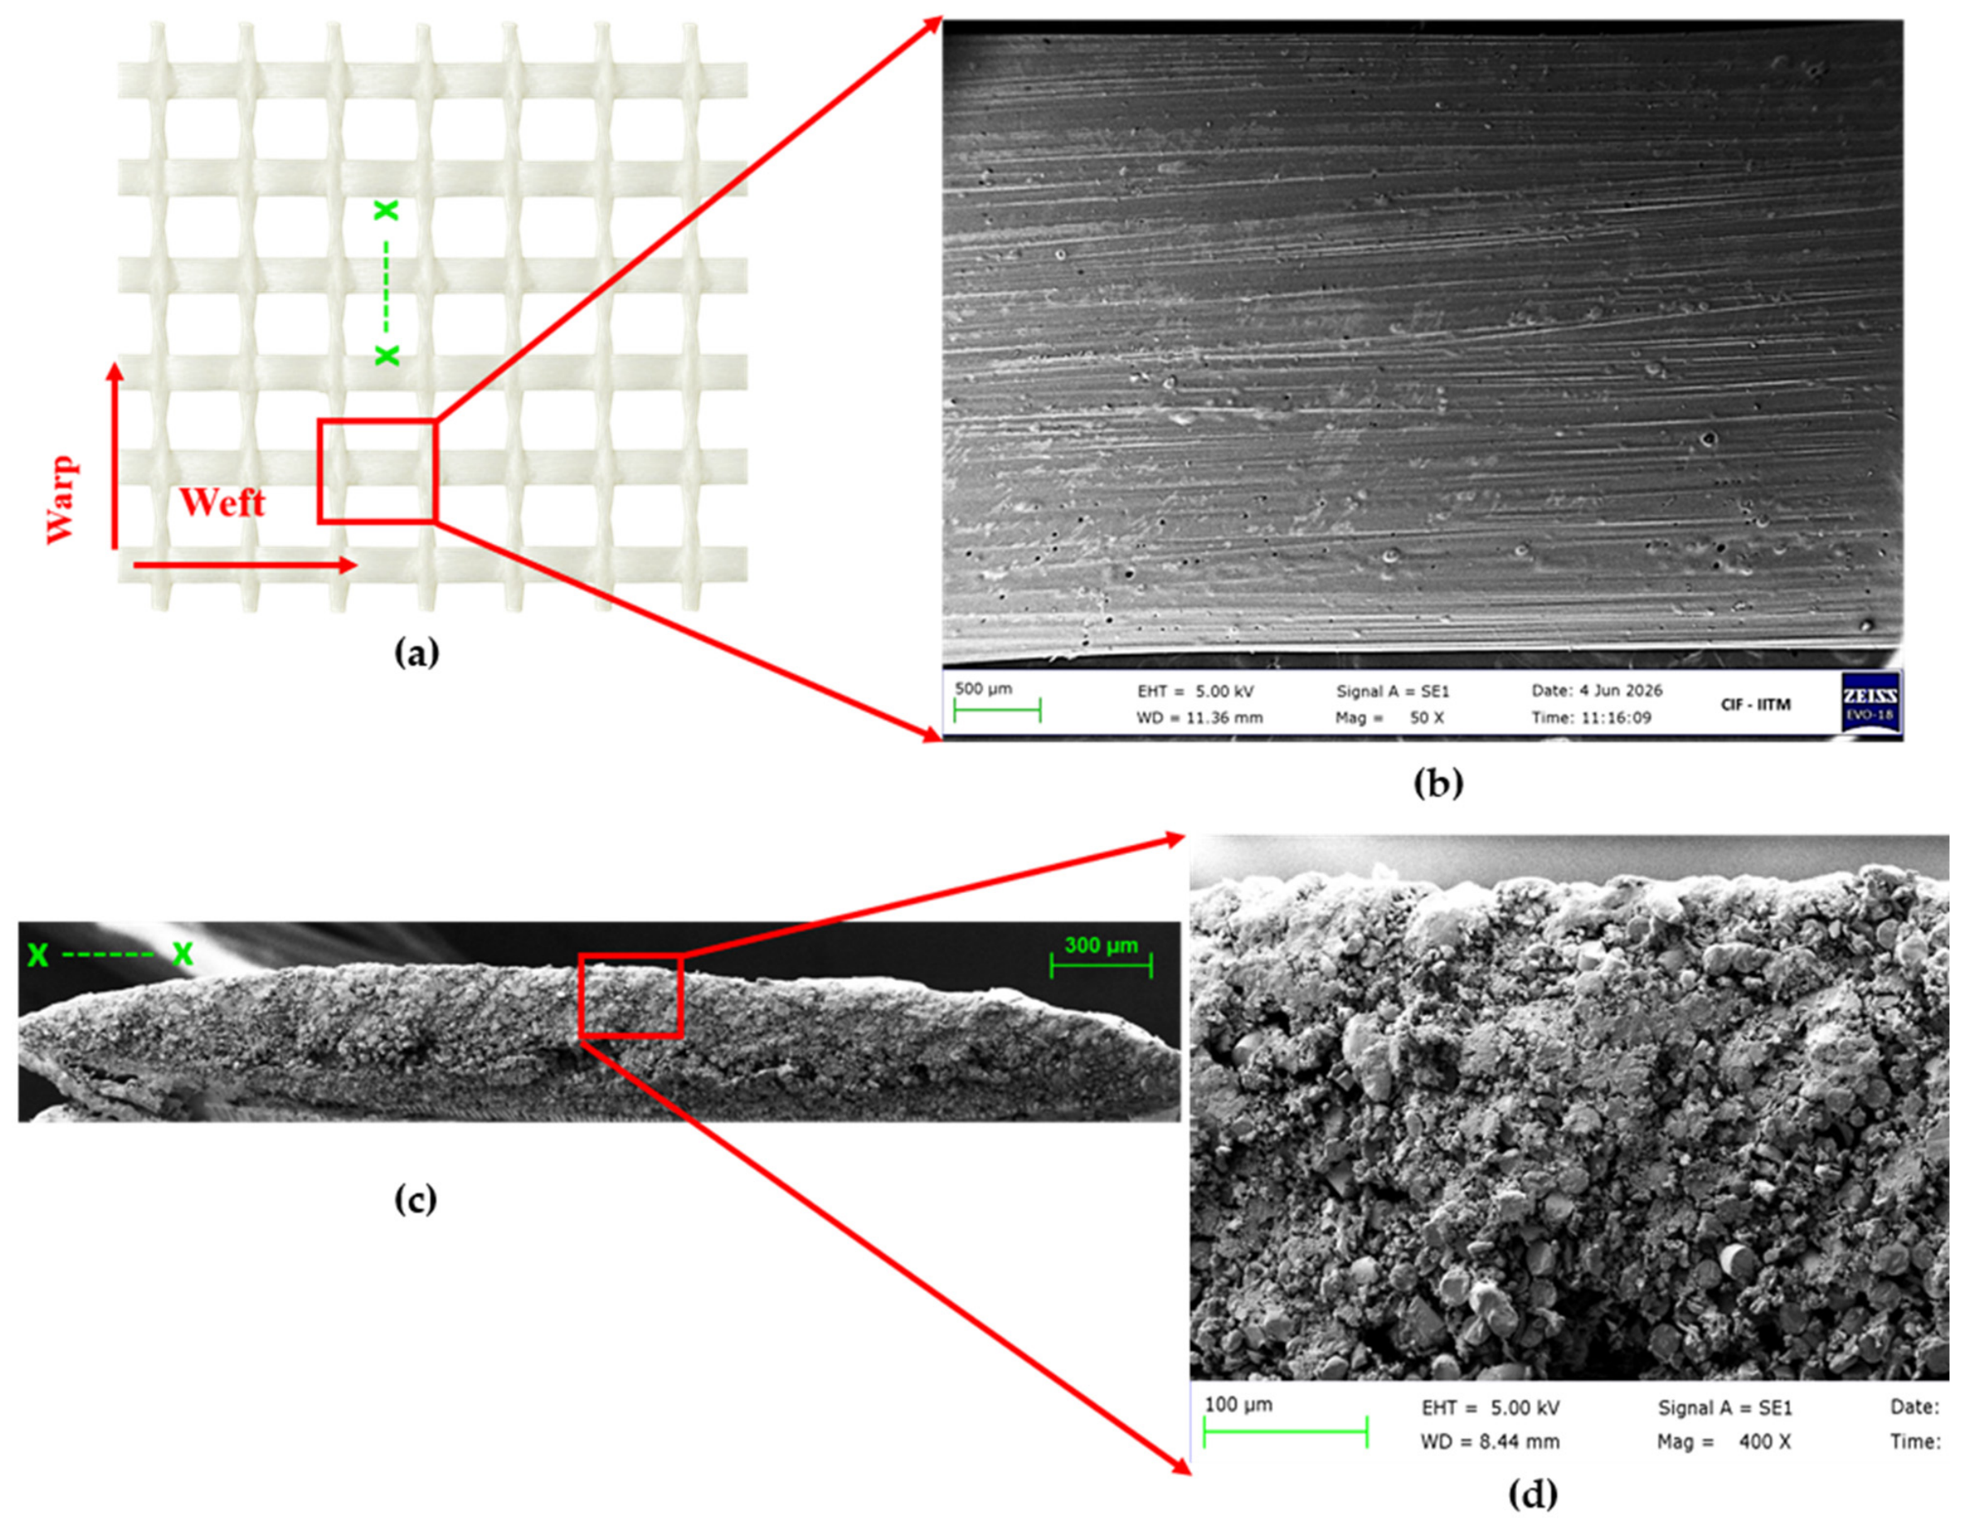
Acrylic-coated E-CR (Electrical Corrosion-resistant) glass textiles (of which the weft yarns are tested), along with the corresponding greige (uncoated glass yarns), are considered in this study. The uncoated yarn, in spool form, and the coated textiles, in rolls, were procured from Montex Glass Fibre Industries Pvt. Ltd., Mumbai, India, who state the yarn supplier to be Owens Corning, and that the woven textile was coated with acrylic-based polymer. The cross-sectional area of the uncoated yarn is obtained by dividing the Tex by the density of glass (i.e., 2.54 g/cc). The filament diameter was determined by scanning electron microscopy (SEM), and the number of filaments is estimated by dividing the average cross-sectional area of the uncoated yarn by that of a filament, which yields an approximate filament count of 4200. For SEM imaging, the yarn is cut and mounted on a metal stub with carbon tape, ensuring that the cross-section is perpendicular to the electron beam. The yarn is then coated with a gold–palladium coating to make it conductive for SEM imaging. The diameters of ten filaments from a single yarn are measured and averaged. Further, the coating amount of the coated yarn is calculated from the mass loss upon exposing the yarn to 600 °C for 1 h. A minimum of three samples is tested and averaged to obtain the polymer percentage. The average coating percentage was found to be 17% in this case, and it compares well with that obtained from the difference in the masses of the coated and uncoated yarns. The physical characteristics of the yarns from the coated textile and the uncoated yarn are presented in Table 1. The coating, in addition to covering the exterior surface of the yarn (see Figure 1a,b), impregnates and constitutes the matrix for a composite response (Figure 1c). Figure 1a shows the textile in as-received condition, with the surface having microscopic defects that show up as black dots in Figure 1b (more prominently visible in the bottom left). The SEM image (secondary electron mode) of the cross-section marked as X-X in Figure 1a is shown in Figure 1c, where the absence of a thick polymer on the outer surface is evident. Nevertheless, the close-up view in Figure 1d shows the circular filaments to be well-embedded in the polymer matrix, though with some interstitial voids.
Table 1.
Physical characteristics of the coated yarns.
Figure 1.
(a) Photograph of acrylic polymer-coated E-glass textile, and SEM images of the (b) surface and (c) cross-section of the coated yarn, and (d) close-up SEM image of the yarn cross-section.
2.2. Tensile Test Protocol
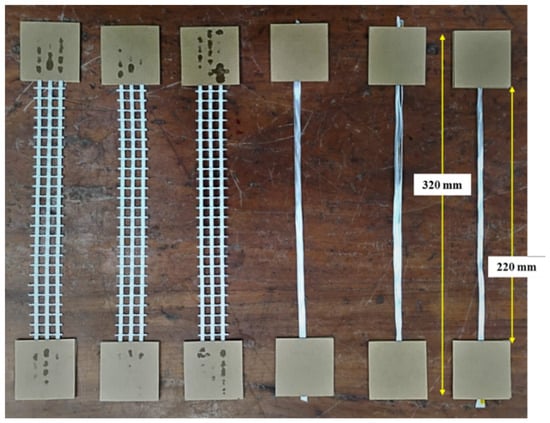
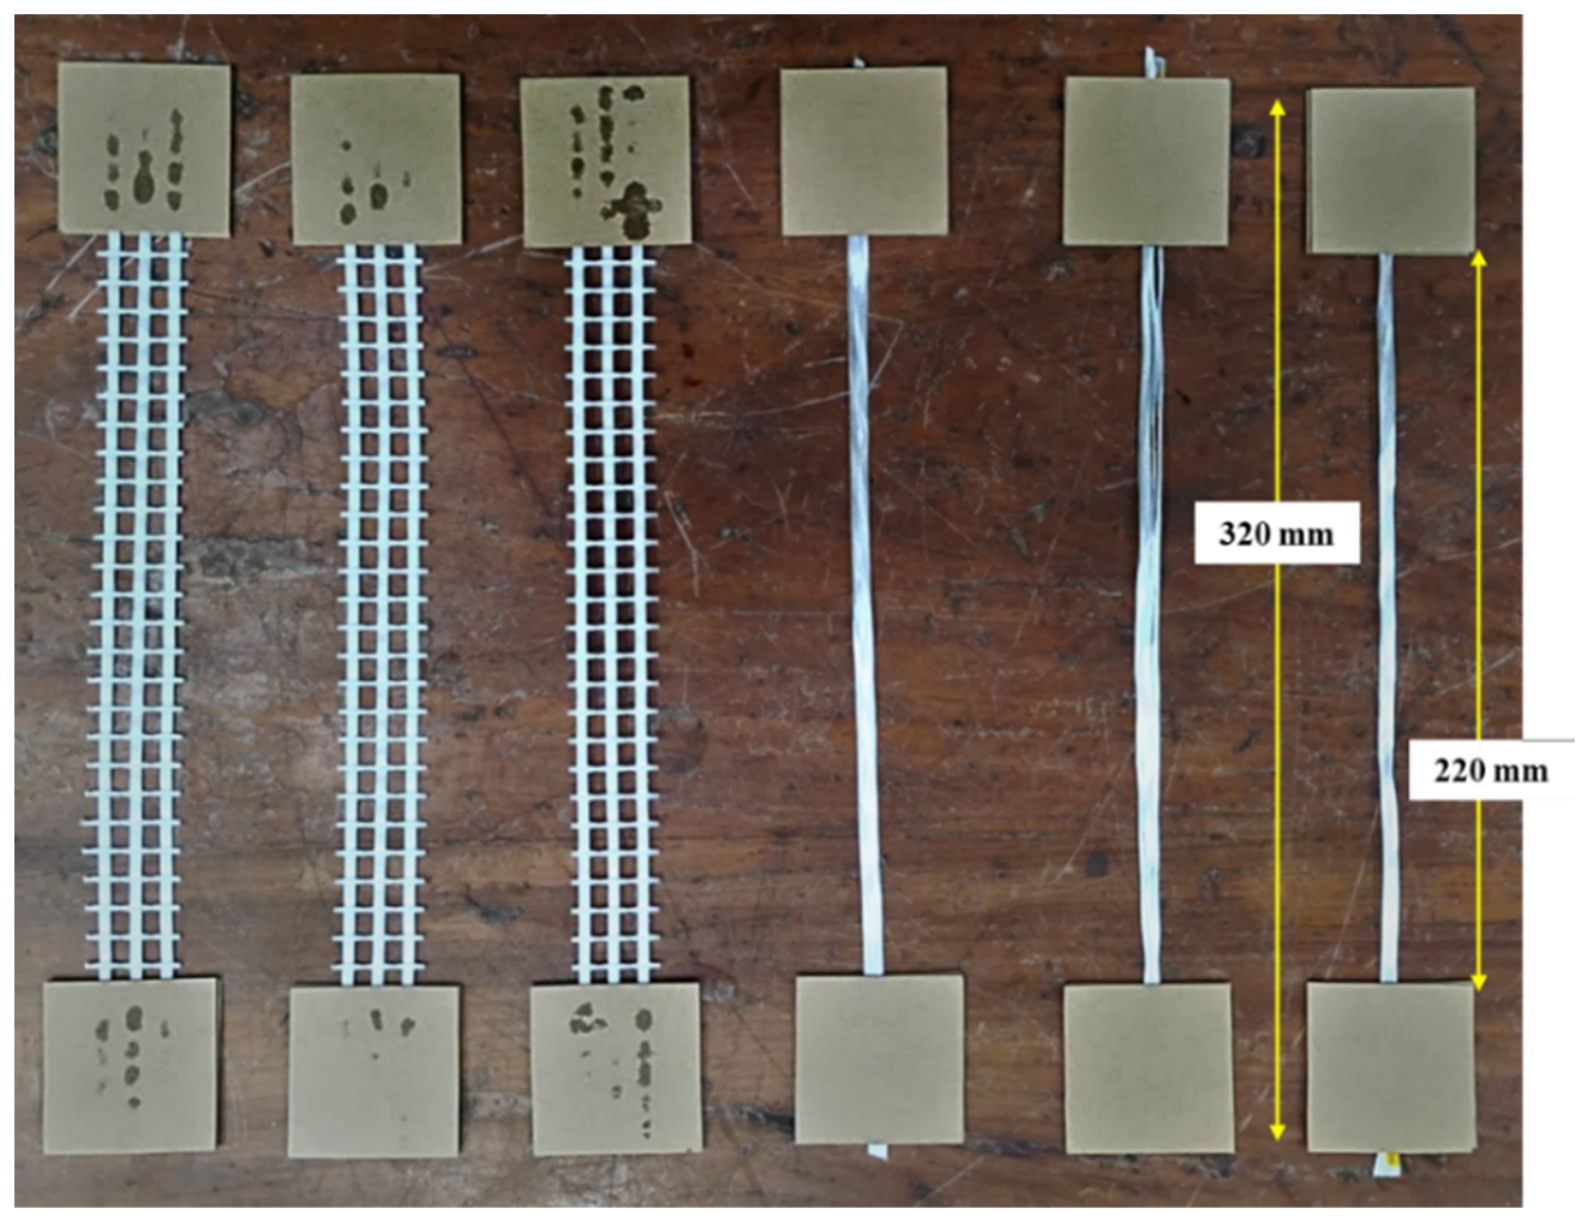
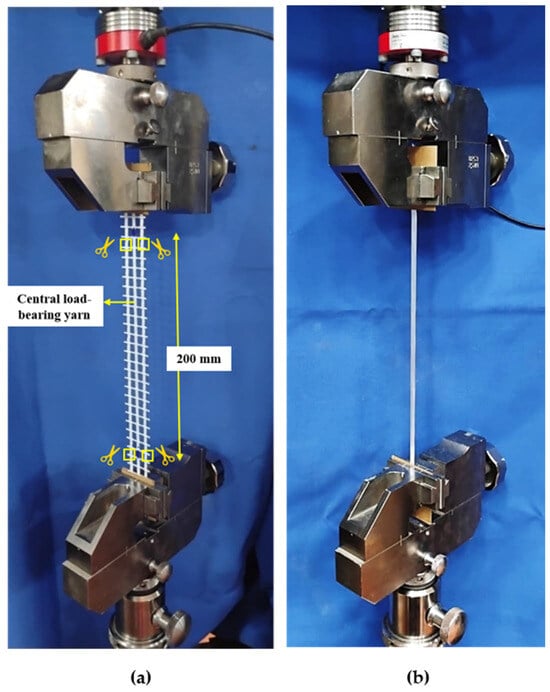
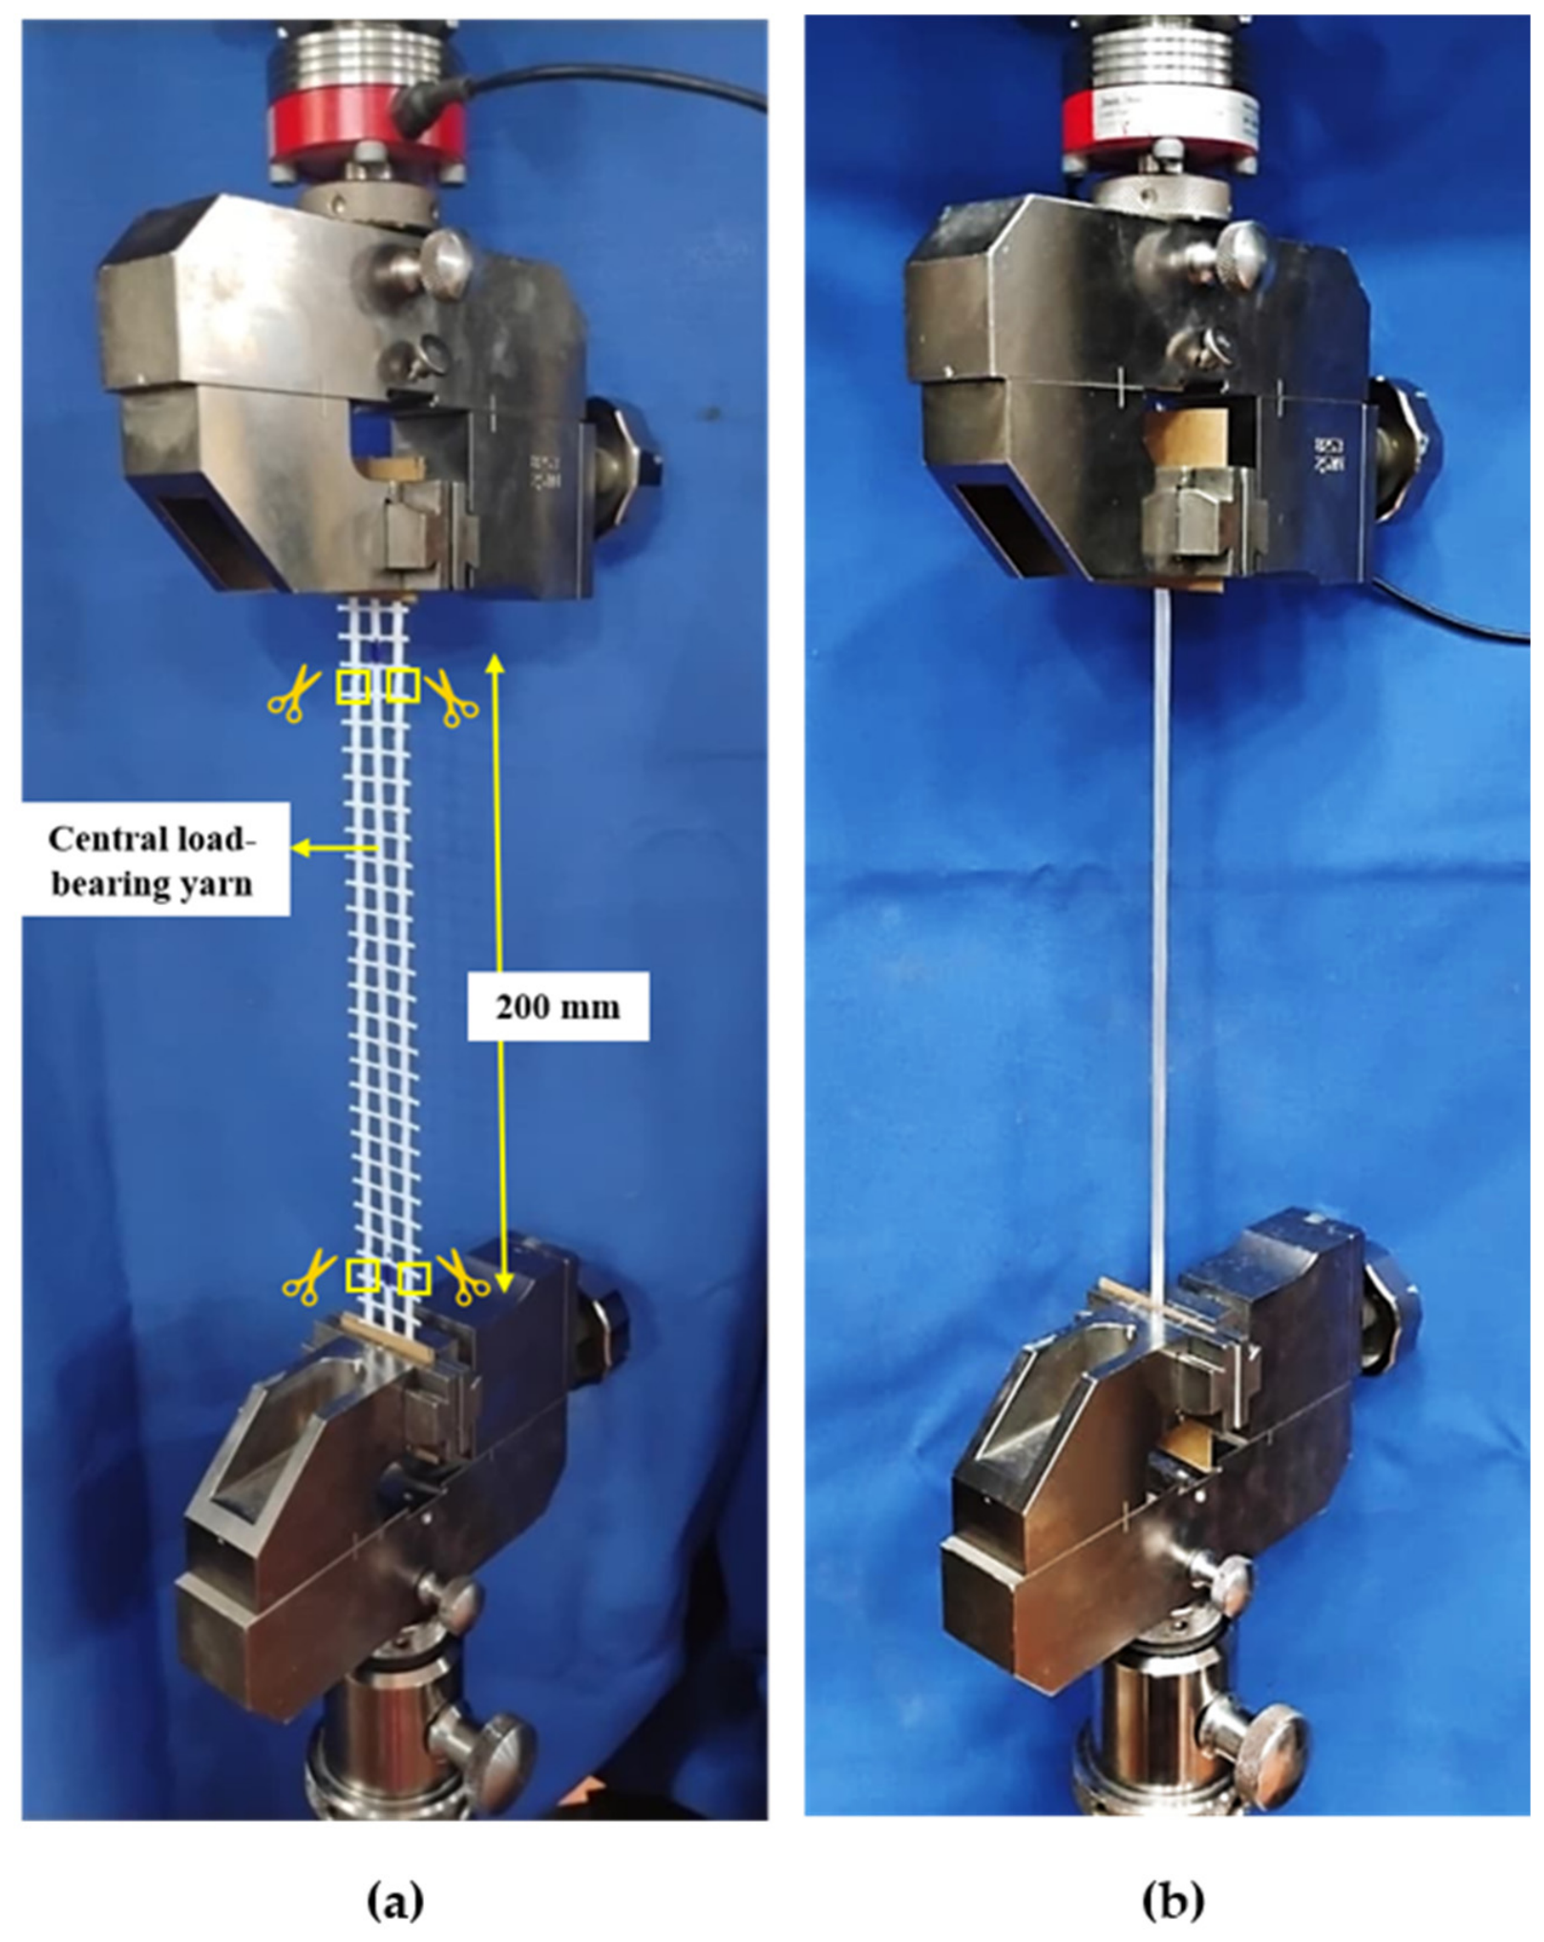
In order to determine the single-yarn strength of the coated yarns, specimens having 320 mm length and 3-yarn width were cut for testing, with a free length of 220 mm, after gluing to cardboard strips over 50 mm on either end for gripping (see Figure 2). The side yarns are cut to ensure loading only on the middle yarn, termed as the central load-bearing yarn (see Figure 3a). Further details of the testing procedure can be seen in Kusumanchi and Gettu [16]. In the case of the uncoated yarn, specimens of 320 mm were cut from the spool and prepared similarly (see Figure 2; the scissor symbols indicate the cuts made in the yarns). In the current study, the textile was stored at 25 °C and 65% RH until testing, and tests were conducted at an average temperature of 30 °C and 75% RH.
Figure 2.
Coated strip and uncoated single-yarn specimens.
Figure 3.
Single-yarn test setup for (a) uncoated and (b) coated yarns. The scissor symbols indicate the cuts made in the yarns.
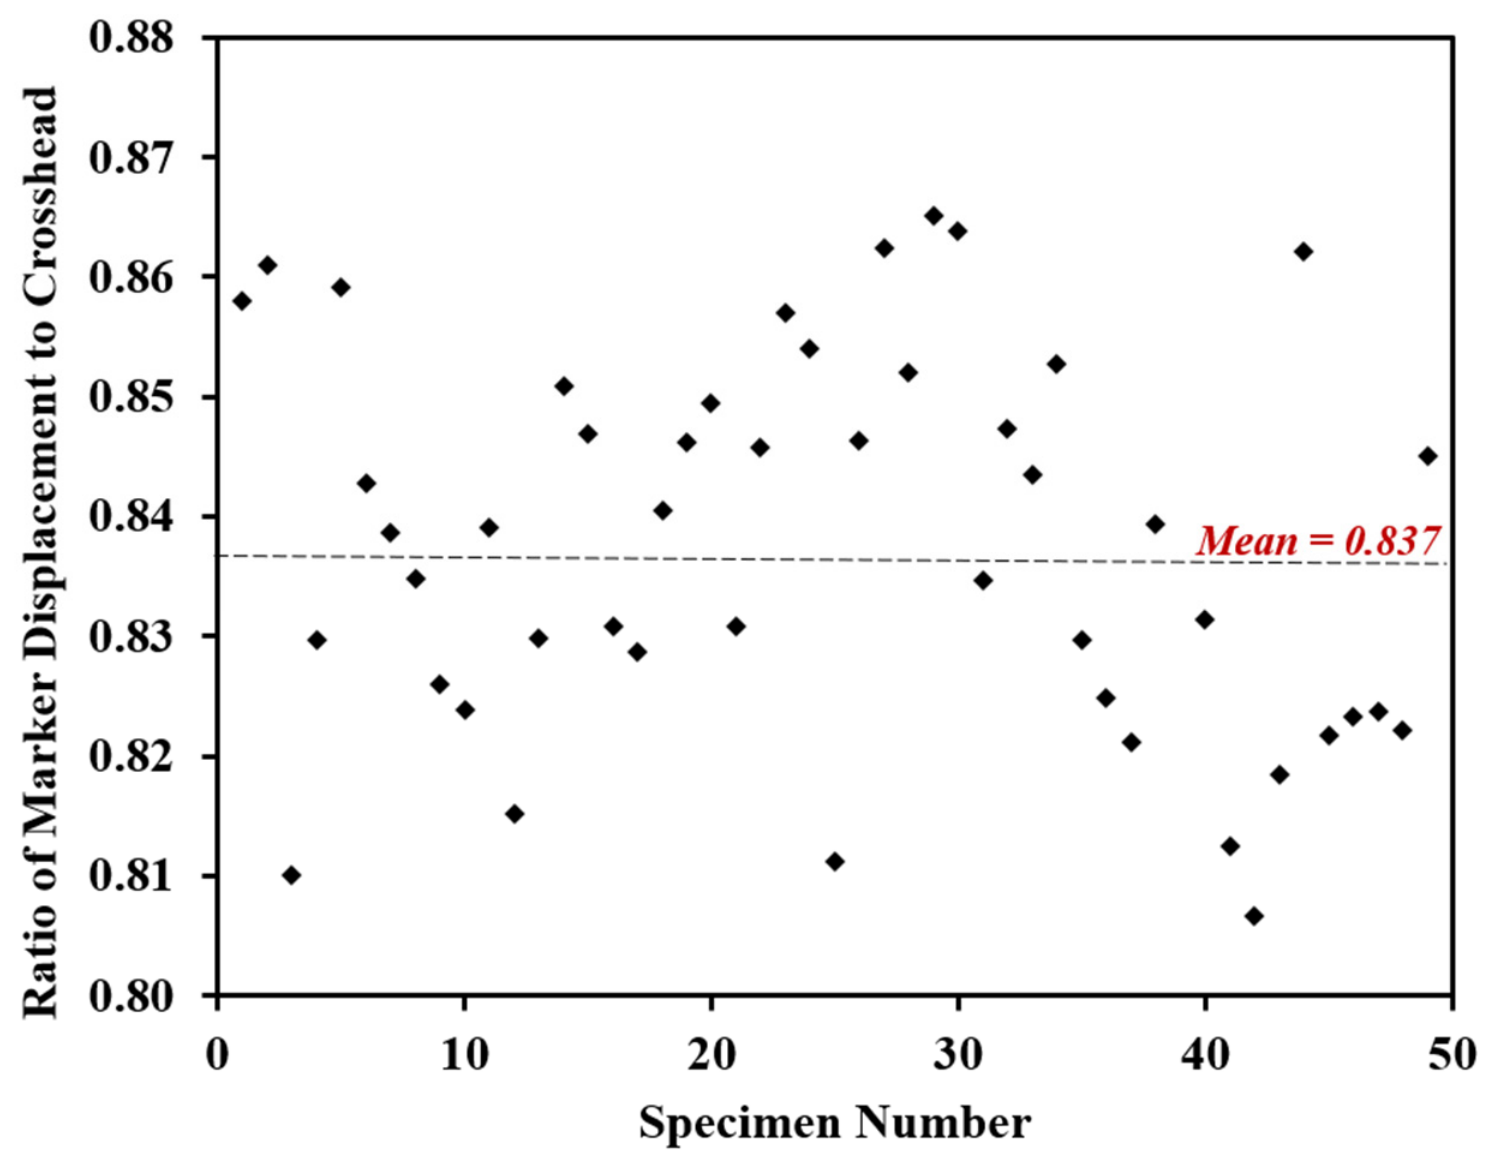
The tensile strength of the yarns is evaluated in accordance with ASTM D6637-11 Standard Test Method for Determining Tensile Properties of Geogrids by the Single or Multi-Rib Test Method [17]. The specimens are mounted on an electromechanical servo-controlled test machine, through a 5 kN load cell, and secured using screw grips, as shown in Figure 3. As per the standard, the tests shall be conducted at a strain rate of 10 ± 3% per minute of the gauge length, and, accordingly, loading was done at a crosshead displacement of 20 mm/min. The elongation of the specimen was measured using a system-mounted non-contact video extensometer. The gauge markers were placed 200 mm apart over the middle of the coated textile specimens to directly measure the elongation. In the case of uncoated yarns, it was difficult to place the gauge markers, as they were loose bundles, and, consequently, the crosshead displacement was corrected using the correlation established between crosshead and marker displacements in the coated specimens (see Figure A1 in Appendix A). A total of 55 specimens were tested in each case to establish the statistical distribution of the tensile properties. The responses of specimens falling outside the three-sigma range were identified and not considered for analysis.
The nominal tensile stresses in the yarns are calculated by dividing the load by the uncoated cross-sectional area of the yarn (see Table 1), and the nominal strains in the coated yarns are obtained by dividing the displacement measured with the video extensometer by 200 mm, the gauge length. The nominal strain corresponding to the maximum nominal stress is reported as the failure strain. As mentioned earlier, the nominal strains in uncoated yarns are estimated using the correlation determined from the displacements of the crosshead and gauge markers for the coated yarns (see Appendix A).
2.3. Test Results of As-Received Yarns
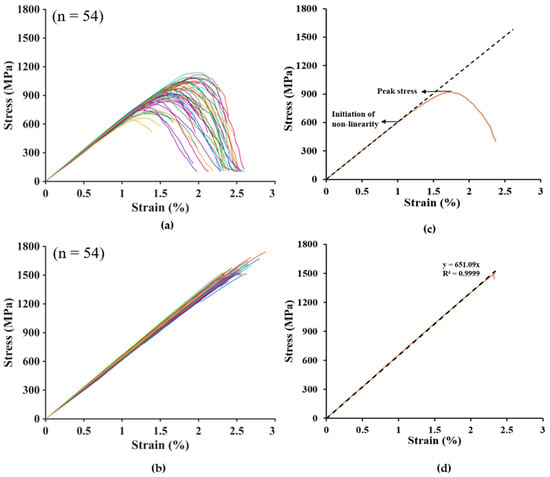
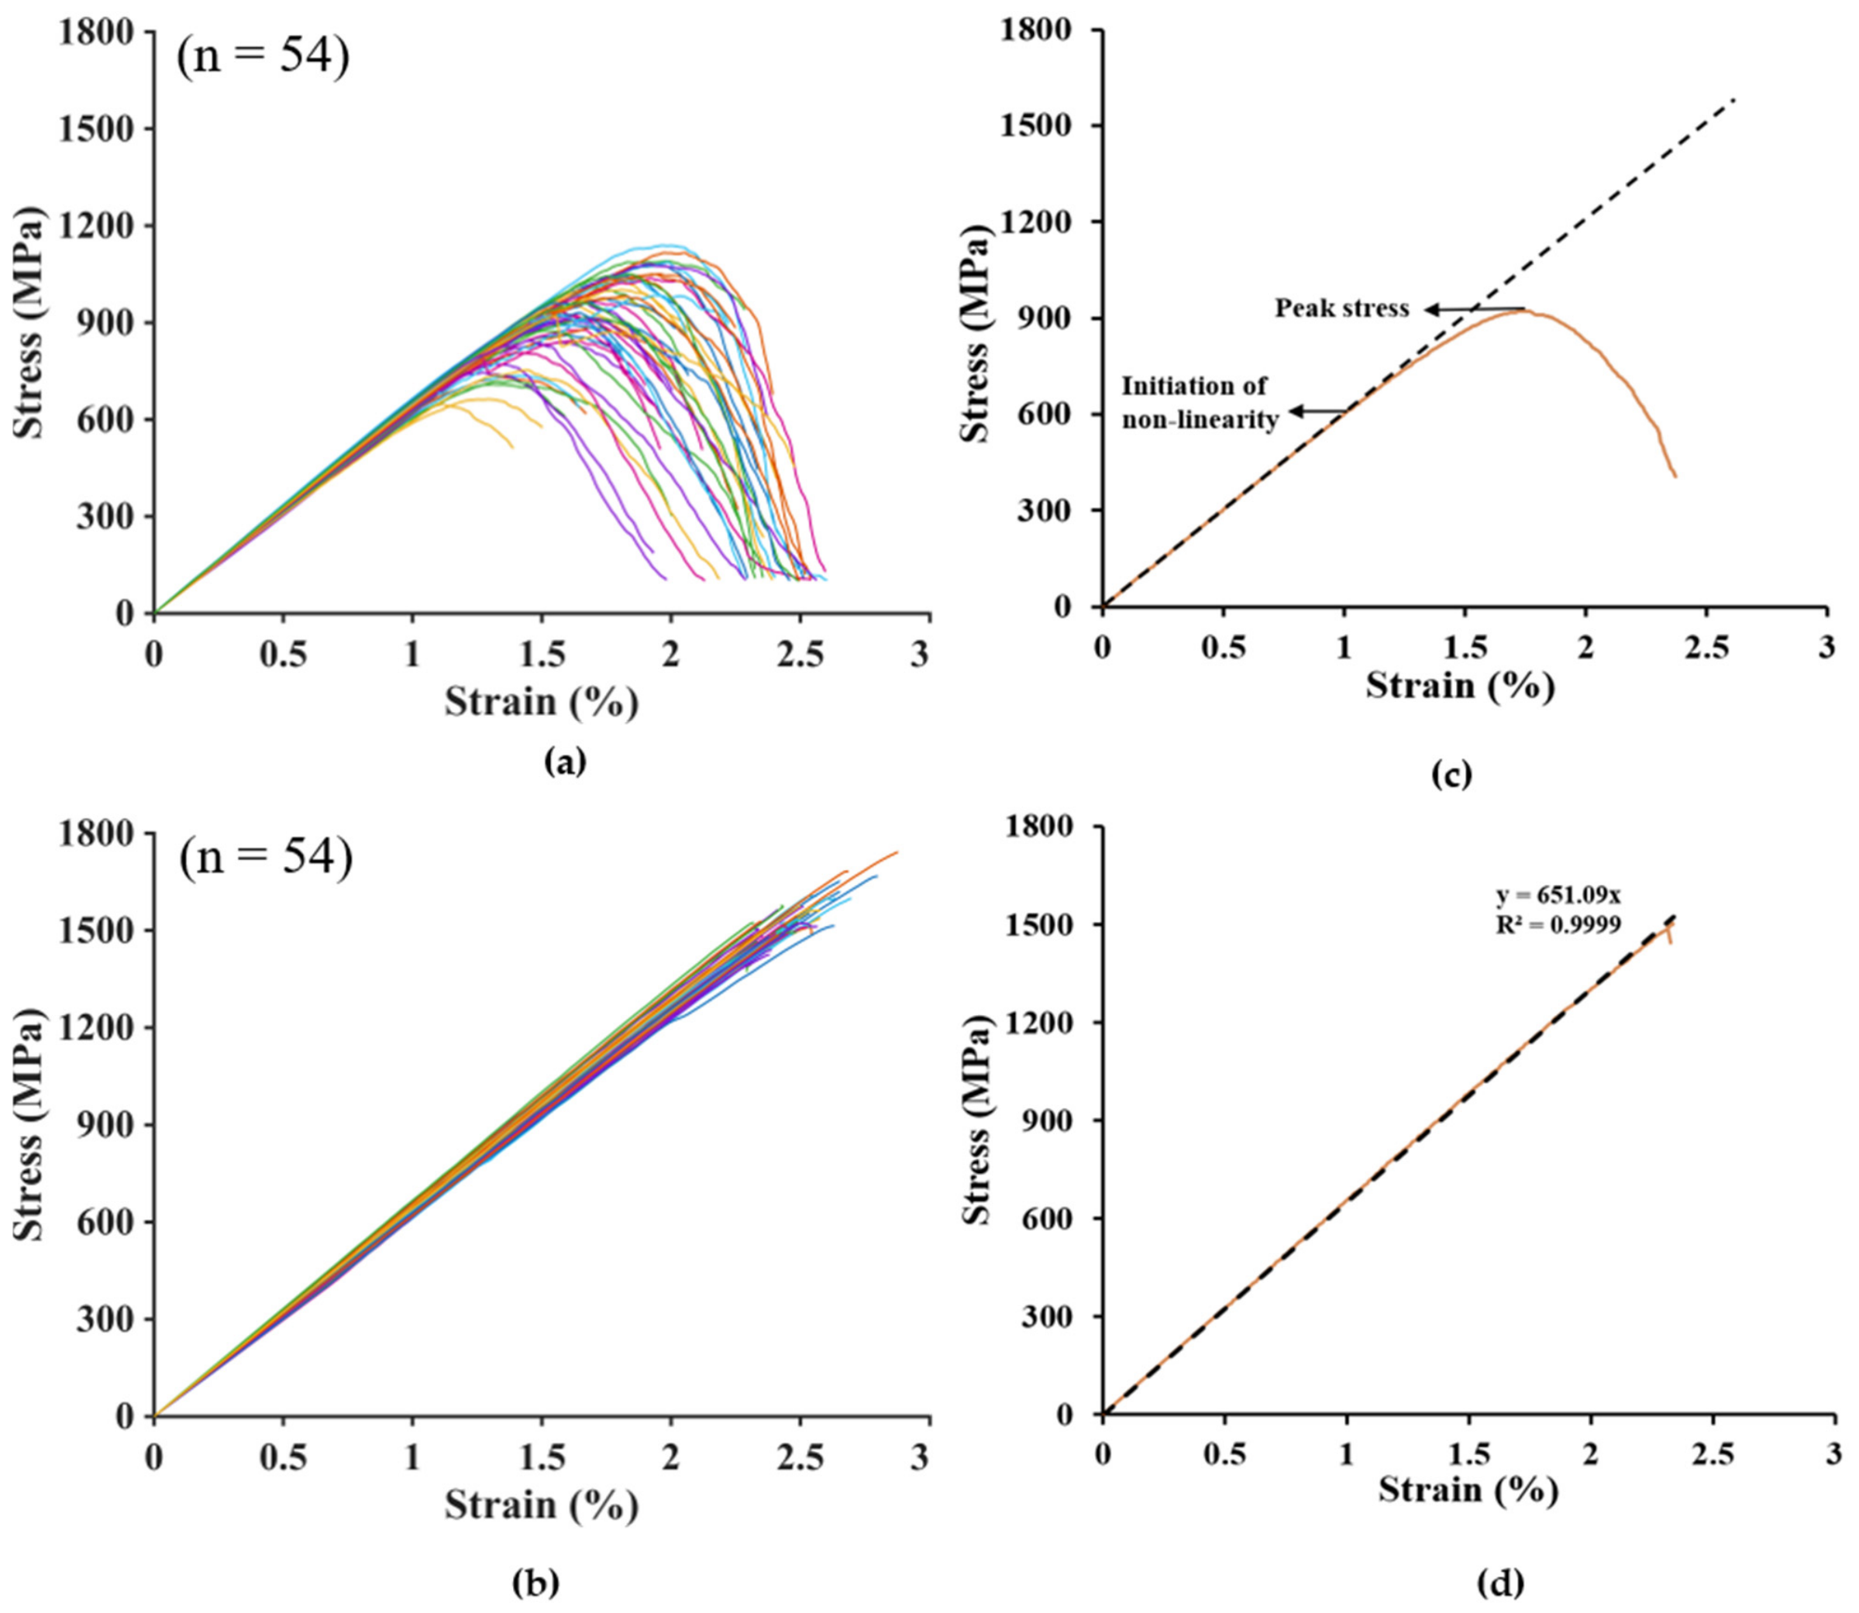
Figure 4a,b show the nominal stress–strain curves for as-received coated and uncoated yarns. A typical specimen response that is representative of the average behavior is plotted for each case in Figure 4c,d; the nonlinearity, in the case of the uncoated yarn, is evident from the significant deviation from the initial slope, which is not seen in the case of the coated yarn. The modulus of elasticity is taken as the slope of the nominal stress–strain curve up to 30% of the ultimate stress. The average values of tensile strength, failure strain, and modulus of elasticity are presented in Table 2. The average strength of coated yarns is 1.62 times that of the uncoated yarns, whereas the change in the modulus of elasticity is only marginal. It is, therefore, evident that the coating significantly improves the yarn’s failure characteristics, without affecting the elastic modulus. Also, as depicted in Figure 4c, there is an early onset of filament failure in the uncoated yarn, reflected by nonlinearity of the stress–strain curve and stiffness degradation beyond a stress of about 500–700 MPa, followed by a peak and subsequent softening due to progressive filament rupture. The factors contributing to differences in the mechanical performance due to the coating are discussed in Section 3. Only one specimen in each case fell outside the three-sigma limit, and these were deemed to be outliers and not considered in further analysis.
Figure 4.
Stress–strain curves of as-received (a) uncoated and (b) coated yarns; and stress–strain responses of typical (c) uncoated and (d) coated yarns. Note that the dashed lines represent the initial slope.
Table 2.
Single-yarn tensile properties of (as-received) uncoated and coated yarns.
3. Statistical Analysis of the Strength of As-Received Yarns
It is imperative to understand the statistical distribution of the strengths of uncoated and coated yarns to efficiently design fiber-reinforced composites. The strength of brittle materials, such as a glass filament, generally follows the Weibull distribution [3,4]. However, it is known that when a large number of filaments are parallelly arranged to form a bundle, the statistical distribution of tensile strength transitions from Weibull to Gaussian [5]. Though the mean strength and standard deviation of yarns can be derived from the Weibull parameters of filaments, this approach cannot be directly applied to an impregnated bundle due to the local load-sharing (LLS) phenomenon after the onset of filament failure. In such cases, there is redistribution of stress through the matrix when a filament fails, over an ineffective length, δ, which is in the order of a few filament diameters; beyond this length, the load is redistributed equally among the surviving filaments through the matrix. Therefore, the yarn can be considered to act as a statistically independent chain of bundles having link length δ, the strength of which can be given by Daniels’ bundle theorem; the overall yarn strength is then given by the weakest link theorem [6,18]. This is supported by numerical studies showing that local sharing of load results in the coated yarn strength being approximated by a Weibull distribution [7,8,9].
3.1. Statistical Distribution of the Yarn Strength
Considering that the strength of both uncoated and coated yarns, each consisting of about 4200 filaments (see Section 2.1), should follow the Weibull distribution, we have
which can be rearranged as
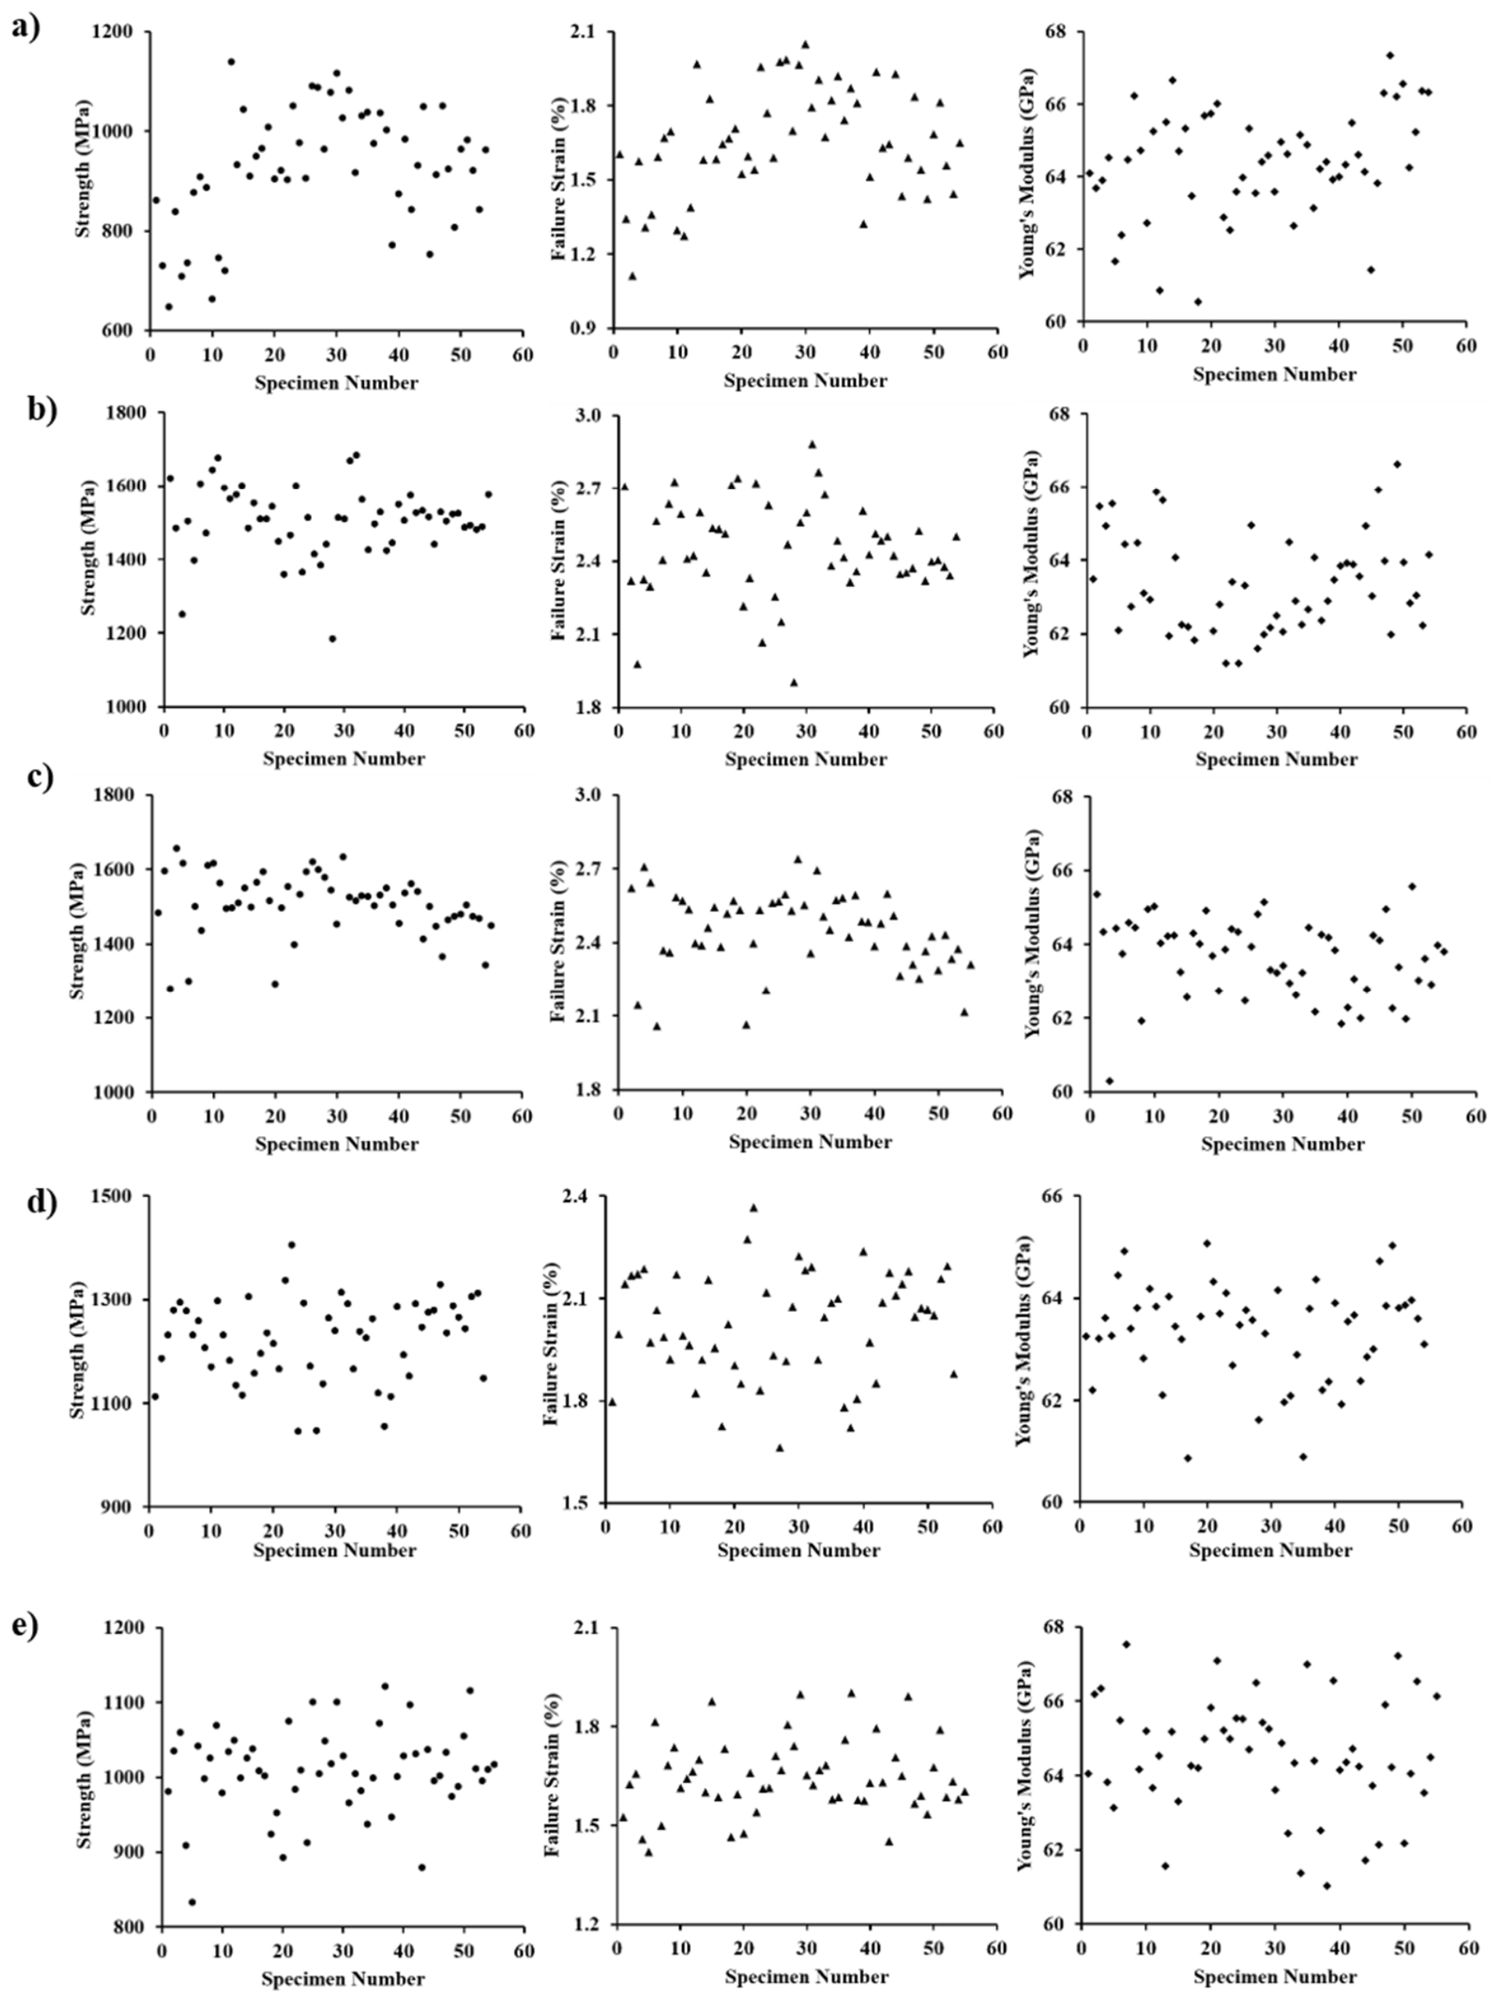
where is the cumulative probability of failure of the yarn at a stress less than or equal to ; m is the Weibull modulus or shape parameter of the yarn; and is the Weibull scale parameter or reference strength of the yarn. Note that the Weibull modulus, m, reflects the variability in the data (coefficient of variation, CoV = , whereas the Weibull scale parameter, , indicates the 63rd percentile strength. The data from yarn tests (see Figure A2 in Appendix B) are arranged in ascending order, and an incremental rank is given to each value. Considering the total number of specimens as n, the cumulative probability, i.e., , was estimated by dividing the rank with n + 1, following the Weibull approach [3]. The choice of the ranking assignment may lead to slight variations in the estimated parameters but is not expected to significantly alter the overall trends or conclusions.
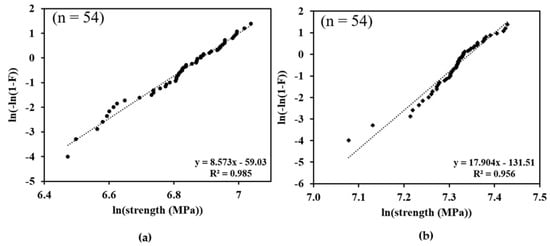
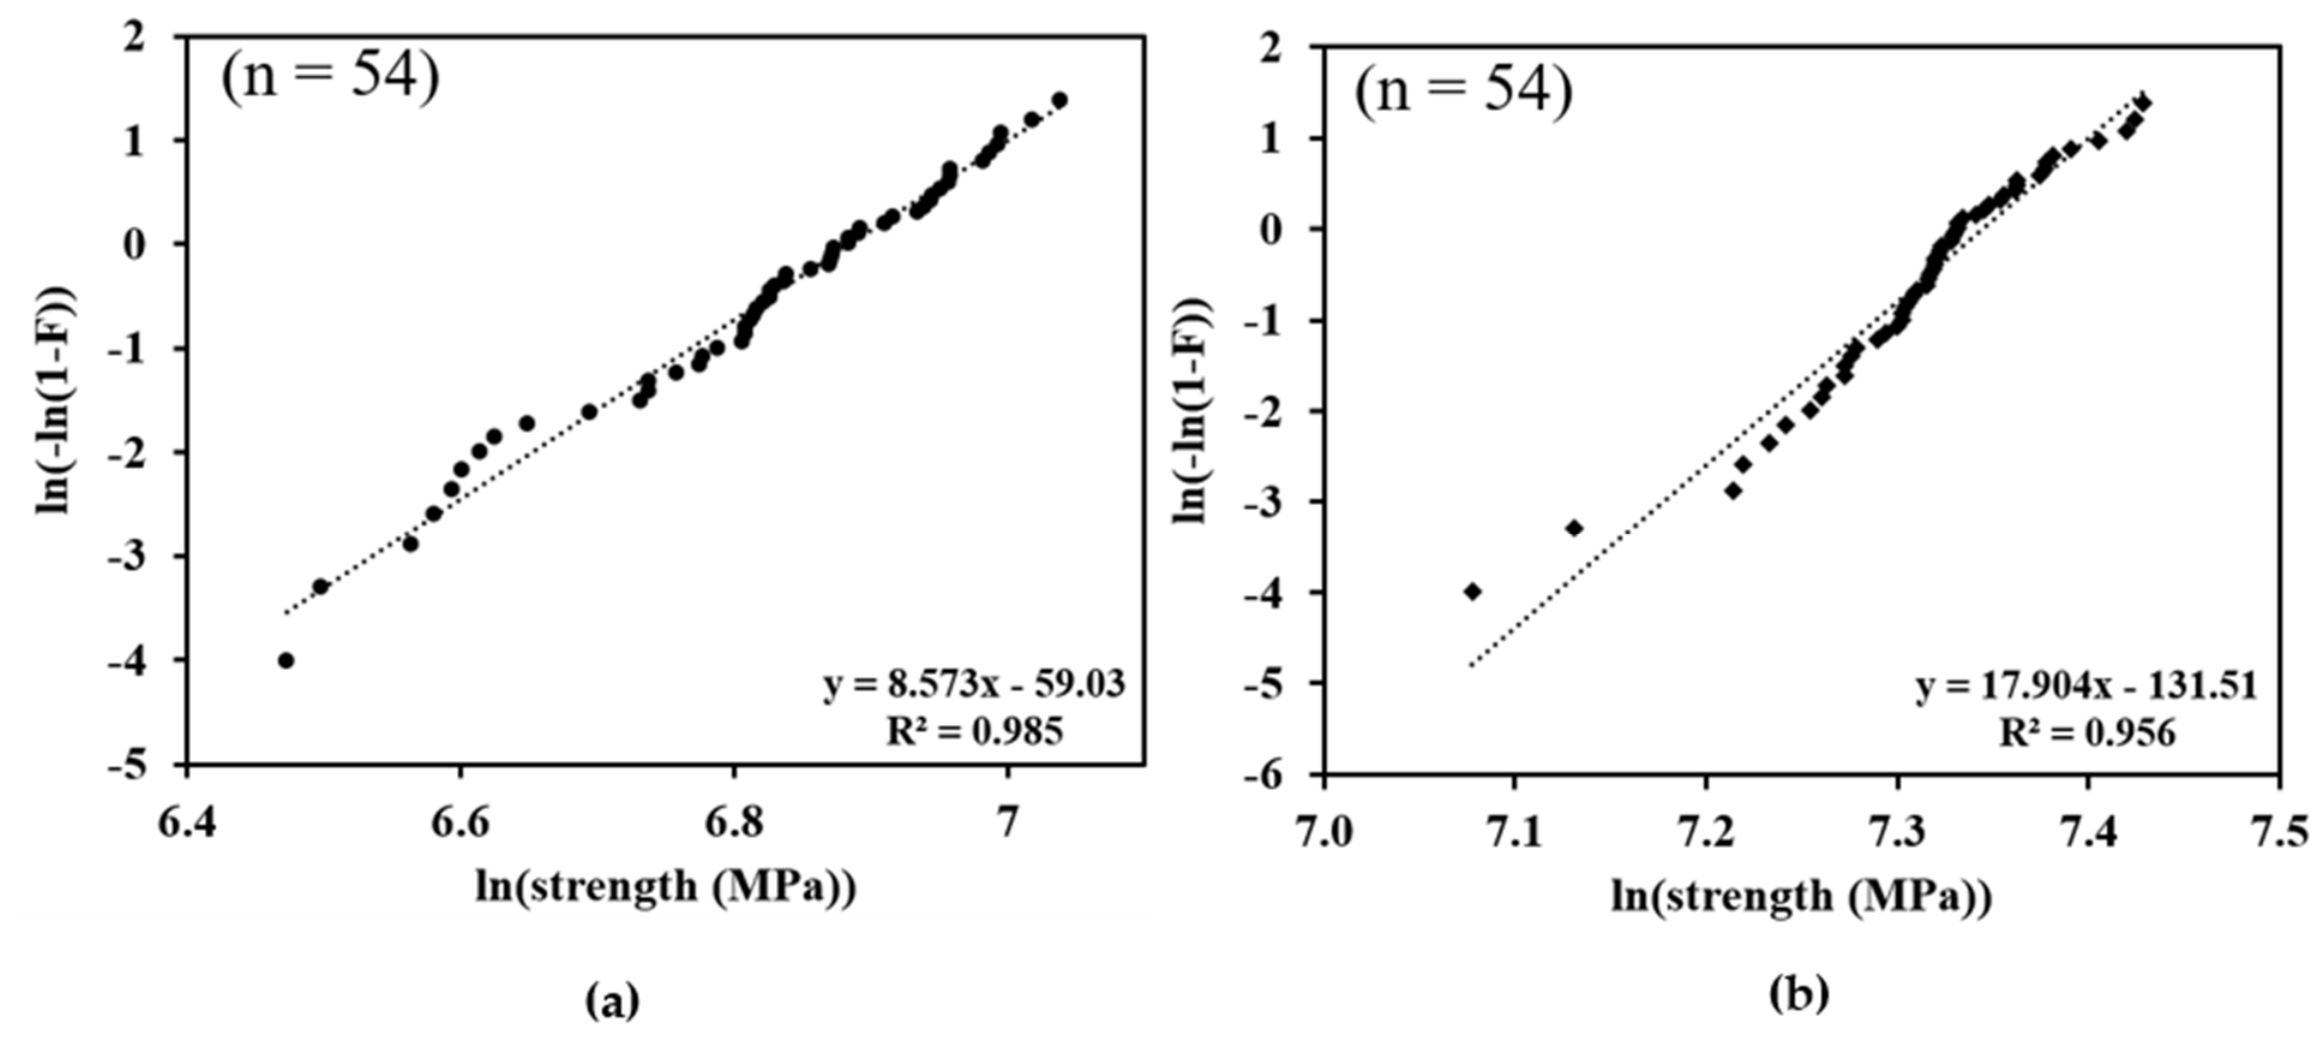
The double-logarithm values of cumulative probabilities are plotted against the logarithm of yarn (bundle) strength in Figure 5, as per Equation (2), for both uncoated and coated cases. The experimental data show good agreement with the Weibull distribution, as indicated by the linear regression fits (dotted lines), from which the Weibull parameters were estimated; the resulting values of Weibull modulus and reference strength are presented in Table 3. The Weibull modulus of coated yarn is seen to be higher than that of uncoated yarn, indicating lower variability in the case of coated-yarn strength. Also, as seen with the average failure stresses, the reference strength of the coated yarn is much higher than that of the uncoated yarn, as also observed previously in carbon fiber yarns containing about 1000 filaments, by Watson and Smith [19].
Figure 5.
Weibull plots for as-received (a) uncoated and (b) coated yarns.
Table 3.
Weibull parameters obtained from experimental data for uncoated and coated yarns, and indirectly estimated for single filaments from the experimental data of uncoated yarn.
3.2. Estimation of the Weibull Parameters for Single Filaments
To understand how the strength of the yarn compares to the strength of a single filament, the Weibull parameters of the single filaments are indirectly estimated based on the uncoated yarn data. To derive the Weibull parameters of single filaments from the uncoated yarn, considered as a loose bundle, the following assumptions are made [12,20,21]: (i) the filaments follow Hooke’s law until failure, (ii) the filament strengths follow the two-parameter Weibull distribution, and, importantly, (iii) the load is equally distributed among the surviving filaments after the failure of any filament. The inter-filament friction within the uncoated yarn may influence the estimated single filament parameters; however, it is not considered in this study based on the conclusions made by Chi et al. [20]. The m-value for the single filament (designated here as mf), and reference strength and failure strain (designated as and as , respectively), are given by Chi et al. [20] as follows:
which can be rearranged as
where
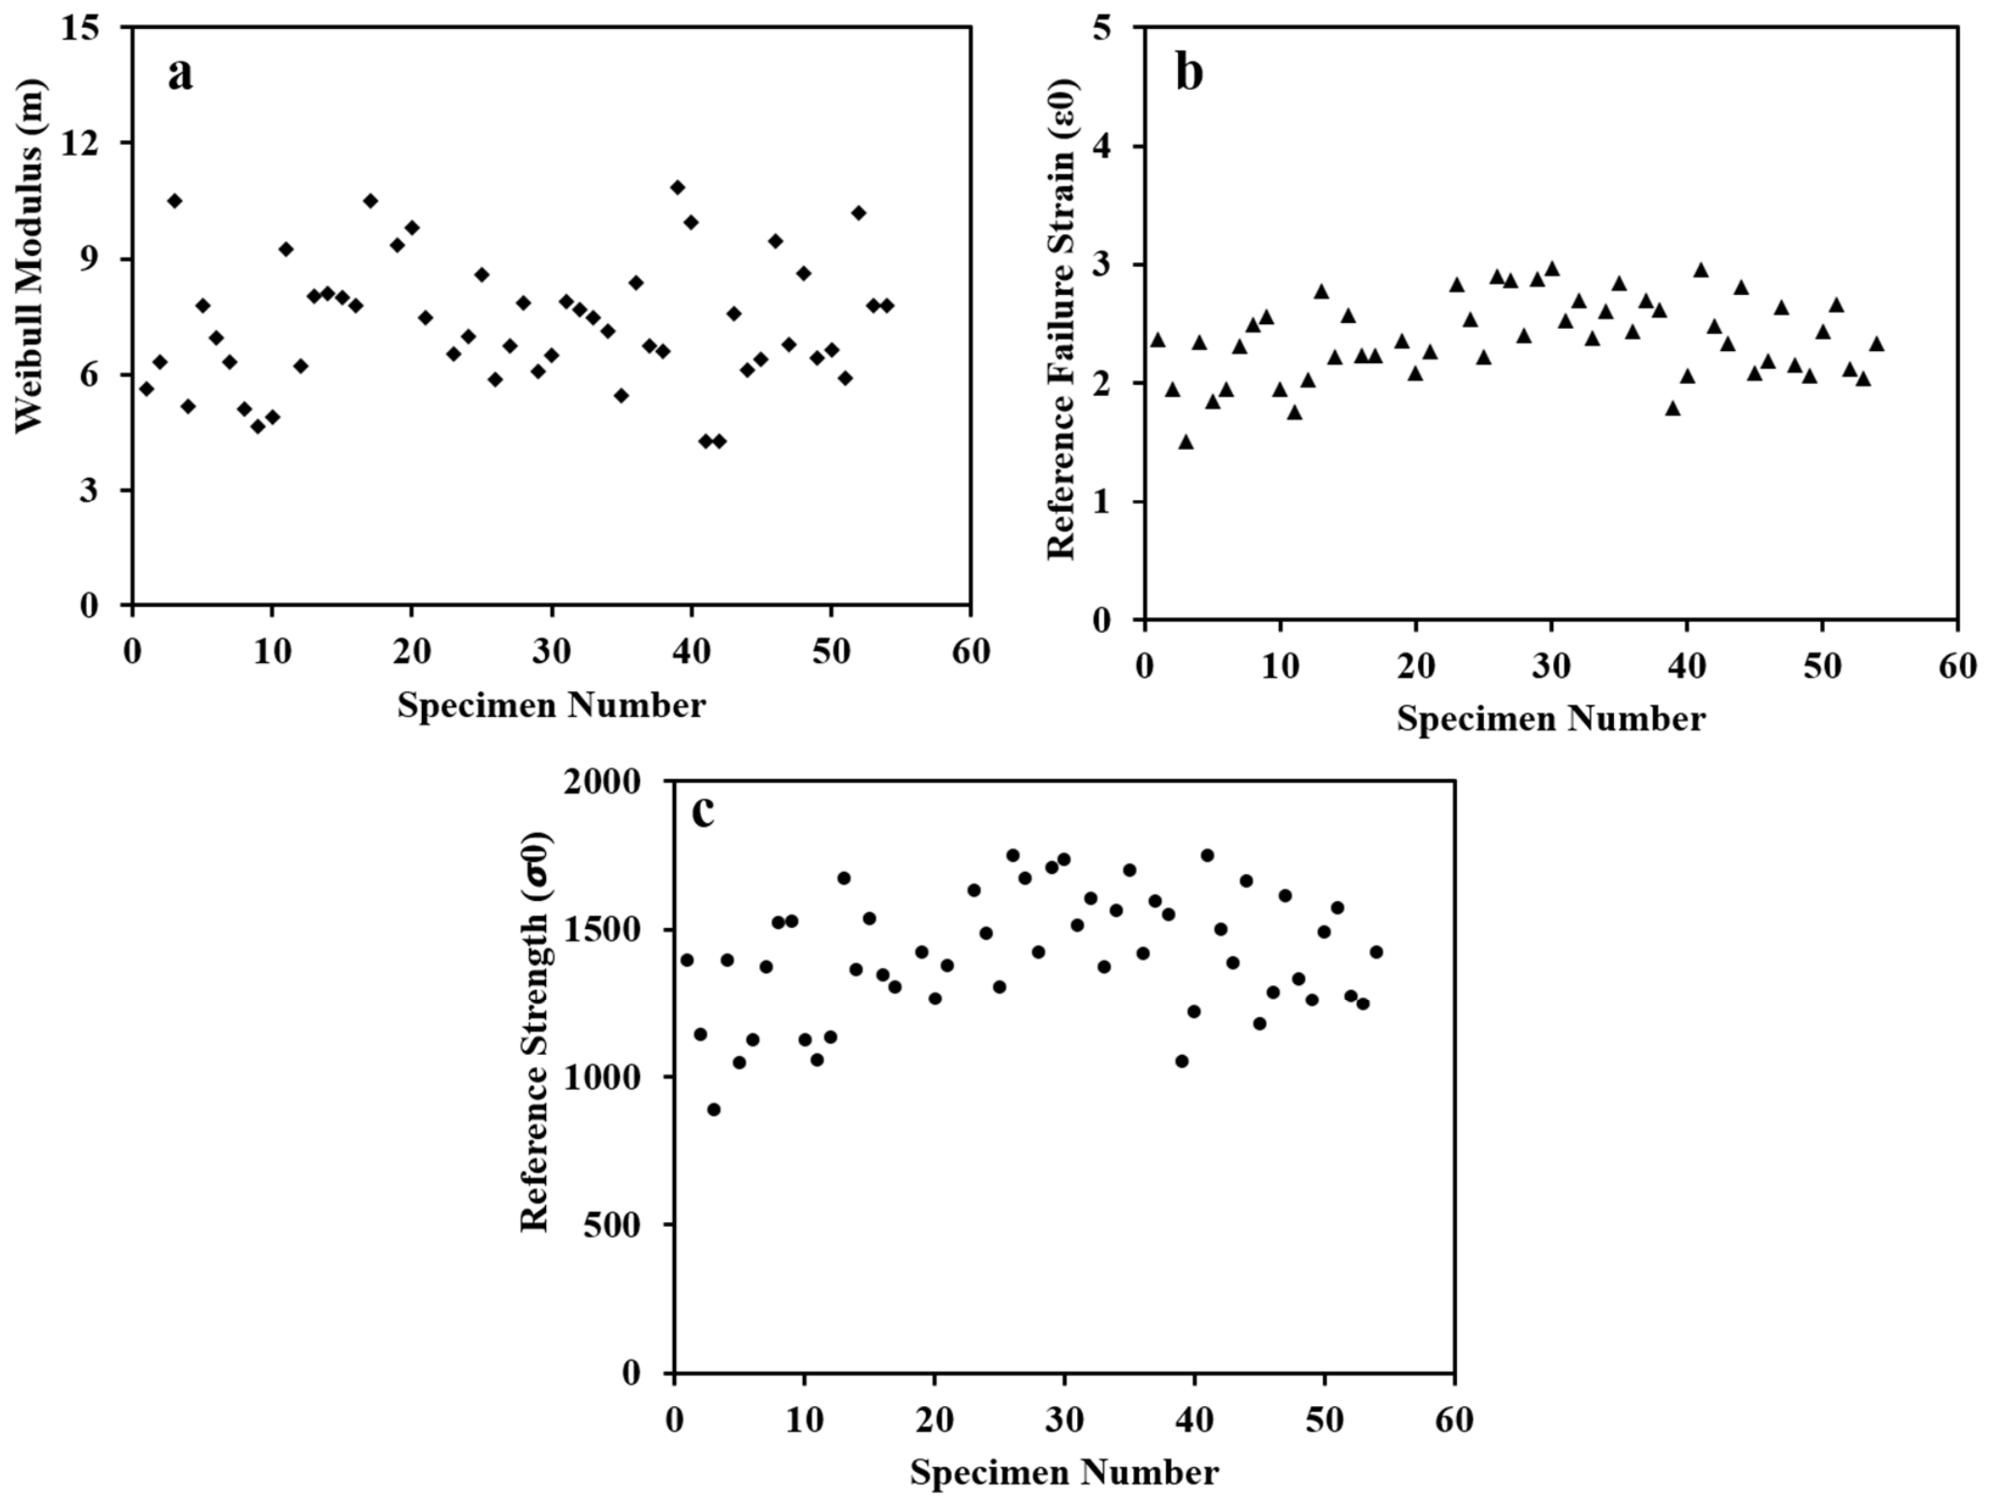
in which is the maximum load carried by the uncoated yarn (bundle); is the estimated total number of filaments in the yarn (here, ≈4200); A is the area of the single filament; , and are the initial tangent modulus, failure stress, and failure strain of the yarn, respectively; and , , and are the Weibull modulus, reference strength, and reference failure strain of the single filament, respectively. The parameters, , , and , calculated for the single filament for each uncoated yarn specimen, are given in Figure A3 (Appendix B), and the average values are presented in Table 3, along with the standard deviations.
The uncoated yarn is seen to have much lower strength than that estimated for a single filament, which is to be expected from the pioneering works of Griffith [1], Weibull [3] and Daniels [5], as there is a higher probability of larger flaws in the bundle than in a single filament. Further, the early failure of a few filaments results in load redistribution until complete failure of the yarn, at much higher loads (reflected by the non-linearity in Figure 4c). The number of filaments that have theoretically failed in the yarn at the peak stress can be estimated by considering the cumulative failure probability of filaments at the ultimate load or strain, . This is obtained by substituting , from Equation (6), in Equation (8), which is the two-parameter Weibull distribution for strain, to obtain Equation (9) [20].
where is the cumulative probability of failure of filaments at any strain less than or equal to , is the cumulative failure probability of filaments at or below the ultimate strain of the uncoated yarn, and mf is the Weibull modulus of the single filaments within the yarn.
For the single-filament Weibull modulus of 7.3 ± 1.6 (see Table 3), the filaments that could have theoretically failed just before the ultimate load of the uncoated yarn is estimated to be 10.5 to 16.0%, from Equation (9). This indicates that, for a yarn of 4200 filaments, 447 to 667 filaments could have ruptured before complete failure occurs in the yarn, which reflects the scatter and nonlinearity observed in the stress–strain curves of uncoated yarns in Figure 4c.
Importantly, Table 3 shows that the reference strength and m-value of the impregnated yarn (1549 MPa) exceed those of a single filament (1410 MPa), as previously reported by Watson and Smith [18] and recently by Naito [10]. This observation is noteworthy because the strength–volume relationship of Griffith [1] and Weibull [3] suggests that an increase in the number of filaments and, consequently, in the stressed volume would reduce the strength, which is contrary to that observed here. In impregnated yarns, the filaments are bound with a polymer matrix, and the failure of a few weaker filaments leads to redistribution of loads, or local load sharing (LLS), among the neighboring surviving filaments, over a small “ineffective” length, which is considered to be about five times the mean fiber diameter by Watson and Smith [19]. Completely understanding the implications of the LLS mechanism on the overall composite strength distribution is challenging due to several sources of uncertainty, including variability in the (i) spatial distribution, (ii) elastic–plastic properties of filaments and matrix, (iii) characteristics of filament–matrix interfaces, and (iv) the stochastic nature of progressive filament failures. However, it is widely accepted that the composite strength can be practically approximated by a Weibull distribution [7,8], as also applicable to impregnated yarns [9]. Accordingly, the yarn behaves as a chain of short bundles, and the m-value of the short bundles in the yarn increases beyond that of the filament as the number of filaments increases. Such a higher m-value for the short bundle could explain the higher yarn strength relative to a single filament, as the length increases [22]. The final rupture of the coated yarn requires the formation of a small yet critical cluster of failed filaments, which could also explain the absence of significant stiffness degradation and pre-peak nonlinearity (Figure 4b,d). Studies on composite tapes of E-glass filaments in epoxy, with an average of 128 filaments, have estimated a critical cluster size of three filaments [22]. Consequently, localized alkaline degradation affecting a small number of neighboring filaments could result in the failure of the impregnated yarn and the statistical nature of its tensile strength.
4. Influence of Alkaline Exposure on the Mechanical Characteristics of Coated Yarns
4.1. Exposure and Test Results
To understand the effect of alkali attack on the tensile strength of coated yarns, textile strips of 1 m length, consisting of three weft yarns, were immersed in an alkaline solution at 25 °C for 7, 28, and 56 days. The solution containing 4 g of KOH, 1 g of NaOH, and 0.5 g of Ca(OH)2 per liter of water, with a pH of 13, was prepared in accordance with the ETAG 004 guidelines, to simulate the aqueous solution in cementitious matrices [23]. The weight ratio of the solution to the uncoated yarn is maintained at 50. After the desired exposure period, the strips were removed and air-dried for two days at 25 °C and 65% RH, after which, specimens were cut and tested, as detailed in Section 2.2.
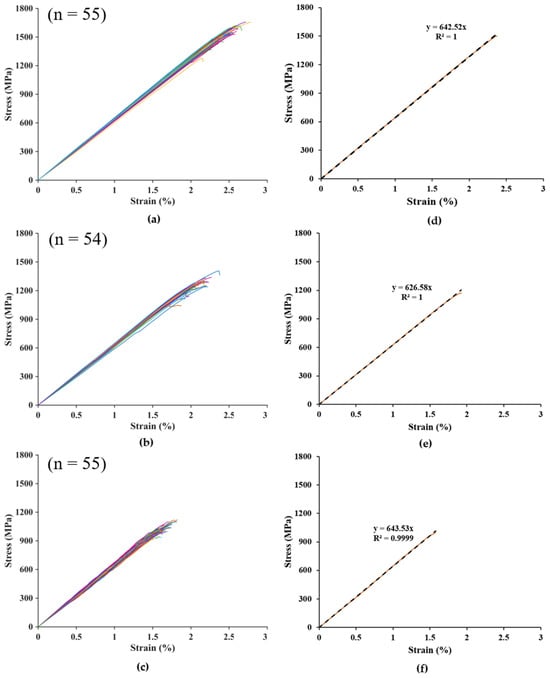
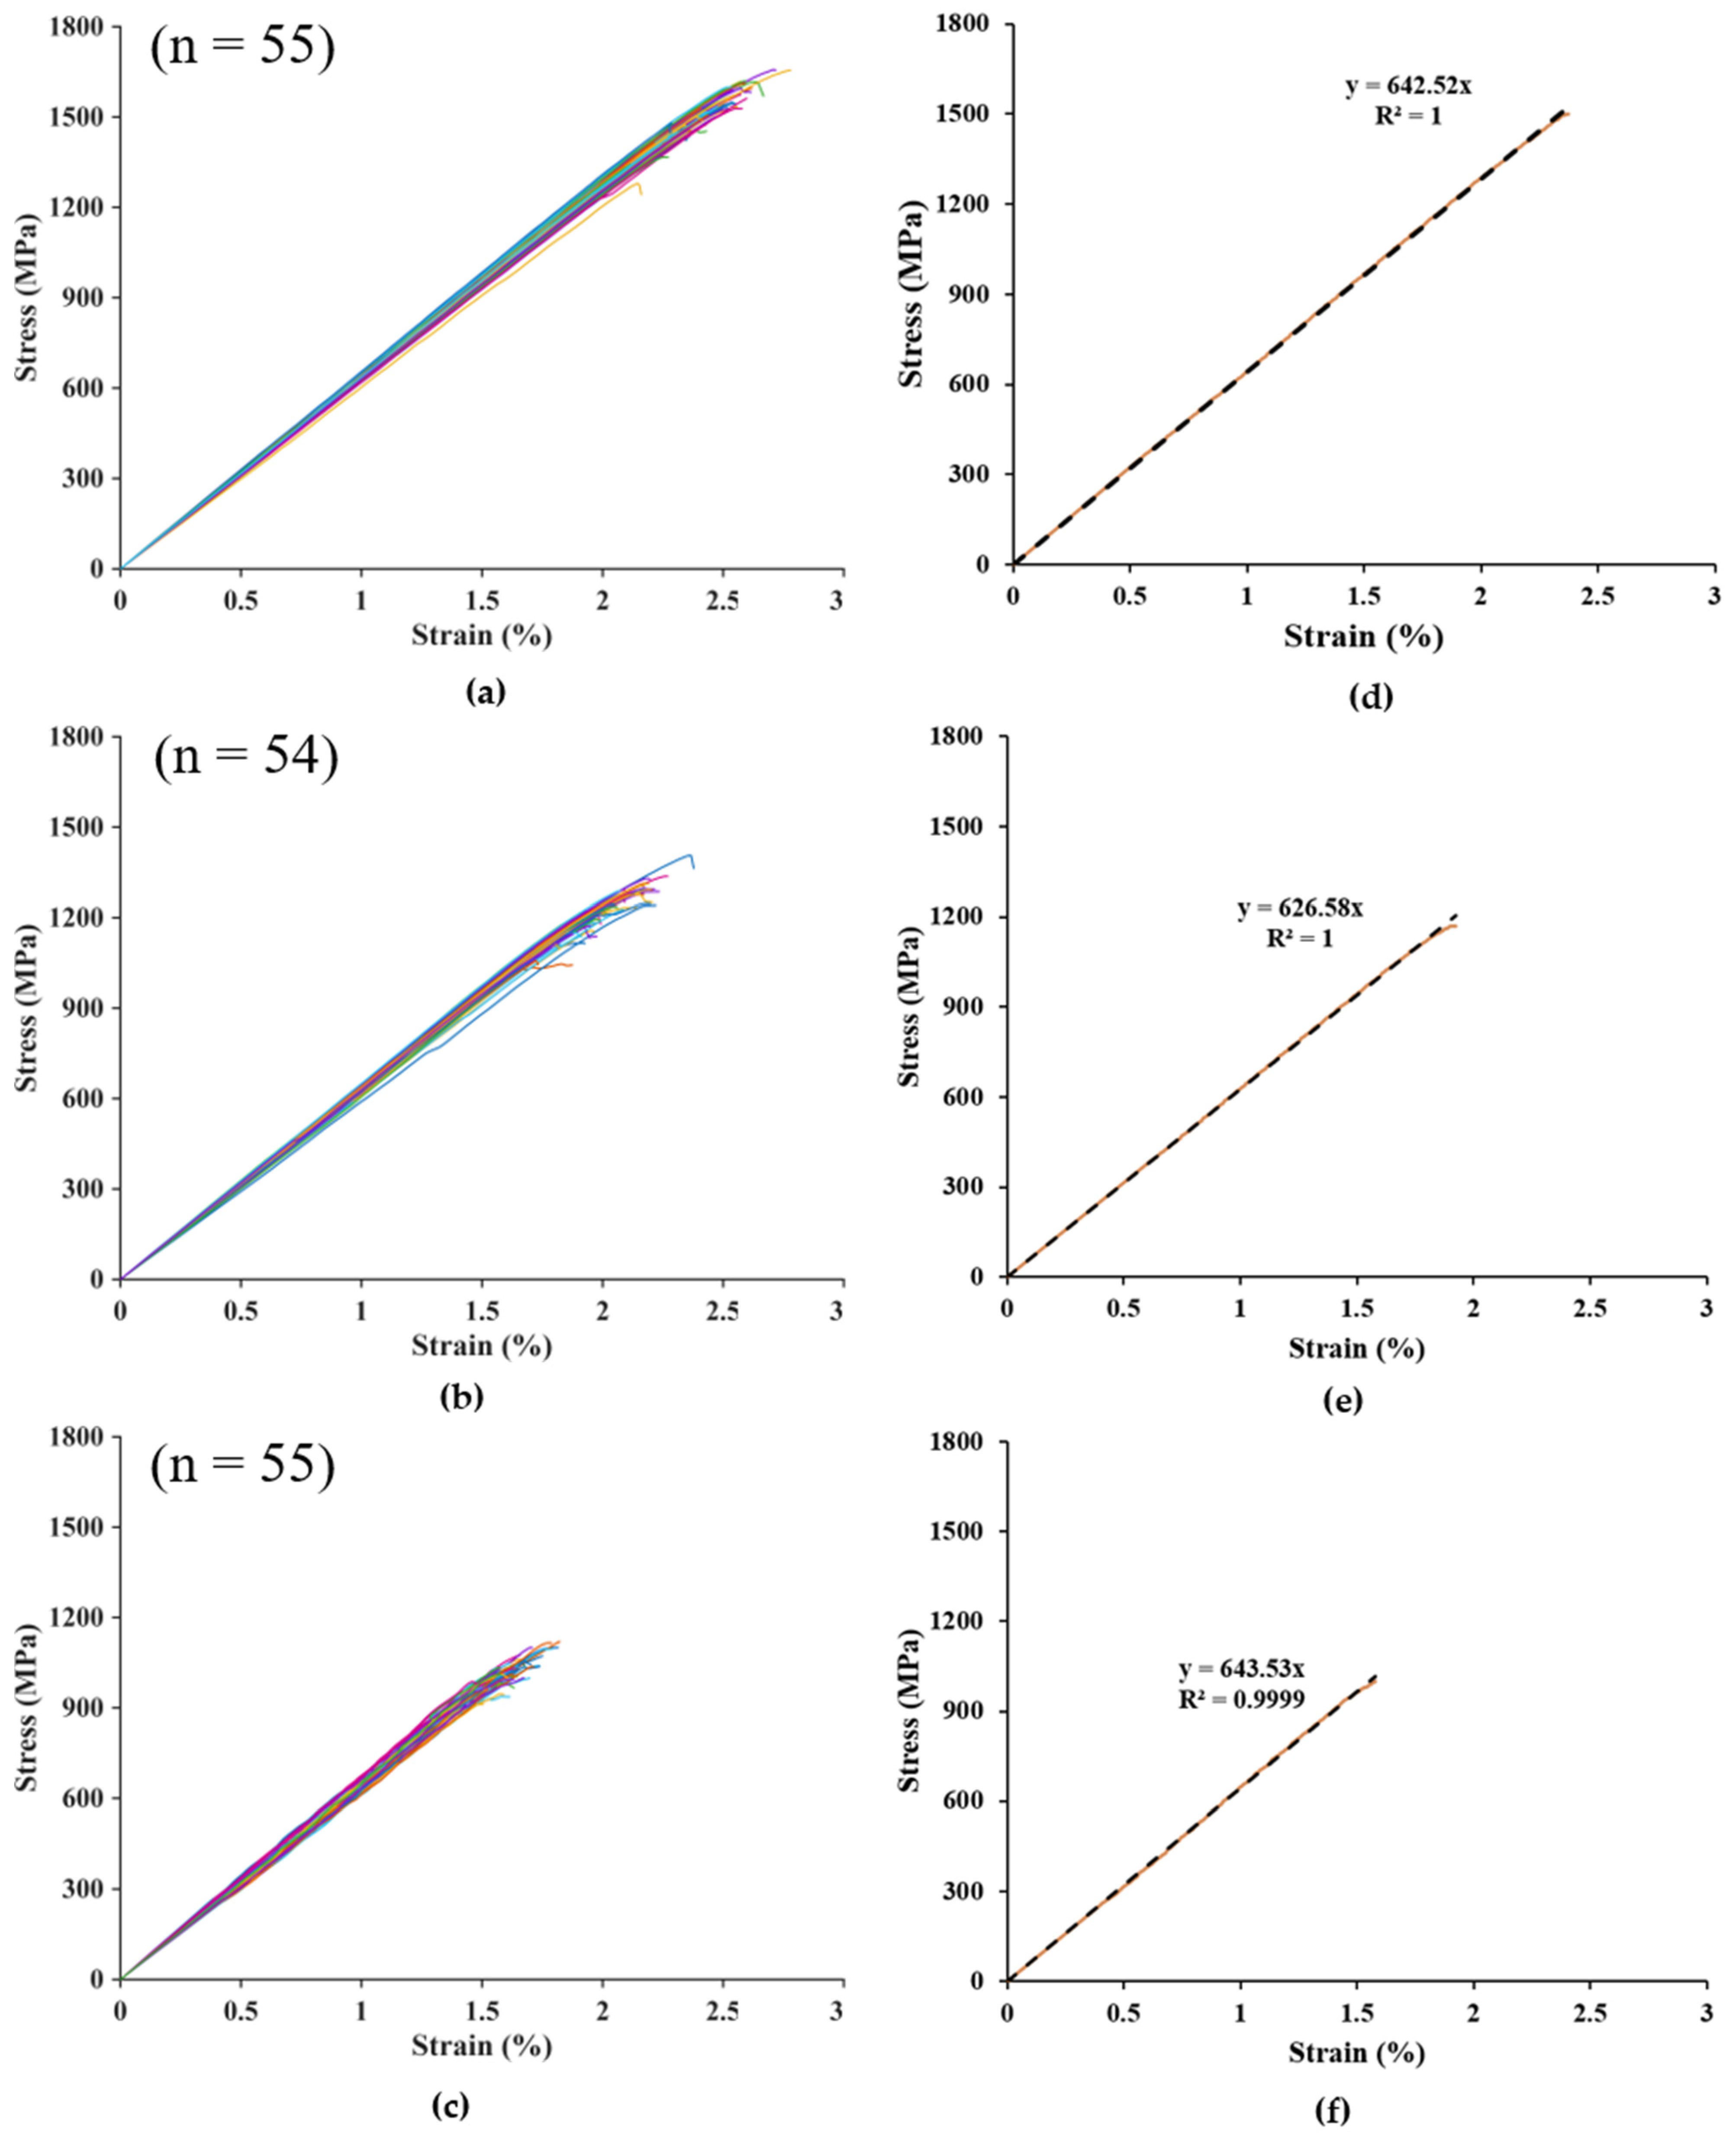
The nominal stress–strain curves of the specimens tested after exposure are presented in Figure 6, and the average tensile parameters are given in Table 4, along with the losses with respect to the as-received yarns (Table 2) within parentheses. It is evident that reduction in single-yarn strength or strain capacity is significant only after 7 days of exposure. Importantly, the stiffness of the yarn remains essentially unchanged throughout the stress–strain response of the yarn till rupture, along with the coefficients of variation of the strength, even after 56 days of exposure, though there is a considerable reduction in the mean strength (i.e., 33%). Moreover, the coating percentage measured after 56 days of alkaline exposure remained unchanged: the average coating amount remained at 17%, as in the as-received yarn. This suggests that the degradation of the yarn occurs only through existing defects in the coating (see Figure 1b) rather than through loss of the coating, and there is no clear evidence of an increase in the number of defects and size of defects during exposure.
Figure 6.
Stress–strain curves from single-yarn tests on coated textile exposed to ETAG solution of pH 13 for (a) 7, (b) 28, and (c) 56 days; and typical responses of individual specimens for (d) 7, (e) 28, and (f) 56 days. Note that the dashed lines represent the initial slope.
Table 4.
Tensile properties of coated yarns after exposure (and % change in values).
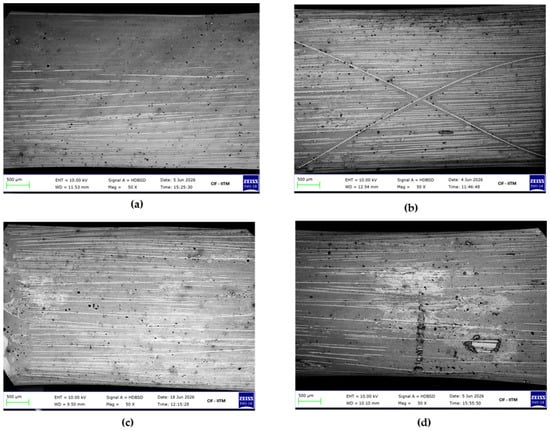
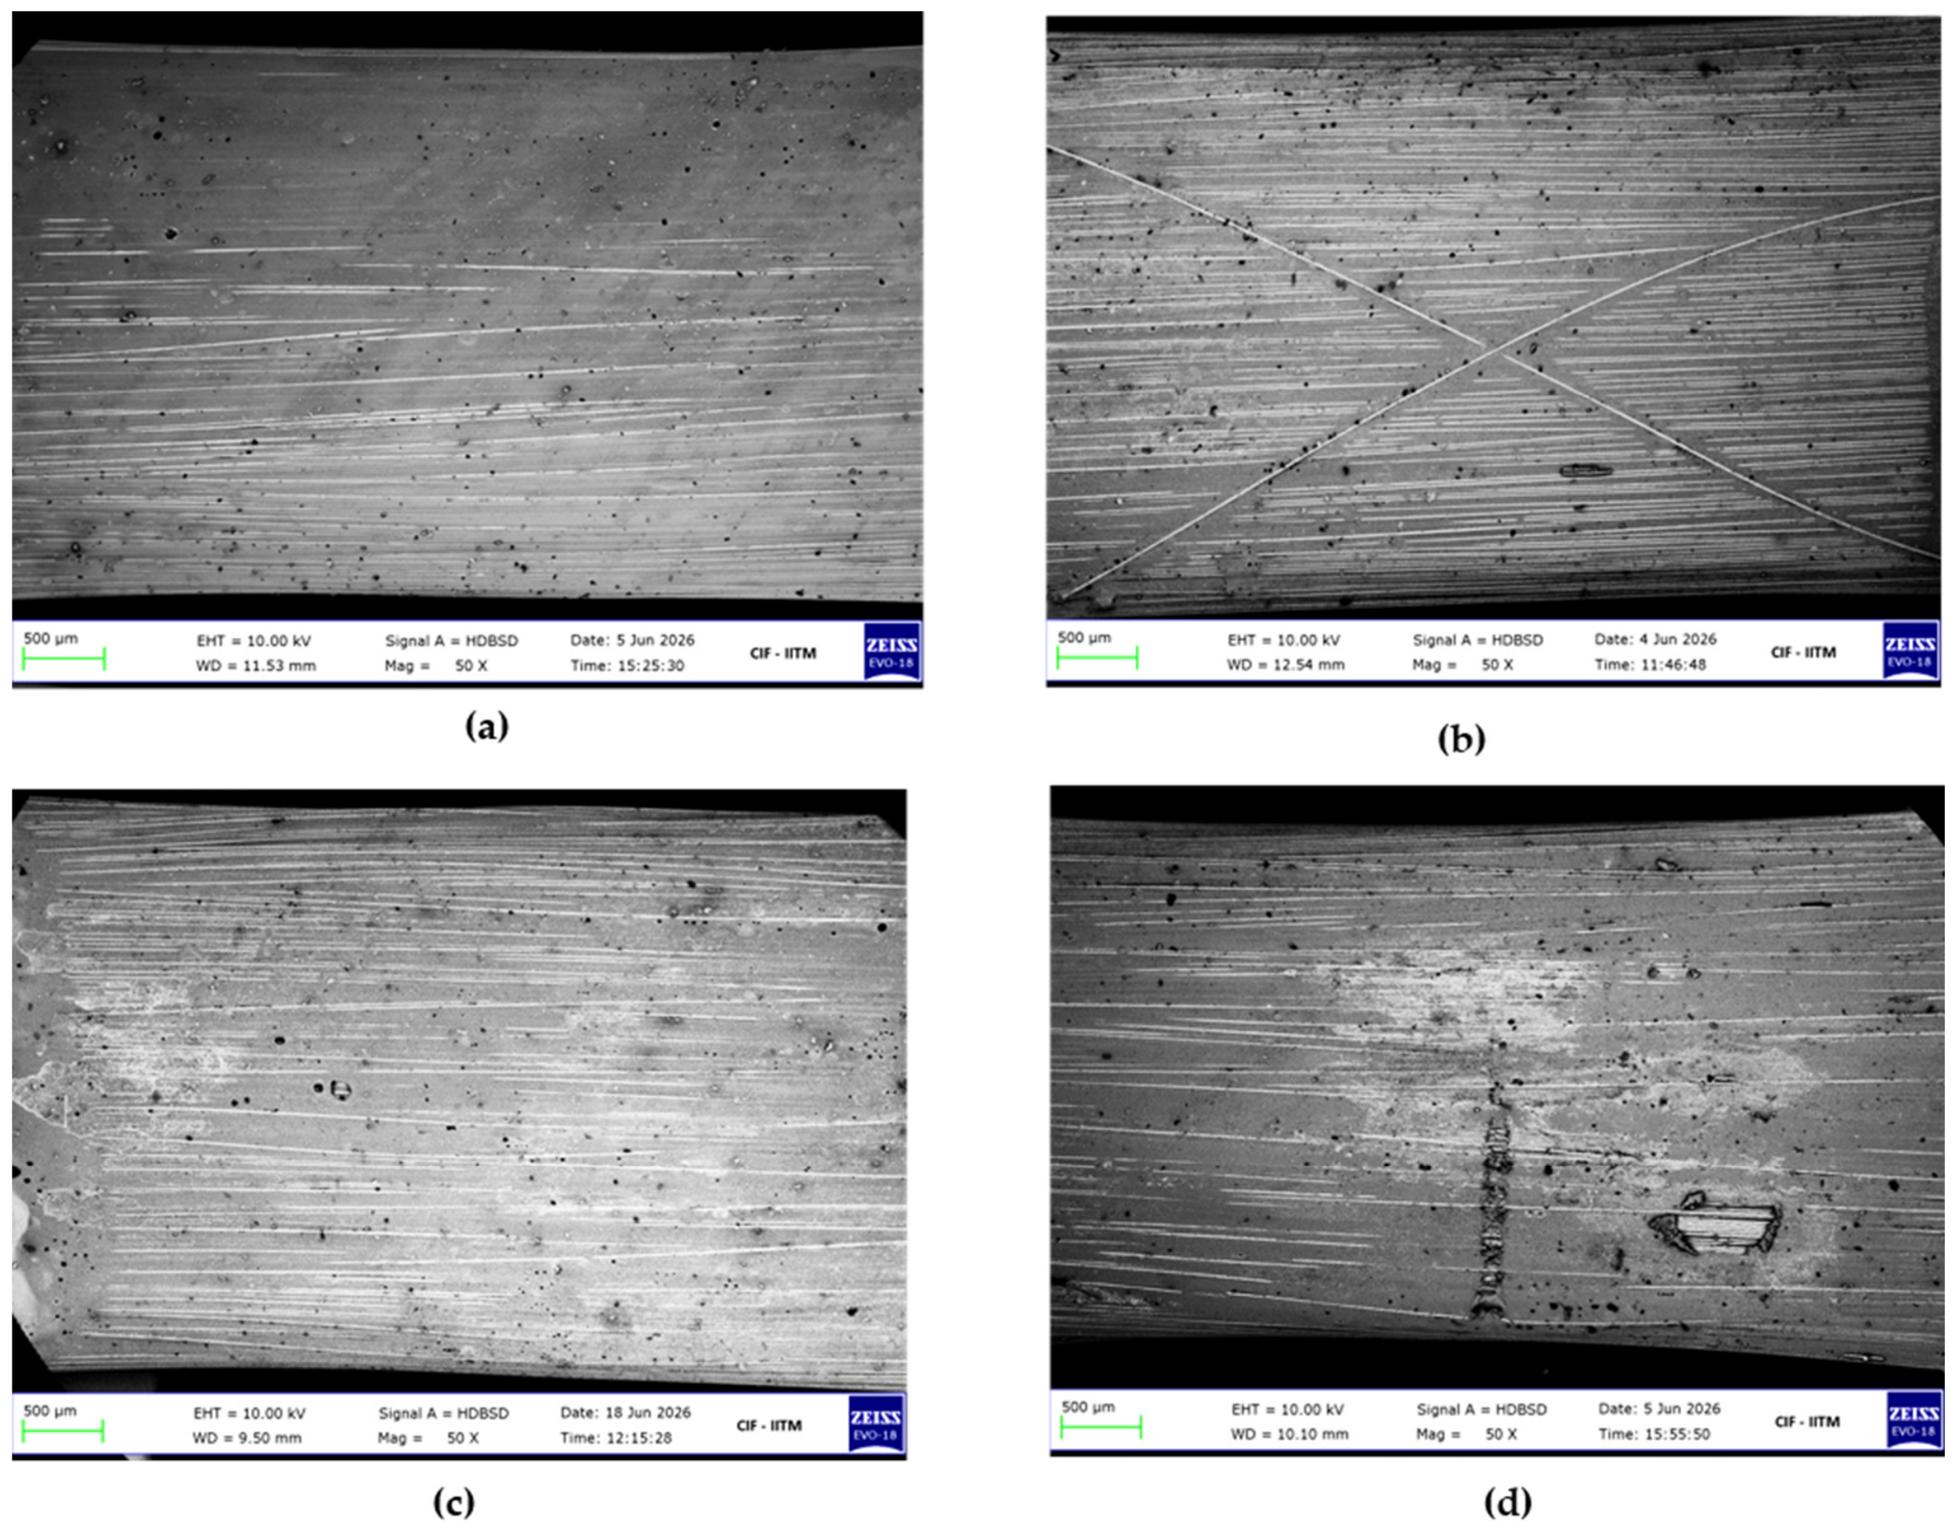
Scanning electron microscopy (SEM) images of the surface of as-received and exposed yarns are shown in Figure 7. Upon visual examination, there is no identifiable trend in the number of pits on the surface of the coated yarns (seen as microscopic spots in the image) across different exposure periods, and there is no clear change in the extent of degradation with exposure period. Note that, in some yarns, few inclined filaments were observed on the surface, as seen in Figure 7b.
Figure 7.
Scanning electron images showing the surface and cross-section of coated yarns in (a) as-received condition, after exposure to ETAG solution of pH 13 for (b) 7, (c) 28, and (d) 56 days.
4.2. Statistical Analysis and Discussion
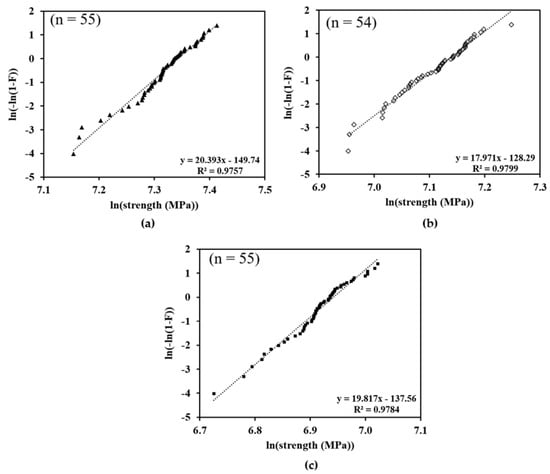
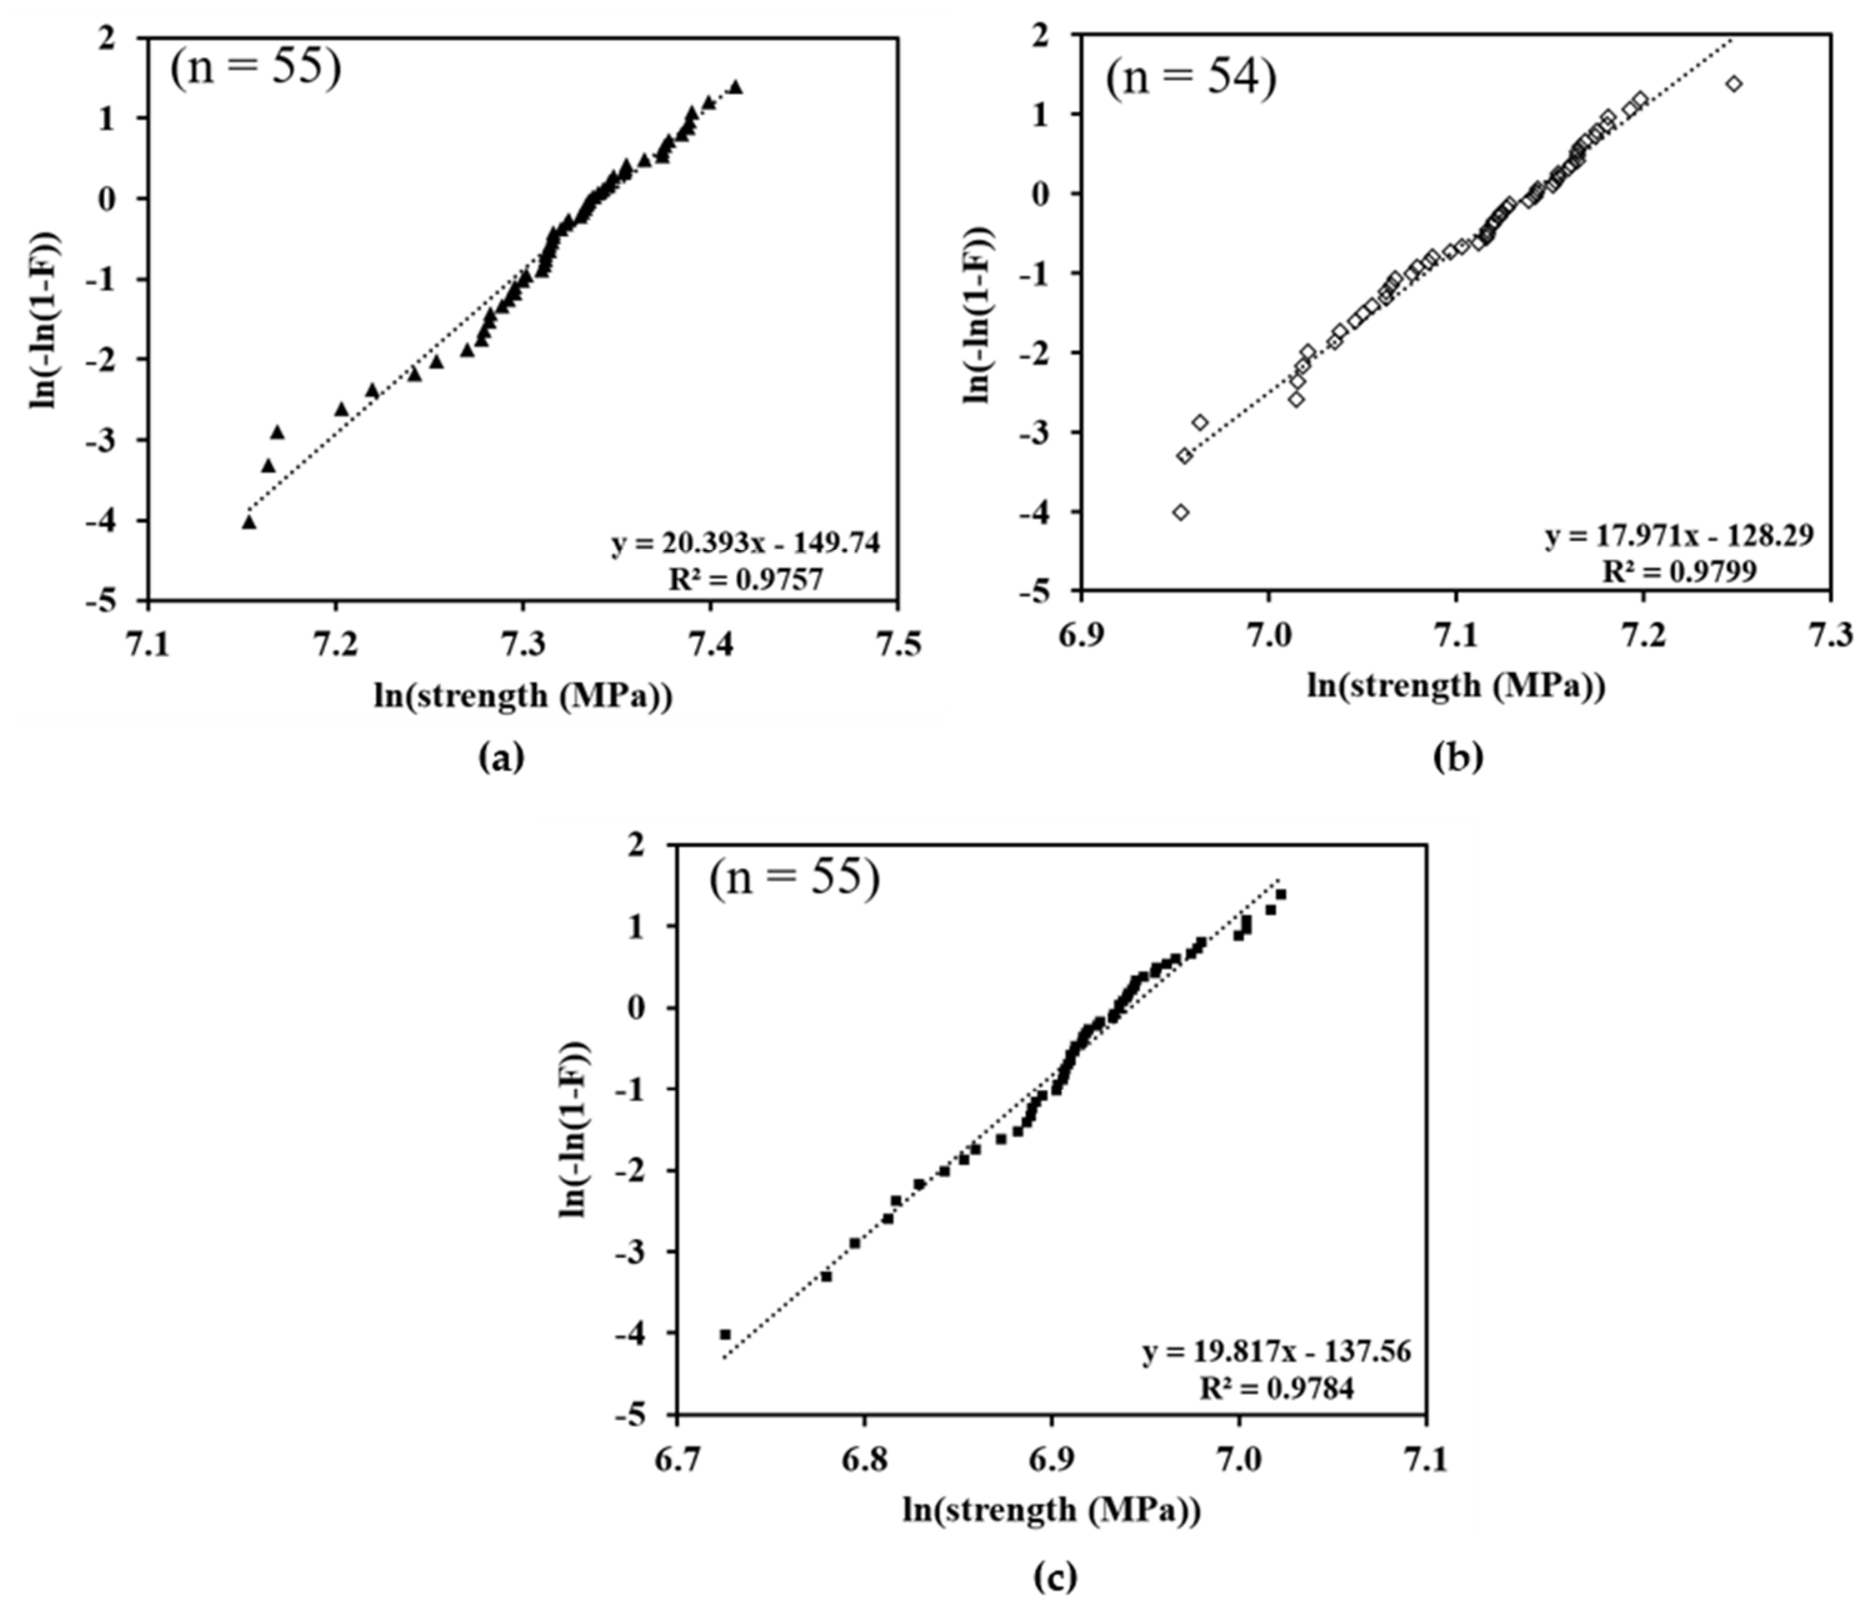
The Weibull plots shown in Figure 8 present satisfactory fits for all exposures, and the resulting parameters are given in Table 5. It is seen that the Weibull modulus (m) remains practically the same in spite of the alkaline exposure, but the reference strength (σ0) decreases significantly with exposure durations longer than 7 days, as in the case of average strength (Table 4).
Figure 8.
The Weibull plots for coated yarns exposed to the ETAG solution of pH 13 for (a) 7, (b) 28, and (c) 56 days.
Table 5.
Weibull parameters for coated yarns exposed to ETAG solution of pH 13 for different time periods.
The unchanged m-value, despite reduced strength, supports the argument that alkaline exposure does not increase defects in the yarn, as the alkaline solution penetrates the coating, causing dissolution of the glass and/or the formation and progression of pits. As mentioned earlier, only the failure of a small cluster of filaments is sufficient to cause final rupture, as evidenced by the lack of significant nonlinearity in the stress–strain curves.
4.3. Statistical Estimation of Minimum Sample Size for Testing of Yarns
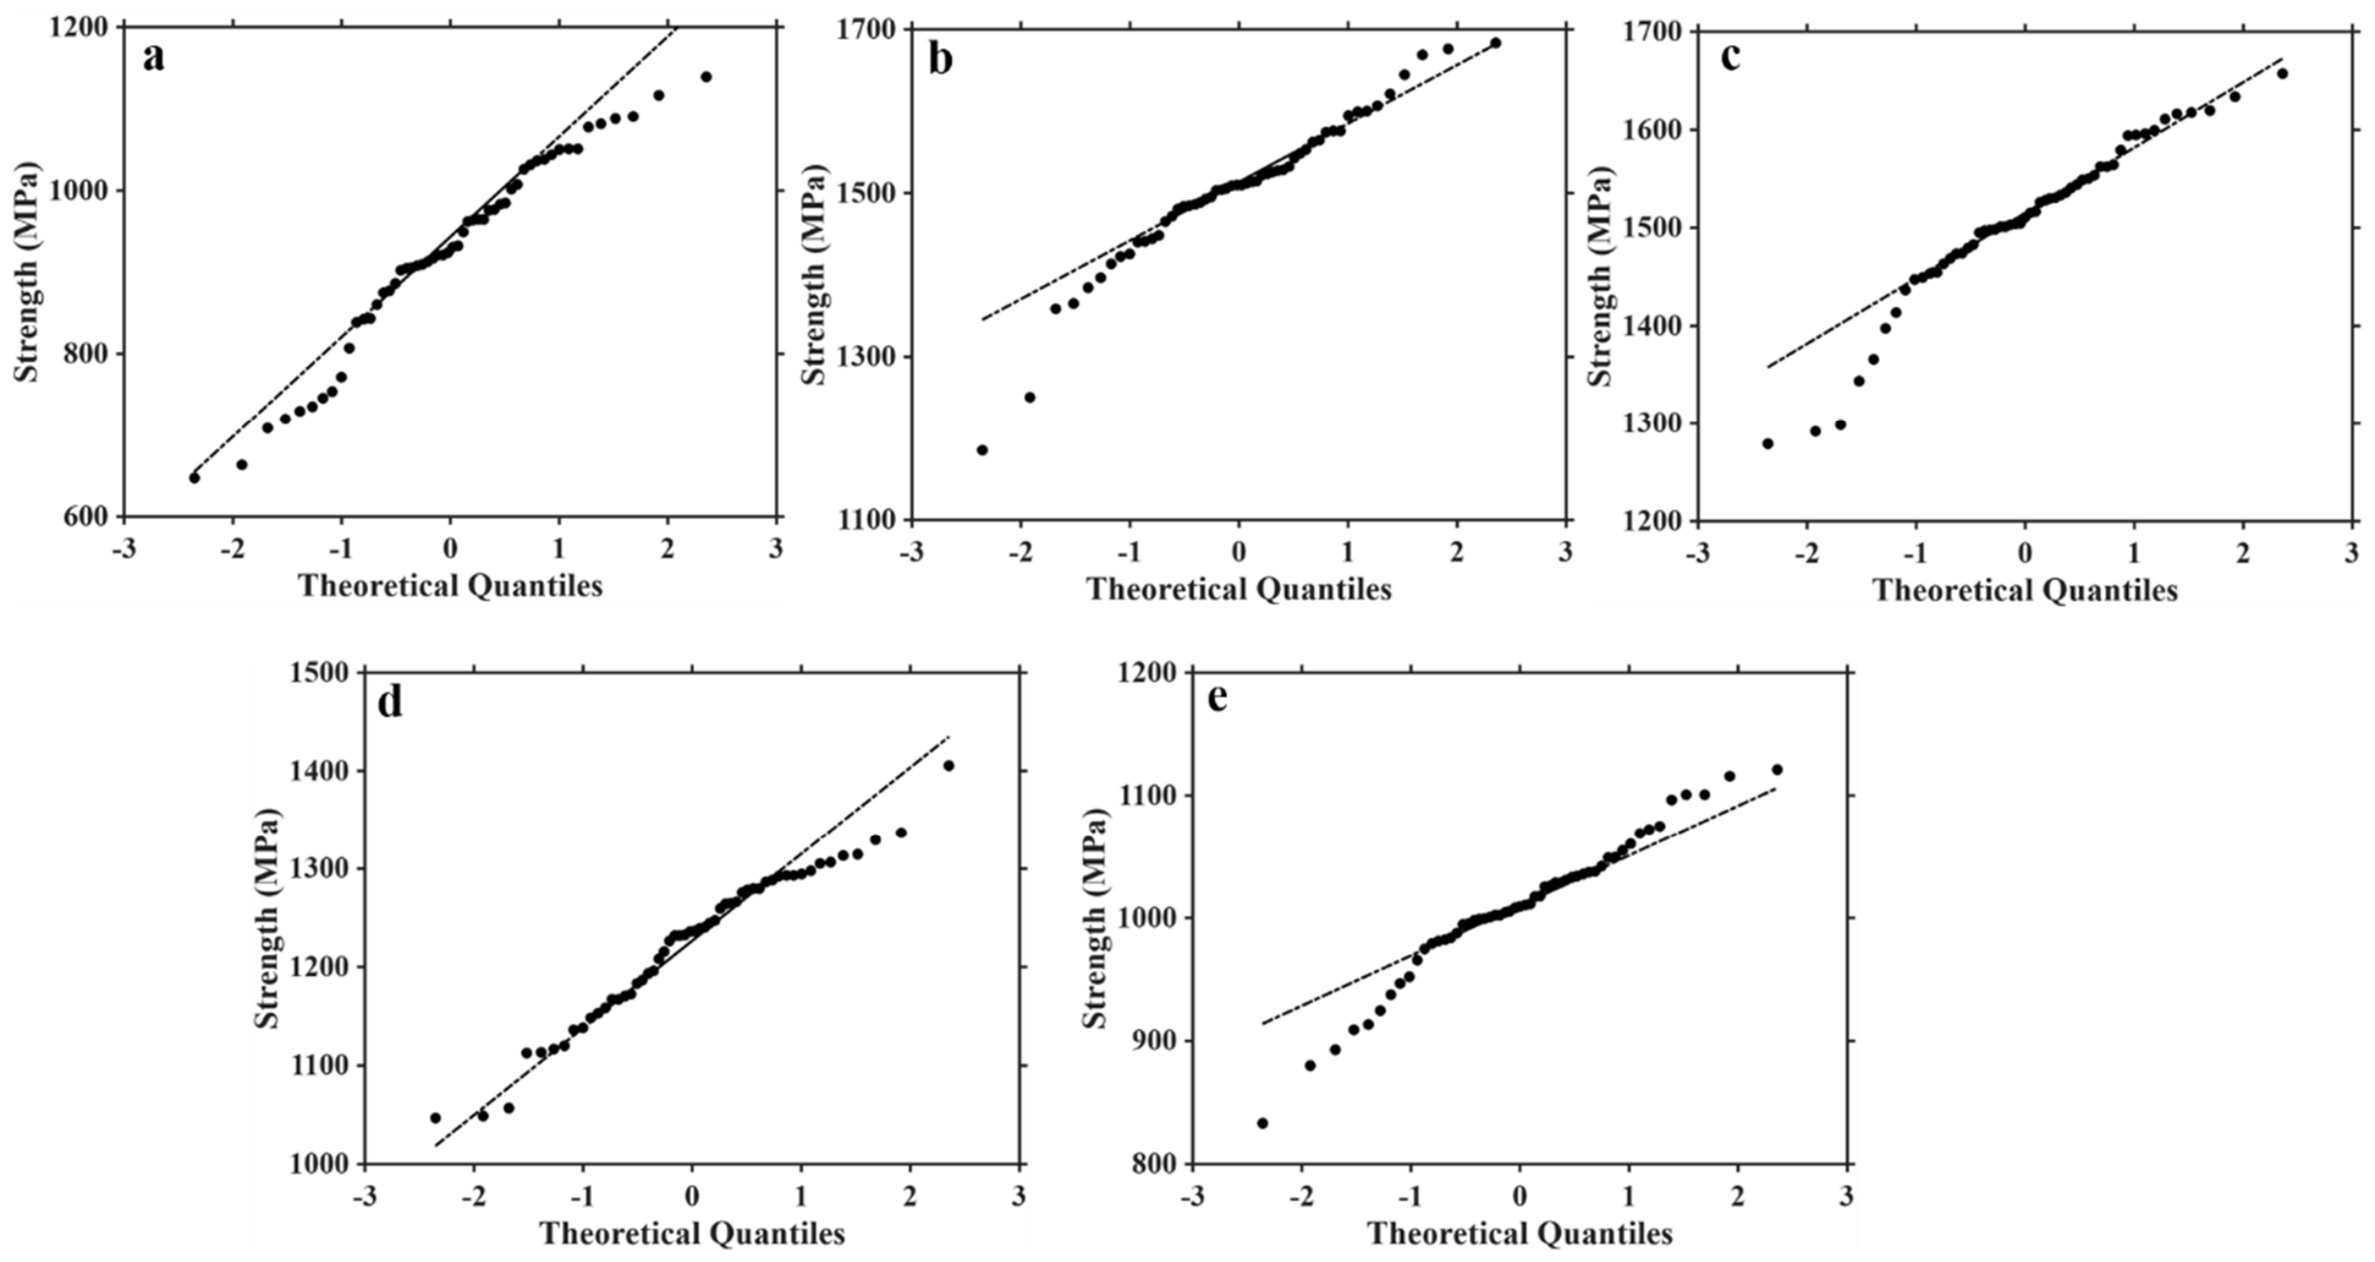
As the testing of yarns after alkaline exposure is necessary for the selection of appropriate textiles, the statistical analysis performed in the present study is used to assess the minimum number of tests required, instead of always testing large numbers, as done here. The Q-Q plots of uncoated and coated yarn (see Figure A4 in Appendix C) indicate that most of the data satisfy the normal distribution, except at the tails, where there is a slight deviation. Consequently, the normal distribution was assumed, and the number of specimens in a sample required to obtain a 5% error in the mean with 95% and 99% confidence intervals for uncoated and coated yarns is calculated using a z-test (see Equation (10)), and the values are provided in Table 6.
where is the percentage error in the mean of the sample, is the standard deviation of the population, is the number of specimens to be tested, and corresponds to the confidence level. Considering a 5% error to be acceptable in most engineering applications, it is evident that a minimum of six specimens is sufficient for coated yarns, whereas at least 25 specimens must be tested for uncoated or loose yarns (greige). These minimum requirements double when the confidence limit increases to 99%.
Table 6.
Estimation of the number of specimens to be tested at given confidence limits.
5. Conclusions
Extensive testing of uncoated and coated yarns, each with an estimated number of 4200 filaments, average filament diameter of 17 μm, and average polymer content of 17%, was performed. The variation in the mechanical behavior and the statistical distribution due to the polymer coating was assessed. Changes in the mechanical properties and the statistical strength in the coated yarn due to alkaline degradation, which is relevant for cementitious matrices, were also evaluated.
The conclusions, drawn specifically based on to the materials and test conditions considered here are, as follows:
- The tensile strength of an uncoated yarn (bundle) is lower than that estimated for a single filament, with a gradual reduction in stiffness due to progressive filament failure originating at about 40% of the yarn strength. The strength of the uncoated yarn is observed to fit the Weibull distribution.
- It is confirmed that polymer impregnation significantly enhances the strength of E-glass yarns due to the local redistribution of loads. However, as the failure is expected to occur due to the breakage of filament clusters, the strength of the impregnated yarn conforms to the Weibull distribution.
- The impregnated yarn exhibits a mean strength of about 10% higher than that estimated for the single filament, in the current study. This is attributed to the higher Weibull modulus of the impregnated yarn (i.e., 18 for coated yarn versus 7 for the single filament).
- The stiffness of the coated yarn remains unchanged until failure, unlike in the uncoated yarn, where nonlinearity can be seen as early as 40% of ultimate stress, due to local load-sharing and final failure occurring without the accumulation of damage.
- Alkaline exposure reduces the yarn strength significantly; the mean strength decreased by 19% and 33% at 28 and 56 days, respectively. However, there is no change in coefficient of variation or Weibull modulus of strength, as well as for elastic modulus.
- Scanning electron microscopy revealed defects in the coating on the as-received yarn that could allow alkali ingress and promote degradation. As the statistical nature does not change, it is hypothesized that no new defects form due to the alkaline exposure in the yarns tested here.
For the E-glass yarn considered in the study, polymer impregnation offers significant benefits over the uncoated yarn in terms of higher strength and constant stiffness (linearity) up to failure. It is shown that the failure of coated yarns conforms to the Weibull distribution, which can assist the design of composites. Importantly, the alkali attack does not lead to any significant change in stiffness and type of strength distribution, which could aid in reducing the complexity in the design of textile reinforced composites.
Author Contributions
Conceptualization, S.S.K. and R.G.; methodology, S.S.K., S.R., and R.G.; validation, S.S.K.; formal analysis, S.S.K.; investigation, S.S.K. and S.R.; data curation, S.S.K. and S.R.; writing—original draft, S.S.K.; writing—review and editing, S.S.K. and R.G.; visualization, S.S.K.; supervision, project administration, and funding acquisition, R.G. All authors have read and agreed to the published version of the manuscript.
Funding
Partial funding from Holcim Innovation Center; the DST-SERB grant (CRG-2019-004267) from the Government of India; Indus Towers; and the Centre of Excellence on Technologies for Low-Carbon and Lean Construction, IIT Madras.
Data Availability Statement
All data underlying the results are available as part of the article, and no additional source data are required. Any additional data needed are available from the corresponding author upon request.
Acknowledgments
The first author is grateful to the Ministry of Education for providing an assistantship for her doctoral studies at IIT Madras. The experimental work was carried out in the Construction Materials Laboratory and the Laboratory for the Mechanical Performance of Civil Engineering Materials in the Department of Civil Engineering at IIT Madras. The FIST Grant (SR/FST/ETII-054/2012) from the Department of Science and Technology (DST), Government of India, is acknowledged. The publication charges were covered from a corporate social responsibility grant from Indus Towers. The support of the Common Instrumentation Facility (CIF) at IIT Madras for conducting microstructural characterization studies is deeply appreciated.
Conflicts of Interest
The authors have no competing interests to declare. The funding sponsors had no role in the design of the study; in the collection, analyses, or interpretation of data; in the writing of the manuscript, and in the decision to publish the results.
Appendix A. Correlation of Video Extensometer Data with Crosshead Displacement
The displacement data obtained from the coated yarn tests were correlated, and the resulting slope was averaged. The ratio of the displacement of the crosshead to that given by the video extensometer over a 200 mm gauge length (see Figure A1), for 50 specimens, is seen to vary from 0.81 to 0.87, with an average at 0.84. If the average is taken as the conversion factor to relate the two displacements, the maximum error is expected to be 4.5%.
Figure A1.
Ratio of displacements measured with the video extensometer and crosshead of coated yarns.
Appendix B
Appendix B.1. Tensile Properties of Uncoated and Coated Yarns
The data from all the tests on as-received uncoated and coated, and coated yarns exposed to alkaline solution of pH 13 for 7, 28, and 56 days are plotted in Figure A2.
Figure A2.
Tensile strengths of (a) as-received uncoated yarns, (b) as-received coated yarns, and coated yarns exposed to ETAG solution of pH 13 for (c) 7, (d) 28, and (e) 56 days.
Appendix B.2. Estimated Weibull Parameters of a Single Filament from Uncoated Yarn Tests
The Weibull modulus (m), reference strength (, and reference failure strain ( values for single filaments, as estimated indirectly from the uncoated yarn test data, are plotted in Figure A3.
Figure A3.
The Weibull parameters estimated indirectly from uncoated yarn data for a single filament: (a) Weibull modulus (m), (b) reference failure strain (, and (c) reference strength (.
Appendix C. Normal Q-Q Plots of Yarn Strength
To verify whether the data also follow a normal distribution, normal quantile plots (Q-Q plots) were generated using the built-in module of MATLAB© (version R2026b). In a Q-Q plot, ordered strength data are plotted on the Y-axis, and theoretical quantiles are plotted on the X-axis. Ordered strength data are obtained by sorting the strength data in ascending order. Once the data are sorted, each data point is assigned a cumulative probability using Equation (A1). Theoretical quantiles ( are then obtained for each of these cumulative probabilities using the inverse normal cumulative function in Equation (A2).
where = 1, 2, 3 … n; is the total number of data points; is the inverse cumulative distribution function of the standard normal distribution; and is the theoretical quantile for a given cumulative probability. The plots show good agreement with the normal distribution, as the data follow a straight line. Note that R-square values are not considered, as outliers and skewness can also yield values close to 1.
Figure A4.
Q-Q plots for tensile strength of (a) as-received uncoated yarn, (b) as-received coated yarn, and coated yarns exposed to ETAG solution of pH 13 for (c) 7, (d) 28, and (e) 56 days.
References
- Griffith, A.A. VI. The phenomena of rupture and flow in solids. Philos. Trans. R. Soc. London. Ser. A 1921, 221, 163–198. [Google Scholar] [CrossRef] [Scilit]
- Pierce, F.T. 32—X.—Tensile tests for cotton yarns v.—“The Weakest Link” theorems on the strength of long and of composite specimens. J. Text. Inst. Trans. 1926, 17, T355–T368. [Google Scholar] [CrossRef] [Scilit]
- Weibull, W. A Statistical Theory of the Strength of Materials; Royal Swedish Institute: Stockholm, Sweden, 1939; Volume 151, pp. 1–45. [Google Scholar]
- Weibull, W. A statistical distribution function of wide applicability. J. Appl. Mech. 1951, 18, 293–297. [Google Scholar] [CrossRef] [Scilit]
- Daniels, H.E. The statistical theory of the strength of bundles of threads. I. Proc. R. Soc. Lond. Ser. A Math. Phys. Sci. 1945, 183, 405–435. [Google Scholar] [CrossRef] [Scilit]
- Rosen, B.W. Tensile failure of fibrous composites. AIAA J. 1964, 2, 1985–1991. [Google Scholar] [CrossRef] [Scilit] [PubMed]
- Harlow, D.G.; Phoenix, S.L. The chain-of-bundles probability model for the strength of fibrous materials I: Analysis and conjectures. J. Compos. Mater. 1978, 12, 195–214. [Google Scholar] [CrossRef] [Scilit]
- Harlow, D.G.; Phoenix, S.L. The chain-of-bundles probability model for the strength of fibrous materials II: A numerical study of convergence. J. Compos. Mater. 1978, 12, 314–334. [Google Scholar] [CrossRef] [Scilit]
- Smith, R.L.; Phoenix, S.L.; Greenfield, M.R.; Henstenburg, R.B.; Pitt, R.E. Lower-tail approximations for the probability of failure of three-dimensional fibrous composites with hexagonal geometry. Proc. R. Soc. London. Ser. A Math. Phys. Sci. 1983, 388, 353–391. [Google Scholar] [CrossRef] [Scilit]
- Naito, K. Effect of the number of filaments on the tensile properties of polyacrylonitrile- and pitch-based carbon fiber epoxy-impregnated bundle composites. Results Mater. 2023, 19, 100424. [Google Scholar] [CrossRef] [Scilit]
- Naito, K.; Nagai, C.; Kawasaki, S. Tensile properties and Weibull modulus of polymeric-fiber-reinforced epoxy-impregnated bundle composites. J. Compos. Sci. 2024, 8, 390. [Google Scholar] [CrossRef] [Scilit]
- Evans, K.E.; Caddock, B.D.; Ainsworth, K.L. Statistical changes during the corrosion of glass fibre bundles. J. Mater. Sci. 1988, 23, 2926–2930. [Google Scholar] [CrossRef] [Scilit]
- Scheffler, C.; Förster, T.; Mäder, E.; Heinrich, G.; Hempel, S.; Mechtcherine, V. Aging of alkali-resistant glass and basalt fibers in alkaline solutions: Evaluation of the failure stress by Weibull distribution function. J. Non-Cryst. Solids 2009, 355, 2588–2595. [Google Scholar] [CrossRef] [Scilit]
- Micelli, F.; Aiello, M.A. Residual tensile strength of dry and impregnated reinforcement fibres after exposure to alkaline environments. Compos. Part B Eng. 2019, 159, 490–501. [Google Scholar] [CrossRef] [Scilit]
- Mrduljaš, B.; Škreb, K.A.; Baričević, A.; Samaržija, M.P.; Vujasinović, E. Comparative study of natural and accelerated ageing of basalt fibres under alkaline and mildly acidic conditions. Case Stud. Constr. Mater. 2025, 23, e05472. [Google Scholar] [CrossRef] [Scilit]
- Kusumanchi, S.S.; Gettu, R. Assessing the influence of yarn characteristics on the uniaxial tensile response of glass textiles. J. Text. Inst. 2026, 117, 2334–2342. [Google Scholar] [CrossRef] [Scilit]
- ASTM D6637-11; Standard Test Method for Determining Tensile Properties of Geogrids by the Single or Multi-Rib Tensile Method. American Society for Testing and Materials: West Conshohocken, PA, USA, 2014. [Google Scholar] [CrossRef] [Scilit]
- Smith, R.L.; Phoenix, S.L. Asymptotic distributions for the failure of fibrous materials under series-parallel structure and equal-load sharing. J. Appl. Mech. 1981, 48, 75–82. [Google Scholar] [CrossRef] [Scilit]
- Watson, A.S.; Smith, R.L. An examination of statistical theories for fibrous materials in the light of experimental data. J. Mater. Sci. 1985, 20, 3260–3270. [Google Scholar] [CrossRef] [Scilit]
- Chi, Z.; Chou, T.W.; Shen, G. Determination of single fibre strength distribution from fibre bundle testing. J. Mater. Sci. 1984, 19, 3319–3324. [Google Scholar] [CrossRef] [Scilit]
- Andersons, J.; Joffe, R.; Hojo, M.; Ochiai, S. Glass fibre strength distribution determined by common experimental methods. Compos. Sci. Technol. 2002, 62, 131–145. [Google Scholar] [CrossRef] [Scilit]
- Phoenix, S.L.; Beyerlein, I.J. Statistical strength theory for fibrous composite materials. In Comprehensive Composite Materials; Kelly, A., Zweben, C., Eds.; Elsevier Pergamon: Oxford, UK, 2000; pp. 559–639. [Google Scholar] [CrossRef] [Scilit]
- Paul, S.; Gettu, R.; Arnepalli, D.N.; Samanthula, R. Experimental evaluation of the durability of glass Textile-Reinforced concrete. Constr. Build. Mater. 2023, 406, 133390. [Google Scholar] [CrossRef] [Scilit]

Disclaimer/Publisher’s Note: The statements, opinions and data contained in all publications are solely those of the individual author(s) and contributor(s) and not of MDPI and/or the editor(s). MDPI and/or the editor(s) disclaim responsibility for any injury to people or property resulting from any ideas, methods, instructions or products referred to in the content. |
© 2026 by the authors. Licensee MDPI, Basel, Switzerland. This article is an open access article distributed under the terms and conditions of the Creative Commons Attribution (CC BY) license.