


Abstract
Illegal bushmeat hunting using wire snares remains a major threat to wildlife in African protected ecosystems, yet its spatial and temporal patterns are often difficult to assess because available information is derived from non-random law-enforcement patrols. This study examined patrol-recorded wire snare removals and snare-related wildlife mortality in the Serengeti-Mara Ecosystem from 2018 to 2024. We quantified annual and monthly variation in recorded snares and mortality, modelled annual relative snare occurrence suitability, mapped relative species-specific snare-related mortality suitability for the eight most frequently recorded species, and assessed associated environmental and anthropogenic variables. Kruskal–Wallis tests, Dunn’s post hoc comparisons and Spearman’s rank correlations were used to evaluate temporal variation. Presence-only records were modelled using Maximum Entropy, with continuous predictions retained as relative suitability values from 0 to 1. After data filtering, 87,027 patrol-detected and removed wire snares and 1967 confirmed snare-related wildlife mortalities involving 13 species were retained. Recorded snare removals varied significantly among years and months, with the highest annual total in 2022 and a pronounced monthly peak in August. No monotonic temporal trend was detected in annual snare removals and recorded snare-related wildlife mortality over the seven-year study period. Wildlife mortality also varied significantly among years, months and species, with the highest monthly levels occurring in August and September. Wildebeest accounted for the greatest recorded mortality. Annual MaxEnt models identified recurring areas of relatively high fitted suitability for patrol-detected snare occurrence, particularly in northern and western Serengeti National Park, Grumeti and Ikorongo Game Reserves, the Makundusi grazing lands and Ikona Wildlife Management Area. Species-specific models showed spatial variation in recorded snare-related mortality suitability, while elevation, long-term mean annual precipitation and distance to buildings were among the predictors associated with the fitted patterns. Because standardized information on patrol effort, spatial coverage, and detection was unavailable, these predictions should be interpreted as exploratory patterns of patrol-recorded detections rather than unbiased estimates of the underlying distribution or intensity of illegal hunting. The identified areas and periods may therefore inform field verification and adaptive patrol planning, but should not be used alone to infer snaring intensity or determine patrol allocation.
1. Introduction
Biodiversity is declining at an unprecedented rate as a result of habitat loss, climate change, invasive species, pollution, and the unsustainable exploitation of wild species, threatening ecosystem integrity and the provision of ecosystem services worldwide [1]. Among these drivers, illegal wildlife hunting for bushmeat remains one of the most significant and persistent threats to terrestrial biodiversity, particularly across tropical forests and African savanna ecosystems [2,3,4,5]. Bushmeat hunting not only reduces wildlife populations through direct mortality but also alters species composition, disrupts trophic interactions, diminishes ecosystem resilience, and undermines the ecological and economic value of protected areas [2,3]. In many African countries, the continued removal of wildlife has contributed to local population declines in several large mammals, compromising ecosystem functioning and threatening conservation investments aimed at maintaining viable wildlife populations [2,3,4]. Recent global syntheses further identify wire snaring as one of the most widespread and destructive forms of illegal wildlife exploitation because of its low cost, ease of deployment, and indiscriminate nature, making it an escalating conservation concern across protected areas worldwide [6,7,8].
Across sub-Saharan Africa, illegal bushmeat hunting is sustained by a complex interaction of socioeconomic, cultural and ecological factors. Rural communities living adjacent to protected areas often rely on bushmeat to supplement household nutrition, generate income and buffer economic hardship where alternative livelihood opportunities are limited [3,4,9,10,11,12,13,14,15]. Growing urban demand for bushmeat, improved market access and expanding transportation networks have further increased commercial incentives for illegal hunting [3,9,11]. Although governments have strengthened wildlife legislation and expanded protected-area networks, illegal hunting continues because the underlying socioeconomic drivers remain largely unresolved [15,16,17,18]. Consequently, effective conservation requires an understanding not only of why illegal hunting occurs but also where and when it is most likely to occur.
Wire snares represent one of the greatest challenges confronting wildlife conservation because they are inexpensive, easy to manufacture from readily available materials and can remain active for extended periods without requiring the hunter’s presence [7,8]. Hunters commonly form wire into a loop attached to a trigger and anchor it to a tree, shrub, wood stake, fence, or other fixed structures. Snares may be placed singly or in lines wherever animal movement is concentrated, including wildlife trails, narrow passageways, fence openings, river crossings, water-access routes, and migration corridors [7,8]. Hunters may adjust the height and diameter of the loop according to the expected body size of the intended animal, placing larger loops at neck or chest height for large ungulates and smaller loops closer to the ground for medium-sized or smaller species. Unlike selective hunting methods, wire snares capture wildlife indiscriminately, affecting target and non-target species regardless of age, sex, or conservation status [7,8,19]. Animals that escape often suffer severe injuries, impaired mobility, and increased vulnerability to predation, while many die from prolonged entanglement before patrol teams locate them [7,8]. In addition to reducing populations of herbivores targeted for bushmeat, snaring also threatens carnivores and scavengers through incidental capture and prey depletion, producing cascading ecological effects throughout entire ecosystems [2,7,8]. These broad ecological impacts have elevated wire snaring from a localized management issue to a global biodiversity priority requiring innovative surveillance and conservation strategies [6,7,8].
The Serengeti-Mara Ecosystem (SME) is one of the world’s most important protected landscapes, covering approximately 30,000 km2 across northern Tanzania and southwestern Kenya. The ecosystem supports exceptional biological diversity and sustains the largest remaining terrestrial migration of large mammals, involving approximately 1.3 million wildebeest (Connochaetes taurinus), more than 200,000 plains zebra (Equus quagga), and hundreds of thousands of Thomson’s gazelles (Eudorcas thomsonii) and other herbivores [20,21,22,23,24,25,26]. Seasonal migration, driven by rainfall gradients and forage availability, underpins ecological processes that maintain predator populations, nutrient cycling and ecosystem productivity [20,23,25,26]. The ecological significance of the SME extends beyond biodiversity conservation, supporting tourism, national economies and the livelihoods of millions of people through ecosystem services and nature-based enterprises [21,22,23].
Despite its global conservation importance, the SME continues to experience persistent illegal bushmeat hunting. Communities surrounding protected areas frequently interact with wildlife, creating opportunities for illegal harvesting where wildlife populations overlap with agricultural land, livestock grazing areas, and expanding human settlements [9,10,11,12,13,14,15]. Previous studies in western Serengeti have shown that bushmeat contributes substantially to household protein consumption and income, while economic incentives, wildlife availability and perceived enforcement risks strongly influence hunters’ decisions [9,12,13,14]. Studies have also demonstrated that illegal hunters adapt their strategies in response to patrol activities by modifying hunting locations, travel routes and snare placement, thereby complicating law-enforcement efforts [12,27,28]. Consequently, understanding the spatial and temporal dynamics of illegal hunting has become increasingly important for improving the effectiveness of conservation interventions.
In response to these challenges, Tanzania has strengthened wildlife conservation through legislative reforms, enhanced anti-poaching operations, expansion of protected areas and the establishment of Wildlife Management Areas that promote community participation in conservation [29,30,31]. However, the presence of these interventions does not by itself indicate where and when illegal snaring persists or whether recorded incidents are concentrated in particular parts of the landscape. Spatially explicit information is therefore needed to determine the distribution of patrol detected and removed wire snares, identify recurrent areas of relatively high occurrence, examine seasonal variation and assess the environmental and anthropogenic conditions associated with these patterns. Such information can complement existing conservation measures by helping managers direct patrol and de-snaring resources towards locations and periods requiring greater attention.
Ranger patrols conducted by the Tanzania National Parks Authority (TANAPA), Tanzania Wildlife Management Authority (TAWA), the Grumeti Fund (GF) and other conservation organizations represent the primary mechanism for detecting and removing wire snares while documenting wildlife mortality associated with illegal hunting. Advances in ranger-based monitoring systems, including EarthRanger and other geospatial patrol databases, now enable systematic recording of illegal activities, patrol observations, and wildlife mortality across extensive protected landscapes [32,33]. These operational datasets provide unprecedented opportunities to understand the spatial ecology of illegal hunting while supporting adaptive management and evidence-based conservation planning [32,34,35,36].
Recent advances in species distribution modelling have further enhanced the capacity to identify areas where illegal activities are most likely to occur. Maximum Entropy (MaxEnt) modelling has become one of the most widely applied approaches for predicting species distributions and environmental suitability from presence-only data because of its strong predictive performance, ability to accommodate complex relationships and robustness when occurrence data are limited [37,38,39,40]. More recently, MaxEnt has been successfully applied beyond traditional species distribution studies to predict spatial patterns of wildlife crime, poaching risk and conservation threats [27,40]. By integrating patrol-derived observations with environmental and anthropogenic variables, predictive modelling can identify recurring hotspots of illegal hunting, improve patrol prioritization and support intelligence-led conservation strategies [27,34,35,36,41]. Nevertheless, relatively few studies have applied these approaches to long-term patrol datasets within the SME.
Most previous research in the Serengeti has focused on the socioeconomic drivers of bushmeat hunting, household dependence on wildlife resources, market dynamics, poacher behaviour, conservation policy and law-enforcement effectiveness [9,10,11,12,13,14,15,16,17,27,28,32,33,42]. While these studies have substantially improved understanding of why illegal hunting persists, comparatively little attention has been given to integrating long-term patrol records with predictive spatial modelling to quantify temporal dynamics, identify recurring hotspots of wire snaring, evaluate species-specific mortality patterns and determine the environmental conditions associated with illegal hunting across multiple years. Consequently, the spatial and temporal information routinely generated through patrol operations has not been fully utilized to support a broader multi-year understanding of recorded snaring dynamics across the SME. Analyzing these data can therefore complement existing conservation interventions by providing evidence to refine patrol prioritization, de-snaring operations and field verification.
This study addresses this gap by integrating seven years (2018–2024) of operational ranger patrol records with MaxEnt modelling to investigate the spatiotemporal dynamics of illegal bushmeat hunting in the Tanzanian sector of the SME. Specifically, the study aimed to (i) quantify annual and monthly variation in patrol-detected wire snare removals and snare-related wildlife mortality, (ii) identify recurring areas of relative snare occurrence suitability and species-specific snare-related mortality occurrence suitability, and (iii) determine the environmental and anthropogenic factors associated with the observed spatial patterns. Rather than estimating the true distribution or intensity of illegal hunting, the resulting suitability maps provide spatially explicit evidence to support field verification, adaptive patrol planning, and targeted anti-poaching interventions.
2. Materials and Methods
2.1. Study Area
Our study was conducted in the SME, located between 1.6° and 3.2° S, and 33.8° and 35.2° E, east of Lake Victoria and northwest of the Ngorongoro highlands. The study landscape comprises protected areas with different legal designations and wildlife use regimes, including Serengeti National Park (SNP), the Ikorongo–Grumeti Game Reserves (IGGRs), and the Ikona Wildlife Management Area (IWMA) (Figure 1). SNP is managed by TANAPA primarily for ecosystem protection and non-consumptive tourism and is not open to licenced tourist or resident hunting. The IGGR falls under the authority of the TAWA, with the Grumeti Fund (GF) supporting conservation and operational management through a partnership arrangement. The IWMA is managed through community-based wildlife institutions, with support from government authorities and conservation partners.
Figure 1.
Map of the Serengeti-Mara ecosystem showing the study area containing various protected areas. The inset in the upper right shows the location of the study area within Tanzania.
Legal wildlife use differs among these protected area categories. In designated hunting blocks, tourist or trophy hunting may occur only under government-issued licences, approved quotas, specified hunting seasons, and professional supervision [29,30]. Within the IWMA, community-based wildlife use is governed by an authorized association and approved land-use, resource-management, and benefit-sharing arrangements. Where permitted, such use may include photographic tourism and quota-controlled consumptive activities conducted under formal permits and institutional oversight [31]. These legally authorized activities are distinct from the illegal bushmeat hunting examined in this study. Here, illegal bushmeat snaring refers specifically to the unauthorized placement or use of wire snares to capture or kill wildlife. The dataset included only snares detected and removed by law-enforcement patrols and wildlife mortalities attributed to those snares. It excluded all animals taken through licenced tourist hunting, authorized community-based wildlife use, resident hunting, problem-animal control, or other legally approved wildlife-use activities.
The SME contains grasslands, wooded grasslands, savanna woodlands, shrublands, riverine forests, wetlands, and riparian systems, which collectively support diverse wildlife communities and large-scale ecological processes [43,44]. The landscape is globally recognized for the annual migration of wildebeest (Connochaetes taurinus), accompanied by zebra (Equus quagga) and gazelles (Eudorcas thomsonii and Nanger granti) [16,20,21,27]. It also supports large herbivores, including elephants (Loxodonta africana) and black rhinoceroses (Diceros bicornis), and large carnivores, including lions (Panthera leo), African wild dogs (Lycaon pictus), cheetahs (Acinonyx jubatus), and leopards (Panthera pardus). The region has a bimodal rainfall regime, with short rains occurring from November to December and long rains from March to May [22,23]. Rainfall variability influences wildlife distribution and seasonal movements.
Communities surrounding the ecosystem are ethnically diverse and include Kuria, Ikizu, Ikoma, Jita, Natta, Sukuma, and others. They rely heavily on subsistence agriculture and livestock keeping, while earlier studies have documented illegal bushmeat hunting as a source of food, income, and trade in the region [12,13].
2.2. Data Collection
We conducted this study under permit number CST00000274-2023-2025-00125 issued by the Tanzania Wildlife Research Institute (TAWIRI) and the Tanzania Commission for Science and Technology (COSTECH). We did not involve any field-based activities or direct interaction with wildlife; instead, we utilized existing patrol and monitoring data collected from 2018 to 2024 from the SNP de-snaring team database and the GF EarthRanger system. Patrols were conducted on foot, by vehicle, and, where required, through aerial surveillance. They included both routine patrols and targeted deployments responding to intelligence, previous detections, wildlife movements, and operational priorities.
The data recording procedures, platforms and operational arrangements were not identical across institutions or throughout the study period. One institution entered incident information in real time into a digital monitoring system during field operations, whereas the other documented observations during patrols and uploaded daily reports after patrol completion. At each observation point, patrol teams recorded the date, geographic coordinates, incident type, and number of snares removed, together with species and mortality information where applicable. Each georeferenced observation point constituted an incident record. When multiple snares were detected at the same observation point, they were recorded within that incident with an associated snare count rather than entered as separate georeferenced records. Only records that meeting the specified inclusion and spatial-quality criteria were retained. However, the available data did not contain sufficiently standardized information on patrol deployment, duration, distance travelled, personnel, team size, search effort, or annual spatial coverage to determine whether patrol effort and reporting intensity changed systematically from 2018 to 2024. The temporal and spatial results, therefore, describe variation in recorded detections and may partly reflect changes in operational deployment and detectability, which are recognized limitations of ranger-based monitoring data [32].
The original patrol databases contained records of several illegal bushmeat hunting methods, including active hunting, poisoning, wire snaring, and other wildlife offences. We filtered the datasets to retain only incidents involving wire snares. Records of snares intercepted while being transported by suspected hunters were excluded because their coordinates represented interception locations rather than locations where the snares had been deployed. Records with coordinates outside the defined study-area boundary were also excluded because they were considered likely to result from GPS configuration or coordinate-entry errors. Only snares physically located and removed from the landscape by patrol teams were retained After filtering, 87,027 wire snares were retained from the 96,298 wire snares initially recorded in the patrol databases: 2018 (n = 16,736), 2019 (n = 12,644), 2020 (n = 7315), 2021 (n = 12,372), 2022 (n = 17,379), 2023 (n = 11,603), and 2024 (n = 8978). These values represent the total numbers of snares detected and removed rather than the numbers of georeferenced incident records, because a single patrol incident could contain multiple snares.
Snare-related wildlife mortality was derived directly from the retained snare-removal incidents. Where an injured or dead animal was found in association with a removed snare, the animal condition, species, and location were recorded within the same incident. Only records documenting an animal that had died directly because of a wire snare were included in the mortality dataset. This filtering process yielded a total of 1967 out of 2569 recorded wildlife deaths during the same period: 2018 (n = 256), 2019 (n = 366), 2020 (n = 265), 2021 (n = 322), 2022 (n = 273), 2023 (n = 302), and 2024 (n = 183). The databases did not consistently distinguish neck, body, and foot snares, nor did they systematically record snare height, loop diameter, anchoring structure, or intended target species. Consequently, all confirmed wire snare records were analyzed as a single category, and differences in species-specific mortality could not be attributed to particular snare types or designs, placement strategies, or intended target species.
2.3. Data Analysis
2.3.1. Recorded Snare Removals and Snare-Related Wildlife Mortality
We examined annual and monthly variation in detected and removed wire snares and recorded snare-related wildlife mortality. For snare comparisons, the analytical unit was the georeferenced patrol incident, with each incident representing one observation location and containing the total number of snares detected and removed at that location. Where multiple snares occurred within the same incident, they were retained as a single incident-level count rather than treated as independent observations. Annual totals were calculated for descriptive purposes, whereas differences among years were assessed using the distributions of incident-level snare counts. For monthly comparisons, incident records from all study years were grouped according to calendar month, and pooled monthly totals were calculated descriptively. Differences among months were likewise tested using the distributions of incident-level counts assigned to each month rather than the twelve pooled monthly totals themselves. Because these counts did not meet the assumptions required for parametric comparison. Kruskal–Wallis tests were used to assess variation in snare counts and wildlife mortality among years and months, as well as mortality differences among species. Where significant differences were detected, Dunn’s post hoc tests were conducted for pairwise comparisons, with p-values adjusted using the Benjamini–Hochberg procedure to control the false discovery rate. Spearman’s rank correlation was used to assess monotonic trends in annual totals of detected and removed snares, and recorded snare-related wildlife mortality from 2018 to 2024. For wildlife mortality, statistical significance was determined using a two-sided exact test implemented through the cor.test() function in R (method = “spearman”, exact = TRUE). No tied ranks occurred among the seven annual mortality totals; therefore, no tie adjustment was required. Data were analyzed using R version 4.4.3 (R Core Team, 2025), and we considered all statistical results significant at p < 0.05. Because standardized patrol efforts were unavailable, the results represent patterns in patrol-recorded snare detections rather than independent estimates of the true underlying intensity of snaring.
2.3.2. Environmental and Anthropogenic Variables
To identify environmental and anthropogenic variables associated with annual relative snare occurrence suitability and relative species-specific snare-related wildlife mortality suitability, we selected the following predictor variables: land cover (as a proxy for habitat structure and land use), elevation, distances to cropland, roads, buildings, and rivers, the Terrain Ruggedness Index (TRI), Enhanced Vegetation Index (EVI), and annual rainfall [27,37,45]. EVI was selected over Normalized Difference Vegetation Index (NDVI) to represent vegetation productivity due to its reduced sensitivity to background noise, atmospheric interference, and pixel saturation, particularly during the dry season. A summary of these predictor variables is presented in Table 1. To minimize potential problems arising from collinearity, we excluded the categorical land cover variable from the collinearity assessment and retained it separately as a categorical predictor in the MaxEnt models. For the continuous predictors, we calculated pairwise Pearson correlation coefficients using the corrplot package and considered absolute correlation coefficients of |r| ≤ 0.7 [45]. All continuous predictors met this criterion and were therefore retained for modelling.
Table 1.
Environmental and anthropogenic variables used to model relative snare occurrence suitability and relative species-specific snare-related wildlife mortality suitability.
Elevation data were obtained from the global 30 m Shuttle Radar Topography Mission (SRTM) Digital Elevation Model (DEM), downloaded via the U.S. Geological Survey (https://earthexplorer.usgs.gov, accessed on 23 March 2026). DEM tiles were merged into a single raster, clipped to the area of interest using ArcGIS Pro version 3.3, and used to calculate the Terrain Ruggedness Index (TRI) in QGIS 3.34.8. Spatial datasets for buildings, rivers, and roads were sourced from OpenStreetMap (http://download.geofabrik.de/africa/tanzania.html, accessed on 8 May 2025), and Euclidean distance rasters (at 30 m resolution) for each feature were generated using the Euclidean Distance tool in ArcGIS Pro version 3.3. Long-term annual mean precipitation data was obtained from WorldClim v2, with 30 s resolution, which provides spatially interpolated climatic averages for the 1970–2000 reference period (https://www.worldclim.org/data/worldclim21.html, accessed on 8 May 2025). This layer was included as a static predictor representing the broad spatial precipitation gradient across the study area. It was not treated as year-specific rainfall for 2018–2024 and was therefore not used to quantify interannual rainfall variability. In each annual model, the layer was used to assess whether the spatial distribution of recorded snares and snare-related wildlife mortality incidents corresponded with areas characterized by relatively wetter or drier long-term climatic conditions. We assessed vegetation productivity using annual dry-season Enhanced Vegetation Index (EVI) raster layers for 2018–2024. EVI data were obtained from the Landsat Collection 2 Tier 1 Level 2 eight-day EVI composite product (LANDSAT/COMPOSITES/C02/T1_L2_8DAY_EVI) available through Google Earth Engine (GEE), at a spatial resolution of 30 m. The dataset provides precomputed EVI values derived from the near-infrared, red and blue spectral bands of Landsat imagery. Each eight-day composite is generated from available Landsat observations, with the most recent pixel selected within each compositing interval. For each year, EVI composites corresponding to the dry season (1 July–30 September) were selected and spatially restricted to the study area. The available EVI observations were subsequently aggregated on a pixel-by-pixel basis using the median to generate a single representative dry-season EVI raster for each year. The median was selected to reduce the influence of anomalous observations and temporal variability within the dry season. Pixels masked in the source composites were excluded automatically from the median calculation, while pixels without valid observations throughout the compositing period remained masked and were excluded from subsequent statistical analyses. This procedure generated seven annual dry-season EVI raster layers (2018–2024) at 30 m spatial resolution. Furthermore, land cover data at 10 m resolution were retrieved for each year from 2018 to 2024 using the Esri Sentinel-2 Land Cover Explorer platform (Esri|Sentinel-2 Land Cover Explorer). To ensure spatial consistency with other predictors, the 10 m land cover raster was resampled to 30 m using the nearest neighbour method, which preserves the original categorical class values and avoids introducing artificial intermediate classes. All environmental and anthropogenic predictor layers were subsequently aligned to a common coordinate reference system, spatial extent, and 30 m resolution to ensure compatibility and consistency in the MaxEnt modelling analyses.
2.3.3. Annual Snare Occurrence and Species-Specific Mortality Occurrence Suitability
To investigate the spatiotemporal dynamics of illegal bushmeat hunting, we modelled annual relative snare occurrence suitability and species-specific snare-related mortality suitability using Maximum Entropy (MaxEnt version 3.4.4). The analysis used georeferenced patrol incidents where one or more wire snares had been detected and removed, together with locations of confirmed snare-related wildlife mortality. For annual snare models, each incident coordinate was entered once regardless of the number of snares recorded at that location. Similarly, for species-specific mortality models, duplicate coordinates for the same species were retained as a single occurrence location. Because confirmed absence data were unavailable, these spatial records were analyzed within a presence-background framework. MaxEnt was selected over alternative presence-only approaches such as BIOCLIM and DOMAIN because of its established predictive performance and broad application in ecological niche and species distribution modelling [37,38,39,45]. The method estimates relative suitability by relating observed occurrence locations to environmental and anthropogenic conditions represented across the modelling landscape.
Separate annual snare models were fitted for each year from 2018 to 2024, while individual mortality models were developed for the eight most frequently recorded species. Species-specific mortality locations were pooled across the full study period because annual sample sizes for several species were insufficient for reliable year-specific modelling. These pooled locations were associated with predictor layers representing 2024 landscape conditions. Relatively stable variables, including elevation, terrain ruggedness, distance to rivers and long-term mean annual precipitation, were treated as unchanged across the study period, whereas land cover, Enhanced Vegetation Index (EVI), cropland, roads and buildings may have varied through time. The species-specific models represent exploratory spatial associations between mortality locations recorded during 2018–2024 and the landscape conditions represented by the 2024 predictor layers. They should not be interpreted as reconstructions of environmental conditions at the time individual mortality events occurred or as estimates of current species-specific mortality risk.
Model performance was evaluated using ten-fold cross-validation in MaxEnt version 3.4.4. Occurrence records were partitioned into ten approximately equal subsets, with approximately 90% used for training and the remaining 10% reserved for testing in each iteration. Model performance was assessed using the mean test Area Under the Receiver Operating Characteristic Curve (AUC) and its standard deviation across the ten folds. Additionally, test omission rates at the 10th-percentile training-presence threshold were extracted as a complementary performance metric, representing the proportion of withheld occurrence locations assigned suitability below the selected threshold. Because the cross-validation procedure was not spatially structured, these metrics assessed internal model performance rather than spatial transferability. The same parameterization was applied across all annual snare-occurrence and species-specific mortality models to maintain a consistent modelling framework and facilitate comparison of spatial patterns among years and species. Specifically, all models used a regularization multiplier of 1 with linear, quadratic, and hinge feature classes. Model-specific tuning was not performed because independently optimized settings could introduce additional variation in model complexity among datasets, complicating interpretation of differences attributable to year or species. However, these fixed settings were not demonstrated to be optimal for every individual model, and this limitation is considered when interpreting fine-scale predictions. A total of 10,000 randomly generated background points were used to characterize the range of environmental conditions within the modelling extent; these background points were not treated as confirmed absence locations. Because patrol-route and patrol-effort information were insufficient to construct an effort-informed bias layer or target-group background, the predicted suitability surfaces may partially reflect patterns of patrol accessibility and detection in addition to the underlying spatial distribution of illegal hunting activities.
We evaluated model performance using the Area Under the Receiver Operating Characteristic Curve (AUC) and its standard deviation, calculated from the ten replicate runs and averaged across replicates. In a presence-background framework, AUC measures the ability of the model to discriminate recorded occurrence locations from randomly selected background locations rather than from confirmed absence locations. AUC values range from 0.5, indicating performance no better than random, to 1.0, indicating perfect discrimination. Following commonly accepted guidelines [37,40]. AUC values of 0.5–0.6 indicate failed models, 0.6–0.7 poor performance, 0.7–0.8 fair performance, 0.8–0.9 good performance, and 0.9–1.0 excellent performance. The annual snare occurrence models achieved mean test AUC values ranging from 0.813 to 0.904, whereas the species-specific mortality models produced AUC values between 0.729 and 0.893. However, because training and testing records were randomly partitioned from the same patrol-derived datasets, these AUC values represent internal hold-out evaluation rather than spatially independent validation. Spatial-block cross-validation and additional performance metrics such as partial ROC, continuous Boyce index, and omission rates were not performed.
The continuous logistic outputs generated by MaxEnt were imported into ArcGIS Pro version 3.3 and retained as continuous values ranging from 0 (lowest suitability) to 1 (highest suitability). No threshold was applied to convert predictions into binary classes. Consequently, the resulting maps represent relative snare occurrence suitability and relative species-specific mortality suitability, with higher values indicating environmental conditions relatively more suitable for snare occurrence or snare-related mortality based on the observed presence records. Finally, the percent contribution and permutation importance statistics provided by MaxEnt were used to evaluate the relative influence of environmental and anthropogenic predictors on each model [39]. Percentage contribution and permutation importance were summarized as mean values across ten MaxEnt cross-validation folds, and their variability was quantified using the standard deviation across folds for each predictor and model (Supplementary Table S1). Predictor response curves were examined to illustrate how predicted relative suitability changed along individual environmental gradients while holding all other variables constant.
3. Result
3.1. Annual and Monthly Variation in Recorded Snare Removals and Snare-Related Wildlife Mortality
We examined how detected and removed snares and associated wildlife mortality fluctuated over time, both on an annual and monthly basis. Our results revealed statistically significant temporal variation in recorded snare and snare-related wildlife mortality across the study period. Annual totals of patrol-detected and removed snares varied from 7315 in 2020 to 17,379 in 2022 (Figure 2a). At the incident level, the number of snares recorded per georeferenced patrol incident differed significantly among years (χ2 = 44.34, df = 6, p < 0.001). Notably, 2022 showed significantly higher counts than 2018, 2020, and 2024. The lowest activity year, 2020, differed significantly from 2019, 2021, 2022, and 2023 (all adjusted p < 0.05). Despite this annual variability, we found no statistically detectable monotonic trend over the seven-year study period (Spearman’s rho = −0.36, p = 0.44). Furthermore, monthly snare counts varied from 2766 snares in February to 22,141 snares in August (Figure 2b). Monthly variation was also significant (χ2 = 89.05, df = 11, p < 0.001), with August constituting the clear peak month for snare counts, showing significantly higher counts than all other months (all p < 0.05).
Figure 2.
Temporal patterns in patrol-recorded snare removals and snare-related wildlife mortality in the Serengeti-Mara ecosystem from 2018 to 2024. (a) Annual totals of detected and removed snares; (b) pooled monthly totals and year-specific monthly counts of detected and removed snares; (c) recorded mortality by species; (d) annual recorded mortality; and (e) pooled monthly recorded mortality. Monthly pooled totals describe recorded detections across all study years and were not adjusted for patrol effort or coverage.
Wire snares caused 1967 wildlife mortalities across 13 species. Wildlife mortality varied significantly across species (χ2 = 145.2, df = 12, p < 0.001), with wildebeest (Connochaetes taurinus) having higher mortality than all other species (p < 0.05) (Figure 2c). Furthermore, wildlife mortality varied significantly across years (χ2 = 45.92, df = 6, p < 0.001), with 2019 having substantially higher mortality than 2018, 2022, and 2024 (Figure 2d). No statistically significant monotonic trend was detected in annual recorded snare-related wildlife mortality over the seven-year study period (n = 7, Spearman’s rho = −0.214, p = 0.662). In addition, monthly variation was significant (χ2 = 122.31, df = 11, p < 0.001), with wildlife mortality peaking in August and September more than in most other months (p < 0.05) (Figure 2e).
3.2. Relative Annual Snare Occurrence Suitability
The annual MaxEnt models identified recurring areas of relatively high fitted suitability for patrol-detected snare occurrence in the northern and western SNP and the Grumeti Game Reserve (GGR), extending into central Ikorongo Game Reserve (IGR), the Makundusi grazing lands, and IWMA (Figure 3a–g). Southern and eastern SNP generally showed lower fitted suitability across the study period. Although the extent and intensity of fitted suitability varied among years, several areas showed recurrent high values across multiple annual models. These surfaces represent relative suitability for patrol-detected snare occurrence and should not be interpreted as direct estimates of snaring probability or intensity. The annual snare-occurrence models achieved mean test AUC values ranging from 0.813 to 0.904, with corresponding mean test omission rates of 10.92–12.21% at the 10th-percentile training-presence threshold (Table 2).
Figure 3.
Annual MaxEnt predictions of relative suitability for patrol-detected snare occurrence across the study area from 2018 to 2024 (a–g). Warmer colours (yellow to red) indicate higher fitted relative suitability, whereas cooler colours (blue) indicate lower suitability. Predictions represent relative patterns of patrol-recorded detections and not direct estimates of underlying snaring intensity.
Table 2.
Percentage contribution of the environmental and anthropogenic variables associated with annual relative snare occurrence suitability from 2018 to 2024 in the Serengeti-Mara ecosystem.
3.3. Relative Species-Specific Mortality Occurrence Suitability
Species-specific models showed distinct spatial patterns of relative snare related mortality occurrence suitability (Figure 4a–h). Wildebeest showed relatively high fitted suitability near the northern and western boundaries of SNP (Figure 4g). Topi, impala, and zebra had broader fitted distributions both within and outside the protected areas (Figure 4e,d,h). Buffalo and warthog showed relatively high suitability in western SNP and GGR, hartebeest in eastern and southern SNP, and giraffe in fragmented areas around Makundusi, Sasakwa and central GGR (Figure 4a,f). Hartebeest showed fitted patterns in eastern and southern SNP. Giraffes showed fragmented patterns around Makundusi grazing area, Sasakwa, and central GGR (Figure 4a–h). Because the models combined mortality locations recorded during 2018–2024 with predictor layers representing 2024 conditions, the fitted surfaces should be interpreted as exploratory spatial associations and not as reconstructions of conditions at the time of mortality, current mortality probability, or per capita risk. The species-specific mortality models achieved mean test AUC values ranging from 0.729 to 0.893, while mean test omission rates ranged from 12.43% to 55.00%. The highest omission rates were recorded for impala (55.00%) and giraffe (40.00%), indicating greater uncertainty in their internal predictive performance (Table 3).
Figure 4.
Predicted relative species-specific snare-related wildlife mortality occurrence suitability in the Serengeti-Mara ecosystem, based on mortality records pooled across 2018–2024 and predictor layers representing 2024 landscape conditions: (a) buffalo, (b) giraffe, (c) hartebeest, (d) impala, (e) topi, (f) warthog, (g) wildebeest, and (h) zebra. Warmer colours (yellow to red) indicate higher fitted relative suitability for patrol-recorded snare-related mortality occurrence, whereas cooler colours (blue) indicate lower suitability. The maps do not represent mortality recorded only in 2024, conditions at the time of each earlier mortality event, or direct estimates of species-specific mortality probability or per capita mortality risk.
Table 3.
Percentage contribution of environmental and anthropogenic variables associated with relative species-specific snare-related wildlife mortality occurrence suitability in the Serengeti-Mara Ecosystem, based on mortality locations pooled across 2018–2024 and predictor layers representing 2024 landscape conditions.
3.4. Environmental and Anthropogenic Variables Associated with Relative Snare and Snare-Related Wildlife Mortality Occurrence Suitability
To identify variables associated with the spatial patterns of snares and snare-related wildlife mortality occurrence suitability, we evaluated the relative importance of environmental and anthropogenic predictors from MaxEnt model outputs. Elevation was the leading predictor in the annual snare occurrence models for 2018, 2020, and 2023. Its percentage contribution to the overall models varied from 20.2% to 70.9%, with the peak observed in 2023 (Table 2). Elevation also contributed strongly to several species-specific mortality occurrence models, particularly hartebeest (34.1%), buffalo (50.5%), and warthog (79.0%) (Table 3). Across most annual and species-specific models, higher relative occurrence suitability was associated with lower elevations, approximately 1100–1200 m a.s.l. (Figure S1a,b). Hartebeest was the main exception, with higher relative, mortality occurrence suitability occurring in more elevated areas (Figure S1c).
Long term annual mean precipitation was also an important predictor in the annual snare occurrence models for 2019 (38.3%), 2021 (29.4%), and 2022 (34.3%), with its percentage contributions varying from 5.6% to 38.3% across the study period (Table 2). It also contributed in species-specific mortality occurrence models for wildebeest (61.8%) and zebra (25.0%) (Table 3). The relative occurrence suitability of wire snare increased sharply with long term precipitation, peaking at levels above approximately 1150 mm and remaining stable at higher values (above approximately 1200 mm). This correlation has also been shown in wildebeest and zebra (Figure S1d,e). Because this predictor represents long-term climatic conditions rather than year-specific rainfall, these results should be interpreted as associations with broad precipitation gradients rather than annual rainfall effects.
Furthermore, distance to buildings showed increasing importance in the annual snare occurrence models, rising from 4.8% in 2018 to 34.4% in 2024. This variable also contributed strongly to the giraffe mortality occurrence suitability (50.5%), indicating that relative suitability for patrol-recorded snare occurrence and recorded giraffe mortality was higher closer to buildings (Figure S1h). Other predictors, including distance to rivers, roads, and cropland, EVI, TRI, and land cover, showed smaller and less consistent contributions across the annual snare occurrence suitability models. However, some variables were important in species-specific mortality occurrence suitability models. For example, relative suitability for recorded topi mortality was higher closer to rivers (46.4%) (Figure S1f), while recorded impala mortality was associated with proximity to roads (25.3%) (Figure S1i). Giraffe mortality occurrence was also associated with areas of higher EVI (Figure S1g).
The species-specific models identify spatial associations between pooled mortality records from 2018 to 2024 and the predictor conditions represented in the model. For relatively stable predictors, such as elevation, terrain ruggedness, distance to rivers, and long-term precipitation, these associations reflect broad landscape conditions that were likely persistent across the study period. For dynamic predictors, including EVI, land cover, cropland, roads, and buildings, the results indicate overlap between pooled mortality locations and the landscape configuration represented by the predictor layers used in the model. Therefore, the reported percentage contributions describe predictive importance within the MaxEnt models and should not be interpreted as causal effects or as evidence that the predictor conditions were identical at the time of every recorded mortality event.
4. Discussion
This study integrated seven years (2018–2024) of patrol records with MaxEnt modelling to examine temporal and spatial patterns of patrol-detected wire snaring and associated wildlife mortality in the Tanzanian sector of the SME. Because the data originated from non-random law-enforcement patrols and standardized information on patrol effort, routes and spatial coverage was unavailable, the observed patterns should be interpreted as patterns of recorded detections rather than direct measures of underlying snaring intensity or species-specific mortality risk.
Four principal findings emerged. First, patrol-detected wire snare removals and associated wildlife mortality varied among years and showed pronounced seasonal patterns, with higher detections during the dry season. Second, annual MaxEnt models showed recurring areas of relatively high fitted suitability for patrol-detected snare occurrence, although the extent and intensity of these patterns varied among years. Third, species-specific mortality models showed distinct spatial patterns among wildlife species. Finally, elevation, long-term mean annual precipitation and proximity to buildings were among the predictors with relatively high contributions to the fitted suitability surfaces. Because patrol effort was not incorporated into the models, areas of high fitted suitability may reflect greater snaring activity, greater patrol accessibility or detection, or a combination of these factors. The spatial predictions should therefore be regarded as exploratory patterns requiring field validation rather than confirmed hotspots of illegal hunting.
4.1. Temporal Variation in Patrol-Detected Wire Snaring and Wildlife Mortality
Patrol-recorded wire snare removals varied considerably among years, although no significant monotonic temporal trend was detected over the seven-year study period. Instead, the observed fluctuations indicate that illegal bushmeat hunting remains a persistent conservation challenge whose apparent intensity varies through time. Similar interannual variability has been reported in protected areas elsewhere in Africa, where temporal changes in recorded hunting events frequently reflect the combined influence of hunter behaviour, wildlife distribution, law-enforcement activities and patrol effectiveness rather than genuine increases or decreases in illegal hunting pressure [19,34,35,36]. Consequently, variation in annual snare detections should be interpreted as changes in patrol-recorded illegal activity rather than direct evidence of temporal changes in bushmeat hunting intensity.
The pronounced reduction in recorded snare removals during 2020 followed by increased detections in subsequent years illustrates the dynamic nature of illegal hunting within the SME. Illegal hunters continuously adapt their activities in response to patrol operations, wildlife movements and perceived enforcement risk [12,28]. Increased patrol effectiveness, intelligence-led operations or improved reporting systems may therefore increase snare detections without necessarily reflecting an increase in the number of snares deployed. Conversely, lower numbers of detected snares may arise from reduced patrol effort, changes in patrol deployment or improved concealment strategies employed by illegal hunters [19,34,35,36]. These interacting processes highlight the importance of interpreting patrol-derived data within the broader context of conservation monitoring rather than as absolute measures of illegal bushmeat hunting activity.
Seasonal variation was substantially more pronounced than annual variation. Both wire snare removals and wildlife mortality consistently peaked during August and September, coinciding with the dry season and the northern phase of the Serengeti wildebeest migration. During this period, large aggregations of wildebeest, zebra and other migratory herbivores occupy predictable grazing areas and migration corridors, increasing opportunities for illegal hunters to intercept wildlife using strategically placed wire snares [21,23,24,25,26]. Seasonal concentration of wildlife has long been recognized as an important determinant of illegal hunting because predictable animal movements increase hunting efficiency while reducing search effort [12,13,14]. The seasonal peak in patrol-recorded snaring is also likely influenced by environmental conditions that improve both hunting opportunities and patrol accessibility. Dry-season conditions reduce vegetation density, improve road accessibility and facilitate ranger movement throughout protected areas, thereby increasing the probability of detecting illegally deployed snares [19,34,35,36]. Simultaneously, reduced surface water availability concentrates wildlife around permanent rivers and productive grazing areas, increasing encounter rates between wildlife and wire snares. The coincidence of these ecological and operational processes suggests that seasonal variation in snare detections reflects both increased wildlife vulnerability and improved detection opportunities rather than a single underlying mechanism.
Patterns of wildlife mortality closely mirrored seasonal variation in snare occurrence, further emphasizing the ecological consequences of illegal bushmeat hunting during the dry season. Wildebeest accounted for the greatest proportion of recorded mortality, followed by other large herbivores that dominate the migratory ungulate assemblage. This finding is consistent with previous studies demonstrating that migratory ungulates constitute the principal targets of illegal bushmeat hunting in the Serengeti because of their abundance, predictable movements, and high economic value within local bushmeat markets [9,13,14]. Nevertheless, the occurrence of mortality across multiple wildlife species demonstrates the indiscriminate nature of wire snares, which continue to threaten both target and non-target species regardless of their conservation status [7,8,19].
Although patrol-derived monitoring data cannot distinguish whether seasonal peaks arise from increased hunting effort or improved detection probability, the consistency of the observed temporal patterns over seven consecutive years suggests that the dry season represents a period of elevated conservation risk within the SME. Intensifying surveillance and de-snaring operations during this period could therefore substantially improve the effectiveness of anti-poaching interventions while reducing wildlife mortality associated with illegal bushmeat hunting.
4.2. Spatial Patterns of Relative Snare Occurrence and Species-Specific Mortality
The annual MaxEnt models consistently identified northern, western and central parts of the SME as areas of relatively high snare occurrence suitability, despite variation in the extent and intensity of predicted suitable areas among years. The persistence of these suitability patters suggests that illegal wire snaring is not randomly distributed but repeatedly occurs where favourable ecological conditions coincide with opportunities for human access. Similar spatial clustering of illegal bushmeat hunting has been documented in protected areas across Africa, where illegal hunting activity is concentrated in predictable locations associated with wildlife abundance, access routes and historical hunting grounds [6,19,27,34,35,36]. The recurrence of these pattern across multiple years indicates that they represent long-term areas of conservation concern rather than isolated events, highlighting their importance for strategic anti-poaching interventions.
A notable feature of the predicted suitability surfaces was the concentration of patterns along sections of the protected-area boundary, particularly around Ikorongo Game Reserve, Grumeti Game Reserve and the Ikona Wildlife Management Area. Protected-area edges often represent zones where wildlife populations interface directly with surrounding human settlements, agricultural land and livestock grazing areas, thereby increasing opportunities for illegal resource extraction. Communities living adjacent to the Serengeti ecosystem continue to depend on natural resources for food security and household income despite considerable conservation investment [9,10,11,12,13,14,17,18,28]. Previous studies have similarly demonstrated that bushmeat hunting is more prevalent near village boundaries where travel costs are lower and access to protected areas is easier [12,27,28,42]. Consequently, the elevated suitability predicted along ecosystem margins most likely reflects the interaction between wildlife availability and human accessibility rather than the influence of protected-area boundaries alone.
In addition to boundary areas, several persistent suitability patterns occurred within the interior of the ecosystem, particularly in northern and central sectors that support seasonal concentrations of migratory ungulates. These areas coincide with important migration corridors and dry-season grazing habitats that attract large numbers of wildebeest, zebra, topi and other herbivores [21,23,24,25,26]. Wire snares are passive hunting devices that rely on predictable animal movements rather than active pursuit, making migration routes particularly attractive to illegal hunters. The repeated occurrence of relatively high suitability in these areas therefore reflects the close relationship between wildlife movement ecology and hunting opportunity. Similar findings have been reported in studies demonstrating that illegal hunters strategically position snares along frequently used wildlife trails, river crossings, and narrow movement corridors where encounter probabilities are highest [6,19,27].
Species-specific mortality models showed considerable spatial variation in the correspondence between pooled mortality locations and the 2024 predictor conditions. Wildebeest exhibited the broadest fitted distribution, consistent with their numerical dominance, extensive seasonal migrations, and repeated use of predictable movement corridors. As the most abundant migratory herbivore within the SME, wildebeest constitute the primary source of bushmeat harvested illegally from the ecosystem [13,14]. Their large herd sizes substantially increase the probability of encountering wire snares during migration, explaining the extensive distribution of predicted mortality suitability observed in this study.
In contrast, buffalo, zebra, giraffe, topi, impala, hartebeest and warthog displayed more localized patterns of mortality suitability that closely reflected differences in habitat preferences and movement behaviour. Grazing species such as topi and zebra were primarily associated with open grassland systems, whereas browsing species such as giraffe exhibited suitability concentrated in woodland-grassland mosaics. Buffalo mortality suitability was associated with areas providing permanent water and productive forage, while warthog and impala showed relatively restricted suitability linked to preferred habitat types. These differences may be associated with variation in species distribution, habitat use, movement patterns and spatial overlap with areas where snares were recorded. However, the patrol databases did not consistently document snare type, loop dimensions, height, placement strategy or the species intended by the hunter. Consequently, differences in recorded mortality among species cannot be attributed to particular snare designs or placement strategies, nor can they be used to determine whether a species was deliberately targeted or captured incidentally.
Taken together, the annual snare-occurrence and species-specific mortality models identified recurring and species-dependent spatial patterns in the patrol-recorded observations. However, neither set of suitability surfaces should be interpreted as a direct estimate of underlying snaring intensity or species-specific mortality risk. Because standardized patrol effort and spatial coverage were unavailable, fitted patterns may partly reflect where patrol teams were more likely to operate and detect snares or snare-related mortality. The models therefore provide exploratory spatial information that can identify areas for further field verification rather than definitive estimates of where illegal hunting or wildlife mortality is greatest.
4.3. Environmental and Anthropogenic Drivers of Relative Snare Occurrence and Wildlife Mortality
The MaxEnt models consistently demonstrated that the spatial distribution of patrol-detected wire snaring was associated with both environmental gradients and indicators of human accessibility. Elevation, long-term annual mean precipitation, and proximity to buildings repeatedly emerged as the most influential predictors across annual models, while the relative importance of additional variables varied among wildlife species. These findings emphasize that illegal bushmeat hunting is influenced by the interaction of ecological conditions that determine wildlife distribution and human factors that influence hunter access, movement and opportunity rather than by individual environmental variables acting independently.
Elevation consistently ranked among the strongest predictors of relative snare occurrence suitability. However, elevation should not be interpreted as a direct driver of illegal bushmeat hunting. Instead, it serves as an integrated landscape descriptor influencing vegetation structure, drainage patterns, habitat heterogeneity and wildlife distribution. Within the SME, elevational gradients contribute to spatial variation in forage productivity and habitat composition, thereby shaping the seasonal distribution of herbivore populations [20,23,43]. Illegal hunters are therefore more likely to deploy wire snares in landscapes that repeatedly support high wildlife use than in response to elevation itself. Similar relationships between topographic characteristics and illegal hunting have been reported elsewhere, where terrain influences both wildlife occurrence and hunter accessibility [19,34,36].
Long-term annual mean precipitation also contributed substantially to model performance, reflecting the importance of climatic conditions in regulating ecosystem productivity. Rainfall influences grass growth, water availability, and forage quality, which subsequently determine the seasonal distribution of migratory and resident herbivores [23,25]. Productive landscapes receiving favourable rainfall support greater wildlife abundance and consequently provide more opportunities for illegal hunting. Nevertheless, rainfall influences snaring indirectly through its effects on wildlife ecology rather than by directly determining hunter behaviour. The significant contribution of precipitation therefore highlights the importance of ecological processes underlying wildlife distribution rather than suggesting that rainfall itself drives illegal hunting activity.
Indicators of human accessibility were equally important in explaining the observed spatial patterns. Proximity to buildings consistently ranked among the most influential predictors, while distance to roads and cropland contributed to several annual and species-specific models. These findings support previous studies showing that illegal hunting is generally concentrated where hunters can gain relatively easy access to protected areas while minimizing travel costs and operational risks [12,27,28,42]. Settlements provide entry points into protected landscapes and facilitate the transport of bushmeat, equipment, and personnel, whereas roads simultaneously improve access for both illegal hunters and ranger patrols. Consequently, accessibility variables should be interpreted as indicators of opportunities for human movement rather than direct measures of hunting pressure.
Environmental drivers varied among wildlife species, reflecting differences in habitat selection and movement ecology. Species occupying open grasslands were more strongly associated with climatic and vegetation-related variables, whereas species dependent on riparian habitats or woodland mosaics showed stronger relationships with variables describing local habitat conditions. These differences indicate that exposure to wire snaring depends not only on where hunters operate but also on how individual species use heterogeneous landscapes. Such variation reinforces the importance of species-specific analyses because conservation strategies based solely on overall snaring patterns may overlook localized mortality risks affecting particular wildlife populations.
Generally, the environmental variables identified by the MaxEnt models should be interpreted as descriptors of landscapes where patrol teams repeatedly encountered evidence of illegal bushmeat hunting rather than as direct causal drivers of wire snaring. Illegal bushmeat hunting is fundamentally a human decision influenced by socioeconomic incentives, enforcement risk, and wildlife availability. The environmental variables incorporated into the models therefore characterize the ecological settings within which these decisions are made. Recognizing this distinction avoids overinterpreting statistical relationships while maximizing the practical value of predictive suitability modelling for conservation planning.
4.4. Conservation and Management Implications
The persistent spatial and temporal patterns identified in this study demonstrate the value of integrating long-term patrol records with predictive spatial modelling to support adaptive conservation management. The recurring patterns of annual snare-occurrence suitability provide a basis for identifying candidate areas for field verification and adaptive patrol planning. Relatively high fitted suitability was repeatedly observed in parts of the landscape, but the absence of standardized patrol-effort and coverage data prevents these areas from being interpreted as confirmed concentrations of underlying illegal snaring. Targeted surveillance combined with systematic recording of patrol effort could be used to test whether recurrent high-suitability areas correspond to elevated snaring activity, greater detectability, or both.
The higher numbers of patrol-recorded snares and snare-related wildlife mortalities during August and September indicate that these months warrant further field evaluation. Targeted surveillance during this period, together with standardized recording of patrol effort and coverage, could help determine whether the observed seasonal peaks reflect increased illegal activity, improved detection, or a combination of these processes before longer-term changes in patrol allocation are implemented.
The concentration of predicted snare occurrence suitability patterns near protected-area boundaries further emphasizes that effective conservation cannot rely exclusively on law enforcement. Illegal bushmeat hunting is strongly influenced by socioeconomic conditions affecting communities adjacent to protected areas, including poverty, food insecurity, limited livelihood opportunities and demand for bushmeat [3,9,10,11,12,13,14,15,18]. Consequently, long-term reductions in illegal hunting require integrated conservation approaches that combine effective patrols with community engagement, conservation education, benefit-sharing mechanisms and alternative livelihood opportunities. Strengthening collaboration between protected-area authorities and surrounding communities could reduce dependence on wildlife resources while improving local support for conservation initiatives. Such approaches are consistent with recent recommendations advocating integrated conservation strategies that simultaneously address ecological and socioeconomic drivers of illegal wildlife exploitation [7,8,32].
The transboundary nature of the SME further highlights the need for coordinated conservation planning between Tanzania and Kenya. Wildlife populations move freely across international boundaries, while illegal hunting activities frequently exploit differences in management, patrol coverage, and administrative jurisdictions. Consequently, conservation interventions implemented independently within national boundaries may have limited effectiveness if complementary management actions are absent elsewhere within the ecosystem. The predictive suitability maps developed in this study provide a common spatial framework that could facilitate collaborative patrol planning, information sharing, and coordinated law-enforcement operations across the broader Serengeti-Mara landscape.
Species-specific mortality suitability maps may complement annual snare-occurrence models by identifying candidate locations for species-focused field verification and surveillance. Areas of relatively high fitted mortality suitability indicate where patrol-recorded snare-related mortality was spatially associated with the predictor conditions represented in the models; they do not identify locations of directly estimated mortality risk or per capita vulnerability. Combining these predictions with standardized patrol-effort data, wildlife abundance and movement information would provide a stronger basis for evaluating species-specific exposure to wire snaring and informing preventive management.
4.5. Limitations and Future Research
Several limitations should be considered when interpreting the findings of this study. First, the analyses were based on patrol-derived observations of wire snares and wildlife mortality rather than direct measurements of illegal hunting activity. Consequently, the fitted snare-occurrence and species-specific mortality suitability surfaces represent spatial patterns derived from patrol-recorded detections and should not be interpreted as unbiased estimates of underlying snaring intensity or species-specific mortality risk. Detection probability is inevitably influenced by patrol deployment, accessibility and operational priorities, all of which may affect where and when snares are discovered [19,32,34,35,36].
Second, a common MaxEnt parameterization was intentionally retained across annual and species-specific models to facilitate comparison under a consistent modelling framework. However, because model-specific tuning was not conducted, the selected feature classes and regularization multiplier may not have been optimal for every dataset, particularly given differences in occurrence sample size among species. Consequently, fine-scale spatial patterns should be interpreted cautiously, with greater emphasis placed on broad differences and recurring spatial patterns.
Third, standardized information describing patrol effort, including patrol routes, search duration, distance travelled, and patrol intensity, was unavailable for incorporation into the modelling framework. Patrol effort is widely recognized as an important determinant of wildlife crime detection because areas receiving greater surveillance generally yield more observations independent of the underlying level of illegal activity [19,34,35,36]. Future studies incorporating explicit patrol-effort metrics or hierarchical modelling approaches that account for imperfect detection would provide more accurate estimates of illegal hunting risk while improving interpretation of patrol-based monitoring data. In addition, inconsistent recording of snare characteristics and intended target species prevented assessment of whether species-specific mortality patterns were associated with particular snare designs, placement strategies, or deliberate targeting.
Fourth, the environmental predictors represented relatively static landscape characteristics and long-term climatic conditions that may not fully capture short-term environmental dynamics influencing wildlife distribution and hunter behaviour. Seasonal vegetation productivity, temporary water availability, annual rainfall variability, and fire occurrence can substantially alter wildlife movements and hunting opportunities across savanna ecosystems. Future investigations integrating near-real-time remote sensing products with ranger-collected observations could improve understanding of how environmental variability influences the spatial dynamics of illegal hunting through time.
Fifth, model evaluation relied on test AUC obtained from repeated random subsampling. Because training and testing locations were randomly partitioned from the same patrol-derived datasets, spatially clustered or environmentally similar observations may have occurred in both subsets, potentially producing optimistic estimates of model discrimination. Spatial-block cross-validation, partial ROC, continuous Boyce index and omission-rate evaluation were not performed. Consequently, the reported AUC values should be interpreted as measures of internal discrimination rather than evidence of spatial transferability, and the models were not validated for prediction to spatially independent areas. Future analyses should incorporate spatially structured validation and additional performance metrics where feasible.
A further limitation concerns the temporal mismatch in the species-specific mortality models. Mortality records were pooled across 2018–2024 because annual observations for several species were insufficient for year-specific modelling, whereas the predictor layers represented 2024 landscape conditions. This mismatch is particularly important for dynamic predictors such as EVI, land cover, cropland, roads and buildings, which may have changed during the study period. The resulting models should therefore be interpreted as exploratory spatial correspondence between historical mortality locations and the 2024 landscape configuration rather than as reconstructions of conditions at the time mortality occurred or estimates of current species-specific mortality risk. Future analyses should link mortality records to temporally matched predictor layers where sufficient data are available.
The socioeconomic drivers were beyond the scope of the present study but remain essential for understanding why illegal hunting persists despite substantial conservation investment. Future research integrating predictive spatial modelling with socioeconomic surveys, wildlife movement data, law-enforcement information and community-based monitoring would provide a more comprehensive understanding of the mechanisms driving illegal hunting and support the design of more effective conservation interventions.
5. Conclusions
This study provides an integrated assessment of the temporal and spatial patterns of patrol-recorded wire snares and snare-related wildlife mortality in the Tanzanian sector of the SME from 2018 to 2024. Recorded snare removals and wildlife mortality varied substantially among years and months, with pronounced dry-season peaks, while wildebeest accounted for the largest share of documented mortality. The consistently identified northern, western and central parts of the landscape, particularly protected-area boundaries and human–wildlife interface zones, as areas of relatively high snare occurrence and species-specific mortality suitability. The spatial patterns were associated principally with elevation, long-term precipitation gradients and proximity to buildings, although predictor importance differed among years and wildlife species. The annual snare-occurrence and species-specific mortality models identified recurring and species-dependent patterns of relative fitted suitability, with predictor importance varying among years and wildlife species. These relationships describe spatial associations within patrol-recorded data and should not be interpreted as causal effects, direct measures of underlying snaring intensity, or estimates of species-specific mortality risk.
The study demonstrates the value of converting routine patrol and de-snaring records into spatially explicit information for conservation management. The identified spatial and seasonal patterns can guide field verification and inform adaptive patrol trials, targeted de-snaring surveys and coordination among protected-area authorities, community conservation institutions, and neighbouring land managers. Particular attention should be given to migratory corridors, protected-area boundaries and settlement interfaces where wildlife exposure and human access may coincide. Interpretation remains constrained by the absence of standardized information on patrol effort, routes, search intensity and detection probability. Consequently, areas with high predicted suitability may reflect high illegal activity, intensive patrol coverage or both, whereas low-suitability areas may represent either limited snaring or insufficient surveillance. Future monitoring should systematically record patrol distance, duration, team size, transport mode, spatial coverage and search effort, and should link mortality incidents to temporally matched land-cover, vegetation and rainfall data. Integrating these records with wildlife abundance and movement information and applying effort-adjusted point-process, occupancy or detection models would provide stronger estimates of illegal-hunting risk and improve the effectiveness of evidence-based anti-poaching interventions.
Supplementary Materials
The following supporting information can be downloaded at: https://www.mdpi.com/article/10.3390/conservation6040133/s1, Figure S1: MaxEnt response curves showing relationships between selected environmental and anthropogenic varia-bles and relative fitted suitability for patrol-recorded snare-related wildlife mortality occurrence in the Seren-geti-Mara Ecosystem, based on mortality locations pooled across 2018–2024 and predictor layers representing 2024 landscape conditions. Red curves represent the mean fitted response, and blue margins indicate ± standard deviation across ten replicate runs; Table S1: Mean and standard deviation of percentage contribution and permutation importance across ten MaxEnt cross-validation folds for nine environmental and anthropogenic predictors in annual snare-occurrence models (2018–2024) and species-specific snare-related wildlife mortality models in the Serengeti-Mara Ecosystem.
Author Contributions
Conceptualization, methodology, resources, project administration, validation, writing—review and editing, M.R.M., G.G.L., K.E.T. and R.A.G.; data curation, investigation, visualization, writing—original draft preparation, M.R.M.; formal analysis, software, M.R.M. and R.A.G.; supervision, R.A.G., G.G.L. and K.E.T.; funding acquisition, G.G.L. and K.E.T. All authors have read and agreed to the published version of the manuscript.
Funding
This research was funded by the Grumeti Fund through the Research and Innovation for the Serengeti Ecosystem (RISE) programme.
Institutional Review Board Statement
This study relied exclusively on secondary data collected by patrol teams during routine park operations. No additional fieldwork was conducted, and the study did not involve any direct interaction with or handling of animals. However, the research was approved by the Tanzania Wildlife Research Institute (TAWIRI) and the Tanzania Com-mission for Science and Technology (COSTECH) (research permit No. CST00000274-2023-2025-00125; approval date: 25 February 2025).
Informed Consent Statement
Not applicable.
Data Availability Statement
The law enforcement raw data used in this study are not publicly available due to their sensitive nature. However, non-sensitive aggregated data, analytical code, predictor descriptions, and derived outputs may be made available upon reasonable request and subject to approval by the Tanzania National Parks and the Grumeti Fund, in collaboration with TAWA and the IWMA management team.
Acknowledgments
We extend our gratitude to the Tanzanian Commission for Science and Technology (COSTECH) and the Tanzania Wildlife Research Institute (TAWIRI) for granting research permission under permit number CST00000274-2023-2025-00125. We are deeply grateful to the Grumeti Fund for providing financial support to cover all research expenses and for granting access to patrol data. Our thanks also go to the Tanzania National Parks (TANAPA) for permitting the use of snare data from Serengeti National Park. This study would not have been possible without the dedicated efforts of management and anti-poaching units across the Serengeti-Mara ecosystem’s protected areas, whose meticulous data collection formed the core of our research. We specifically acknowledge the de-snaring teams and control room personnel from both Serengeti National Park and the Grumeti Fund for sharing their knowledge of patrolling operations and data management tools.
Conflicts of Interest
Author George G. Lohay was employed by the Grumeti Fund. The remaining authors declare that the research was conducted in the absence of any commercial or financial relationships that could be construed as a potential conflict of interest.
Abbreviations
The following abbreviations are used in this manuscript:
| AUC | Area Under the Curve |
| CITES | Convention on International Trade in Endangered Species of Wild Fauna and Flora |
| CRS | Coordinate Reference System |
| DEM | Digital Elevation Model |
| EVI | Enhanced Vegetation Index |
| GIS | Geographic Information System |
| GPS | Global Positioning System |
| GGR | Grumeti Game Reserve |
| GF | Grumeti Fund |
| IGGR | Ikorongo Grumeti Game Reserve |
| IGR | Ikorongo Game Reserve |
| IPBES | Intergovernmental Science-Policy Platform on Biodiversity and Ecosystem Services |
| IWMA | Ikona Wildlife Management Area |
| MaxEnt | Maximum Entropy |
| PA | Protected Area |
| PAs | Protected Areas |
| RISE | Research and Innovation for the Serengeti Ecosystem |
| ROC | Receiver Operating Characteristic |
| SADC | Southern African Development Community |
| SNP | Serengeti National Park |
| SRTM | Shuttle Radar Topography Mission |
| TAWA | Tanzania Wildlife Management Authority |
| TANAPA | Tanzania National Parks |
| TAWIRI | Tanzania Wildlife Research Institute |
| TRI | Terrain Ruggedness Index |
| WMA | Wildlife Management Area |
References
- IPBES. Summary for Policymakers of the Global Assessment Report on Biodiversity and Ecosystem Services; IPBES Secretariat: Bonn, Germany, 2019. [Google Scholar]
- Ripple, W.J.; Abernethy, K.; Betts, M.G.; Chapron, G.; Dirzo, R.; Galetti, M.; Levi, T.; Lindsey, P.A.; Macdonald, D.W.; Machovina, B.; et al. Bushmeat Hunting and Extinction Risk to the World’s Mammals. R. Soc. Open Sci. 2016, 3, 160498. [Google Scholar] [CrossRef] [Scilit] [PubMed]
- Lindsey, P.A.; Balme, G.; Becker, M.; Begg, C.; Bento, C.; Bocchino, C.; Dickman, A.; Diggle, R.W.; Eves, H.; Henschel, P.; et al. The Bushmeat Trade in African Savannas: Impacts, Drivers, and Possible Solutions. Biol. Conserv. 2013, 160, 80–96. [Google Scholar] [CrossRef] [Scilit]
- Van Velden, J.L.; Wilson, K.; Lindsey, P.A.; McCallum, H.; Moyo, B.H.Z.; Biggs, D. Bushmeat Hunting and Consumption Is a Pervasive Issue in African Savannahs: Insights from Four Protected Areas in Malawi. Biodivers. Conserv. 2020, 29, 1443–1464. [Google Scholar] [CrossRef] [Scilit]
- Zisadza, J.; Mrewa, A.T.; Khosa, A.; Mutematemi, S.A.; Muvengwi, J. Illegal Hunting and Bushmeat Trade around Save Valley Conservancy. Environ. Manag. 2025, 75, 2722–2735. [Google Scholar] [CrossRef] [Scilit] [PubMed]
- Warrer, C.H.; Riedner, D.C.; Briefer, E.F.; Venter, J.A.; Davis, R.S. Identifying Areas of High Snaring Risk in Kruger National Park: A Novel Citizen Science Approach for Carnivore Conservation. Biol. Conserv. 2025, 310, 111353. [Google Scholar] [CrossRef] [Scilit]
- Denny, S.; Coad, L.; Jones, S.; Ingram, D.J. Snaring and Wildlife Wastage in Africa: Drivers, Scale, Impacts, and Paths to Sustainability. BioScience 2025, 75, 284–297. [Google Scholar] [CrossRef] [Scilit] [PubMed]
- Feldmeier, D.E.; Schmitz, O.J.; Dickman, A.J.; Kasozi, H.; Montgomery, R.A. The Global Threat of Wire Snare Poaching: A Comprehensive Review of Impacts and Research Priorities. Biol. Conserv. 2025, 310, 111406. [Google Scholar] [CrossRef] [Scilit]
- Walelign, S.Z.; Nielsen, M.R.; Jakobsen, J.B. Price Elasticity of Bushmeat Demand in the Greater Serengeti Ecosystem: Insights for Managing the Bushmeat Trade. Front. Ecol. Evol. 2019, 7, 162. [Google Scholar] [CrossRef] [Scilit]
- Ceppi, S.L.; Nielsen, M.R. A Comparative Study on Bushmeat Consumption Patterns in Ten Tribes in Tanzania. Trop. Conserv. Sci. 2014, 7, 272–287. [Google Scholar] [CrossRef] [Scilit]
- Mrosso, H.T.; Kicheleri, R.P.; Kashaigili, J.J.; Munishi, P.; Kadigi, R.M.J.; Mgeni, C.P.; Kimaro, M.H. Illegal Wildlife Trade: Trade Flows of Wildlife Products and Facilitation Methods in the Ruaha Landscape, Tanzania. OJE 2022, 12, 585–603. [Google Scholar] [CrossRef]
- Knapp, E.J. Why Poaching Pays: A Summary of Risks and Benefits Illegal Hunters Face in Western Serengeti, Tanzania. Trop. Conserv. Sci. 2012, 5, 434–445. [Google Scholar] [CrossRef] [Scilit]
- Rentsch, D.; Damon, A. Prices, Poaching, and Protein Alternatives: An Analysis of Bushmeat Consumption around Serengeti National Park, Tanzania. Ecol. Econ. 2013, 91, 1–9. [Google Scholar] [CrossRef] [Scilit]
- Rentsch, D.; Packer, C. The Effect of Bushmeat Consumption on Migratory Wildlife in the Serengeti Ecosystem, Tanzania. Oryx 2015, 49, 287–294. [Google Scholar] [CrossRef] [Scilit]
- Kideghesho, J.R. The Contribution of Research in Combating Wildlife Poaching in Tanzania: Review of Existing Literature. In Natural Resources Management and Biological Sciences; Rhodes, E.R., Naser, H., Eds.; IntechOpen: London, UK, 2021; ISBN 978-1-83880-464-0. [Google Scholar]
- Kegamba, J.J.; Siga, A.A. Wildlife Crimes and the Demographic Characteristics of Offenders in Western Serengeti, Tanzania: A Review of Court Cases 2012–2022. Glob. Ecol. Conserv. 2025, 62, e03743. [Google Scholar] [CrossRef] [Scilit]
- Kegamba, J.J.; Sangha, K.K.; Wurm, P.; Garnett, S.T. A Review of Conservation-Related Benefit-Sharing Mechanisms in Tanzania. Glob. Ecol. Conserv. 2022, 33, e01955. [Google Scholar] [CrossRef] [Scilit]
- Kegamba, J.J.; Sangha, K.K.; Wurm, P.A.S.; Kideghesho, J.R.; Garnett, S.T. The Influence of Conservation Policies and Legislations on Communities in Tanzania. Biodivers. Conserv. 2024, 33, 3147–3170. [Google Scholar] [CrossRef] [Scilit]
- Becker, M.; McRobb, R.; Watson, F.; Droge, E.; Kanyembo, B.; Murdoch, J.; Kakumbi, C. Evaluating Wire-Snare Poaching Trends and the Impacts of by-Catch on Elephants and Large Carnivores. Biol. Conserv. 2013, 158, 26–36. [Google Scholar] [CrossRef] [Scilit]
- Sinclair, A.R.E.; Metzger, K.L.; Fryxell, J.M.; Packer, C.; Byrom, A.E.; Craft, M.E.; Hampson, K.; Lembo, T.; Durant, S.M.; Forrester, G.J.; et al. Asynchronous Food-web Pathways Could Buffer the Response of Serengeti Predators to El Niño Southern Oscillation. Ecology 2013, 94, 1123–1130. [Google Scholar] [CrossRef] [Scilit] [PubMed]
- TAWIRI. Aerial Point Survey of Wildebeest in the Greater Serengeti Ecosystem; Tanzania Wildlife Research Institute: Arusha, Tanzania, 2023. [Google Scholar]
- Kiwango, Y. Restoring Ecological Connectivity in the Serengeti Ecosystem. Doctoral Thesis, University of Groningen, Groningen, The Netherlands, 2024. [Google Scholar]
- Ogutu, J.O.; Bartzke, G.S.; Mukhopadhyay, S.; Dublin, H.T.; Senteu, J.S.; Gikungu, D.; Obara, I.; Piepho, H.-P. Trends and Cycles in Rainfall, Temperature, NDVI, IOD and SOI in the Mara-Serengeti: Insights for Biodiversity Conservation. PLoS Clim. 2024, 3, e0000388. [Google Scholar] [CrossRef] [Scilit]
- Fan, X.; Tang, K.H.D.; Liu, S.; Liu, Y.; Smith, C.K. Optimizing the Migratory Environment of Wildebeests in the Maasai Mara Reserve with a New Ecological Corridor and Customized Buffer Zone Model. Earth 2024, 5, 707–723. [Google Scholar] [CrossRef] [Scilit]
- Holdo, R.M.; Holt, R.D.; Fryxell, J.M. Opposing Rainfall and Plant Nutritional Gradients Best Explain the Wildebeest Migration in the Serengeti. Am. Nat. 2009, 173, 431–445. [Google Scholar] [CrossRef] [Scilit] [PubMed]
- Pennycuick, L. Movements of the Migratory Wildebeest Population in the Serengeti Area between 1960 and 1973. Afr. J. Ecol. 1975, 13, 65–87. [Google Scholar] [CrossRef] [Scilit]
- Snyder, K.D.; Mneney, P.B.; Wittemyer, G. Predicting the Risk of Illegal Activity and Evaluating Law Enforcement Interventions in the Western Serengeti. Conserv. Sci. Pract. 2019, 1, e81. [Google Scholar] [CrossRef] [Scilit]
- Rija, A.A.; Kideghesho, J.R. Poachers’ Strategies to Surmount Anti-Poaching Efforts in Western Serengeti, Tanzania. In Protected Areas in Northern Tanzania: Local Communities, Land Use Change, and Management Challenges; Durrant, J.O., Martin, E.H., Melubo, K., Jensen, R.R., Hadfield, L.A., Hardin, P.J., Weisler, L., Eds.; Springer International Publishing: Cham, Switzerland, 2020; pp. 91–112. ISBN 978-3-030-43302-4. [Google Scholar]
- United Republic of Tanzania. The Wildlife Conservation (Tourist Hunting) Regulations, 2015; Government of the United Republic of Tanzania: Dar es Salaam, Tanzania, 2015.
- United Republic of Tanzania. The Wildlife Conservation Act, Chapter 283, Revised Edition 2022; Office of the Attorney General: Dodoma, Tanzania, 2022.
- United Republic of Tanzania. The Wildlife Conservation (Wildlife Management Areas) Regulations, 2018; Government of the United Republic of Tanzania: Dodoma, Tanzania, 2018.
- Kuiper, T.; Dancer, A.; Beale, C.M.; Ghoddousi, A.; Ibbett, H.; Joanny, L.; Keane, A.; Kavhu, B.; Makaza, D.; Milner-Gulland, E.J.; et al. Unlocking the Value of Ranger-Based Monitoring for Biodiversity Conservation and Protected Area Management. Conserv. Lett. 2025, 18, e13082. [Google Scholar] [CrossRef] [Scilit]
- Phurna, P. Effectiveness of De-Snaring Strategies in Protecting Tanzania’s Wildlife at Serengeti National Park. J. Policy Dev. Stud. 2024, 17, 86–106. [Google Scholar] [CrossRef] [Scilit]
- Critchlow, R.; Plumptre, A.J.; Alidria, B.; Nsubuga, M.; Driciru, M.; Rwetsiba, A.; Wanyama, F.; Beale, C.M. Improving Law-Enforcement Effectiveness and Efficiency in Protected Areas Using Ranger-collected Monitoring Data. Conserv. Lett. 2017, 10, 572–580. [Google Scholar] [CrossRef] [Scilit]
- Dobson, A.D.M.; Milner-Gulland, E.J.; Beale, C.M.; Ibbett, H.; Keane, A. Detecting Deterrence from Patrol Data. Conserv. Biol. 2019, 33, 665–675. [Google Scholar] [CrossRef] [Scilit] [PubMed]
- Ghoddousi, A.; Van Cayzeele, C.; Negahdar, P.; Soofi, M.; Kh. Hamidi, A.; Bleyhl, B.; Fandos, G.; Khorozyan, I.; Waltert, M.; Kuemmerle, T. Understanding Spatial Patterns of Poaching Pressure Using Ranger Logbook Data to Optimize Future Patrolling Strategies. Ecol. Appl. 2022, 32, e2601. [Google Scholar] [CrossRef] [Scilit] [PubMed]
- Giliba, R.A.; Yengoh, G.T. Predicting Suitable Habitats of the African Cherry (Prunus Africana) under Climate Change in Tanzania. Atmosphere 2020, 11, 988. [Google Scholar] [CrossRef] [Scilit]
- Elith, J.; Phillips, S.J.; Hastie, T.; Dudík, M.; Chee, Y.E.; Yates, C.J. A Statistical Explanation of MaxEnt for Ecologists: Statistical Explanation of MaxEnt. Divers. Distrib. 2011, 17, 43–57. [Google Scholar] [CrossRef] [Scilit]
- Giliba, R.A.; Mpinga, I.H.; Ndimuligo, S.A.; Mpanda, M.M. Changing Climate Patterns Risk the Spread of Varroa Destructor Infestation of African Honey Bees in Tanzania. Ecol. Process. 2020, 9, 48. [Google Scholar] [CrossRef] [Scilit]
- Ding, X.; Xu, Z.; Wang, Y. Application of MaxEnt Model in Biomass Estimation: An Example of Spruce Forest in the Tianshan Mountains of the Central-Western Part of Xinjiang, China. Forests 2023, 14, 953. [Google Scholar] [CrossRef] [Scilit]
- Nguyen, T.H.; Sinha, A.; Gholami, S.; Plumptre, A.; Joppa, L.; Tambe, M.; Driciru, M.; Wanyama, F.; Rwetsiba, A.; Critchlow, R. CAPTURE: A New Predictive Anti-Poaching Tool for Wildlife Protection. In Proceedings of the 2016 International Conference on Autonomous Agents & Multiagent Systems (AAMAS); International Foundation for Autonomous Agents and Multiagent Systems: Richland, SC, USA, 2016. [Google Scholar]
- Holmern, T.; Muya, J.; Røskaft, E. Local Law Enforcement and Illegal Bushmeat Hunting Outside the Serengeti National Park, Tanzania. Environ. Conserv. 2007, 34, 55–63. [Google Scholar] [CrossRef] [Scilit]
- Kija, H.K.; Ogutu, J.O.; Mangewa, L.J.; Bukombe, J.; Verones, F.; Graae, B.J.; Kideghesho, J.R.; Said, M.Y.; Nzunda, E.F. Spatio-Temporal Changes in Wildlife Habitat Quality in the Greater Serengeti Ecosystem. Sustainability 2020, 12, 2440. [Google Scholar] [CrossRef] [Scilit]
- Mligo, C. Plant Species Composition and Distribution in Relation to Land Use Patterns in Serengeti Ecosystem Tanzania. Open J. For. 2015, 5, 607–620. [Google Scholar] [CrossRef]
- Giliba, R.A.; Kiffner, C.; Fust, P.; Loos, J. Modelling Elephant Corridors over Two Decades Reveals Opportunities for Conserving Connectivity across a Large Protected Area Network. PLoS ONE 2023, 18, e0292918. [Google Scholar] [CrossRef] [Scilit] [PubMed]
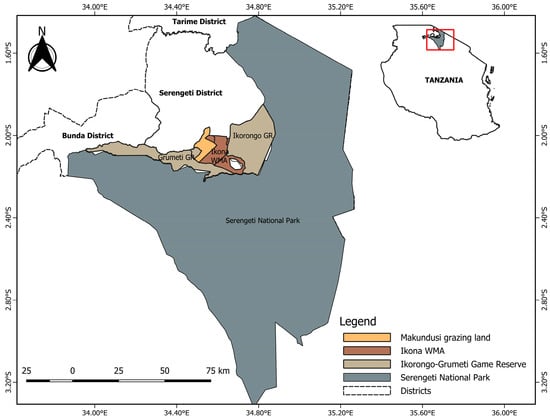
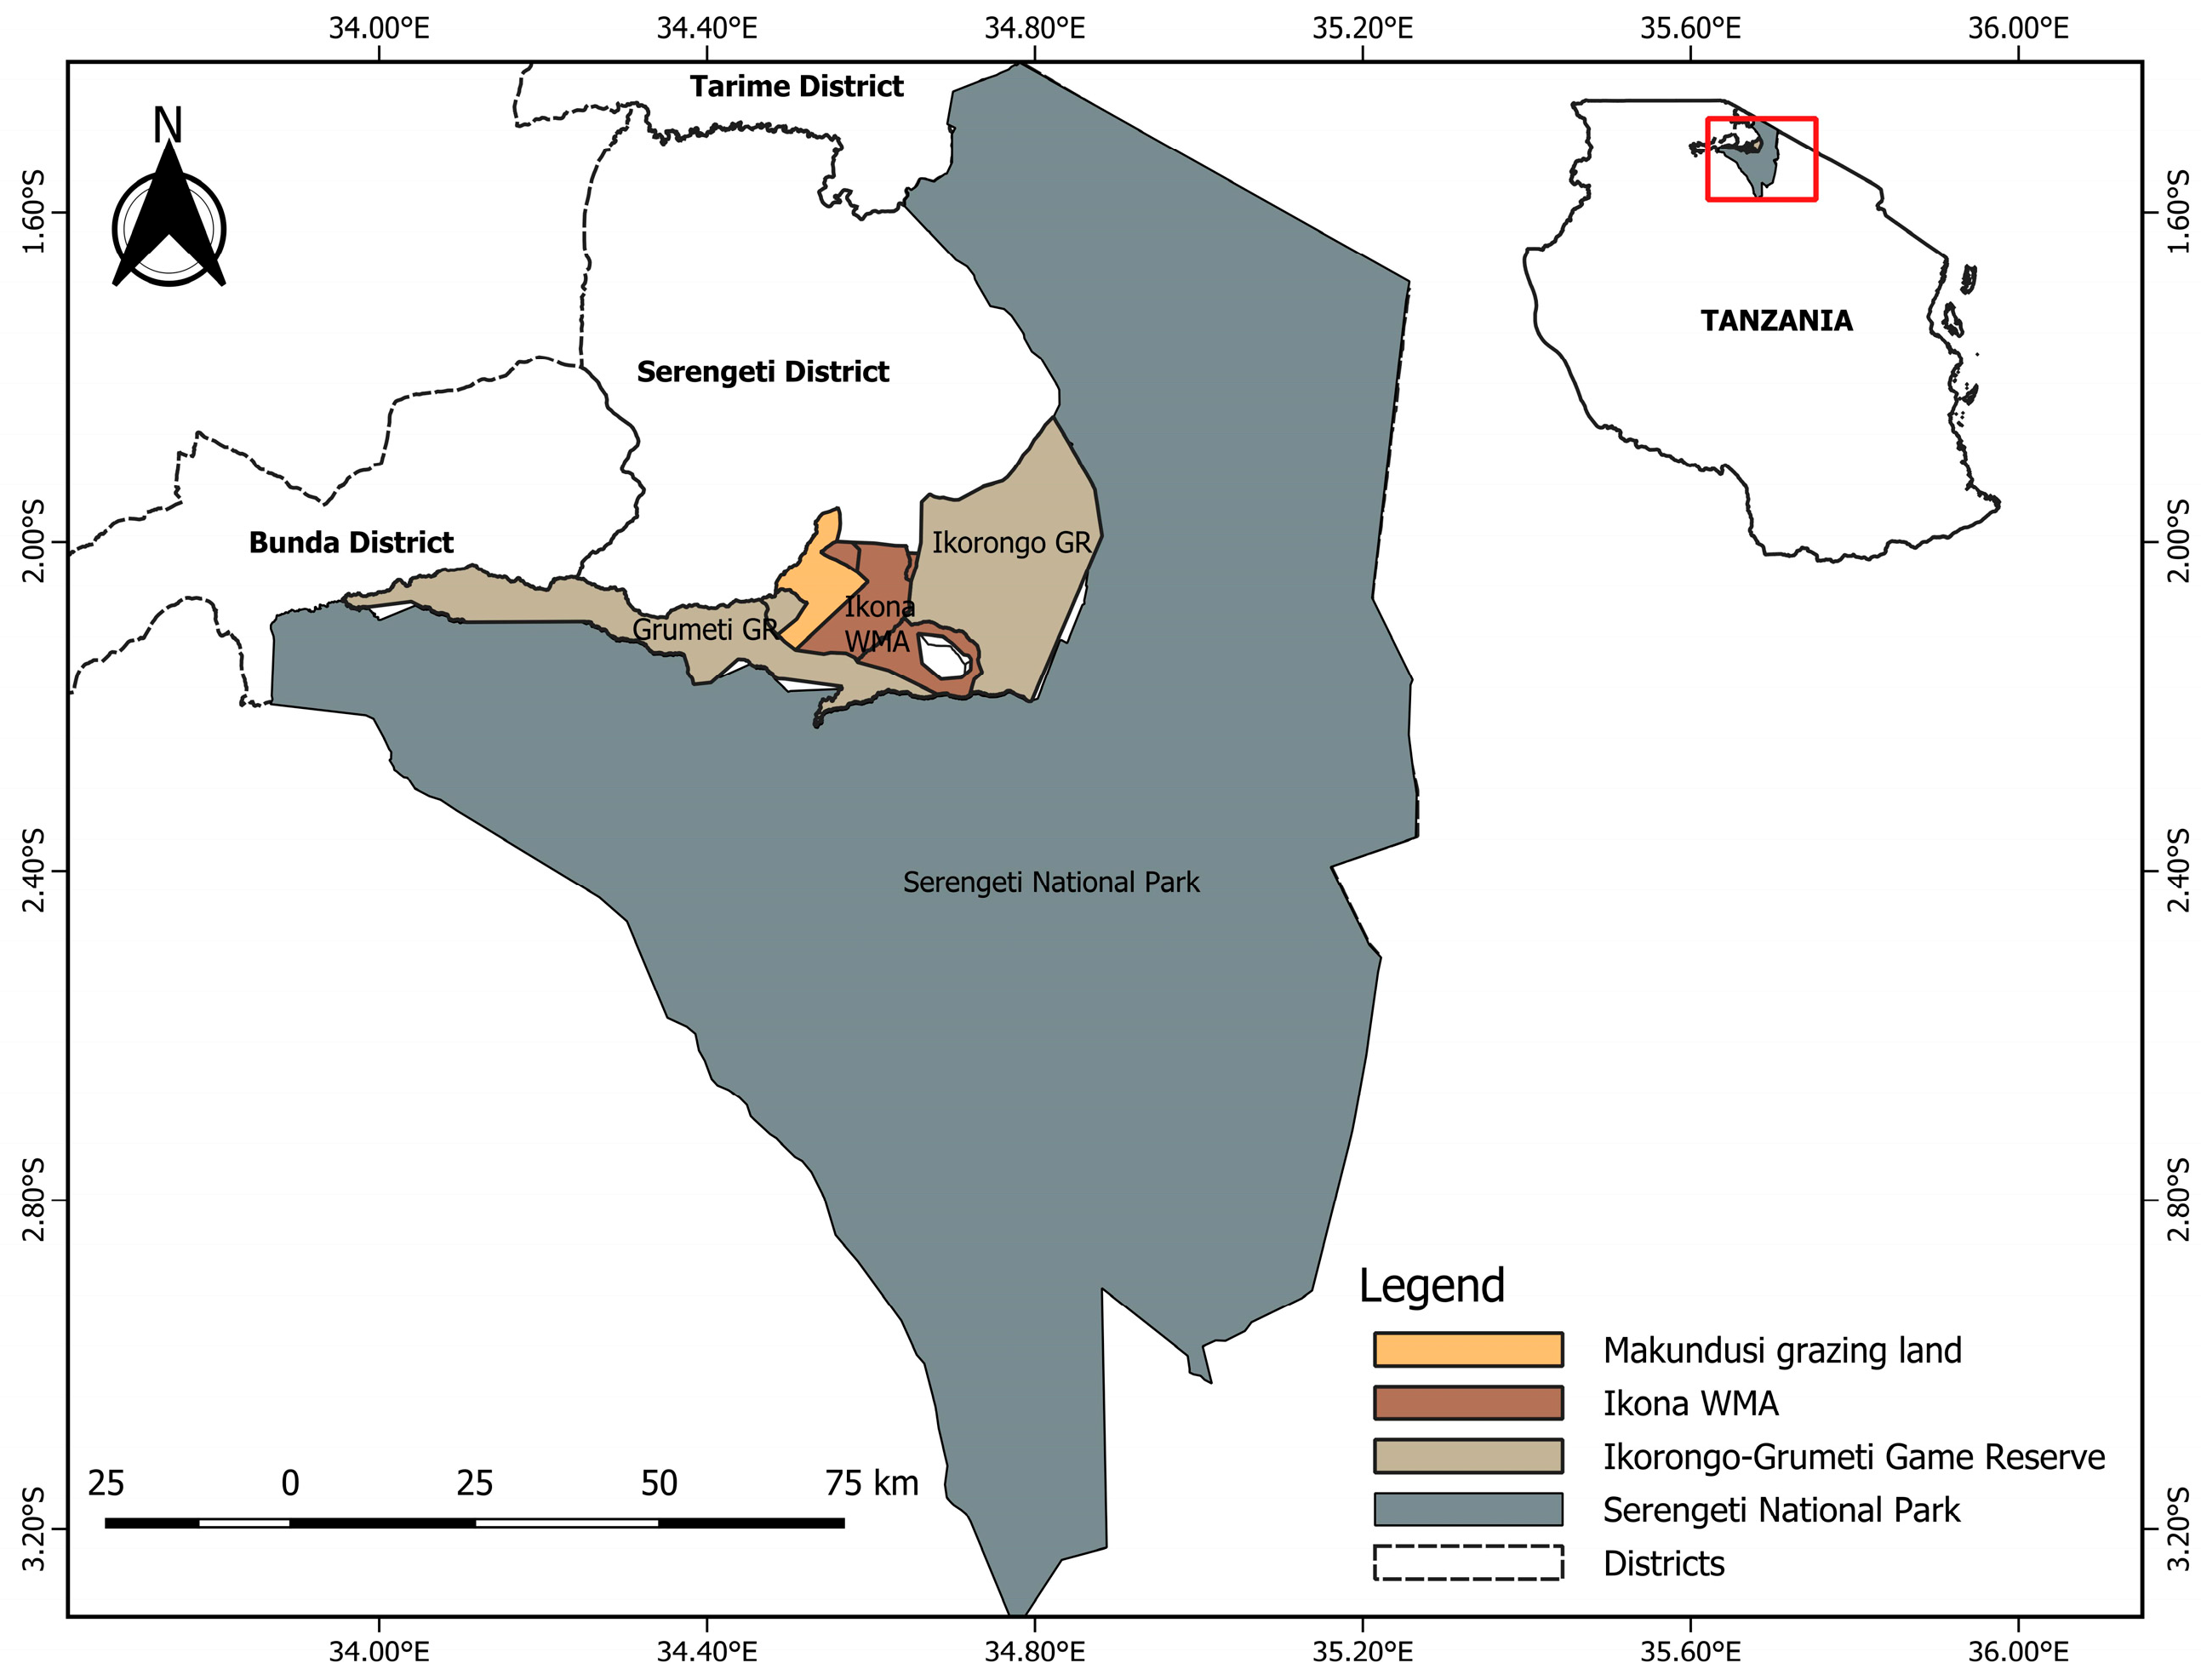
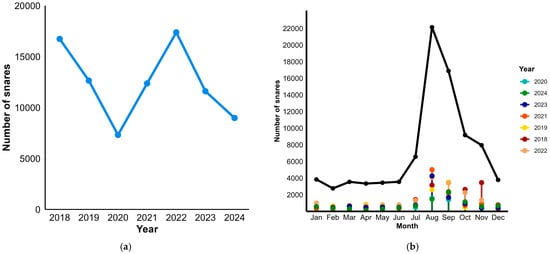
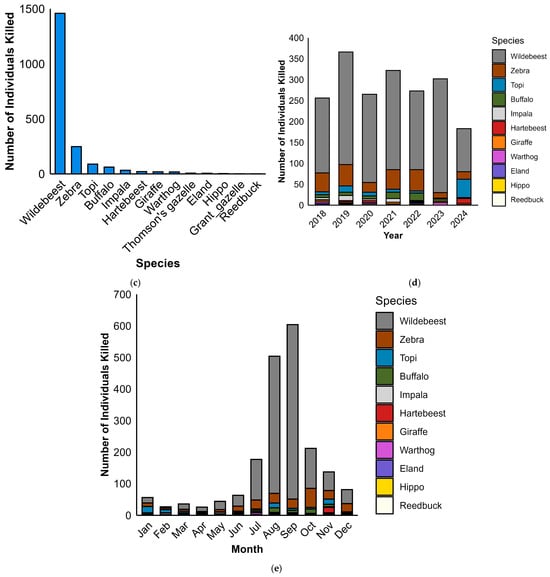
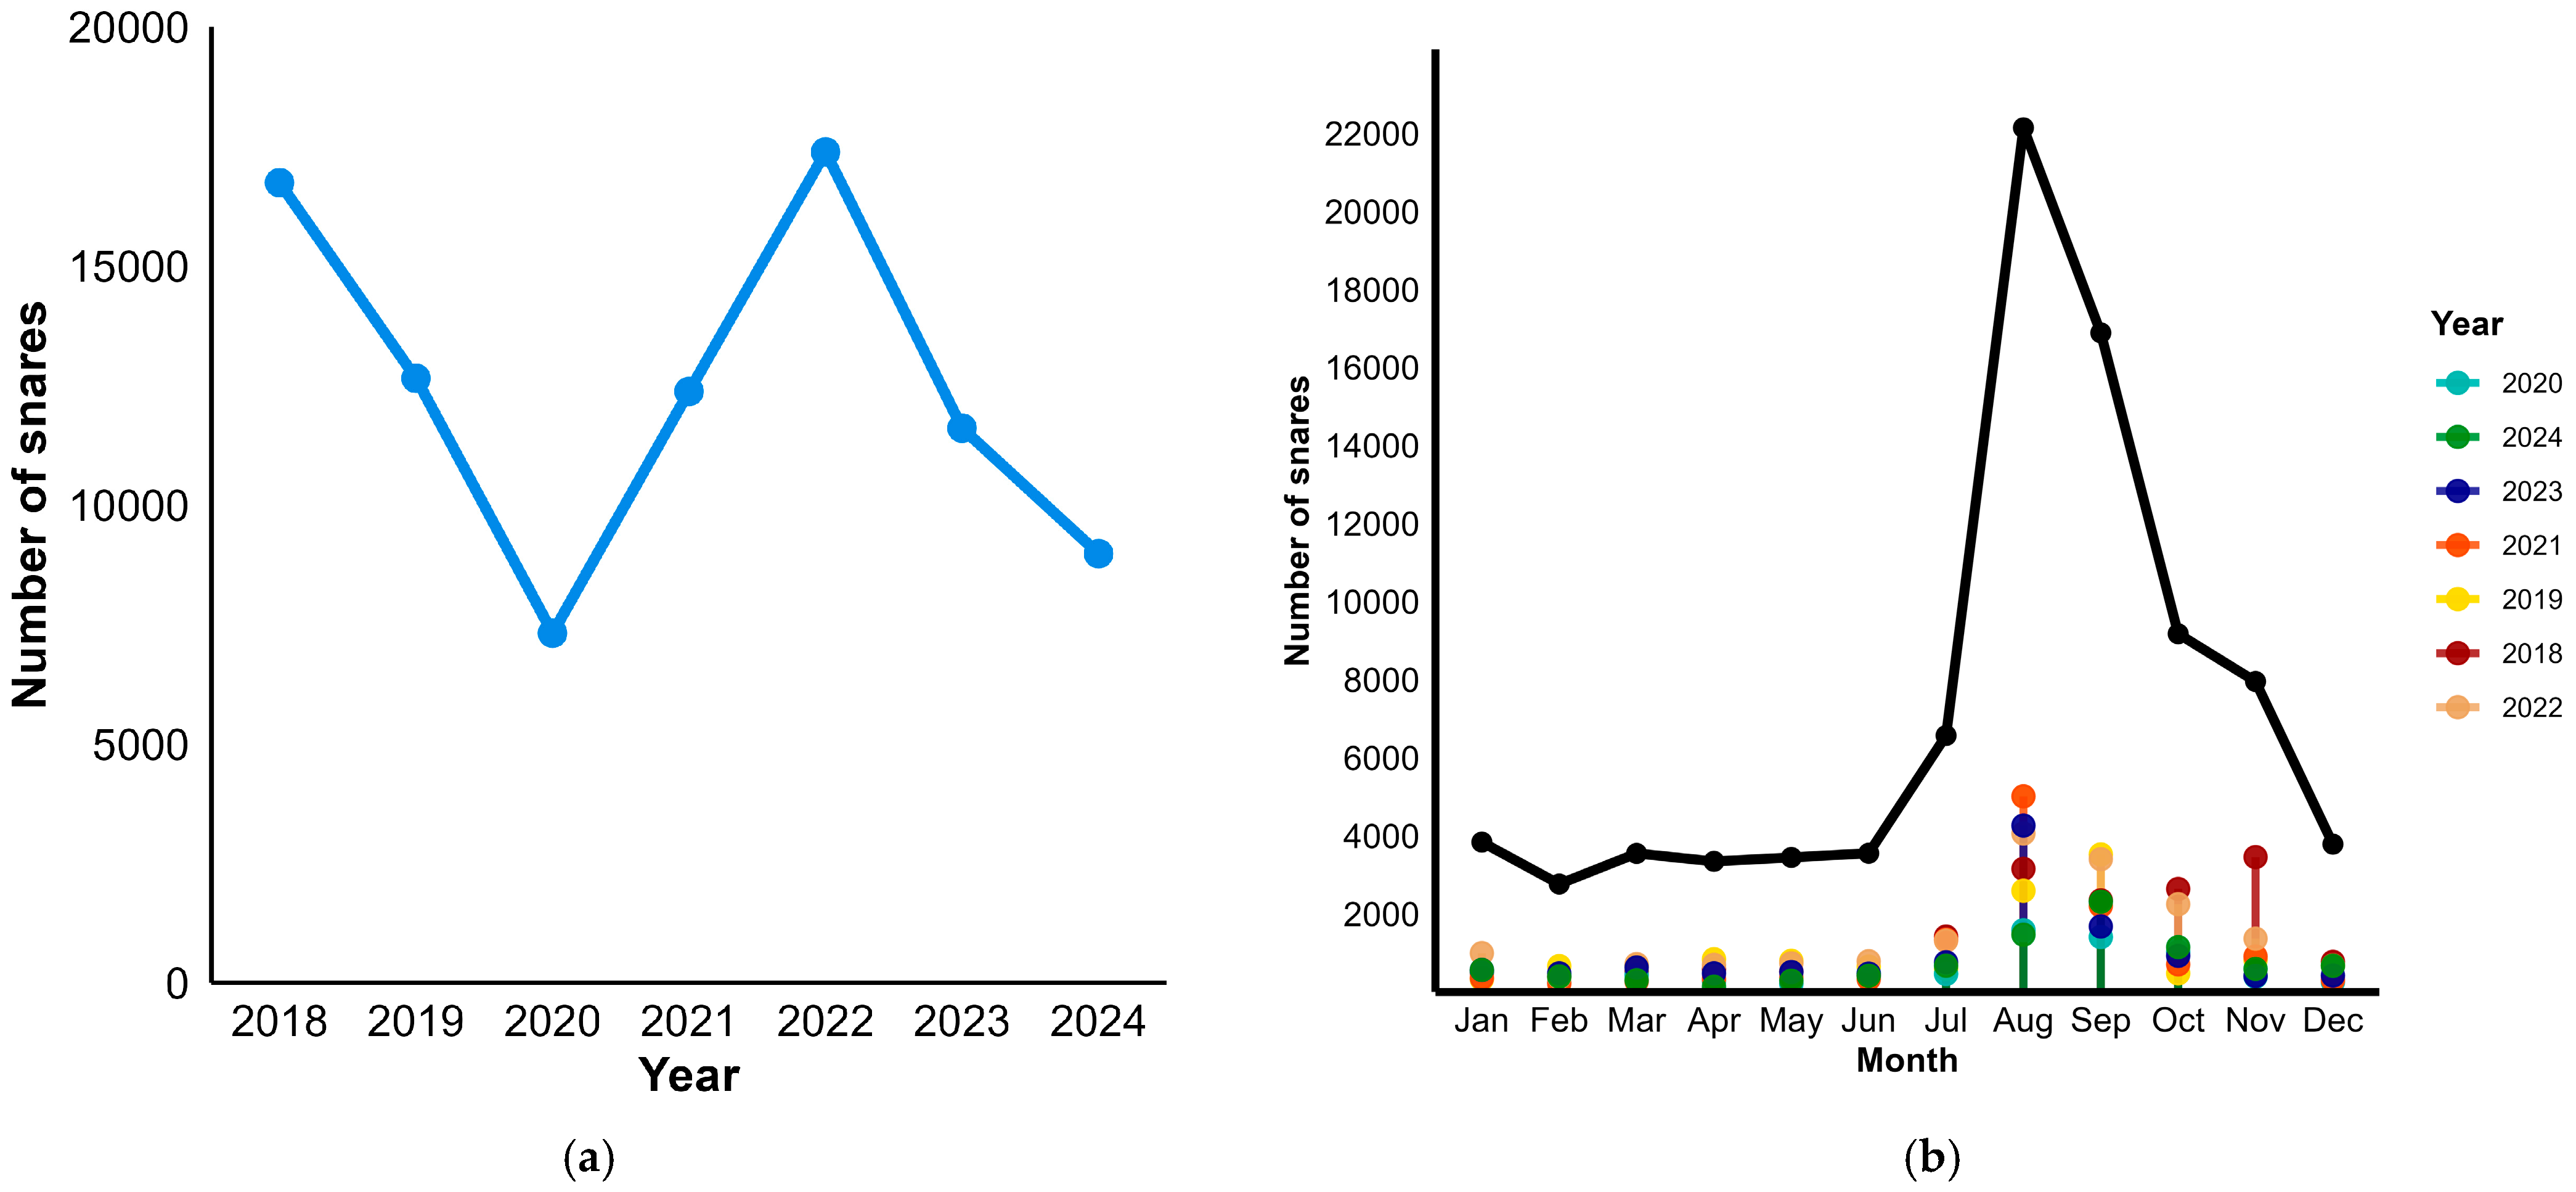
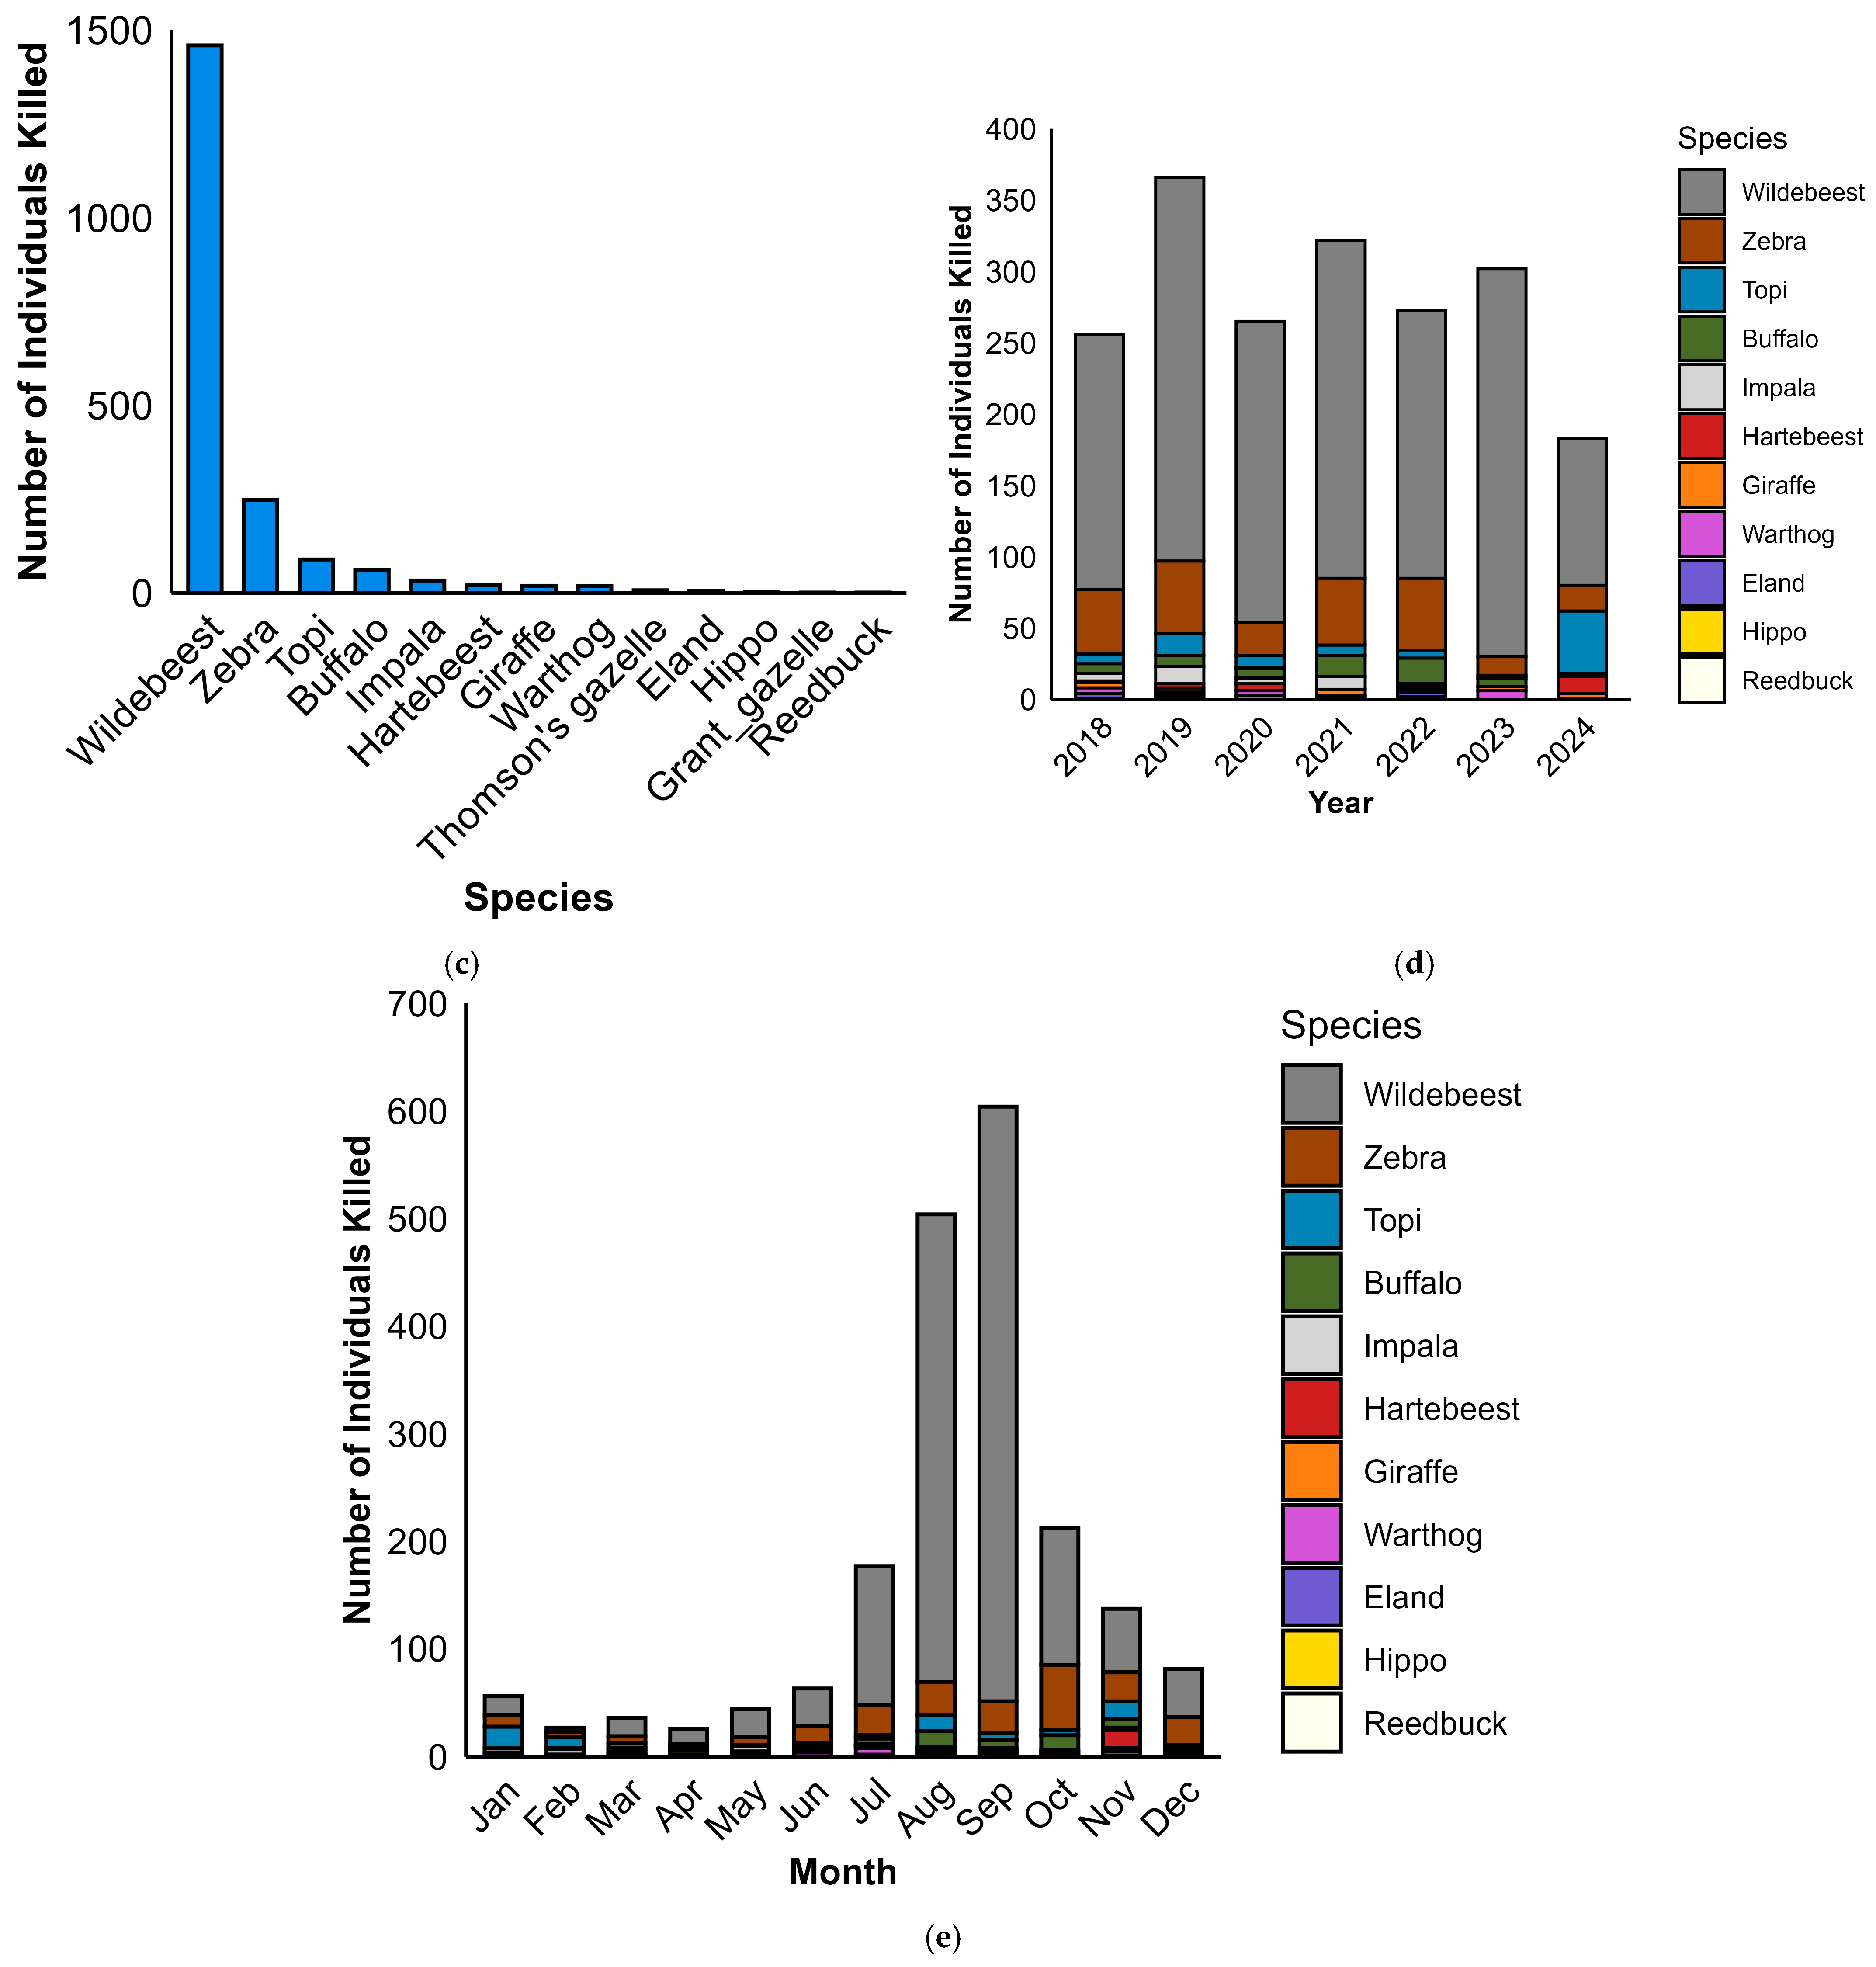
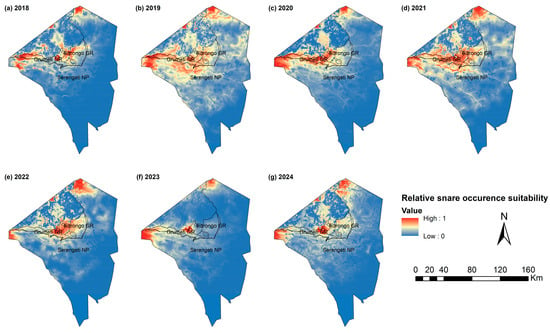
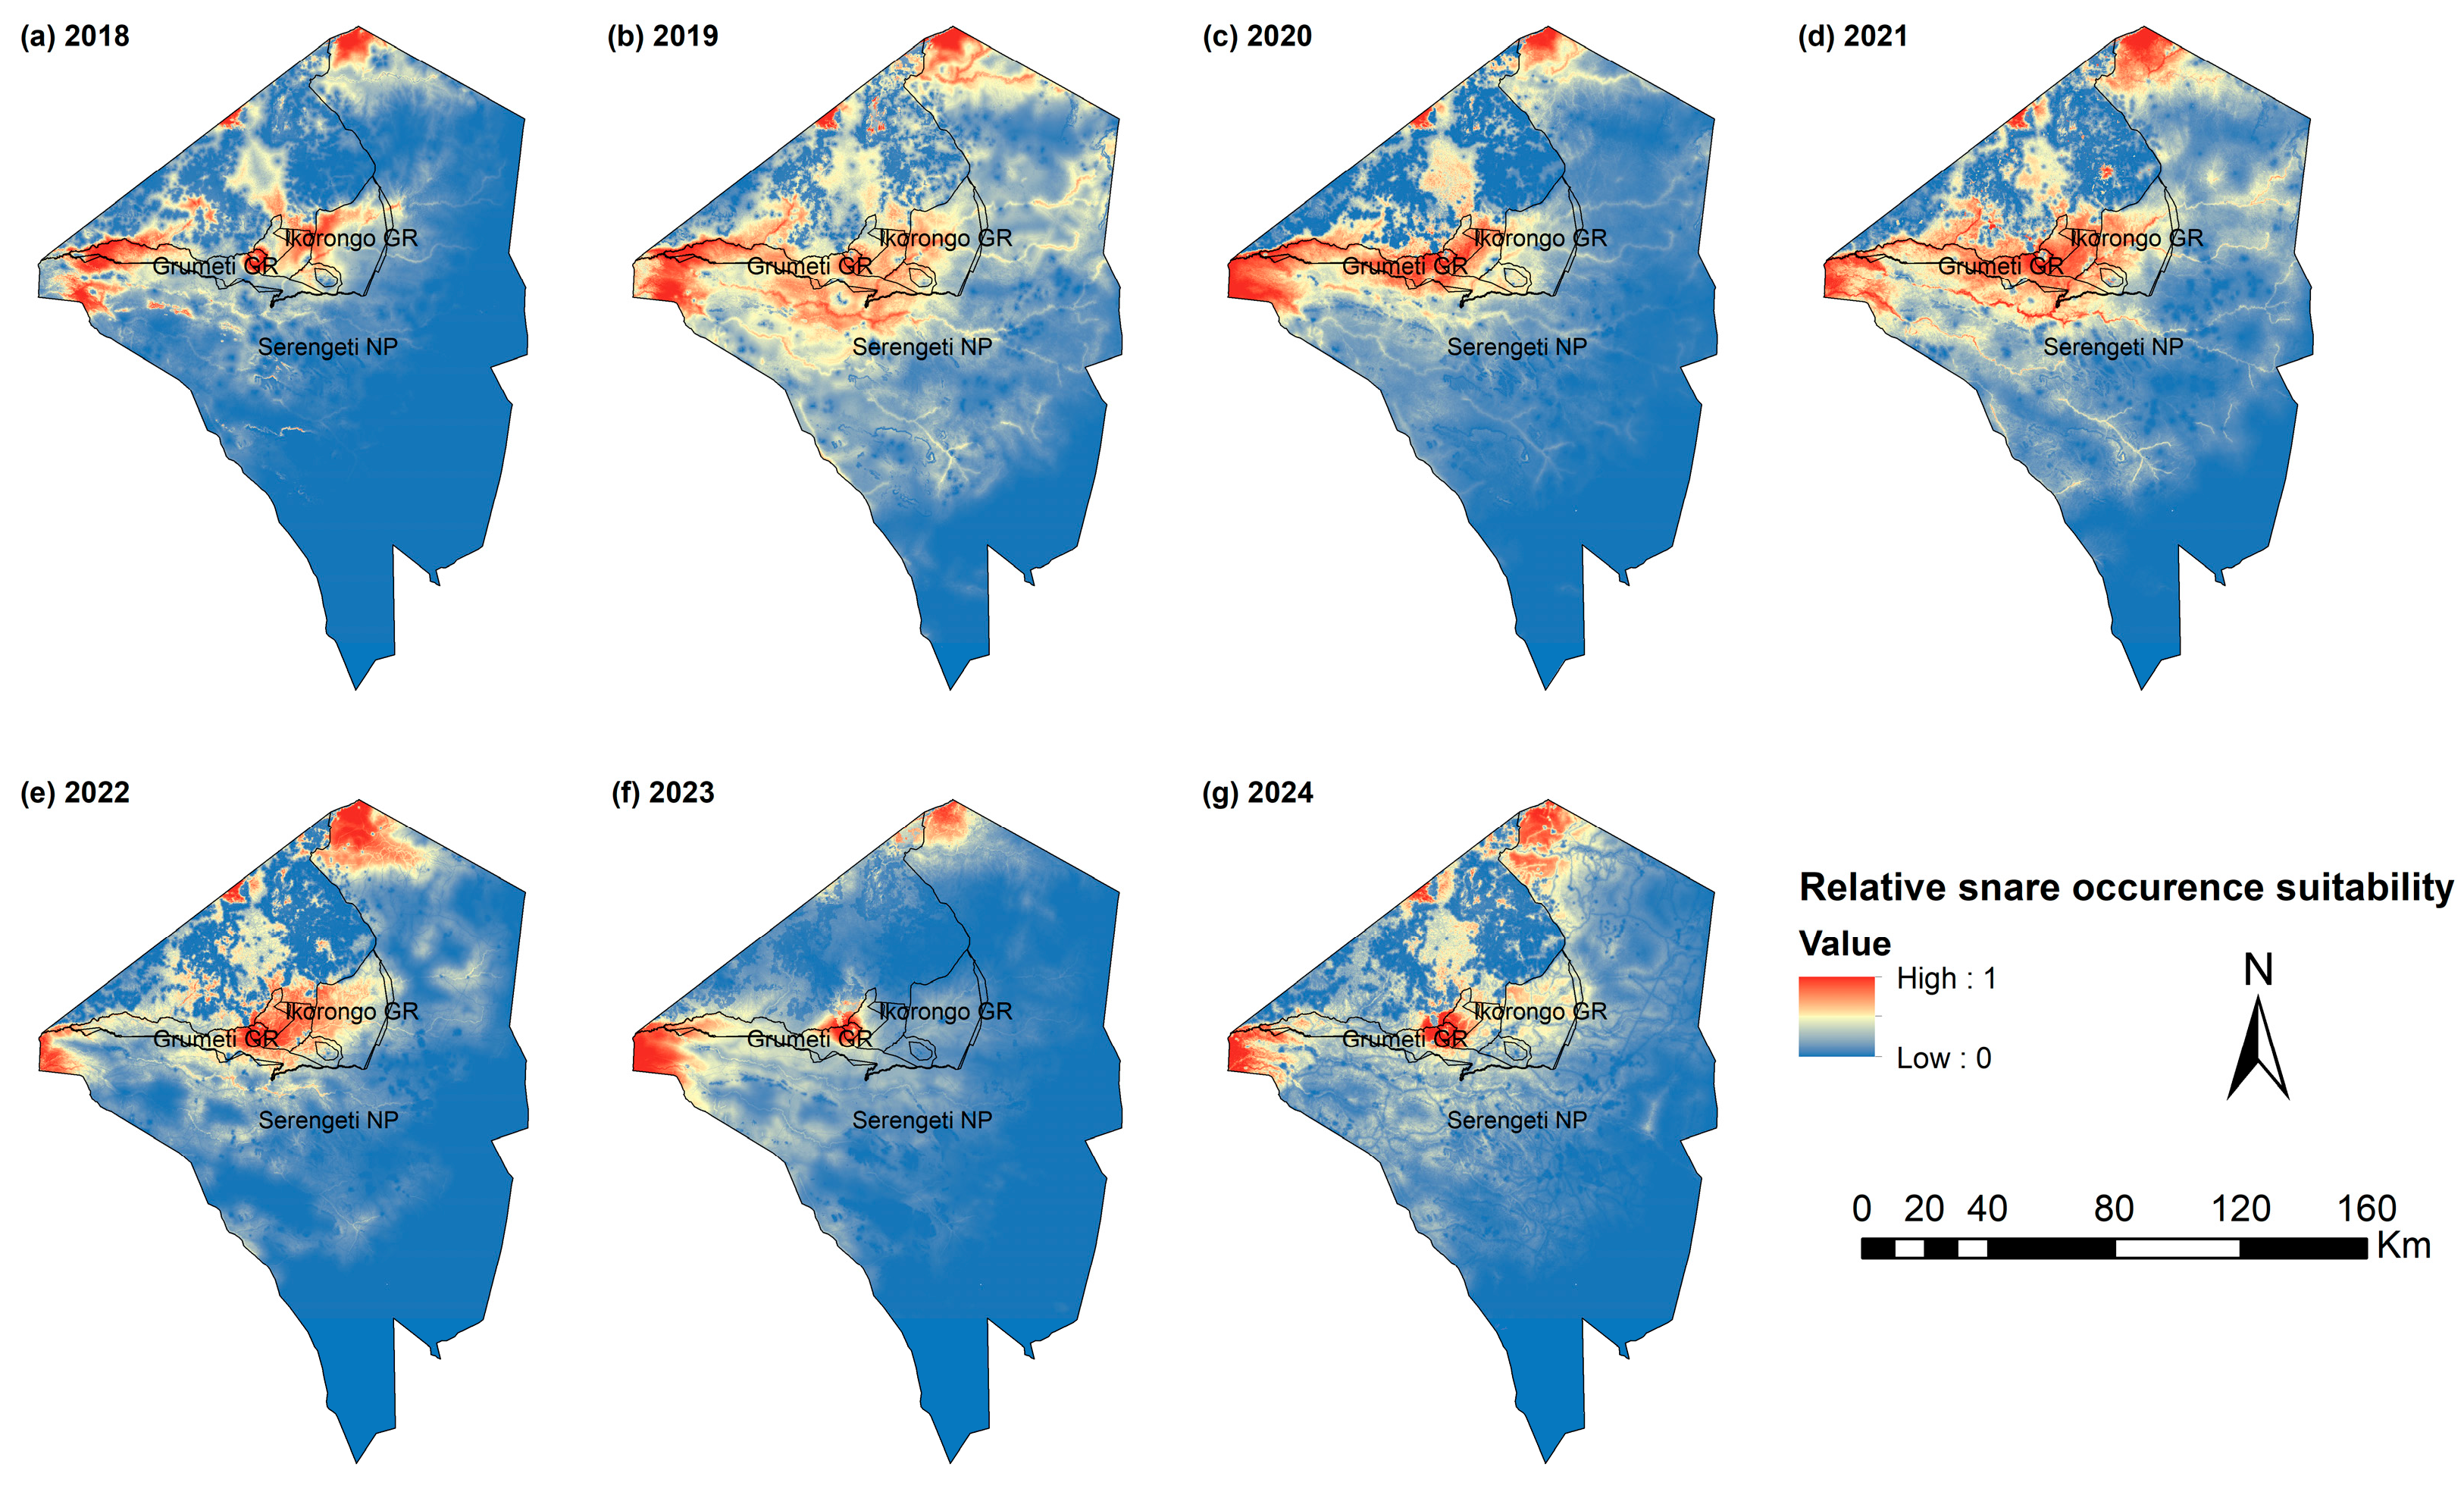
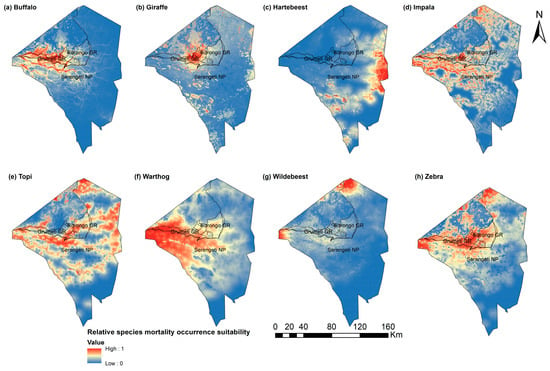
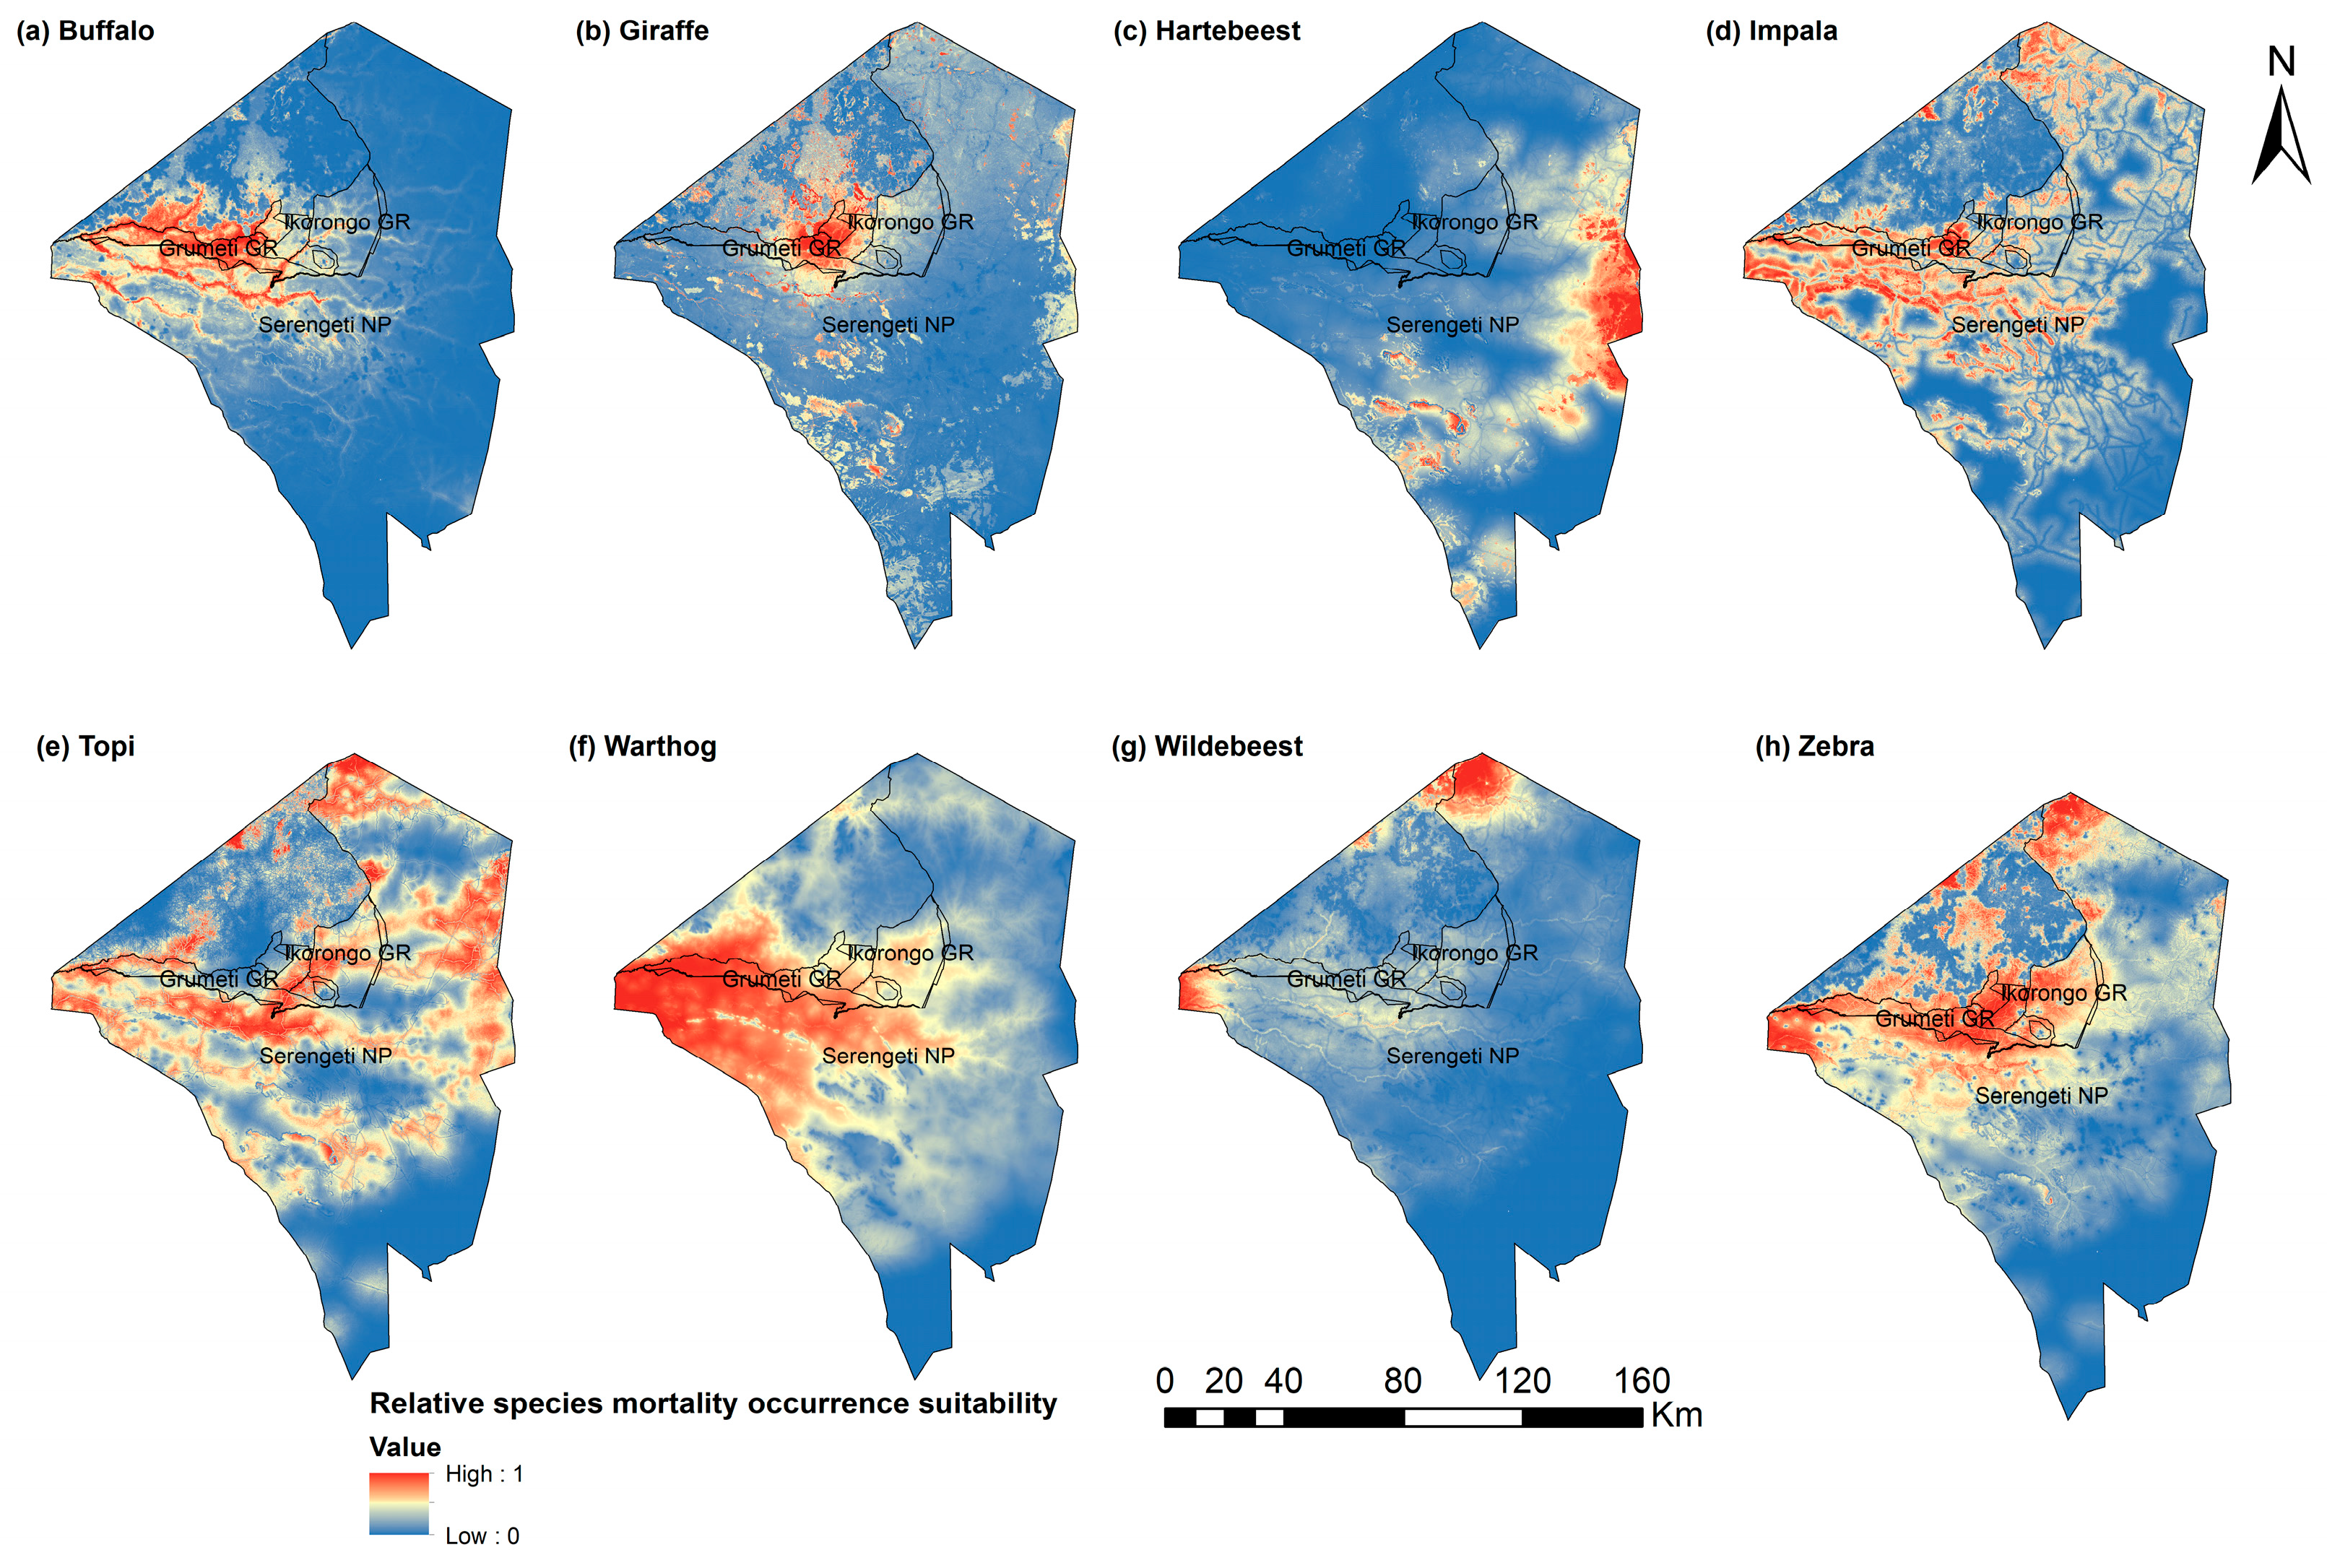

Disclaimer/Publisher’s Note: The statements, opinions and data contained in all publications are solely those of the individual author(s) and contributor(s) and not of MDPI and/or the editor(s). MDPI and/or the editor(s) disclaim responsibility for any injury to people or property resulting from any ideas, methods, instructions or products referred to in the content. |
© 2026 by the authors. Licensee MDPI, Basel, Switzerland. This article is an open access article distributed under the terms and conditions of the Creative Commons Attribution (CC BY) license.