


Abstract
Having reliable information on the main influences on the conservation behaviour of individuals is crucial to the evaluation of policy measures intended to promote sustainability. Knowing the potential for survey respondents to overstate the frequency with which they engage in behaviours that are thought desirable and understate the frequency with which they engage in behaviours that are thought undesirable is a matter of practical importance. This potential depends in part on the importance to them of appearing to be socially responsible with respect to conservation behaviours. We used crosswise questioning to investigate the influence of social desirability bias on self-reporting of conservation behaviour by members of the public in New Zealand. We also investigated the extent to which the importance of conservation influences the extent of apparent bias in respondents’ reporting of their behaviour. We found that the effect of social desirability bias on self-reports of conservation behaviour by members of the public in New Zealand may be substantial, being of the order of 20%, but also, counter-intuitively, that this bias may lead to under-reporting of conservation behaviours as well as over-reporting. We also found that the incidence of social desirability bias was associated with the personal importance of conservation to respondents.
1. Introduction
Having robust data on people’s conservation behaviour is crucial if we are to understand what influences people’s willingness to adopt, or not adopt, conservation behaviours. The main source of data on conservation behaviour, and the variables that are hypothesised to influence behaviour, is self-reports through surveys. This is because direct, continuous observation of actual behaviour on sufficient scale is completely impractical. In this context, knowing the extent to which people’s reports of their behaviour might be biased, one way or another, is important.
The potential for a variety of biases, including ‘social desirability bias’ [1], to influence survey responses has long been recognised, and a variety of techniques for framing questions have been developed to ameliorate them [2,3,4]. Social desirability bias surfaces when respondents answer questions about their opinions or behaviour in ways that avoid revealing opinions or behaviours that they believe others whose opinions they value will find objectionable [1,5]. Consequently, social desirability bias means that in their responses, people overstate the frequency with which they engage in behaviours that are desirable from a conservation or sustainability perspective and understate the frequency with which they engage in behaviours that are undesirable. The problem of invalid or unreliable responses resulting from social desirability bias is relevant for analysis and interpretation to all elicitation techniques that rely on participants’ self-reports, from the simplest techniques such as direct questioning through to the most complex such as contingent valuation [1]. Although the potential for social desirability bias to influence self-reporting of conservation behaviour in surveys is often acknowledged, the use of questioning techniques designed to overcome this bias in surveys of conservation behaviour has been somewhat limited [5,6]. Consequently, the circumstances that encourage or discourage bias have rarely been investigated [5].
In the context of reporting conservation behaviour, the presence of social desirability bias is attributed to psychological needs relating to impression management [5]. In principle, the importance of impression management for a respondent to a survey depends on the personal importance to them of social approval with respect to the topic at hand. In other words, the more important a respondent perceives conserving the environment to be relevant to others, the stronger will be their motivation to appear to act in ways that those others believe contribute to conserving the environment, irrespective of their actual behaviour.
In this study, we used crosswise questioning to infer the effect of social desirability bias (positive or negative) on responses to direct questioning about conservation behaviour in a survey. Compared to other indirect questioning techniques, crosswise questioning is easier to comprehend and to provide instructions for, as it does not require an external randomisation device [7]. Crosswise questioning has been applied to surveys in a range of fields, including racist attitudes [7,8,9], charitable behaviours [10], health behaviours [11], tax evasion [12], and behaviours relevant to conservation and sustainability, such as illegal wildlife hunting [13].
To the best of our knowledge, ours is the first ever application of the technique to a mix of voluntary, desirable, and legal conservation behaviours. We also test hypotheses about the association between the inferred effects of social desirability bias and the personal importance to respondents of environmental conservation.
2. Background
Social desirability bias is a form of strategic dishonesty, witting or otherwise, that arises when internal conflict arises between personal behaviour and a desire to appear to others to be aligning with, or conforming to, social norms about behaviour. The key point here is the strength of the desire to be seen to be conforming. Arguably, this desire depends fundamentally on the personal relevance and importance of the behaviour of interest, as it is these that condition both the extensiveness of decision-making about behaviour and the desire to conform.
Extensive decision-making is logical problem-solving based on the careful weighing and evaluation of relevant criteria to arrive at a satisfactory decision [14]. This implies the investment of substantial cognitive effort in gathering information, identifying relevant decision criteria, and systematically evaluating alternatives against those criteria to reach a decision [15]. Extensive decision-making may include affect (feelings) as a factor influencing the evaluation of alternatives and hence decisions [15]. Extensive decision-making is associated with strong, stable attitudes [16,17] which are in turn moderately predictive of behaviour [18,19].
Extensive decision-making requires ‘cognitive engagement’ and often entails ‘affective engagement’. Cognitive engagement is an indication of the level of intellectual activity devoted to accumulating knowledge related to a subject or task [20]. Affective engagement is an indication of the strength of positive or negative feelings and arousal a person experiences regarding a subject or task [20]. Together, cognitive and affective engagement influence ‘behavioural engagement’, or more simply, behaviour [21]. Cognitive, affective, and behavioural engagement imply effort in different forms.
Greater engagement with a subject or task is thought to generate greater enthusiasm, commitment, and performance with respect to that subject [22]. Hence, someone who is highly engaged, cognitively or affectively, with a subject is expected to feel a personal sense of obligation and responsibility towards the subject and so is likely to engage in actions associated with it [23,24,25,26,27,28].
Where engagement is largely a matter of personal volition, engagement can be expected to be motivated by the personal relevance and importance of a subject [29,30]. ‘Involvement’, a concept from the field of social psychology that applies to all voluntary behavioural choice contexts, is used widely particularly in marketing to capture just this: the personal relevance and importance that goods and services, as objects of choice, have for consumers [15,31].
Involvement arises from the degree to which the subject of interest is perceived to contribute to meeting experiential, functional, and self-identity needs [31]. Involvement is heightened the more significant are the perceived consequences (for meeting these needs) that might result from making decisions about the subject and the greater the perceived risk and consequences of making a wrong decision about the subject. There appears to be at least a moderate association between involvement and engagement with consumer products and services [32,33,34,35].
High involvement is associated with extensive decision-making, resulting in relatively strong, stable attitudes and a greater propensity to act. Importantly, this means that in high-involvement contexts personal attitudes are a key predictor of behaviour. Low involvement is associated with limited search effort and simplified decision-making, resulting in relatively weak, unstable attitudes and a lower propensity to act. Hence, personal attitudes may not alone be a key predictor of behaviour when involvement is low. In the absence of any external compulsion, those with low involvement in a subject are unlikely to engage in subject-related behaviours requiring a high degree of effort.
To summarise, involvement indicates the personal importance of a subject and influences the extent of cognitive and affective engagement with it, and thus the effort devoted to gathering information and making decisions about it. A pivotal implication of this is that, because higher involvement leads to stronger cognitive and affective engagement and more extensive decision-making and stronger opinions and attitudes, the potential influence of social desirability bias on self-reported behaviour weakens as involvement increases. Presumably, involvement dampens any propensity to seek social approval. In other words, the motivation to comply with social norms [36] is weakened when involvement is high. Therefore, when involvement is high, self-reported behaviour is more likely to reflect actual behaviour.
Conversely, the potential influence of social desirability bias on self-reported behaviour strengthens as involvement decreases because lower involvement leads to weaker cognitive and affective engagement, more routine decision-making, and weaker opinions and attitudes. When involvement is low and the desire for social approval is strong, there is a greater chance that self-reported behaviour will be based on perceptions of subjective norms. When involvement is low but the desire for social approval is weak, self-reported behaviour is more likely to be the outcome of using heuristics or random responses [37].
The influence of involvement on sensitivity to subjective norms is likely to be conditional on the effort entailed in a behaviour and the visibility of the behaviour. On the one hand, a higher level of involvement is likely to be needed to trigger higher-effort behaviours than lower-effort behaviours. On the other hand, however, a lower level of involvement is likely to be needed to trigger behaviours that are highly visible to relevant others compared to behaviours that are less visible.
Given the preceding reasoning, we proposed the following hypotheses (see Figure 1):
- Involvement and engagement with the conservation of biodiversity would be inversely associated with social desirability bias regarding the conservation of biodiversity.
- Respondents with relatively low levels of involvement and engagement with conserving biodiversity would show social desirability bias for low-effort behaviours.
- Social desirability bias regarding the conservation of biodiversity would be associated with subjective norms for low-effort behaviour.
- Social desirability bias regarding the conservation of biodiversity would not be associated with subjective norms for high-effort behaviour.
Figure 1.
Hypothesised associations between involvement, attitudes, engagement, and behaviour Source: Kaine & Wright [38]. Note that elements with a grey background were not measured.
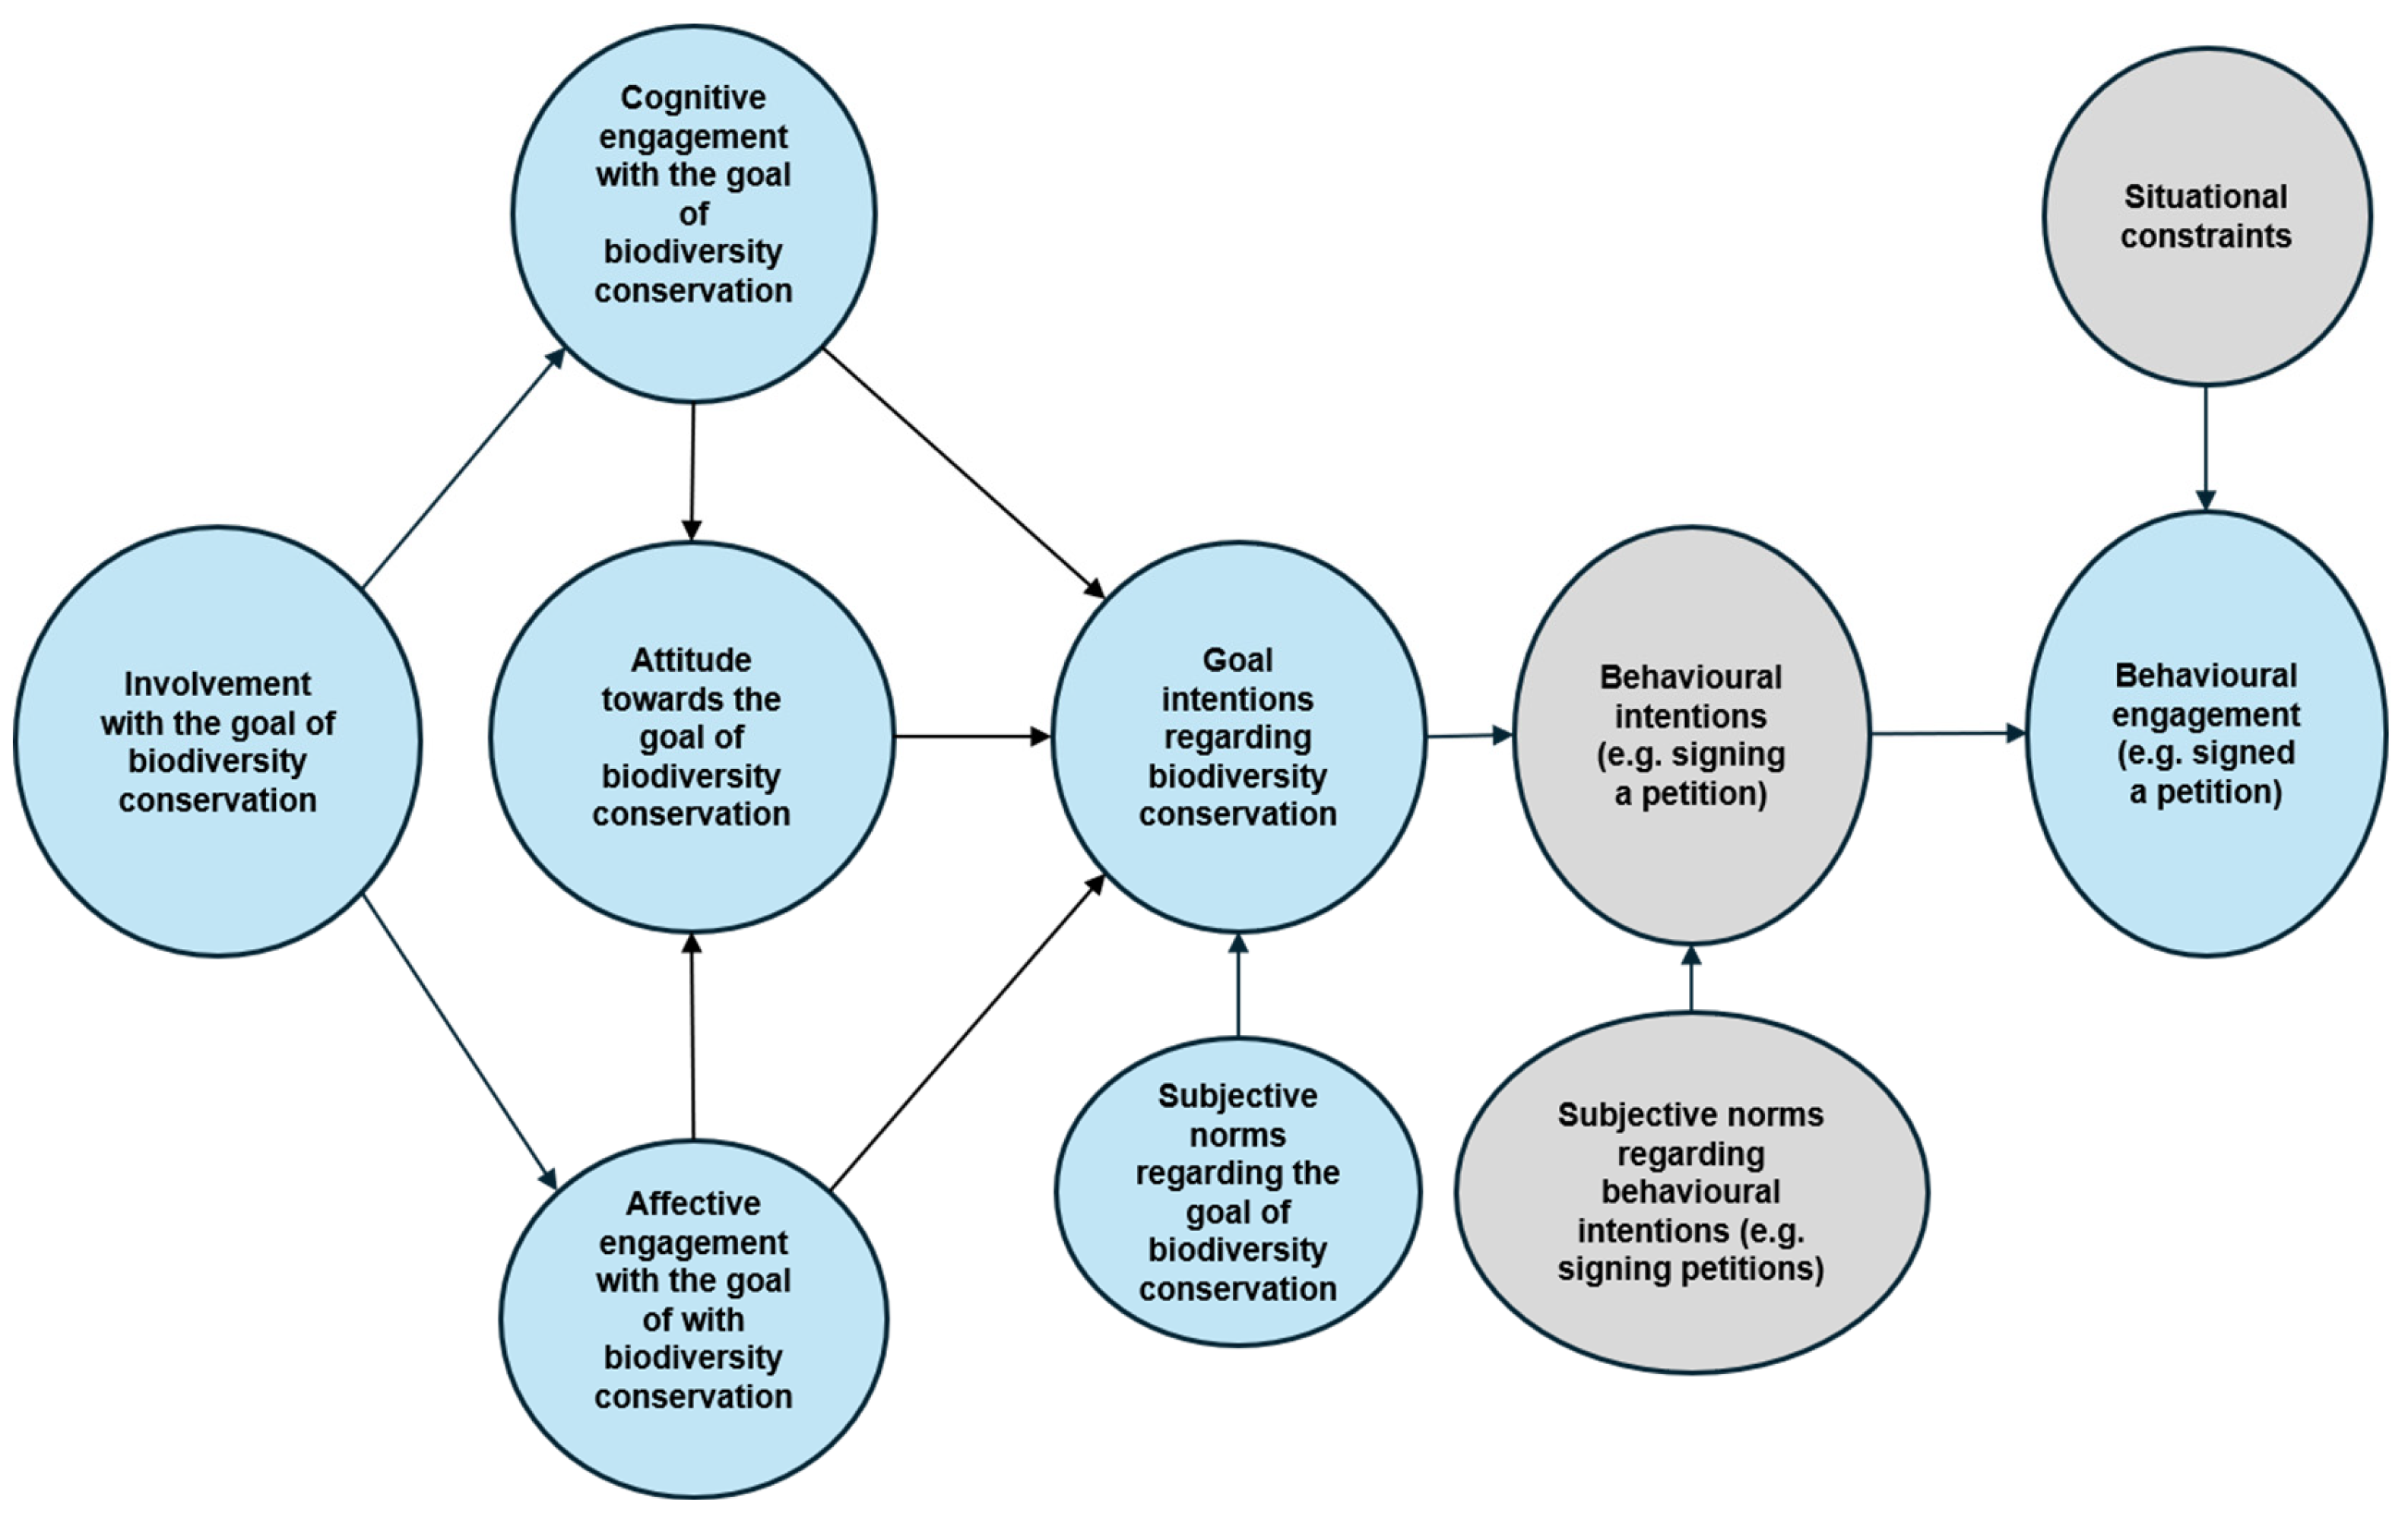
We tested these hypotheses by conducting a survey of the New Zealand public and comparing their responses to direct and crosswise questioning regarding four activities associated to a greater or lesser degree with protecting the environment and conserving biodiversity. The four activities were: signing an online petition in support of the environment (low effort); cleaning up litter in public spaces, parks, and forests (low effort); taking part in hearings or consent processes about the environment (high and low effort); and participating in a project to improve the natural environment (high effort). We originally assumed that taking part in hearings or consent processes about the environment would be a high-effort activity. However, after the survey had been in the field, it came to our attention that respondents could easily participate in processes and hearings by responding to online invitations from councils to respond to draft policies. Such invitations are a common feature of the public consultation processes of councils in New Zealand. Hence, we treated participating in processes and hearings as a mix of high- and low-effort activity.
Hereafter, the activities are referred to as picking up litter, signing petitions, attending hearings, and participating in projects.
3. Materials and Methods
3.1. Materials
The survey questionnaire used to gather information on cognitive, affective, and behavioural engagement with conserving biodiversity, involvement with conserving biodiversity, and conservation behaviours is described in Kaine & Wright [38,39]. Briefly, respondents’ cognitive and affective engagement with conserving biodiversity was measured using biodiversity appreciation scales suggested by Fielding et al. [40] and Fielding et al. [27]. Respondents’ involvement with conserving biodiversity was measured using a shortened version of a scale developed by Laurent and Kapferer [41]. Statements in the involvement and engagement scales were randomised to avoid systematic bias in responses that may arise from the presentation order of questions. These scales, together with the scoring system for the engagement scales, are reported in Appendix A (Table A1, Table A2, Table A3, Table A4, Table A5 and Table A6).
Respondents’ intentions regarding the goal of conserving biodiversity were measured based on their agreement with four statements describing feeling some responsibility, changing normal behaviour, being prepared to make sacrifices, and being willing to work with others, to protect the native plants and wildlife of New Zealand [38]. Respondents’ attitudes towards conserving biodiversity were measured using the simple evaluative statement ‘protecting the native plants and wildlife of New Zealand is the right thing to do’ (Table A5). Respondents’ subjective norms regarding biodiversity conservation were based on their assessment of the agreement of others (i.e., ‘most people they know’) with these statements (Table A6).
Respondents scored their agreement with the attitude statement and evaluative statements in the cognitive engagement, affective engagement, involvement, subjective norms, and goal intentions scales, using a five-point rating ranging from strongly disagree (1) to strongly agree (5). Respondents were also questioned about their age, gender, education, ethnicity, and household income [38].
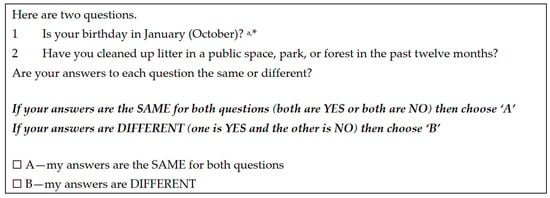
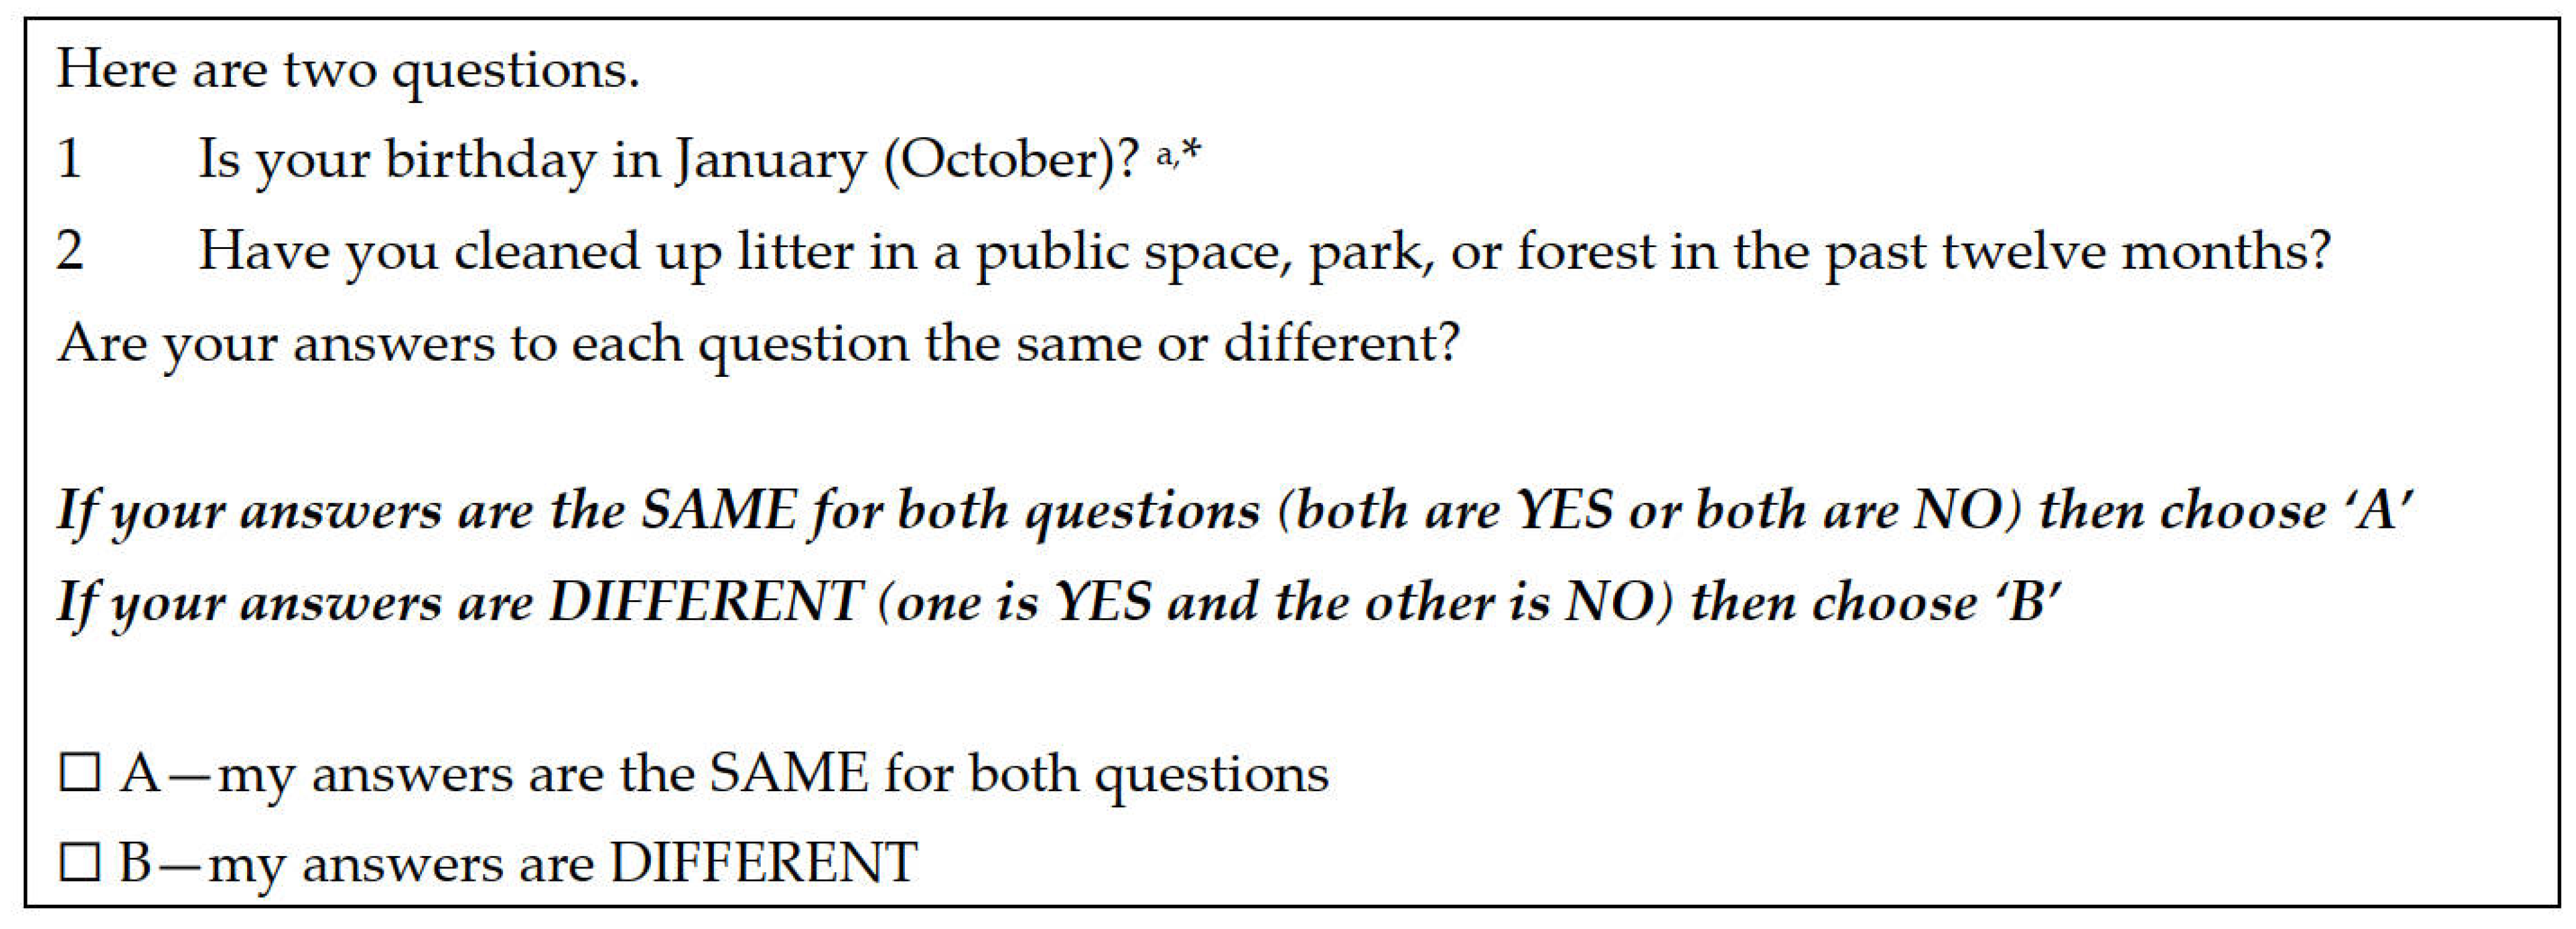
As described in Kaine & Wright [38], respondents were questioned about their conservation behaviour directly and using crosswise questioning. Crosswise questioning relies on asking respondents about a sensitive statement (the behaviour of interest) and a non-sensitive statement (e.g., the respondent’s month of birth) at the same time (see Figure 2). Respondents answer by choosing one of two options. Option A is that both statements are true or that both statements are false. Option B is that one statement is true and the other statement is false [38]. The order in which the crosswise questions were presented to respondents was randomised to avoid systematic bias in responses that may arise from the presentation order.
Figure 2.
Example crosswise question. a Non-sensitive attribute with known probability of occurrence. * Respondents were randomly allocated between January and October variants.
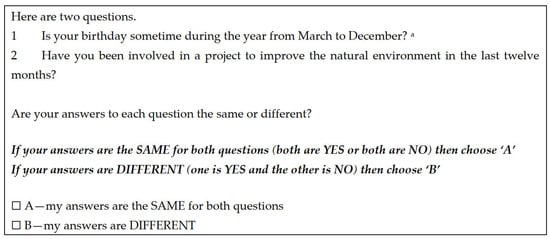
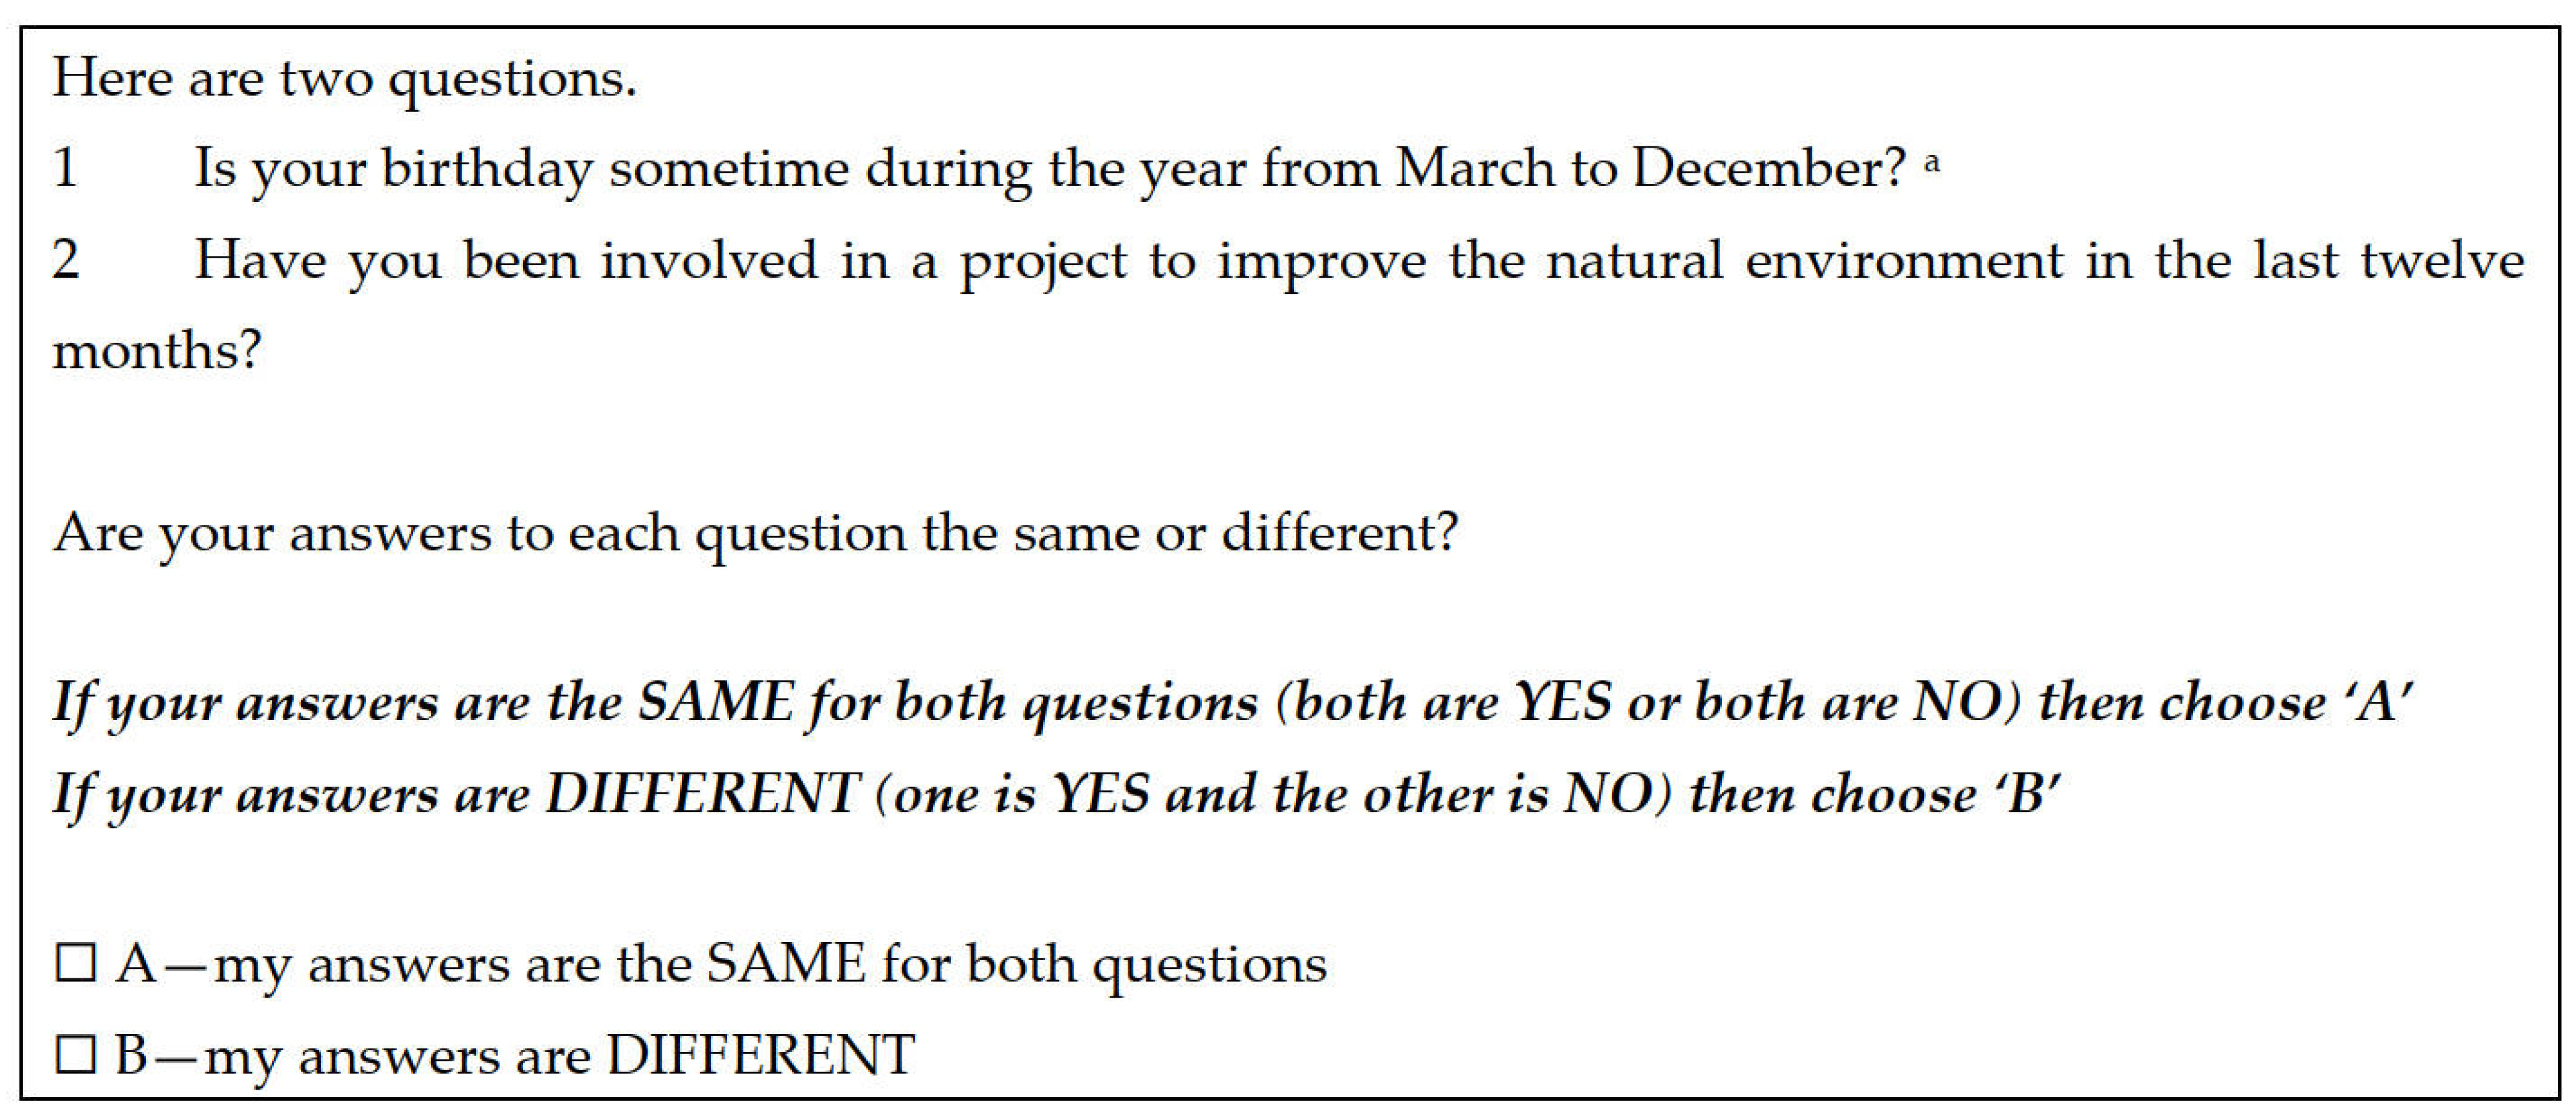
To allow testing for systematic preference effects or non-adherence to the instructions regarding crosswise questions, we implemented a modification of the extended crosswise model proposed by Meisters et al. [7]. This was done in two ways: first, by randomly offering two different versions of the non-sensitive attribute (‘Is your birthday in January?’ or ‘Is your birthday in October?’); and second, having a different version of the non-sensitive attribute (‘Is your birthday sometime during the year from March to December?’) for the crosswise question regarding participating in a project to improve the environment (Figure 3).
Figure 3.
Alternative crosswise question. a Non-sensitive attribute with known probability of occurrence.
In the absence of information about the true state of respondents regarding the non-sensitive statement, the behaviour of individual respondents cannot be inferred from their answers. This should make it apparent to respondents that their answer to the sensitive statement is anonymous: they are never asked directly to reveal their behaviour [8,42]. This encourages the analyst to infer greater honesty in responses when, as is commonplace, crosswise questioning reveals higher proportions (termed ‘prevalence’) of socially undesirable behaviour amongst respondents than does direct questioning (see Meisters et al. [7]). Consequently, we assumed that respondents were more honest when answering the crosswise questions than when answering direct questioning.
Note that in the New Zealand context, the conservation of biodiversity means ‘the conservation of native plants and wildlife’ [43,44]. Given the possibility that some respondents might interpret ‘conserving biodiversity’ to include introduced species, Kaine & Wright [38] formulated two versions of the questionnaire, one using the term ‘biodiversity’, and the other using the phrase ‘native plants and wildlife’. Kaine & Wright [38] found that responses to the statements containing the term ‘conserving biodiversity’ were not meaningfully different from the statements containing the term ‘protecting native plants and wildlife’ and therefore aggregated responses to the two versions of the questionnaire. This approach has also been adopted here.
The questionnaire was piloted and administered by a commercial market research company to members selected at random from an online consumer panel. Members received a small reward for each survey they completed. Participation in the survey was voluntary, respondents could leave the survey at any time, and all survey questions were optional and could be skipped. The research approach was reviewed and approved by the social ethics process of Manaaki Whenua—Landcare Research (SE 2122/11), which is based on the New Zealand Association of Social Science Research code of ethics. As participants were members of a commercial consumer panel and were provided with a project information sheet, completion of the questionnaire was regarded as providing informed consent.
The survey commenced on 26 February 2024 and closed four weeks later on 22 March 2024 when 1000 responses had been obtained [38]. In the pilot (n = 50), respondents were questioned about the difficulty of answering the crosswise questions. Eight per cent indicated that they found the questions difficult. One respondent found them very difficult to answer.
3.2. Methods
Our analytical approach was to compare responses to direct questioning and to the crosswise questioning regarding conservation actions and then investigate the extent to which differences in responses were associated with (a) involvement and engagement with biodiversity conservation, and (b) subjective norms regarding the conservation of biodiversity.
Crosswise questioning is designed to indicate response validity by providing estimates, adjusted for social desirability bias, of the prevalence of a behaviour claimed by the respondent to have been undertaken [7]. Crosswise questioning also offers the potential to identify the extent of random responses to questions [10], indicating response reliability.
Prevalence rates (the proportion confirming a fact or behaviour) for crosswise responses across the sample were estimated as follows [45]:
where Pr(A) is the probability that the same answer applies to both statements, p is the known probability that the answer to the non-sensitive statement is affirmative, and π is the estimated probability that the answer to the sensitive statement is affirmative. Confidence intervals for crosswise prevalence estimates can be obtained, if needed, using the formulae provided by Yu et al. [45].
Pr(A) = λ = (1 − π) · (1 − p) + π · p
π = (λ + p − 1)/(2p − 1)
To enable us to distinguish respondents exhibiting positive or negative social desirability bias in their answers, we were provided by the market research company data indicating whether respondents’ birth month was January, February, or October. Together with the responses to the crosswise questions, these birth-month data enabled the identification of respondent behaviour related to the sensitive questions. As respondents were anonymous, the provision of these data did not violate their privacy.
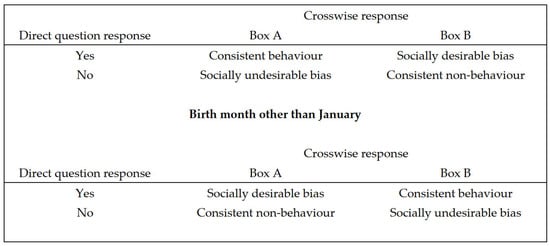
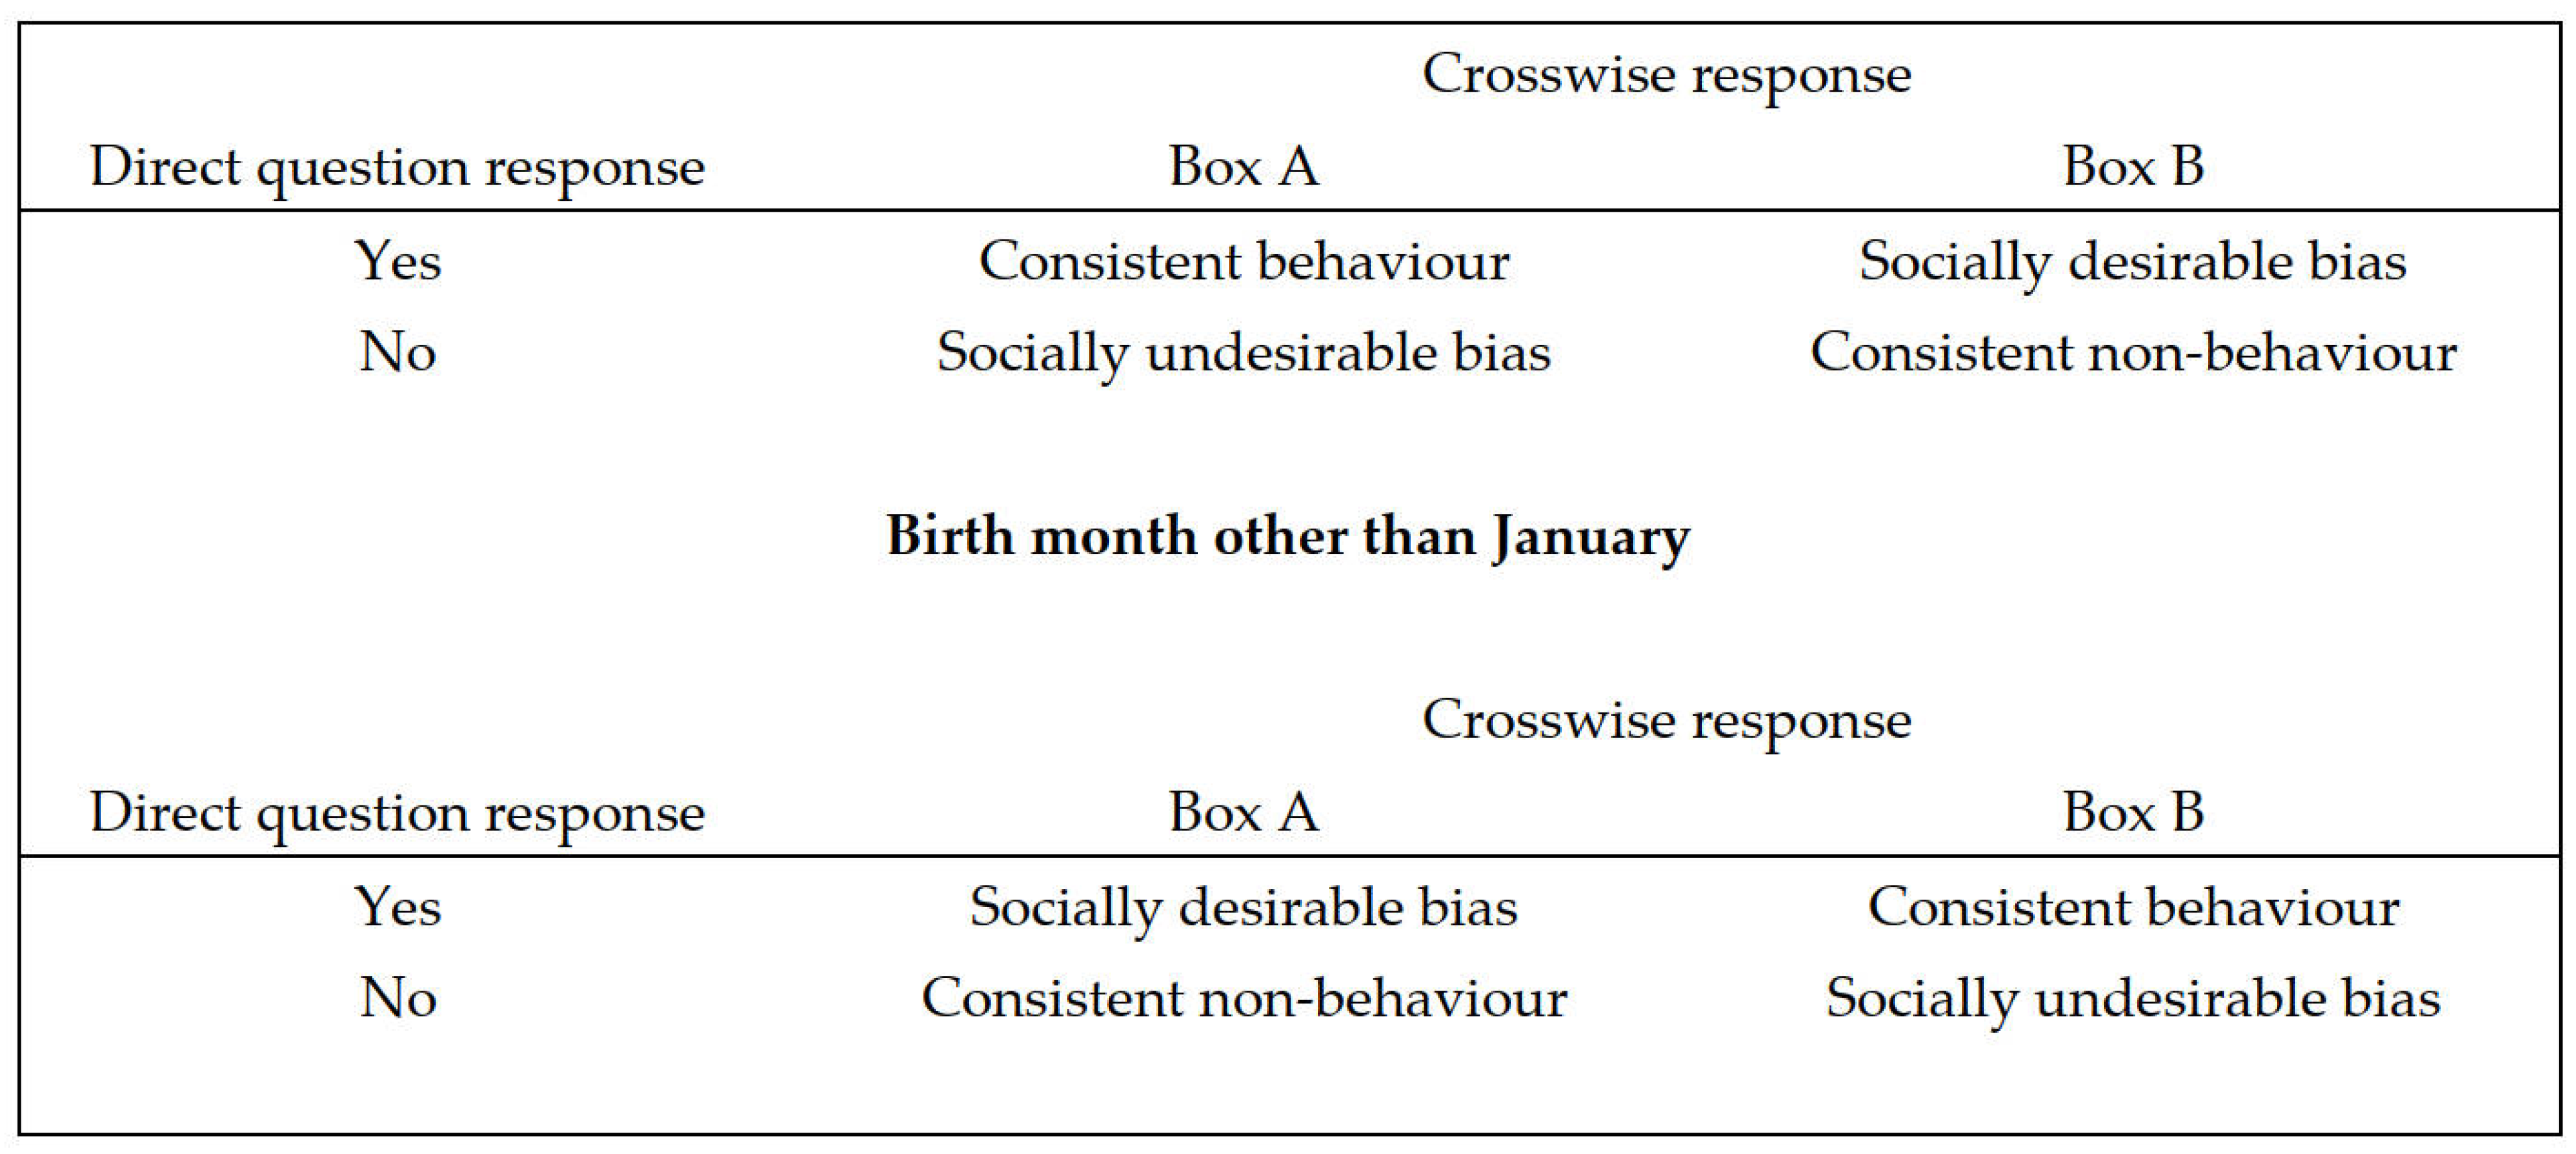
This allowed us to classify respondents into four groups based on their responses to the direct and crosswise questions. These groups were defined by the consistency of the revealed behaviour with their direct question responses for each specific behaviour (consistent non-behaviour or consistent behaviour) and, where there was inconsistency, what the inconsistency revealed as bias in answers to direct questions: apparent socially desirable bias, where actual non-behaviour was accompanied by a claim of such behaviour in direct question responses; or apparent socially undesirable bias, where a claim of non-behaviour in direct question responses was accompanied by actual behaviour (Figure 4).
Figure 4.
Example of classifying respondents into reporting groups.
To check for systematic preference effects or non-adherence to the instructions regarding crosswise questions, we tested for statistically significant differences in estimated prevalence rates across the different versions of crosswise questions using the formula provided by Yu et al. [45].
We also tested the influence of random responses to crosswise questions. We assumed that respondents who answered the crosswise questions randomly would likely do so for all the behaviours, as the provision of random responses is triggered by the answering task rather than the behaviours themselves. This implies that the proportion of respondents who answered randomly should be similar across the behaviours (given that the ordering of crosswise questions was randomised); therefore, the proportion of random responses required to generate the observed differences between the direct question and crosswise question prevalence estimates should be similar across the behaviours. Consequently, if the proportion of random responses required to generate the observed differences in the direct and crosswise prevalence estimates vary considerably across behaviours, then the difference in the estimates is unlikely to be due to random responses. The formula provided by Walzenbach & Hinz [37] was used to estimate the proportion of respondents that would need to answer randomly to generate the differences in the observed prevalence estimates.
For reasons that will become apparent, we also estimated the proportion of respondents who would have had to deliberately or mistakenly answer the crosswise questions incorrectly to obtain the estimated prevalence of negative bias (Appendix B).
We tested our hypotheses regarding involvement, engagement, and social desirability bias using multinomial logistic regression to distinguish between respondents in each of the four groups. As involvement, attitudes, intentions, cognitive engagement, affective engagement, and subjective norms were highly correlated, principal-component analysis was used to create uncorrelated factors summarising the variance in these data prior to estimating the regressions. The explanatory variables in the regressions were the components, together with the demographic characteristics of respondents. Statistical analyses were conducted using SPSS v31 [46].
4. Results
Kaine & Wright [38] noted that their sample of respondents differed from the population of New Zealand in being younger, more highly educated, and earning higher household incomes than the general population (Appendix C, Table A7, Table A8, Table A9 and Table A10). They proposed that the demographic differences between the sample and the general population reflected differences regarding internet access to, and comfort with, online activities among groups in the general population. While they found some statistically significant associations between respondents’ demographics and their involvement and engagement with conserving biodiversity, they concluded that the bias in age, education, and incomes in the sample did not materially affect the results as the effect sizes were small [38]. They reported reasonable alpha reliabilities, ranging between 0.67 and 0.89, for the engagement, involvement, intention, and subjective norm scales [38].
4.1. Classifications
The estimated prevalence of each behaviour using direct and crosswise questioning is reported in Table 1 together with the proportion of respondents classified to each of the four reporting groups. The differences between the direct and crosswise estimates of prevalence are statistically significant and substantial. For both cases of lower-effort behaviour (picking up litter and signing petitions), the proportion of respondents reporting they engaged in the behaviour is greater than for the higher-effort behaviour (participating in projects), which is consistent with engaging in more effortful behaviour being positively correlated with greater involvement.
Table 1.
Proportion of respondents in each reporting group.
Note that we report the results for attending hearings, but we did not include them in the testing of the hypotheses because we could not unambiguously characterise this as high- or low-effort behaviour, and because the proportion of respondents reporting as engaging in this behaviour was exceptionally small.
Most respondents answered the direct and crosswise questions consistently irrespective of the behaviour of interest. The proportion of respondents exhibiting positive social desirability bias was small, especially compared with the proportion exhibiting negative social desirability bias. This means that, for whatever reason, respondents were more likely to under-report rather than over-report performing (seemingly) socially desirable behaviour. As a result, the estimated prevalence of the behaviours is higher for crosswise than for direct questioning.
As the estimated prevalence using direct questioning was less than 50% for each of the conservation behaviours, the proportions of respondents that would have had to answer the crosswise questions randomly to generate the differences between direct and crosswise questioning in the estimated prevalence for each behaviour can be calculated [37]. The variation in these proportions suggests that the difference between the direct and crosswise estimates of the prevalence of behaviours is unlikely to be due to random responses (Table 1). Note that the proportion of random responses needed to explain the difference in estimated prevalence for picking up litter was infeasible (>100%). Note also that the proportion of respondents that would have had to answer the crosswise questions randomly to generate the differences in direct and crosswise prevalence estimates was smaller for respondents with below-average involvement in conserving biodiversity compared to respondents with above-average involvement in conserving biodiversity. This indicates that randomness in responding to the crosswise questions was not systematically related to respondents’ level of interest in conserving biodiversity (as measured by involvement).
To exhibit negative social desirability bias, respondents answering a direct question affirmatively would have to deliberately or inadvertently answer the corresponding crosswise question incorrectly. Given the size of the negative-bias groups, this means that some respondents who indicated that they did not engage in a behaviour when questioned directly and whose birthday was not in the relevant month chose box B instead of box A when answering the corresponding crosswise question, thereby indicating that they did engage in the behaviour. For example, these respondents indicated that they did not pick up litter when questioned directly and chose box B instead of box A when answering the corresponding crosswise question, even though their birthday was not in January.
The proportion of respondents that would have to deliberately or inadvertently answer a crosswise question incorrectly after answering the corresponding direct question affirmatively was estimated for each conservation action (Appendix B). The results indicated that this proportion was roughly similar across the actions except for participating in projects to benefit the environment, where the proportion was much higher (Table 1).
The overlap among the behaviours in the respondents that were classified as having a negative social desirability bias is reported in Table 2. The overlap is considerable for picking up litter, signing petitions, and attending hearings. Note that only 1.8% of respondents were classified into the negative-bias group for all the behaviours.
Table 2.
Overlap in negative social desirability bias.
The differences in the mean scores for the reporting groups on involvement, attitudes, cognitive and affective engagement, intentions and subjective norms are reported in Appendix C (Table A11, Table A12, Table A13 and Table A14). There were reasonably consistent patterns in the differences in means across the four behaviours, with respondents who consistently reported behaviours having higher involvement, more favourable attitudes, stronger intentions and greater engagement on average compared to respondents who consistently reported non-behaviour.
Respondents in the positive social desirability group were like those in the consistent-behaviour group with respect to their involvement, attitudes, cognitive, and affective engagement, intentions, and subjective norms. Respondents in the negative social desirability group were like those in the consistent non-behaviour group on involvement, attitudes, intentions, and cognitive and affective engagement, but had significantly higher mean scores on subjective norms regarding others’ intentions to conserve biodiversity.
4.2. Multinomial Logistic Regressions
Principal-component analysis was used to create uncorrelated factors from the data on involvement, attitudes, cognitive engagement, affective engagement, intentions, and subjective norms to avoid problems with multicollinearity affecting the results of the regression analyses (Table 3). Two components summarised approximately 75% of the variance in the data (Table 4). The first component summarised respondents’ involvement, attitudes, intentions, and engagement with conserving biodiversity, while the second component summarised their subjective norms. The demographic characteristics of respondents were also included as explanatory variables in the regressions where pre-screening using χ2 analysis indicated a statistically significant relationship (p < 0.01).
Table 3.
Correlations between key variables.
Table 4.
Principal-component analysis.
The results of the multinomial logistic regression for picking up litter, using respondents who consistently reported they did not pick up litter as the reference group, are reported in Table 5. They indicate that positive social bias in reporting was associated with relatively high involvement in, strong engagement with, and more favourable attitudes about conserving biodiversity. Negative bias in reporting was also associated with relatively low involvement, weak engagement with, and less favourable attitudes towards conserving biodiversity, but strongly favourable subjective norms regarding the conservation of biodiversity. Respondents who consistently reported that they did pick up litter had relatively high involvement in, strong engagement with, and favourable attitudes towards conserving biodiversity. Similar results were obtained regarding the signing of online petitions about protecting the environment (Table 6).
Table 5.
Regression analysis for picking up litter.
Table 6.
Regression analysis for signing petitions.
With respect to attending hearings about the environment, the results indicate that consistent reporting was associated with higher involvement in, more favourable attitudes about, and stronger engagement with conserving biodiversity (Table 7). Respondents who consistently reported that they did not attend hearings, together with respondents with either positive or negative bias, had lower involvement in, less favourable attitudes about, and weaker engagement with conserving biodiversity than respondents who consistently reported that they did attend hearings. Again, negative bias in reporting was associated with stronger subjective norms regarding the conservation of biodiversity.
Table 7.
Regression analysis for participating in hearings and consent processes.
The results regarding participation in projects to improve the environment indicated that consistent reporting was associated with higher involvement in, more favourable attitudes about, and stronger engagement with conserving biodiversity compared to positive bias and negative bias in reporting, and consistent reporting of not participating in projects (Table 8). Bias was not associated with differences in subjective norms for this behaviour. The explanatory power of this regression was substantially weaker than the regressions for the other behaviours.
Table 8.
Regression analysis for participating in projects to improve the environment.
The results indicate that older respondents were more consistent in reporting that they had not picked up litter or signed petitions. Younger respondents were more likely to show negative bias with respect to picking up litter, signing petitions, and participating in hearings. Respondents with higher formal education qualifications were more likely to exhibit positive bias with respect to hearings and positive or negative bias with respect to participating in projects. European New Zealanders were more likely to show negative bias with picking up litter and attending hearings. Māori were more likely to show positive bias regarding signing petitions. Women overall were more likely to be consistent in their responses and less likely to show negative bias in particular. Residents of Auckland were more likely than other respondents to exhibit negative bias with respect to picking up litter, signing petitions, and attending hearings.
5. Discussion
A considerable proportion of respondents appeared to show negative social desirability bias regarding the conservation behaviours we investigated. This was a surprising result, as we used crosswise questioning because we expected respondents to display positive social desirability bias.
We found that the differences between direct and crosswise estimates of prevalence, and therefore the incidence of negative bias in reporting behaviours, was unlikely to be the result of random answering by respondents for several reasons. First, the proportion of random responses required to match the direct and crosswise estimates of prevalence varied considerably across the behaviours. Second, while the main reason for the differences in the prevalence estimates was because a substantial proportion of respondents showed negative bias for each behaviour, the overlap in respondents showing negative bias across the behaviours was small. Third, random responses tend to arise when there is a lack of interest in the survey topic [47]. We found that the proportion of random responses required to match the direct and crosswise estimates of prevalence was not systematically related to respondents’ interest in conserving biodiversity, as measured by their involvement and engagement with it (Table 1).
Fourth, we did find that respondents revealing negative bias had significantly lower involvement with and stronger subjective norms about conserving biodiversity than other respondents. This suggests that negative bias is less likely to be the product of random answering and more likely to be associated with the respondents’ subjective norms regarding the behaviours themselves. In other words, when directly questioned, respondents may have under-reported their conservation behaviour because they had unfavourable attitudes or subjective norms about the behaviour. Relatedly, we found that the differences between direct and crosswise estimates of prevalence and therefore the incidence of negative bias in reporting behaviours, could be explained by a relatively small proportion of respondents (Table 1) deliberately under-reporting conservation behaviours when answering direct questions.
Social desirability bias may arise because respondents fear material costs arising from revealing undesirable behaviour, because of concerns regarding their reputation, or because they wish to avoid discomfort by admitting to behaviours that conflict with their preferred self-image [47]. For example, respondents may under-report behaviours they later regret because they experience discomforting consequences because of their actions, such as phishing or spam following the signing of petitions [48,49]. Similarly, respondents may believe that others regard certain actions as undesirable, such as picking up other people’s litter [50], and so may under-report such behaviours when directly questioned. On the other hand, respondents may under-report behaviours that they believe others do regard as desirable simply because they do not wish to appear susceptible to their influence. These possibilities are considered below.
5.1. Picking up Litter
Respondents with positive bias in reporting picking up litter had higher involvement, stronger intentions and engagement, and more favourable attitudes with regard to conserving biodiversity compared to respondents who consistently reported they did not pick up litter. Positive bias might arise because respondents would like to pick up litter, but have not had an opportunity to do so or were discouraged by characteristics of the behavioural context; for example, being concerned that collecting litter might expose them to infection by diseases or parasites, that others might see them and believe that the respondent themselves had been littering, or the respondents did not have suitable means for storing and/or disposing of litter.
Respondents that consistently reported they did not pick up litter and respondents with negative bias had relatively low involvement, weak intentions and engagement, and less favourable attitudes with regard to conserving biodiversity. Respondents with negative bias had significantly stronger subjective norms on average compared to respondents who consistently reported that they did not sign petitions.
Respondents might display negative bias because they believe that others view picking up other people’s litter as undesirable [50], perhaps because they believe it might expose them to infection by diseases or parasites, and so do not disclose they have picked up litter when directly questioned. Alternatively, these respondents may have felt obliged to collect litter either because others had or they believed others would, but because they want to avoid admitting they are susceptible to social pressure, claim that they do not collect litter when directly questioned. This is consistent with subjective norms being an influential factor in low-involvement decisions about participating in low-effort activities.
5.2. Signing Petitions
Respondents with positive bias in reporting signing petitions had higher involvement, stronger intentions and engagement, and more favourable attitudes (but similar subjective norms) with regard to conserving biodiversity compared to respondents who consistently reported they did not. Again, positive bias might arise because respondents have not had an opportunity to engage in the behaviour or were discouraged by the characteristics of the signing context; for example, being concerned that by signing and revealing their email address, they might be exposed to spam, phishing, or repeated unwanted requests to sign petitions or make donations [48,49].
Respondents that were consistent in reporting that they did not sign petitions and respondents with negative bias had relatively low involvement, weak intentions and engagement, and less favourable attitudes in terms of conserving biodiversity. Respondents with negative bias had significantly stronger subjective norms on average compared to respondents who consistently reported they did not sign petitions. Respondents might display negative bias because they either regret having signed petitions (perhaps because they have experienced spam, phishing, or repeated unwanted requests to sign petitions or make donations) or because they believe that others view signing online petitions as an undesirable behaviour, and so do not wish to disclose they have signed petitions when directly questioned. Alternatively, some of these respondents may have signed a petition because they believed that relevant others would do so, but because they want to avoid appearing susceptible to social pressure, claim not to have signed when directly questioned. Again, this is consistent with subjective norms being an influential factor in low-involvement decisions regarding low-effort activities.
5.3. Taking Part in Hearings and Consent Processes
Respondents who consistently reported not attending, and respondents with either negative or positive bias in reporting attending, had low involvement and engagement in and less favourable attitudes towards conserving biodiversity compared to respondents who consistently reported attending hearings.
Respondents with negative bias had significantly stronger subjective norms about attending hearings on average compared to respondents who consistently reported that they did not attend hearings. Respondents might display negative bias because they wish to avoid appearing as committed advocates or activists. There is also the possibility that respondents might not claim to take part because their participation was prompted by other, personally critical concerns that impelled them to oppose environmental considerations in the hearings, or they would be discomforted if their contribution (in the form of online comments) were to become public.
Alternatively, respondents might display negative bias because their participation was largely passive. For example, some respondents may interpret commenting on hearings and consent processes through social media as ‘taking part’. This means that ‘taking part’ can be low-effort as well as high-effort, which helps explain the relatively high estimated prevalence for this behaviour. It is also consistent with subjective norms being significantly associated with negative bias for this behaviour.
5.4. Participating in Projects to Improve the Environment
Respondents who consistently reported not participating in projects and respondents with either negative or positive bias in reporting participation had low involvement and engagement in, and less favourable attitudes towards, conserving biodiversity compared to respondents who consistently reported participating. Differences in subjective norms were not associated with either positive or negative bias. This is consistent with subjective norms not being an influential factor in decisions regarding high-effort activities.
We reasoned that positive bias might arise among respondents who wished to take part in projects, but have not, partly because they have not had an opportunity to do so and partly because they were not sufficiently motivated to do so. We speculated that respondents might display negative bias because they believe that their projects were too informal and small-scale (e.g., planting native plants in the garden) to justify claiming that they were contributing to improving the natural environment when directly questioned.
5.5. Hypothesis Tests
Given that the differences in the direct and crosswise estimates of the prevalence of conservation behaviours were unlikely to be the result of random answering by respondents and that there may be sound reasons for negative bias in respondents’ reporting of conservation behaviours, we can now consider the results with respect to the hypotheses.
The first hypothesis, that social desirability bias regarding the conservation of biodiversity would be inversely associated with involvement with the conservation of biodiversity, was supported with respect to negative bias, but not with respect to positive bias. Respondents who showed negative bias regarding picking up litter, signing online petitions in support of the environment, or participating in environmental projects generally had lower involvement with conserving biodiversity than respondents who consistently reported they engaged in these behaviours (Table 5 and Table A11, Table 6 and Table A12, Table 8 and Table A14 respectively). However, respondents who showed positive bias regarding picking up litter and signing online petitions in support of the environment generally had similar levels of involvement with conserving biodiversity as respondents who consistently reported they engaged in these behaviours.
In short, negative social desirability bias was associated with relatively low involvement while positive social desirability bias was associated with relatively high involvement and engagement with conserving biodiversity. Hence, the second hypothesis, that social desirability bias for low-effort behaviours would be associated with lower levels of involvement and engagement with conserving biodiversity, was only supported for respondents with negative social desirability bias (Table 5 and Table A7, Table 6 and Table A8). One possible explanation for negative bias is that these respondents wish to avoid appearing susceptible to social pressure to engage in behaviours about which they are ambivalent.
The hypothesis that social desirability bias for low-effort behaviours would be associated with lower levels of involvement and engagement with conserving biodiversity was not supported for respondents with positive social desirability bias. One possible explanation for positive bias is that these respondents believe that they would perform these behaviours if they had an opportunity to do so. Their claim to perform these behaviours when directly questioned may reflect a desire to demonstrate alignment with their preferred self-image.
The results supported the third hypothesis that social desirability bias would be associated with subjective norms for low-effort behaviours; that is, picking up litter and signing petitions (Table 5 and Table 6). Respondents in the negative-bias group for these behaviours had, on average, significantly stronger subjective norms regarding the intentions of others to conserve biodiversity than respondents in the other groups. As noted above, some respondents may choose not to report these behaviours when directly questioned because they wish to avoid appearing susceptible to social pressure. Alternatively, they may choose not to report these behaviours when directly questioned because they hold unfavourable attitudes and subjective norms with respect to these specific behaviours.
Negative bias in reporting attending hearings was also associated with stronger subjective norms for conserving biodiversity among respondents with low involvement and weak engagement in conserving biodiversity. This may be because some respondents may have interpreted commenting on hearings and consent processes through social media as ‘taking part’. This means that ‘taking part’ in hearings was not, as we originally supposed, exclusively a high-effort behaviour.
The fourth hypothesis, that social desirability bias would not be associated with subjective norms for high-effort behaviours, was supported for participating in projects (Table 8). Subjective norms were not associated with positive or negative bias in reporting participation in projects.
5.6. Implications for Crosswise Questioning
Our results are generally consistent with the proposition that the more involved participants are in the subject of surveys, the more likely it is that they will be to engage in extensive decision-making and the more likely their responses will reflect strong, stable attitudes towards the subject. Conversely, the less involved they are, the less likely they will be to engage in extensive decision-making and so the more likely their answers will reflect the use of simple heuristics such as subjective norms or be the product of random chance.
This means that the findings of surveys will be increasingly unreliable the less involved participants are with the subjects of surveys. This applies to the estimates of the prevalence of behaviours using direct questioning or crosswise questioning and perhaps even more so to valuation estimates obtained using more cognitively demanding methods such as choice modelling and contingent valuation.
Our results with respect to the presence of positive and negative social desirability bias for both low- and high-effort behaviours have important implications for interpreting the outcomes of crosswise questioning. We found that for apparently desirable behaviours, the proportion of respondents displaying negative social desirability bias was substantially and consistently greater than the proportion of respondents displaying positive social desirability bias. This meant that the estimated prevalence of these desirable behaviours was greater using crosswise questioning than the estimated prevalence of these desirable behaviours using direct questioning. We also found that the presence of social desirability bias was associated with subjective norms for low-effort behaviour and with differences in involvement for high-effort behaviours. This suggests that having information on the involvement, attitudes, and subjective norms of participants with respect to the subjects in surveys is crucial to understanding the reasons for the presence of social desirability bias and for validating estimates of the prevalence of behaviours. With respect to the latter, modifications to crosswise questioning, such as those by Meisters et al. [7], can deal with validity issues of crosswise questioning, but cannot cope with the implications of variations in cognitive effort applied to preference formation because of variations in involvement.
5.7. Qualifications and Further Research
An important qualification regarding our findings is that they are based on identifying associations between specific reported behaviours and respondents’ involvement, engagement, attitudes, subjective norms, and intentions regarding the general goal of ‘conserving biodiversity’. Our findings would be more robust and insightful if they were based on associations between these respondents’ involvement, attitudes, and subjective norms regarding the specific behaviours themselves.
Another qualification is that our findings are based on an analysis of apparently desirable behaviours. Our findings would be more robust if corresponding results were obtained with respect to complementary undesirable behaviours (e.g., [39]).
Unlike many studies using crosswise questioning, we investigated behaviours that are not almost universally accepted as desirable. This created the opportunity for negative-desirability bias to emerge. Confidence in the generalisability of our findings would be increased if similar results were obtained in studies of other behaviours and in other cultures.
Also, unlike many studies using crosswise questioning, we used respondents’ birth months as the non-sensitive attribute instead of that of a close family member, because this would hopefully allow us to accurately identify social desirability bias (positive or negative) as we had information on the birth month of respondents. Confidence in our findings would be increased if similar results were obtained in studies using alternative framings for the non-sensitive attribute, as there is some evidence that the framing of the question about the non-sensitive attribute can influence responses and therefore estimates of social desirability bias [41].
6. Conclusions
We found considerable differences in estimates from direct and crosswise questioning of the prevalence among the New Zealand public of four conservation behaviours. We also found evidence that a considerable proportion of the public appeared to show negative social desirability bias regarding the conservation behaviours we investigated. We found that the differences between direct and crosswise estimates of prevalence, and therefore the incidence of negative bias in reporting behaviours, was unlikely to be the result of random answering by respondents. Instead, we found systematic associations between self-reported behaviour, involvement, and social desirability bias that were largely consistent with our hypotheses. This suggests that there were plausible psychological reasons for respondents to show negative social desirability bias with respect to conservation behaviours, and so under-report them when questioned directly.
This draws attention to the importance of having information on the involvement, attitudes, and subjective norms of participants with respect to the subjects of surveys to understand the reasons for and validate differences between estimates of the prevalence of behaviours based on direct and crosswise questioning. It also suggests that having information on the involvement, attitudes, and subjective norms of participants with respect to the subjects of surveys generally is vital for validating estimates of behaviour and for identifying the reasons for differences in behaviour.
Overall, the results indicate involvement, as measured, is a meaningful indicator of the allocation of limited cognitive capacity, including attention. When it is high, intentions tend to be more strongly indicative of behaviour. When it is low, due to the need to rationalise behaviour in the context of weak intentions, subjective norms more strongly influence behaviour. To ignore respondents’ involvement with the subjects of surveys is to risk treating answers that arise from unavoidably different decision-making processes as having the same validity when it comes to predicting behaviour. Involvement is an intervening variable between real choices and intentions related to them.
Author Contributions
Conceptualisation, V.W. and G.K.; methodology, V.W. and G.K.; formal analysis, V.W. and G.K.; data curation, G.K.; writing—original draft preparation, V.W. and G.K.; writing—review and editing, V.W. and G.K.; funding acquisition, G.K. All authors have read and agreed to the published version of the manuscript.
Funding
This research was funded by the New Zealand Ministry for Business, Innovation and Employment (Grant C09X2103).
Institutional Review Board Statement
The study was conducted in accordance with the Declaration of Helsinki and approved by the Ethics Committee of Manaaki Whenua—Landcare Research (protocol code 2122/11, approved 14 February 2022).
Informed Consent Statement
Participants were members of a commercial online consumer panel and received a small reward for completing surveys. Participants had access to an information sheet about the research. Informed consent was obtained from all subjects involved in the study.
Data Availability Statement
The dataset analysed in this study is available at https://osf.io/7nmcx/files/t2er7 (accessed 10 February 2026).
Acknowledgments
We would sincerely like to thank the members of the public throughout New Zealand who completed our survey. Thanks also to our referees for their time, patience, and constructive advice. And thanks to Natalie for suggestions on interpreting responses to participating in hearings.
Conflicts of Interest
The authors declare no conflicts of interest. The funders had no role in the design of the study; in the collection, analyses, or interpretation of data; in the writing of the manuscript; or in the decision to publish the results.
Appendix A
Table A1.
Scale for measuring involvement with conserving biodiversity.
Table A2.
Scale for measuring cognitive engagement with conserving biodiversity.
Table A3.
Scale for measuring affective engagement with conserving biodiversity.
Table A4.
Scale for measuring behaviour to conserve biodiversity.
Table A5.
Scale for measuring attitude and intentions to conserve biodiversity.
Table A6.
Scale for measuring subjective norms about attitude and intentions to conserve biodiversity.
Appendix B
The proportion of respondents that would have to deliberately or inadvertently answer a crosswise question incorrectly after answering the corresponding direct question affirmatively was estimated for each conservation action as follows.
For litter, petitions and hearings:
As the magnitude of negative bias was greater than the probability of a respondent having a birthday in January (October), we assumed that the birth month of participants in the negative-bias group was not January (October). Negative bias results when these respondents answered the direct question in the negative and then inadvertently or deliberately chose Box B when answering the crosswise question, thereby implicitly indicating that they had engaged in the activity.
Let Pr(A) be the probability that the same answer apples to both statements, p the known probability that the answer to the non-sensitive statement is affirmative, π the estimated probability that the answer to the sensitive statement is affirmative, and R the proportion of respondents whose birthday is not in January (October) and who incorrectly choose Box B. Then, the probability of Box A being selected is:
Let Z denote ((1 − π) · (1 − p) + π · p)) and setting π to the direct question prevalence, then:
For projects:
Pr(A) = λ = (1 − R) · ((1 − π) · (1 − p) + π · p)) − R · ((1 − π) · (1 − p))
R = (Z − λ)/(Z + ((1 − π) · (1 − p)))
As the magnitude of negative bias was greater than the probability of a respondent having a birthday in January or February, we assumed that the birth month of participants in the negative-bias group was sometime in March to December. Negative bias results when these respondents answered the direct question in the negative and then inadvertently or deliberately chose Box A when answering the crosswise question, thereby implicitly indicating that they had engaged in the activity.
The probability of Box A being selected then becomes:
Let Z denote ((1 − π) · (1 − p) + π · p)) and setting π to the direct question prevalence then:
where Pr(A) is the probability that the same answer applies to both statements, p is the known probability that the answer to the non-sensitive statement is affirmative, and π is the estimated probability that the answer to the sensitive statement is affirmative.
Pr(A) = λ = (1 − R) · ((1 − π) · (1 − p) + π · p)) + R · ((1 − π) · p)
R = (Z − λ)/(Z − (1 − π) · p)
Appendix C
Table A7.
Age distribution of community respondents.
Table A8.
Distribution of community respondents by highest educational qualification.
Table A9.
Income distribution of community respondents.
Table A10.
Ethnicity and gender distribution of respondents.
Table A11.
Group means on key variables for picking up litter.
Table A12.
Group means on key variables for signing petitions.
Table A13.
Group means on key variables for hearings and consents.
Table A14.
Group means on key variables for participating in projects to improve the environment.
References
- Lopez-Becerra, E.I.; Alcon, F. Social desirability bias in the environmental economic valuation: An inferred valuation approach. Ecol. Econ. 2021, 184, 106988. [Google Scholar] [CrossRef] [Scilit]
- Morrison, M.; Brown, T.C. Testing the effectiveness of certainty scales, cheap talk, and dissonance-minimization in reducing hypothetical bias in contingent valuation studies. Environ. Resour. Econ. 2009, 44, 307–326. [Google Scholar] [CrossRef] [Scilit]
- Loomis, J.B. WAEA keynote address: Strategies for overcoming hypothetical bias in stated preference surveys. J. Agric. Resour. Econ. 2013, 1, 34–46. [Google Scholar]
- Johnston, R.J.; Boyle, K.J.; Adamowicz, W.; Bennett, J.; Brouwer, R.; Cameron, T.A.; Hanemann, W.M.; Hanley, N.; Ryan, M.; Scarpa, R.; et al. Contemporary guidance for stated preference studies. J. Assoc. Environ. Resour. Econ. 2017, 4, 319–405. [Google Scholar] [CrossRef] [Scilit]
- Milfont, T.L. The effects of social desirability on self-reported environmental attitudes and ecological behaviour. Environ. 2009, 29, 263–269. [Google Scholar] [CrossRef] [Scilit]
- Ibbett, H.; Jones, J.P.; John, F.A. Asking sensitive questions in conservation using Randomised Response Techniques. Biol. Conserv. 2021, 260, 109191. [Google Scholar] [CrossRef] [Scilit]
- Meisters, J.; Hoffmann, A.; Musch, J. Controlling social desirability bias: An experimental investigation of the extended crosswise model. PLoS ONE 2020, 15, 0243384. [Google Scholar] [CrossRef] [Scilit]
- Hoffmann, A.; Musch, J. Assessing the validity of two indirect questioning techniques: A Stochastic Lie Detector versus the Crosswise Model. Behav. Res. Methods 2016, 48, 1032–1046. [Google Scholar] [CrossRef] [Scilit]
- Johann, D.; Thomas, K. Testing the Validity of the Crosswise Model: A Study on Attitudes Towards Muslims Survey Methods: Insights from the Field. 2017. Available online: https://surveyinsights.org/?p=8887 (accessed on 31 October 2024).
- Walzenbach, S.; Hinz, T. Pouring Water into Wine: Revisiting the Advantages of the Crosswise Model for Asking Sensitive Questions. Survey Methods: Insights from the Field [Internet]. 2019. Available online: https://surveyinsights.org/?p=10323 (accessed on 29 September 2026).
- Höglinger, M.; Diekmann, A. Uncovering a blind spot in sensitive question research: False positives undermine the crosswise-model RRT. Political Anal. 2017, 25, 131–137. [Google Scholar] [CrossRef] [Scilit]
- Korndorfer, M.; Krumpal, I.; Schmukle, S.C. Measuring and explaining tax evasion: Improving self-reports using the crosswise model. J. Econ. Psychol. 2014, 45, 18–32. [Google Scholar] [CrossRef] [Scilit]
- Ibbett, H.; Dorward, L.; Dwiyahreni, A.A.; Jones, J.P.G.; Kaduma, J.; Kohi, E.M.; Mchomvu, J.; Prayitno, K.; Sabiladiyni, H.; Sankeni, S.; et al. Experimental validation of specialized questioning techniques in conservation. Conserv. Biol. 2022, 36, e13908. [Google Scholar] [CrossRef] [Scilit]
- Erasmus, A.C.; Boshoff, E.; Rousseau, G.G. Consumer decision-making models within the discipline of consumer science: A critical approach. J. Consum. Sci. 2001, 29, 82–90. [Google Scholar]
- Stankevich, A. Explaining the consumer decision-making process: Critical literature review. J. Int. Bus. Res. Mark. 2017, 2, 7–14. [Google Scholar] [CrossRef] [Scilit]
- Petty, R.E.; Cacioppo, J.T. The elaboration likelihood model of persuasion. Adv. Exp. Soc. Psychol. 1986, 19, 123–205. [Google Scholar] [CrossRef] [Scilit]
- Priluck, R.; Till, B.D. The role of contingency awareness, involvement and need for cognition in attitude formation. J. Acad. Mark. Sci. 2004, 32, 329–344. [Google Scholar] [CrossRef] [Scilit]
- Cooke, R.; Sheeran, P. Moderation of cognition-intention and cognition-behaviour relations: A meta-analysis of properties of variables from the theory of planned behaviour. Br. J. Soc. Psychol. 2004, 43, 159–186. [Google Scholar] [CrossRef] [Scilit]
- Miller, J.M.; Peterson, D.A. Theoretical and empirical implications of attitude strength. J. Politics 2004, 66, 847–867. [Google Scholar] [CrossRef] [Scilit]
- Soane, E.; Truss, C.; Alfes, K.; Shantz, A.; Rees, C.; Gatenby, M. Development and application of a new measure of employee engagement: The ISA Engagement Scale. Hum. Resour. Dev. Int. 2012, 15, 529–547. [Google Scholar] [CrossRef] [Scilit]
- Kahn, W.A. Psychological conditions of personal engagement and disengagement at work. Acad. Manag. J. 1990, 33, 692–724. [Google Scholar] [CrossRef] [Scilit]
- Bailey, C.; Madden, A.; Alfes, K.; Fletcher, L. The meaning, antecedents and outcomes of employee engagement: A narrative synthesis. Int. J. Manag. Rev. 2017, 19, 31–53. [Google Scholar] [CrossRef] [Scilit]
- Stern, P.C. New environmental theories: Toward a coherent theory of environmentally significant behavior. J. Soc. Issues 2000, 56, 407–424. [Google Scholar] [CrossRef] [Scilit]
- Ajzen, I. Nature and operation of attitudes. Annu. Rev. Psychol. 2001, 52, 27–58. [Google Scholar] [CrossRef] [Scilit]
- Kaiser, F.G.; Fuhrer, U. Ecological behavior’s dependency on different forms of knowledge. Appl. Psychol. 2003, 52, 598–613. [Google Scholar] [CrossRef] [Scilit]
- Klöckner, C.A. A comprehensive model of the psychology of environmental behaviour—A meta-analysis. Glob. Environ. Change 2013, 23, 1028–1038. [Google Scholar] [CrossRef] [Scilit]
- Fielding, K.S.; Prober, S.M.; Williams, K.J.; Dean, A.J. Developing an indicator of community appreciation of biodiversity. Environ. Sustain. Indic. 2023, 19, 100278. [Google Scholar] [CrossRef] [Scilit]
- Gurung, B.; Thapa, A. Exploring the Impact of Community Engagement, Including Mental Health, on the Efficacy of Environ-mental Education and Biodiversity Conservation: A Systematic Literature Review. J. Empir. Soc. Sci. Stud. 2023, 7, 16–50. [Google Scholar]
- Nielsen, K.S.; Marteau, T.M.; Bauer, J.M.; Bradbury, R.B.; Broad, S.; Burgess, G.; Burgman, M.; Byerly, H.; Clayton, S.; Espelosin, D.; et al. Biodiversity conservation as a promising frontier for behavioural science. Nat. Hum. Behav. 2021, 5, 550–556. [Google Scholar] [CrossRef] [Scilit]
- Steinhardt, F.; Dolva, A.S.; Jahnsen, R.; Ullenhag, A. Exploring two subdimensions of participation, involvement and engagement: A scoping review. Scand. J. Occup. Ther. 2022, 29, 441–463. [Google Scholar] [CrossRef] [Scilit]
- Broderick, A.J. A cross-national study of the individual and national–cultural nomological network of consumer involvement. Psychol. Mark. 2007, 24, 343–374. [Google Scholar] [CrossRef] [Scilit]
- Hollebeek, L.D.; Glynn, M.S.; Brodie, R.J. Consumer brand engagement in social media: Conceptualization, scale development and validation. J. Interact. Mark. 2014, 28, 149–165. [Google Scholar] [CrossRef] [Scilit]
- Dessart, L. Social media engagement: A model of antecedents and relational outcomes. J. Mark. Manag. 2017, 33, 375–399. [Google Scholar] [CrossRef] [Scilit]
- Leong, M.K.; Osman, S.; Laily, P.; Sabri, M.F. Enhancing consumer online engagement through consumer involvement: A case of airline and hospitality services in Malaysia. Manag. Sci. Lett. 2019, 9, 795–808. [Google Scholar] [CrossRef] [Scilit]
- Chin, J.X.; Cheng, B.L.; Chalke, A.; Idris, I. Brand engagement in self-concept for influencer marketing: The role of product involvement as a moderator. E-Acad. J. 2023, 12, 90–104. [Google Scholar] [CrossRef] [Scilit]
- Ajzen, I. The theory of planned behavior. Organ. Behav. Hum. Decis. Processes 1991, 50, 179–211. [Google Scholar] [CrossRef] [Scilit]
- Walzenbach, S.; Hinz, T. Puzzling Answers to Crosswise Questions: Examining Overall Prevalence Rates, Response Order Effects, and Learning Effects. Surv. Res. Methods 2023, 17, 1–13. [Google Scholar]
- Kaine, G.; Wright, V. Motivation and Personal Engagement with Biodiversity. Conservation 2026, 6, 25. [Google Scholar] [CrossRef] [Scilit]
- Kaine, G.; Wright, V. Social desirability bias and the prevalence of self-reported conservation behaviour among farmers. Sustainability 2025, 16, 9658. [Google Scholar] [CrossRef] [Scilit]
- Fielding, K.S.; Prober, S.; Dean, A.J. Community Appreciation of Biodiversity: Developing Enhanced Measures; New South Wales Government Department of Planning, Industry and Environment: Sydney, Australia, 2021. [Google Scholar]
- Laurent, G.; Kapferer, J.N. Measuring consumer involvement profiles. J. Mark. Res. 1985, 22, 41–53. [Google Scholar] [CrossRef] [Scilit]
- Heck, D.W.; Hoffmann, A.; Moshagen, M. Detecting nonadherence without loss in efficiency: A simple extension of the crosswise model. Behav. Res. Methods 2018, 50, 1895–1905. [Google Scholar] [CrossRef] [Scilit]
- Department of Conservation Te Papa Atawhai. Conservation General Policy, 2019. Available online: https://www.doc.govt.nz/about-us/our-policies-and-plans/conservation-general-policy/ (accessed on 29 September 2026).
- Department of Conservation Te Papa Atawhai. General Policy for National Parks, 2019. Available online: https://www.doc.govt.nz/about-us/our-policies-and-plans/statutory-plans/statutory-plan-publications/national-park-management/general-policy-for-national-parks/ (accessed on 29 September 2026).
- Yu, J.W.; Tian, G.L.; Tang, M.L. Two new models for survey sampling with sensitive characteristic: Design and analysis. Metrika 2008, 67, 251–263. [Google Scholar] [CrossRef] [Scilit]
- IBM SPSS Statistics for Windows, Version 31.0; IBM Corporation: Armonk, NY, USA, 2023.
- Wolter, F.; Diekmann, A. False positives and the “more-is-better” assumption in sensitive question research: New evidence on the crosswise model and the item count technique. Public Opin. Q. 2021, 85, 836–863. [Google Scholar]
- Belen-Saglam, R.; Nurse, J.R.C.; Hodges, D. An Investigation Into the Sensitivity of Personal Information and Implications for Disclosure: A Uintorspective. Front. Comput. Sci. 2022, 4, 908245. [Google Scholar] [CrossRef] [Scilit]
- Kibby, M.D. Email forwardables: Folklore in the age of the internet. New Media Soc. 2005, 7, 770–790. [Google Scholar] [CrossRef] [Scilit]
- Brown, T.J.; Ham, S.H.; Hughes, M. Picking up litter: An application of theory-based communication to influence tourist behaviour in protected areas. J. Sustain. Tour. 2010, 18, 879–900. [Google Scholar] [CrossRef] [Scilit]

Disclaimer/Publisher’s Note: The statements, opinions and data contained in all publications are solely those of the individual author(s) and contributor(s) and not of MDPI and/or the editor(s). MDPI and/or the editor(s) disclaim responsibility for any injury to people or property resulting from any ideas, methods, instructions or products referred to in the content. |
© 2026 by the authors. Licensee MDPI, Basel, Switzerland. This article is an open access article distributed under the terms and conditions of the Creative Commons Attribution (CC BY) license.