


Abstract
Monitoring large elasmobranchs can employ standardized photo-identification protocols to manage diverse and progressively expanding photographic datasets. This study examines the interpretation of performance metrics generated by a dorsal fin–based photo-identification protocol implemented using the semi-automated IDENTIFIN software. The protocol was applied to dorsal fin photographs of bronze whaler shark collected along the South African coast between 2024 and 2025, facilitating the creation of a structured, individual-specific database. Archival photographic data of white shark (2012–2019) served as a methodological reference, providing context for software outputs under different dataset conditions. Analyses focused on the behavior of similarity scores associated with validated matches and on their relationship with image ranking position, a common metric for assessing software performance. Results indicate that similarity scores exhibit comparable distributions across species-specific datasets, supporting their potential use as an operationally complementary metric for interpreting IDENTIFIN outputs. While operator-based visual validation remains essential, this study provides preliminary methodological insights into the interpretation of similarity scores as supportive information within the individual identification process.
1. Introduction
The need for reliable individual-level ecological data to improve elasmobranch conservation requires the development and standardization of non-invasive and accessible methodologies. Among these, photo-identification has emerged as a valuable tool for supporting effective management and conservation strategies applicable over the long term [1,2,3]. In recent years, the use of photographic data has expanded considerably as a method for studying marine population dynamics, facilitating data collection in challenging environments and providing key information for the management and conservation of wild species [4,5,6,7,8,9,10].
In this context, photo-identification (Photo-ID) has emerged as an effective approach [2,10,11,12,13,14,15], thanks to its non-invasive nature, low costs, and capacity to generate long-term datasets [7,16,17], while also reducing the methodological, logistical, and ethical issues associated with traditional tagging techniques [18,19]. Nonetheless, the growing complexity of Photo-ID protocols and associated software has initially resulted in highly species-specific development, focused on analyzing distinctive morphological features for each species [10,13,14,15], and therefore not generalizable to other taxa. For elasmobranchs, and sharks in particular, obtaining individual-specific data remains a considerable challenge [20], despite the crucial role of these apex predators in maintaining the structure and stability of marine ecosystems [21]. Predator–prey interactions exerted by sharks contribute to mitigating trophic cascades and enhance the resilience of marine ecosystems [21,22,23,24], underscoring the importance of reliable data for their effective management and conservation.
Applying Photo-ID to large epipelagic fishes entails specific operational and methodological challenges. These are related both to high interspecific diversity and to the presence of variable body patterns, which in some cases are less evident than in other taxa [25,26,27,28]. These challenges are further amplified by the considerable workload associated with the manual processing of large photographic archives, a task that becomes increasingly time-consuming and error-prone as databases grow [8,11,29]. In this context, IDENTIFIN has been developed as a semi-automated comparison system for the white shark (Carcharodon carcharias; Linnaeus 1758), based on the analysis of the posterior profile of the dorsal fin [25,26,30]. The selection of the dorsal fin as a discriminating feature is supported by evidence of its long-term morphological stability [16,27]. Based on the effectiveness observed for the white shark [25,26], we hypothesize that the IDENTIFIN-based photo-identification protocol can be successfully applied to the bronze whaler shark (Carcharhinus brachyurus; Günther 1870), producing comparable methodological performance despite interspecific differences in dorsal fin morphology. In this context, the white shark is used exclusively as a methodological reference. This hypothesis is explored by evaluating the behavior of internal performance metrics generated by the software, rather than by direct biological or demographic comparisons. The introduction of semi-automated comparison systems has represented a significant methodological advancement for monitoring elasmobranchs, enabling a reduction in the time required to process photographic data and facilitating individual recognition in increasingly large databases [25,26,31,32,33,34]. Recent studies have thoroughly evaluated the performance of the IDENTIFIN software through comparisons with other dorsal fin–based photo-identification protocols [25].
In particular, Maroen et al. [25] demonstrated that the semi-automated system significantly reduces identification time while maintaining high matching accuracy. In that study, the software performance was primarily assessed using the ranking position metric, defined as the position of the correct match within the list of images ordered by similarity, and here interpreted as an indicator of the manual inspection effort required by the operator [25]. Despite these findings, the interpretation of the metrics generated by the software remains only partially explored, particularly with respect to the behavior of similarity scores associated with validated matches. These values represent the internal metric used to rank the images analyzed by the algorithm, but they have not yet been explicitly examined as an informative variable in evaluating the performance of the protocol independently from their effect on the ranking position of candidate matches. We therefore hypothesize that analyzing similarity scores can provide operationally complementary and non-overlapping insights compared to ranking-based metrics, thereby contributing to a more comprehensive understanding of the comparison system, particularly in relation to varying dorsal fin morphologies and datasets collected under different operational conditions. Accordingly, we further propose that the joint interpretation of similarity scores and ranking position may increase operator confidence during match validation and potentially reduce manual inspection effort; however, this operational implication is not directly quantified in the present study and is discussed as a prospect for future investigation.
Finally, we hypothesize that similarity score distributions associated with validated matches do not differ significantly between the bronze whaler shark and the white shark datasets, supporting the use of this metric as a methodological performance indicator across species, without implying biological equivalence or interspecific comparability.
Both epipelagic sharks exhibit large and well-defined dorsal fins, characterized by distinctive morphological features (notches) that are informative for individual identification [16,28]. The bronze whaler shark was selected due to its large body size, conservation relevance, and ecological role, which is comparable to that of the white shark as an apex predator in marine trophic webs. Additionally, both species are currently classified as Vulnerable (VU) according to IUCN criteria [35,36,37,38,39]. In particular, the analysis focused on the behavior of similarity scores associated with validated matches, with the aim of assessing the informational value of this metric as functionally distinct from ranking position, which reflects the position of matches within the candidate list. The study adopts a strictly methodological framework and is not intended to address biological or demographic comparisons between species, but rather to evaluate the reliability of the protocol and its internal similarity metric in real-world application contexts.
2. Materials and Methods
2.1. Sampling Area
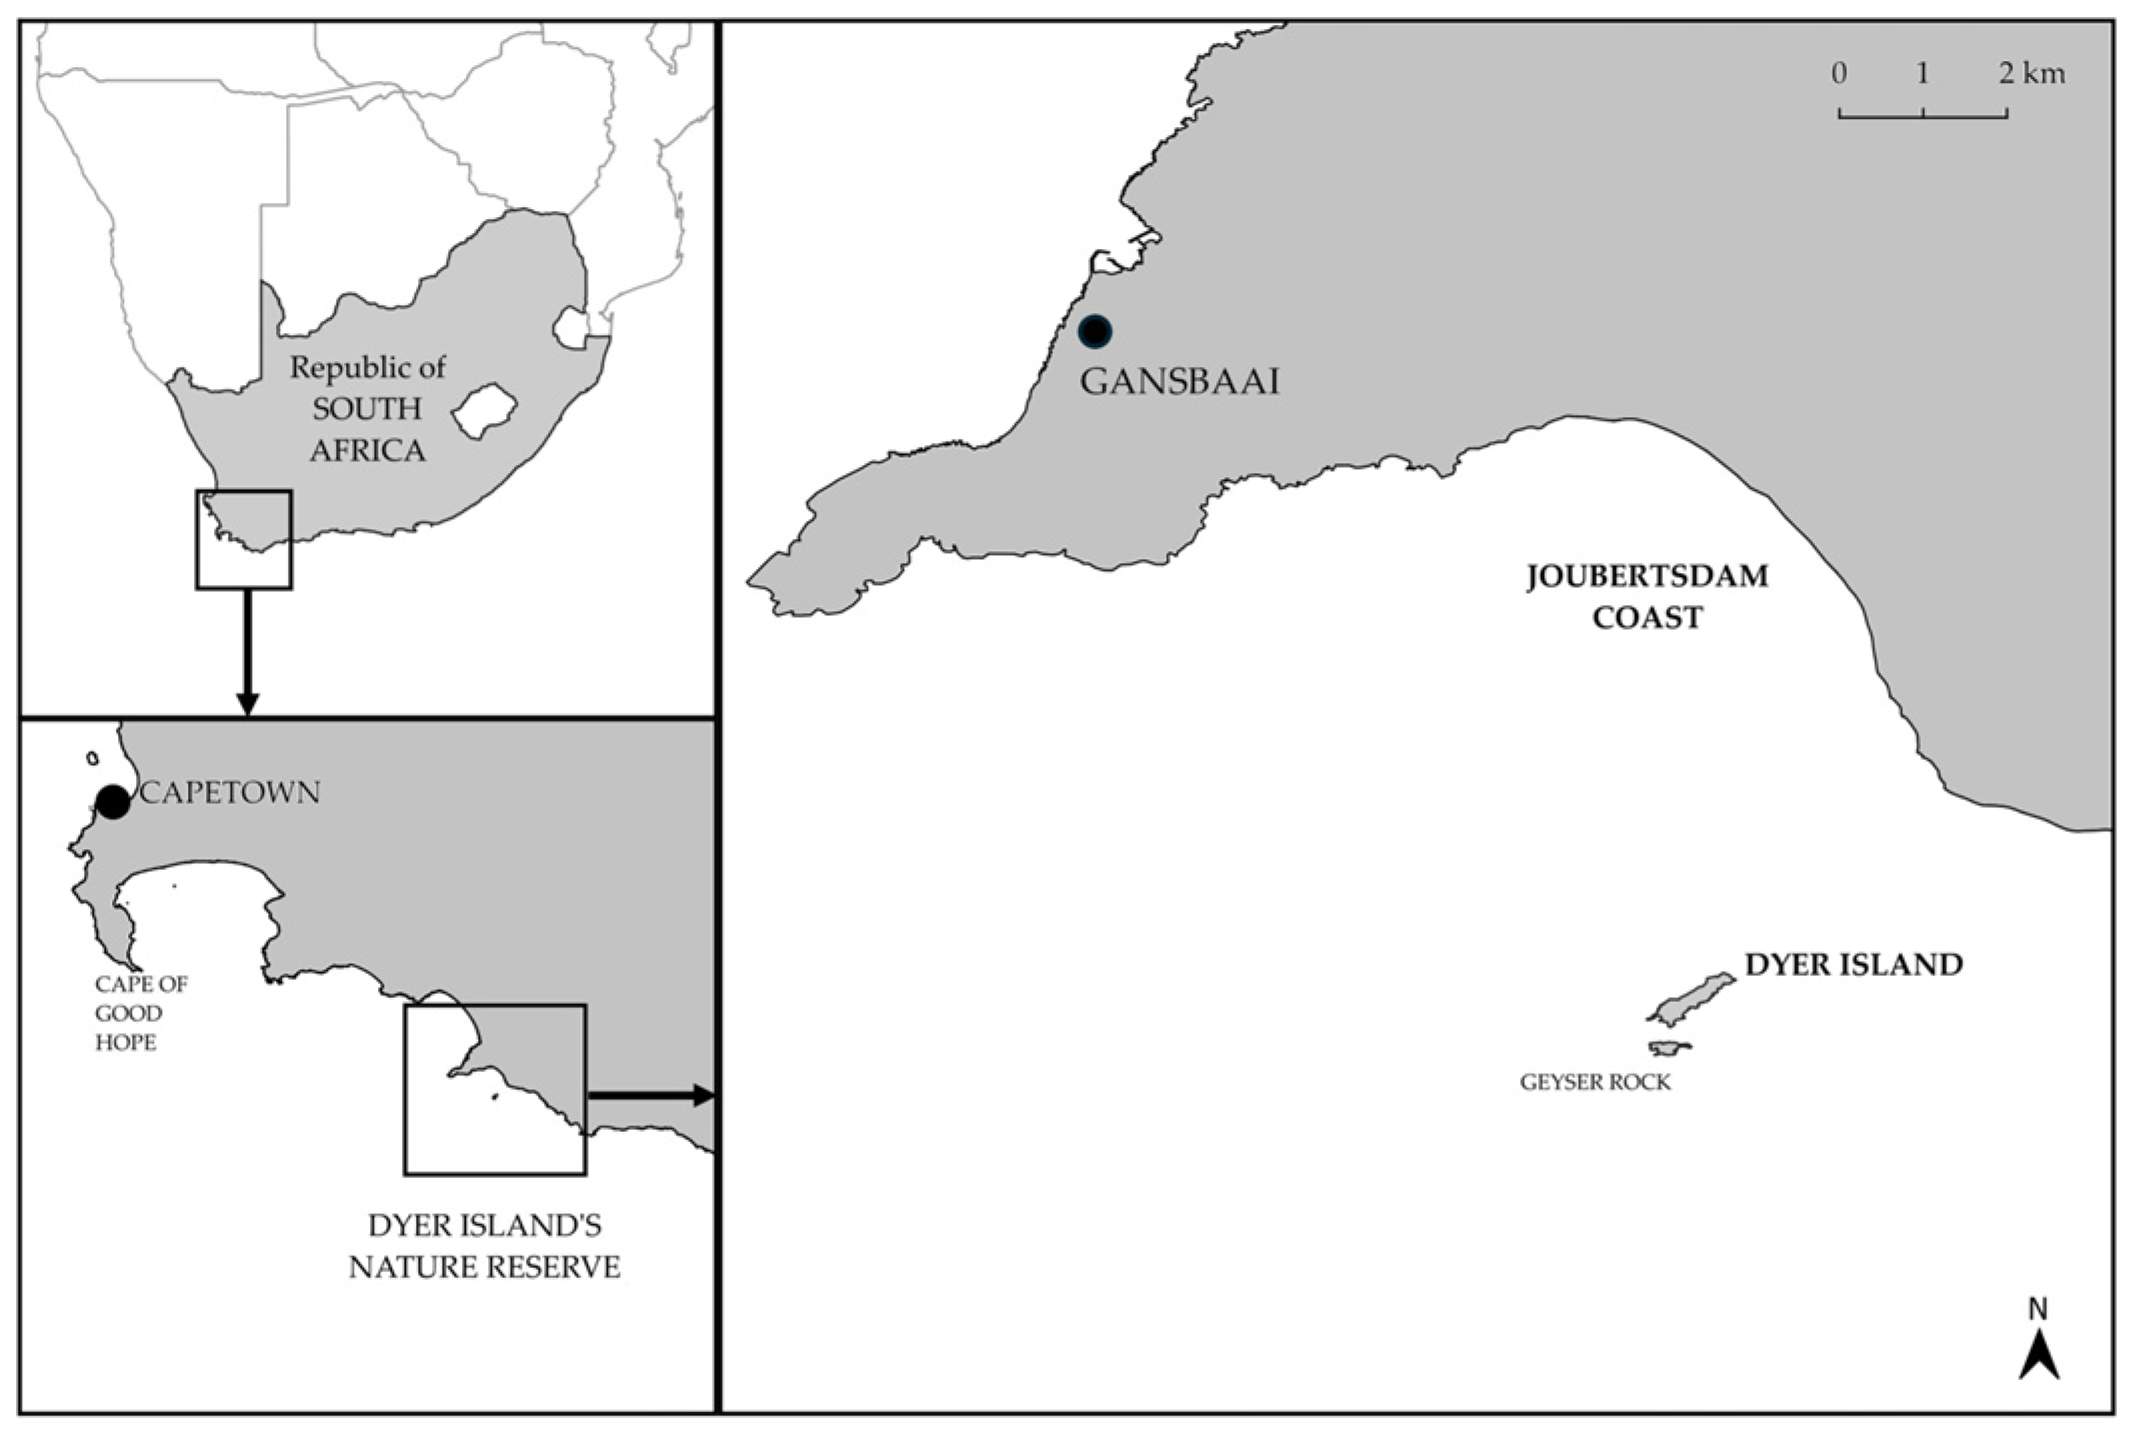
Observations and photographic data collection of the posterior profile of the dorsal fin were conducted by the Centro Studi Squali (CSS) (Sharks Studies Centre—Scientific Institute of Massa Marittima, GR, Italy) with operational support from Marine Dynamics (Gansbaai, South Africa). Marine Dynamics is one of eight cage diving operators licensed to carry out this activity, which also includes chumming to observe sharks up close. Image acquisition for the Photo-ID protocol was specifically performed in the vicinity of Gansbaai (34°41′ S; 19°24′ E), approximately 175 km southeast of Cape Town, at the coastal sites of Joubertsdam and Dyer Island (Figure 1).
Figure 1.
Maps of sampling sites along the southern coast of South Africa (Joubertsdam and Dyer Island). Arrows indicate the sequence of progressive zooming from the national scale (South Africa) to the study area.
The selection of this study area was based on the availability of multi-year, standardized photographic series. This region is characterized by distinctive oceanographic features that sustain large marine vertebrates [40] and represents an area of high ecological relevance, as well as a key transit hotspot for the target species along the South African coastline [41]. These conditions are driven by the convergence of water masses originating from the Atlantic Ocean (west coast) and the Indian Ocean (east coast). The system is further influenced by upwelling processes associated with the Benguela Current, a cold, nutrient-rich water mass flowing northward along the western coast of southern Africa [42,43,44].
2.2. Photo Collection
The data collection campaign was conducted directly by the CSS in September 2024 and September 2025 and was further supplemented with photographic material provided by Marine Dynamics in August and September 2025. During each survey, individual-specific data sheets were compiled for every observed individual shark. In addition to the dorsal fin profile, secondary morphological features were recorded when present, such as pigmentation, scars, wounds, and deformities. The estimated total length (TL) was recorded using the shark-diving cage (length 4.5 m) as a reference, and sex was assessed during cage-diving sessions, even though sometimes this was not possible due to the poor visibility of the water [41,45], thereby improving the precision of individual identification. Sharks were attracted to the vessel using chumming and baiting techniques in strict accordance with ethical guidelines for elasmobranch research, ensuring minimal risk of behavioral conditioning. For these reasons, baits consisted specifically of salmon, a species that does not typically form part of the natural diet of these predators [46,47,48].
Images of the dorsal fin of the bronze whaler shark were captured when individuals approached the surface, under conditions that ensured clear visibility of the posterior fin profile. Photographs were archived in JPG format using three digital cameras: Panasonic Lumix FZ1000 (Panasonic Corporation, Osaka, Japan), equipped with a 25–400 mm zoom lens, and Canon 2000D (Canon Inc., Tokyo, Japan) and Canon 800D (Canon Inc., Tokyo, Japan), offering comparable technical specifications. Efforts were made to photograph the trailing edge of the dorsal fin oriented perpendicular to the waterline, a configuration recommended in previous studies [11,16]. This approach enabled initial standardization of the images and facilitated subsequent image processing using software, reducing the risk of errors due to perspective distortion. The historical reference dataset of white shark included sightings from 2012 to 2019, derived from archival identification sheets maintained by the CSS, as no individuals were sighted during the 2025 sampling—likely associated with the documented presence of orcas (Orcinus orca; Linnaeus, 1758) in the area [49]. All images were subsequently subjected to a preliminary selection and processing phase, detailed in Section 2.3, to ensure their comparability and suitability for Photo-ID analysis.
2.3. Image Processing and Photo-ID Protocol (IDENTIFIN)
To ensure image comparability and the reliability of the Photo-ID process, all collected photographs were subjected to a standardized workflow (selection, processing, and analysis) organized into three main phases: (i) qualitative assessment and selection of suitable images, (ii) standardization and pre-processing using image editing software, and (iii) extraction of the posterior dorsal fin profile and semi-automatic matching using the IDENTIFIN software. The initial qualitative screening (eye-based screening) was conducted to identify images suitable for Photo-ID analysis.
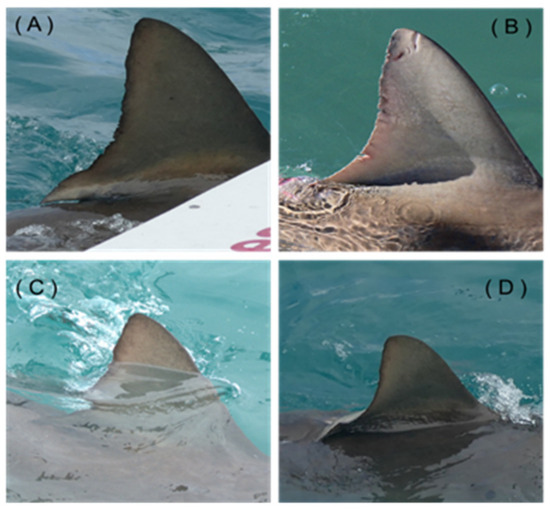
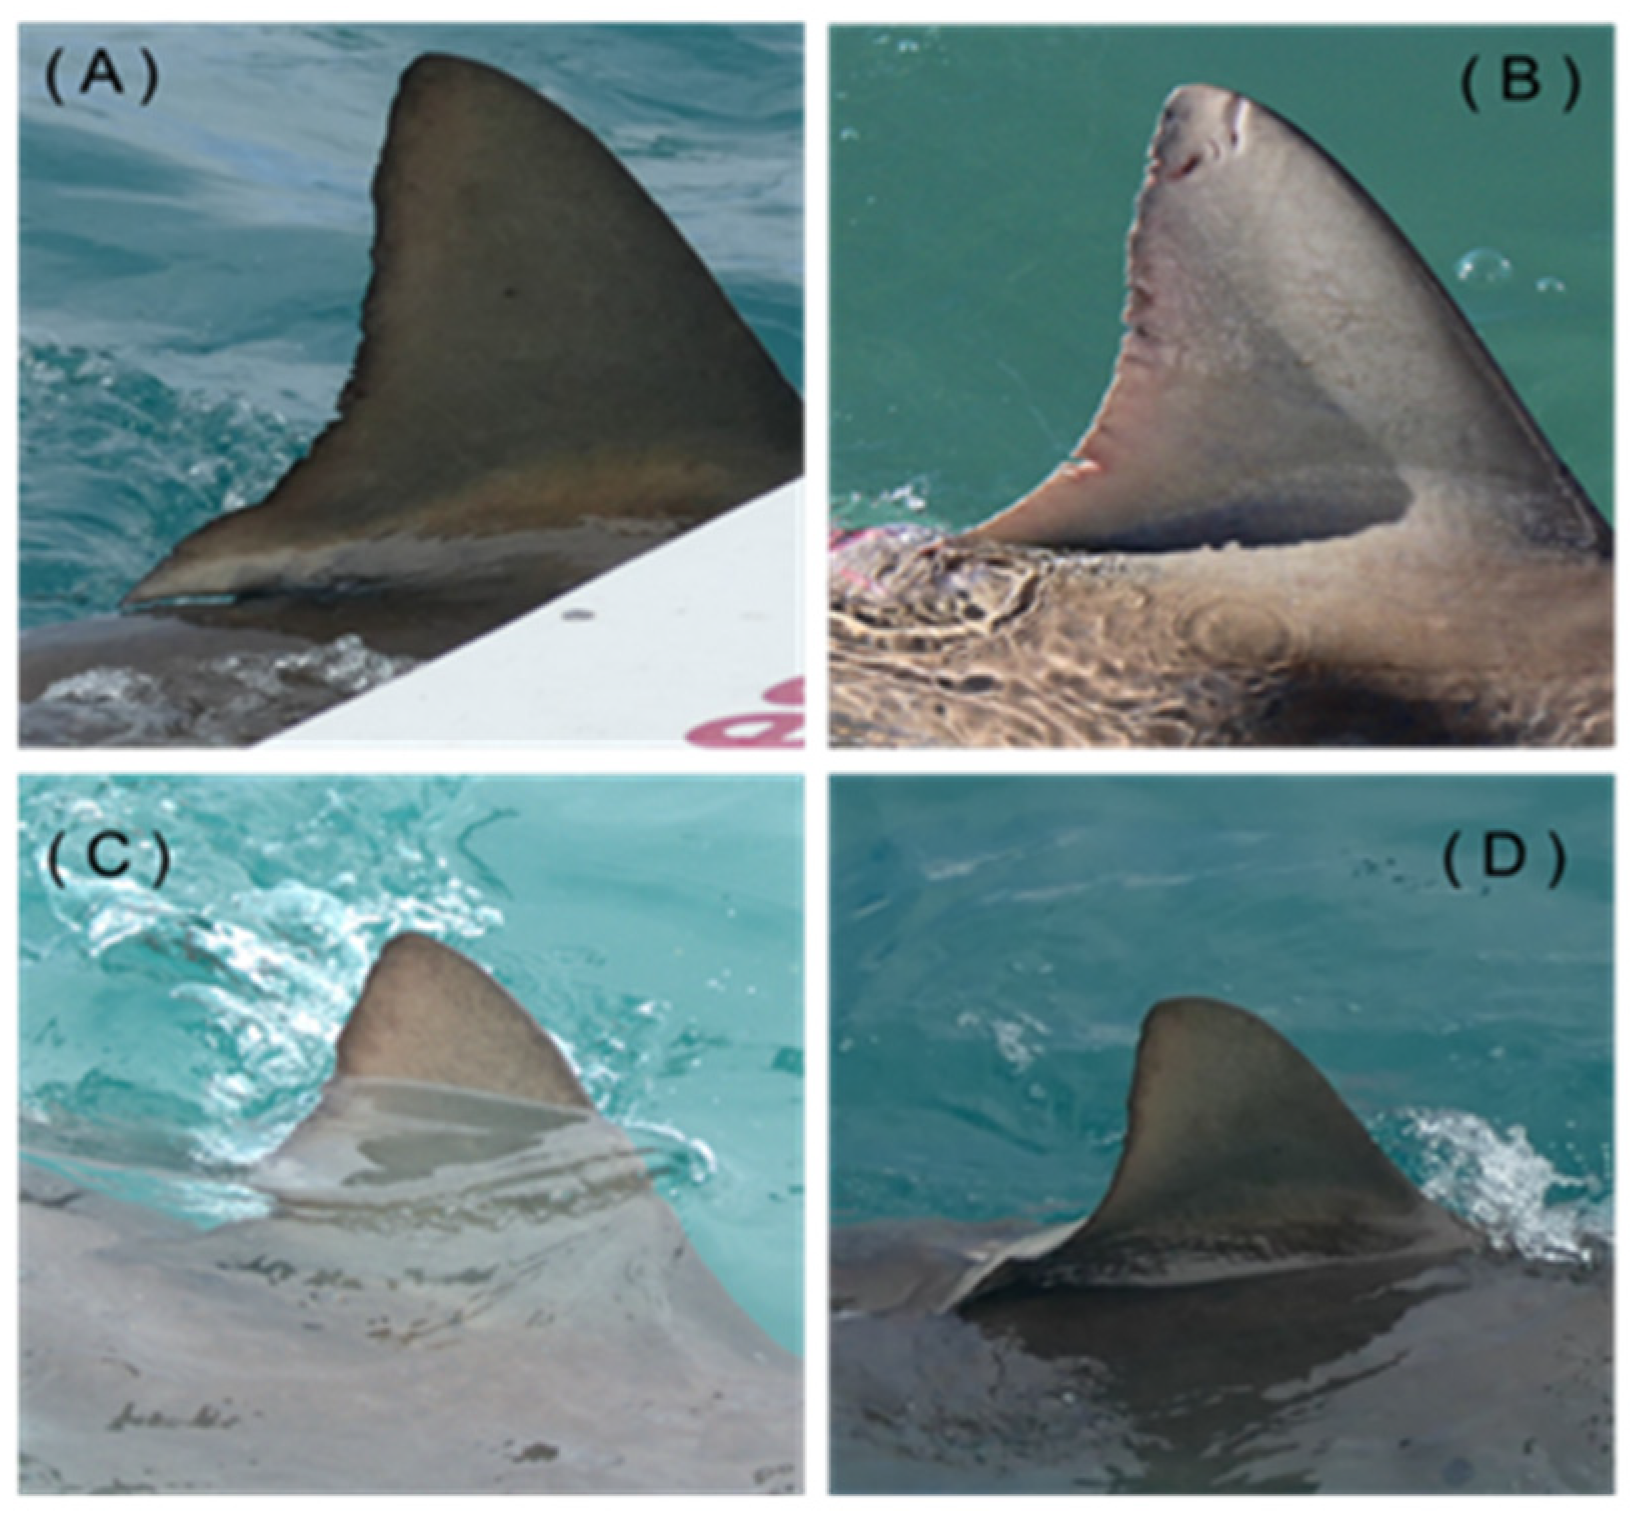
Photographs were taken with 20 Megapixels or more cameras and were considered suitable when they exhibited high resolution of the dorsal fin, were acquired at close range, and captured the subject with an orientation approximately perpendicular to the sagittal plane. Images were excluded if the dorsal fin appeared bent or distorted due to animal movement, or if the viewing angle compromised accurate interpretation of the morphological features of interest. Similarly, photographs in which the lower portion of the fin was partially submerged, preventing clear visualization of the notches, were also excluded (Figure 2).
Figure 2.
Examples of dorsal fin photographs used for Photo-ID of bronze whaler shark (Carcharhinus brachyurus): (A,B) images meeting the quality criteria, (C) image with partially submerged dorsal fin, (D) image with reduced fin visibility due to movement.
Photographs of dorsal fins that did not meet these criteria were not included in the reference database.
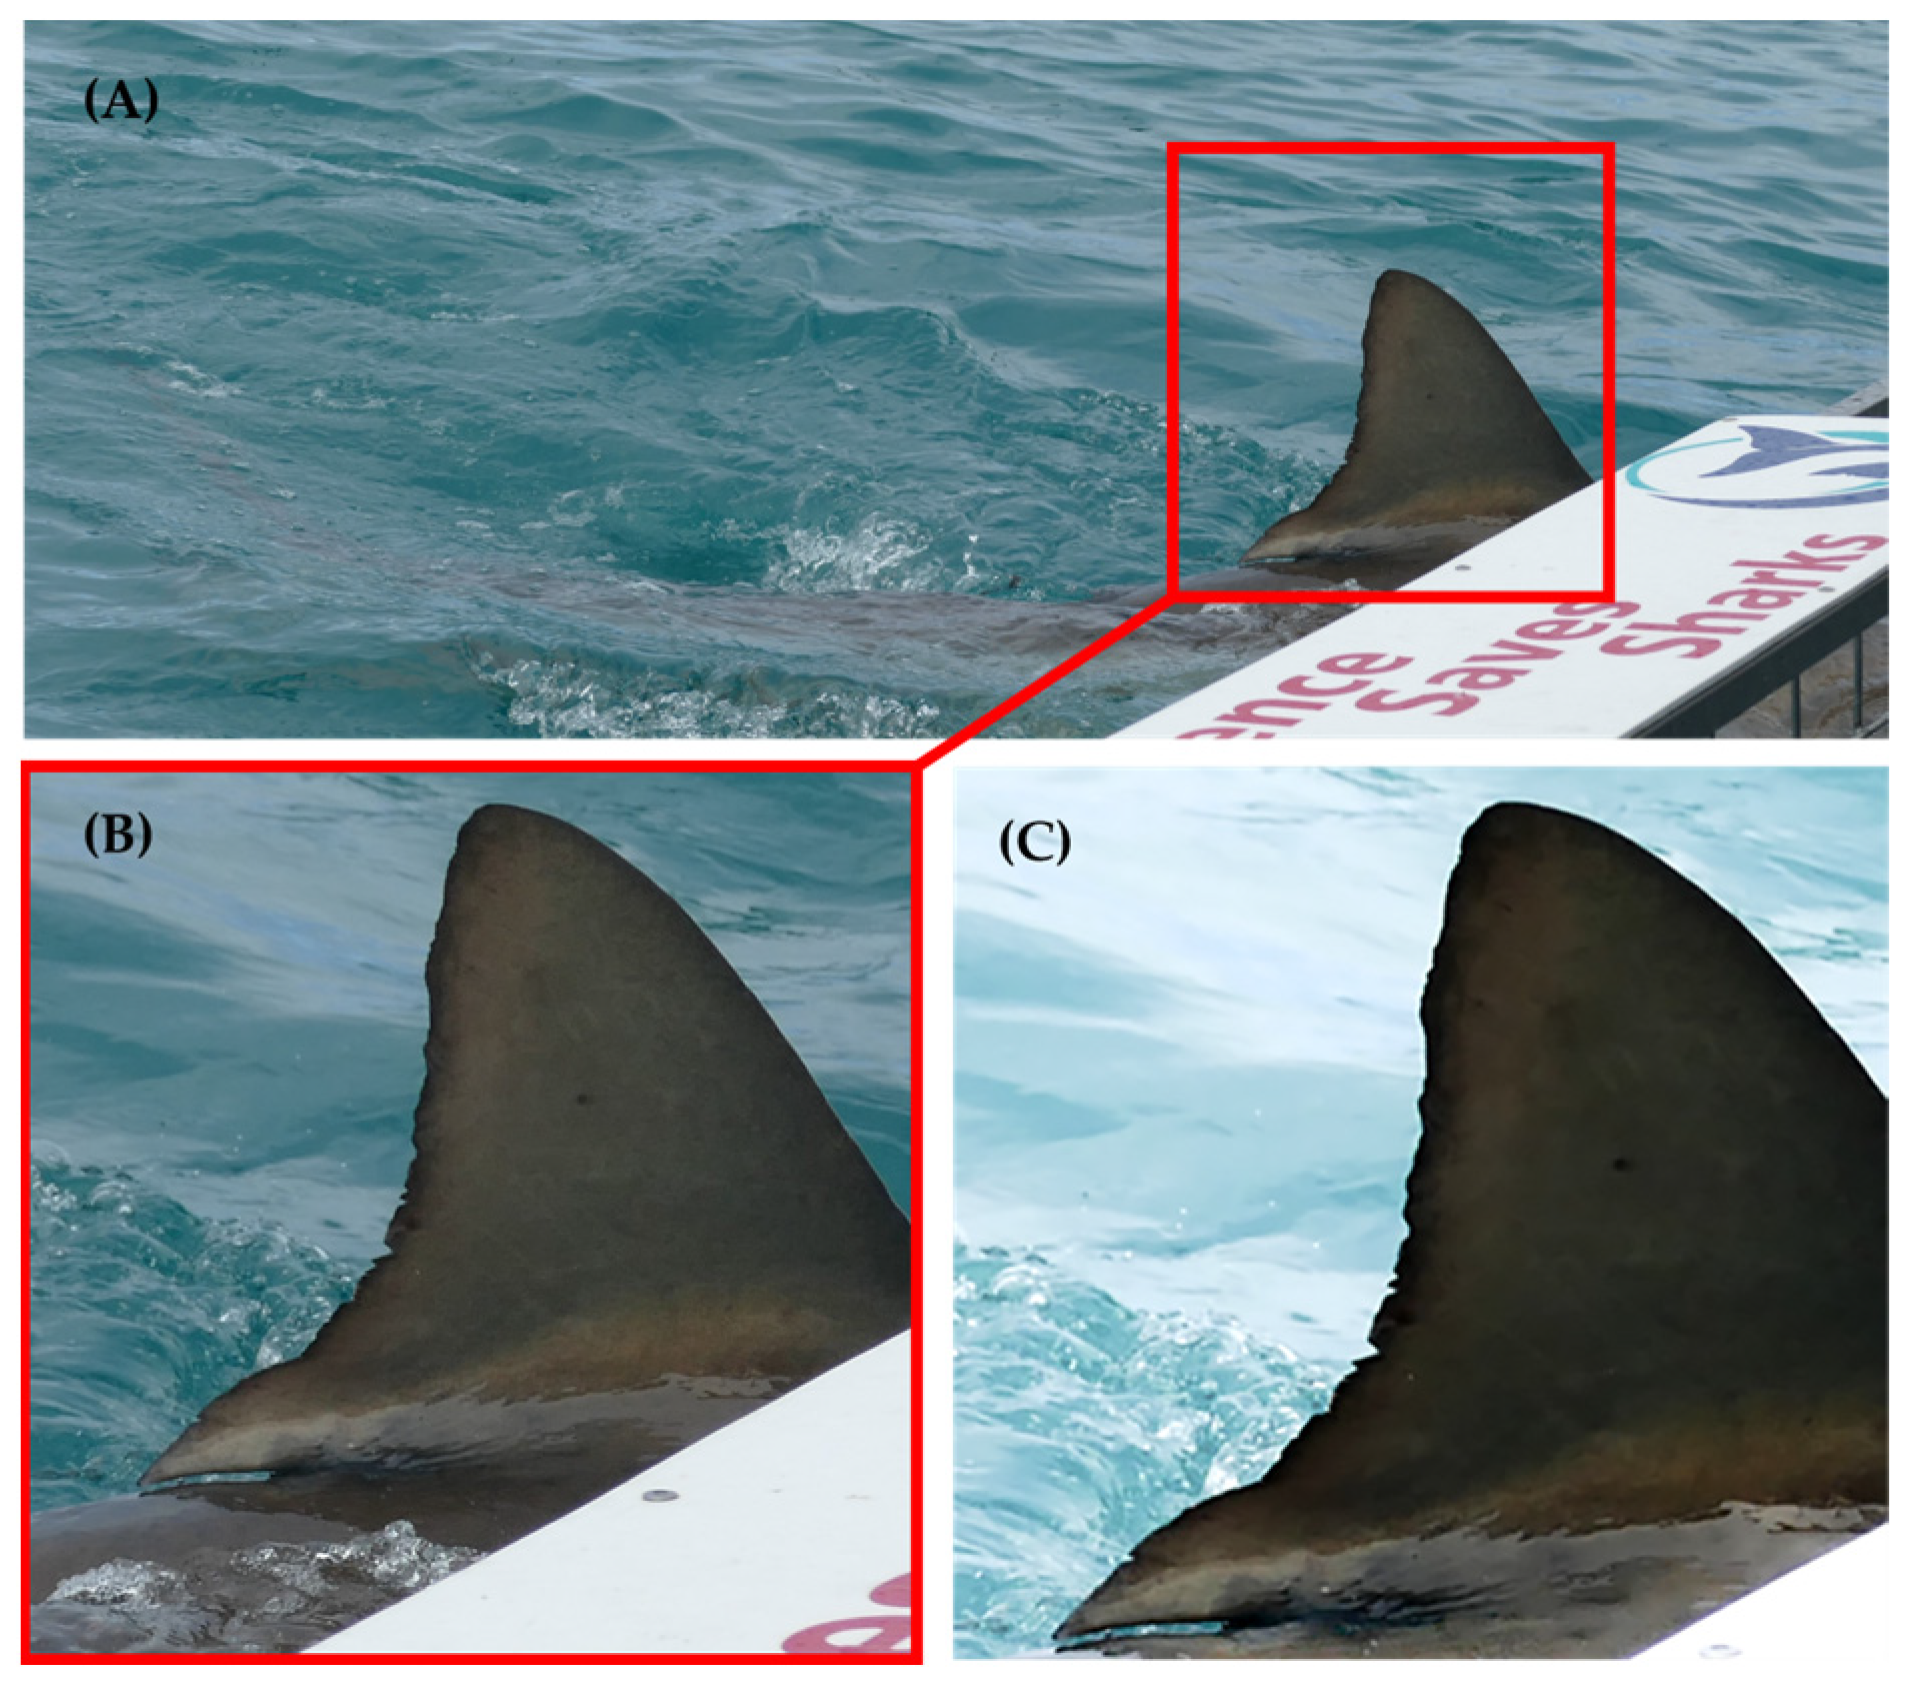
Adobe Photoshop (version 27.0.0) was used exclusively as a support tool in the Photo-ID process, with the aim of standardizing image format and enhancing visual clarity, without altering the informational content. The selected images of bronze whaler shark were cropped to isolate the dorsal fin and resized to a square format (8.0 cm × 8.0 cm) with resolution increased to 300 DPI. Basic image adjustment functions were applied to enhance subject contrast and reduce background prominence, thereby improving the visibility of fin notches, which are typically less pronounced in this species (Figure 3).
Figure 3.
Example of dorsal fin image processing workflow for Photo-ID of bronze whaler shark (Carcharhinus brachyurus): (A) original photograph, (B) cropped image, (C) processed image.
For each image of the bronze whaler shark, a standardized processing pipeline was applied, including cropping to a 1:1 aspect ratio, setting the resolution to 300 DPI, optimizing contrast using the Camera Raw tool, and saving at the highest available quality.
For the white shark, dorsal fin images were extracted from previously processed archival identification sheets. The identification sheets include a photograph of the fin of the sharks sighted, indicating whether it is the right or left side of the fin; in a few cases, both sides of the fin were present. They also include the date of the sighting, the sighting location, the sex (if observed), and an estimate of the shark’s TL. All the identification sheets used pertain to white sharks sighted in the study area. A conservative selection criterion was adopted, retaining sheets with non-blurred images and clearly identifiable notches, thereby maximizing the preservation of informative features. The standardization process followed a procedure similar to that applied to the bronze whaler shark, including cropping to a 1:1 ratio (8.0 cm × 8.0 cm), setting resolution to 300 DPI, automatic contrast enhancement, and saving at the highest available quality. These operations were carried out to align our study with the standardization already used in previous studies for the white shark’s fin and the use of IDENTIFIN software [16,25,26,50].
The standardized images were imported into the semi-automatic software IDENTIFIN, which facilitates the extraction of the posterior dorsal fin profile and comparison between individuals. After importing the apex and base points of the fin, the software automatically traces the profile using a vector line and saves the extracted information in the JSON file format associated with each image. When automatic extraction was believed to be inaccurate, manual corrections were applied via the Paint exclusion mask function, which allows irrelevant portions of the fin edge to be excluded, thereby improving alignment between the traced profile and the actual fin edge. IDENTIFIN independently assigns each individual a numerical code based on the date of first sighting, derived from the photograph’s metadata (format YYYYMMDD), with a progressive suffix to distinguish multiple individuals observed on the same day. For resightings, the software indicates the event with the suffix “RS” positioned between the two relevant dates. To enhance traceability and enable cross-validation, a parallel database in Excel format was maintained, where each individual was assigned a unique identifier independent of the software’s internal coding system (C_braXXX for the bronze whaler shark and C_carXXX for the white shark). In cases where comparisons were ambiguous, the sighting was conservatively classified as a new individual pending additional photographic data.
2.4. Exploratory Analyses
Given the exploratory nature of the study, the heterogeneity of sampling effort between years and between species—2024 and 2025 for the bronze whaler shark and a longer period for the white shark (2012–2019)—and the limited size of the available datasets, all analyses were conducted only for descriptive purposes. The comparative analysis is strictly methodological without ecological or biological assessment. All exploratory analyses in this study were conducted using the validated match as the analytical unit. A validated match is defined as a confirmed correspondence between two images of the same individual. Such matches may result from temporal matches or, in the case of the white shark dataset, also from within-event bilateral (right-left fin sides) comparisons.
Similarity scores should be interpreted as relative indicators of morphological similarity and not as probabilistic measures of identification confidence. Accordingly, analyses in this study were restricted to visually validated correct matches, since IDENTIFIN does not offer an objective framework for identifying or classifying false-positive matches. This metric can range from 0 to 1, where 1 represents the maximum possible similarity. For each species, descriptive statistics such as the mean and median of similarity scores associated with validated matches were calculated; the median was preferred as a summary measure due to its reduced sensitivity to outliers. The position of the correct match within the software’s list of proposals (ranking position) was evaluated as an indicator of the manual workload required by the operator [25]. Similarity scores and ranking positions were therefore analyzed jointly to explore their roles in the interpretation of IDENTIFIN outputs. The normality of similarity score validated matches distributions for each species was assessed using the Shapiro–Wilk test, which is well suited for small sample sizes and has high sensitivity in detecting departures from normality [51]. Confidence intervals (CI) for mean and median similarity scores were estimated using a non-parametric bootstrap approach (10,000 resamples).
Considering the deviation from normality and the small, unbalanced sample sizes, a non-parametric statistical approach was adopted because these tests are robust to small and unequal sample sizes, which characterize real-world Photo-ID datasets. Exploratory comparisons of the similarity score distributions between the two species were performed using the Mann–Whitney U test. This test was selected to evaluate the behavior of two independent groups of observations, in this case, the two species under examination, when the dependent variable is not normally distributed and without relying on distributional assumptions, making it suitable for exploratory methodological comparisons [52]. To facilitate interpretation, the effect size (r) r = was also calculated to quantify the magnitude of the observed difference independently of sample size [53]. In addition to the non-parametric analysis, a permutation test based on the difference between the medians of the similarity scores for the two species was conducted. The permutation test, performed using 10,000 random permutations, was included as a complementary distribution-free approach to assess the robustness of the observed differences, and as it is less sensitive to outliers and non-normal data distributions, making it advantageous when analyzing data derived from operational field conditions. These analyses were carried out using R software, version 4.5.2.
Bivariate distributions of similarity scores and ranking positions were analyzed using R Studio (version 2026.01.0). To visualize data density and mitigate point overplotting at discrete ranks, a jittering technique (width = 0.12) was applied. Performance core areas for each species were identified by calculating 80% confidence ellipses based on the covariance of the score and rank variables, the 80% confidence level was intentionally selected to emphasize the central tendencies of score-rank combinations of validated matches while limiting the influence of outliers. This choice reflects the exploratory objective of the analysis, which aims to visualize performance patterns rather than establish decision thresholds or infer population-level parameters. This choice was not intended to define a statistical confidence interval, but rather to facilitate visual comparison of core performance patterns between species.
3. Results
3.1. IDENTIFIN Performance on the Bronze Whaler Shark
The image selection and pre-processing workflow for the bronze whaler shark processed 1528 photographs collected in 2024 and 498 in 2025. Following qualitative screening based on image resolution, shooting angle, and visibility of the notches, only 54 images from 2024 and 27 from 2025 were selected for analysis. In cases where multiple valid photographs of the same individual were available from a single observation event, only the highest quality images were taken. Excluded images primarily exhibited poor sharpness, fin distortion, or partial submersion in water, as illustrated in Figure 2.
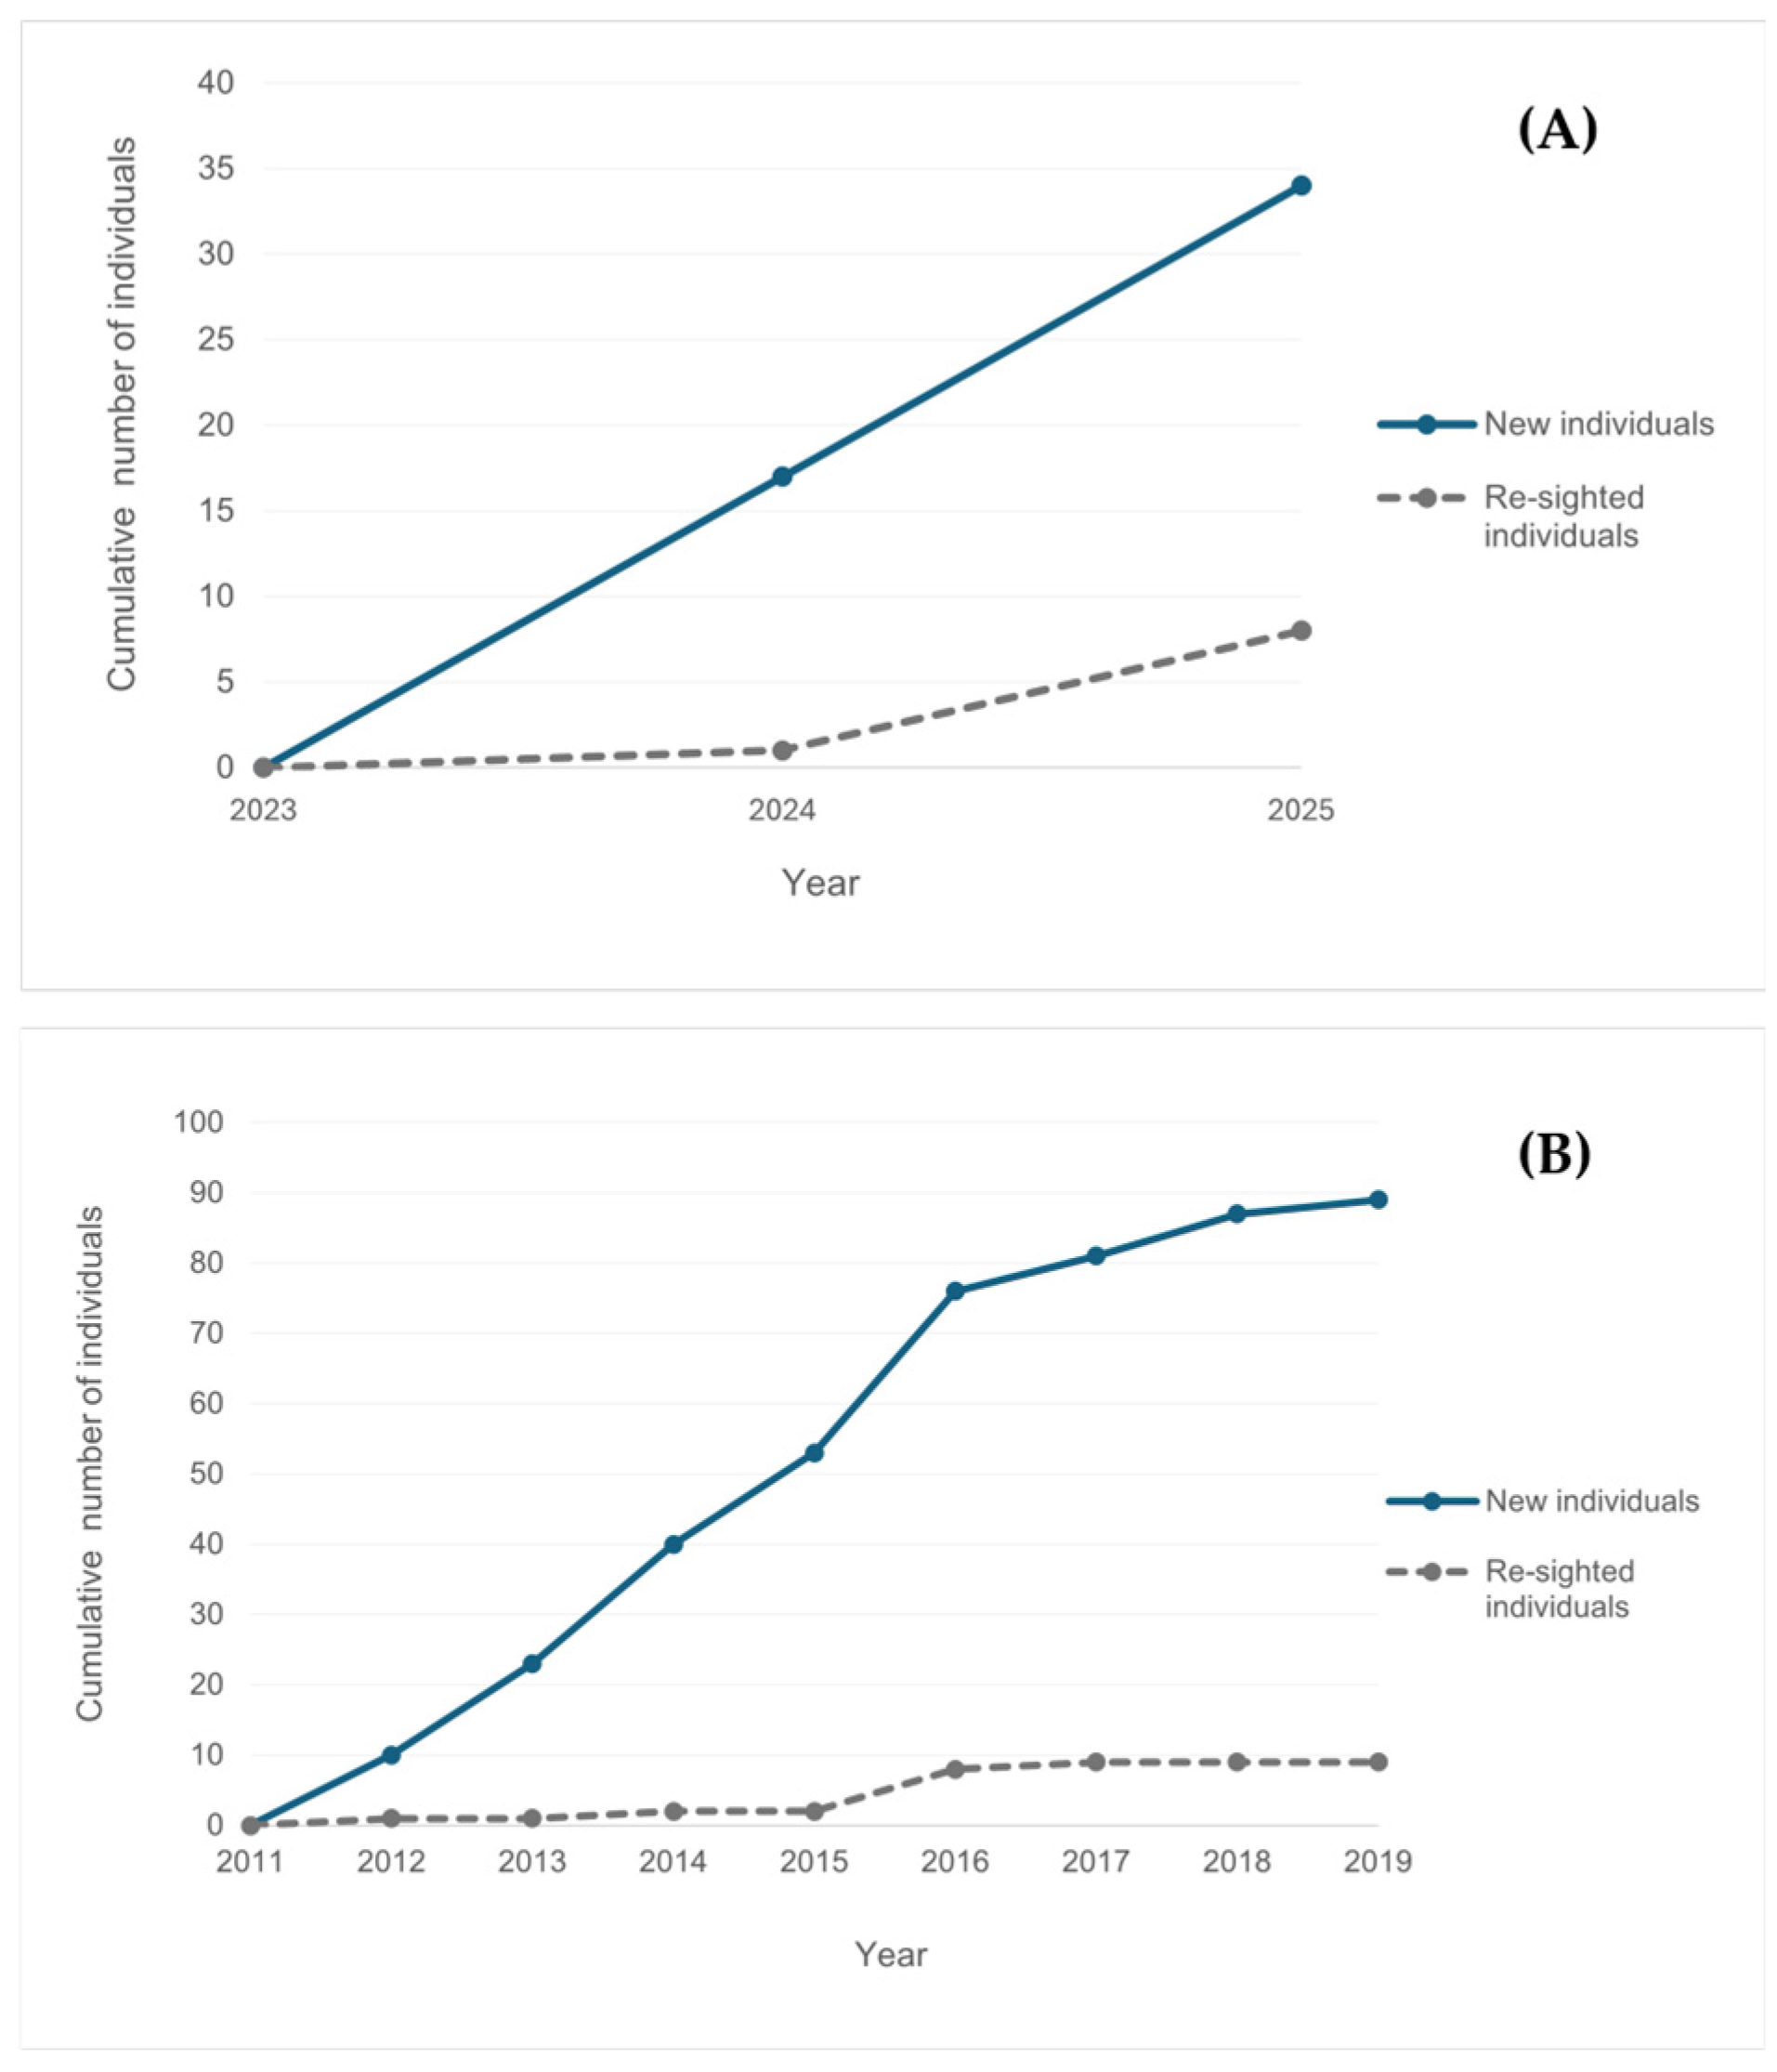
The analysis of the bronze whaler shark images using IDENTIFIN enabled each identified individual to be assigned to a dedicated folder within the software, resulting in the registration of 34 unique specimens. Eight temporal matches of events were documented, with some of these separated by approximately one year (e.g., C_bra007 and C_bra009), and others representing presence across several consecutive days (Table A1).
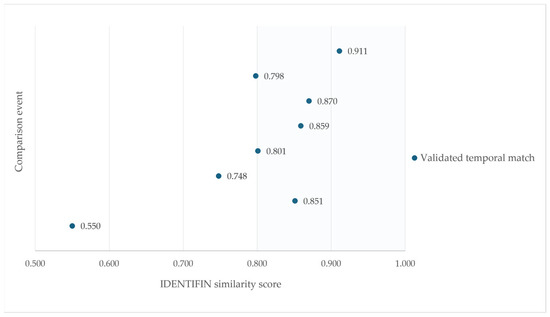
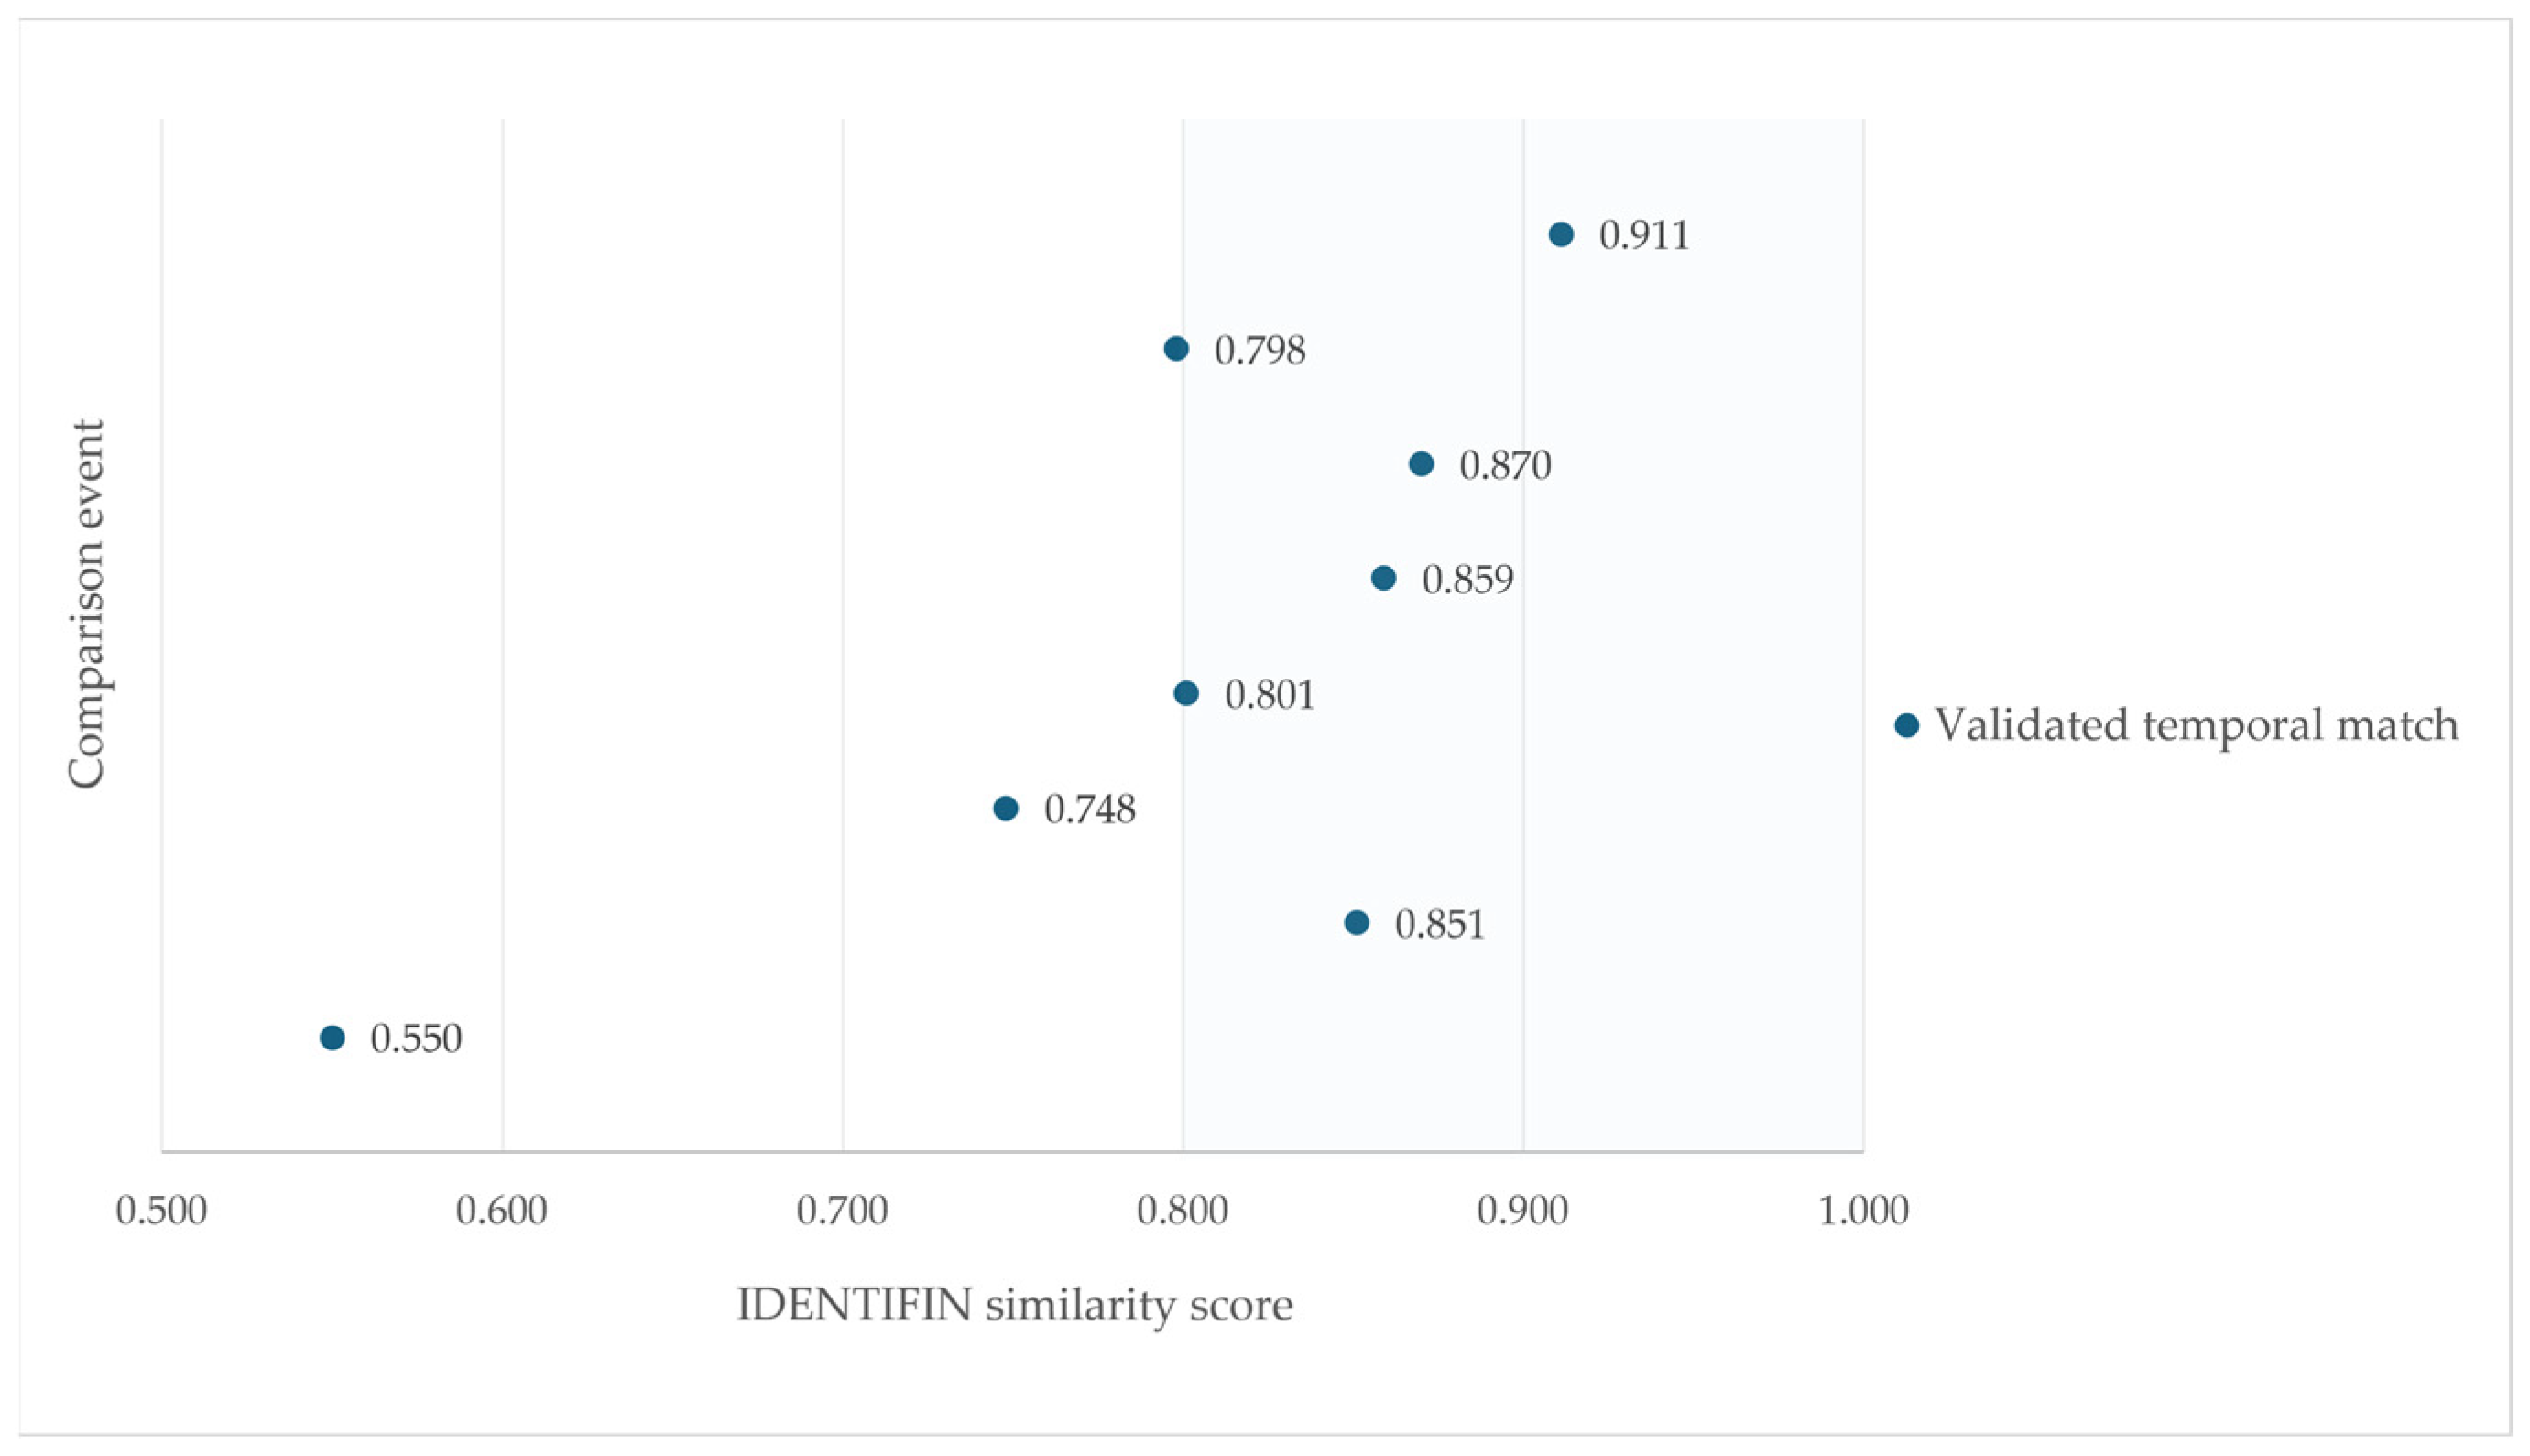
For the eight validated bronze whaler shark matches, similarity scores associated with the software’s internal matching algorithm ranged from 0.550 to 0.911, values of 0.800 or higher were interpreted as indicative of relatively high similarity within the context of the software output, without implying a formal threshold for match acceptance (Figure 4).
Figure 4.
Distribution of IDENTIFIN similarity scores of bronze whaler shark (Carcharhinus brachyurus) validated matches.
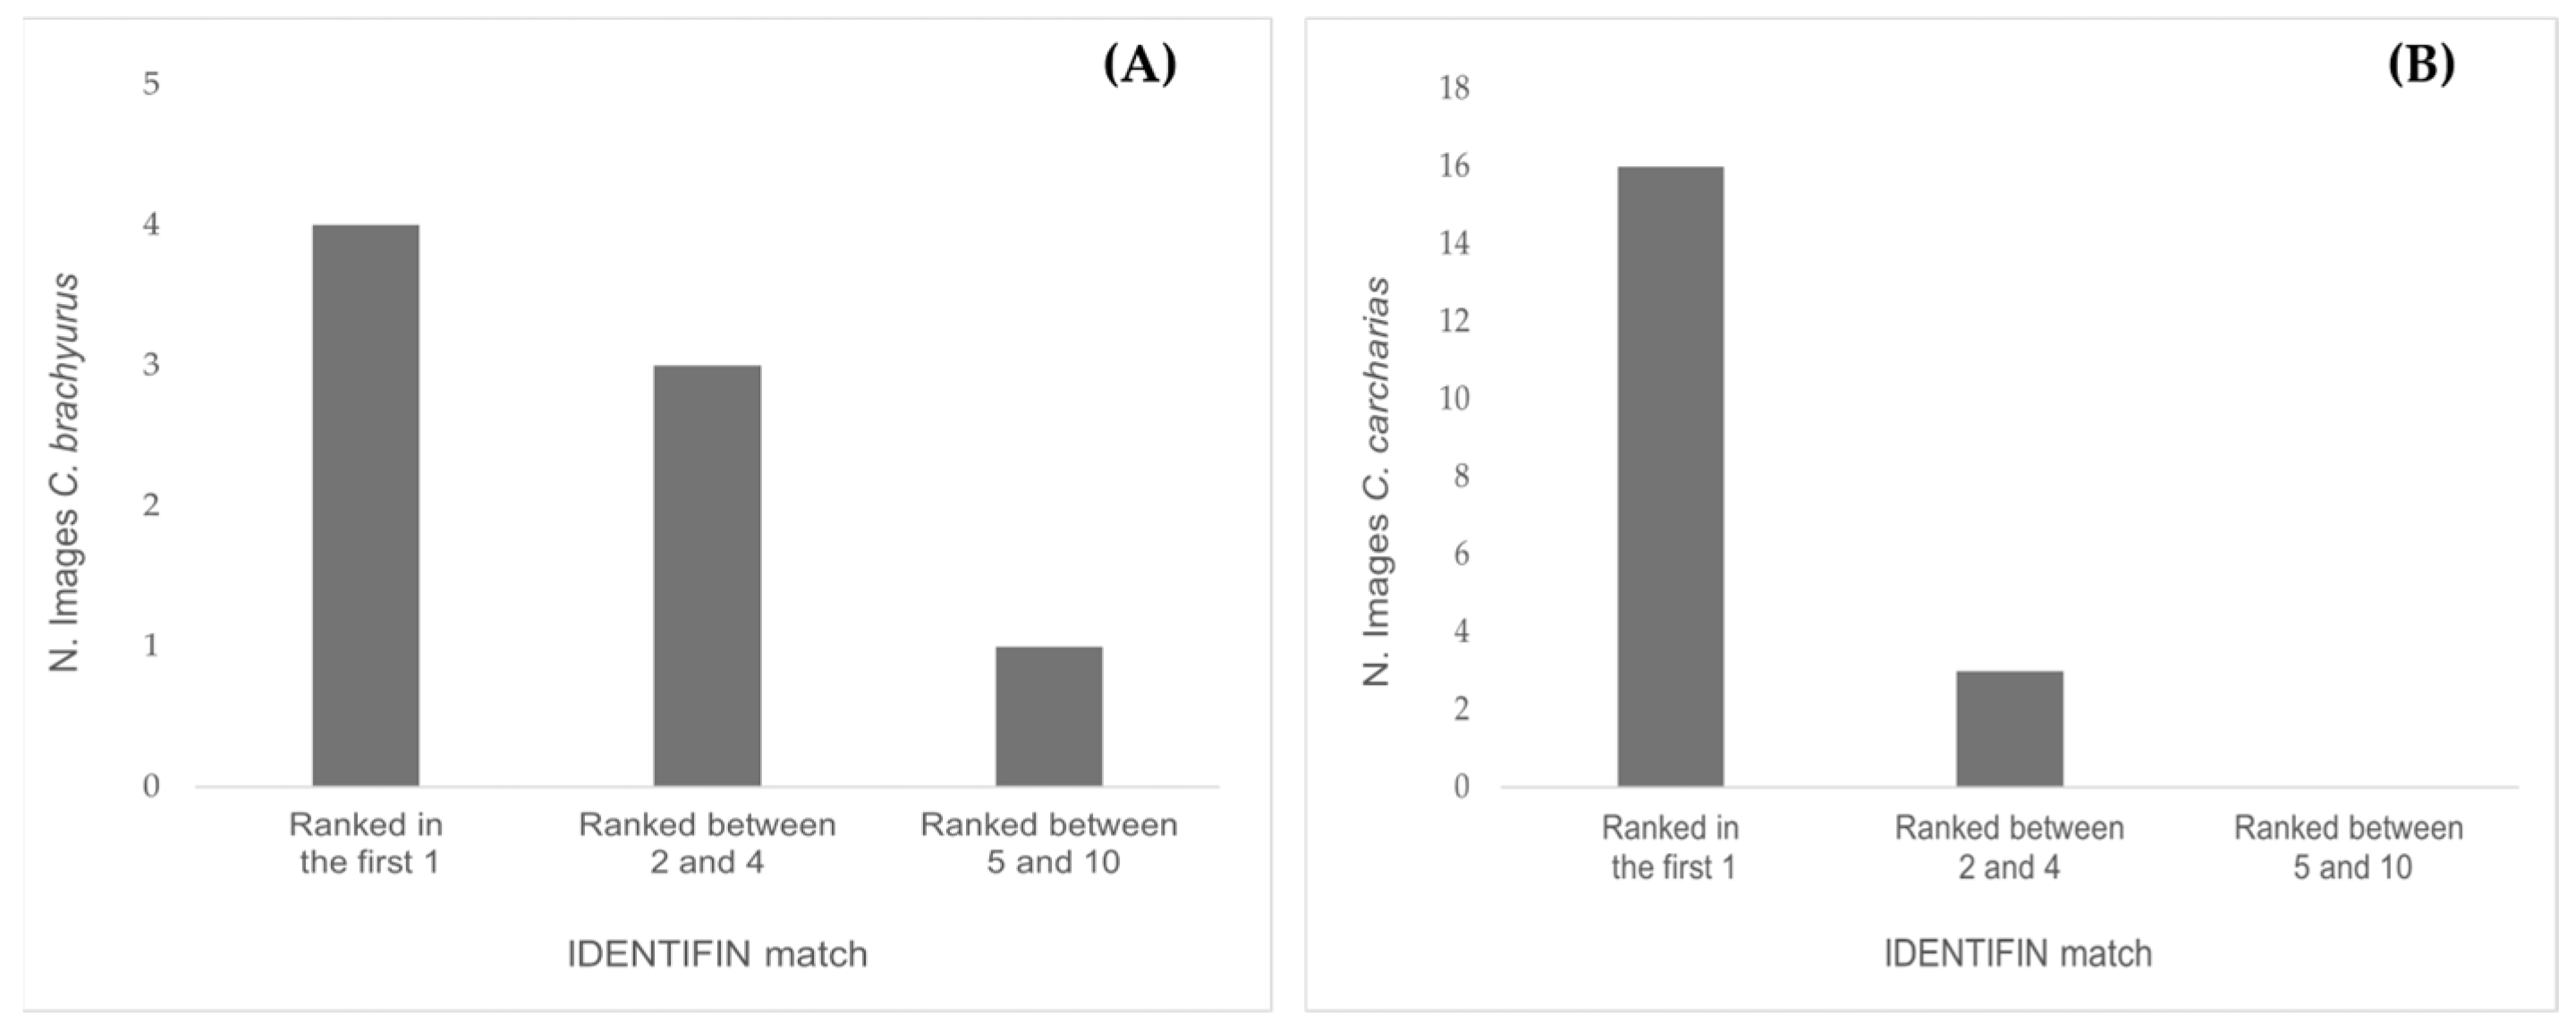
Regarding the ranking of images generated by the software for the eight validated matches, 50% of them (n = 4) were ranked first, 37.5% (n = 3) were positioned between second and fourth, and the remaining 12.5% (n = 1) fell between fifth and tenth (Figure 5A).
Figure 5.
Histogram showing the ranking position of validated matches proposed by IDENTIFIN of (A) bronze whaler shark (Carcharhinus brachyurus; temporal matches) and (B) white shark (Carcharodon carcharias; temporal matches and bilateral comparisons).
The metadata analysis of the 34 identified bronze whaler specimens (17 from 2024 and 17 from 2025; Figure A1) indicated the presence of eight females, while the sex of the remaining 26 individuals could not be determined with certainty. The TL for all the individuals was estimated to be between 100 cm and 280 cm (mean = 233 cm, n = 34).
3.2. IDENTIFIN Performance on the White Shark
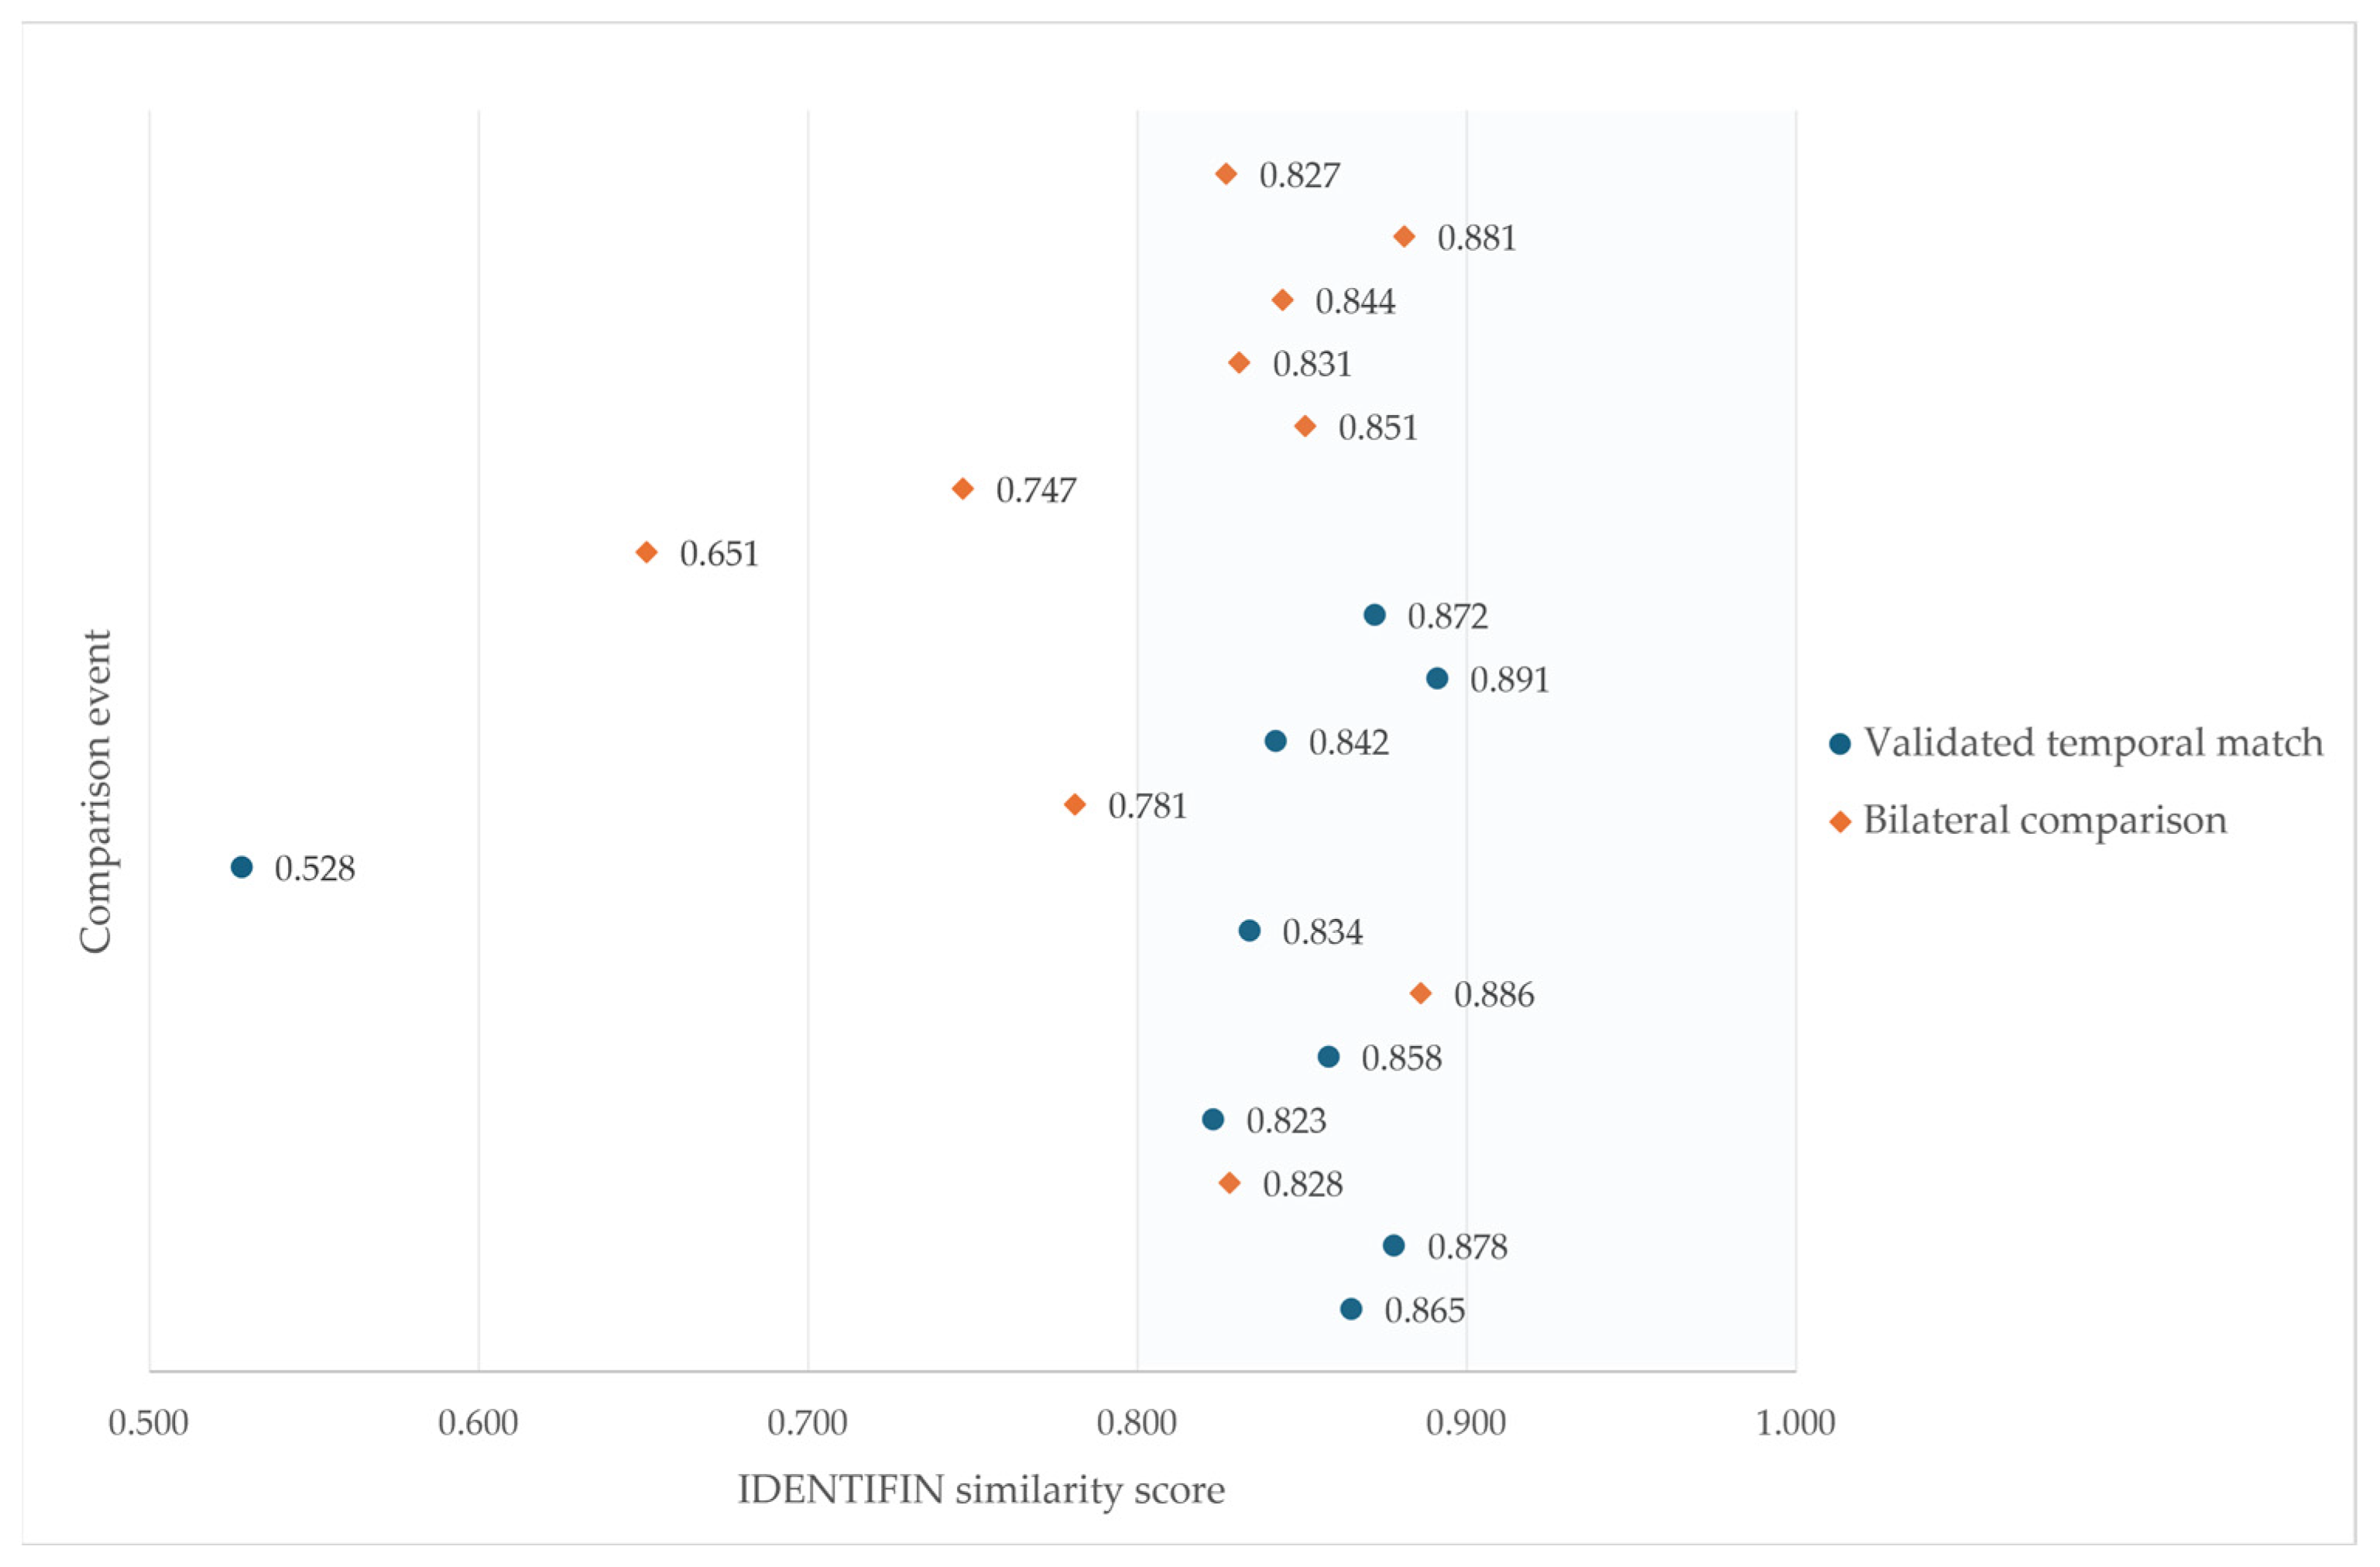
The dataset for the white shark included 110 archival identification sheets collected between 2012 and 2019. Following qualitative screening, 98 sheets were considered suitable for analysis using IDENTIFIN, resulting in the identification of 89 unique individuals and 9 temporal matches (Figure A1). In addition to the nine temporal matches, we also considered ten bilateral comparisons between the right and left sides of the dorsal fin of the same individual photographed during a single event and present in the same archival identification sheet. Both temporal matches and bilateral comparisons were treated equivalently as validated matches for performance evaluation, for a total of 19 validated matches performed for this species. Similarity scores as produced by the internal scoring function of the software for the white shark ranged from 0.528 to 0.891; values of 0.800 or higher were interpreted as indicative of relatively high similarity within the context of the software output, without implying a formal threshold for match acceptance, as it was done for the bronze whaler shark (Figure 6).
Figure 6.
Distribution of IDENTIFIN similarity scores of white shark (Carcharodon carcharias) validated matches.
Regarding the ranking of images generated by the software for the 19 validated matches, 84.2% of matches (n = 16) were assigned first position, while the remaining 15.8% (n = 3) were ranked between second and fourth; no validated match was ranked beyond fourth position (Figure 5B).
Metadata analysis of the total 89 identified individuals indicated 47 females, 15 males, and 27 individuals whose sex could not be determined with certainty. The TL for all individuals was estimated to be between 150 cm and 500 cm (mean = 316 cm, n = 89).
3.3. Comparative Performance
The quantitative comparison of IDENTIFIN’s performance between the two species is summarized in Table 1.
Table 1.
Comparison of IDENTIFIN performance metrics for bronze whaler shark (Carcharhinus brachyurus) and white shark (Carcharodon carcharias).
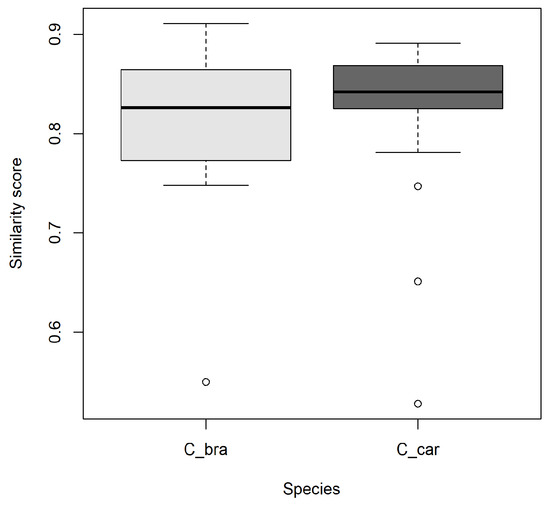
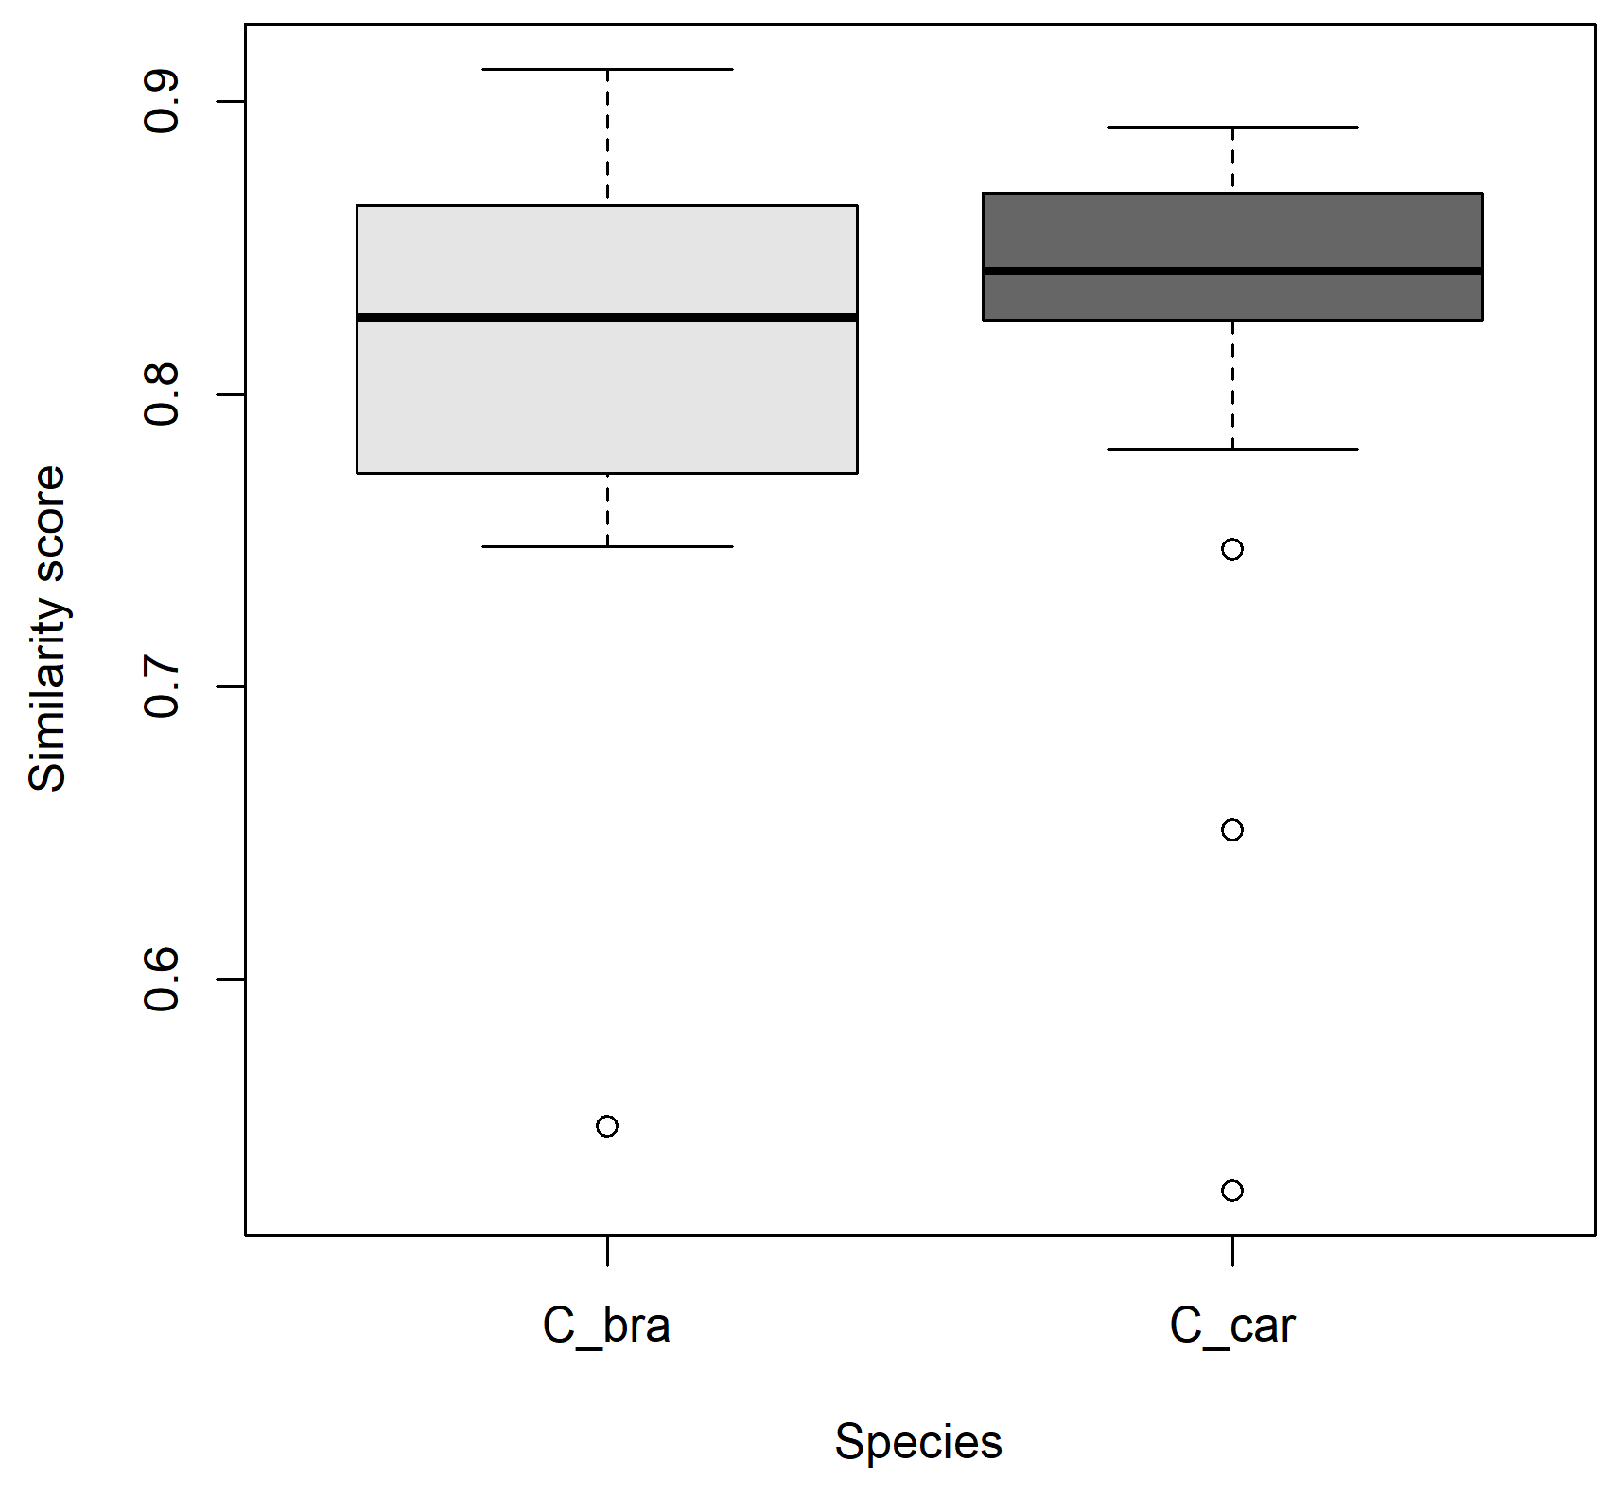
For the bronze whaler shark, 50% of validated matches (n = 4) were ranked in the first position, compared with 84% (n = 16) for the white shark. Cumulative accuracy within the fourth position was 87.5% (n = 7) for the bronze whaler shark and 100% (n = 19) for the white shark. The mean similarity score for the bronze whaler shark was 0.798, with a non-parametric bootstrap 95% CI of 0.716–0.860, and a median similarity score of 0.826 (95% CI: 0.748–0.870). For the white shark, the mean similarity score was 0.817 (95% CI: 0.773–0.851), with a median of 0.842 (95% CI: 0.827–0.865). Despite slightly higher similarity scores in the white shark dataset, these values did not show a strict correspondence with ranking positions. The mean ranking position was 2.88 for the bronze whaler shark and 1.16 for the white shark, reflecting differences in the distribution of validated match positions within the software’s candidate list and therefore in the extent of manual inspection required. Assessment of the similarity score distributions conducted using the Shapiro-Wilk test indicated deviation from normality for the white shark (W = 0.712, p < 0.001) while the bronze whaler shark showed a borderline normality (W = 0.827, p = 0.055), rendering them unsuitable for parametric statistical testing.
For the comparison of similarity score distributions in both species (Figure 7), using n = 8 validated matches for the bronze whaler shark and n = 19 for the white shark, the Mann–Whitney U test was applied, which did not reveal statistically significant differences (W = 69.5; p = 0.75).
Figure 7.
Boxplot of IDENTIFIN similarity score distributions for validated matches of the bronze whaler shark (Carcharhinus brachyurus; temporal matches) and white shark (Carcharodon carcharias; temporal matches and bilateral comparisons).
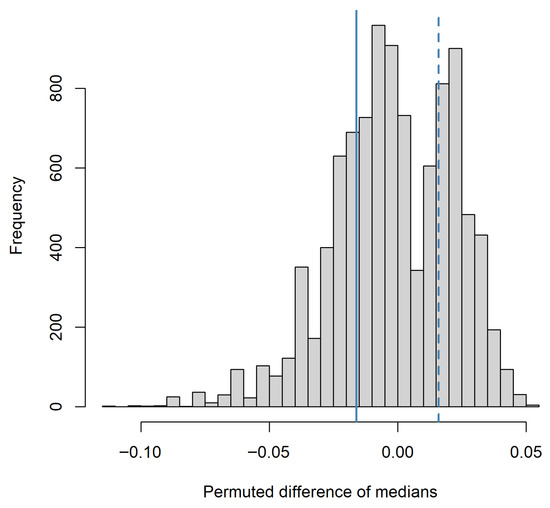
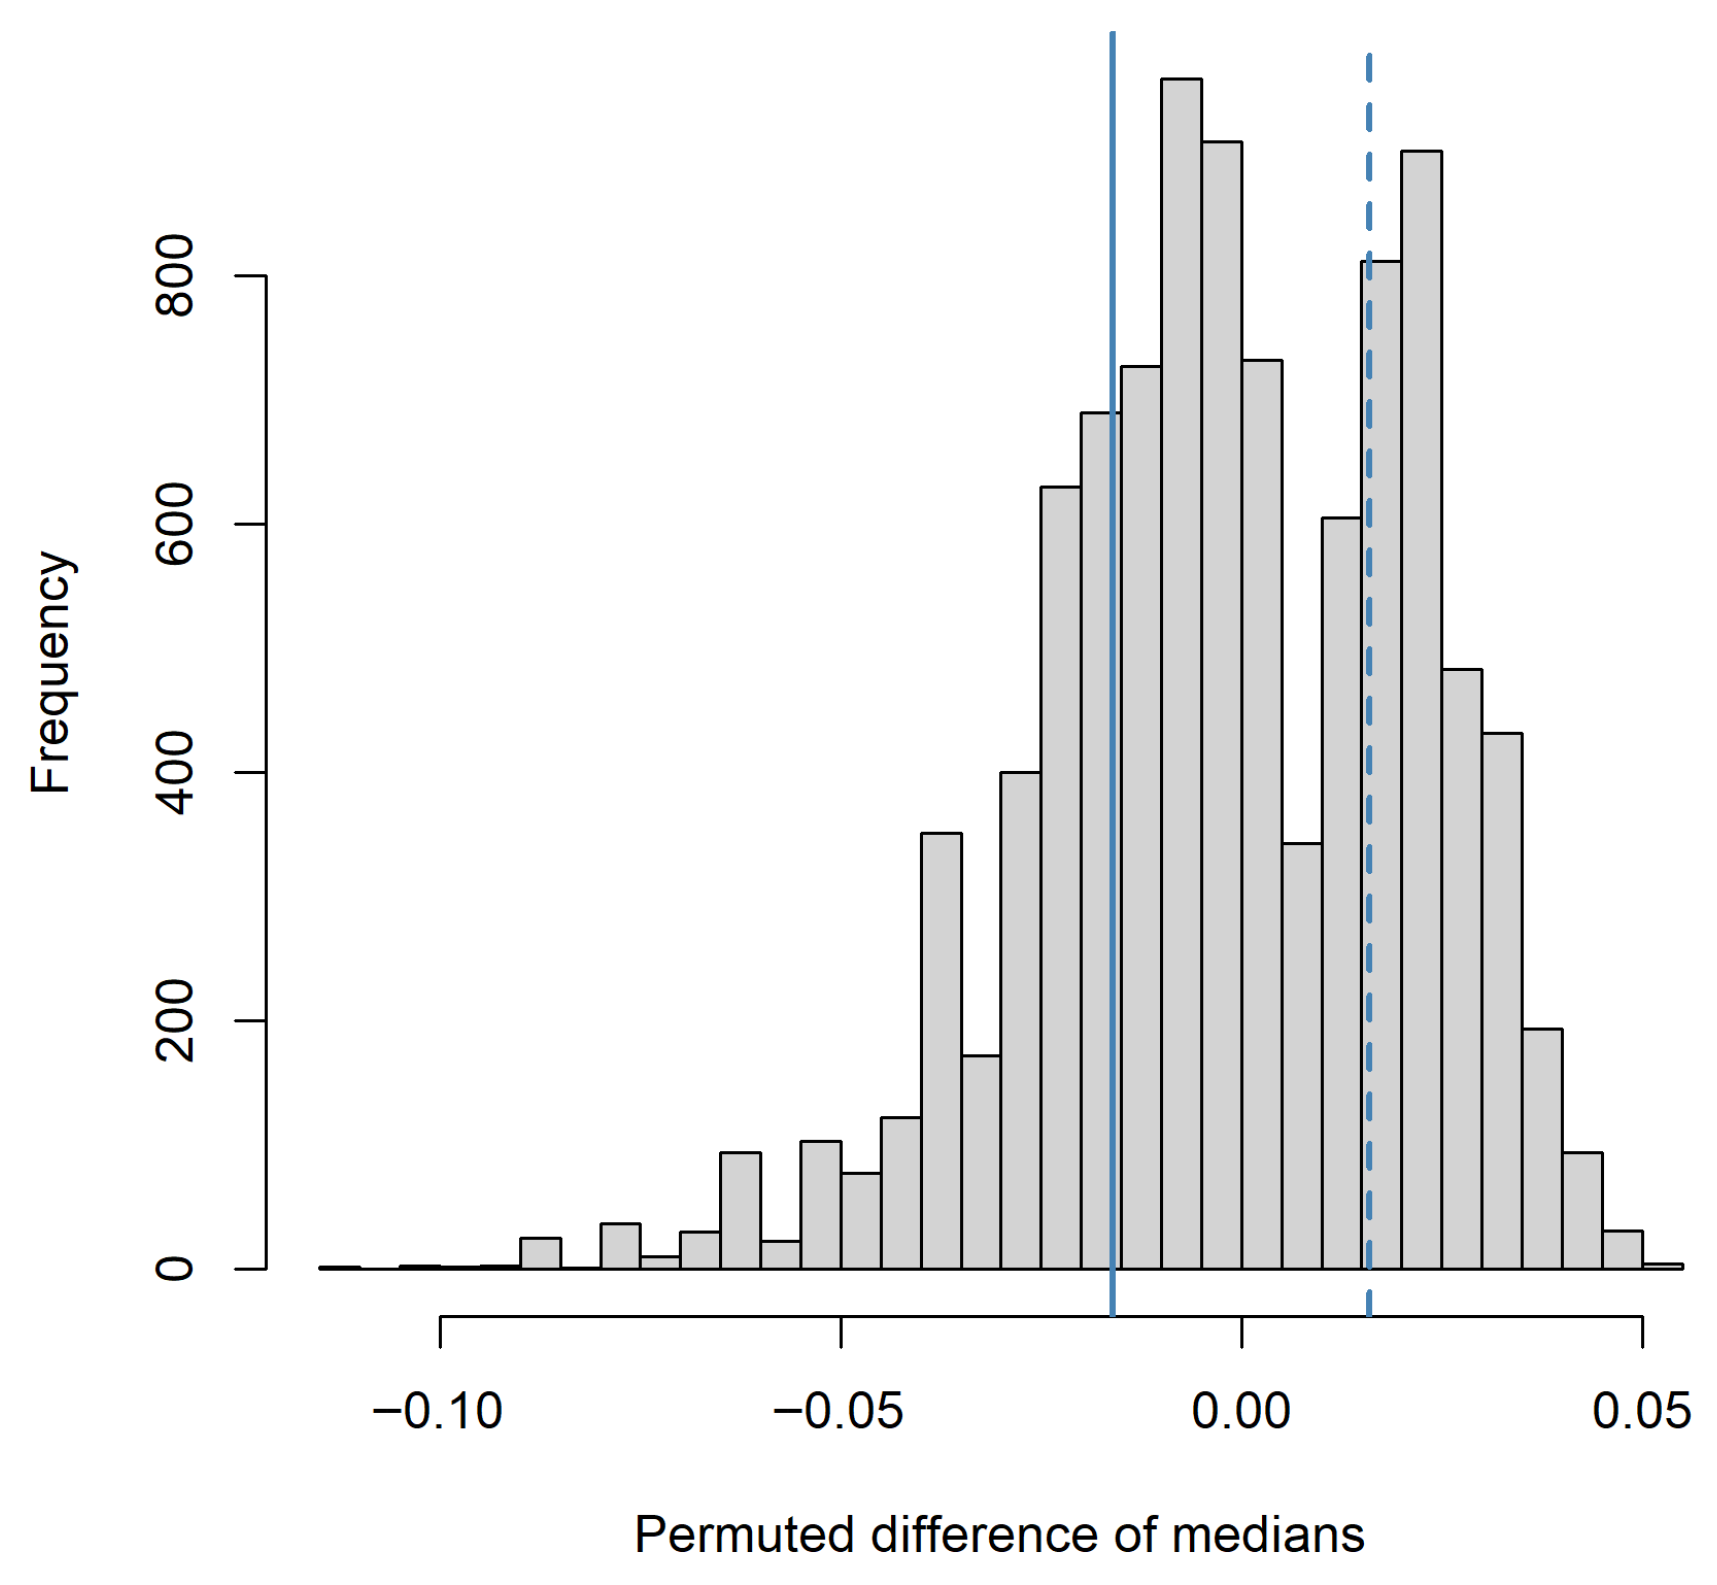
The effect size associated with the test, expressed as the r index, was 0.066. To further support the non-parametric analysis, a permutation test based on the difference between the medians of similarity scores for the two species yielded an observed difference of −0.016, with a p-value of 0.552 (Figure 8).
Figure 8.
Histogram of permuted differences between the median similarity scores validated matches for bronze whaler shark (Carcharhinus brachyurus; temporal matches) and white shark (Carcharodon carcharias; temporal matches and bilateral comparisons). The solid line indicates the observed difference (−0.016), and the dashed line indicates the opposite value (+0.016).
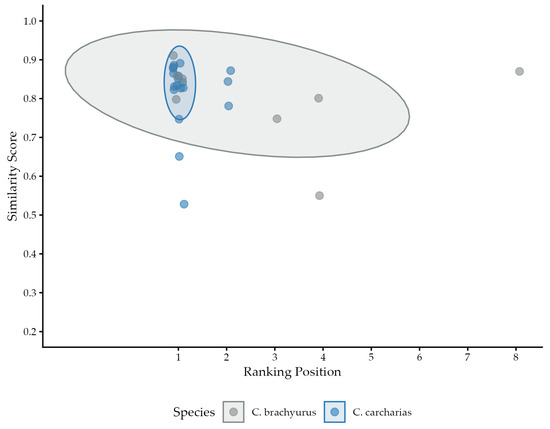
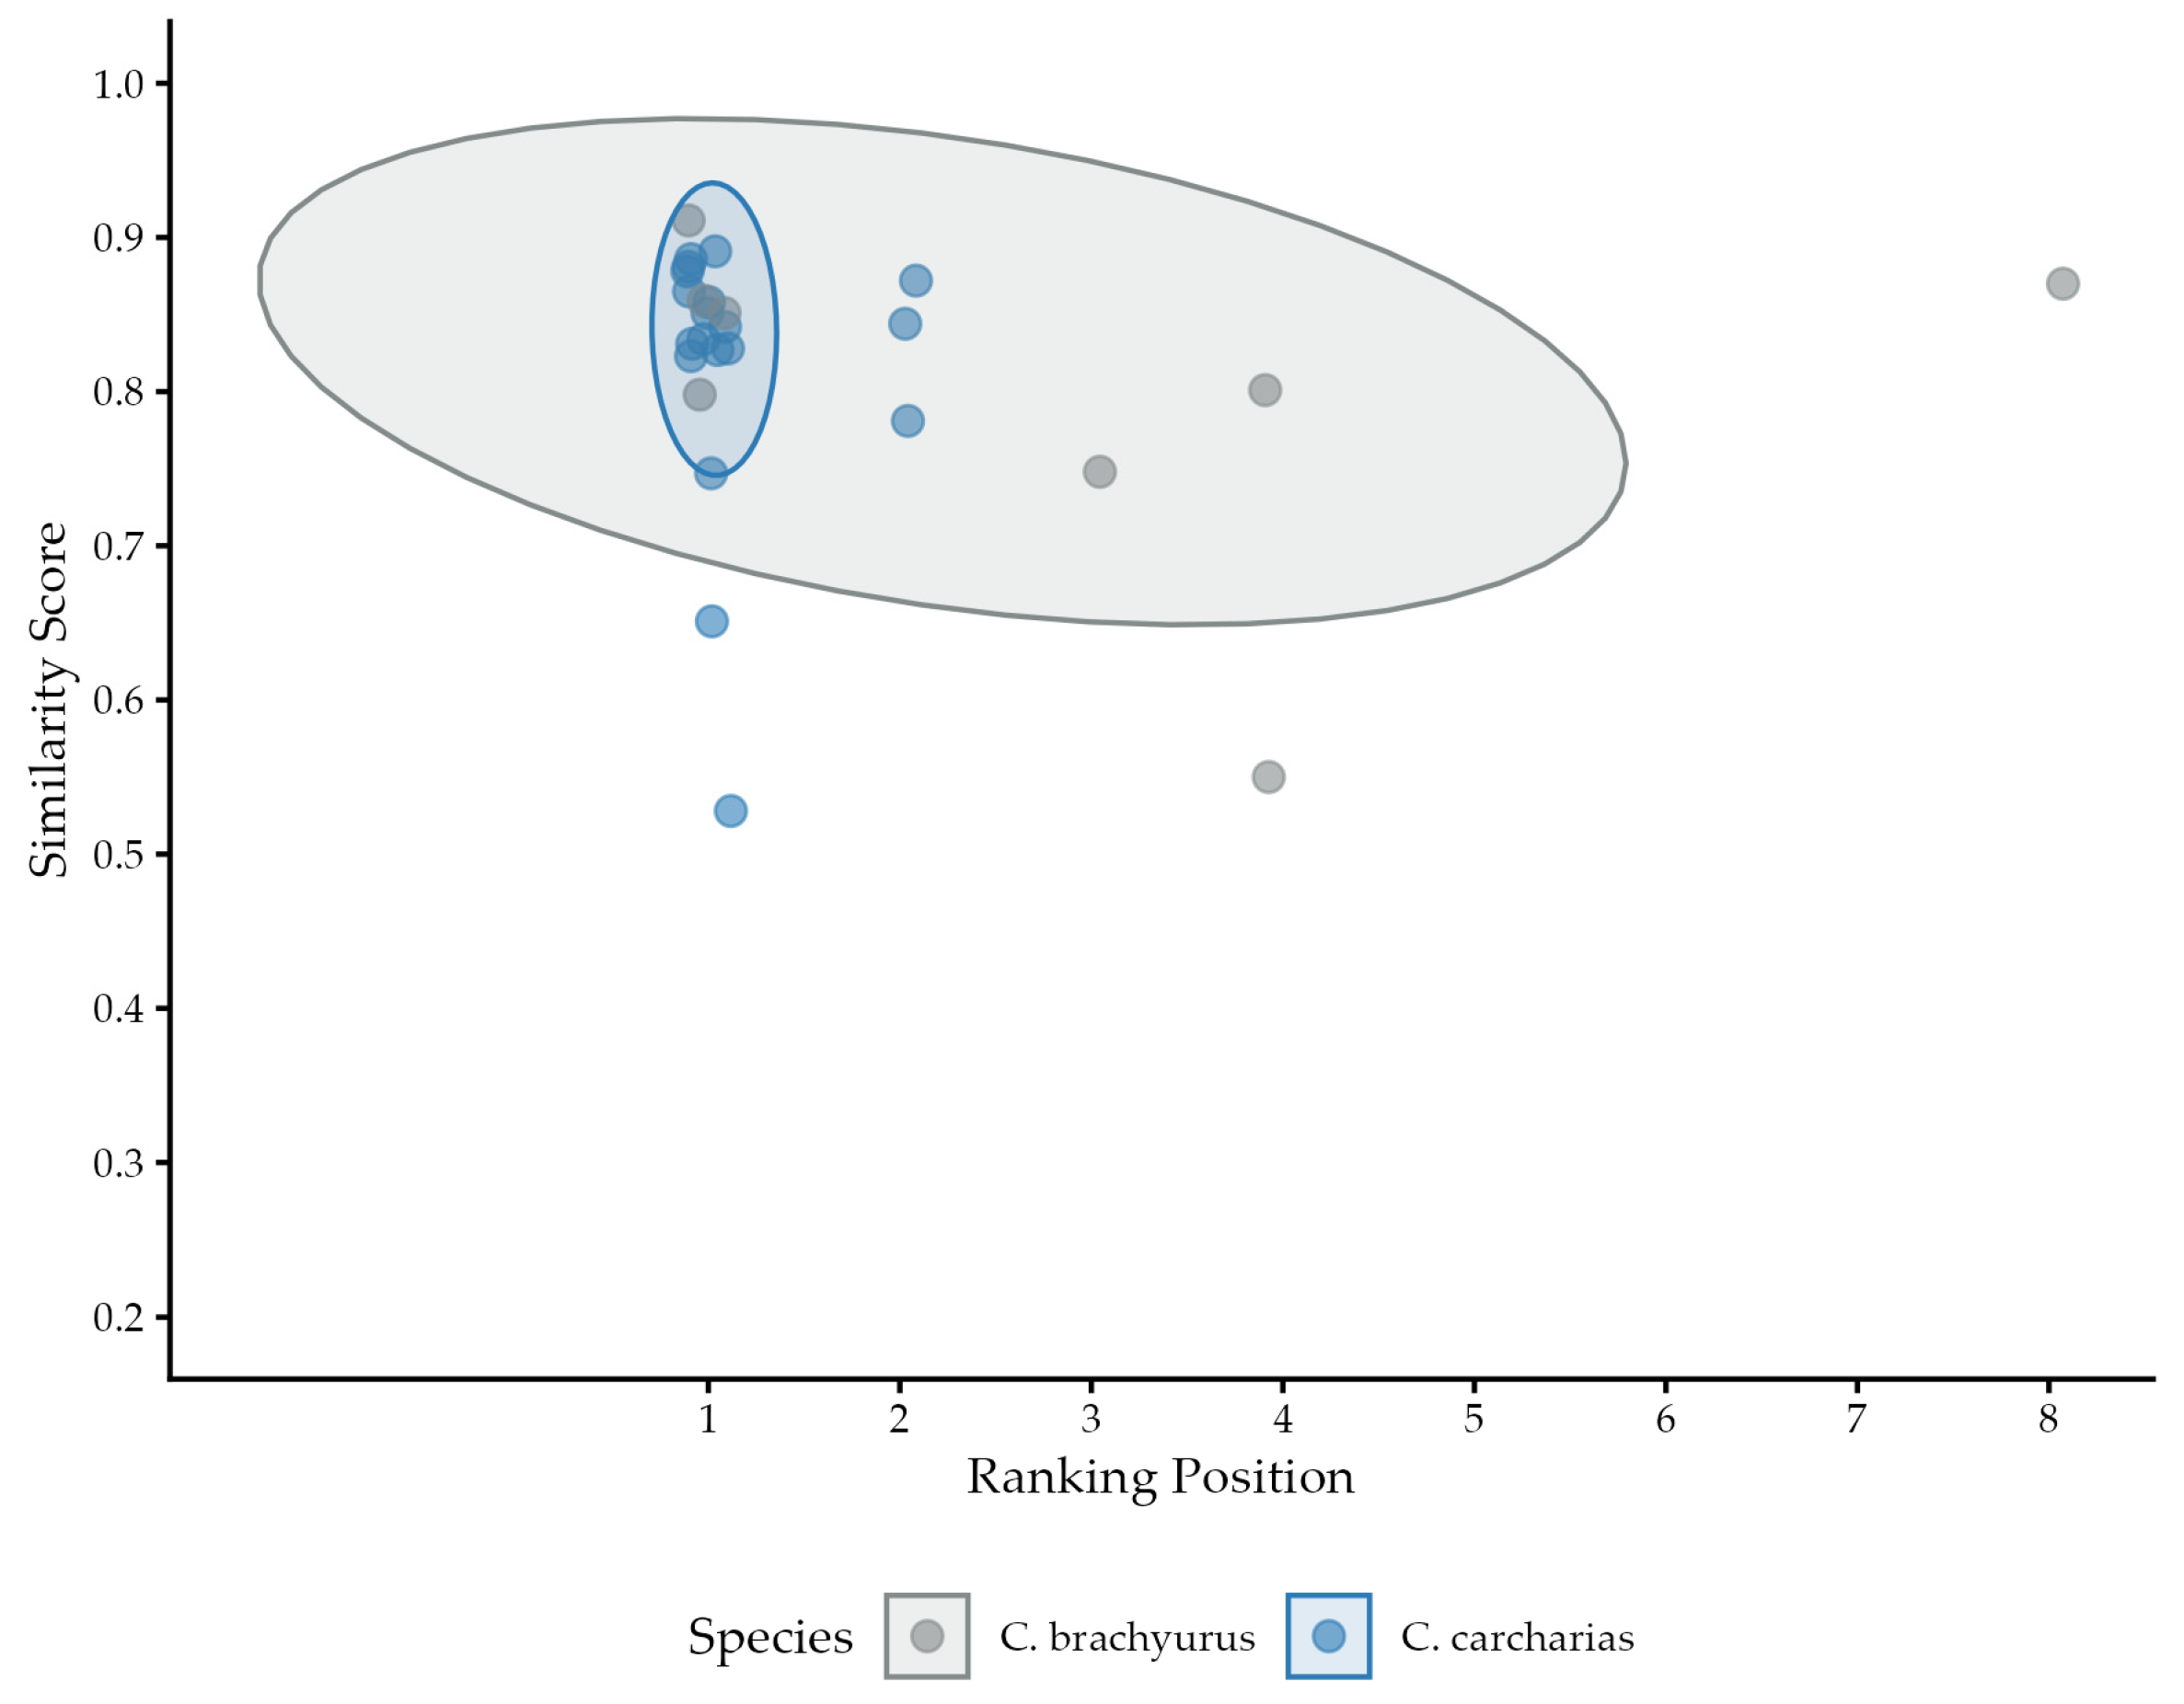
The bivariate analysis (Figure 9) shows the distribution of validated matches for both species. The scatter plot illustrates the relationship between similarity scores and ranking positions for validated matches, with jitter applied to visualize point density, and confidence ellipses highlight the central tendency of score–rank combinations without implying threshold-based performance. The 80% confidence ellipses for the white shark and the bronze whaler shark exhibit a high degree of spatial overlap on the plot, particularly centered on the first ranking coordinate. No correct matches for white shark were recorded beyond the fourth position of the ranking, whereas bronze whaler shark showed a wider dispersion, reaching tenth position in the ranking position.
Figure 9.
Bivariate distribution of IDENTIFIN output metrics for bronze whaler shark (Carcharhinus brachyurus; grey, temporal matches) and white shark (Carcharodon carcharias; blue, temporal matches and bilateral comparisons), with confidence ellipses.
4. Discussion
This exploratory study investigated the internal metrics of the Photo-ID protocol facilitated by IDENTIFIN in two large elasmobranch species, the bronze whaler shark and the white shark. The analysis emphasized the interpretation of metrics generated by the software during the image comparison process, with particular focus on similarity scores, rather than solely assessing overall software performance. This approach was explicitly designed to explore and evaluate the methodological hypotheses outlined in the Introduction, focusing on the potential transferability and interpretability of internal performance metrics across species. Comparison with previous studies corroborated observations reported by Maroen et al. [25], demonstrating that validated matches tend to appear among the top-ranked candidates proposed by the software, within a framework primarily based on ranking position. Unlike prior work [25], the present study focused not only on the position of the validated match within the candidate list but also on the quantitative interpretation of similarity values associated with validated matches. The identification software generates a similarity score for each candidate match, encompassing both temporal matches and bilateral comparisons, although these values are seldom explicitly treated as a metric. Similarity scores represent a quantitative output of the matching algorithm, indicating how similar two dorsal fin profiles are, functionally distinct from ranking position, which reflects the position of the correct match within the candidate list. Importantly, the present analysis does not aim to revalidate the IDENTIFIN software nor to assess its biological accuracy, but rather to explore the interpretative value of similarity scores as an internal metric supporting operator-based validation processes, in accordance with the hypothesis that similarity scores provide information under different conditions to ranking position rather than redundant or substitutive output. Analysis of the distribution of similarity scores associated with validated matches revealed that mean and median values were highly similar between the two species examined. IDENTIFIN yielded similarity scores with slightly lower mean and median values in the bronze whaler shark (respectively, 0.798 and 0.826) than in the white shark (respectively, 0.817 and 0.842). In both species, similarity scores for validated matches did not fall below 0.528, indicating a consistent lower bound of similarity associated with correct identifications within the analyzed datasets. These results suggest that similarity scores provide a potentially stable and interpretable quantitative reference within the IDENTIFIN workflow, independent of the ranking position and of the extent of manual intervention required by the operator. These findings did not reveal significant differences in the distributions of similarity scores between the datasets of the two species, although they are limited by sample size and data structure. Specifically, neither the Mann–Whitney U test (p = 0.75) nor the permutation test on the medians (p = 0.552) indicated statistically significant differences. Consistently, the estimated effect size (r = 0.066) was minimal, indicating that any differences between the similarity score distributions of the two species are quantitatively negligible. These results are in line with the hypothesis that similarity score distributions associated with validated matches do not differ significantly between bronze whaler shark and white shark datasets, supporting the potential methodological comparability of this metric. This suggests that, while limited sample size and reduced statistical power cannot be entirely excluded as contributing factors, the minimal estimated effect size may indicate that any difference between datasets is likely small and methodologically negligible. These parameters indicate that the observed difference lies well within the variability expected under the null hypothesis of no differences between groups. This meaning that the detected differences can be entirely explained by random variation supporting the conclusion that the level of similarity associated with validated matches is comparable within the methodological context examined. This comparability should be interpreted exclusively in methodological terms and does not imply biological equivalence or demographic similarity between taxa. Moving beyond univariate comparisons, the spatial overlap of the confidence ellipses observed in Figure 9 suggests a potential consistency in IDENTIFIN’s scoring logic when applied to different dorsal fin morphologies. This observation is purely descriptive and does not constitute a formal inferential test of equivalence or similarity between species, but rather an exploratory visualization of the joint behavior of the two metrics. Although the white shark dataset showed a higher frequency of the first rank position assignments compared to the bronze whaler shark dataset, the fact that the bivariate cores of both distributions occupy a similar metric space appears to indicate that the software’s prioritization mechanism operates consistently within the validated matches considered. However, the observed overlap does not imply equivalence between ranking position and similarity score, and the two metrics should be interpreted as functionally distinct dimensions of the identification process. These patterns confirm that ranking position alone does not fully capture match similarity, supporting the interpretation of similarity scores as a jointly informative, operator-guided metric that may assist validation decisions.
However, these observations must be interpreted with caution due to the relatively small and unbalanced sample sizes, which preclude a broader generalization of the software’s absolute robustness. The differences in ranking position accuracy between the two species (84.2% vs. 50.0% in the first rank position) might be influenced by factors such as image quality, database size, or specific morphological complexities of the bronze whaler shark fins, which require further investigation.
This preliminary analysis offers additional insights that complement the findings of Maroen et al. [25]. While their work established the general effectiveness of the software, our bivariate approach can provide an initial indication of how similarity scores may relate to ranking positions. Although higher similarity scores were generally associated with top-ranking positions, this relationship was not explicitly quantified in terms of time savings or operator effort in the present study. Therefore, any potential reduction in operator workload should be considered a plausible operational implication rather than a tested outcome. Nevertheless, integrating result rankings with similarity score analysis as two functionally distinct sources of information can offer a more systematic and reproducible framework for validating matches generated by the software, particularly in long-term monitoring studies with increasingly large datasets. This approach may aid researchers in structuring the manual validation process, though larger and more balanced datasets are needed to confirm these trends. Overall, the results of this study suggest that the similarity scores generated by IDENTIFIN can be interpreted not only as an intrinsic algorithmic parameter but also as an operationally complementary metric that supports the evaluation of semi-automated Photo-ID results.
Several methodological limitations of this study should be acknowledged. The dataset for the bronze whaler shark was relatively small, and sightings were unevenly distributed, which may have affected the results. In addition, manual verification of matches required by the software may introduce operator-dependent variability; future studies could address this limitation by incorporating inter-operator validation. The absence of an integrated system for managing metadata and distinguishing between species required the use of parallel databases, which could reduce efficiency in larger-scale applications. Nevertheless, the findings suggest that similarity scores may serve as a reliable and complementary operator-guided metric for semi-automated Photo-ID workflows, suggesting a possible applicability of IDENTIFIN to heterogeneous and unbalanced datasets and offering additional methodological insights relative to previous studies, provided they are interpreted in conjunction with, but not as a substitute for, ranking-based metrics.
5. Conclusions
In conclusion, this study revealed that the two evaluated metrics—similarity score and ranking position—can provide distinct and non-redundant information and can assist the operator in selecting the correct match for C. brachyurus and C. carcharias. Similarity scores reflect the quantitative output of the matching algorithm based on dorsal fin profiles, whereas ranking position represents the position of the correct match within the candidate list and, indirectly, the extent of manual inspection required. Taken together, these metrics could support the methodological hypotheses underlying this study, indicating that the IDENTIFIN protocol may be considered for exploratory methodological applications, from white shark to bronze whaler shark, despite interspecific differences in dorsal fin morphology. However, any inference of across-species transferability requires further confirmation using larger and more balanced datasets. IDENTIFIN can therefore be considered a useful tool within the evaluated methodological framework for managing large photographic archives, potentially reducing the number of manual comparisons required, and streamlining individual identification procedures. However, the software exhibits notable operational limitations that should be carefully considered when interpreting its outputs. Emphasizing that the final identification still relies on the manual verification by the operator, a step that cannot be fully substituted by either of the evaluated metrics and intrinsically introduces a subjective element into the process. In future studies, it will be necessary to formally evaluate the existence of an effective similarity score threshold indicative of high-quality correspondence. In the present study, such a threshold is only suggested, given the limited dataset size, the small number of validated matches, and the explicitly exploratory nature of the analyses. A robust definition of similarity score thresholds, supported by larger and more balanced datasets, would represent a critical step toward contributing to future assessments of the generalizability of IDENTIFIN across additional shark species and operational contexts. From an applied perspective, threshold-informed interpretation of similarity scores could further reduce operator workload by guiding visual validation more efficiently. Moreover, similarity scores are internal algorithm-dependent and should not be generalized across different Photo-ID software or interpreted as absolute measures of identification confidence. Metadata management also represents a key area for improvement. In this study, parallel databases were required as an external data management solution to organize resighting events and individual-specific attributes clearly, as IDENTIFIN currently lacks an internal system for distinguishing between species, necessitating the maintenance of separate databases. Future work could strengthen the robustness of analyses within a more standardized analytical framework by expanding photographic datasets, incorporating inter-operator validation, and implementing software enhancements [54], thereby allowing further evaluation of interspecific applicability and providing a more comprehensive evaluation of IDENTIFIN’s performance. From a conservation perspective, and in light of the ongoing decline of all elasmobranch species [55], the methodological insights provided in this study, in combination with previous research [6,10,25], should be regarded as a prospective contribution toward expanding the range of applicable and effective non-invasive, semi-automated photo-ID techniques for elasmobranchs. These approaches may also indirectly support non-invasive, long-term monitoring strategies for data-deficient species. A practical strategy for increasing the availability of individual-specific data for population studies may involve the use of photographs collected through shark cage-diving ecotourism along the South African coast, which can yield substantial quantities of usable material [46,47]. The acquisition of such data may be facilitated through the integration of structured scientific surveys with opportunistic photographic sources, which may represent a valuable source of longitudinal data when integrated within appropriate ethical and scientific frameworks [56,57]. Future research should aim to validate these methodological perspectives using large and more balanced datasets, further exploring how opportunistic photographs can be systematically incorporated into structured conservation monitoring programs. Collectively, these developments would allow IDENTIFIN’s similarity scores to be more rigorously embedded within individual-based monitoring frameworks and, in the longer term, could support population-level inference in conservation-oriented applications.
Author Contributions
Conceptualization, P.M., G.P. and F.R.R.; methodology, P.M. and G.P.; software, G.P.; validation, P.M., F.T., G.P. and F.R.R.; formal analysis, G.P. and A.P.; investigation, P.M., G.P. and F.R.R.; resources, P.M., G.P. and F.R.R.; data curation, P.M., G.P. and F.R.R.; writing—original draft preparation, G.P. and P.M.; writing—review and editing, G.P., P.M., F.R.R., F.T., F.E. and A.P.; supervision, P.M. All authors have read and agreed to the published version of the manuscript.
Funding
This research received no external funding.
Institutional Review Board Statement
Ethical review and approval were waived for this study by Sharks Studies Centre-Scientific Institute and Siena University. The study and experimentation protocols were reviewed and approved in accordance 166 with the Directive 2010/63/EU, and the ethical review and approval were waived for this study because it did not intervene in the observed animals.
Informed Consent Statement
Not applicable.
Data Availability Statement
Data will be available after publication on ResearchGate upon request to the authors.
Acknowledgments
We are grateful to the Sharks Studies Centre-Scientific Institute team members who carried out the expeditions for their indirect financial support of this research, and thanks are also due to the Marine Dynamics boat’s team, in particular Susy Jaegtvik Alexandersen, for logistical, field and sharks photos assistance, and for data collection.
Conflicts of Interest
The authors declare no conflicts of interest.
Appendix A
Table A1.
Dorsal fin photographs of bronze whaler shark (Carcharhinus brachyurus) individuals recognized by IDENTIFIN and validated across multiple sampling times.
Figure A1.
(A) Cumulative number of identified bronze whaler shark (Carcharhinus brachyurus) individuals over the study period; solid line indicates newly identified individuals, and dashed line indicates resighting events (temporal matches) detected by IDENTIFIN. (B) Cumulative number of identified white shark (Carcharodon carcharias) individuals over the study period; solid line indicates newly identified individuals, and dashed line indicates resighting events (temporal matches) detected by IDENTIFIN.
References
- Carbone, C.; Christie, S.; Conforti, K.; Coulson, T.; Franklin, N.; Ginsberg, J.; Griffiths, M.; Holden, J.; Kinnaird, M.; Laidlaw, R.; et al. The use of photographic rates to estimate densities of tigers and other cryptic mammals. Anim. Conserv. 2001, 4, 121–123. [Google Scholar] [CrossRef] [Scilit]
- Dudgeon, C.; Noad, M.; Lanyon, J. Abundance and demography of a seasonal aggregation of zebra sharks Stegostoma fasciatum. Mar. Ecol. Prog. Ser. 2008, 368, 269–281. [Google Scholar] [CrossRef] [Scilit]
- Langtimm, C.A.; Beck, C.A.; Edwards, H.H.; Fick-Child, K.J.; Ackerman, B.B.; Barton, S.L.; Hartley, W.C. Survival estimates for Florida manatees from the photo-identification of individuals. Mar. Mamm. Sci. 2004, 20, 438–463. [Google Scholar] [CrossRef] [Scilit]
- Bolger, D.T.; Morrison, T.A.; Vance, B.; Lee, D.; Farid, H. A computer-assisted system for photographic mark–recapture analysis. Methods Ecol. Evol. 2012, 3, 813–822. [Google Scholar] [CrossRef] [Scilit]
- Chapple, T.K.; Jorgensen, S.J.; Anderson, S.D.; Kanive, P.E.; Klimley, A.P.; Botsford, L.W.; Block, B.A. A first estimate of white shark, Carcharodon carcharias, abundance off central California. Biol. Lett. 2011, 7, 581–583. [Google Scholar] [CrossRef] [Scilit] [PubMed]
- Bonfil, R.; Meÿer, M.; Scholl, M.C.; Johnson, R.; O’Brien, S.; Oosthuizen, H.; Swanson, S.; Kotze, D.; Paterson, M. Transoceanic migration, spatial dynamics, and population linkages of white sharks. Science 2005, 310, 100–103. [Google Scholar] [CrossRef] [Scilit] [PubMed]
- Marshall, A.D.; Pierce, S.J. Use and abuse of photographic identification in sharks and rays. J. Fish Biol. 2012, 80, 1361–1379. [Google Scholar] [CrossRef] [Scilit] [PubMed]
- Speed, C.W.; Meekan, M.G.; Bradshaw, C.J. Spot the match—Wildlife photo-identification using information theory. Front. Zool. 2007, 4, 2. [Google Scholar] [CrossRef] [Scilit] [PubMed]
- Marley, S.A.; McConnell, L.; Allen, C.; Wettner, S.; Hunt, T.; Rocha, D.; Gullan, A. Dolphins, sharks, and barnacles: Use of photographs to examine intra- and inter-specific interactions in bottlenose dolphins in Mozambique. Ecol. Evol. 2024, 14, e11691. [Google Scholar] [CrossRef] [Scilit] [PubMed]
- Vossgaetter, L.; Dudeck, T.; Crouch, J.; Cope, M.; Ivanova, T.; Siyan, I.; Riyaz, M.; Araujo, G. Non-invasive methods characterise the world’s largest tiger shark aggregation in Fuvahmulah, Maldives. Sci. Rep. 2024, 14, 21998. [Google Scholar] [CrossRef] [Scilit] [PubMed]
- Stevick, P.T.; Palsbøll, P.J.; Smith, T.D.; Bravington, M.V.; Hammond, P.S. Errors in identification using natural markings: Rates, sources, and effects on capture-recapture estimates of abundance. Can. J. Fish. Aquat. Sci. 2001, 58, 1861–1870. [Google Scholar] [CrossRef] [Scilit]
- Würsig, B.; Jefferson, T.A. Methods of photo-identification for small cetaceans. Rep. Int. Whal. Comm. 1990, 12, 43–52. [Google Scholar]
- Lionnet, L.A.; Debaere, S.F.; Heuls, H.; Mourier, J.; Planes, S.; Rummer, J.L. A blacktip’s black tip: The reliability of using dorsal-fin patterns for photo identification of blacktip reef sharks (Carcharhinus melanopterus). J. Fish Biol. 2025, 107, 1224–1236. [Google Scholar] [CrossRef] [Scilit] [PubMed]
- Dunbar, S.G.; Anger, E.C.; Parham, J.R.; Kingen, C.; Wright, M.K.; Hayes, C.T.; Safi, S.; Holmberg, J.; Salinas, L.; Baumbach, D.S. HotSpotter: Using a computer-driven photo-id application to identify sea turtles. J. Exp. Mar. Biol. Ecol. 2021, 535, 151490. [Google Scholar] [CrossRef] [Scilit]
- Langley, I.; Hague, E.; Civil, M.A. Assessing the performance of open-source, semi-automated pattern recognition software for harbour seal (P. v. vitulina) photo ID. Mamm. Biol. 2022, 102, 973–982. [Google Scholar] [CrossRef] [Scilit]
- Anderson, S.D.; Chapple, T.K.; Jorgensen, S.J.; Klimley, A.P.; Block, B.A. Long-term individual identification and site fidelity of white sharks, Carcharodon carcharias, off California using dorsal fins. Mar. Biol. 2011, 158, 1233–1237. [Google Scholar] [CrossRef] [Scilit] [PubMed]
- Schofield, G.; Katselidis, K.A.; Dimopoulos, P.; Pantis, J.D. Investigating the viability of photo-identification as an objective tool to study endangered sea turtle populations. J. Exp. Mar. Biol. Ecol. 2008, 360, 103–108. [Google Scholar] [CrossRef] [Scilit]
- Gauthier-Clerc, M.; Gendner, J.; Ribic, C.; Fraser, W.; Woehler, E.; Descamps, S.; Gilly, C.; Le Bohec, C.; Le Maho, Y. Long-Term effects of flipper bands on penguins. Proc. R. Soc. B 2005, 271, S423–S426. [Google Scholar] [CrossRef] [Scilit] [PubMed]
- Wilson, R.; McMahon, C. Measuring Devices on Wild Animals: What constitutes acceptable practice? Front. Ecol. Environ. 2006, 4, 147–154. [Google Scholar] [CrossRef] [Scilit]
- Jorgensen, S.J.; Micheli, F.; White, T.D.; Houtan, K.S.V.; Alfaro-Shigueto, J.; Andrzejaczek, S.; Arnoldi, N.S.; Baum, J.K.; Block, B.; Britten, G.L.; et al. Emergent research and priorities for shark and ray conservation. Endanger. Species Res. 2022, 47, 171–203. [Google Scholar] [CrossRef] [Scilit]
- Hammerschlag, N.; Herskowitz, Y.; Fallows, C.; Couto, T. Evidence of cascading ecosystem effects following the loss of white sharks from False Bay, South Africa. Front. Mar. Sci. 2025, 12, 1530362. [Google Scholar] [CrossRef] [Scilit]
- Bascompte, J.; Melián, C.J.; Sala, E. Interaction strength combinations and the overfishing of a marine food web. Proc. Natl. Acad. Sci. USA 2005, 102, 5443–5447. [Google Scholar] [CrossRef] [Scilit] [PubMed]
- Myers, R.A.; Baum, J.K.; Shepherd, T.D.; Powers, S.P.; Peterson, C.H. Cascading Effects of the loss of apex predatory sharks from a coastal ocean. Science 2007, 315, 1846–1850. [Google Scholar] [CrossRef] [Scilit] [PubMed]
- Lucifora, L.O.; García, V.B.; Menni, R.C.; Escalante, A.H.; Hozbor, N.M. Effects of body size, age and maturity stage on diet in a large shark: Ecological and applied implications. Ecol. Res. 2009, 24, 109–118. [Google Scholar] [CrossRef] [Scilit]
- Maroen, M.; Rowlinson, M.; Matthee, C.; Andreotti, S. The Effectiveness of the semi-automated Identifin software to accurately fast-track dorsal fin photographic identifications of sharks. Aquat. Conserv. Mar. Freshw. Ecosyst. 2024, 34, e4159. [Google Scholar] [CrossRef] [Scilit]
- Andreotti, S.; Holtzhausen, P.; Rutzen, M.; Meÿer, M.; Van der Walt, S.; Herbst, B.; Matthee, C.A. Semi-automated software for dorsal fin photographic identification of marine species: Application to Carcharodon carcharias. Mar. Biodivers. 2018, 48, 1655–1660. [Google Scholar] [CrossRef] [Scilit]
- Mourier, J. Underwater photo-identification of sicklefin lemon sharks, Negaprion acutidens, at Moorea (French Polynesia). Cybium 2009, 33, 21–27. [Google Scholar]
- Gubili, C.; Johnson, R.; Gennari, E.; Oosthuizen, W.; Kotze, D.; Meÿer, M.; Sims, D.; Jones, C.; Noble, L. Concordance of genetic and fin photo identification in the great white shark, Carcharodon carcharias, off Mossel Bay, South Africa. Mar. Biol. 2009, 156, 2199–2207. [Google Scholar] [CrossRef] [Scilit]
- Cheeseman, T.; Southerland, K.; Park, J.; Olio, M.; Flynn, K.; Calambokidis, J.; Jones, L.; Garrigue, C.; Frisch Jordán, A.; Howard, A.; et al. Advanced image recognition: A fully automated, high-accuracy photo-identification matching system for humpback whales. Mamm. Biol. 2022, 102, 915–929. [Google Scholar] [CrossRef] [Scilit]
- Gore, M.A.; Frey, P.H.; Ormond, R.F.; Allan, H.; Gilkes, G. Use of photo-identification and mark-recapture methodology to assess basking shark (Cetorhinus maximus) populations. PLoS ONE 2016, 11, e0150160. [Google Scholar] [CrossRef] [Scilit] [PubMed]
- Reinero, F.R.; Pireddu, M.; Ridella, G.; Valenti, L.; Pacifico, A.; Ellero, F.; Micarelli, P. Baited-associated aggregation of spinner sharks in Hulhumale, Maldives: Preliminary observations and photo-identification tools. Oceans 2026, 7, 22. [Google Scholar] [CrossRef] [Scilit]
- Micarelli, P.; Pireddu, M.; Persia, D.; Sanna, M.; Vicariotto, C.; Pacifico, A.; Storelli, P.; Mahrer, M.; Venanzi, E.E.; Reinero, F.R. Observations on an aggregation of grey reef sharks (Carcharhinus amblyrhynchos) in the Mozambique Channel off the coast of Nosy Be (Madagascar) and tools for photo-identification—A new aggregation nursery site? Biology 2024, 13, 661. [Google Scholar] [CrossRef] [Scilit] [PubMed]
- Arzoumanian, Z.; Holmberg, J.; Norman, B. An astronomical pattern-matching algorithm for computer-aided identification of whale sharks Rhincodon typus. J. Appl. Ecol. 2005, 42, 999–1011. [Google Scholar] [CrossRef] [Scilit]
- Van Tienhoven, A.M.; Den Hartog, J.E.; Reijns, R.A.; Peddemors, V.M. A computer-aided program for pattern-matching of natural marks on the spotted raggedtooth shark Carcharias taurus. J. Appl. Ecol. 2007, 44, 273–280. [Google Scholar] [CrossRef] [Scilit]
- Huveneers, C.; Rigby, C.L.; Dicken, M.; Pacoureau, N.; Derrick, D. Carcharhinus brachyurus. The IUCN Red List of Threatened Species 2020: e.T41741A2954522. Available online: https://www.iucnredlist.org/species/41741/2954522 (accessed on 2 March 2026).
- Rigby, C.L.; Barreto, R.; Carlson, J.; Fernando, D.; Fordham, S.; Francis, M.P.; Herman, K.; Jabado, R.W.; Jones, G.C.A.; Liu, K.M.; et al. Carcharodon carcharias (amended version of 2019 assessment). The IUCN Red List of Threatened Species 2022: e.T3855A212629880. Available online: https://www.iucnredlist.org/species/3855/212629880 (accessed on 2 March 2026).
- Bruce, B.D.; Stevens, J.D.; Malcolm, H. Movements and swimming behaviour of white sharks (Carcharodon carcharias) in Australian waters. Mar. Biol. 2006, 150, 161–172. [Google Scholar] [CrossRef] [Scilit]
- Gibbs, L.; Fetterplace, L.; Rees, M.; Hanich, Q. Effects and effectiveness of lethal shark hazard management: The shark meshing (bather protection) program, NSW, Australia. People Nat. 2020, 2, 189–203. [Google Scholar] [CrossRef] [Scilit]
- Dudley, S.F.J.; Simpfendorfer, C.A. Population status of 14 shark species caught in the protective gillnets off KwaZulu–Natal beaches, South Africa, 1978–2003. Mar. Freshw. Res. 2006, 57, 225–240. [Google Scholar] [CrossRef] [Scilit]
- Griffiths, C.L.; Robinson, T.B.; Lange, L.; Mead, A. Marine biodiversity in South Africa: An evaluation of current states of knowledge. PLoS ONE 2010, 5, e12008. [Google Scholar] [CrossRef] [Scilit] [PubMed]
- Micarelli, P.; Bonsignori, D.; Compagno, L.J.V.; Pacifico, A.; Romano, C.; Reinero, F.R. Analysis of sightings of white sharks in Gansbaai (South Africa). Eur. Zool. J. 2021, 88, 363–374. [Google Scholar] [CrossRef] [Scilit]
- Majumder, S.; Schmid, C. A study of the variability in the Benguela Current volume transport. Ocean Sci. 2018, 14, 273–283. [Google Scholar] [CrossRef] [Scilit]
- Potts, W.M.; Götz, A.; James, N. Review of the projected impacts of climate change on coastal fishes in Southern Africa. Rev. Fish Biol. Fish. 2015, 25, 603–630. [Google Scholar] [CrossRef] [Scilit]
- Smit, A.J.; Roberts, M.; Anderson, R.J.; Dufois, F.; Dudley, S.F.J.; Bornman, T.G.; Olbers, J.; Bolton, J.J. A coastal seawater temperature dataset for biogeographical studies: Large biases between in situ and remotely sensed data sets around the coast of South Africa. PLoS ONE 2013, 8, e81944. [Google Scholar] [CrossRef] [Scilit] [PubMed]
- Hewitt, A.; Kock, A.; Booth, A.; Griffiths, C. Trends in sightings and population structure of white sharks, Carcharodon Carcharias, at Seal Island, False Bay, South Africa, and the emigration of subadult female sharks approaching maturity. Environ. Biol. Fishes 2018, 101, 39–54. [Google Scholar] [CrossRef] [Scilit]
- Johnson, R.; Kock, A. South Africa’s white shark cage-diving industry—Is there cause for concern? In Finding a Balance: White Shark Conservation and Recreational Safety in the Inshore Waters of Cape Town, South Africa; Nel, D.C., Peschak, T.P., Eds.; WWF Sanlam Marine Programme: Cape Town, South Africa, 2006; pp. 40–59. [Google Scholar]
- Laroche, R.K.; Kock, A.A.; Dill, L.M.; Oosthuizen, W.H. Effects of provisioning ecotourism activity on the behaviour of white sharks Carcharodon carcharias. Mar. Ecol. Prog. Ser. 2007, 338, 199–209. [Google Scholar] [CrossRef] [Scilit]
- Sperone, E.; Micarelli, P.; Andreotti, S.; Spinetti, S.; Andreani, A.; Serena, F.; Brunelli, E.; Tripepi, S. Social interactions among bait-attracted white sharks at Dyer Island (South Africa). Mar. Biol. Res. 2010, 6, 408–414. [Google Scholar] [CrossRef] [Scilit]
- Towner, A.; Micarelli, P.; Hurwitz, D.; Smale, M.; Booth, A.; Stopforth, C.; Jacobs, E.; Reinero, F.; Ricci, V.; Di Bari, A.; et al. Further Insights into Killer Whales Orcinus orca Preying on White Sharks Carcharodon carcharias in South Africa. Afr. J. Mar. Sci. 2024, 46, 1–5. [Google Scholar] [CrossRef] [Scilit]
- Andreotti, S.; Rutzen, M.; Wesche, P.L.; O’Connell, C.P.; Meÿer, M.; Oosthuizen, H.; Matthee, C.A. A novel categorisation system to organise a large photo identification database for white sharks Carcharodon carcharias. Afr. J. Mar. Sci. 2014, 36, 59–67. [Google Scholar] [CrossRef] [Scilit]
- Shapiro, S.S.; Wilk, M.B. An analysis of variance test for normality (complete samples). Biometrika 1965, 52, 591–611. [Google Scholar] [CrossRef] [Scilit]
- Mann, H.B.; Whitney, D.R. On a test of whether one of two random variables is stochastically larger than the other. Ann. Math. Stat. 1947, 18, 50–60. [Google Scholar] [CrossRef] [Scilit]
- Fritz, C.O.; Morris, P.E.; Richler, J.J. Effect size estimates: Current use, calculations, and interpretation. J. Exp. Psychol. Gen. 2012, 141, 2–18. [Google Scholar] [CrossRef] [Scilit] [PubMed]
- Lonati, M.; Jahanbakht, M.; Atkins, D.; Bierwagen, S.L.; Chin, A.; Barnett, A.; Rummer, J.L. Novel use of deep neural networks on photographic identification of epaulette sharks (Hemiscyllium ocellatum) across life stages. J. Fish Biol. 2024, 105, 1572–1587. [Google Scholar] [CrossRef] [Scilit] [PubMed]
- Pacoureau, N.; Rigby, C.L.; Kyne, P.M.; Sherley, R.B.; Winker, H.; Carlson, J.K.; Fordham, S.V.; Barreto, R.; Fernando, D.; Francis, M.P.; et al. Half a century of global decline in oceanic sharks and rays. Nature 2021, 589, 567–571. [Google Scholar] [CrossRef] [Scilit] [PubMed]
- Cisneros-Montemayor, A.M.; Barnes-Mauthe, M.; Al-Abdulrazzak, D.; Navarro-Holm, E.; Sumaila, U.R. Global economic value of shark ecotourism: Implications for conservation. Oryx 2013, 47, 381–388. [Google Scholar] [CrossRef] [Scilit]
- Bierwirth, J.; Vignaud, T.; Séguigne, C.; Clua, E. Opportunities for science in touristic shark feeding aggregations—A review. Glob. Ecol. Conserv. 2025, 62, e03690. [Google Scholar] [CrossRef] [Scilit]

Disclaimer/Publisher’s Note: The statements, opinions and data contained in all publications are solely those of the individual author(s) and contributor(s) and not of MDPI and/or the editor(s). MDPI and/or the editor(s) disclaim responsibility for any injury to people or property resulting from any ideas, methods, instructions or products referred to in the content. |
© 2026 by the authors. Licensee MDPI, Basel, Switzerland. This article is an open access article distributed under the terms and conditions of the Creative Commons Attribution (CC BY) license.