


Abstract
Controlled ovarian stimulation (COS) is a key component of assisted reproductive technology (ART), yet its systemic and reproductive effects remain incompletely understood. We investigated redox status, fibrinogen functional properties, vaginal microbiome (VM) remodelling, and pregnancy outcomes in 23 women undergoing ART, including 13 women sampled before and after COS, and 25 age-matched healthy controls (HC). Plasma lipid peroxidation and antioxidant capacity, intracellular reactive oxygen species and glutathione, fibrinogen oxidation, polymerization and clot lysis, and VM composition by 16S rRNA gene sequencing were assessed. At baseline, women undergoing ART showed increased oxidative stress and altered fibrinogen functional properties relative to healthy controls, including increased resistance to plasmin-mediated fibrin degradation. In the paired cohort, total antioxidant capacity was lower at T1, whereas most cellular redox and fibrinogen functional measures did not show statistically significant paired differences between T0 and T1. VM composition differed between the pre-stimulation and peri-ovulatory sampling points, with lower relative abundance of Lactobacillus and differences in selected taxa and predicted functional pathways. Because T0 and T1 differed in menstrual-cycle phase and peri-ovulatory conditions and no longitudinal infertile non-COS control group was available, these temporal differences cannot be attributed specifically to COS. Pregnancy-related and microbiome–redox analyses were exploratory. Overall, the study provides a descriptive integrated profile of redox status, fibrinogen function and VM composition in women undergoing ART, but does not establish causal relationships among these domains or with reproductive outcome.
1. Introduction
Infertility is defined by the American Society for Reproductive Medicine (ASRM) as the inability to conceive after 12 months of regular unprotected intercourse in women younger than 35 years, or after 6 months in women aged 35 years or older. Infertility affects approximately 10–12% of couples worldwide and may arise from male and/or female factors, combined etiologies, or remain idiopathic in 10–15% of cases [1].
Female infertility encompasses a wide spectrum of causes, including ovulatory disorders, anatomical abnormalities of the reproductive tract, endometriosis, and age-related decline in ovarian reserve [2]. Controlled ovarian stimulation (COS) is a cornerstone of Assisted Reproductive Technology (ART), enabling multifollicular development and improving pregnancy rates. COS protocols are individualized based on ovarian reserve markers, mainly antral follicle count (AFC) and serum anti-Müllerian hormone (AMH) levels, and employ gonadotropins in combination with gonadotropin-releasing hormone (GnRH) analogues to prevent premature luteinizing hormone surges. According to ovarian response, women undergoing COS are classified as poor, normal, or high responders, with relevant implications for treatment outcomes and risks such as ovarian hyperstimulation syndrome (OHSS).
In addition to its well-known endocrine effects, hormonal stimulation has been associated with an increased risk of thromboembolic events, especially in high responders and in women who develop OHSS [3,4,5]. ART-related hormonal exposure may induce a pro-coagulant state characterized by hemoconcentration, endothelial activation, and altered fibrinolysis [6]. The molecular mechanisms responsible for this increased thrombotic risk remain poorly understood; however, growing evidence suggests that systemic inflammation and oxidative stress may contribute to coagulation abnormalities during and after COS [7,8,9,10].
Oxidative stress arises from an imbalance between reactive oxygen species (ROS) production and antioxidant defence systems, resulting in cellular and molecular damage. While physiological ROS levels are essential for folliculogenesis, ovulation, and embryo development, excessive ROS generation may impair oocyte quality, endometrial receptivity, and implantation potential [7,8,9,10]. Furthermore, oxidative stress has been implicated in the pathogenesis of several reproductive disorders and may be exacerbated during COS due to enhanced ovarian metabolic activity and systemic inflammatory responses [10].
Among circulating proteins, fibrinogen is particularly susceptible to oxidative modifications [11]. Oxidation-induced structural changes may alter fibrin polymerization, clot architecture, and fibrinolytic susceptibility, finally promoting the formation of denser and more thrombogenic fibrin networks [12,13]. These alterations may contribute not only to the increased thromboembolic risk observed during ART but also to subtle disturbances in endometrial and placental microcirculation, potentially affecting embryo implantation and pregnancy establishment [14]. Consequently, the evaluation of fibrinogen functional properties may provide novel and critical insights into the relationship between oxidative stress, coagulation dynamics, and reproductive outcomes.
In parallel, growing attention has been directed toward the role of the female reproductive tract microbiome in fertility [15]. In healthy reproductive-age women, the vaginal microbiome (VM) is typically dominated by Lactobacillus species, which contribute to mucosal homeostasis, pathogen exclusion, and immune regulation [16,17]. Conversely, microbial dysbiosis has been associated with local inflammation, impaired endometrial receptivity, and diminished implantation rates [18,19,20]. Although several studies suggest that microbiome composition may influence ART success [21], current evidence remains limited and conflicting, and the underlying mechanisms are not fully elucidated.
These biological domains may potentially be influenced by partially overlapping processes occurring during ART. Oxidative stress can induce structural and functional modifications of fibrinogen, affecting fibrin network formation and susceptibility to fibrinolysis, while the hormonal and inflammatory changes associated with ovarian stimulation may also influence the vaginal microbial environment. Investigating these domains together may therefore provide a broader picture of the biological changes accompanying COS. However, their integrated assessment is exploratory and does not imply the existence of a direct or causal microbiome–redox–fibrinogen pathway.
Despite the potential biological interconnections, previous studies have predominantly investigated oxidative stress, hemostatic alterations, or reproductive-tract microbiota separately. Consequently, the concurrent assessment of systemic redox markers, fibrinogen function, and vaginal microbiome composition across the same ART interval remains poorly characterized. Furthermore, the absence of longitudinal infertile non-stimulated control groups in this setting limits the ability to distinguish treatment-related changes from those potentially associated with menstrual-cycle fluctuations and peri-ovulatory effects.
Based on this rationale, the present study addressed two main descriptive questions: (i) whether women undergoing ART differed from healthy women at baseline (T0) in terms of systemic redox status and fibrinogen functional properties; and (ii) whether redox markers, fibrinogen functional parameters, and VM composition changed between the pre-stimulation (T0) and peri-ovulatory (T1) time points within the ART cohort. In addition, comparisons according to subsequent pregnancy outcome and exploratory analyses of microbiome–redox correlations were performed to identify potential associations among these biological features. Overall, the study aimed to provide an integrated exploratory characterization of systemic and reproductive-tract changes during COS, without assuming causal relationships among the investigated parameters.
2. Results
2.1. Plasma Oxidative Stress Profile
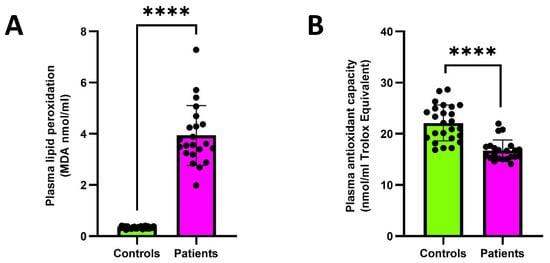
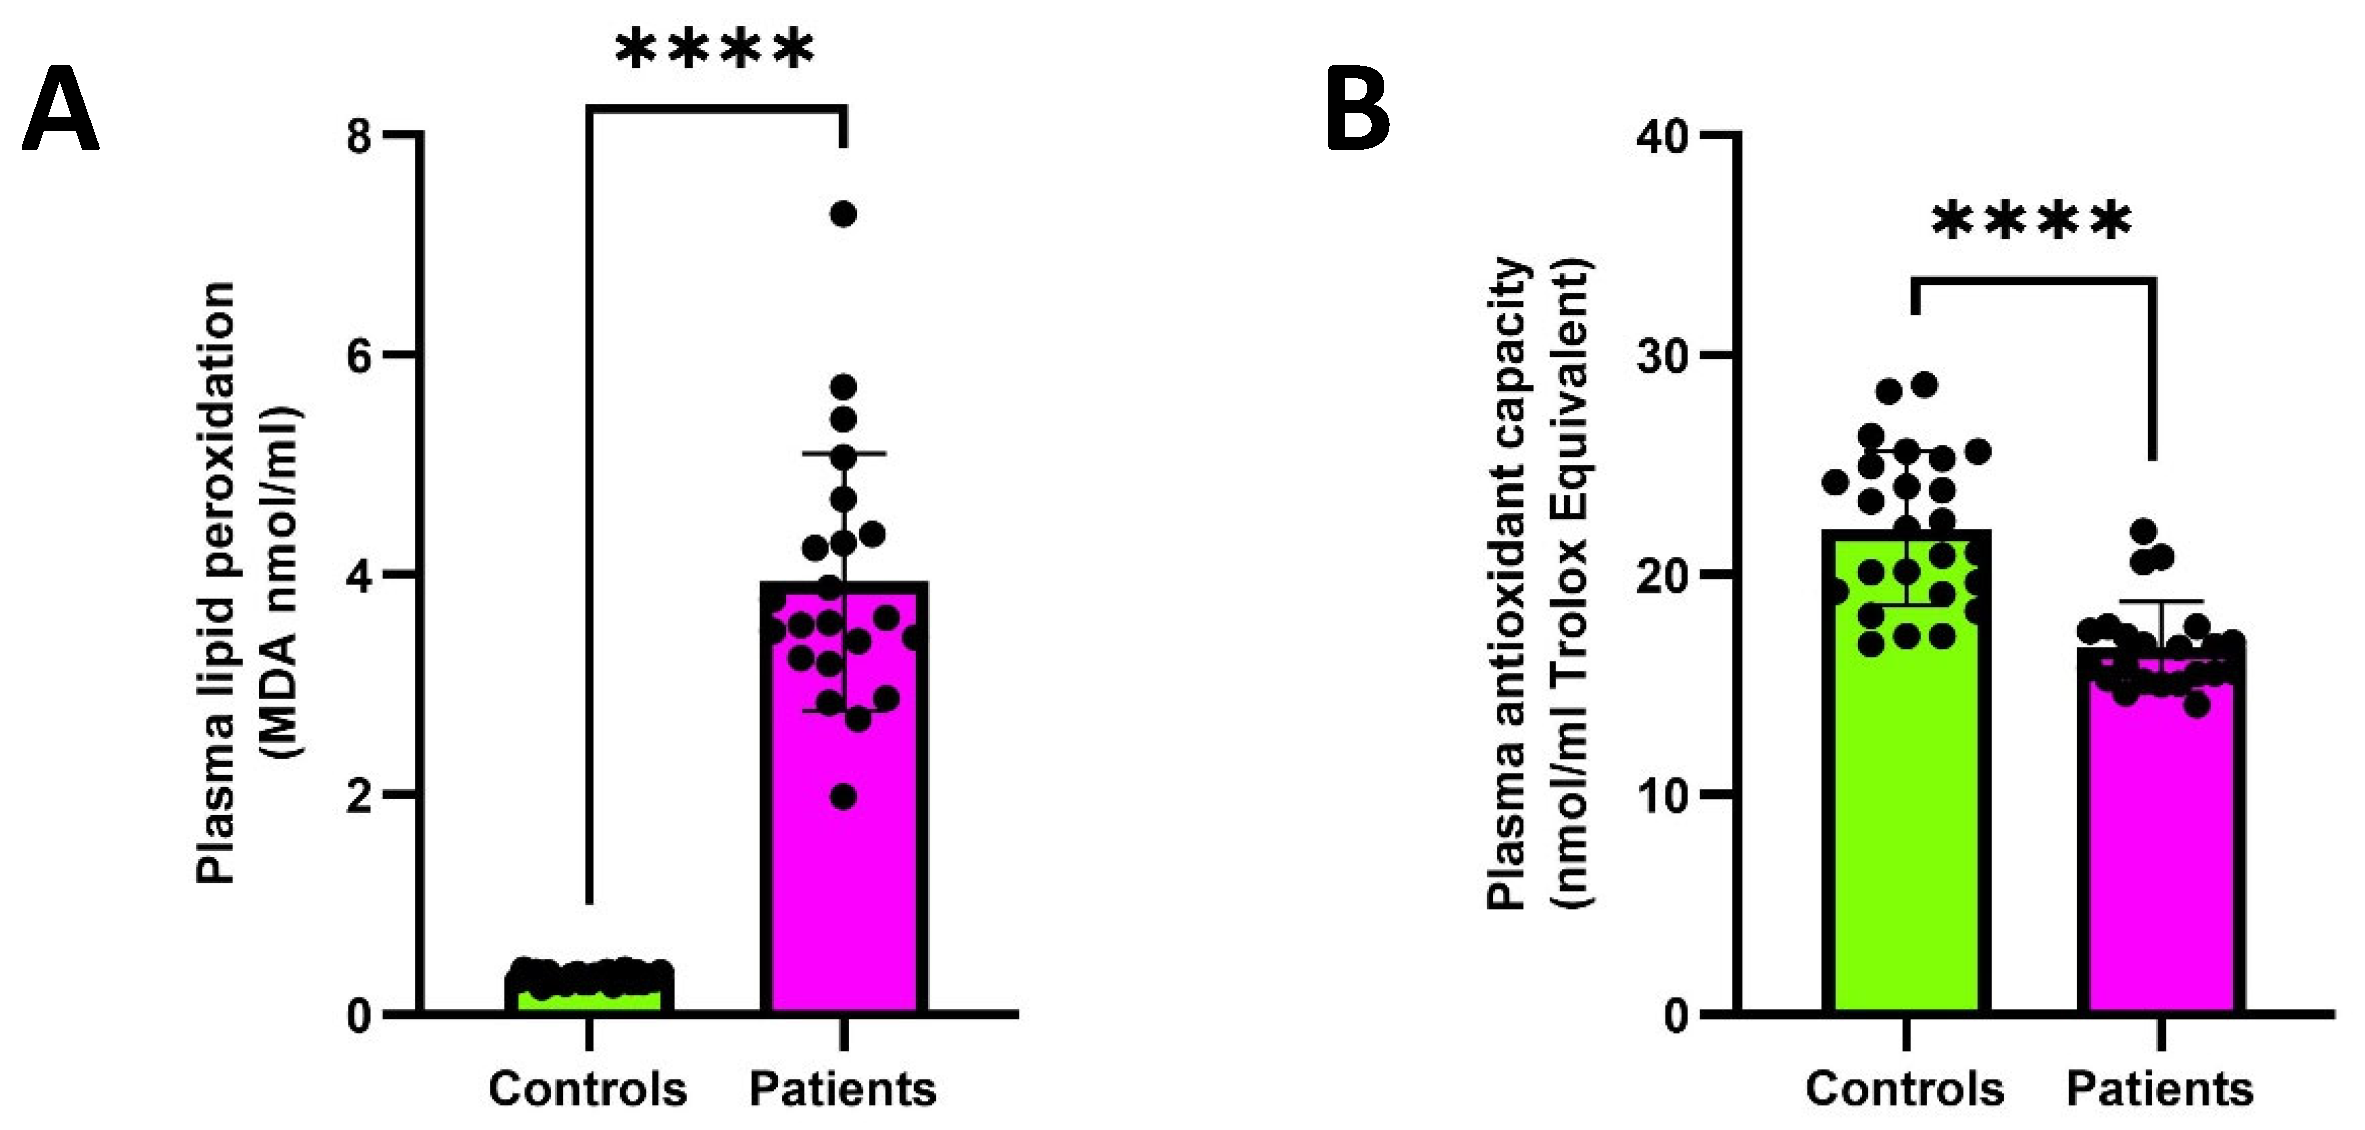
Systemic redox status was evaluated by assessing plasma lipid peroxidation and total antioxidant capacity in patients (n = 23) and healthy subjects (n = 25). Compared with controls, patients exhibited significantly increased plasma lipid peroxidation [3.59 (IQR 3.23–4.45) vs. 0.35 (IQR 0.30–0.38) MDA nmol/mL], indicating enhanced oxidative damage to circulating lipids (Figure 1A). In parallel, plasma total antioxidant capacity was markedly decreased [16.28 (IQR 15.24–17.50) vs. 22.11 (IQR 19.18–25.13) nmol/mL Trolox equivalent], mirroring an impaired systemic antioxidant defence (Figure 1B).
Figure 1.
Plasma lipid peroxidation and total antioxidant capacity in patients (n = 23) and healthy controls (n = 25). (A) Plasma lipid peroxidation assessed by malondialdehyde (MDA) levels (nmol/mL). (B) Plasma total antioxidant capacity measured by oxygen radical absorbance capacity (ORAC; nmol/mL Trolox equivalents). Data are presented as median (IQR). Individual dots represent single subjects. Controls: healthy subjects; Patients: patients before COS (T0); **** p < 0.0001.
2.2. Intracellular Oxidative Status and Glutathione Levels in Leukocytes and Red Blood Cells
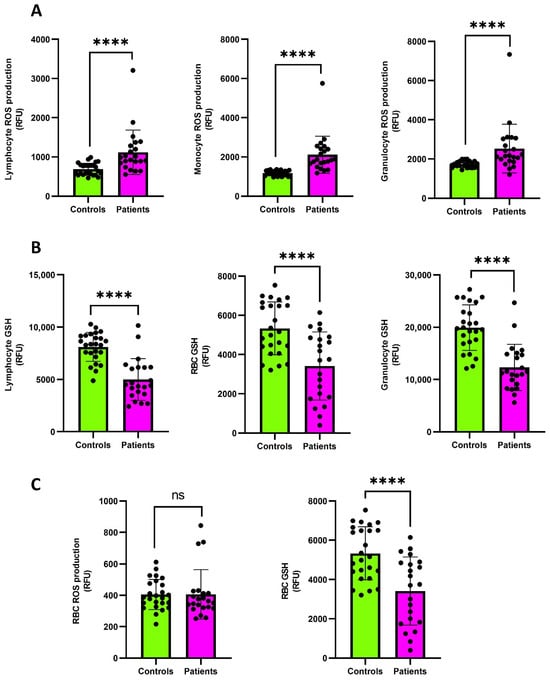
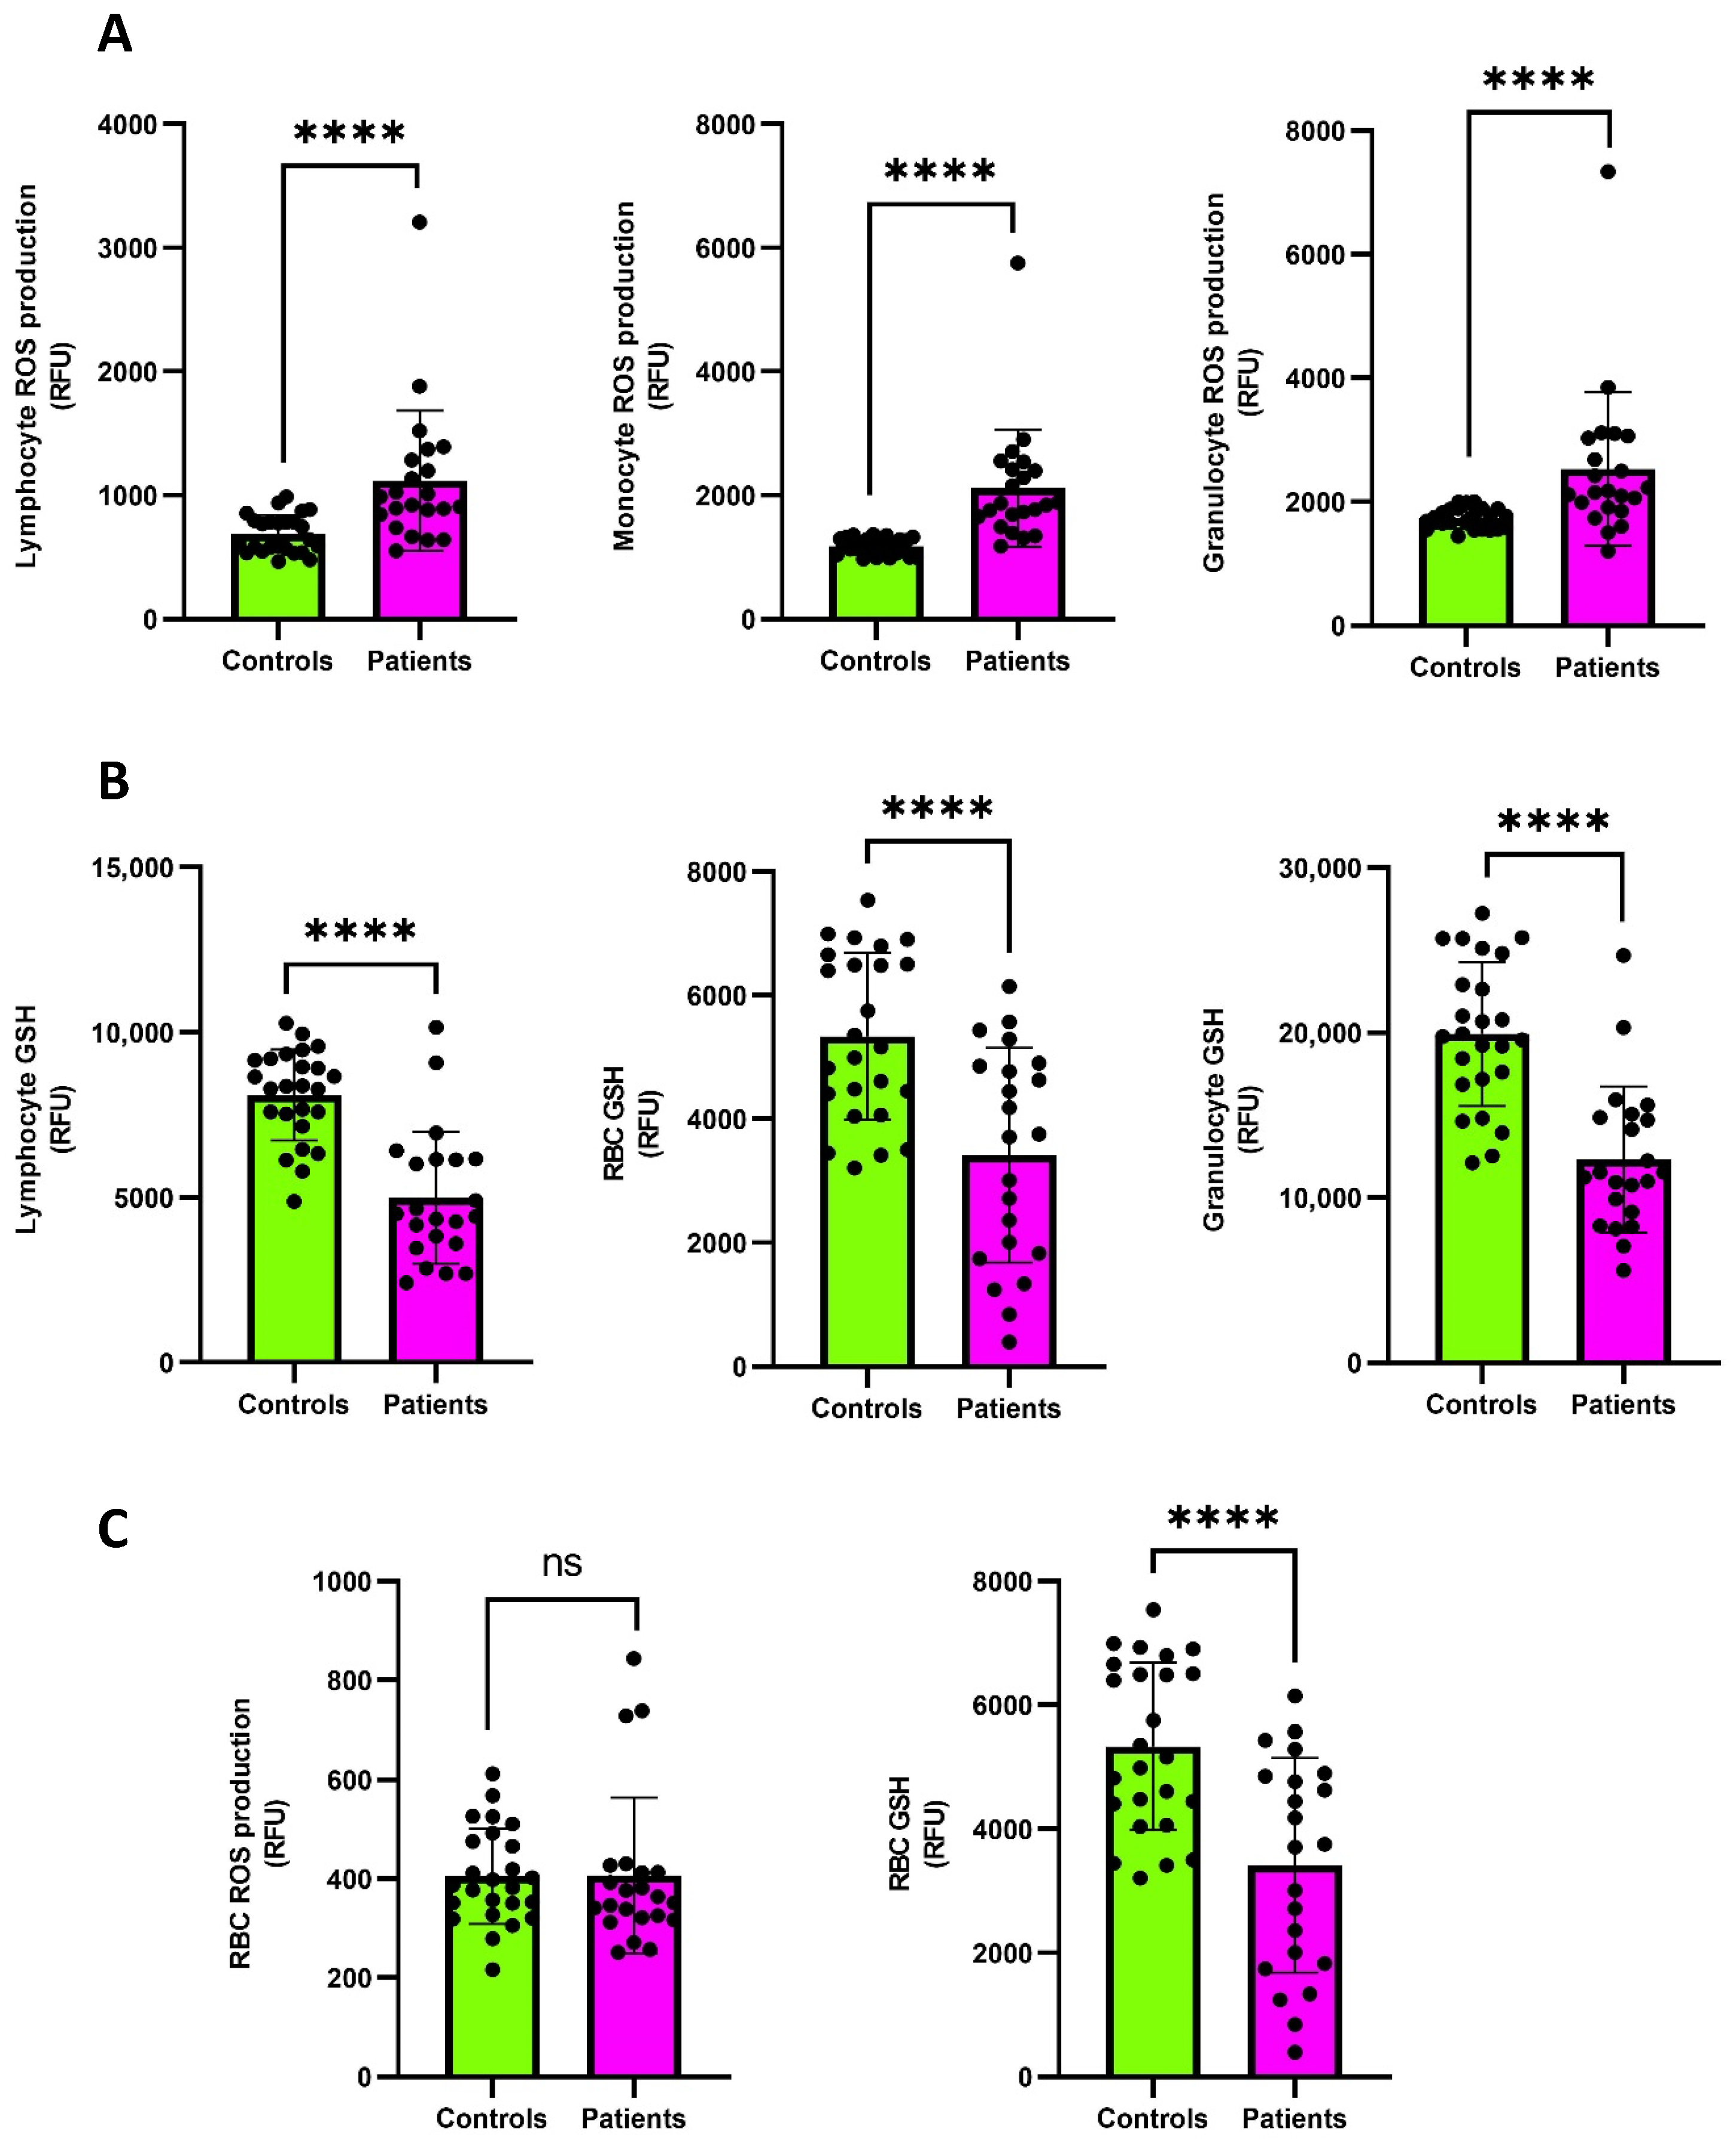
To further characterize oxidative stress at the cellular level, H2DCFDA fluorescence and reduced GSH content were measured in circulating leukocytes and red blood cells (RBCs). Patients (n = 23) showed significantly increased H2DCFDA fluorescence in leukocytes, including lymphocytes [954 (IQR 819–1307) RFU], monocytes [1856 (IQR 1615–2446) RFU], and granulocytes [2161 (IQR 1895–3037) RFU], compared with controls (n = 25) [643 (IQR 559–789), 1186 (IQR 1047–1292), and 1689 (IQR 1571–1887) RFU for lymphocytes, monocytes, and granulocytes, respectively] (Figure 2A). This increase was consistently associated with a significant decrease in leukocyte GSH levels [4458 (IQR 3575–6159) RFU vs. 8371 (IQR 7344–9180) RFU; 9927 (IQR 8732–13,069) RFU vs. 19,529 (IQR 16,743–21,340) RFU; 11,377 (IQR 8918–14,908) RFU vs. 19,762 (IQR 17,032–23,855) RFU for lymphocytes, monocytes, and granulocytes, respectively], evidencing depletion of intracellular antioxidant reserves (Figure 2B).
Figure 2.
Flow cytometric analysis of intracellular oxidative status and glutathione levels in peripheral blood cells from patients (n = 23) and healthy controls (n = 25). (A) Intracellular H2DCFDA fluorescence in lymphocytes, monocytes, and granulocytes. (B) Intracellular reduced glutathione (GSH) levels in lymphocytes, monocytes, and granulocytes. (C) H2DCFDA fluorescence and GSH levels in erythrocytes (RBCs). Data are expressed as median (IQR). Individual dots represent single subjects. Controls: healthy subjects; Patients: patients before COS (T0). **** p < 0.0001; ns, not significant. ROS and GSH values are expressed as relative fluorescence units (RFU).
A similar redox imbalance was observed in RBCs. H2DCFDA fluorescence was comparable between patients (n = 23) and healthy controls (n = 25) [358 (IQR 320–417) RFU vs. 387 (IQR 339–484) RFU], whereas GSH content was significantly reduced in patients [3732 (IQR 1809–4868) RFU vs. 5166 (IQR 4238–6579) RFU] (Figure 2C).
2.3. Fibrinogen Oxidation and Functional Analysis
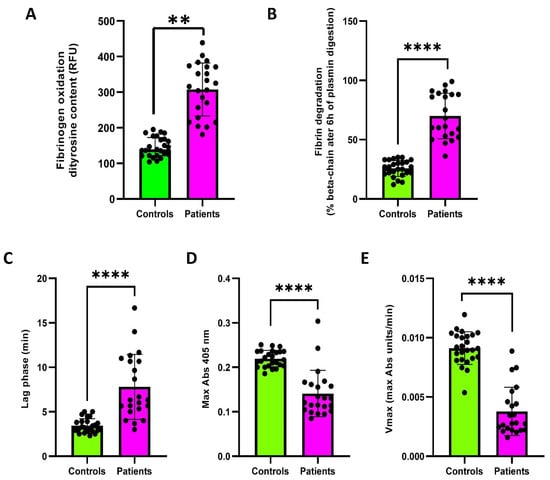
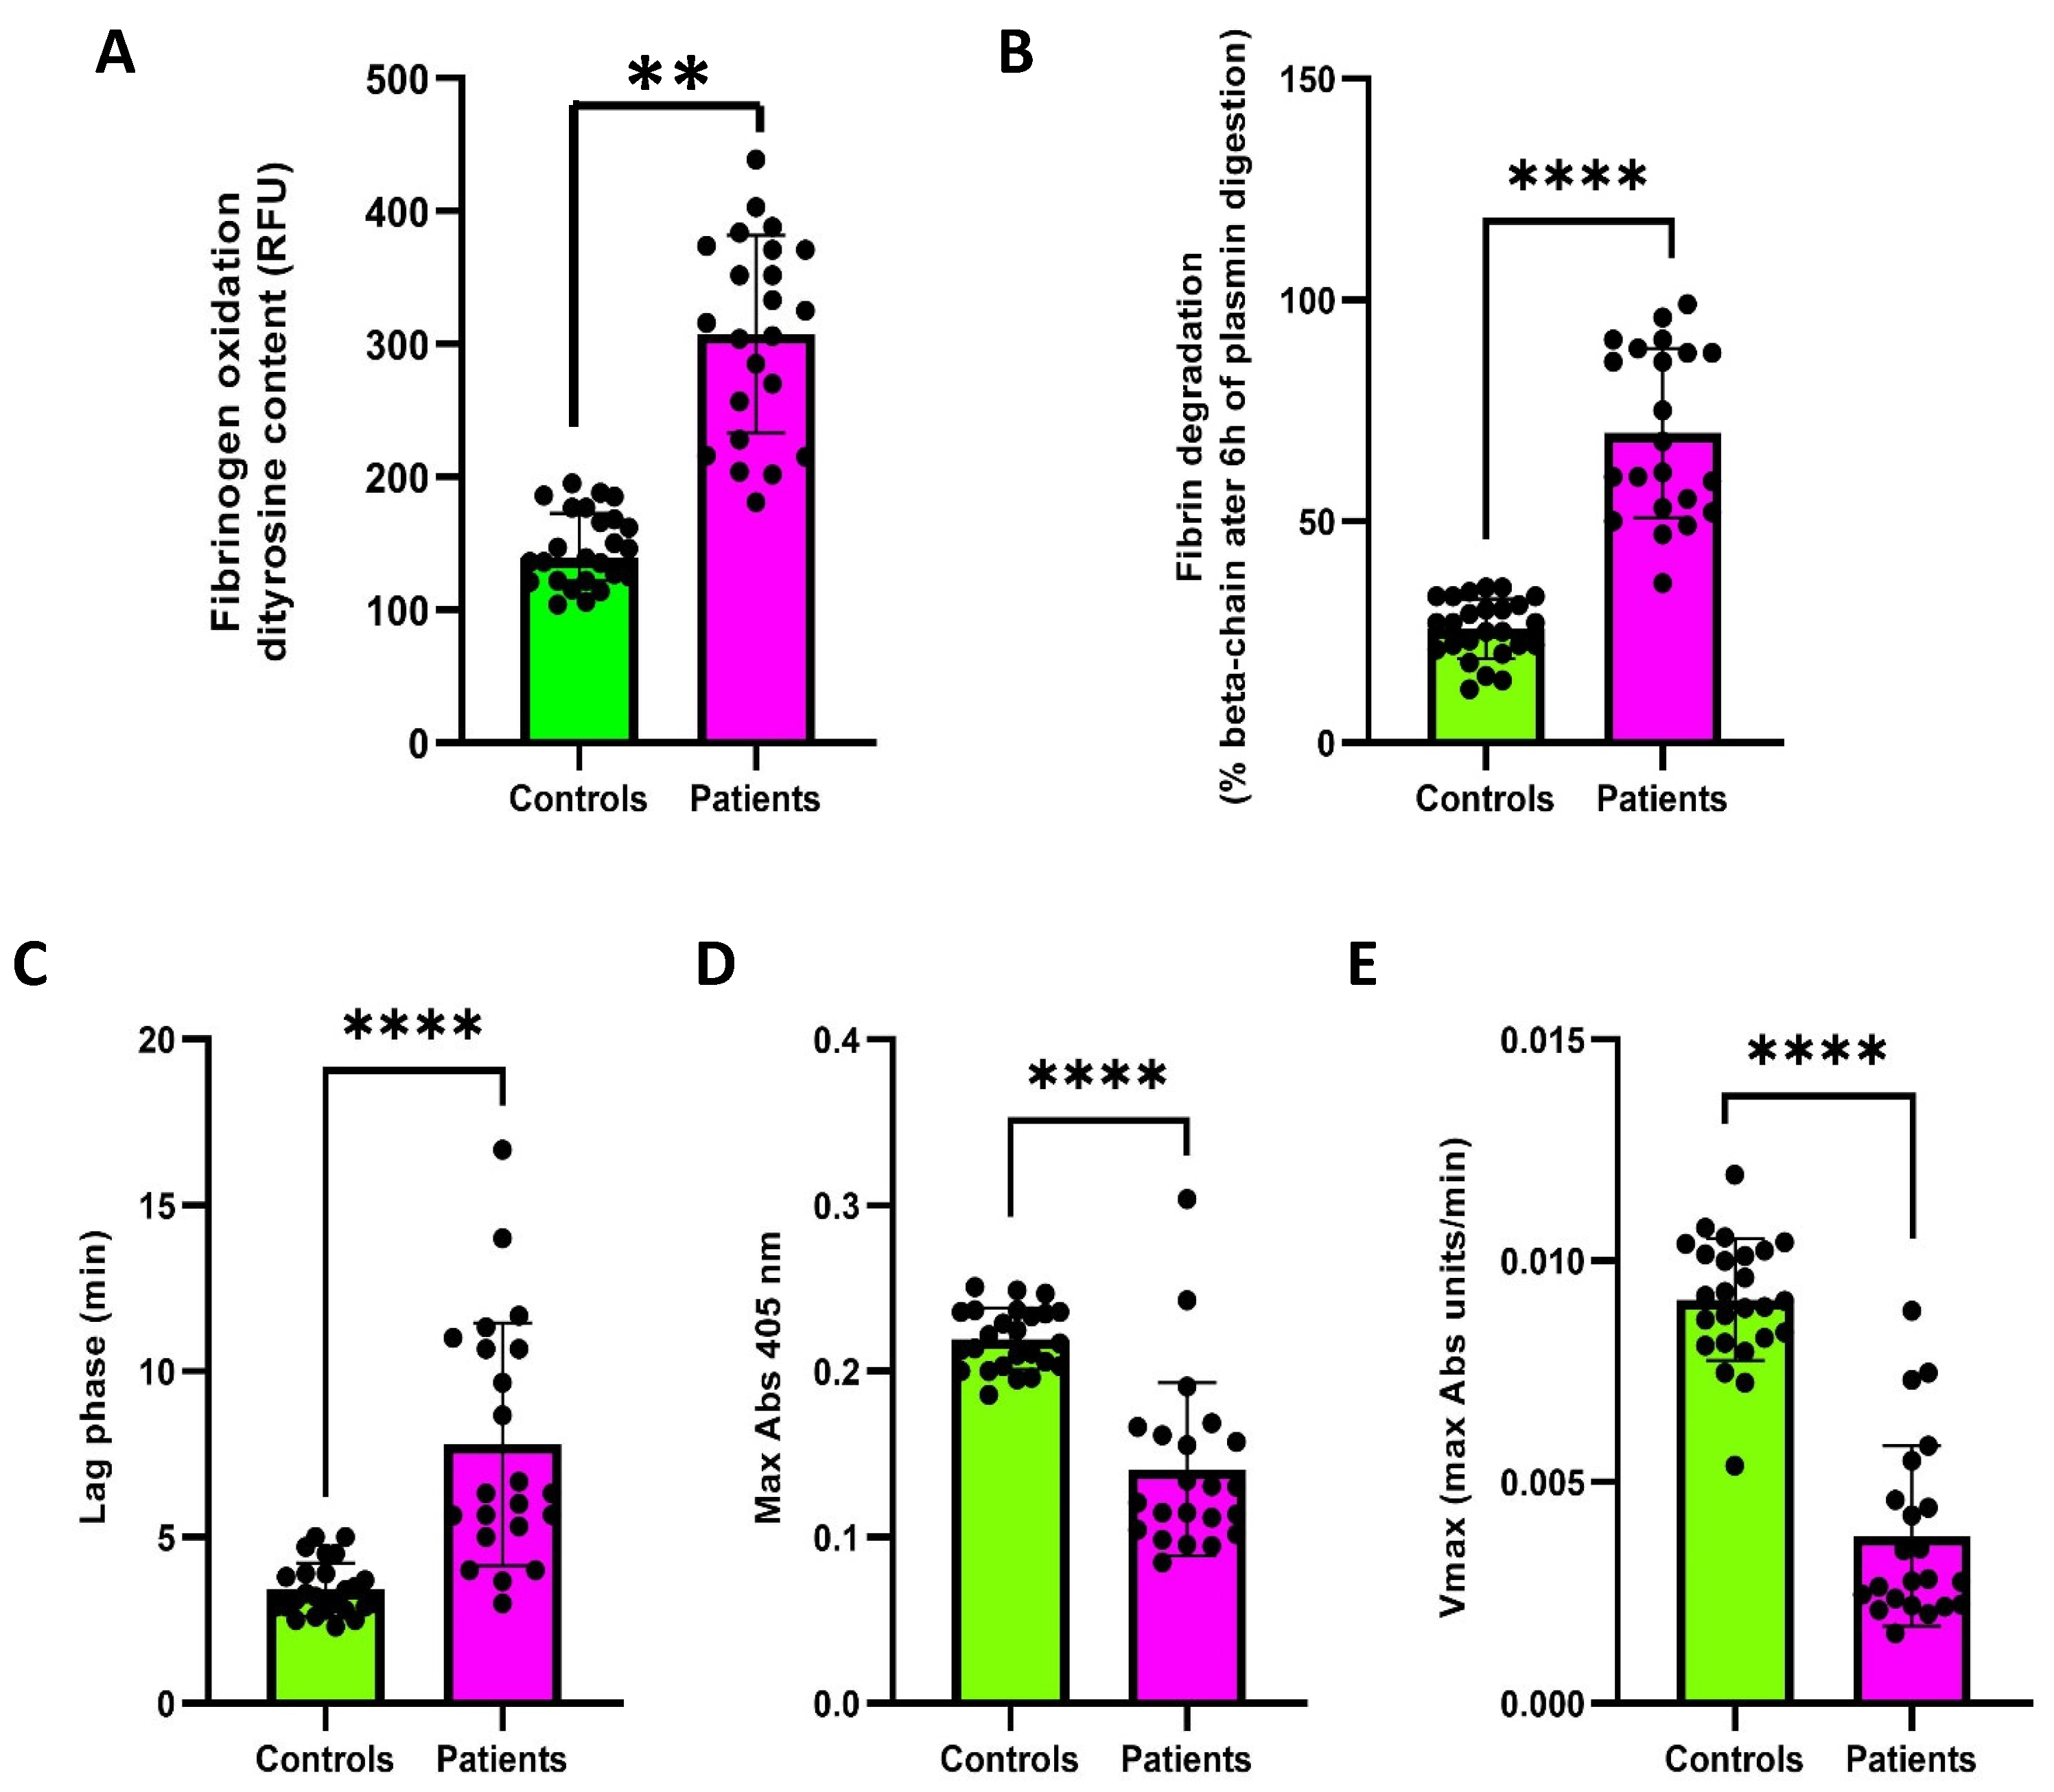
Fibrinogen oxidative modifications were assessed by measuring dityrosine content in purified fibrinogen fractions. A significant increase in dityrosine content was found in patients (n = 23) compared to controls (n = 25) [316 (IQR 228–371) vs. 139 (IQR 122–172.5) RFU] (Figure 3A).
Figure 3.
Fibrin clot formation and fibrinolysis parameters in patients (n = 23) and healthy controls (n = 25). (A) Fibrinogen oxidation analysis via dityrosine content assessment. (B) Quantification of residual fibrin β chain after 6h of plasmin digestion. (C) Lag phase, (D) Max Abs and (E) Vmax of thrombin-catalysed fibrin polymerization curves in fibrinogen purified samples. Data are expressed as median (IQR). Individual dots represent single subjects. Controls: healthy subjects; Patients: patients before COS (T0). ** p < 0.01, **** p < 0.0001.
Fibrinogen functional properties were investigated by analyzing fibrin susceptibility to plasmin-induced lysis and thrombin-catalyzed fibrin polymerization kinetics. Fibrin clots generated from patients’ fibrinogen (n = 23) exhibited significantly increased resistance to plasmin-induced lysis compared with controls (n = 25), as demonstrated by a higher percentage of residual fibrin β-chain after plasmin digestion [64.5 (IQR 52.8–88.3) vs. 27.0 (IQR 21.5–32.0)] (Figure 3B). Consistently, thrombin-catalyzed fibrin polymerization kinetics were markedly altered in patients. In detail, patients (n = 23) displayed a significant prolongation of the lag phase [6.33 (IQR 5.25–10.75) vs. 3.20 (IQR 2.85–3.90) min] (Figure 3C), indicating delayed initiation of fibrin assembly. Moreover, both maximum absorbance (Max Abs) [0.1258 (IQR 0.1039–0.1628) vs. 0.2170 (IQR 0.2030–0.2360)] (Figure 3D) and maximum polymerization velocity (Vmax) [0.00278 (IQR 0.00222–0.00481) vs. 0.00909 (IQR 0.00821–0.01019) Abs/min] were significantly reduced compared with controls (n = 25) (Figure 3E).
2.4. Variation in Redox Status, Fibrinogen Oxidation and Functional Parameters Following COS
Longitudinal analyses were performed in a subgroup of 13 patients with paired samples collected before ovarian stimulation (T0) and at oocyte retrieval (T1) to assess changes in redox status, fibrinogen oxidation, and functional properties.
Plasma lipid peroxidation showed a numerical increase at T1 compared with T0 [4.39 (IQR 3.8–4.9) vs. 3.88 (IQR 3.32–4.72) MDA nmol/mL], although this difference was not statistically significant. In contrast, total antioxidant capacity was significantly lower at T1 [15.43 (IQR 12.04–16.71) vs. 16.82 (IQR 15.03–17.56) nmol/mL Trolox equivalents, p < 0.05] (Figure S1A,B).
At the cellular level, no statistically significant differences in leukocyte H2DCFDA fluorescence were observed between T1 and T0 [1152 (IQR 874.5–1311) vs. 988 (IQR 779–1338) RFU; 1973 (IQR 1786–2602) vs. 1870 (IQR 1574–2469) RFU; 2412 (IQR 2008–3079) vs. 2420 (IQR 1880–3072) RFU for lymphocytes, monocytes, and granulocytes, respectively]. Similarly, GSH levels did not differ significantly between the two time points [4520 (IQR 4023–5228) vs. 4906 (IQR 3511–6293) RFU; 12,186 (IQR 10,107–12,646) vs. 9933 (IQR 7509–14,464) RFU; 13,025 (IQR 11,106–14,745) vs. 12,240 (IQR 9587–15,496) RFU for lymphocytes, monocytes, and granulocytes, respectively] (Figure S1C,D). In RBCs, neither H2DCFDA fluorescence nor GSH content showed statistically significant differences between T1 and T0 [479 (IQR 356–540) vs. 339 (IQR 294–429) RFU; 3228 (IQR 3066–3971) vs. 3754 (IQR 1291–5098) RFU, respectively] (Figure S1E).
Fibrinogen oxidation, assessed by dityrosine fluorescence, did not differ significantly between T1 and T0 [352 (IQR 241–373) vs. 371 (IQR 305–386) RFU] (Figure S2A). Similarly, no statistically significant differences were observed in fibrin susceptibility to plasmin-mediated degradation, despite a numerically higher percentage of residual fibrin β-chain at T1 [83 (IQR 74.5–94) vs. 75 (IQR 51.5–90)] (Figure S2B). Thrombin-catalyzed fibrin polymerization parameters also showed no statistically significant changes between the two time points, with numerical differences in lag phase [7.5 (IQR 5.08–8.75) vs. 6 (IQR 4.5–9.2)], Vmax [0.0029 (IQR 0.0026–0.0033) vs. 0.0035 (IQR 0.0023–0.0057)], and Max Abs [0.113 (IQR 0.101–0.143) vs. 0.115 (IQR 0.099–0.180)] (Figure S2C).
Overall, paired analyses identified a significant reduction in plasma total antioxidant capacity at T1, whereas the other redox and fibrinogen-related parameters did not show statistically significant changes. These findings should be interpreted descriptively, as the absence of statistically significant differences does not establish the persistence, normalization, or progression of the abnormalities observed at baseline.
2.5. Changes in the Relative Abundance of Vaginal Microbiome Taxa Following Treatment
To assess the longitudinal changes in the vaginal microbiome during COS, microbial communities were analyzed at T0 (pre COS) and T1 (post COS) in the subgroup of 13 patients with paired samples. All samples passed the saturation analysis and were therefore included in subsequent analyses.
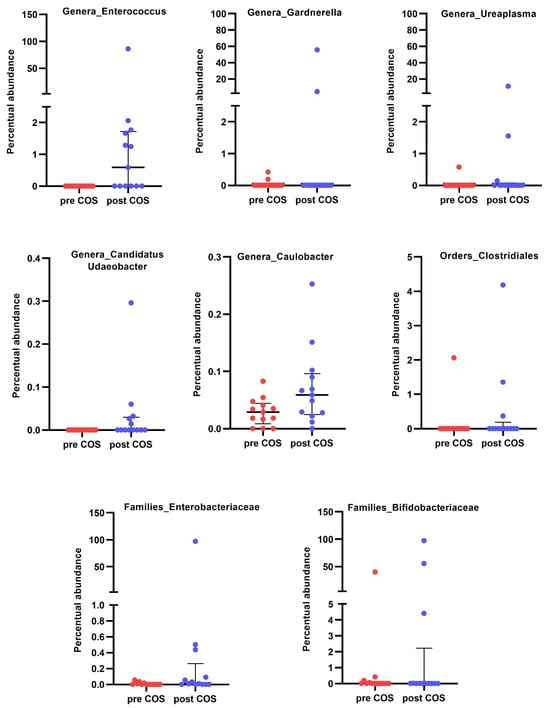
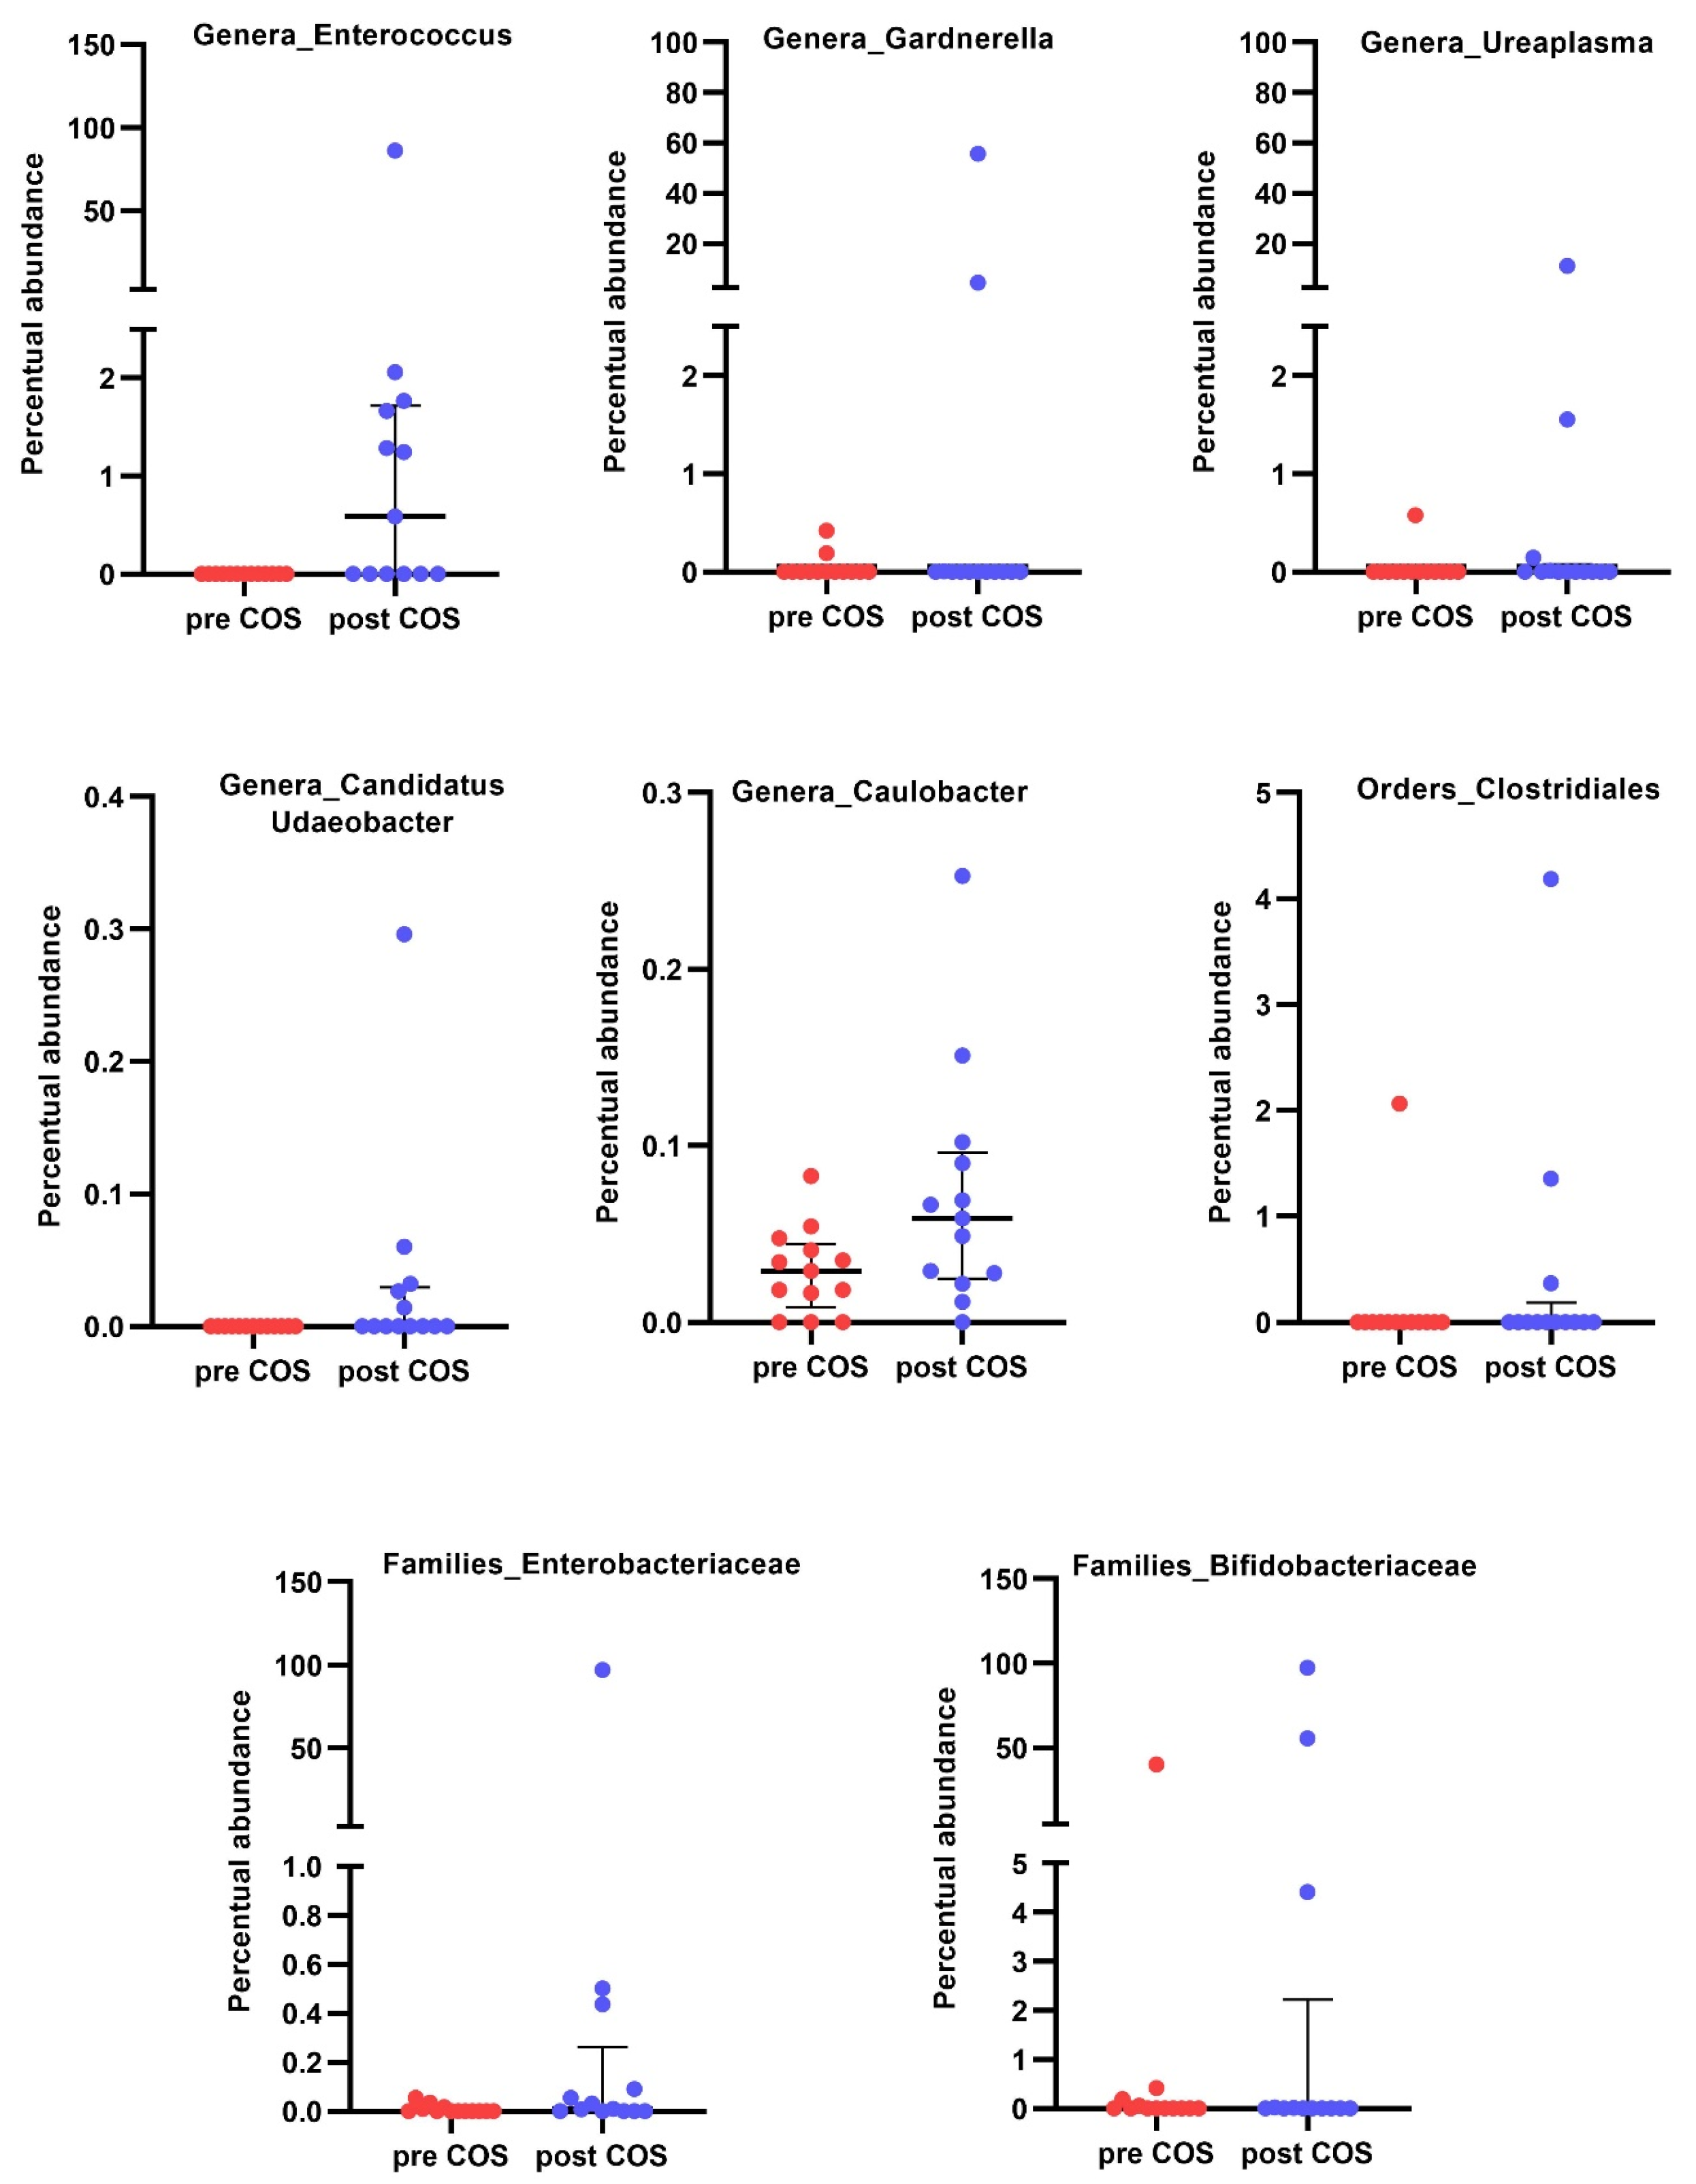
No significant differences were observed in alpha diversity between T0 and T1 samples, whereas beta diversity differed significantly between the two time points (PERMANOVA, p = 0.0115; Figure S3). However, inspection of the relative abundance profiles of the five most abundant phyla and genera suggested compositional shifts during the COS interval (Figure S4). Although Lactobacillus remained the dominant genus at both time points, its relative abundance decreased from 95.7% to 70.6%, accompanied by increased relative abundance of Actinobacteriota, Proteobacteria, Gardnerella, Bifidobacterium, Escherichia-Shigella, and Enterococcus. Differential abundance analysis using DESeq2 identified higher relative abundance at T1 of Enterococcus, Gardnerella, Caulobacter, Ureaplasma, and Candidatus_Udaeobacter, as well as Enterobacteriaceae, Bifidobacteriaceae, and Clostridiales (Figure 4). The corresponding log2 fold changes (effect sizes), p-values, and adjusted p-values are reported in Supplementary Table S1. Prediction of functional potential using PICRUSt2 identified 97 differentially represented MetaCyc pathways, most of which were enriched at T1 (Figure S5), including pathways related to amino acid biosynthesis, central carbon metabolism, fatty acid biosynthesis, cofactor production, and menaquinone biosynthesis.
Figure 4.
Differential abundance analysis was performed with DESeq2 using the paired T0–T1 design (n = 13); p values were adjusted by the Benjamini–Hochberg false discovery rate (BH-FDR), and taxa with adjusted p < 0.05 are shown.
In sum, these paired findings indicate differences in VM composition between T0 and T1, accompanied by changes in the predicted functional potential, including the higher relative abundance of several biosynthetic and metabolic pathways. However, these temporal differences may reflect stimulation, menstrual-cycle phase, peri-ovulatory hormonal conditions, or other time-varying factors and therefore cannot be attributed specifically to COS.
2.6. Oxidative Stress and Fibrinogen Functional Properties at Baseline and After Treatment According to Pregnancy Outcome
Given the small pregnancy subgroup, analyses according to pregnancy outcome were considered exploratory. At T0 (pre COS), no significant differences were observed between women who subsequently achieved pregnancy (n = 6) and those who did not (n = 7) in systemic or cellular oxidative stress markers, fibrinogen oxidation, or fibrinogen functional properties. Intracellular GSH and H2DCFDA fluorescence across RBCs and leukocyte subpopulations, as well as plasma total antioxidant capacity and lipid peroxidation, were comparable between groups (Figure S6). Similarly, fibrinogen oxidative status and functional properties were not associated with pregnancy outcome (Figure S7).
At T1 (after COS), oxidative stress profiles remained comparable between groups, with no differences in intracellular H2DCFDA fluorescence, GSH content, plasma antioxidant capacity, or lipid peroxidation (Figure S8). Most fibrinogen functional parameters were also unchanged between groups; however, thrombin-induced fibrin polymerization showed a significantly prolonged lag phase (p < 0.01) in women who achieved pregnancy (n = 6) compared with those who did not (n = 7), suggesting delayed clot initiation. Dityrosine levels remained not significantly different between groups (Figure S9).
2.7. Assessment of VM Differences in Patients Who Achieved Pregnancy Following Treatment
Given the restricted subgroup size, microbiome analyses according to pregnancy outcome were considered exploratory. At baseline (T0), no differences in alpha or beta diversity were observed between women who achieved pregnancy (n = 6) and those who did not (n = 7) (Figure S10). No statistically significant differences were documented in differential abundance analyses at any taxonomic level. Similarly, PICRUSt2 did not identify significant differences in predicted functional pathways between groups.
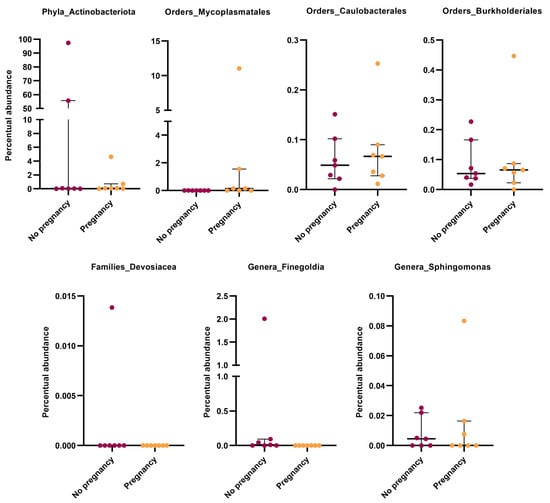
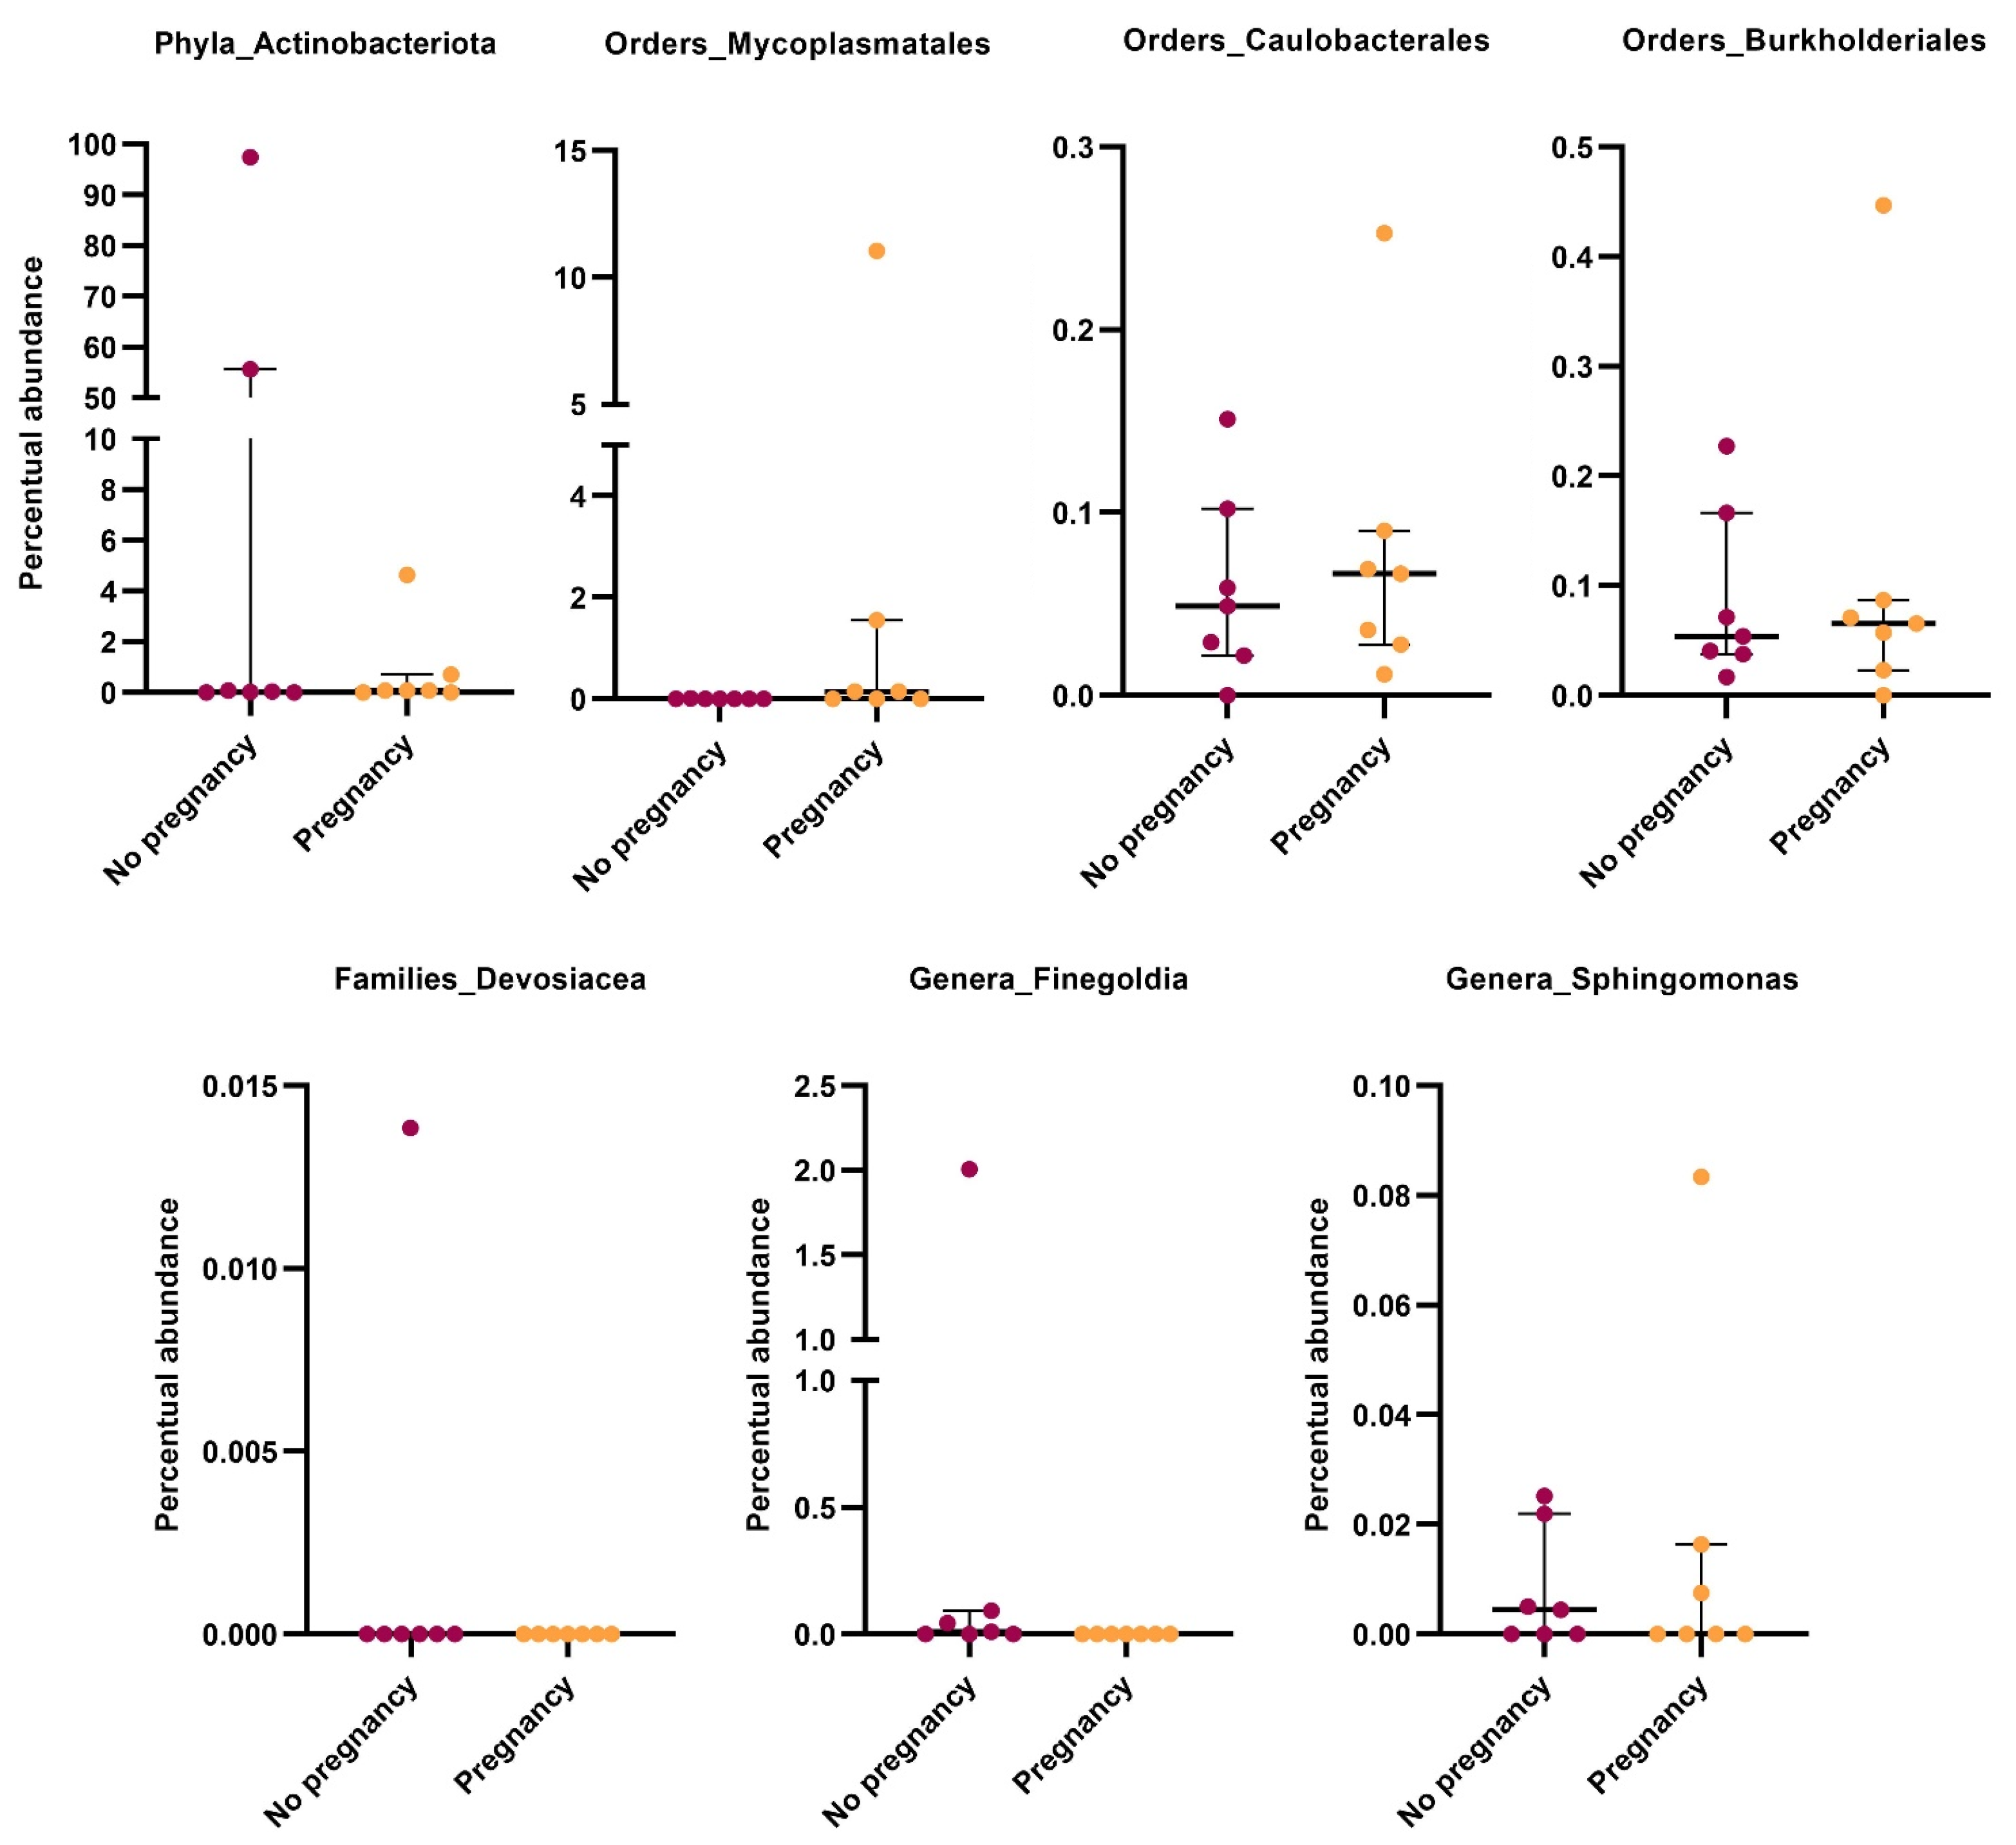
After COS (T1), overall diversity remained unchanged between groups (Figure S11). Differential abundance analysis showed higher relative abundance of Actinobacteriota, Finegoldia, Sphingomonas, and Devosiaceae in non-pregnant women (n = 7), whereas Mycoplasmatales, Caulobacterales, and Burkholderiales were more abundant in women who achieved pregnancy (n = 6) (Figure 5). Individual-level relative abundance data for the differentially abundant taxa are provided in Supplementary Table S2, while the corresponding log2 fold changes (effect sizes), p-values, and adjusted p-values are reported in Supplementary Table S3. Functional prediction further identified three differentially represented MetaCyc pathways (Figure S12). Exploratory comparisons at T1 suggested differences in selected microbial taxa between the small pregnancy subgroups. However, given the limited sample size, these findings should be considered hypothesis-generating and do not support the identification of a reproducible pregnancy-associated microbial signature. Validation in larger independent cohorts is therefore required.
Figure 5.
Exploratory DESeq2 differential abundance analysis comparing T1 samples from women who subsequently achieved clinical pregnancy (n = 6) and those who did not (n = 7). p values were adjusted using the Benjamini–Hochberg false discovery rate (BH-FDR) procedure, and taxa with adjusted p values (padj) < 0.05 are shown.
2.8. Microbiome–Oxidative Stress Correlations
To explore potential associations between systemic oxidative stress markers and the vaginal microbiome before and after COS, and according to subsequent pregnancy outcome, we performed an integrated correlation analysis combining VM profiles with plasma oxidative stress markers. Correlation analyses were restricted to bacterial taxa identified as differentially abundant by DESeq2. p values were adjusted for multiple testing using the Benjamini–Hochberg false discovery rate (BH-FDR), and only adjusted p values < 0.05 were considered statistically significant. At T0, correlations generally showed a positive trend, but none remained significant after BH-FDR correction. Following COS (T1), the overall pattern shifted toward predominantly negative correlations, but these also failed to reach statistical significance. Bifidobacteriaceae, which was enriched at T1 according to DESeq2, showed a reversal in the direction of its correlations with ROS levels, from positive at T0 to negative at T1 (Figure S13A,B). Because none of these correlations remained significant after BH-FDR correction, these directional patterns were considered descriptive and hypothesis-generating rather than evidence of a robust microbiome–redox interaction.
No significant differences in microbial–oxidative stress correlation patterns were detected between patients who achieved pregnancy and those who did not, either at T0 or following COS treatment.
3. Discussion
The present study evaluated systemic oxidative stress, fibrinogen functional properties, and reproductive outcome in women undergoing ART, while also exploring longitudinal changes in the VM during COS.
The main findings indicate that women undergoing ART exhibited an altered systemic redox profile and abnormal fibrinogen functional properties at baseline compared with healthy controls. In the paired cohort, total antioxidant capacity decreased significantly between T0 and T1, whereas most other redox and fibrinogen-related parameters did not show statistically significant changes. Vaginal microbiome composition also differed between the two sampling points. Given the observational design and the absence of a longitudinal infertile non-COS control group, these findings should be interpreted as baseline characteristics and temporal observations rather than evidence of a causal effect of ovarian stimulation. Pregnancy-related and microbiome–redox analyses were exploratory.
Women undergoing ART showed evidence of systemic oxidative imbalance, including increased plasma lipid peroxidation and reduced total antioxidant capacity, together with increased oxidant-sensitive fluorescence in circulating leukocytes and reduced intracellular GSH in both leukocytes and erythrocytes. Importantly, these abnormalities were already present at T0. In paired samples, total antioxidant capacity was significantly reduced at T1, whereas most other systemic and cellular redox parameters did not show statistically significant differences between the two sampling points. Therefore, these longitudinal findings do not establish either the persistence or progression of the oxidative abnormalities observed at baseline. Moreover, the absence of an infertile non-COS comparison group prevents the attribution of these observations specifically to ovarian stimulation, as baseline differences may reflect infertility-related characteristics or other individual factors.
Although COS is primarily intended to promote follicular recruitment and maturation, gonadotropin exposure may also influence the ovarian microenvironment. Experimental studies using human ovarian cortical tissue have reported concentration-dependent effects of FSH on VEGF-A expression and secretion, as well as dynamic metabolic and secretory responses following cellular stress and during recovery [22,23]. These observations provide biological context for the temporal complexity of ovarian responses during ART. However, ex vivo ovarian tissue findings cannot be directly extrapolated to the present cohort, and our study cannot determine whether the systemic alterations observed at T0 or T1 are related to gonadotropin exposure. Further studies integrating gonadotropin exposure with ovarian and systemic biomarkers may help clarify these relationships.
Fibrinogen represents an important redox-sensitive target because oxidative post-translational modifications can alter fibrin assembly, clot architecture, and fibrinolytic susceptibility [24,25,26]. Consistent with this biological framework, ART patients showed increased fibrinogen oxidation, a prolonged polymerization lag phase, reduced Vmax and Max Abs, and increased resistance to plasmin-mediated degradation. Among these alterations, reduced susceptibility to plasmin-mediated degradation represents the most relevant feature in relation to a potentially prothrombotic clot phenotype, as impaired fibrinolysis may favor clot persistence. In contrast, the prolonged lag phase and reduced Vmax and Max Abs reflect alterations in clot polymerization kinetics and should not be interpreted as independent evidence of increased thrombogenicity. Similar functional alterations have been associated in previous studies with dense, compact fibrin networks and impaired fibrinolysis in several inflammatory and reproductive disorders [12,27,28,29,30]. Experimental oxidation of purified fibrinogen has also been shown to reproduce impaired polymerization and fibrinolysis, whereas antioxidant treatment prevented these alterations. These previous observations provide mechanistic context for the present findings. Overall, our ex vivo results indicate altered fibrin formation and degradation properties, including reduced fibrinolytic susceptibility, but do not demonstrate increased in vivo thrombosis or clinical thrombotic risk in the ART cohort.
In paired samples, fibrinogen oxidation, fibrin susceptibility to plasmin-mediated degradation, and polymerization parameters did not show statistically significant differences between T0 and T1. These findings do not establish either the persistence or progression of the baseline fibrin functional abnormalities. Similarly, possible implications for implantation or placentation remain hypotheses, as endometrial perfusion, local coagulation, vascular function, and thrombotic events were not directly assessed. The longer polymerization lag phase observed in women who achieved pregnancy should also be interpreted cautiously because of the very small pregnancy subgroup.
In the 13 paired samples, vaginal community composition differed between T0 and T1, including a lower relative abundance of Lactobacillus and differences in the relative abundance of selected taxa [21,31,32,33]. Because 16S rRNA gene sequencing provides compositional rather than absolute abundance data, these findings should not be interpreted as evidence of an absolute increase in bacterial load or as proof of clinical dysbiosis. Moreover, T0 and T1 corresponded to different menstrual-cycle and peri-ovulatory conditions, which may have contributed to the observed temporal differences. PICRUSt2 analysis further identified changes in predicted metabolic pathways at T1 [34,35,36]. Because PICRUSt2 provides inferred functional potential rather than direct measurements of microbial metabolic activity, these findings should be interpreted accordingly.
Importantly, the microbiome findings do not provide evidence for a demonstrated interaction between vaginal microbial composition and systemic oxidative stress. Although exploratory associations were examined, none of the microbiome–redox correlations remained statistically significant after BH-FDR correction. The present data therefore do not support a microbiome–oxidative stress relationship, and the observed longitudinal microbial changes should not be interpreted as evidence of a microbiome-mediated mechanism underlying the systemic redox or fibrinogen phenotype.
Baseline VM composition did not differ between women who achieved pregnancy and those who did not. Exploratory post-COS analyses suggested differential abundance of selected taxa, including Finegoldia and Actino-bacteriota in women who did not achieve pregnancy [37,38,39,40,41]. However, only six women achieved pregnancy, making these analyses particularly susceptible to interindividual variability and limited statistical power. These findings should therefore be regarded as hypothesis-generating rather than as evidence of a reproducible pregnancy-associated microbial signature. Larger prospective cohorts will be required to determine whether these observations can be replicated and whether they have biological or clinical relevance.
Oxidative stress has been implicated in reproductive competence, with evidence linking altered redox homeostasis to oocyte quality, embryo development, endometrial receptivity, and early placental processes [42,43,44]. These mechanisms may also be relevant to fertility-preservation procedures, including those involving COS before potentially gonadotoxic treatments. However, the present study was not designed to investigate fertility-preservation populations, and its findings cannot be directly extrapolated to these patients or used to infer clinical implications for fertility-preservation practice.
Several limitations should be considered. First, the overall ART cohort was small (n = 23), only 13 women provided paired T0–T1 samples, and six achieved pregnancies, limiting the statistical power of longitudinal and pregnancy-related analyses. No a priori sample-size calculation was performed, and the study was not powered to detect differences in these subgroup analyses. Second, the absence of a longitudinal infertile non-COS control group prevents attribution of temporal changes specifically to ovarian stimulation and limits the interpretation of baseline differences relative to healthy controls. Furthermore, although healthy controls were age-matched, menstrual-cycle phase was not systematically recorded and could not be accounted for in the baseline comparisons. Since physiological hormonal fluctuations may influence systemic oxidative stress and potentially fibrinogen functional properties, menstrual-cycle-related variability represents a possible confounding factor. Therefore, the observed baseline differences should be interpreted as descriptive characteristics of women entering ART relative to a healthy reference population, rather than as abnormalities specifically attributable to infertility or ovarian stimulation. Third, clinical heterogeneity within the ART population may introduce residual confounding. Although sample collection was defined relative to the menstrual cycle and ovarian stimulation protocol, differences in hormonal conditions between T0 and T1 may have contributed to the observed microbiome changes. Furthermore, recent sexual activity was not systematically recorded and could not be accounted for in the analyses. These factors limit the attribution of longitudinal microbiome alterations specifically to COS. Fourth, the microbiome findings, particularly those involving uncommon taxa and pregnancy subgroups, require independent validation. In addition, the functional analyses were based on PICRUSt2 inference from 16S rRNA gene profiles and therefore represent predicted functional potential rather than direct measurements of microbial metabolic activity. Confirmation of these functional predictions would require complementary approaches such as metagenomics, metatranscriptomics, or metabolomics. Fifth, T1 samples were collected at oocyte retrieval, whereas frozen embryo transfer occurred in a subsequent cycle; consequently, pregnancy-related analyses reflect associations between the biological profile at retrieval and subsequent reproductive outcome rather than measurements of the peri-implantation environment. Sixth, extraction blanks and PCR/sequencing negative controls were not available, precluding formal identification and removal of reagent- or environment-derived contaminants. Finally, follow-up was limited to the studied COS interval, and direct assessment of endometrial redox and coagulation, fibrin architecture in vivo, vascular function, endometrial perfusion, and clinical thrombotic outcomes was not performed.
Overall, women undergoing ART exhibited baseline differences in systemic redox status and fibrinogen function relative to healthy controls. In the paired cohort, total antioxidant capacity decreased significantly at T1, whereas most other redox and fibrinogen functional measures did not show statistically significant T0–T1 changes. VM composition also differed between the pre-stimulation and peri-ovulatory sampling points. These observations are descriptive and do not establish a causal effect of COS, a mechanistic relationship between microbiome and redox/fibrinogen alterations, or predictive value for pregnancy outcome. Pregnancy-related and microbiome–redox findings remain exploratory and require validation in larger, appropriately controlled longitudinal cohorts.
4. Materials and Methods
4.1. Study Population and Sample Collection
A total of 36 vaginal swab samples and 36 peripheral blood samples were obtained from 23 women attending the ART outpatient clinic at Careggi University Hospital. All 23 participants contributed a baseline sample (T0), while 13 women also provided a second paired sample (T1). Participants were female partners of infertile couples of reproductive age (mean age 34.8 years) who met the following inclusion criteria: (i) no previous COS treatment or completion of the most recent COS cycle at least 3 months before enrolment; (ii) no more than one previous failed COS cycle; and (iii) serum anti-Müllerian hormone (AMH) ≥ 1 ng/mL. The exclusion criteria included acute infections, coagulation disorders, use of anticoagulant medications, and recent antibiotic treatment.
The clinical, hormonal, and ovarian reserve characteristics of the study population are reported in Table 1 and Table 2.
Table 1.
Baseline clinical characteristics of the study population.
Table 2.
Baseline hormonal and ovarian reserve characteristics (n = 23).
Thirteen women provided paired samples collected before and after COS (Table 3).
Table 3.
Ovarian stimulation, embryological and reproductive outcomes in the paired longitudinal cohort. (N = 13 women; 13 index stimulation cycles).
T0 samples were collected during the luteal phase, 10 days before the initiation of ovarian stimulation, whereas T1 vaginal swabs were collected during the peri-ovulatory phase, at the time of oocyte retrieval, 36 h after trigger administration. In women undergoing frozen-thawed embryo transfer, T1 sampling therefore preceded embryo transfer and subsequent pregnancy assessment by a longer interval than in women undergoing fresh embryo transfer. T1 vaginal sampling was performed before vaginal preparation and disinfection and prior to the oocyte retrieval procedure. None of the participants reported the use of antibiotics, probiotics, or antioxidant supplements during the two months preceding each vaginal sampling. Recent sexual activity was not systematically recorded.
Patients underwent COS using an antagonist protocol with recombinant human follicle-stimulating hormone (r-hFSH; follitropin alfa, GONAL-f®, 150–300 IU/day; Merck Healthcare, Darmstadt, Germany) or human menopausal gonadotropin (hMG; Menopur®, 100–225 IU/day, Ferring Pharmaceuticals, Kastrup, Denmark), at individualized doses according to ovarian reserve and clinical response. A GnRH antagonist (ganirelix; Orgalutran®, 0.25 mg/day; Organon N.V., Oss, The Netherlands) was administered once daily when the leading follicle(s) reached a diameter of 14 mm to prevent a premature LH surge. Final oocyte maturation was triggered with either recombinant human chorionic gonadotropin (r-hCG; Ovitrelle®, 250 μg; Merck Healthcare, Darmstadt, Germany) in 6/13 cycles (46.2%) or the GnRH agonist triptorelin at a total dose of 0.4 mg, administered subcutaneously as four 0.1-mg vials (Decapeptyl® 0.1 mg; Ferring Pharmaceuticals, Kastrup, Denmark), in 7/13 cycles (53.8%).
The duration of COS varied according to individual ovarian response, ranging from 8 to 16 days (mean ± SD: 10.7 ± 1.9 days). Following oocyte retrieval, luteal support during the stimulation cycle consisted of daily subcutaneous progesterone (PLEYRIS®, 25 mg; IBSA Farmaceutici Italia S.r.l., Lodi, Italy) for 12 days, starting on the day after oocyte retrieval. For women undergoing frozen-thawed embryo transfer, endometrial preparation and luteal support were performed according to the clinical protocol used for the subsequent FET cycle and were therefore temporally distinct from the T1 sampling performed at oocyte retrieval.
Pregnancy outcome was assessed following embryo transfer and was defined as the ultrasonographic detection of an intrauterine gestational sac with embryonic cardiac activity at 6–7 weeks of gestation. During follow-up, six women achieved pregnancy. For frozen-thawed embryo transfers, the median interval between oocyte retrieval/T1 sampling and embryo transfer was 38 days (range 30–45).
In addition, 25 age-matched healthy women underwent peripheral blood collection for the evaluation of plasma oxidative stress markers, intracellular redox status, and functional characterization of purified fibrinogen. The study was observational; healthy controls were used as a reference for systemic redox and fibrinogen parameters and were not intended to represent an untreated infertile control group. Therefore, baseline differences cannot be attributed to COS, and paired T0–T1 differences cannot isolate a stimulation-specific effect. Menstrual-cycle phase was not systematically recorded in healthy controls and was therefore not used as a matching criterion. Consequently, potential hormonal differences between healthy controls and ART patients could not be accounted for in the baseline comparisons.
All participants provided written informed consent, and the study was approved by the local Ethics Committee (Ref. 27289, approved on 15 October 2024).
4.2. Blood Sample Processing and Fibrinogen Purification
Peripheral blood was obtained using Vacutainer tubes (Becton Dickinson, Franklin Lakes, NJ, USA) containing either trisodium citrate as anticoagulant (1:10) or EDTA (0.17 mM). Samples were centrifuged at 1500× g for 15 min at 4 °C to separate plasma. Citrated plasma was either processed immediately for experimental assays or stored at −80 °C until further analysis.
An aliquot of citrated plasma was used for fibrinogen isolation by cold ethanol precipitation, as previously described [27,45]. Purified fibrinogen concentration was determined by ultraviolet spectrophotometry at 280 nm (ONDA UV-20, GEASS s.r.l., Torino, Italy), applying an extinction coefficient of 1.51 mg/mL. The cold-ethanol protocol has been previously validated by reducing SDS-PAGE and densitometry, yielding fibrinogen preparations accounting for approximately 94–97% of total protein content [27]. This validation refers to the established purification protocol; SDS-PAGE or immunoblotting was not repeated for each individual isolate in the present cohort. EDTA-anticoagulated whole blood samples were processed immediately for flow cytometric analyses.
4.3. Plasma Lipid Peroxidation
Plasma lipid peroxidation levels were assessed using a commercially available colorimetric assay (ALDetect Lipid Peroxidation Assay, Enzo Biochem Inc., New York, NY, USA), as previously described [46]. Results were expressed in terms of Malondialdehyde (MDA) Equivalents (nmol/mL).
4.4. Plasma Total Antioxidant Capacity
Total antioxidant capacity in plasma was evaluated by the oxygen radical absorbance capacity (ORAC) assay. This fluorescence-based method measures the ability of plasma antioxidants to counteract peroxyl radical-induced oxidation of fluorescein. Peroxyl radicals were generated through thermal decomposition of 2,2′-azobis(2-amidinopropane) dihydrochloride. Fluorescence decay was monitored using a microplate fluorometer (BioTek Synergy H1, Agilent Technologies, Santa Clara, CA, USA) with excitation and emission wavelengths set at 485 nm and 537 nm, respectively. Antioxidant capacity was expressed as Trolox equivalents (nmol/mL) [47,48].
4.5. Measurement of Intracellular Oxidative Status and Glutathione (GSH) Levels in Leukocytes
Intracellular oxidative status and reduced GSH content were assessed in peripheral blood leukocytes by flow cytometry as previously described [49]. Briefly, 100 μL of whole blood were incubated with red blood cell lysis buffer (BioVision, Milpitas, CA, USA) for 10 min at room temperature in the dark. Samples were then centrifuged, the supernatant discarded, and leukocytes washed twice with PBS.
Intracellular oxidative status and reduced GSH levels in leukocytes were assessed by flow cytometry after incubation with 2′,7′-dichlorodihydrofluorescein diacetate (H2DCFDA, 1.5 μmol/L; Invitrogen, Waltham, MA, USA) or the thiol-specific fluorescent probe ThiolTracker™ Violet (1.0 μmol/L; Thermo Fisher Scientific, Waltham, MA, USA) in serum-free, phenol red-free RPMI medium (Merck KGaA, Darmstadt, Germany). Following incubation, cells were washed, resuspended in PBS, and immediately analyzed using a FACSCanto flow cytometer (Becton, Dickinson and Company, Franklin Lakes, NJ, USA) at a flow rate of approximately 1000 events per second. Data analysis was performed with BD FACSDiva software v8.0.2 (Becton, Dickinson and Company, Franklin Lakes, NJ, USA). Because H2DCFDA is not selective for a single ROS species, its fluorescence was interpreted as a comparative index of intracellular oxidant burden rather than as a species-specific measurement of individual ROS [50].
4.6. Measurement of Intracellular Oxidative Status and Glutathione Levels in Erythrocytes
After collection, 3 μL of EDTA-anticoagulated blood were resuspended in 87 μL serum-free, phenol red-free RPMI and incubated with 10 μL anti-human glycophorin A-phycoerythrin (PE) antibody (BD Biosciences, Franklin Lakes, NJ, USA) for 15 min at 37 °C in the dark. Cells were then washed twice in PBS. ROS-sensitive fluorescence and GSH content were assessed after incubation with H2DCFDA (1.5 μM; Life Technologies, Carlsbad, CA, USA) and ThiolTracker Violet (1.0 μmol/L; Thermo Fisher Scientific, Waltham, MA, USA), respectively, for 30 min at 37 °C. After labeling, cells were washed, resuspended in PBS, and immediately analyzed using a FACSCanto flow cytometer (Becton-Dickinson, San Jose, CA, USA) at approximately 1000 events/s. To minimize leukocyte contamination, erythrocytes were identified by staining with a PE-conjugated anti-human glycophorin A (CD235a) antibody. Fluorescence analyses were restricted to glycophorin A-positive events, thereby excluding glycophorin A-negative cells, including leukocytes, from the analysis. For each sample, 100,000 erythrocyte events were acquired and analyzed using BD FACSDiva software.
4.7. Fibrinogen Oxidation and Functional Analysis
Fibrinogen oxidation was assessed by measuring dityrosine fluorescence in purified fibrinogen fractions using a PerkinElmer LS 55 spectrofluorometer (Waltham, MA, USA) equipped with a thermostated cell holder attached to a Haake F8 water bath (Karlsruhe, Germany), as previously described [12]. Fluorescence measurements were performed at an excitation wavelength of 330 nm and an emission wavelength of 418 nm. Background fluorescence from the corresponding protein-free buffer was subtracted from each measurement, and fluorescence values were subsequently normalized to fibrinogen concentration. A separate in vitro oxidation control was not included in the present ex vivo comparative analysis; dityrosine fluorescence was used as a relative marker of fibrinogen oxidative modification between groups.
Fibrinogen functional analysis included assessment of thrombin-catalyzed fibrin polymerization kinetics and fibrin susceptibility to plasmin-induced lysis. For polymerization, purified fibrinogen (1 mg/mL, 100 μL) in 100 mmol/L Tris/HCl, 5 mmol/L CaCl2, pH 7.4 was polymerized by addition of thrombin (final concentration 0.25 U/mL, 100 μL) in a 96-well microplate at 25 °C, and absorbance (405 nm) was monitored as previously described [26,27,51,52]. Polymerization curves were characterized by: (i) maximum slope (Vmax) of the steepest portion of the curve, reflecting the rate of lateral protofibril association; (ii) lag phase, defined as the time elapsed before an increase in absorbance was detected; and (iii) maximum absorbance (Max Abs) of the growing clot, recorded 120 min after polymerization induction. Plasmin-induced fibrin digestion was monitored as previously described [51]. Briefly, fibrin clots were formed in microcentrifuge tubes by incubating 10 μg of fibrinogen with human thrombin (12 U/mL) for 2 h at 25 °C. Plasmin (5 μL of 100 μg/mL) was then added, and digestion proceeded for 6 h at 37 °C. Reactions were stopped by adding 10 μL of LDS sample buffer. Samples were heated at 70 °C for 10 min with 50 mM dithiothreitol, and aliquots (10 μg fibrin equivalents) were run on 4–12% Bis-Tris gels. After electrophoresis, gels were Coomassie-stained, and band intensities were quantified by densitometry using the Chemi-Doc system and Quantity-One software Version 4.6.8 (Bio-Rad, Milan, Italy). Data were expressed as the percentage of residual fibrin β-chain intensity after 6 h of plasmin digestion (T6) relative to the corresponding undigested fibrin β-chain intensity (T0) for each sample, which served as its own internal reference. All measurements were performed in triplicate technical replicates for each biological sample.
4.8. Microbiome Characterization
Genomic DNA was extracted from vaginal swab samples using the DNeasy PowerLyzer PowerSoil Kit (Qiagen, Hilden, Germany). The quality and quantity of the extracted DNA were assessed using a NanoDrop ND-1000 spectrophotometer (Thermo Fisher Scientific, Waltham, MA, USA) and a Qubit Fluorometer (Thermo Fisher Scientific) and then frozen at −20 °C until further analysis. Extracted DNA samples were sent to IGA Technology Services (Udine, Italy) where amplicons of the variable V3–V4 region of the bacterial 16S rRNA gene were sequenced in paired-end sequencing (2 × 300 bp) on the Illumina MiSeq platform.
The resulting raw FASTQ files were demultiplexed and processed using QIIME2 v.2021.4 [53]. The Cutadapt tool [54] was employed to discard the sequences lacking primers while DADA2 was used to trim low-quality nucleotides from both forward and reverse reads (--p-trunc-len-f 280 --p-trunc-len-r 174) and to perform paired-end filtering, merging, and chimera removal [55]. Potential host sequences were identified by aligning the possible amplicon sequence variants (ASV) to the GRCh38 human reference genome using Bowtie2 v.2.4.4 and subsequently removed. The remaining reads were imported into QIIME2, where taxonomic assignments were performed through the Scikit-learn multinomial Bayes classifier re-trained on the Silva database (release 138) V3–V4 hypervariable region [56].
No extraction blanks or PCR/sequencing negative controls were available for the present analysis; therefore, reagent- or environment-derived contaminants could not be formally identified using control-based approaches. To reduce the potential contribution of low-abundance contaminants, ASVs with an average relative abundance below 0.005% were excluded, as were sequences assigned to the Chloroplast and Mitochondria genera [57,58].
4.9. Statistical Analyses
No a priori sample size or power calculation was performed, as the study was designed as an exploratory observational investigation integrating multiple biological endpoints.
Clinical and treatment characteristics were summarized descriptively as mean ± SD with observed range, or n (%), as appropriate. Experimental redox and fibrinogen outcomes were summarized as median (IQR) because these variables were analyzed according to their distributional characteristics.
The statistical analyses of bacterial communities were performed in R v.4.2.2 using the following packages: phyloseq v.1.42.0, vegan v.2.6-4, DEseq2 v.1.38.3, ggplot2 v.3.2.4, ggpubr v.0.6.0 and other packages satisfying their dependencies [59].
Saturation analysis was performed and satisfied for each sample using the rarefaction curves. The observed richness and Shannon indices were used to perform alpha diversity analyses. Pielou’s evenness index was calculated as J = H′/ln(S), where H′ is the Shannon diversity index and S is the number of observed ASVs. Differences in all indices between grouped samples were evaluated using the Wilcoxon–Mann–Whitney test, whereas paired comparisons between T0 and T1 samples from the same individuals were performed using the Wilcoxon signed-rank test to account for the paired study design. The permutational ANOVA (PERMANOVA) with 9999 permutations [60] was applied to beta diversity distance matrices (performed using Hellinger distance on Hellinger transformed genera abundances) to assess the significance between samples’ clusters observed following principal coordinate analysis (PCoA). For longitudinal comparisons between T0 and T1 samples from the same individuals, permutations were constrained by subject identity using the strata = “Patient” option in the vegan framework, where “Patient” identifies the paired samples from the same individual. Differential abundance (DA) analyses at various taxonomic ranks were performed using the DESeq2 algorithm on raw count data. The magnitude and direction of differential abundance were assessed using log2 fold changes (log2FC), which were considered estimates of effect size. For longitudinal comparisons between T0 and T1, subject identity was included in the experimental design to account for the paired nature of the samples. Features with a grand mean count < 100 were excluded to reduce noise. Potential MetaCyc pathway abundances were inferred using PICRUSt2 v2.4.2 (Phylogenetic Investigation of Communities by Reconstruction of Unobserved States) with the EPA-ng algorithm [61]. Differential pathway abundance among groups was then assessed using LEfSe (Linear Discriminant Analysis Effect Size) [62], and results were considered statistically significant when the LDA score was >2 and the adjusted p-value was <0.05.
Comparisons between independent groups (healthy controls vs. patients and women who achieved pregnancy vs. those who did not) were performed using an unpaired t-test or the Mann–Whitney U test, as appropriate. Comparisons of paired measurements obtained from the same patients before and after treatment were performed using a paired t-test or the Wilcoxon signed-rank test, as appropriate. The choice between parametric and non-parametric tests was based on the assessment of data normality using the Shapiro–Wilk test. Experimental redox and fibrinogen outcomes are presented as median and interquartile range (IQR), reflecting their distributional characteristics. Finally, Spearman’s rank correlation analyses were performed to assess the associations between taxa identified by differential abundance analysis and oxidative stress markers. For all analyses involving multiple testing, p-values were adjusted using the Benjamini–Hochberg false discovery rate (FDR) correction, and adjusted p-values < 0.05 were considered statistically significant.
Supplementary Materials
The following supporting information can be downloaded at: https://www.mdpi.com/article/10.3390/stresses6040092/s1, Figure S1. Systemic (A,B) and cellular oxidative stress markers (C–E) in 13 women before and after controlled ovarian stimulation (COS). Data are expressed as median (IQR). Individual dots represent single subjects. * p < 0.05; Figure S2. Fibrinogen dityrosine content (A) and fibrinogen functional properties (B,C) in 13 women before and after COS. Data are expressed as median (IQR). Individual dots represent single subjects; Figure S3. (A) Alpha diversity indices (observed ASV richness, Shannon index, and Pielou’s evenness) in vaginal swab samples collected before and after COS. Statistical differences were assessed using the Wilcoxon test, with p < 0.05 considered statistically significant. (B) Principal coordinate analysis (PCoA) based on Hellinger distance calculated from transformed genus-level abundances; Figure S4. Relative abundance profiles of the five most abundant bacterial phyla at T0 (A) and T1 (B), and the five most abundant genera at T0 (C) and T1 (D), in individual vaginal samples; Figure S5. Predicted microbial functions differing significantly between samples collected before and after COS. The figure shows MetaCyc pathways, the group with the highest mean abundance (red for pathways enriched before COS and blue for those enriched after COS), and the corresponding linear discriminant analysis (LDA) scores; Figure S6. Systemic and cellular oxidative stress markers at baseline (T0) in women who subsequently achieved pregnancy (n = 6) and those who did not (n = 7). Data are expressed as median (IQR). Individual dots represent single subjects; Figure S7. Fibrinogen dityrosine content and functional properties at baseline (T0) in women who subsequently achieved pregnancy (n = 6) and those who did not (n = 7). Data are expressed as median (IQR). Individual dots represent single subjects; Figure S8. Systemic and cellular oxidative stress markers at T1 (post-COS) in women who subsequently achieved pregnancy (n = 6) and those who did not (n = 7). Data are expressed as median (IQR). Individual dots represent single subjects; Figure S9. Fibrinogen dityrosine content and functional properties at T1 (post-COS) in women who subsequently achieved pregnancy (n = 6) and those who did not (n = 7). Data are expressed as median (IQR). Individual dots represent single subjects. ** p < 0.01; Figure S10. (A) Alpha diversity indices (observed ASV richness, Shannon index, and Pielou’s evenness) in baseline vaginal swab samples from women who subsequently achieved pregnancy (n = 6) and those who did not (n = 7). Statistical differences were assessed using the Mann–Whitney U test, with p < 0.05 considered statistically significant. (B) Principal coordinate analysis (PCoA) based on Hellinger distance calculated from transformed genus-level abundances; Figure S11. (A) Alpha diversity indices (observed ASV richness, Shannon index, and Pielou’s evenness) in post-COS vaginal swab samples from women who achieved pregnancy (n = 6) and those who did not (n = 7). Statistical differences were assessed using the Mann–Whitney U test, with p < 0.05 considered statistically significant. (B) Principal coordinate analysis (PCoA) based on Hellinger distance calculated from transformed genus-level abundances; Figure S12. Exploratory analysis of predicted microbial functions differing between women who achieved pregnancy following COS (n = 6) and those who did not (n = 7). The figure shows MetaCyc pathways, the group with the highest mean abundance (orange for the pregnancy group and purple for the non-pregnancy group), and the corresponding LDA scores. Given the small sample size, these findings should be considered exploratory and hypothesis-generating; Figure S13. Exploratory heatmap analysis of Spearman’s correlations between oxidative stress markers and differentially abundant bacterial taxa in the paired cohort (n = 13). (A) Correlations at baseline (T0); (B) correlations after COS (T1). Red and blue shades indicate positive and negative correlations, respectively, with color intensity reflecting correlation strength. Statistical significance was assessed after Benjamini–Hochberg false discovery rate correction (adjusted p < 0.05). These findings should be considered exploratory and hypothesis-generating; Table S1. Differential abundance analysis of vaginal microbiome taxa between T0 (pre-COS) and T1 (post-COS), performed using DESeq2. Log2 fold changes (log2FC) indicate the magnitude and direction of differential abundance, with positive values indicating enrichment at T1. Raw p-values and Benjamini–Hochberg-adjusted p-values (padj) are reported; Table S2. Individual-level relative abundance (%) of vaginal microbiome taxa identified as differentially abundant by DESeq2 at T1 (post-COS) between women who achieved pregnancy (n = 6) and those who did not (n = 7). Each row represents an individual participant, and taxa are reported at their respective taxonomic levels. All included taxa showed an adjusted p-value < 0.05; Table S3. Differential abundance analysis of vaginal microbiome taxa at T1 (post-COS) between women who achieved pregnancy (n = 6) and those who did not (n = 7), performed using DESeq2. Positive log2 fold changes (log2FC) indicate enrichment in the pregnancy group, whereas negative values indicate enrichment in the non-pregnancy group. Raw p-values and Benjamini–Hochberg-adjusted p-values (padj) are reported.
Author Contributions
S.B. (Sara Bertorello): formal analysis, visualization, writing—original draft; F.N.: writing—original draft; F.C.: investigation, data curation; G.N.: investigation, writing—original draft; S.B. (Serena Borghi): investigation; E.G.: investigation; I.C.: writing—original draft; E.R.: investigation; A.N.: investigation; C.F.: writing—review & editing; M.E.C.: conceptualization, writing—review & editing, resources; M.B.: formal analysis, visualization, writing—original draft; A.A.: writing—review & editing, resources, funding acquisition, supervision. All authors have read and agreed to the published version of the manuscript.
Funding
Microbiome-immunity axis: functional food for the inflammation modulating in gastrointestinal diseases “FONZIE”, a project funded by University as a “problem-driven” research projects to be carried out through the establishment of public–private partnerships in the context of the issues of the PNR (ex D.M. 737/2021). The call is part of the initiatives financed by the European Union—Next-Generation EU—CUP B55F21007810001.
Institutional Review Board Statement
The study was conducted in accordance with the Declaration of Helsinki and approved by Comitato Etico Regione Toscana, Area Vasta Centro (protocol code 27289; date of approval: 15 October 2024).
Informed Consent Statement
Written informed consent was obtained from all participants involved in the study.
Data Availability Statement
The data presented in this study are deposited in the NCBI Gene Expression Omnibus (GEO) repository, accession number GSE322884.
Conflicts of Interest
The authors declare no conflicts of interest.
Abbreviations
The following abbreviations are used in this manuscript:
| AFC | Antral Follicle Count |
| AMH | Anti-Müllerian Hormone |
| ART | Assisted Reproductive Technology |
| ASRM | American Society for Reproductive Medicine |
| ASV | Amplicon Sequence Variant |
| BH-FDR | Benjamini–Hochberg False Discovery Rate |
| COS | Controlled Ovarian Stimulation |
| DA | Differential Abundance |
| DNA | Deoxyribonucleic Acid |
| EDTA | Ethylenediaminetetraacetic Acid |
| FDR | False Discovery Rate |
| GnRH | Gonadotropin-Releasing Hormone |
| GSH | Reduced Glutathione |
| HC | Healthy Controls |
| H2DCFDA | 2′,7′-Dichlorodihydrofluorescein Diacetate |
| IQR | Interquartile Range |
| LDA | Linear Discriminant Analysis |
| LEfSe | Linear Discriminant Analysis Effect Size |
| MDA | Malondialdehyde |
| OHSS | Ovarian Hyperstimulation Syndrome |
| ORAC | Oxygen Radical Absorbance Capacity |
| PBS | Phosphate-Buffered Saline |
| PCoA | Principal Coordinate Analysis |
| PE | Phycoerythrin |
| PERMANOVA | Permutational Multivariate Analysis of Variance |
| PICRUSt2 | Phylogenetic Investigation of Communities by Reconstruction of Unobserved States 2 |
| QIIME2 | Quantitative Insights Into Microbial Ecology 2 |
| RBC | Red Blood Cell |
| RFU | Relative Fluorescence Units |
| ROS | Reactive Oxygen Species |
| RPMI | Roswell Park Memorial Institute |
| rRNA | Ribosomal Ribonucleic Acid |
| VM | Vaginal Microbiome |
| Vmax | Maximum Polymerization Velocity |
References
- Starc, A.; Trampuš, M.; Pavan Jukić, D.; Rotim, C.; Jukić, T.; Polona Mivšek, A. Infertility and Sexual Dysfunctions: A Systematic Literature Review. Acta Clin. Croat. 2019, 58, 508–515. [Google Scholar] [CrossRef] [Scilit] [PubMed]
- Abrao, M.S.; Muzii, L.; Marana, R. Anatomical causes of female infertility and their management. Int. J. Gynaecol. Obstet. 2013, 123, S18–S24. [Google Scholar] [CrossRef] [Scilit] [PubMed]
- Henriksson, P. Cardiovascular problems associated with IVF therapy. J. Intern. Med. 2021, 289, 2–11. [Google Scholar] [CrossRef] [Scilit] [PubMed]
- Sarno, L.; Strina, I.; Borrelli, P.; Palese, M.; Angelino, A.; Marrone, V.; Perrone, A.; Maria Maruotti, G.; Stampalija, T.; Guida, M. Controlled ovarian stimulation leads to cardiovascular changes in patients undergoing in vitro fertilization. Eur. J. Obstet. Gynecol. Reprod. Biol. 2024, 300, 17–22. [Google Scholar] [CrossRef] [Scilit] [PubMed]
- Mor, Y.S.; Schenker, J.G. Ovarian hyperstimulation syndrome and thrombotic events. Am. J. Reprod. Immunol. 2014, 72, 541–548. [Google Scholar] [CrossRef] [Scilit] [PubMed]
- Grandone, E.; Bitsadze, V.; Khizroeva, J.; Chinni, E.; Mastroianno, M.; Nappi, L.; Tretyakova, M.; Makatsariya, N.; Grigoreva, K.; Gashimova, N.; et al. Risk of Thrombosis in Women Undergoing In Vitro Fertilization: A Narrative Review. J. Clin. Med. 2025, 14, 1053. [Google Scholar] [CrossRef] [Scilit] [PubMed]
- Artini, P.G.; Scarfò, G.; Marzi, I.; Fusi, J.; Obino, M.E.; Franzoni, F.; Zappelli, E.; Chelucci, E.; Martini, C.; Cela, V.; et al. Oxidative Stress-Related Signaling Pathways Predict Oocytes’ Fertilization In Vitro and Embryo Quality. Int. J. Mol. Sci. 2022, 23, 13442. [Google Scholar] [CrossRef] [Scilit] [PubMed]
- Da Broi, M.G.; Ferreira, E.M.; Andrade, A.Z.; Jordão, A.A.; Ferriani, R.A.; Navarro, P.A. The Impact of Controlled Ovarian Stimulation on Serum Oxidative Stress Markers in Infertile Women with Endometriosis Undergoing ICSI. Antioxidants 2022, 11, 1161. [Google Scholar] [CrossRef] [Scilit] [PubMed]
- Singh, A.K.; Chattopadhyay, R.; Chakravarty, B.; Chaudhury, K. Markers of oxidative stress in follicular fluid of women with endometriosis and tubal infertility undergoing IVF. Reprod. Toxicol. 2013, 42, 116–124. [Google Scholar] [CrossRef] [Scilit] [PubMed]
- Badejogbin, O.C.; Agunloye, M.O.; Chijioke-Agu, O.E.; Olubiyi, M.V.; Olugbuyiro, S.O.; Soetan, O.A.; Bamgbose, O.A.; Olaleye, T.O. Cardiovascular Dysfunction in Polycystic Ovary Syndrome: Mitochondrial and Inflammatory Mechanisms. Biomed. Res. Int. 2026, 2026, 1110229. [Google Scholar] [CrossRef] [Scilit] [PubMed]
- Nencini, F.; Giurranna, E.; Borghi, S.; Taddei, N.; Fiorillo, C.; Becatti, M. Fibrinogen Oxidation and Thrombosis: Shaping Structure and Function. Antioxidants 2025, 14, 390. [Google Scholar] [CrossRef] [Scilit] [PubMed]
- Fini, E.; Argento, F.R.; Borghi, S.; Giurranna, E.; Nencini, F.; Cirillo, M.; Fatini, C.; Taddei, N.; Coccia, M.E.; Fiorillo, C.; et al. Fibrinogen Structural Changes and Their Potential Role in Endometriosis-Related Thrombosis. Antioxidants 2024, 13, 1456. [Google Scholar] [CrossRef] [Scilit] [PubMed]
- Yatsenko, T.; Us, I.; Korolova, D.; Zhuk, S.; Dziuba, H.; Nalbat, A.; Kharchenko, S.; Vari, S.G.; Chernyshenko, V. Placental Dysfunction Is Associated with Dysregulated Fibrinolytic System Activation. Int. J. Mol. Sci. 2025, 26, 9339. [Google Scholar] [CrossRef] [Scilit] [PubMed]
- Chen, Q.; Li, D.; Zheng, Y.; Li, X.; Wang, L.; Li, W.; Lu, Z.; Wang, F.; Zhou, L. The Maternal-Fetal Interface Fibrin Deposition and Expression of FGL2 in the Placenta of Preeclampsia and Fetal Growth Restriction. Int. J. Gynecol. Pathol. 2025, 44, 436–444. [Google Scholar] [CrossRef] [Scilit] [PubMed]
- Turnbaugh, P.J.; Ley, R.E.; Hamady, M.; Fraser-Liggett, C.M.; Knight, R.; Gordon, J.I. The human microbiome project. Nature 2007, 449, 804–810. [Google Scholar] [CrossRef] [Scilit] [PubMed]
- Sirota, I.; Zarek, S.M.; Segars, J.H. Potential influence of the microbiome on infertility and assisted reproductive technology. Semin. Reprod. Med. 2014, 32, 35–42. [Google Scholar] [CrossRef] [Scilit] [PubMed]
- Chee, W.J.Y.; Chew, S.Y.; Than, L.T.L. Vaginal microbiota and the potential of Lactobacillus derivatives in maintaining vaginal health. Microb. Cell Fact. 2020, 19, 203. [Google Scholar] [CrossRef] [Scilit] [PubMed]
- Dong, W.; Wang, S.; Wang, X.; Xu, G.; Liu, Q.; Li, Z.; Lv, N.; Pan, Y.; Xiong, Q.; Liu, D.; et al. Characteristics of Vaginal Microbiota of Women of Reproductive Age with Infections. Microorganisms 2024, 12, 1030. [Google Scholar] [CrossRef] [Scilit] [PubMed]
- Fredricks, D.N.; Fiedler, T.L.; Marrazzo, J.M. Molecular identification of bacteria associated with bacterial vaginosis. N. Engl. J. Med. 2005, 353, 1899–1911. [Google Scholar] [CrossRef] [Scilit] [PubMed]
- Moreno, I.; Simon, C. Deciphering the effect of reproductive tract microbiota on human reproduction. Reprod. Med. Biol. 2019, 18, 40–50. [Google Scholar] [CrossRef] [Scilit] [PubMed]
- Tsonis, O.; Gkrozou, F.; Paschopoulos, M. Microbiome affecting reproductive outcome in ARTs. J. Gynecol. Obstet. Hum. Reprod. 2021, 50, 102036. [Google Scholar] [CrossRef] [Scilit] [PubMed]
- Einenkel, R.; Schallmoser, A.; Sänger, N. High FSH levels impair VEGF secretion of human, frozen-thawed ovarian cortical tissue in vitro. Sci. Rep. 2024, 14, 3287. [Google Scholar] [CrossRef] [Scilit] [PubMed]
- Einenkel, R.; Schallmoser, A.; Sänger, N. Metabolic and secretory recovery of slow frozen-thawed human ovarian tissue in vitro. Mol. Hum. Reprod. 2022, 28, gaac037. [Google Scholar] [CrossRef] [Scilit] [PubMed]
- Angelidakis, E.; Chen, S.; Zhang, S.; Wan, Z.; Kamm, R.D.; Shelton, S.E. Impact of Fibrinogen, Fibrin Thrombi, and Thrombin on Cancer Cell Extravasation Using In Vitro Microvascular Networks. Adv. Healthc. Mater. 2023, 12, e2202984. [Google Scholar] [CrossRef] [Scilit] [PubMed]
- Nencini, F.; Bettiol, A.; Argento, F.R.; Borghi, S.; Giurranna, E.; Emmi, G.; Prisco, D.; Taddei, N.; Fiorillo, C.; Becatti, M. Post-translational modifications of fibrinogen: Implications for clotting, fibrin structure and degradation. Mol. Biomed. 2024, 5, 45. [Google Scholar] [CrossRef] [Scilit] [PubMed]
- Undas, A.; Ariëns, R.A. Fibrin clot structure and function: A role in the pathophysiology of arterial and venous thromboembolic diseases. Arterioscler. Thromb. Vasc. Biol. 2011, 31, 12. [Google Scholar] [CrossRef] [Scilit] [PubMed]
- Becatti, M.; Emmi, G.; Silvestri, E.; Bruschi, G.; Ciucciarelli, L.; Squatrito, D.; Vaglio, A.; Taddei, N.; Abbate, R.; Emmi, L.; et al. Neutrophil Activation Promotes Fibrinogen Oxidation and Thrombus Formation in Behçet Disease. Circulation 2016, 133, 302–311. [Google Scholar] [CrossRef] [Scilit] [PubMed]
- Becatti, M.; Emmi, G.; Bettiol, A.; Silvestri, E.; Di Scala, G.; Taddei, N.; Prisco, D.; Fiorillo, C. Behçet’s syndrome as a tool to dissect the mechanisms of thrombo-inflammation: Clinical and pathogenetic aspects. Clin. Exp. Immunol. 2019, 195, 322–333. [Google Scholar] [CrossRef] [Scilit] [PubMed]
- Becatti, M.; Emmi, G.; Bettiol, A.; Mannucci, A.; Argento, F.R.; Fini, E.; Borghi, S.; Nencini, F.; Nicastro, M.; Mattioli, I.; et al. ROS-induced modifications of fibrin clots connect immune responses to atherothrombosis in systemic lupus erythematosus. Arthritis Rheumatol. 2025, 78, 344–356. [Google Scholar] [CrossRef] [Scilit] [PubMed]
- Nencini, F.; La Spina, E.; Borghi, S.; Giurranna, E.; Argento, F.R.; Fini, E.; Giallongo, C.; Duminuco, A.; Volti, G.L.; Palumbo, G.A.; et al. Prothrombotic profiles in myelofibrosis: Fibrinogen oxidation and the beneficial effects of ruxolitinib. Thromb. Res. 2025, 256, 109517. [Google Scholar] [CrossRef] [Scilit] [PubMed]
- van den Tweel, M.M.; van den Munckhof, E.H.A.; van der Zanden, M.; Molijn, A.; van Lith, J.M.M.; Boers, K.E. The Vaginal Microbiome Changes During Various Fertility Treatments. Reprod. Sci. 2024, 31, 1593–1600. [Google Scholar] [CrossRef] [Scilit] [PubMed]
- Das, S.; Konwar, B.K. The vital role of Lactobacillus sp. in vaginal health: Implications for enhanced prophylactic research. Probiotics Antimicrob. Proteins 2026, 18, 1602–1621. [Google Scholar] [CrossRef] [Scilit] [PubMed]
- Carosso, A.; Revelli, A.; Gennarelli, G.; Canosa, S.; Cosma, S.; Borella, F.; Tancredi, A.; Paschero, C.; Boatti, L.; Zanotto, E.; et al. Controlled ovarian stimulation and progesterone supplementation affect vaginal and endometrial microbiota in IVF cycles: A pilot study. J. Assist. Reprod. Genet. 2020, 37, 2315–2326. [Google Scholar] [CrossRef] [Scilit] [PubMed]
- Guan, Y.; Zhao, S.; Li, J.; Zhang, W.; Guo, Z.; Luo, Y.; Jiang, X.; Liu, J.; Chen, X.; Zhao, Z.; et al. Insights from metagenomics into gut microbiome associated with acute coronary syndrome therapy. Front. Microbiol. 2024, 15, 1369478. [Google Scholar] [CrossRef] [Scilit] [PubMed]
- Zeng, L.; Liang, Y.; Huang, L.; Li, Z.; Kumar, M.; Zheng, X.; Li, J.; Luo, S.; Zhu, L. Untargeted metabolomics reveals homogeneity and heterogeneity between physiological and pathological ovarian aging. J. Ovarian Res. 2025, 18, 56. [Google Scholar] [CrossRef] [Scilit] [PubMed]
- Su, W.; Gong, C.; Zhong, H.; Yang, H.; Chen, Y.; Wu, X.; Jin, J.; Xi, H.; Zhao, J. Vaginal and endometrial microbiome dysbiosis associated with adverse embryo transfer outcomes. Reprod. Biol. Endocrinol. 2024, 22, 111. [Google Scholar] [CrossRef] [Scilit] [PubMed]
- Wang, X.; Buhimschi, C.S.; Temoin, S.; Bhandari, V.; Han, Y.W.; Buhimschi, I.A. Comparative microbial analysis of paired amniotic fluid and cord blood from pregnancies complicated by preterm birth and early-onset neonatal sepsis. PLoS ONE 2013, 8, e56131. [Google Scholar] [CrossRef] [Scilit] [PubMed]
- Liu, Y.; Ko, E.Y.; Wong, K.K.; Chen, X.; Cheung, W.C.; Law, T.S.; Chung, J.P.; Tsui, S.K.; Li, T.C.; Chim, S.S. Endometrial microbiota in infertile women with and without chronic endometritis as diagnosed using a quantitative and reference range-based method. Fertil. Steril. 2019, 112, 707–717.E1. [Google Scholar] [CrossRef] [Scilit] [PubMed]
- Bassetti, S.; Laifer, G.; Goy, G.; Fluckiger, U.; Frei, R. Endocarditis caused by Finegoldia magna (formerly Peptostreptococcus magnus): Diagnosis depends on the blood culture system used. Diagn. Microbiol. Infect. Dis. 2003, 47, 359–360. [Google Scholar] [CrossRef] [Scilit] [PubMed]
- Koort, K.; Sõsa, K.; Türk, S.; Lapp, E.; Talving, E.; Karits, P.; Rosenstein, K.; Jaagura, M.; Sekavin, A.; Sõritsa, D.; et al. Lactobacillus crispatus-dominated vaginal microbiome and Acinetobacter-dominated seminal microbiome support beneficial ART outcome. Acta Obstet. Gynecol. Scand. 2023, 102, 921–934. [Google Scholar] [CrossRef] [Scilit] [PubMed]
- Neumann, A.; Björck, L.; Frick, I.M. Finegoldia magna, an Anaerobic Gram-Positive Bacterium of the Normal Human Microbiota, Induces Inflammation by Activating Neutrophils. Front. Microbiol. 2020, 11, 65. [Google Scholar] [CrossRef] [Scilit] [PubMed]
- Agarwal, A.; Aponte-Mellado, A.; Premkumar, B.J.; Shaman, A.; Gupta, S. The effects of oxidative stress on female reproduction: A review. Reprod. Biol. Endocrinol. 2012, 10, 49. [Google Scholar] [CrossRef] [Scilit] [PubMed]
- Ruder, E.H.; Hartman, T.J.; Blumberg, J.; Goldman, M.B. Oxidative stress and antioxidants: Exposure and impact on female fertility. Hum. Reprod. Update 2008, 14, 345–357. [Google Scholar] [CrossRef] [Scilit] [PubMed]
- Al-Gubory, K.H.; Fowler, P.A.; Garrel, C. The roles of cellular reactive oxygen species, oxidative stress and antioxidants in pregnancy outcomes. Int. J. Biochem. Cell Biol. 2010, 42, 1634–1650. [Google Scholar] [CrossRef] [Scilit] [PubMed]
- Miniati, M.; Fiorillo, C.; Becatti, M.; Monti, S.; Bottai, M.; Marini, C.; Grifoni, E.; Formichi, B.; Bauleo, C.; Arcangeli, C.; et al. Fibrin resistance to lysis in patients with pulmonary hypertension other than thromboembolic. Am. J. Respir. Crit. Care Med. 2010, 181, 992–996. [Google Scholar] [CrossRef] [Scilit] [PubMed]
- Becatti, M.; Mannucci, A.; Barygina, V.; Mascherini, G.; Emmi, G.; Silvestri, E.; Wright, D.; Taddei, N.; Galanti, G.; Fiorillo, C. Redox status alterations during the competitive season in élite soccer players: Focus on peripheral leukocyte-derived ROS. Intern. Emerg. Med. 2017, 12, 777–788. [Google Scholar] [CrossRef] [Scilit] [PubMed]
- Fiorillo, C.; Becatti, M.; Attanasio, M.; Lucarini, L.; Nassi, N.; Evangelisti, L.; Porciani, M.C.; Nassi, P.; Gensini, G.F.; Abbate, R.; et al. Evidence for oxidative stress in plasma of patients with Marfan syndrome. Int. J. Cardiol. 2010, 145, 544–546. [Google Scholar] [CrossRef] [Scilit] [PubMed]
- Prior, R.L.; Wu, X.; Schaich, K. Standardized methods for the determination of antioxidant capacity and phenolics in foods and dietary supplements. J. Agric. Food Chem. 2005, 53, 4290–4302. [Google Scholar] [CrossRef] [Scilit] [PubMed]
- Cito, G.; Becatti, M.; Natali, A.; Fucci, R.; Picone, R.; Cocci, A.; Falcone, P.; Criscuoli, L.; Mannucci, A.; Argento, F.R.; et al. Redox status assessment in infertile patients with non-obstructive azoospermia undergoing testicular sperm extraction: A prospective study. Andrology 2020, 8, 364–371. [Google Scholar] [CrossRef] [Scilit] [PubMed]
- Kalyanaraman, B.; Darley-Usmar, V.; Davies, K.J.; Dennery, P.A.; Forman, H.J.; Grisham, M.B.; Mann, G.E.; Moore, K.; Roberts, L.J.; Ischiropoulos, H. Measuring reactive oxygen and nitrogen species with fluorescent probes: Challenges and limitations. Free Radic. Biol. Med. 2012, 52, 1–6. [Google Scholar] [CrossRef] [Scilit] [PubMed]
- Ianni, A.; Kumari, P.; Tarighi, S.; Argento, F.R.; Fini, E.; Emmi, G.; Bettiol, A.; Braun, T.; Prisco, D.; Fiorillo, C.; et al. An Insight into Giant Cell Arteritis Pathogenesis: Evidence for Oxidative Stress and SIRT1 Downregulation. Antioxidants 2021, 10, 885. [Google Scholar] [CrossRef] [Scilit] [PubMed]
- Undas, A. Fibrin clot properties and their modulation in thrombotic disorders. Thromb. Haemost. 2014, 112, 32–42. [Google Scholar] [CrossRef] [Scilit] [PubMed]
- Bolyen, E.; Rideout, J.R.; Dillon, M.R.; Bokulich, N.A.; Abnet, C.C.; Al-Ghalith, G.A.; Alexander, H.; Alm, E.J.; Arumugam, M.; Asnicar, F.; et al. Reproducible, interactive, scalable and extensible microbiome data science using QIIME 2. Nat. Biotechnol. 2019, 37, 852–857, Correction in Nat. Biotechnol. 2019, 37, 1091. https://doi.org/10.1038/s41587-019-0252-6. [Google Scholar] [CrossRef] [Scilit] [PubMed]
- Martin, M. Cutadapt removes adapter sequences from high-throughput sequencing reads. EMBnet. J. 2011, 17, 10–12. [Google Scholar] [CrossRef] [Scilit]
- Callahan, B.J.; McMurdie, P.J.; Rosen, M.J.; Han, A.W.; Johnson, A.J.; Holmes, S.P. DADA2: High-resolution sample inference from Illumina amplicon data. Nat. Methods 2016, 13, 581–583. [Google Scholar] [CrossRef] [Scilit] [PubMed]
- Quast, C.; Pruesse, E.; Yilmaz, P.; Gerken, J.; Schweer, T.; Yarza, P.; Peplies, J.; Glöckner, F.O. The SILVA ribosomal RNA gene database project: Improved data processing and web-based tools. Nucleic Acids Res. 2013, 41, D590–D596. [Google Scholar] [CrossRef] [Scilit] [PubMed]
- Lusk, R.W. Diverse and widespread contamination evident in the unmapped depths of high throughput sequencing data. PLoS ONE 2014, 9, e110808. [Google Scholar] [CrossRef] [Scilit] [PubMed]
- Salter, S.J.; Cox, M.J.; Turek, E.M.; Calus, S.T.; Cookson, W.O.; Moffatt, M.F.; Turner, P.; Parkhill, J.; Loman, N.J.; Walker, A.W. Reagent and laboratory contamination can critically impact sequence-based microbiome analyses. BMC Biol. 2014, 12, 87. [Google Scholar] [CrossRef] [Scilit] [PubMed]
- Love, M.I.; Huber, W.; Anders, S. Moderated estimation of fold change and dispersion for RNA-seq data with DESeq2. Genome Biol. 2014, 15, 550. [Google Scholar] [CrossRef] [Scilit] [PubMed]
- Anderson, M.J. Permutational Multivariate Analysis of Variance (PERMANOVA). In Wiley StatsRef: Statistics Reference Online; John Wiley & Sons, Ltd.: Chichester, UK, 2017; pp. 1–15. [Google Scholar]
- Douglas, G.M.; Maffei, V.J.; Zaneveld, J.R.; Yurgel, S.N.; Brown, J.R.; Taylor, C.M.; Huttenhower, C.; Langille, M.G.I. PICRUSt2 for prediction of metagenome functions. Nat. Biotechnol. 2020, 38, 685–688. [Google Scholar] [CrossRef] [Scilit] [PubMed]
- Segata, N.; Izard, J.; Waldron, L.; Gevers, D.; Miropolsky, L.; Garrett, W.S.; Huttenhower, C. Metagenomic biomarker discovery and explanation. Genome Biol. 2011, 12, R60. [Google Scholar] [CrossRef] [Scilit] [PubMed]

Disclaimer/Publisher’s Note: The statements, opinions and data contained in all publications are solely those of the individual author(s) and contributor(s) and not of MDPI and/or the editor(s). MDPI and/or the editor(s) disclaim responsibility for any injury to people or property resulting from any ideas, methods, instructions or products referred to in the content. |
© 2026 by the authors. Licensee MDPI, Basel, Switzerland. This article is an open access article distributed under the terms and conditions of the Creative Commons Attribution (CC BY) license.